
Stereotaxic display of brain lesions
11
191 Stereotaxic display of brain lesions Chris Rorden a,∗ and Matthew Brett b a University of Nottingham, Nottingham, UK b MRC Cognition and Brain Sciences Unit, Cambridge, UK Traditionally lesion location has been reported using stan- dard templates, text based descriptions or representative raw slices from the patient’s CT or MRI scan. Each of these methods has drawbacks for the display of neuroanatomical data. One solution is to display MRI scans in the same stereotaxic space popular with researchers working in func- tional neuroimaging. Presenting brains in this format is use- ful as the slices correspond to the standard anatomical at- lases used by neuroimagers. In addition, lesion position and volume are directly comparable across patients. This arti- cle describes freely available software for presenting stereo- taxically aligned patient scans. This article focuses on MRI scans, but many of these tools are also applicable to other modalities (e.g. CT, PET and SPECT). We suggest that this technique of presenting lesions in terms of images normalized to standard stereotaxic space should become the standard for neuropsychological studies. 1. Introduction Accurate lesion localization is vital in order to make anatomical inferences based on neuropsychological data. This article has three main aims. First, some of the limitations of the traditional methods for presenting lesion information will be discussed. Second, an alter- native method (called ‘spatial normalization’) will be outlined. Normalization scales, rotates and warps the patient’s Magnetic Resonance Imaging (MRI) scan so that it is approximately co-registered with a standard atlas template image. The advantages of this technique will be introduced. Third, the technical difficulties that have prevented this technique from gaining widespread acceptance will be reviewed. Finally, this article will ∗ Corresponding author: Chris Rorden, School of Psychology, University of Nottingham, University Park, Nottingham, NG7 2RD, UK. Tel.: +44 115 951 5294; Fax: +44 115 951 5324; E-mail: [email protected]. describe a number of recent advances that have gener- ally overcome these difficulties. Advances in neuroimaging such as functional MRI (fMRI) allow scientists to observe brain function in the intact human brain. These studies avoid some of the inherent limitations of neuropsychology. For example, the interpretation of most neuropsychological functions relies on the assumption that the preserved regions of a neurological patient’s brain are functioning normally. This assumption is often wrong for two reasons. First, the brain is a highly integrated organ, and damage to one area will therefore have knock-on effects on the remaining regions. While clinical MRI scans can iden- tify regions that are clearly damaged, this does not nec- essarily mean that the other regions are functioning normally (functional and diffusion-weighted imaging of neurological patients [14,19] can help address this problem). Secondly, brain function is often plastic, and therefore the function of preserved regions may adapt to compensate for focal damage. However, neuropsychology also has intrinsic strengths. For example, the power of inference based on a conventional fMRI study is fairly weak. Gener- ally, fMRI studies indicate that certain regions are in- volved with specific tasks. Neuropsychology can make a stronger claim, identifying required regions for cer- tain tasks. The inherent strengths of the neuropsychological method means it can play an important role in the emerging field of cognitive neuroscience. It can com- plement the use of other tools such as fMRI, single cell recording, positron emission tomography (PET), event related potentials (ERP), optical imaging and transcra- nial magnetic stimulation (TMS). Indeed, neuropsy- chology will perhaps become most useful as a tool for steering further exploration with other techniques. For example, patients with posterior cerebral artery terri- tory infarcts often fail to recognize faces [4]; conver- gent findings using fMRI in healthy subjects show acti- vation in this region when viewing faces [9]. The spe- cific deficits found in patients can imply some level of modular processing, and suggest necessary regions for completing these tasks. Therefore, neuropsychology can guide the choice of task and anatomical location for research with tools such as TMS, fMRI and ERP. Behavioural Neurology 12 (2000) 191–200 ISSN 0953-4180 / $8.00 2000, IOS Press. All rights reserved
Transcript of Stereotaxic display of brain lesions

191
Stereotaxic display of brain lesions
Chris Rordena,∗ and Matthew BrettbaUniversity of Nottingham, Nottingham, UKbMRC Cognition and Brain Sciences Unit,Cambridge, UK
Traditionally lesion location has been reported using stan-dard templates, text based descriptions or representative rawslices from the patient’s CT or MRI scan. Each of thesemethods has drawbacks for the display of neuroanatomicaldata. One solution is to display MRI scans in the samestereotaxic space popular with researchers working in func-tional neuroimaging. Presenting brains in this format is use-ful as the slices correspond to the standard anatomical at-lases used by neuroimagers. In addition, lesion position andvolume are directly comparable across patients. This arti-cle describes freely available software for presenting stereo-taxically aligned patient scans. This article focuses on MRIscans, but many of these tools are also applicable to othermodalities (e.g. CT, PET and SPECT). We suggest that thistechnique of presenting lesions in terms of images normalizedto standard stereotaxic space should become the standard forneuropsychological studies.
1. Introduction
Accurate lesion localization is vital in order to makeanatomical inferences based on neuropsychologicaldata. This article has three main aims. First, some ofthe limitations of the traditional methods for presentinglesion information will be discussed. Second, an alter-native method (called ‘spatial normalization’) will beoutlined. Normalization scales, rotates and warps thepatient’s Magnetic Resonance Imaging (MRI) scan sothat it is approximately co-registered with a standardatlas template image. The advantages of this techniquewill be introduced. Third, the technical difficulties thathave prevented this technique from gaining widespreadacceptance will be reviewed. Finally, this article will
∗Corresponding author: Chris Rorden, School of Psychology,University of Nottingham, University Park, Nottingham, NG7 2RD,UK. Tel.: +44 115 951 5294; Fax: +44 115 951 5324; E-mail:[email protected].
describe a number of recent advances that have gener-ally overcome these difficulties.
Advances in neuroimaging such as functional MRI(fMRI) allow scientists to observe brain function in theintact human brain. These studies avoid some of theinherent limitations of neuropsychology. For example,the interpretation of most neuropsychological functionsrelies on the assumption that the preserved regions ofa neurological patient’s brain are functioning normally.This assumption is often wrong for two reasons. First,the brain is a highly integrated organ, and damage toone area will therefore have knock-on effects on theremaining regions. While clinical MRI scans can iden-tify regions that are clearly damaged, this does not nec-essarily mean that the other regions are functioningnormally (functional and diffusion-weighted imagingof neurological patients [14,19] can help address thisproblem). Secondly, brain function is often plastic, andtherefore the function of preserved regions may adaptto compensate for focal damage.
However, neuropsychology also has intrinsicstrengths. For example, the power of inference basedon a conventional fMRI study is fairly weak. Gener-ally, fMRI studies indicate that certain regions are in-volved with specific tasks. Neuropsychology can makea stronger claim, identifying required regions for cer-tain tasks.
The inherent strengths of the neuropsychologicalmethod means it can play an important role in theemerging field of cognitive neuroscience. It can com-plement the use of other tools such as fMRI, single cellrecording, positron emission tomography (PET), eventrelated potentials (ERP), optical imaging and transcra-nial magnetic stimulation (TMS). Indeed, neuropsy-chology will perhaps become most useful as a tool forsteering further exploration with other techniques. Forexample, patients with posterior cerebral artery terri-tory infarcts often fail to recognize faces [4]; conver-gent findings using fMRI in healthy subjects show acti-vation in this region when viewing faces [9]. The spe-cific deficits found in patients can imply some level ofmodular processing, and suggest necessary regions forcompleting these tasks. Therefore, neuropsychologycan guide the choice of task and anatomical locationfor research with tools such as TMS, fMRI and ERP.
Behavioural Neurology 12 (2000) 191–200ISSN 0953-4180 / $8.00 2000, IOS Press. All rights reserved

192 C. Rorden and M. Brett / Stereotaxic display of brain lesions
If neuropsychology is to make an important contri-bution to the emerging field of cognitive neuroscience,close attention must be paid to the specific natureand location of the lesion giving rise to the functionaldeficits. The next section reviews the limitations ofthe lesion-mapping techniques that are currently pop-ular. Later sections describe an alternative method forpresenting patient data.
2. Traditional methods for presenting anatomicaldata
There are three common methods for presentinganatomical data from brain-injured patients. One solu-tion is to show the lesion on a template of a standardhealthy brain. A second technique is to describe thelesion using only a text description. A final methodis to display a representative slice or slices from thepatient’s clinical CT or MRI scan. This section willdescribe each of these techniques in turn, with an em-phasis on the limitations of each.
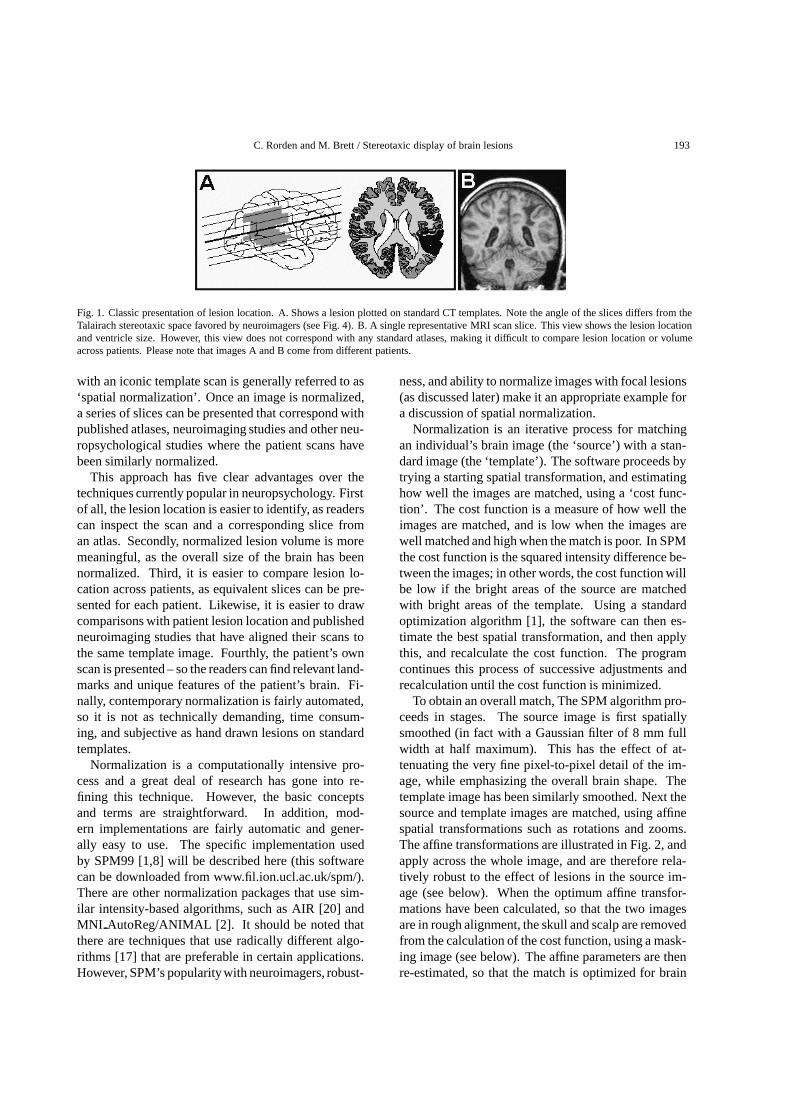
Lesions are often displayed on a series of templatebrain slices [3,7] (see Fig. 1(A)). The advantage of thistechnique is that lesion location and volume from dif-ferent patients can be roughly compared (even thoughactual brain size and orientation are different in theoriginal scans). Presenting lesions on these universaltemplates helps the reader visualize the approximatelocation of the lesion. However, this method has a num-ber of distinct drawbacks. First of all, standard neu-ropsychological CT-scan templates are distinctly dif-ferent from the templates commonly used to displayfMRI data. For example, compare Fig. 1(A) (a com-mon neuropsychology template) with Fig. 4 (an im-age aligned to a template used by many neuroimagers).Note that pitch of the Fig. 1(A)’s slices match the com-mon CT scanning angle, while the slice in Fig. 4 isaligned to easily recognized landmarks (as will be de-scribed later). Therefore, it is difficult to make compar-isons between the patient data and functional imagingdata. One of the biggest drawbacks of this techniqueis that the person drawing the lesion on the templateneeds to find the corresponding location on the clinicalscan and manually define the lesion. This is difficultbecause the template and the scan will be viewed at dif-ferent orientations and scales. Every brain has a uniquepattern of sulci and gyri, and the person defining thelesion must determine how to translate the location ofthe lesion to a template of a generic brain. Therefore,this technique requires a skilled individual who must
painstakingly make a number of difficult and often ar-bitrary decisions. Replication is difficult, as differentindividuals will focus on different landmarks. Anotherdifficulty with this technique is that the final presenta-tion is on a ‘universal’ brain, which can hide any uniquevariations found in the original lesion or the patient’sbrain. For example, the standard templates will hidedilated ventricles, mass effects (shifts in the location ofbrain structures due to edema, resorption, or tumors) orunique sulcal patterns.
A second technique for reporting lesion location isto present a text-based clinical description. This formatis often vague and it can be difficult to determine thelocus of the lesion with much accuracy based solely ona text-based report. In addition, lesion volume cannotbe accurately compared across patients. Furthermore,precise comparisons with neuroimaging studies cannotbe made. The readers are not able to inspect the scansthemselves and make their own judgements.
The third common technique for presenting patientdata is to present representative slice(s) of the pa-tient’s raw MRI or CT scan (as shown in Fig. 1(B)).This method preserves the morphological variations be-tween patients. However, the burden of interpretingthe lesion location and volume is placed on the reader.Because scans vary in scan angle and overall brain size,the slices do not correspond with neuroanatomical at-lases. Therefore, it can be difficult for the reader todetermine the location of a lesion. Furthermore, it isdifficult to compare the size and location of lesionsacross patients. Again, this method makes it difficult tomake comparisons between patients or with publishedneuroimaging studies.
In review, each of the contemporary methods for pre-senting lesion anatomy have limitations. Therefore, itis often difficult to relate neuropsychological findings toother methods. One solution is to present patient scansusing the same stereotaxic techniques used by neuroim-agers, as discussed in the next section. This approachcan improve our understanding of the anatomical basisfor neuropsychological findings.
3. Normalized scans: an alternative way to presentlesions
An alternative technique for presenting anatomicalinformation is to present the patient’s own MRI scan af-ter it has been coregistered to the same coordinate sys-tem used to present neuroimaging data. This techniqueof scaling, rotating and warping a brain to be aligned
C. Rorden and M. Brett / Stereotaxic display of brain lesions 193
Fig. 1. Classic presentation of lesion location. A. Shows a lesion plotted on standard CT templates. Note the angle of the slices differs from theTalairach stereotaxic space favored by neuroimagers (see Fig. 4). B. A single representative MRI scan slice. This view shows the lesion locationand ventricle size. However, this view does not correspond with any standard atlases, making it difficult to compare lesion location or volumeacross patients. Please note that images A and B come from different patients.
with an iconic template scan is generally referred to as‘spatial normalization’. Once an image is normalized,a series of slices can be presented that correspond withpublished atlases, neuroimaging studies and other neu-ropsychological studies where the patient scans havebeen similarly normalized.
This approach has five clear advantages over thetechniques currently popular in neuropsychology. Firstof all, the lesion location is easier to identify, as readerscan inspect the scan and a corresponding slice froman atlas. Secondly, normalized lesion volume is moremeaningful, as the overall size of the brain has beennormalized. Third, it is easier to compare lesion lo-cation across patients, as equivalent slices can be pre-sented for each patient. Likewise, it is easier to drawcomparisons with patient lesion location and publishedneuroimaging studies that have aligned their scans tothe same template image. Fourthly, the patient’s ownscan is presented – so the readers can find relevant land-marks and unique features of the patient’s brain. Fi-nally, contemporary normalization is fairly automated,so it is not as technically demanding, time consum-ing, and subjective as hand drawn lesions on standardtemplates.
Normalization is a computationally intensive pro-cess and a great deal of research has gone into re-fining this technique. However, the basic conceptsand terms are straightforward. In addition, mod-ern implementations are fairly automatic and gener-ally easy to use. The specific implementation usedby SPM99 [1,8] will be described here (this softwarecan be downloaded from www.fil.ion.ucl.ac.uk/spm/).There are other normalization packages that use sim-ilar intensity-based algorithms, such as AIR [20] andMNI AutoReg/ANIMAL [2]. It should be noted thatthere are techniques that use radically different algo-rithms [17] that are preferable in certain applications.However, SPM’s popularity with neuroimagers, robust-
ness, and ability to normalize images with focal lesions(as discussed later) make it an appropriate example fora discussion of spatial normalization.
Normalization is an iterative process for matchingan individual’s brain image (the ‘source’) with a stan-dard image (the ‘template’). The software proceeds bytrying a starting spatial transformation, and estimatinghow well the images are matched, using a ‘cost func-tion’. The cost function is a measure of how well theimages are matched, and is low when the images arewell matched and high when the match is poor. In SPMthe cost function is the squared intensity difference be-tween the images; in other words, the cost function willbe low if the bright areas of the source are matchedwith bright areas of the template. Using a standardoptimization algorithm [1], the software can then es-timate the best spatial transformation, and then applythis, and recalculate the cost function. The programcontinues this process of successive adjustments andrecalculation until the cost function is minimized.
To obtain an overall match, The SPM algorithm pro-ceeds in stages. The source image is first spatiallysmoothed (in fact with a Gaussian filter of 8 mm fullwidth at half maximum). This has the effect of at-tenuating the very fine pixel-to-pixel detail of the im-age, while emphasizing the overall brain shape. Thetemplate image has been similarly smoothed. Next thesource and template images are matched, using affinespatial transformations such as rotations and zooms.The affine transformations are illustrated in Fig. 2, andapply across the whole image, and are therefore rela-tively robust to the effect of lesions in the source im-age (see below). When the optimum affine transfor-mations have been calculated, so that the two imagesare in rough alignment, the skull and scalp are removedfrom the calculation of the cost function, using a mask-ing image (see below). The affine parameters are thenre-estimated, so that the match is optimized for brain

194 C. Rorden and M. Brett / Stereotaxic display of brain lesions
Fig. 2. An illustration of the common affine transformations. A. represents the standard template for this example. B. An image that mustrequires a translation (here, moved ventrally) in order to match the template. C. Shows an image that requires a ‘zoom’. D. Illustrates an imagethat would require a ‘rotation’ (in this case, of pitch). E. Requires a ‘shear’ (aka affine) transformation. Each of these illustrative caricaturesshows the specific transformation in only one of the three dimensions. Note that each of these transformations can be applied in each of thethree dimensions (e.g. rotation can influence the pitch, yaw and roll of an image). Affine transformations are sometimes referred to as lineartransformations. Note that normalization of most images requires some degree of each of these functions.
shape only. After the affine parameters have been op-timized, the algorithm proceeds to calculate the opti-mum parameters for nonlinear transformations in thesame iterative fashion as for the affine transforms. InSPM, the nonlinear functions are drawn from a discretecosine transform basis set, which are a set of cosinewave functions that will selectively compress some por-tions of the image while expanding other regions [1].Nonlinear functions improve the correspondence of thesource image to the template [1], but they tend to bemore sensitive to local differences than affine trans-forms. Because the non-linear transforms can havelarge effects that are quite local in the image, the non-linear transforms can have a significant impact on theshape of the lesioned area of the patient’s scan. Thenon-linear transforms are driven to change the shape ofthe lesioned area because the lesion will usually havea very different intensity in the patient’s scan to thecorresponding area in the template, and will thus con-tribute a large amount to the cost function that is to beminimized. This issue will be discussed later.
Neuroimagers typically normalize their images withtemplate images developed by the Montreal Neurolog-ical Institute, and subsequently adopted by the Interna-tional Consortium of Brain Mapping (ICBM) [5]. Thistemplate attempts to define a standard, by taking theaverage of the MRI brain scans from a large number ofyoung normal individuals. Normalizing the MRI scansfrom neurological patients (particularly those with fo-cal brain lesions) to this popular template maximizesthe correspondence of the resulting images with pub-lished neuroimaging studies. However, when normal-izing images from a group of patients with diffusebrain damage (e.g. Alzheimer’s patients), it may bepreferable to create a template based on the diseasedgroup [17]. The ‘Talairach’ coordinate system [16]is typically used to describe spatial locations in these
scans.1 While this coordinate system is unfamiliarto many neuropsychologists, it is fairly easy to de-scribe (in a slightly simplified manner). First of all,Talairach coordinates are measured with respect to theanterior commissure (AC), a fibre tract that connectsthe two hemispheres that lies anterior to the thalamus.Three axes define the Talairach coordinate system: left-right (X-axis), posterior-anterior (Y-axis), and inferior-superior (Z-axis). All the axes pass through the AC: theY-axis passes through both the anterior and posteriorcommissures; the Z-axis runs through the AC and upalong the interhemispheric fissure, and the X-axis runsperpendicular to the Z and Y-axes. Thus the AC is de-fined as having a Talairach coordinate of 0, 0, 0, and thestandard axial plane of the Talairach system containsthe AC, and is the plane where the Z coordinate is zero(see Fig. 4). It should be mentioned that the orientationof this plane is quite different from the orientation ofaxial planes found in most CT scans (compare the sliceorientation in Fig. 1(A) to the image in Fig. 4). Anypoint in the brain can be identified by its coordinate inmillimetres relative to these X, Y and Z axes, where apositive X coordinate is on the right of the AC, positiveY is anterior to the AC, and positive Z is above the AC.For example, a point at coordinate 38, −64, 58 is in theright, posterior, superior portion of the brain.
Two features can be clearly seen from the samplenormalized patient scans presented in Fig. 3. First ofall, despite the large lesions, all of the images are fairly
1Neuroimagers use the coordinate system developed by Talairachand Tornoux [16]. Unfortunately, no MRI scans exist for the brainused to create the Talairach atlas, and therefore the MRI templatesthat are available vary slightly from the atlas. Therefore, it can beambiguous to refer to ‘Talairach space’ (as it is unclear whether youare referring to the coordinate system or the brain in the Talairachand Tournoux atlas). For clarity, it is helpful to be clear as to thetemplate used for normalization. As noted, the MNI / ICBM tem-plate is currently the most popular. For more details see www.mrc-cbu.cam.ac.uk/Imaging/mnispace.html.

C. Rorden and M. Brett / Stereotaxic display of brain lesions 195
Fig. 3. Normalized T1-weighted MRI scans from three right-hemisphere patients. Note that they all display similar size, shape and orientation.These brains were normalized using SPM99’s masking feature as described in the text. These slices correspond to Talairach Y values of −40,−48, −56, −64 and −72 mm.
closely aligned to each other. A second feature is thatnormalization preserves the unique features of eachbrain. This is useful, as one can clearly see the differentextent of the lesions. Inherent to the fact that normal-ization preserves the unique elements of the image isthe fact that the normalizations are not ‘perfect’. Analgorithm that attempted to match all of the sulci wouldlead to many local distortions and would mask uniquefeatures. Further, each individual has a unique sulcalpattern [18]. Indeed, some individuals completely lacksome of the secondary and tertiary sulci [13]. There-fore, the concept of a ‘perfect’ normalization is am-biguous: any normalization will be the result of a seriesof compromises to preserve the overall size of a regionwhile trying to match the position of major sulci. Agood analogy is to think of sulcal patterns as finger-prints – with each individual having a unique set.
The type of normalization that we have describedabove matches the overall shape, size and orientationof the brain while preserving individual local features.As noted above, the normalization transforms are com-puted on a spatially smoothed copy of the source im-age, which reduced fine image detail such as the po-sitions of small sulci. One consequence of this is thatTalairach coordinates in images normalized with thissort of algorithm may have only an approximate re-lationship to the location of individual sulci and toBrodmann’s Areas [10,11]. In addition, one could ar-gue that reporting lesion data in terms of Talairach co-ordinates or sulcal landmarks (as estimated on the in-dividual images) is more appropriate for neuropsycho-
logical data than trying to specify the site of the lesionin terms of Brodmann’s Areas. Brodmann’s Areas arestrictly defined by cytoarchitecture, which cannot bedirectly observed in MRI scans. Based on histologicalwork, Zilles and colleagues [21] have noted that bothnormalization and sulcal landmarks are not generallyprecise indicators of the borders of cytoarchitectonicareas.
To summarize, normalization is a technique forcoregistering brains to a common template. This al-lows one to make comparisons across individuals whileretaining many of the unique features of each brain(e.g. sulcal patterns). The Talairach coordinate systemis used to describe locations in normalized space.
4. Technical difficulties facing normalization ofpatient scans
Despite the clear advantages of presenting patientlesions using normalized MRI scans, this technique re-mains rare in the neuropsychological literature. In thepast, a number of technical obstacles have preventedneuropsychologists from presenting normalized scans.First of all, MRI scans have only recently become avail-able for most neuropsychologists (replacing CT scanswhere the distance between slices is too large to allowrobust normalization). Second, early algorithms formatching damaged patient brains with standard tem-plates were either time consuming or unreliable. Third,

C. Rorden and M. Brett / Stereotaxic display of brain lesions 197
software for mapping lesion location on MRI scans wasexpensive, nonexistent, or difficult to use. Finally, anumber of proprietary clinical MRI formats exist, andit was difficult to convert these clinical formats to thescientific file formats that are recognized by normal-izing software. In this section, each of these hurdleswill be described. The next section will describe recentdevelopments that address each of these issues.
In the past, only a small percentage of neurologicalpatients received high quality MRI scans. While CTscans are useful for clinical diagnosis, they are less thanideal for scientists studying brain function. First ofall, most CT scans have very large interslice distances,so damage to brain regions that lie between successiveslices must be extrapolated. Second, CT scans oftendo not provide the anatomical and clinical accuracy ofcombined T1 and T2 MRI scans. Clinical T2-weightedimages excel in distinguishing fluids from other materi-als - specifically cerebral spinal fluids and most patho-logic lesions (edema, tumor and infarction). On theother hand, T1-weighted images show a high degree ofcontrast between gray and white matter, giving excel-lent anatomical information [12].
Attempting to normalize MRI scans from neurolog-ical patients with standard anatomical atlases can be anunreliable procedure. The fundamental problem is thatthe templates are based on neurologically intact brains,and the region of the lesion can disrupt the normaliza-tion (as the lesion intensity is radically different fromthe corresponding region in the template). One optionwould be to normalize patient brains by hand – man-ually adjusting the overall brain size, angle, position,etc. to match the anatomical template. However, man-ual methods are time consuming (adjustments must bemade in all three dimensions) and subjective [15]. Asmentioned earlier, normalization is an iterative process,where small adjustments are tested to see if they im-prove the alignment of the image. One potential prob-lem with this process is that it can get trapped in a“local minimum” – where the algorithm settles for anincorrect set of spatial transformations because smallchanges in alignment reduce the overall fit even thougha bigger change would improve it. By reducing thecorrespondence of a correct fit, lesions can greatly in-crease the chance that the normalization functions willsettle on an incorrect alignment.
Neuropsychologists have traditionally been slow topresent MRI scan data partly because the software toview images and define lesions was expensive, difficultto use and required exotic hardware. Until recently,brain-imaging software required a high-end worksta-
tion with a large amount of memory. For example, asingle standard high resolution T1 scan (256×256×128voxels, storing 16-bits of data per voxel) can consume16 MB of hard disc storage, and will require a consid-erable amount of random access memory for viewing.Few neuropsychologists had access to these systems.In addition, most of the available brain-imaging soft-ware was designed for neuroimagers, and these pack-ages did not have many tools to aid neuropsychologistsin identifying and measuring the lesion volume.
A final challenge faced by neuropsychologists is thatthere are many manufacturers of MRI, CT and PETscanner systems. Generally, each of these systemssaves images in their own proprietary format. Theseproprietary clinical formats are different from the sci-entific formats used by most normalizing software andmost neuroimagers. Therefore, the popular scientifictools have been unable to view or modify clinical scans.
5. Recent advances
The previous section reviewed the numerous obsta-cles that have prevented neuropsychologists from nor-malizing patient scans. This section describes a num-ber of recent technical advances that can aid neuropsy-chologists hoping to normalize scans from neurologicalpatients. Taken together, these techniques are usefulfor displaying lesion location in stereotaxic space.
Until recently, high-resolution MRI scans were rareand expensive. Fortunately, MRI scans are becomingmore common. This is a trend that will continue in thefuture. The combination of T2-weighted scans (thatgenerally show precise pathological information) andT1-weighted scans (with their excellent anatomical def-inition) allow scientists to accurately map the locationand extent of lesions. High-resolution T1 scans offerthin slice thickness, so there is minimal need to inter-polate the extent of the lesion between slices. With asmall voxel size, and a field of view that covers the en-tire brain, many MRI sequences are ideal for accurateautomated normalization.
One danger when normalizing scans from a neuro-logical patient is that the unusual intensity of the lesioncan disrupt the normalization. In addition to the abnor-mality caused by the lesion itself, scans from patientsoften show greatly dilated ventricles, mass effects and(non-magnetic) aneurysm clip artifacts that can also in-terfere with the normalization process. In particular,nonlinear transformations that improve normalizationof scans from intact individuals can lead to the defor-

198 C. Rorden and M. Brett / Stereotaxic display of brain lesions
mation of patient lesions. These functions are heav-ily influenced by local detail, and they can greatly dis-tort damaged regions. For example, a dark-appearinglesion in the white matter can be crushed so that theoverall white matter for the patient’s scan most closelyresembles the template scan of a healthy brain. One op-tion is to only apply linear transforms when normaliz-ing scans from patients. While this somewhat reducesthe fit for intact regions, these ‘affine only’ transformsare fairly robust even when confronted with very largelesions.
Brett, Leff, and Ashburner (www.apnet.com/www/journal/hbm2000/6786.html) have developed routinesfor SPM99 that allow accurate normalization of scansfrom lesioned brains. They describe a simple techniquefor masking the lesion, so that the unusual signal fromthe lesion does not influence the computation of thetransformations. They demonstrate that this techniquecan allow both affine and nonlinear transformationsto be accurately computed. In addition, this methodis straightforward to apply. First, the lesion extent isdrawn on top of the scan. This stage allows the userto define the regions of the original scan that will nothave equivalent intensities in the template image (e.g.the lesion, clip artifacts, etc.). Next, this ‘region ofinterest’ (ROI) is inverted, so that regions outside theabnormal tissue have values of 1, and the abnormal tis-sue contains zeros. Next the inverted ROI is smoothedusing the same function that will be applied to the brainimage during normalization, and finally thresholded sothat values in the smoothed image that are not veryclose to 1 are set to zero. This image is the ‘sourcemask’. The reason for smoothing and thresholding theROI is to deal with the fact that the source brain im-age is smoothed (prior to normalization), and thereforeregions of abnormal image intensity will ‘bleed’ intosurrounding voxels. Smoothing and thresholding theROI ensures that the normalization will only be con-ducted on healthy tissue with a contribution from ab-normal tissue that is very near zero. Next, one conductsan SPM normalization using the source mask to definethe area of the image that is to be used to computethe transforms. Specifically, when the normalization istesting a transformation, it will calculate the pixel val-ues for the source image after the transformation, andalso the matching pixel values from the mask image.Wherever the pixel values for the mask image are 0, theprogram sets the cost function (the squared differencebetween the transformed source image and the tem-plate image for that pixel) to 0. Using this masked costfunction, the program can calculate the optimum linear
and nonlinear transforms that match only the regionsthat fall outside of the source mask (i.e. based onlyon the healthy tissue). Finally, the transforms are ap-plied to the entire brain image (for example, if the brainneeded to be ‘zoomed’ to be 20% smaller, both the le-sion and the healthy tissue would both be scaled appro-priately). This ‘lesion masking’ technique ensures thatthe lesion normalization is based solely on the portionsof the source image that match the template image.Brett and colleagues have demonstrated that this tech-nique can greatly improve the normalization accuracyfor images from stroke patients. However, there aresome limitations to the lesion masking technique. Ifthe lesion is very large, and especially if the abnormalarea is large and bilateral, then the normalization mayhave too little information to work on. In this case,the program may calculate transformations that matchthe remaining brain very well, but cause severe distor-tions in the masked area, that are clearly incorrect, andare obvious to visual inspection. In the evaluations ofBrett et al., the technique worked well even for lesionsthat included most of one hemisphere. If the lesion islarge enough to cause problems for the lesion maskingtechnique, then one may need to use an affine-only ormanual normalization.
In the past, software for tracing lesions was ex-pensive, generally difficult to use and required exotichardware. For example, Brainvox brain imaging soft-ware [6] requires a SGI workstation. A fundamen-tal problem has been that brain images contain a largeamount of data – and manipulating this vast amount ofdata required large hard disk drives, fast CPUs and largeamounts of RAM. Previously, these hardware require-ments were only fulfilled by the high-end workstations.However, cheap desktop computers have recently be-come much more powerful, and modern desktops arenow more powerful than the previous generation ofworkstations.
A second problem is that the number of neuropsy-chologists has been too small to justify software com-panies investing the money to develop software forthis market. A recent solution is MRIcro, a free soft-ware package released in January 1999. MRIcro isboth fairly ease to use and has a number of toolsto help neuropsychologists. MRIcro will run on anymodern Windows or Linux Intel-compatible PC. Thesoftware uses a graphical user interface that makes iteasy to use. It should be stressed that MRIcro wasnot designed for clinical use. However, the softwarehas found a niche being used by scientists workingwith medical images. One can use MRIcro to rapidly

C. Rorden and M. Brett / Stereotaxic display of brain lesions 199
Table 1This table lists free tools for converting proprietary medical image formats to the Analyze format used by scientificnormalization and viewing software. In addition, the table lists the URLs for downloading these packages
Tool System Formats read / URL
MRIcro Windows, Linux – Analyze, DICOM, NEMA, GE LX, GE Genesis, Interfile,ECAT6/7, Siemens Magnetom Vision, Picker CT, SPMwin, Raw
– www.psychology.nottingham.ac.uk/staff/cr1/mricro.htmlImageJ Windows, Unix, Macintosh – Analyze, BMP, DICOM, GIF, JPEG, TIFF
– /rsb.info.nih.gov/ij/MedCon Windows, Unix – Analyze, DICOM, NEMA, ECAT6, GIF
– petaxp.rug.ac.be/˜nolf/ImageConverter Windows – Analyze, Siemens System 7, Shimadzu HeadTome IV, Hamamatsu
Photonics SHR2000, GEMS 2048-15B– www.fil.ion.bpmf.ac.uk/spm/spmw.html
view a scan and define the damaged region. Mod-ern computers running Windows or Linux can alsouse SPM2 and take advantage of its advanced nor-malization features. MRIcro can be downloaded fromthe web: www.psychology.nottingham.ac.uk/staff/cr1/mritut.htm.
Both MRIcro and SPM use graphical interfaces.With MRIcro, many of the standard functions are simi-lar to the functions of other Windows applications (seeFig. 4). For example, to load an MRI scan you can sim-ply drag and drop its icon onto the program (MRIcrowill automatically identify the image format, regardlessof whether it is in Analyze, DICOM, or a supportedproprietary format). The application includes drawingtools that allow the user to quickly outline and savethe lesion location. Creating these regions of interest(ROIs) allows the user to compute lesion volume, com-pare regions of mutual involvement and create lesionmasks for SPM99 (the technique developed by Brett etal. described earlier). Performing an accurate normal-ization of a patient scan is somewhat more involved.However, a step-by-step tutorial for using MRIcro andSPM to normalize and present scans is available onthe web (www.psychology.nottingham.ac.uk/staff/cr1/mritut.htm). Following this guide, most users canquickly learn how to display lesions in stereotaxicspace. Additional tips are available from the MedicalResearch Council’s Cognition and Brain Sciences Unitin Cambridge (www.mrc-cbu.cam.ac.uk/Imaging/). Insum, the introduction of modern, more powerful com-
2While SPM99 is free, it does require a Matlab license. One alter-native is to use the freeware “SPM for Windows” (a.k.a. SPMwin) –a free implementation of SPM96 that does not require MatLab. Onelimitation with SPMwin is that it cannot perform SPM99’s lesionmasking (as outlined in this article). Therefore, when normalizingimages of lesioned brains, SPMwin users should conduct affine-onlytransformations. To find out more about SPM or SPMwin, visitwww.fil.ion.bpmf.ac.uk/spm/spmw.html.
puters and the advent of free brain imaging software al-lows neuropsychologists to work with MRI scans usingtheir desktop computer.
The final hurdle confronting neuropsychologists wasthe large number of proprietary medical image formats.Many scanner manufacturers have designed their ownimage formats. This makes the user dependent on themanufacturers’ software for viewing and printing scans.Unfortunately, the scientific software available for nor-malizing images cannot read these formats. However,there has recently been a major shift in the industrywith most new scanners supporting the DICOM for-mat (or its predecessor, the NEMA format). There-fore, most neuropsychologists will only require soft-ware to convert images from the DICOM standard to ascientific standard. In addition, a number of free soft-ware packages have been developed that can convert abroad range of medical image formats into a standardscientific format (the ‘Analyze’ format). Table 1 listsa number of free tools for converting medical images.For example, MRIcro can convert the most commonclinical images to Analyze format.
6. Conclusions
Neuropsychological research can play an importantrole in the developing field of cognitive neuroscience.Lesion studies can provide convergent information andhelp guide studies using different methods. However,one traditional weakness with lesion studies has con-cerned the presentation of anatomical data. Presentinganatomical data in a consistent framework can improvecomparisons across studies and improve the correspon-dence of lesion studies with other methods. This ar-ticle describes the methods used by neuroimagers andsuggests that it is a robust tool for lesion studies. Thismethod can improve our understanding of the anatom-ical basis of neurological syndromes.
200 C. Rorden and M. Brett / Stereotaxic display of brain lesions
References
[1] J. Ashburner and K.J. Friston, Nonlinear spatial normalizationusing basis functions, Human Brain Mapping 7 (1999), 254–266.
[2] D.L. Collins, P. Neelin, T.M. Peters and A.C. Evans, Auto-matic 3D intersubject registration of MR volumetric data instandardized Talairach space, Journal of Computer AssistedTomography 18 (1994), 192–205.
[3] H. Damasio and A.R. Damasio, Lesion Analysis in Neuropsy-chology, New Yourk, Oxford, 1989.
[4] E. De Renzi, Prosopagnosia, in: Patient-based approaches tocognitive neuroscience, M.J.F.a.T.E. Feinberg, ed., MIT Press,Cambridge, MA, 2000.
[5] A.C. Evans, M. Kamber, D.L. Collins and D. Macdonald, AnMRI-based probabilistic atlas of neuroanatomy, in: MagneticResonance Scanning and Epilepsy, S.S. Shorvon, D. Fish, F.Andermann and G.M.H. Bydder, eds, 1994.
[6] R.J. Frank, H. Damasio and T.J. Grabowski, Brainvox: aninteractive multimodal visualization and analysis system forneuroanatomical imaging, NeuroImage 5 (1997), 13–30.
[7] R. Frey, D.L. Woods, R.T. Knight and D. Scabini, Definingfunctional cortical areas with “averaged” CT scans, Society ofNeuroscience Abstracts 13 (1987), 1266–1267.
[8] K.J. Friston, J. Ashburner, C.D. Frith, J.B. Poline, J.D. Heatherand R.S.J. Frackowiak, Spatial registration and normalizationof images, Human Brain Mapping 3 (1995), 165–189.
[9] N. Kanwisher, J. McDermott and M. Chun, The fusiform facearea: A module in human extrastriate cortex specialized forface perception, Journal of Neuroscience 11 (1997), 4302–4311.
[10] J.L. Lancaster et al., Automated Talairach atlas labels for func-tional brain imaging, Human Brain Mapping 10 (2000), 120–131.
[11] J.C. Mazziotta, A.W. Toga, A. Evans, J.L. Lancaster and P.T.
Fox, A probabilistic atlas of the human brain: Theory andrational for its development, Neuroimage (1995), 89–101.
[12] P.G. Morris, Nuclear magnetic resonance imaging in medicineand biology, Claredon Press, Oxford, 1986.
[13] M. Ono, S. Kubik and C.D. Abernathey, Atlas of the cerebralsulci, Theime Medical Publishers, New York, 1990.
[14] C.J. Price, D. Howard, K. Patterson, E.A. Warburton, F.J.Friston and R.S.J. Frackowiak, A functional neuroimagingdescription of two deep dyslexic patients, Journal of CognitiveNeuroscience 10 (1998), 303–315.
[15] M. Sugiura et al., Anatomic validation of spatial normalizationmethods for PET, Journal of Nuclear Medicine 40 (1999),317–322.
[16] J. Talairach and P. Tournoux, Co-planar Stereotaxic Atlas ofthe Human Brain, George Thieme, New York, 1988.
[17] P.M. Thompson, M.S. Mega, K.L. Narr, E.R. Sowell, R.E.Blanton and A.W. Toga, Brain image analysis and atlas con-struction, in: Handbook of Medical Imaging, M.S.a.J.M. Fitz-patrick, ed., SPIE Press, Bellingham, WA, 2000.
[18] P.M. Thompson, C. Schwartz, R.T. Lin, A.A. Khan and A.W.Toga, 3D Statistical Analysis of Sulcal Variability in the Hu-man Brain, Journal of Neuroscience 16 (1996), 4261–4274.
[19] D.J. Werring, A.T. Toosy, C.A. Clark, G.J.M. Parker, G.J.Barker, D.H. Miller and A.J. Thompson, Diffusion tensorimaging can detect and quantify corticospinal tract degener-ation after stroke, Journal of Neurology Neurosurgery andPsychiatry 69 (2000), 269–272.
[20] R.P. Woods, S.R. Cherry and J.C. Mazziotta, Rapid automatedalgorithm for aligning and reslicing PET images, Journal ofComputer Assisted Tomography 16 (1992), 620–633.
[21] K. Zilles et al., Quantitative analysis of sulci in the humancerebral cortex: Development, regional heterogeneity, genderdifference, asymmetry, intersubject variability, and corticalarchitecture, Human Brain Mapping 5 (1997), 218–221.

196 C. Rorden and M. Brett / Stereotaxic display of brain lesions
Fig. 4. MRIcro is a free application that can display images from a broad range of scanners. It includes drawing tools that allow neuropsychologiststo compute lesion volume, identify regions of mutual involvement, and create lesion masks for SPM99. The top panel illustrates the approximatelocation of the anterior commissure, the landmark used as the origin for Talairach space. The lower left panel shows an axial slice where a lesioncan be observed. The bottom right panel shows how the user can draw a region of interest (ROI) that includes the lesion – depicted as white. Thevolume of the ROI is reported in the lower-left portion of the MRIcro window (here, 14.8cc). Also, note that the pen tool has been selected (assignified by the depressed-button depicting a curved-line visible in the lower left of the window), allowing the user to outline the ROI.

Submit your manuscripts athttp://www.hindawi.com
Stem CellsInternational
Hindawi Publishing Corporationhttp://www.hindawi.com Volume 2014
Hindawi Publishing Corporationhttp://www.hindawi.com Volume 2014
MEDIATORSINFLAMMATION
of
Hindawi Publishing Corporationhttp://www.hindawi.com Volume 2014
Behavioural Neurology
EndocrinologyInternational Journal of
Hindawi Publishing Corporationhttp://www.hindawi.com Volume 2014
Hindawi Publishing Corporationhttp://www.hindawi.com Volume 2014
Disease Markers
Hindawi Publishing Corporationhttp://www.hindawi.com Volume 2014
BioMed Research International
OncologyJournal of
Hindawi Publishing Corporationhttp://www.hindawi.com Volume 2014
Hindawi Publishing Corporationhttp://www.hindawi.com Volume 2014
Oxidative Medicine and Cellular Longevity
Hindawi Publishing Corporationhttp://www.hindawi.com Volume 2014
PPAR Research
The Scientific World JournalHindawi Publishing Corporation http://www.hindawi.com Volume 2014
Immunology ResearchHindawi Publishing Corporationhttp://www.hindawi.com Volume 2014
Journal of
ObesityJournal of
Hindawi Publishing Corporationhttp://www.hindawi.com Volume 2014
Hindawi Publishing Corporationhttp://www.hindawi.com Volume 2014
Computational and Mathematical Methods in Medicine
OphthalmologyJournal of
Hindawi Publishing Corporationhttp://www.hindawi.com Volume 2014
Diabetes ResearchJournal of
Hindawi Publishing Corporationhttp://www.hindawi.com Volume 2014
Hindawi Publishing Corporationhttp://www.hindawi.com Volume 2014
Research and TreatmentAIDS
Hindawi Publishing Corporationhttp://www.hindawi.com Volume 2014
Gastroenterology Research and Practice
Hindawi Publishing Corporationhttp://www.hindawi.com Volume 2014
Parkinson’s Disease
Evidence-Based Complementary and Alternative Medicine
Volume 2014Hindawi Publishing Corporationhttp://www.hindawi.com


