Steps so far taken & their impacts Euro Norms Towards ...cpcbenvis.nic.in/cpcb_newsletter/AUTO...
21
Central Pollution Control Board http://www.cpcbenvis.nic.in/newsletter/autoemissionjun1999/jun1999.htm[9/6/2012 11:01:26 AM] Introduction Steps so far taken & their impacts Euro Norms Towards Integrated Approach
Transcript of Steps so far taken & their impacts Euro Norms Towards ...cpcbenvis.nic.in/cpcb_newsletter/AUTO...

Central Pollution Control Board
http://www.cpcbenvis.nic.in/newsletter/autoemissionjun1999/jun1999.htm[9/6/2012 11:01:26 AM]
IntroductionSteps so far taken & their impactsEuro NormsTowards Integrated Approach

Central Pollution Control Board
http://www.cpcbenvis.nic.in/newsletter/autoemissionjun1999/jun99edi.htm[9/6/2012 11:01:27 AM]
Contents
Archives
Home
With the recent directives of the Hon’ble Supreme Court regarding compliance of emissionnorms for sale of new cars in the National Capital Region, the various aspects of vehicularpollution have been brought to limelight. These include engine technologies, fuel quality,public transport, inspection and certification system for on-road vehicles and trafficmanagement. In an earlier issue of Parivesh (December, 1997), we discussed these aspects insome detail. Based on findings of our air quality monitoring data, we had drawn the attentionof concerned authorities and public at large for creation of awareness and for decisions onmeasures required for curbing the menace of auto emissions.
Dilip Biswas Chairman, CPCB

Central Pollution Control Board
http://www.cpcbenvis.nic.in/newsletter/autoemissionjun1999/jun1999intro.htm[9/6/2012 11:01:28 AM]
INTRODUCTION
With the exponential increase in the number of motor vehicles, vehicular exhaust has become a major source of airpollution in urban centres. For containing vehicular pollution, the Government has taken some important initiatives inrecent years. These relate to progressive tightening of auto-emission norms (1991,1996, 1998 & 2000) and fuel qualityspecifications (1996) as recommended by the Central Pollution Control Board (CPCB). CPCB had also drawn up a seriesof Action Points (1995) and a Strategy for Vehicular Pollution Control (1997) with estimates of possible reduction inpollution load through the individual and combination of various measures including phasing out of grossly polluting oldvehicles and introduction of systematic inspection and certification system for on-road vehicles.
Among the metro-cities, the capital city is most severely affected with the highest number of motor vehicles and as muchas 70% of the air pollution is attributed to vehicular exhaust. This is why, the Environment Pollution (Prevention &Control) Authority for NCR, (constituted in January 1998) was asked to pay special attention to the measures forcontainment of vehicular pollution.
Based on the inputs provided by CPCB and discussions with the concerned agencies, the Authority had enlisted somepriority measures and time targets for vehicular pollution control. The Hon’ble Supreme Court approved the proposedmeasures and directed that these measures should be implemented. Some of the measures have been implemented whileothers are in different stages of implementation (Table 9). A review of the steps so far taken and their impacts vis-à-visthe steps which need to be taken for an integrated approach towards control of vehicular pollution is presented in thefollowing sections.
Back to Content

Central Pollution Control Board
http://www.cpcbenvis.nic.in/newsletter/autoemissionjun1999/jun1999step.htm[9/6/2012 11:01:28 AM]
STEPS SO FOR TAKEN AND THEIR IMPACTS
As a result of initiatives taken in recent years which have been reinforced through the Environmental Pollution ControlAuthority and directions of the Hon’ble Supreme court, the impacts in terms of pollution reduction as confirmed byCPCB findings include the following:
(I) Unleaded Petrol
With the progressive reduction of lead content in petrol (from 0.56 gm./litre to 0.15 gm./litre), introduction ofunleaded petrol for new passenger cars from April, 1995 and supply of only unleaded petrol for all vehicles fromSeptember, 1998, in UT of Delhi a lethal pollutant from vehicular exhaust has been removed. The lead content inthe atmosphere near traffic intersections of UT of Delhi has reduced by more than 60% with the introduction ofunleaded petrol. The apprehensions that the unleaded petrol would adversely affect the performance of engines andincrease the emission of benzene have also been allayed. The refineries have been asked to ensure that the benzenecontent in unleaded petrol is not increased beyond the limit of 5% (v/v) as prescribed for the leaded petrol in 1996and 3% (v/v) from 2000. However, the ambient air quality monitoring data indicate high levels of benzene andpolyaromatic hydrocarbons before and after introduction of unleaded petrol. Hence, in addition to phasing out oflead it is necessary to reduce the benzene (to 1% or lower) and aromatics in petrol not only for Delhi but also forother parts of the country.
(II) Sulphur in Diesel
Sulphur contentin dieselsupplied inDelhi wasreduced to0.5% in 1996and it wasfurther reducedto 0.25% in1997. It isexpected thatdiesel with0.25% sulphurwill be -availablethroughout thecountry bySeptember,1999.Considering thefact that severalcountries haveintroduced
SULPHUR IN DIESEL
Diesel emissions contain sulphur in particulateand gaseous form, and thus any reduction insulphur has dual advantages. Recent evaluationscarried out in Europe show the benefits of reducedsulphur in diesel fuel for lowering particulates. Forexample, preliminary data released from theAuto/Oil study showed that lowering the dieselfuel sulphur level from 2000 particles per million(ppm) 500 ppm reduced overall particulate fromlight-duty diesels by 2.4 percent, and from heavy-duty diesels by 13 percent. The relationshipbetween particulates and sulphur level was foundto be linear; for every 100 ppm reduction insulphur, there is a 0.16 percent reduction inparticulate from light-duty vehicles and a 0.87percent reduction from heavy-duty vehicles.
Options to Reduce the Sulphur Content of DieselFuel

Central Pollution Control Board
http://www.cpcbenvis.nic.in/newsletter/autoemissionjun1999/jun1999step.htm[9/6/2012 11:01:28 AM]
diesel withmuch lowersulphur contentand it isnecessary tohave lowsulphur dieselfor meeting theemission normsbeyond EURO-II norms (forEURO-I toEURO-IInorms, sulphurcontent indiesel is 0.3%),the refinerieswill need totake steps forbringing downthe sulphurcontent.
In the crude state, increase the proportion oflow-sulphur crude oil.
Reduce the cut point of diesel fractions fromboth primary distillation as well as from the
fractionation of secondary processingstreams to 350-360oC.
Improve fractionation efficiency toeliminate inter-stream overlaps during
fractionation of diesel oils. Hydro-treat straight-sun diesel and
thermally cracked diesel and/or hydrofine;reduce proportions of FCC oil blended into
final product diesel oil. Install hydrocrackers that would enable
production of very low-sulphur saturateddiesel with high cetane numbers.
GASOLINE LEAD PHASE OUT PROGRAMME IN INDIA
Phase – I June 1994 Lowleaded (0.15 g/l)
Cities of Delhi,Mumbai, Calcutta andChennai
Phase – II 1.4.1995 Unleaded (0.013 g/l) (+ low leaded)
Cities of Delhi,Mumbai, Calcutta andChennai
Phase – III 1.1.1997 Lowleaded (0.15 g/l) Entire country
Phase – IV 1.9.1998 Ban on Leaded fuel(Only unleaded fuel)
NCT Delhi
Phase – V 31.12.1998(Advancedto 1.9.98)
Unleaded (0.013 g/l) (+ low leaded)
All other capitals ofStates / UTs and othermajor cities.
Phase - VI 1.1.99 Unleaded only (0.013 g/l)
NCR
Phase – VII 1.4.2000 Unleaded (0.013 g/l) (+ low leaded)
Entire country
DIESEL SULPHUR PHASE OUT ROGRAMME IN INDIA
Phase I April 96 Low Sulphur (0.5%)
Four metros and TajTrapezium

Central Pollution Control Board
http://www.cpcbenvis.nic.in/newsletter/autoemissionjun1999/jun1999step.htm[9/6/2012 11:01:28 AM]
Phase II August 97 Low Sulphur(0.25%)
Delhi and Taj Trapezium
Phase III April 98 Low Sulphur (0.25%)
Metro Cities
Phase IV April 99 Low Sulphur (0.25%)
Entire Country
(III) Tightening of vehicular emission norms
During 1990-91, for the first time, mass emission norms for vehicles at manufacturing stage as well as for in-usevehicles have been notified. For meeting these norms, the manufacturers did not require any major modifications.The emission norms along with fuel quality specifications laid down in 1996 required the automobile manufacturersto make modification in the engine design particularly in regard to crankcase emission and evaporative emissioncontrol. From April, 1995 new passenger cars were allowed to register only if these were fitted with catalyticconverters. Emission norms for such cars were tightened by 50 percent as compared to 1996 norms. The testingmethod for Passenger Cars norms was changed to cold start from hot start from April 98 which is a stricterprocedure than the previous one. The norms for the year 2000 notified in August 1997 under the Motor VehicleRules require major modifications in the engine design specially in regard to fuel injection system in passenger carsand fitment of catalytic converters in 2 stroke engines. These standards are akin to EURO-I norms adopted in theEuropean countries in 1992. With the recent directions of the Hon’ble Supreme Court, passenger cars (both petroland diesel) are required to meet atleast EURO-I norms June 1999 and from April 2000 only such vehicles meetingEURO-II norms will be registered in the National Capital region. CNG operated vehicles are also permitted by theSupreme Court directions.
(IV) 2-T oil for 2 stroke engines
On the recommendation of CPCB, the Ministry of Environment & Forests notified the specifications for 2T oilwhich became effective from 01.04.99. The specifications required use of low smoke 2T oil which is one of thecauses of pollution from 2 stroke engines. To prevent the use of 2T oil in excess of the required quantity, pre-mixed 2T oil dispensers have been installed in all the petrol filling stations of Delhi. Sale of loose 2T oil has alsobeen banned from December, 1998.
POLLUTION REDUCTION THROUGH PREMIX 2T OIL DISPENSERThe two stroke two and three wheelers require 2 T oil for lubrication of engine. The lubrication is carried out eitherthrough premixing modes or through oil injection modes. In either case it is a total loss system as the oil is burnt alongwith the fuel and goes through the exhaust. The burnt oil comes out through the exhaust, which is responsible for smokeand particulate matter emission.The burning quality of mineral based lubricating oil is very poor as compared to that ofpetrol. Major fraction of the lubricating oil entering the engine may therefore burn only partially or remain unburned.Some of the burnt oil may lead to formation of solid particles while major fraction may remain unburnt. This reflectsitself as visible smoke in the exhaust in the form of oil droplets and some solid particles. The totality of these solidparticles is referred to as particulate matter.The two stroke vehicles required 2 T oil at concentration not more than2% i.e. 20 ml in a litre of petrol. There is tendency to mix excess oil in petrol keeping disbelief in mind that morelube oil increase engine life.Excess use of 2 T oil causes following problems :
1.
1. Increases visible smoke and particulate matters. It has been found that with increase of 1% of oil there isincrease of about 15% of particulate matter.
1. Oil consumption is more.2. More engines deposit.

Central Pollution Control Board
http://www.cpcbenvis.nic.in/newsletter/autoemissionjun1999/jun1999step.htm[9/6/2012 11:01:28 AM]
3. Reduction in life of spark plug and engine.
(V) Phasing out of grossly polluting vehicles
To begin with, 20-year old vehicles were prohibited from plying from December 1998, followed by phasingout of 17-year old vehicles from November 98 and 15-year old vehicles from December 1998. Registrationof new auto-rickshaws with front engine has been banned from May 1996 and the registration of old defenceservice and govt. auctioned vehicles has been banned from April, 1998.
(VI) Impacts on pollution load and air quality
The steps taken so far taken had some impact on vehicular pollution load and air quality. The major impactshave been observed through implementation of emission norms and fuel quality specifications effective from1996, as also phasing out of 15-year old commercial vehicles and leaded petrol in the year 1998. Table 1shows estimated vehicular pollution load in different years if no measures were taken and with variousmeasures taken. Due to increase in growth of vehicles, the vehicular pollution load has increased from 1990-91 to 1995-96. With the implementation of emission norms and fuel quality specifications, phasing out of 15-year old vehicles and leaded gasoline the pollution load has decreased in 1998-99. The ambient air qualitymonitored in different areas of Delhi also shows a similar trend (Table 2). As compared to 1995, the levelsof pollutants in the ambient air of Delhi has decreased by 4-40 percent in case of SO2, 4-13 percent in caseof NO2, 6-17 percent in case of Particulate Matter, 3 percent in case of Carbon monoxide and 11 to 60percent in case of lead during 1998.
Table 1 Estimated Vehicular Pollution Load in Delhi
Pollutants Pollution Load in thousand tonnes % reduction ascompared to 1995-96
Without measures With measures
1990-91
1995-96
1998-99
1995-96
1998-99
Carbonmonoxide
243 373 451 351 337 4
Hydrocarbons 82 123 148 113 115 +2
NitrogenOxides
139 208 248 207 182 12
Sulphurdioxide
10 15 17 15 11 27
Lead 0.190 0.259 0.362 0.259 0.007 97
ParticulateMatter
19 28 33 28 21 25
TotalPollutionLoad
394 747 897 714 666
EmissionLoad in t/day
1351 2047 2459 1957 1825

Central Pollution Control Board
http://www.cpcbenvis.nic.in/newsletter/autoemissionjun1999/jun1999step.htm[9/6/2012 11:01:28 AM]
Table 2 Estimated Vehicular Emission load in Delhi
Pollutants Pollution load in thousand tonnes
1990-91 1995-96 1998-99 % reduction as compared to 1995-96
Sulphur dioxide 10 15 11 27
Nitrogen dioxide 139 207 182 12
ParticulateMatter
19 28 21 25
Lead 0.190 0.362 0.007 97
CarbonMonoxide
243 351 337 4
Hydrocarbons 0.83 113 115 +2
Table 3 Ambient air quality in Delhi
1995 1998 Percent reduction ascompared to 1995
INDUSTRIAL AREA
Sulphur dioxide 24.1 20.2 16
Nitrogen dioxide 35.5 34.7 4
Suspended Particulate Matter 420 367 13
Lead 110 105 5
RESIDENTIAL AREA
Sulphur dioxide 16.5 15.8 4
Nitrogen dioxide 32.5 28.6 13
Suspended Particulate Matter 409 341 17
Lead 155 95 39
TRAFFIC INTERSECTIONS
Sulphur dioxide 42 25 40
Nitrogen dioxide 66 63 5
Suspended Particulate Matter 452 426 6
Central Pollution Control Board
http://www.cpcbenvis.nic.in/newsletter/autoemissionjun1999/jun1999step.htm[9/6/2012 11:01:28 AM]
Lead 335 136 60
Carbon Monoxide 5587 5450 3
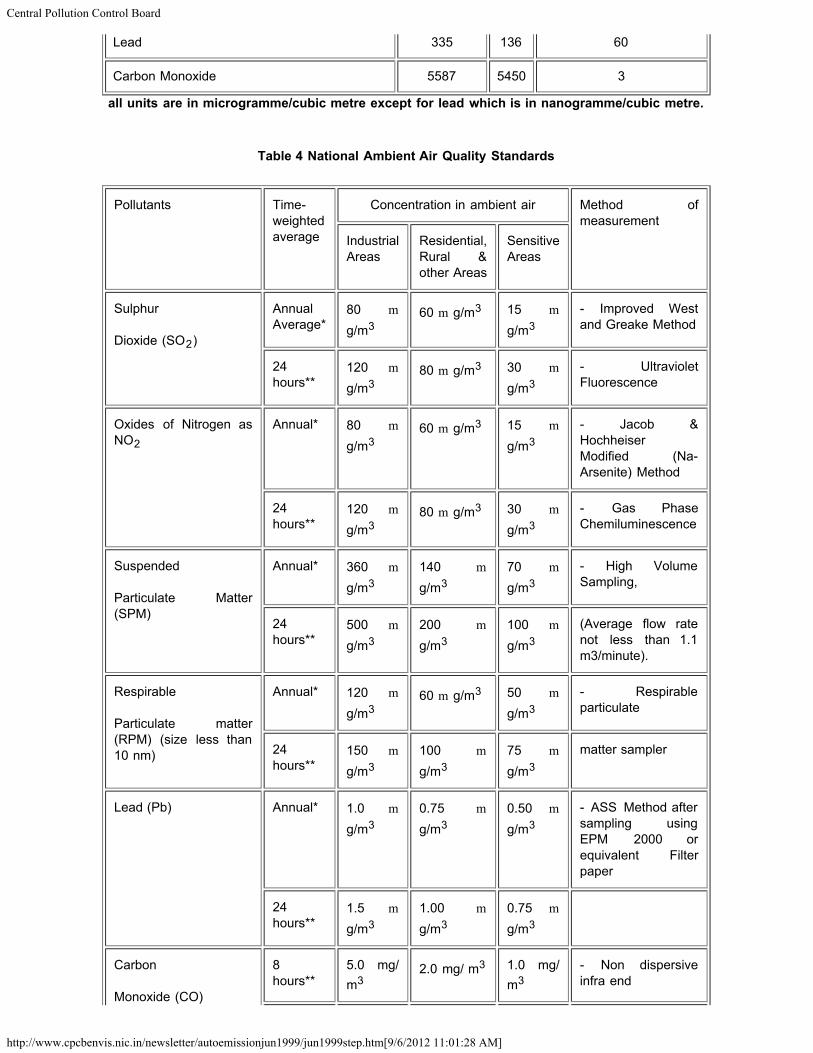
all units are in microgramme/cubic metre except for lead which is in nanogramme/cubic metre.
Table 4 National Ambient Air Quality Standards
Pollutants Time-weightedaverage
Concentration in ambient air Method ofmeasurement
IndustrialAreas
Residential,Rural &other Areas
SensitiveAreas
Sulphur
Dioxide (SO2)
AnnualAverage*
80 mg/m3
60 m g/m3 15 mg/m3
- Improved Westand Greake Method
24hours**
120 mg/m3
80 m g/m3 30 mg/m3
- UltravioletFluorescence
Oxides of Nitrogen asNO2
Annual* 80 mg/m3
60 m g/m3 15 mg/m3
- Jacob &HochheiserModified (Na-Arsenite) Method
24hours**
120 mg/m3
80 m g/m3 30 mg/m3
- Gas PhaseChemiluminescence
Suspended
Particulate Matter(SPM)
Annual* 360 mg/m3
140 mg/m3
70 mg/m3
- High VolumeSampling,
24hours**
500 mg/m3
200 mg/m3
100 mg/m3
(Average flow ratenot less than 1.1m3/minute).
Respirable
Particulate matter(RPM) (size less than10 nm)
Annual* 120 mg/m3
60 m g/m3 50 mg/m3
- Respirableparticulate
24hours**
150 mg/m3
100 mg/m3
75 mg/m3
matter sampler
Lead (Pb) Annual* 1.0 mg/m3
0.75 mg/m3
0.50 mg/m3
- ASS Method aftersampling usingEPM 2000 orequivalent Filterpaper
24hours**
1.5 mg/m3
1.00 mg/m3
0.75 mg/m3
Carbon
Monoxide (CO)
8hours**
5.0 mg/m3
2.0 mg/ m3 1.0 mg/m3
- Non dispersiveinfra end

Central Pollution Control Board
http://www.cpcbenvis.nic.in/newsletter/autoemissionjun1999/jun1999step.htm[9/6/2012 11:01:28 AM]
1 hour 10.0 mg/m3
4.0 mg/ m3 2.0 mg/m3
Spectroscopy
* Annual Arithmetic mean of minimum 104 measurements in a year taken twice a week 24 hourly at uniforminterval. ** 24 hourly/8 hourly values should be met 98% of the time in a year. However, 2% of the time, it mayexceed but not on two consecutive days.
NOTE:
1. National Ambient Air Quality Standard: The levels of air quality with an adequate margin of safety, to protect thepublic health,, vegetation and property. 2. Whenever and wherever two consecutive values exceeds the limit specifiedabove forthe respective category, it would be considered adequate reason to institute regular/continuous monitoring andfurther investigations.
Back to Content

Central Pollution Control Board
http://www.cpcbenvis.nic.in/newsletter/autoemissionjun1999/jun1999euro.htm[9/6/2012 11:01:30 AM]
EURO NORMS
European Union regulations on vehicle emission published as directives have the force of law within EU member statesunder the provisions of the treaty of Rome. In its early years the European Union of generally adopted regulations whichwere technically identified with ECE (Economic commission for European) equivalents. This position has changed overthe time with the European Union, gradually assuming a major role in formulating automotive emission standards.
Light duty vehicles (Passenger Cars) were the first to be regulated under the ECE Process and their limits have beensubsequently amended four times ECE-15, ECE-15/01, ECE 15/02, ECE 15/03, ECE 15/04 from 1970 to 1984. In 1988ECE adopted Directives ECE 83 (88/76/EEC) which amend Directives 70/220/EEC allows the certification of cars withan engine displacement above 1.4 litres on the basis of US procedure and limits. In practical terms this regulation was notimplemented by any European Country in anticipation of adoption by EU of the Consolidate Emission directive or Euro Inorms. In 1991 the council of Ministry of European Community adopted the Consolidate Emission Direction91/441/EEC or Euro I norms. According to the Directive Exhaust emission standard have to be on the basis of newcombined ECE - 15 (urban) cycle and EUDC Extra urban test cycle. In contrast to pervious directives a common set ofgaseous emission standard will apply to all private passenger cars irrespective of engine capacity. Subsequent in Dec. 93the Environmental Council agreed more stringent limit for 1996 onwards and these were adopted as Directives 94/12/ECon Euro II norms in March 1994. Compared with Euro I norms separate limits are given for gasoline and diesel fuelvehicles. These represent respective reduction of 30% CO, 55% HC+NOx for gasoline cars and 68% CO, 38% HC+NOxand 55% particulate emission for diesel vehicles. Contrary to the earlier standard, production vehicle must comply withthe type approval limits. Based on Auto Oil study Euro III and Euro IV norms has been adopted which will beimplemented year 2000 and 2005. The comparative table of EURO I, II, III, IV along with Indian norms is given in table5, 6, 7, & 8. India introduced emission norms for vehicle for the first time in 1991. Indian norms are behind Euro normsby 8 years although effort is being made to narrow the gap between Euro standard and Indian emission norms.
Back to Content

Central Pollution Control Board
http://www.cpcbenvis.nic.in/newsletter/autoemissionjun1999/jun1999toward.htm[9/6/2012 11:01:31 AM]
TOWARDS INTEGRATED APPROACH
Containment of vehicular pollution requires an integrated approach, the essential components of which include thefollowing :
i. Improvement of public transport system (e.g. urban buses)
ii. Optimisation of traffic flow and improvement in traffic management (e.g. area traffic control system, no-trafficzone, green corridors, removal of encroachment on roads, regulation of construction activities and digging ofroads).
iii. Comprehensive inspection and certification system for on-road vehicles.iv. Phasing out of grossly polluting vehicles.
v. Fuel quality improvement (e.g. benzene and aromatics in petrol, reformulated gasoline with oxygenates/additives,reduction of sulphur in diesel).
vi. Tightening of emission norms (e.g. EURO-IV by 2005)
vii. Improvement in vehicle technology (e.g. restriction on the 2 stroke engines, emission warranty, on-board diagnosticsystem).
viii. Checking adulteration of fuel.ix. Checking evaporative emissions from storage tanks and fuel distribution system.
Improvement of Public Transport System
According to an estimate made by RITES, a modal split of 70-75% infavour of public transport needs to be planned forthe city of Delhi. Presently, the modal share of public transport (Bus) is 62 percent. Along with the increase in number ofbuses, the passenger capacity should also be increased and the engines should conform to urban design. The existingcircular ring railway network also requires to be improved. These measures will meet the immediate requirements sincethe mass rapid transport system (MRTS) will take some years to materialise.
Traffic Management System
Well planned Traffic management system results in better mobility level on road by providing higher journey speeds andreduced delay at intersection thereby bringing significant reduction in fuel consumption and emission. Automatic trafficcontrol, signal optimisation, tidal flow and removal of encroachments are among the important components of trafficmanagement system. This will reduce the congestion and consequently pollution. Frequent digging of roads andconstruction work also leads to congestion and pollution, which can be minimised through proper coordination withtraffic police.
Comprehensive Inspection and Certification System
It is a system to reduce the pollution by requiring regular inspection and maintenance of motor vehicles already plying on

Central Pollution Control Board
http://www.cpcbenvis.nic.in/newsletter/autoemissionjun1999/jun1999toward.htm[9/6/2012 11:01:31 AM]
roads. It identifies those in-use vehicles that need maintenance and repair because they pollute more than the newvehicles. The system helps in reducing the air pollution. Such system is widely used in other countries and it has beenpossible to reduce about 30-40% of pollution loads by proper inspection and maintenance of vehicles. Such facilities forthorough inspection and maintenance of vehicles are required in different parts of the country.
Phasing Out of Grossly Polluted Vehicles
Pre-1990 vehicles emit more than ten times pollutants than the vehicles meeting Euro I norms (India 2000 norms). InDelhi, more than 15 year old commercial vehicles are not allowed to ply on roads. Similarly, de-registration of all oldervehicles should be made effective so that the grossly polluting vehicles are phased out.
Fuel Quality Improvement
Benzene and aromatics in petrol
Due to high level of benzene in atmosphere, benzene content of gasoline needs to be reduced to 1% (v/v) or lower as inother countries. With the reduction of benzene in gasoline (<1%) it is possible to achieve significant reduction in benzeneemission from exhaust. Benzene and PAH emission also depend upon the aromatic content of gasoline. Therefore, inaddition to reduction of benzene, it is also necessary to reduce the aromatic content in petrol.
REDUCING BENZENE CONTENT IN MOTOR GASOLINE
Benzene is a proven carcinogen. The most significant health effects from a short or longterm exposure to benzene are haemotoxicity, immunotoxicity, neurotoxicity andcarcinogenicity.
Benzene in the crude oil is present at levels upto 4 g/l. Its concentration varies from onesource to another. In India, Benzene content in motor gasoline varies from 3-5% byweight.
Although Benzene is also emitted from industrial activity, about 80 to 85% of benzene inatmosphere comes from automobiles. In heavy traffic area, upto 40 to 50 ug/m3 ofBenzene in the ambient air has been observed.
About 80-90% of the Benzene from automobile sector is emitted from the exhaust. About10-20% are from evaporation while 3-6% are from transportation, delivery anddistribution at petrol stations. Most part of benzene in gasoline is oxidised duringcombustion while some part are emitted through exhaust. Some portion of benzene isformed from the other aromatics by process of dealkylation during combustion. On anEuropean vehicle fuelled with gasoline containing 3% by wt of benzene and 30% by wt ofother aromatics, it has been found that 44% of the benzene survived combustion and 56%was created during combustion from other aromatics.
Average benzene emission of 32 mg/km out of 1130 mg/km of HC has been measured onAmerican automobiles equipped with catalytic converter in FTP cycle. Europeanautomobiles without catalytic converter emit about 270 mg/km of benzene in ECE cycle.
Benzene exhaust emission ( B.E.E.) can be estimated by following equation,
BEE mg/km = [1.884 + (0.949 x % Benzene) x 0.113 + (% aromatics - % of Benzene)] x1.609

Central Pollution Control Board
http://www.cpcbenvis.nic.in/newsletter/autoemissionjun1999/jun1999toward.htm[9/6/2012 11:01:31 AM]
By this equation, it can be estimated that if benzene control is reduced from 5% to 3%there will be 35% reduction in the exhaust emission of Benzene.
In USA, Europe and Japan, benzene content in motor gasoline has been reduced to 1%. InIndia, the benzene content of 5% has been prescribed which will be reduced to 3% fromyear 2000.
Sulphur Content in Diesel
Sulphur in diesel has direct effect on SO2 and particulate emission and indirectly on other pollutants due to its poisoningeffect on catalytic converter. In European countries, sulphur content in diesel has been reduced to 0.05% from 1996 andit will be further reduced to 0.005 from the year 2000.
Reformulated gasoline
Reformulated gasoline with the use of oxygenates and additives etc. help reducing pollution load from on-road vehicles.According to a study commissioned by CPCB, 3-5% ethanol can be used in petrol without affecting the engineperformance and with the attendent benefits in terms of emission control.
Tightening of emission norms
The emission norms effective from 2005 need to be further tightened to offset the increase of pollution load due toexponential growth of vehicles. It is time to bridge the gap between Euro norms and Indian norms. Euro IV norms forpetrol vehicles and diesel passenger cars and Euro III norms for heavy diesel vehicles may be a preferred target for 2005.
Improvement in Vehicles
In India, majority of vehicles is of two stroke engines. Although the two stroke engine technology for 2 or 3 - wheelershas been upgraded to some extent there is not much improvement in control of hydrocarbons and particulate (due tocombustion of lube oil). Hence, it is necessary to consider as to whether 2-stroke technology should be replaced by 4-stroke technology for reducing the emission specially in terms of hydrocarbons and particulate matter apart fromincreased fuel efficiency in 4-stroke engines.
On Board Diagnostic System
The On Board Diagnostic System (OBD) electronically records the fault and their causes in combination with variousDiagnostic Strategies to enable vehicle owner / driver to take corrective action. This is one of the requirements ofemission regulation in USA and it will be followed in Europe from year 2000 which will be a part of Euro III norm for2000.
Checking Fuel Adulteration
Adulteration of fuel plays a major role in emission of pollutants from on roads vehicles. Effective measures are requiredto prevent adulteration of fuel.
Evaporative Emission Control
To minimise evaporation losses of fuel and consequent pollution, adequate preventive steps need to be taken duringstorage, loading, unloading and distribution. Vapour recovery system in the filling stations is yet another importantmeasure for reducing evaporative losses.
Table 5 Indian and EURO Norms for Petrol Driven Passenger Cars

Central Pollution Control Board
http://www.cpcbenvis.nic.in/newsletter/autoemissionjun1999/jun1999toward.htm[9/6/2012 11:01:31 AM]
1991/92 1996 19981 1996 2000 2005
INDIA EURO-I
INDIA INDIA EURO-II
INDIA EURO-III2
EURO-IV2
CO g/km 14.3-27.1
2.72 8.68-12.4
4.34-6.20
2.2 2.72 2.3 1.0
HC g/km 2.0-2.9
- - - - 0.20 0.1
NOxg/km
- - - - - 0.15 0.08
HC+NOxg/km
- 0.97 3.4-4.36
1.5-2.18
0.57 0.97
Note : 1. Norms for Passenger Cars fitted with catalytic converter only
2. In case of Euro III & Euro IV COP = type approved norms Table 6 Indian and EURO norms for Diesel driven Passenger cars
1991/1992 1996 2000
INDIA EURO-I INDIA EURO-II
INDIA EURO-III
CO g/km 14.0(g/KWH)
2.72 5.0 -9.0
1.00 2.72-6.90 0.6
HC g/km 3.5(g/KWH)
-
NOxg/km
18.0(g/KWH)
HC+NOxg/km
- 0.97(IDI)1.36(DI)
2.0-4.0 0.7 0.97 - 1.70 0.56
PM g/km - 0.14(IDI)0.19(DI)
0.08 0.14-0.25 0.05
Note:
In case of EURO II and EURO III type approved norms = COP norms.In India there is also option for testing with engine dynamometer (in g/KWH) as given in Table 3 as these come under DieselLight duty vehicles GVW<3.5 tons.In European norms Passenger Cars refers to Passenger Cars with seating capacity less than 6 and GVW less than 2.5 tons.

Central Pollution Control Board
http://www.cpcbenvis.nic.in/newsletter/autoemissionjun1999/jun1999toward.htm[9/6/2012 11:01:31 AM]
Table 7 Indian and EURO norms for Diesel Light duty Vehicles < 3.5 tonnes
1991/1992 1996 2000
INDIA EURO-I INDIA EURO-II INDIA
CO 14.0g/KWH
2.72-6.902
g/km
11.21 g/km or 50-9.03 g/km
1.0 to 1.52
g/km
4.51 g/KWH or 2.75-6.903
g/km
HC 3.51
g/KWH- 2.41 g/KWH
or HC+NOxnorms
- 1.11 g/KWH or HC+NOx Norms
NOx
HC+NOx
18g/KWH
-
-
0.97-1.72
(g/km)
14.41 g/KWH
or
2.0 to 4.03
g/km
-
0.7 - 1.32
8.01g/KWH
or
0.97-1.703 g/km
PM - 0.14-.7
(g/km)
- - 0.61 KWH
or
0.14 - 0.25 g/km3
1 = 13 mode cycle
2 = EDC + EUDC
3 = Indian Driving Cycle
Table 8 Indian and EURO norms for Diesel Vehicles > 3.5 tonnes
1991/92 1996 2000
INDIA EURO-I
INDIA EURO-II INDIA EURO-III
CO g/KWH 14.0 4.5 11.2 4.00 4.5 2.1
HC g/KWH 3.5 1.10 2.4 1.10 1.10 0.66
NOx g/KWH 18.0 8.00 14.4 7.00 8.00 5.0
PM>85 g/KWH - 0.36 - 0.15 0.36 0.1
PM<85 g/KWH - 0.61 - 0.15 0.61 0.1
Table 9 Status of Implementation of Priority Measures
S. No. Measures Time Target ConcernedAgency
Status

Central Pollution Control Board
http://www.cpcbenvis.nic.in/newsletter/autoemissionjun1999/jun1999toward.htm[9/6/2012 11:01:31 AM]
1. Complete removal ofleaded petrol in NCTDelhi
01.09.1998 Ministry ofPetroleum &Natural Gas
Done
2. Phasing out of 15 yearsold commercial vehicles
31.12.1998 TransportDepartment,Govt. of NCT-Delhi.
Done
3. Installation of pre-mixed2T oil dispensers inpetrol filling stations.
31.12.1998 Ministry ofPetroleum &Natural Gas
Done
4. Expansion of CNGSupply Network (from 9to 80 stations)
31.03.2000 Gas Authority ofIndia Limited
Pending issuesrelating toallotment ofland for theCNG stationshas beensorted outthroughintervention ofthe Authoritywith theconcernedland owningagencies.
5. Setting up of twoindependent fuel testinglaboratories for checkingthe quality of the fuel.
01.06.1999 Ministry ofPetroleum &Natural Gas andAssociation ofIndianAutomobileManufacturers(AIAM)
One laboratoryis being set upat NOIDA andthe other willbe at Gurgaon.
6. Replacement of all pre-1990 autos and taxiswith new vehicles usingclean fuel
31.03.2000 TransportDepartment,Govt. of NCT-Delhi.
Action due.
7. No 8 years old bus is toply except on CNG orother clean fuel.
01.04.2000 TransportDepartment,Govt. of NCT-Delhi.
Action due.Work plan notreceived.
8. All buses to switch overto CNG instead of diesel
31.03.2001 TransportDepartment,Govt. of NCT-Delhi.
Action due.
9. The bus fleet to beaugmented to 10,000
01.04.2001 TransportDepartment,Govt. of NCT-Delhi
Action due.
10. New ISBTs to be set up 31.03.2000 Transport Action due.

Central Pollution Control Board
http://www.cpcbenvis.nic.in/newsletter/autoemissionjun1999/jun1999toward.htm[9/6/2012 11:01:31 AM]
at entry points in northand south-west to avoidcongestion and pollutiondue to entry of inter-state buses.
Department,Govt. of NCT-Delhi.
11. Automated inspectionand certification facilitiesto be set up forcommercial vehicles inthe first phase.
31.03.2000 TransportDepartment,Govt. of NCT-Delhi.
Action due. Asof now, onlyone station isin operation.
12. Augmentation of airquality monitoringnetwork.
31.03.2000 Central PollutionControl Board,Ministry ofEnvironment &Forests andDelhi PollutionControlCommittee,Govt. of NCT-Delhi.
CPCB hasprepared acomprehensiveproposal.DPCC hasbeen asked toset upmonitoringfacilities inaddition to themonitoringstations set upby CPCB.Besides thecriteriapollutants,facilities formonitoring ofadditionalparameterslike benzene,RSPM, Polyaromatics andOzone havebeen set up byCPCB.
DRIVING CYCLE
The method of measuring exhaust emission rates from motor vehicles is determined by statutory test procedure,the objective being to establish the mass of each exhaust component emitted during the test. The mass iscomputed from the measured concentration of each pollutant in the known exhaust gas volume. Exhaust speciesare generated when the vehicle is operated on a chasis dynamometer according to certain driving cycle whichare designated to simulate driving condition in urban traffic. To be able to check the application of theregulation in measurement conditions that are reproducible as possible it is necessary to adopt these testprocedures. The Indian driving cycle has been developed by IIP, Dehradun and ARAI Pune.
Different countries used different test cycles. A comparision of different test cycle for passenger cars is given inTable 10. So far unfortunately the countries have not been unanimous in adopting universally applicableprocedures and several types of test cycles are in use, for which no correlation exists for converting from one toanother.
In Europe, Extra urban cycle (EUDC) was introduced under pressure from Netherland which showed that over70% of European mileage was driven at more than 70 km/hr, conditions that lead to 40% of HC emission and80% of NOx emission.

Central Pollution Control Board
http://www.cpcbenvis.nic.in/newsletter/autoemissionjun1999/jun1999toward.htm[9/6/2012 11:01:31 AM]
Table 10 Comparision of Different Driving Cycles for Passengers Cars
Parmeters Units ECE-15cycle
ECE-15+EUDCcycle
FTP – 75cycle
Japan11modecycle
Japan10.15mode
Indiandrivingcycle(IDC)
Total time Seconds 780 1220 2477 120 660 648
Distance covered Km 4.052 11.007 17.87 1.021 4.16 3.948
Average Speed Km/hr 18.7 33.6 34.1 30.6 22.7 21.93
Max. Speed Km/hr 50 120 91.2 60 70 42
Idling % time 35.4 31 17.3 21.7 31.4 14.81
Acceleration % time 21.6 33.7 34.2 38.89
Constant Speed % time 29.3 20.5 13.3 12.04
Deceleration % time 13.8 26.5 30.8 34.26
Implementation incountries
Earlier byEECCountries,Malasiya
Most ofEECcountries
USA,California,Canada,Australia,Norway,Sweden,Brazil, S.Koria
EarlierbyJapan
Japan India
* Modified Indian Driving cycle is similar to ECE-15+EUDC expect the maximum speed is restricted to 90 km/hr.
Back to Content

ENVIS Centre, CPCB,Delhi, India
http://www.cpcbenvis.nic.in/newsletter/news.htm[9/6/2012 11:01:32 AM]
About Envis
Air Pollution
Water Pollution
Noise Pollution
Publications
News Letters
Annual Report
Highlights
News
Team
Home
News Letters
Water Quality Management in IndiaBio-mapping of Rivers - Case study Assam State - August-2005Sewage Pollution -February 2005Dioxin(PCDDs) And Furan(PCDFs) -December 2004Solid Waste Management in Slaughter House -September 2004Polycyclic Aromatic Hydrocarbons (PAHs) In Air And Their Effects On Human Health -November 2003Bio-monitoring of wetlands in wildlife habitats of India Part - I Bird Sanctuaries - July 2003Transport Fuel Adulteration - July 2003
Groundwater - July 2003R&D for Pollution Control CPCB Initiatives - June 2003
Inspection/Maintenance & Certification System for In-use Vehicles - May 2003
Alternative Transport Fuels An Overview-April 2003Odour Pollution and its Control - January 2003
Public Interest Litigations - December 2002
Climate Change - October 2002
Biodiesel As Automobile Fuel - September 2002
Benzene in Air and its Effect on Human Health - February 2002Air Pollution And Human Health-September 2001
Polychlorinated Biphenyls (PCBs) - December 2001
Environmental Management Plan Kanpur Urban Area- May 2001
Bio-Monitoring of Water Quality in Problem Areas - April 2001
Environmental Management System- February 2001
Common Effluent Treatment Plants - November 2000
Polluting Industries
Clean Coal Initiatives - June 2000
Bio-Mapping Of Rivers - March 1999
Auto Emissions - June 1999
Technologies for Pollution Control Industry - October 1999
Hazardous Waste Management - June 1998
Plastic Waste Management - September 1998
Municipal Solid Wastes - June 1997
Click here for LATEST Newsletters

ENVIS Centre, CPCB,Delhi, India
http://www.cpcbenvis.nic.in/newsletter/news.htm[9/6/2012 11:01:32 AM]
Cleaner Production Options for Pulp & Paper Industry - Sept 1997
Zoning Atlas For Siting Industries - June 1996
Bio-Monitoring of Water - September, 1995
Assessment and Development Study of River Basin - March 1995
Depletion of Ozone Layer and Its Implications - September 1994
Agro - based Industries - December 1994