A CRN SIMULATION FOR EMISSION.pdf
15
1 A CRN SIMULATION FOR EMISSION POLLUTANTS PREDICTION IN LEAN PREMIXED GAS TURBINE COMBUSTOR Nguyen Thanh Hao 1 , Nguyen Thanh Nam 1 , Jungkyu Park 2 1 Dcselab, HoChiMinh University of Technology, Vietnam, Tel: 84-8-919034504, Email: [email protected] 2 Department of Mechanical Engineering, Konkuk University, Korea, Tel: 82-1091634628, Email: [email protected] Abstract This study presents the use of a new CRN (Chemical Reactor Network) model and non-uniform injectors to predict the emission pollutant in the lean premixed gas turbine combustor. The CRN uses the information from the CFD (Computational Fluid Dynamics) combustion analysis with two injectors of CH 4 -air mixture. The experiment and the modeling focus on the output of the turbine combustor and the optimized fuel load. The injectors of CH 4 -air mixture have different lean equivalence ratio, and they control the fuel flow to stabilize the combustion and adjust the combustor’s equivalence ratio. The non-uniform injector is applied to improve the burning process of the turbine combustor. The results of the new CRN emission predictions for the gas turbine combustor show very good agreement with the experimental data from Korea Electric Power Research Institute. The new CRN model is a valuable tool in the evaluation of the pollution formation and the performance of the turbine combustor systems. Keywords: Combustion, CFD, CRN, Lean premixed combustor, Non-uniformity. Introduction Control of pollutant emissions is a major factor in the design of modern combustion systems. The major pollutants produced in the combustion process are nitrogen oxides (NO and NO 2 ), carbon monoxide (CO) and sulphur oxides (SO 2 and SO 3 ). Nitrogen oxides (also called NOx) are one of the most toxic pollutants in the atmosphere and are well known as a destroyer of the stratospheric ozone and a precursor of the acid rain. In addition, the fuel price is high and the combustion efficiency is low, which are also greater emphasis. Simplified CRN models for NOx production rates in the lean-premixed combustion is prop osed by Nicol, D. G., Malte, P. C., and Steele, R. C. [1-2] . NOx formatio n in the lean premixed combustion of CH 4 in a high-pressure jet-stirred reactor is introduced by Bengtson, K. U. M., et al. [3]. Variables effecting NOx formation in the lean-premixed combustion is prop osed by Ste el , R. C. [ 4- 5] . The comb ustion of fuels that conta ins no nitrogen, but NOx is formed by three chemical mechanisms or routes that involve nitrogen from the air: Zeldovich mechanism, Fenimore mechanism, and N 2 O-intermediate mechanism. The chemical reactor network model is constructed to be a valuable tool in the evaluation of the pollution formation. The simple two- or three-idealized reactor scheme has been found useful in the modeling researched by Rutar, T. and Malte, P.C. [6]. The development of a four-idealized reactor scheme CH 4 oxidation-NO formation mechanism for the lean premixed gas turbine combustion was introduced by Nicol, D. G., et al. [7]. The CRN development based on the CFD solution of the combustor using eight-idealized reactor scheme was introduced by Novosselov [8]. In this study, based on the actual geometry of the turbine combustor DGT5 and depending on the load which was predicted, the new chemical reactor network model is constructed to predi ct NOx and CO emissio n pollu tants in the lean premix ed turbi ne combu stor. This
Transcript of A CRN SIMULATION FOR EMISSION.pdf

8/10/2019 A CRN SIMULATION FOR EMISSION.pdf
http://slidepdf.com/reader/full/a-crn-simulation-for-emissionpdf 1/15
1
A CRN SIMULATION FOR EMISSIONPOLLUTANTS PREDICTION IN LEAN PREMIXED
GAS TURBINE COMBUSTOR
Nguyen Thanh Hao 1, Nguyen Thanh Nam 1, Jungkyu Park 2
1 Dcselab, HoChiMinh University of Technology, Vietnam, Tel: 84-8-919034504,Email: [email protected]
2Department of Mechanical Engineering, Konkuk University, Korea, Tel: 82-1091634628,Email: [email protected]
AbstractThis study presents the use of a new CRN (Chemical Reactor Network) model and non-uniforminjectors to predict the emission pollutant in the lean premixed gas turbine combustor. The CRNuses the information from the CFD (Computational Fluid Dynamics) combustion analysis with twoinjectors of CH 4-air mixture. The experiment and the modeling focus on the output of the turbinecombustor and the optimized fuel load. The injectors of CH 4-air mixture have different leanequivalence ratio, and they control the fuel flow to stabilize the combustion and adjust thecombustor’s equivalence ratio. The non-uniform injector is applied to improve the burning processof the turbine combustor. The results of the new CRN emission predictions for the gas turbinecombustor show very good agreement with the experimental data from Korea Electric PowerResearch Institute. The new CRN model is a valuable tool in the evaluation of the pollutionformation and the performance of the turbine combustor systems.
Keywords: Combustion, CFD, CRN, Lean premixed combustor, Non-uniformity.
IntroductionControl of pollutant emissions is a major factor in the design of modern combustion systems.The major pollutants produced in the combustion process are nitrogen oxides (NO and NO 2),carbon monoxide (CO) and sulphur oxides (SO 2 and SO 3). Nitrogen oxides (also called NOx)are one of the most toxic pollutants in the atmosphere and are well known as a destroyer ofthe stratospheric ozone and a precursor of the acid rain. In addition, the fuel price is high andthe combustion efficiency is low, which are also greater emphasis.
Simplified CRN models for NOx production rates in the lean-premixed combustion is proposed by Nicol, D. G., Malte, P. C., and Steele, R. C. [1-2]. NOx formation in the lean premixed combustion of CH 4 in a high-pressure jet-stirred reactor is introduced by Bengtson,K. U. M., et al. [3]. Variables effecting NOx formation in the lean-premixed combustion is
proposed by Steel, R.C. [4-5]. The combustion of fuels that contains no nitrogen, but NOx isformed by three chemical mechanisms or routes that involve nitrogen from the air: Zeldovichmechanism, Fenimore mechanism, and N 2O-intermediate mechanism. The chemical reactornetwork model is constructed to be a valuable tool in the evaluation of the pollution formation.The simple two- or three-idealized reactor scheme has been found useful in the modelingresearched by Rutar, T. and Malte, P.C. [6]. The development of a four-idealized reactorscheme CH 4 oxidation-NO formation mechanism for the lean premixed gas turbinecombustion was introduced by Nicol, D. G., et al. [7]. The CRN development based on theCFD solution of the combustor using eight-idealized reactor scheme was introduced by
Novosselov [8].In this study, based on the actual geometry of the turbine combustor DGT5 and depending
on the load which was predicted, the new chemical reactor network model is constructed to predict NOx and CO emission pollutants in the lean premixed turbine combustor. This

8/10/2019 A CRN SIMULATION FOR EMISSION.pdf
http://slidepdf.com/reader/full/a-crn-simulation-for-emissionpdf 2/15

8/10/2019 A CRN SIMULATION FOR EMISSION.pdf
http://slidepdf.com/reader/full/a-crn-simulation-for-emissionpdf 3/15
3
where
j
iij x
uS P
∂∂= (3)
it h
i B
x
gP
∂
∂−= ρ
ρ σ
1
,
(4)
⎥⎥⎦
⎤
⎢⎢⎣
⎡
∂∂⎟⎟
⎠ ⎞
⎜⎜
⎝ ⎛ +
∂∂−−
∂∂′′−=
i
i
t i
i
j
i ji
t NL x
uk x
uP
x
uuuP
μ
ρ
μ
ρ
32
(5)
Cμ is the isotropic turbulent viscosity and given by the Prandtl-Kolmogorov relation
ε ρ μ μ
2k C t = (6)
The model constants are assigned the following standard values: C μ = 0.09, C ε1 = 1.44,Cε2 = 1.92, C ε3 = 1.44 for P B > 0 or C ε3 = 0 for other, C ε4 = −0.33, σk = 1.0 and σε = 1.22. The
air inlet velocity and the fuel inlet velocity of the different load (1.0N, 0.8N, 0.6N, idle) are based on the experimental conditions (Table 1). In the properties of Star-CCM window, thesestandard values are entered into each node for setting model parameters.
The simulation performed in the model of CH 4-air combustion is repeated using a three-step reaction of the following forms
CH 4 + 0.5O 2 → CO + 2H 2 (7)
CO + 0.5O 2 → CO 2 (8)
H2 + 0.5O 2 → H2O (9)
The Reactions (7) ÷ (9) themselves are defined by specifying the amounts (in kilomoles)
of the participating leading reactants, reactants and products. In the properties of Star-CCMwindow, these amounts are entered into each node for the stoichiometry coefficient.The combustion model is used to calculate the reaction state space, the concentrations of
the various species present in a chemical reaction, density, viscosity, and temperature. In thisstudy, a CH 4 combustion case is set up using the Presumed Probability Density Function(PPDF) reaction model for premixed flames. The model assumes adiabatic conditions and alocal instantaneous chemical equilibrium. In the PPDF model, a few parametric variables suchas the mean mixture fraction are tracked on the grid. The mean species concentrations,temperature and density are obtained as functions of mean parametric variables, after anaveraging process around a presumed probability distribution that is considered to representturbulent fluctuations. Under this assumption, if one defines a mixture fraction
pm
m
mmm
f +
= (10)
where m m is the total mass of all atoms originating from the main inlet at any spatial location,and m p is the total mass of all atoms originating from the pilot inlet, it can be seen that f is aconverted scalar. The equation for such a scalar is simple; f is transported by convection anddiffusion, and can accumulate locally, but there is no f production. Therefore:
( ) [ ] 0=∇−•∇+∂∂
f DUf f t f ρ ρ ρ (11)

8/10/2019 A CRN SIMULATION FOR EMISSION.pdf
http://slidepdf.com/reader/full/a-crn-simulation-for-emissionpdf 4/15
4
Figure 1. The experiment schematic measurement
The overall structure of the gas turbine combustor system (Figure 1) includes an aircompressor, an air heater, a compressed natural gas, a combustor, two gas turbine burners,and an exhaust processing unit. The control instrumentation consists of the ICCD cameraand the image processing controller, etc.
The experiment parameters are based on combustion conditions. The external temperatureis 298K, after passing through compressor, the temperature is 650K. The pressure and theother combustion parameters are based on the maximum load (1.0N load) and the minimumload (idle load).
In order to understand the effect of the injector CH 4-air mixing profile on the flame position and the emission levels, this study will calculate the profile of the non-uniforminjector. The mixture of fuel and air in both main injector and pilot injector are not the same.At the idle load, the overall equivalent ratio of the pilot injector is less than 0.7, and the loweroverall equivalent ratio is 0.166. The overall equivalent ratio of the main injector and the pilotinjector at 1.0N load is 0.422, at 0.8N load is 0.367, and at 0.6N load is 0.314. More detailedconditions are shown in Table 1.
The combustion chamber boundary is a cylindrical shape using the grid to reduce thecomputational time as shown in Figure 2. A two-dimensional grid consisting of 190,000 cellsis used. The modeling assumptions used in the numerical simulation are listed in Table 2. Inorder to adequately resolve the gradients that exist in the flame, the grid resolution is refinedin the pilot flame region and the boundary layer effect.

8/10/2019 A CRN SIMULATION FOR EMISSION.pdf
http://slidepdf.com/reader/full/a-crn-simulation-for-emissionpdf 5/15
5
Table 1. Experimental Conditions for Combustor
Description UnitNormal condition (T air = 15 0C)
1.0N 0.8N 0.6N Idle
Air flow rate into the flametubes kg/s 0.08697 0.08912 0.09144 0.09842
Combustion Air Nm 3/hr 266.93 275.56 284.83 317.37
Total pressure of air after thecompressor Mpa 0.1 0.1 0.1 0.1
Total hourly fuel consumption Slpm 174.85 155.76 136.62 77.89
Fuel consumption of the 1st fuelchannel (pilot) Slpm 68.8 77.88 82.5 77.89
Fuel consumption of the 2nd
fuel channel (main)Slpm 106.05 77.88 54.12 0
Overall equivalence ratio - 0.422 0.367 0.314 0.166
Table 2. Modeling Assumptions and Boundary Conditions for Combustor
Numerical domain Polyhedral 190,000 cells
Solver Reynolds Averaged Navier-Stokes
Turbulence model High Reynolds k- ε model
Wall condition Cyclic wall-30 0 adiabatic
Figure 2. Computation Grid for CFD Modeling of Gas Turbine Combustor
The combustor used in this study has the same shape and size of the gas turbinecombustor DGT-5 as shown in Figure 2. The experimental simulation of a simplified
practical and reliable combustor in order to pursue the practical and physical changes are atthe same shape and size, but we need to visualize the liner portions omitted except thecooling air and the dilution air. All parts were fabricated by the same simulation.
The results of the mass fraction of the gas turbine combustor at the entrance with theoverall equivalent ratio of 0.7 are shown in Figure 3. The formation of the NOx and COemissions in the combustor is determined by the post-processing CFD solutions of the flowfield. Figure 3 shows the CFD predicted flow patterns and the CRN flow splits of the flame.In the CFD modeling of the modeled combustor (section A-A), it has been found that avery small amount of gas from the main flame enters the dome recirculation zone. Thus,

8/10/2019 A CRN SIMULATION FOR EMISSION.pdf
http://slidepdf.com/reader/full/a-crn-simulation-for-emissionpdf 6/15
6
one percent (1%) of the main flame gas has been assigned to be recycled into the domerecirculation zone. This percentage can change when a different combustor setup is used.In the CFD modeling of the modeled combustor (section B-B), it has been found that ten
percent (10%) of the main pilot flame gas has been assigned to be recycled into the mainflame, ten percent (10%) of the main pilot flame gas has been assigned to be recycled into
the pilot recirculation zone. The fuel-air ratio of the pilot injector is assumed to be inuniform, there is no radial or circumferential variability in the fuel-air mixture. The main
pilot stream mixes with gas from the main recirculation zone and the pilot recirculationzone. The post flame zone needs to be split into two streams based on the CFD temperatureand the fuel-air equivalence ratio in the center post flame zone and the main post flamezone. In the CFD modeling of the modeled combustor, it has been found that thirty percent(30%) of the post flame gas has been assigned to be recycled into the main pilot. Thetypical backside cooled gas turbine combustor also has a dilution zone, where dilution airis introduced into the post flame zone to reduce the gas temperature prior to entering theturbine. The simple CRN does not have any secondary dilution addition, so the last PFRelement could be used for this purpose.
Section A-A
Section B-B
Figure 3. Velocity and Mass Fraction at the Injector Outlets

8/10/2019 A CRN SIMULATION FOR EMISSION.pdf
http://slidepdf.com/reader/full/a-crn-simulation-for-emissionpdf 7/15
7
(a) Flame Temperature Surface
(b) Ratio of unburned fuel in a premixed flame
(c) Mass Fraction of CO Surface
Figure 4. Temperature, Regress Variable and Mass Fraction Contours Plot from Star-CCMSoftware Showing the Presence of the different combustion zones
Temperature, regress variable and mass fraction contours plotted from the 2D CFDsimulation show the different combustion zones (Figure 4). A regress variable representsthe ratio of fuel that is unburned in a premixed flames, it has a value of 1.0 for an unburnedgas mixture and a value of 0.0 for a fully burned mixture.
The different combustion zones in Figure 5 includes the main flame zone, the mainrecirculation zone, the pilot inner zone, the pilot out post, the pilot median zone and the pilot

8/10/2019 A CRN SIMULATION FOR EMISSION.pdf
http://slidepdf.com/reader/full/a-crn-simulation-for-emissionpdf 8/15
8
recirculation zone. The highest temperature of the flame in the combustion chamber appearson the wall. In the non-uniform mass fraction inlet case, the temperature is up to 1903.5K.The development chemical reactor network modeling of the gas turbine combustor isconstructed based on the CFD-predicted flow patterns such as the flame temperature and thevolumetric zones (Figure 5), and the entrainment of the dome air and gas from the main
recirculation zone into the flame as show in Figure 3.
Figure 5. Flame Zone Mapping onto the CRN
CRN Model Configuration
CRN model is constructed in this study based on Figures 4 and 5. First of all, the recirculationzone consists of PSR which was a fully mixed assumption. According to the results of Figure5, the temperature of the flame was broken. Subdivision of the flame cross-section of theentrance in order to determine the flow information is used based on the results of Figure 3.
At the idle state, the overall equivalent ratio distribution is up to 0.9. More than 0.05 unitsfrom the overall equivalent ratio of 0.7 are divided into two entrances. The overall equivalentratio ranges from 0.6 to 0.7. One of areas is subdivided into the entrance, so the totalentrances are two. The number of the flame zones is also divided into eight zones. Theregions of the overall equivalent ratio of 0.7 or more are accounted approximately 20% of thetotal.
At the 0.6N load, 0.8N load, and 1.0N load state, when the overall equivalent ratiodistribution is 0.85, the equivalent ratio does not exist, and the flame zone is divided into eight
zones. The regions of the overall equivalent ratio of 0.7 of 0.6N load are accountedapproximately 12%. The 1.0N load is accounted approximately 9% of the total. The CRN model is separated because a non-equivalent portion of the pilot flame was
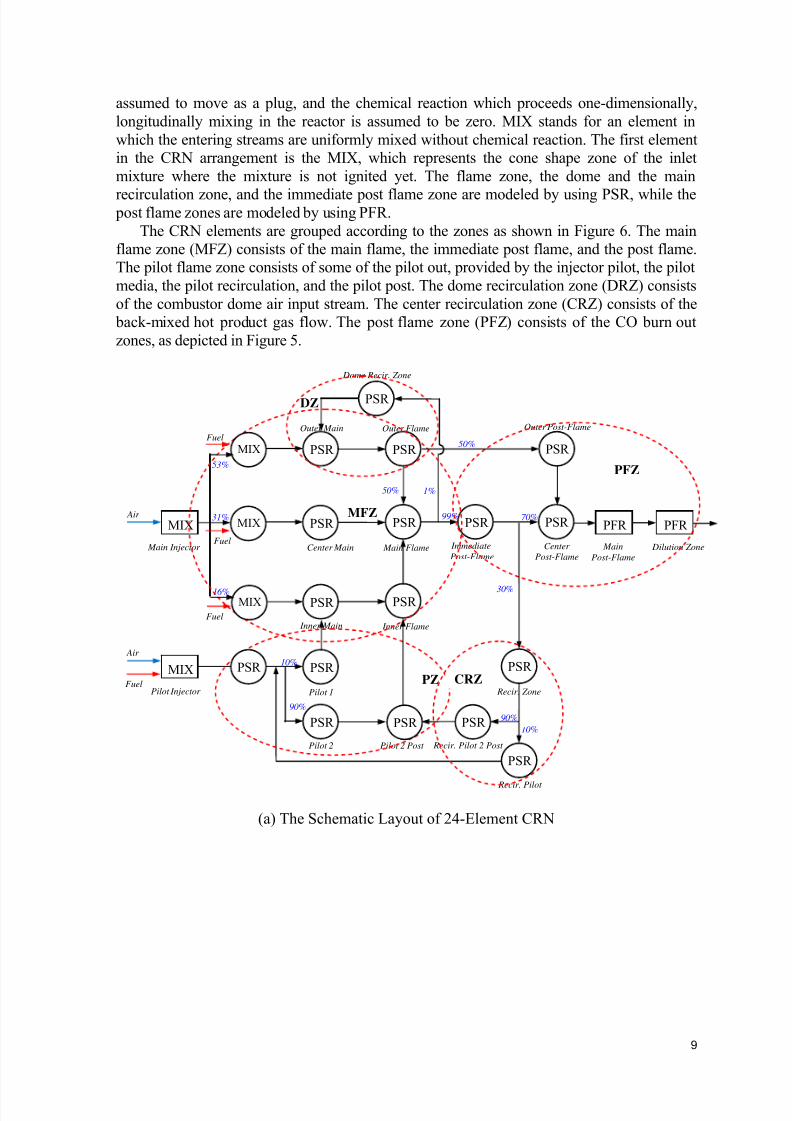
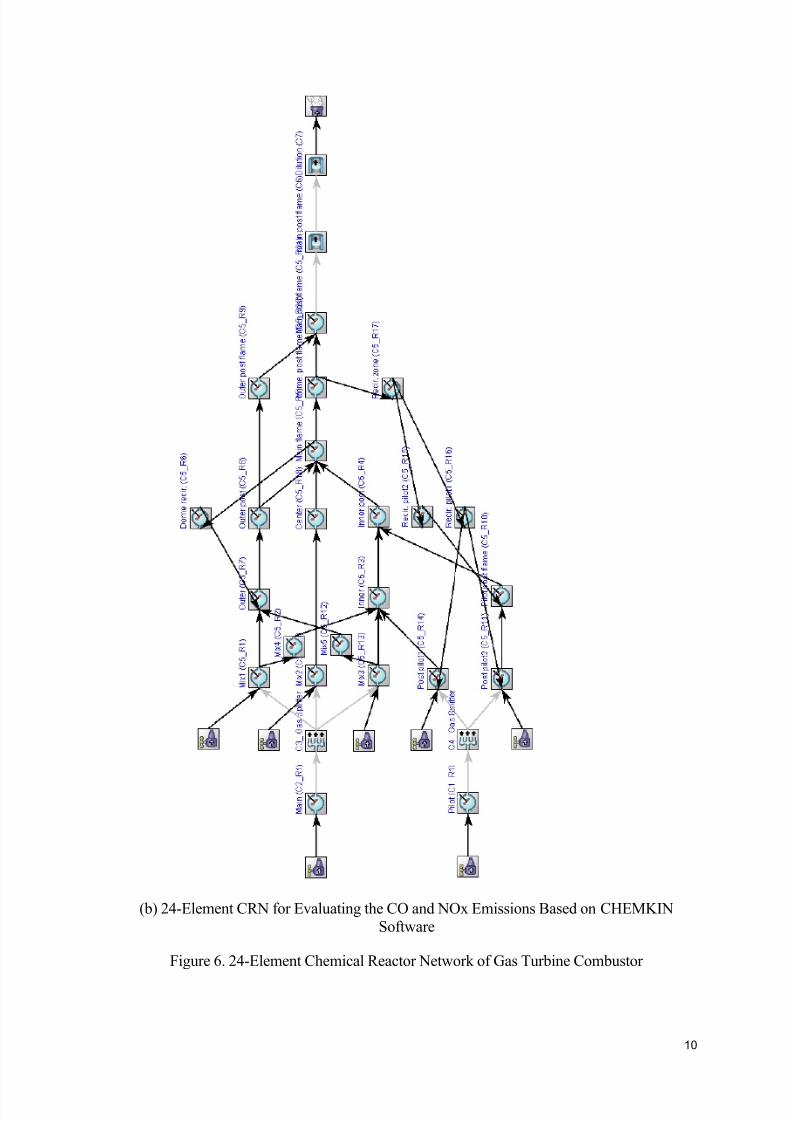
broken. The area consists of more than the overall equivalent ratio of 0.8 is the pilot out 2 tosimulate the flame on the wall. The area consists of more than the overall equivalent ratio of0.7 is the pilot out 1 to simulate the flame inside of the wall. The overall equivalent ratio lessthan 0.6 are accounted approximately a medium flame. The schematic layout of the 24-element CRN is constructed in this study which based on the CFD-predicted results as shownin Figure 6(a) and it is used to evaluate the CO and NOx emissions based on CHEMKINsoftware as shown in Figure 6(b).
PSR stands for a perfectly stirred reactor in which mixing to the molecular scale is
assumed to happen instantaneously compared to the chemical reaction. The combustionoccurs homogeneously in the reactor. PFR stands for a plug flow reactor in which the flow is
8/10/2019 A CRN SIMULATION FOR EMISSION.pdf
http://slidepdf.com/reader/full/a-crn-simulation-for-emissionpdf 9/15
9
assumed to move as a plug, and the chemical reaction which proceeds one-dimensionally,longitudinally mixing in the reactor is assumed to be zero. MIX stands for an element inwhich the entering streams are uniformly mixed without chemical reaction. The first elementin the CRN arrangement is the MIX, which represents the cone shape zone of the inletmixture where the mixture is not ignited yet. The flame zone, the dome and the main
recirculation zone, and the immediate post flame zone are modeled by using PSR, while the post flame zones are modeled by using PFR.
The CRN elements are grouped according to the zones as shown in Figure 6. The mainflame zone (MFZ) consists of the main flame, the immediate post flame, and the post flame.The pilot flame zone consists of some of the pilot out, provided by the injector pilot, the pilotmedia, the pilot recirculation, and the pilot post. The dome recirculation zone (DRZ) consistsof the combustor dome air input stream. The center recirculation zone (CRZ) consists of the
back-mixed hot product gas flow. The post flame zone (PFZ) consists of the CO burn outzones, as depicted in Figure 5.
(a) The Schematic Layout of 24-Element CRN
16%
31%
53%
50%
10%
90%
50%
99%
1%
70%
30%
10%90%
Fuel
Fuel
ImmediatePost-Flame
DZ
Dome Recir. Zone
MFZ
PZ
Inner Main
Outer Main
Recir. Pilot
Recir. Pilot 2 Post
Recir. Zone
Outer Post-Flame
Inner Flame
Center Main
Outer Flame
Pilot 2 PostPilot 2
Pilot 1
Main Flame CenterPost-Flame
MainPost-Flame
Dilution Zone
Air
Fuel
MIX
MIX
PSR
PSR
PSR
PSR
PSR
PSR
Main Injector
PSR PFR PFR
PSR
PSR
Pilot InjectorCRZ
PSR
PSR
PSR
Air
Fuel
PSR
PSR
PSR
PSR
PSR
PFZ
MIX
MIX
MIX
8/10/2019 A CRN SIMULATION FOR EMISSION.pdf
http://slidepdf.com/reader/full/a-crn-simulation-for-emissionpdf 10/15
10
(b) 24-Element CRN for Evaluating the CO and NOx Emissions Based on CHEMKINSoftware
Figure 6. 24-Element Chemical Reactor Network of Gas Turbine Combustor

8/10/2019 A CRN SIMULATION FOR EMISSION.pdf
http://slidepdf.com/reader/full/a-crn-simulation-for-emissionpdf 11/15
11
Results and Discussions
Figure 7. Non-uniformity Mole Fraction of NOx in Normal Condition
Figure 8. Non-uniformity Mole Fraction of NOx in Cold Condition

8/10/2019 A CRN SIMULATION FOR EMISSION.pdf
http://slidepdf.com/reader/full/a-crn-simulation-for-emissionpdf 12/15
12
Figure 9. Non-uniformity Mole Fraction of NOx in Hot Condition
Figure 10. Non-uniformity Mole Fraction of CO in Normal Condition

8/10/2019 A CRN SIMULATION FOR EMISSION.pdf
http://slidepdf.com/reader/full/a-crn-simulation-for-emissionpdf 13/15
13
Figure 11. Non-uniformity Mole Fraction of CO in Cold Condition
Figure 12. Non-uniformity Mole Fraction of CO in Hot Condition
The mole fraction of NOx in the normal condition is shown in Figure 7. The figure alsoshows the differences of each mole fraction of the NOx formation mechanism. The largestmole fraction of the NOx formation is at the idle load. The mole fraction of the NOxformation at the 0.6N load is lower than the idle load. Finally, the mole fraction of the NOxformation at the 0.8N load and the 1.0N load is equal to zero. At the 0.8N load and the 1.0Nload cases, the temperature in the flame is high enough to trigger the thermal NOx production(Figure 4), so the mole fraction of NOx is low. However, the mole fraction of NOx that is
exposed to this temperature is relatively small. Thus, the lowest mole fraction of the NOxformation is at the 0.8N load.

8/10/2019 A CRN SIMULATION FOR EMISSION.pdf
http://slidepdf.com/reader/full/a-crn-simulation-for-emissionpdf 14/15

8/10/2019 A CRN SIMULATION FOR EMISSION.pdf
http://slidepdf.com/reader/full/a-crn-simulation-for-emissionpdf 15/15