Steelwedge 2015 Agility Webinar Series: From Good to Great: The Business Case for Best-in-Class S&OP
27
1 © 2015 Steelwedge Software, Inc. Confidential. From Good to Great: The Business Case for Advanced S&OP Andrew McCall Vice President Customer Success
-
Upload
steelwedge-software -
Category
Technology
-
view
165 -
download
4
Transcript of Steelwedge 2015 Agility Webinar Series: From Good to Great: The Business Case for Best-in-Class S&OP

1 © 2015 Steelwedge Software, Inc. Confidential.
From Good to Great: The
Business Case for
Advanced S&OP
Andrew McCall
Vice President
Customer Success

2 © 2015 Steelwedge Software, Inc. Confidential.
Getting to Value?
• Business Value: The Size of the Prize
• The Roadmap: Getting there rapidly
• Measuring Success: Tangible Results
• Case Study: How to Bring this all together

3 © 2015 Steelwedge Software, Inc. Confidential.
Performance of Best-in-Class Companies
• 15% -25% higher average Customer Service Levels
• Three times lower Cash-to-Cash cycles
• 35% greater forecast accuracy at the product family level
• 30% of Best-in-Class companies have increased their inventory
turns in the last six months as compared to 10% of All Others.
• Sixty percent (60%) of Best-in-Class companies have increased
their perfect order percentage to customers versus 20% of All
Others.
Source: Aberdeen Group

4 © 2015 Steelwedge Software, Inc. Confidential.
Another View: The Benefits of S&OP
Source: Supply Chain Insights
Recent Survey Question to 180 Respondents – What benefits have you received from your improvement efforts surrounding S&OP?

5 © 2015 Steelwedge Software, Inc. Confidential.
Value Levers
50-70% Reduction
15-30% Improvement
20%-25% Reduction
25% Reduction in
Stock-outs
1-2% Lift in Revenue
Typical Results
Our View
6 © 2015 Steelwedge Software, Inc. Confidential.
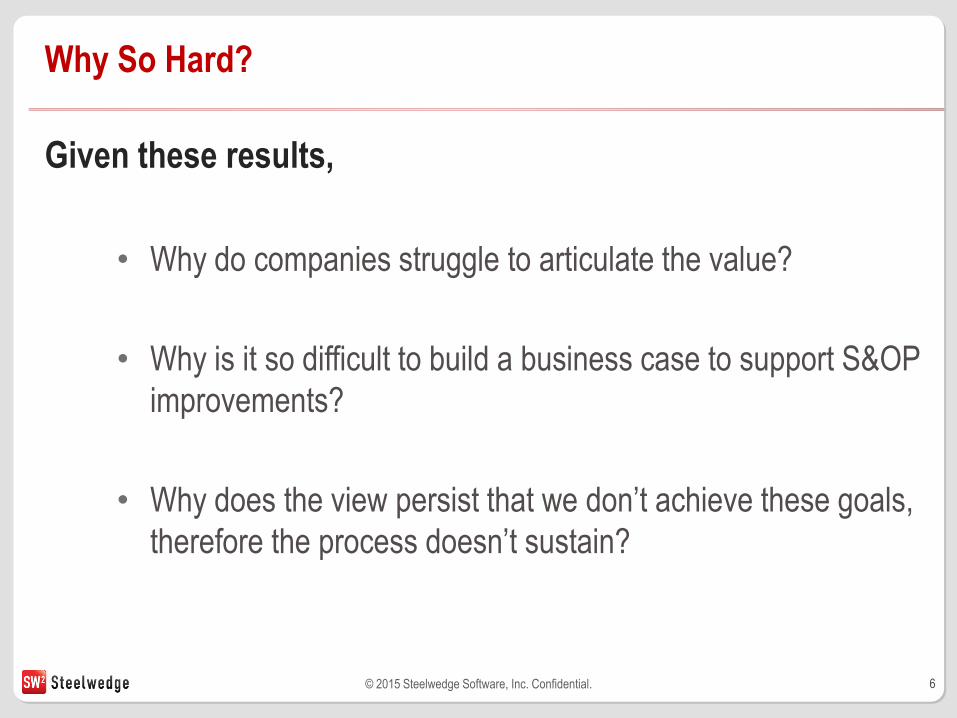
Why So Hard?
Given these results,
• Why do companies struggle to articulate the value?
• Why is it so difficult to build a business case to support S&OP
improvements?
• Why does the view persist that we don’t achieve these goals,
therefore the process doesn’t sustain?

7 © 2015 Steelwedge Software, Inc. Confidential.
Sustaining Value

8 © 2015 Steelwedge Software, Inc. Confidential.
A Question of Focus
• Process often starts in the supply chain, and gets focused on
Forecast Accuracy—not the results from a better forecast
• Competing Metrics—every project results in inventory reductions,
so we either double count, or don’t count at all
• Cross functional measures can be too difficult (fill rate/revenue lift
for instance) to attribute to one set of improvements
• Measures need to be more broad based

9 © 2015 Steelwedge Software, Inc. Confidential.
Balanced Score Card

10 © 2015 Steelwedge Software, Inc. Confidential.
Getting Specific About Value
S&OP, Metrics, Customer Experience, Inventory Op, Demand Planning, Strategic Sourcing
Why it is important
5 Value Questions
Growth
Profitability Efficiency Demand Planning Total Annual Conservative
Opportunity Estimate
Range
1. How do you
measure it?
$Revenue Gross Profit Asset Turnover Forecast
Accuracy
2. What is it today?
$7.1B (2013)
7.5% increase
based on $6.6B ’12
COGS $3.9B (2013)
45.9% Gross Margin
2.9% improvement
based on 43.0% in ‘12
Ratio 1.33
0.06 decreaseYOY
based on 1.39 in ‘12
Moves all the rest
(1% improvement
correlation 2%
improvement in Perfect
Order)
3. What would you
like it to be?
5% growth rate
assumption
2% target improvement
assumption
Target 1.43
5% Rev growth and 2%
asset optimization
assumption
4. Value of the
difference?
$357M $77M $107M (asset only) $541M
5. Value Over time ?
(3-5 years)
$1.0B – $1.7B
$3.9M-$7.7M $321M – $536M $1.6B - $2.7B
“Moving the needle”
just 5%-10% of the % above
Opportunity (% of a %)
$17.9M – $35.7M $2.1M-$6.5M $5.3M-$10.7M $___ X Factor ___
Multiplier for previous $27.0M – $54.2M
Annually
Opportunity monthly
(Cost of doing nothing each
month)
$1.4M – $3.0M $322K-$644K $446K-$893K $___ X Factor ___
Multiplier for previous
$2.3M - $4.5M
Monthly

11 © 2015 Steelwedge Software, Inc. Confidential.
Defining the Roadmap
Holistic End-State Vision
People, Process & Technology
Maturity Model
Defined evolution of capabilities
Value Releases
Anticipated Benefits at each stage
Executive Engagement
Development of a true “Management Operating System” for
Integrated Business Planning—not a silo process owned by a single domain

12 © 2015 Steelwedge Software, Inc. Confidential.
The Roadmap: Strategic Value Assessment
Overall Process Framework
Vision Assessment Road Map /
Maturity Model
Value & Measures
Theme: Training & Baseline
Data for Value
- Key S&OP Baseline
- Critical Success Factors
- Value Drivers
- Pain Points
- Follow Up/Clarification on Pre
Work & Data Requests
- Test Drive Planning
- Data Bin
Requirements
- Core Use Cases
- Value Driver & Pain
Point Examples
- Forecasting Validation
Data
Theme: Assessment
- Process Review for
- Demand
- Supply
- Pre-S&OP
- Executive S&OP
- Data Management
- Pipeline Management
- Master Data
- Landscape & Integration
- Financial Inputs to Value
Drivers
- Current Org Review
- R&R
- Process Ownership
Theme: Road Mapping
- End State Process Map
- What Does Good
Look Like?
- Key Components of End
State
- Industry Flavor
- Test Drive Linkage
- Implementation Strategy
- Process RACI
- Master Data Strategy
- Integration Strategy
- IT Landscape - Proposed
- Getting There
- Phasing
- Resources
- ROI Analysis (Cost/Benefit)
- Time To Benefit – Phasing
- Crawl, Walk, Run
- EVA & Linkage
- Key Enablers
Theme: Validation & Review
- Create SVA Roadmap
- Sponsor Walk Through
- Financial ROI Validation &
Acceptance
- Baseline
- Stretch Goals/ Upside
- SVA Output Document
- Executive Review
- Road Map Summary
- Test Drive
- Critical Success
Factors
- Business Case
Review
- Phased Actions
- 90 Day Play Book
- Mobilization
- Governance &
Budgeting
- Mid Term Planning
- Go Forward Decisions

13 © 2015 Steelwedge Software, Inc. Confidential.
Specific Vision
Assessment Maturity Model
Metrics & Results
Monitoring
Getting there

14 © 2015 Steelwedge Software, Inc. Confidential.
Measuring Success
• Define the right metrics
• Create a baseline that clearly outlines current state and
recent trend
• Establish targets
• Link desired improvements to the roadmap

15 © 2015 Steelwedge Software, Inc. Confidential.
Defining & Using Metrics
• Establish Strategic Goals
• Monitor Performance
• Measurable and quantifiable
• Linkage to responsibility
• Ensure metric is well-defined
1
5 * Source: Supply Chain Council
15

16 © 2015 Steelwedge Software, Inc. Confidential.
1
6
Attribute Strategy
Reliability (RL) Consistently getting the orders right, product meets
quality requirements
Responsiveness (RS) The consistent speed of providing products/services to
customers
Agility (AG) The ability to respond to changes in the market
(external influences)
Cost (CO) The cost associated with managing and operating the
supply chain
Assets (AM) The effectiveness in managing the supply chain’s
assets in support of fulfillment
Cu
sto
me
r In
tern
al
Performance Attributes*
16 * Source: Supply Chain Council
Question: What is/are the most important attributes to achieve your supply chain strategy?

17 © 2015 Steelwedge Software, Inc. Confidential.
Measuring Success
Create a baseline

18 © 2015 Steelwedge Software, Inc. Confidential.
Measuring Success
Receivables Net Sales Accounts Receivable (AR) Turns DSO
2013 $2,064,000,000 $232,270,000 8.886 41.075
2014 $1,783,000,000 $323,710,000 5.508 66.267
2015 $1,733,000,000 $483,030,000 3.588 101.735
Assumptions 105.0% 99.5%
(Projected) 2016 >> $1,819,650,000 $480,614,850 3.786 96.406
(Projected) 2016 >> Accounts Receivable (AR)
Improvement (%) 0.5%
Receivable Revenue $2,415,150
Inventory Turns Inventory Value COGS Turns DIO Inventory Increase
PY Inventory 2012 $146,520,000
2013 $122,280,000 $610,330,000 4.991 73.128 ($24,240,000)
2014 $152,720,000 $541,520,000 3.546 102.938 $30,440,000
2015 $163,880,000 $546,740,000 3.336 109.405 $11,160,000
Assumptions 99.5% 101.0%
(Projected) 2016 >> $163,060,600 $552,207,400 3.387 107.780
(Projected) 2016 >> Inventory Value COGS
Improvement (%) 0.5% 1.0%
Revenue $819,400 $5,467,400
Payables Inv Inc + COGS Accounts Payable (AP) Turns DPO
2013 $98,040,000 $52,150,000 0.532 686.186
2014 $183,160,000 $50,040,000 0.273 1335.999
2015 $175,040,000 $44,160,000 0.252 1446.775
Assumptions 100.0% 102.0%
(Projected) 2016 >> $175,040,000 $45,043,200 3.886 93.926
(Projected) 2016 >> COGS
Improvement (%) 2.0%
Payable Revenue $883,200
Cash Conversation Cycle DSO DIO DPO CCC
2015 101.735 109.405 1446.775 -1235.636
Opportunity 96.406 107.780 93.926 110.260
Improvement (%) Improvement ($)
Improve AR by: 0.5% $2,415,150
Improve Inventories by: 0.5% $819,400
Improve AP by: 2.0% $883,200
Improve COGS by: 1.0% $5,467,400
Total $9,585,150
Moving Needle 5.0% $479,258
Moving Needle 10.0% $958,515
Assumptions
Cash to Cash Cycle Data Input Tab

19 © 2015 Steelwedge Software, Inc. Confidential.
Measuring Success
5 Value Questions
Growth Profitability Efficiency Demand Planning Total Conservative
Opportunity Estimate
Range
1. How Do you Measure it? $ Rev Gross Profit Asset Turnover Forecast Accuracy
2. What is it Today? $ -0.05B (2015) -
2.8% Decrease
based on 1.79B
(2014)
COGS $1.19B
(2015) 68.5%
Gross Margin -
1.2% Decrease
based on 1.79B
(2014)
Ratio 0.29; -0.09
Deteriment YoY
based on 0.38 in
2015
3. What would like it to be? 5% Growth rate
assumption
2% Target
improvement
assumption
Target 5.89
Revenue growth 5%
and 2% asset
optimization
assumption
4. Value of the Difference $86.65M $10.94M $120.2M $217.79M
5. Value over time? $0.26B - $0.44B $32.81M - $54.68M $360.6M - $601M $0.66B - $1.09B
“Moving the needle” just
5%-10% of the % above
Opportunity (% of a %) $4.34M - $8.67M $0.55M - $1.1M $6.01M - $12.02M
$___ X Factor ___
Multiplier for previous $10.89M - $21.78M
Annually
Opportunity monthly
(Cost of doing nothing each
month) $0.37M - $0.73M $0.05M - $0.1M $0.51M - $1.01M
$___ X Factor ___
Multiplier for previous $0.91M - $1.82M
Monthly
IBP, S&OP, Sales Planning, Metrics, Customer Experience, Inventory Op, Demand Planning, Strategic Sourcing

20 © 2015 Steelwedge Software, Inc. Confidential.
Real Global Case Study: Prior Solution Status
Collaboration
Financial
Scenario
Management
Single Source
of Truth
Tedious mechanisms
to support financial
alignment and
executive reporting
Lack of Systemic
Flows and Analytics
lead to extensive
manual processes
Silo’d applications
Inability to process
and analyze daily
Point of Sale data
Manual, batch
oriented
communication
Retailers
EDI
Account
Manager
Sales
Manager
PoS Data
Finance
Manager Analysts
EXCEL
Forecast
Home
Grown
Applications
Executive
EXCEL
Disparate home grown systems and Excel files.
Lack of responsiveness, inaccurate data , inconsistencies

21 © 2015 Steelwedge Software, Inc. Confidential.
Measuring Success
• Define the right metrics
• Create a baseline that clearly outlines current state and
recent trend
• Establish targets
• Link desired improvements to the roadmap
22 © 2015 Steelwedge Software, Inc. Confidential.
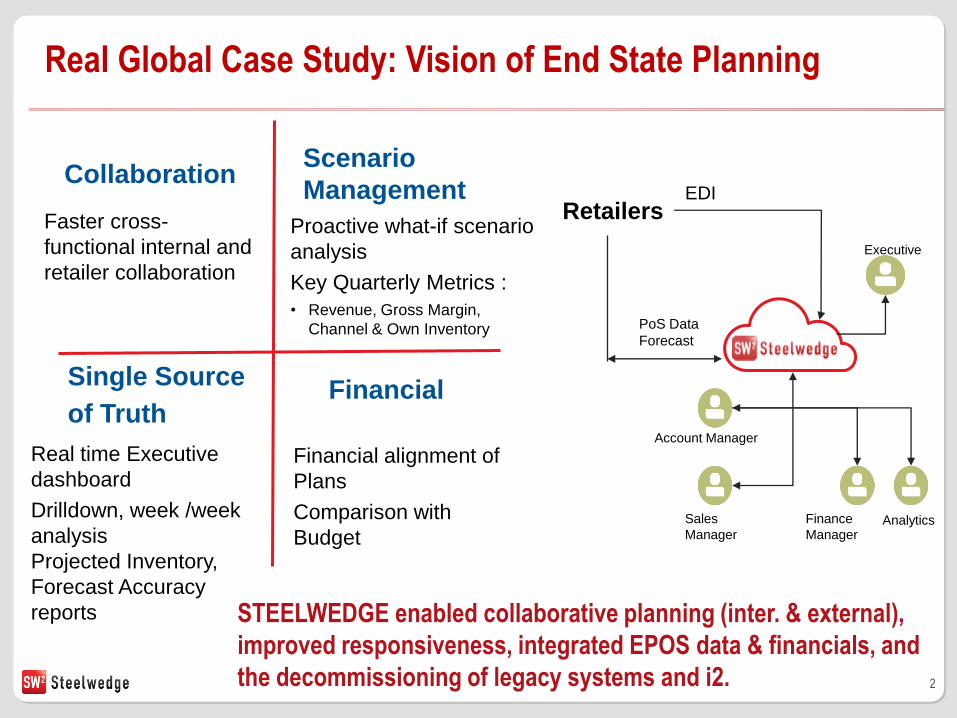
Real Global Case Study: Vision of End State Planning
Collaboration
Financial
Scenario
Management
Single Source
of Truth
Financial alignment of
Plans
Comparison with
Budget
Proactive what-if scenario
analysis
Key Quarterly Metrics :
• Revenue, Gross Margin,
Channel & Own Inventory
Faster cross-
functional internal and
retailer collaboration
STEELWEDGE enabled collaborative planning (inter. & external),
improved responsiveness, integrated EPOS data & financials, and
the decommissioning of legacy systems and i2.
Real time Executive
dashboard
Drilldown, week /week
analysis
Projected Inventory,
Forecast Accuracy
reports
EDI
Account Manager
Sales
Manager
PoS Data
Forecast
Finance
Manager Analytics
Executive
Retailers

23 © 2015 Steelwedge Software, Inc. Confidential.
Stage 1
Collaborative Demand Planning
Stage 2
Sales & Operations Planning
Stage 3
Decision Data Visibility
Stage 4
Demand Intelligence
Stage 5
Predictive and Prescriptive Analytics
Cloud Systemic Single Source Mobility Big Data
Statistics
Algorithms
What-if
Math
Real Global Case Study: Maturity Model
RETAILERS
24 © 2015 Steelwedge Software, Inc. Confidential.
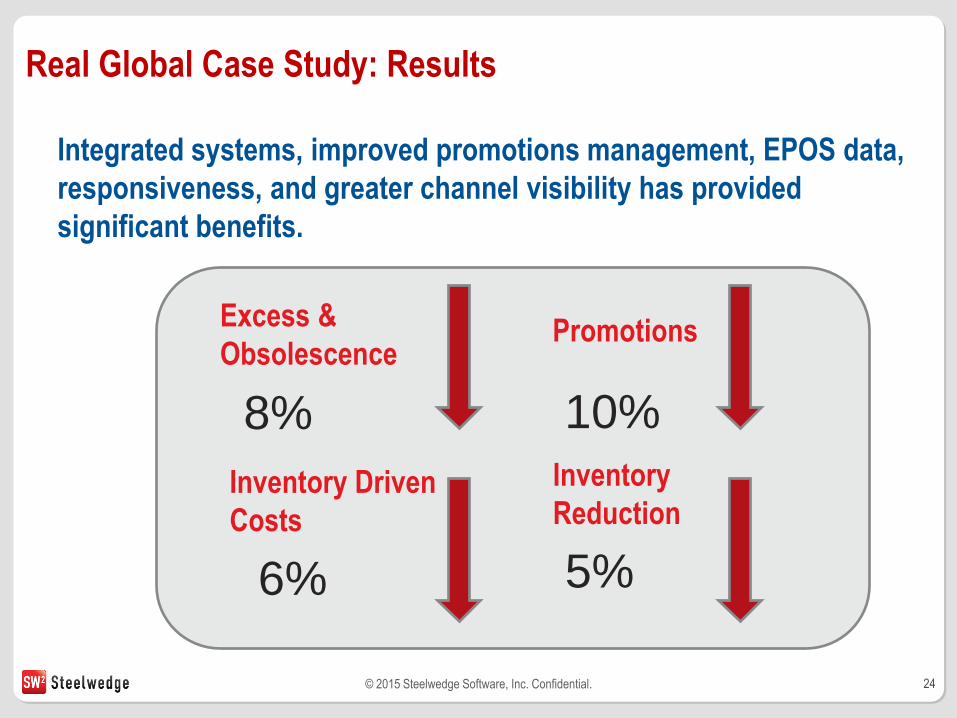
Integrated systems, improved promotions management, EPOS data,
responsiveness, and greater channel visibility has provided
significant benefits.
Real Global Case Study: Results
Promotions
Inventory Driven
Costs
Excess &
Obsolescence
10% 8%
6%
Inventory
Reduction
5%

25 © 2015 Steelwedge Software, Inc. Confidential.
The Bottom Line
• Value: There is incredible value, as long as we measure it
correctly
• Roadmap: Define a clear end state, as well as the stages of
maturity to get there and the benefits associated at each
stage in order to sustain
• Measuring Success: KPI’s must link with strategic goals and
be focused on the outcome
26 © 2015 Steelwedge Software, Inc. Confidential.
Q&A Contact Us
Telephone: North America +1 (855) 980.8800
United Kingdom +44 (0)121.232.4668
Netherlands +31 (0)70.7999.288
Japan +813-6277-8521
27 © 2015 Steelwedge Software, Inc. Confidential.