Stavros Kromidas with Contributions bylibrary.nuft.edu.ua/ebook/file/Kromidas2005.pdf · is "More...
302
Stavros Kromidas More Practical Problem Solving in HPLC with Contributions by FriedrichMandel, Jurgen Maier-Rosenkranz and Hans-Joachim Kuss Translated by Renate FitzRoy WILEY- VCH WILEY-VCH Verlag GmbH & Co. KGaA
Transcript of Stavros Kromidas with Contributions bylibrary.nuft.edu.ua/ebook/file/Kromidas2005.pdf · is "More...

Stavros Kromidas
More Practical Problem Solv ingin H P L C
with Contributions byFriedrich Mandel, Jurgen Maier-Rosenkranz and Hans-Joachim Kuss
Translated byRenate FitzRoy
WILEY-VCH
WILEY-VCH Verlag GmbH & Co. KGaA

Further Titles of Interest
S. KromidasPractical Problem Solving in HPLC
2000, ISBN 3-527-29842-8
P.C. SadekThe HPLC Solvent Guide2002. ISBN 0-471-41138-8
P.C. SadekTroubleshooting HPLC SystemsA Bench Manual1999, ISBN (M7M7834-9

Dr. Stavros KromidasRosenstraOe 1666125 [email protected]
Dr. Friedrich MandelSenior Applications ChemistMass SpectrometryAgilent TechnologiesSales & Services GmbH & Co. KGHewlett-Packard-Str. 876337 WatdbronnGermanyfrjedrich_mandel@ agilent.com
Dr. Juergen Maier-RosenkranzGROM Chromatography GmbHa GRACE Vydac DivisionEtzwiesenstraGe 3772108 [email protected]. Hans-Joachim KussInnenstadtklinikum der LMUNussbaumstr. 780338 [email protected]
This book was carefully produced. Nevertheless, authors and publisher do not warrant theinformation contained therein to be free of errors. Readers are advised to keep in mind thatstatements, data, illustrations, procedural details or other items may inadvertently be inac-curate.
Library of Congress Card No.: applied forA catalogue record for this book is available from the British Library.Bibliographic information published by Die Deutsche BibliothekDie Deutsche Bibliothek lists this publication in the Deutsche Nationalbibliografie; detailedbibliographic data is available in the Internet at http://dnb.ddb.de© 2005 WILEY-VCH Verlag GmbH & Co. KGaA. WeinheirnAll rights reserved (including those of translation in other languages). No part of this book maybe reproduced in any form - by photoprinting, microfilm, or any other means - nor transmittedor translated into machine language without written permission from the publishers Registerednames, trademarks, etc. used in this book, even when not specifically marked as such are notto be considered unprotected by law.Printed in the Federal Republic of Germany.Printed on acid-free paper.Typesetting K+V Fotosatz, BeerfeldenPrinting betz-druck gmbh, DarmstadtBookbinding J. Schaffer GmbH & Co. KG, GrunstadtISBN 3-527-31113-0
I Univ. Bayreuth II Univ. Biblkrtrw*
Foreword
Over the last 35 years, HPLC has become the analytical separation method par ex-cellence. HPLC instruments are standard equipment in analytical laboratories, in thirdplace after scales and pH meters. Many introductions, compendia and textbooks havebeen written on the subject of HPLC that give more or less systematic description ofthe basic apparatus, various techniques and quantitative evaluation of chromatograms.All these books require systematic study - at least of some individual chapters.
This book, however, uses a different, sometimes quite idiosyncratic approach toHPLC It provides practical support - answering questions of the "what do I do if..."variety. As even minute and often inadvertent changes in the HPLC system can causeheretofore-successful separations to go awry - e.g. a different supplier of solvents orchemicals, subtle changes (volumetric measurements at different temperatures) in thecomposition of eluents etc. - this book is an antidote to potential frustration. Over 90tips deal with the choice of column, problems with buffers and eluent composition,troubleshooting etc. giving the individual users support in their daily routine. Theauthor can build on his vast experience in HPLC.
I hope that his slightly unconventional description of HPLC technique will helpmany users to cope with their frustration with badly documented analytic systems.Perhaps, some of you may even feel inspired to document not only the process (dry-ing at 40'C), but also the performance (drying at 40 C until the weight remains con-stant), und keep a record of chromatographic parameters for the most important ana-lytes or those most difficult to separate.
June 2003 Prof. Dr. Dr. h.c. Heinis Engelhardt
More Practical Problem Solving in HPLC. S. tCroniidas VIICopyright © 2005 WlLEY-VCH Verlag GmbH & Co. KGaA. WciiiheimISBN: 3-S27-3M13-0

Contents
Preface XVThe Structure of the Book 1Part I (general section) 1Part 2 (specific questions) 1In Lieu of an Introduction 3Chromatography Crossword 4Across 4Down 4An HPLC-Quiz 6An HPLC Tale 9The Tale oi Peaky and Chromy 9
I HPLC Tips 11
1.1 Stationary Phases and Columns 11Tip No.01 "It improves with age" is a rule that applies to port and sometimes
to red wine, but how about your C1K column? ! 102 Optimization via column parameters - what works best? 1403 Can selectivity always be put down to chemical interactions
with the stationary phase? 1704 A matter of perspective ... Or: Selectivity and peak symmetry
of basic compounds using reversed-phase packing materials 1905 Separation of isomers 2106 When should I use a "polar" C1!t phase? 2307 Are polar RP-C,8 phases more suitable for the separation of polar analytes
than non-polar phases? 2408 What about non-endcapped phases - are they a thing of the past? 2509 How can I separate acids using RP C18? 2710 The nitrile phase - some like it polar 29I1 The selectivity of RP columns 311.2 Buffers, pH Value 3312 Does it always have to be potassium phosphate? 33
More Practical Problem Solving in HPLC. S. Kromidas IXCopyrighl O 2005 WILEY-VCH Vcrlag GmbH & Co. KCaA, WeinhcimISBN: 3-527-31113-0
Tip No.47 Peak deformation and a shift in retention time
due to an unsuitable sample solvent 11948 Is flushing with water or acetonitrile sufficient? 12349 Flushing and washing fluids for HPLC apparatus 12550 When does the peak area change? 12751 Reasons for a change in either peak height or peak area,
but not in both 12952 Excesses and their pitfalls 13153 Algae, fungi and bacteria in HPLC 13254 Does 40 °C always mean 40 X? 13455 The most common reason for a lack of reproducibility
is a lack of methodological robustness 135Have a break ... 13S
Dear Reader 138
Complete the sentences 139
"Matching pairs" 140Has Peaky remembered his lessons correctly? 1411.5 General HPLC Tips 14256 What changes can you expect when switching from one HPLC system
to another? 14257 What changes can be expected in a chromatogram if the dead voiume
is larger in one isocratic system than in another? 14458 Contribution of the individual modules of the system
to band broadening 14659 How to keep retention times constant while reducing the diameter
of the column 14860 Has 3 um material been developed sufficiently to be used
in routine separations? 15061 Miniaturization may be all well and good - but when does it really work
and does it make sense in routine separations? 15262 Why is it that peaks appear later with a new column? 15463 Column length, flow and retention times in gradient separations 15564 Column dimensions and gradient separations 15965 What is the difference between dead time and dead volume on the one hand
and selectivity and resolution on the other? 16166 Troublesome small peaks 16367 Lowering the detection limit by optimizing the injection 16468 Setting the parameters of an HPLC instrument 16769 The right wavelength - old hat to some, a revelation to others 17170 Characteristics of refraction, fluorescence and conductivity detectors 175
151617
192021
2324252627
34353637
383940414243444546
L'V cut-off of buffer solutions 34Sources of errors when using buffers 35The drawbacks of using buffers 37Why is the pH value so important, and what does it do? 40Why does the pH value shift even though I am using the correct bufferand the buffer capacity is sufficient? 42Changes to the pH value in the eluent: the extent of the shiftand the reasons behind it 43An unintentional pH shift and its consequences 46RP separations in the alkaline medium 49Separation of basic and acidic compounds containedin the same sample 5]Optimization, Peak Homogeneity 53The peaks appear too soon - what can be done? 53What can I do if the peaks elute late? 55Quick optimization of an existing gradient method 60Increasing efficiency - often the fast track to success 63Additives to the eluent 66Separating the unknown - where shall 1 begin? 69Separation of an unknown sample using a reversed-phase C)s column -how do I go about it? 72Developing an RP separation - the two-day-methodPart 1: Choice of column and eluent 74Developing an RP separation - the two-day methodPart 2: Fine-tuning of the separation 78Quick check on peak homogeneity - Part 1 80Quick check on peak homogeneity - Part 2 82Tied to a standard operating procedure -how can a bad separation be improved further? 84More elaborate measures to check peak homogeneity 86First easily digestible tip 91Second easily digestible tip 94Third easily digestible tip 96
Troubleshooting 99How to approach problems in a systematic manner 99Spikes in the chromatogram 101Additional peaks in trace analysis separations 103What causes a ghost peak? 105Ghost peaks in a blank gradient 107Strange behaviour of a peak. What could be the cause? 108When could one expect a change in the elution order of the peaks? 110Tailing in RP HPLC - Part 1: Fast troubleshooting 114Tailing in RP HPLC - Part 2: Further causes and time-served cures 116

Preface
The HPLC community gave "Practical Problem Solving in HPLC" a warm welcome.Alongside joy, 1 also fell a kind of urge to "keep going". The logical result of this
is "More Practical Problem Solving in HPLC". The intention, language and style haveremained the same, serving one aim: The book is meant to be an easy-io-read com-panion for HPLC users, providing tips and suggestions in a compact form,
Alongside general tips we have also included three "Special Areas" in this volume.These are two techniques that are already important and will become increasingly soin future - LC-MS-coupling and micro-/nano-LC - as well as a look at quantitativeevaluation. Even if today's computers do nearly all the work for us, the backgroundcould prove interesting for some readers, such as how settings influence the peakshape, area and height, or why the calculated content is dependent on the evaluationmethod used.
1 would like to emphasize that the "Practical Problem Solving" series is not in-tended as a course book. Rather, it is a concise representation of the relations and ex-planations from a practical viewpoint. For the theoretical background 1 would pointthe reader towards the appropriate works.
1 wish to extend my gratitude to my colleagues Friedrich Maude!, Joachim Maier-Rosenkranz and Hans-Joachim Kuss, who provided their expert knowledge in theirspecialized area.
The cooperation with Steffen Pauly at Wiley-VCH proved to be most pleasant. Ialso thank Renate FitzRoy for expertly translating the often not-trivial passages of theoriginal manuscript into English, and Uwe Neue for his scientific discussions and crit-ical reading of the text.
Finally, I hope you have fun while reading this book and that you find here ideasand help for your daily work with HPLC.Saarbrucken, September 2004 Stavros Kromidas
More Practical Problem SnlvinR in HPLC. S. KromidasCopyright © 2005 WILEY-VCH Vcrlag GmbH & Co. KGaA. WeintvinISBN: 3-527-31U3-O

3.2 From Theory to Practice - Empirical Formulae, Rules of Thumband Simple Correlations in Everyday HPLC 269
3.3 Information Resources for Analysis/HPLC 2773.4 Analytical Chemistry Today 2813.5 Trends in HPLC 2853.6 Thoughts About a Dead Horse 290
XIV

The Structure of the Book
Part 1 (general section)In the first part, I am trying to break the reader in gently before proceeding to the
73 tips in which various aspects of HPLC are discussed. Although it is not alwayspossible to link everything to an overriding theme, 1 have tried to introduce the fol-lowing subject categories:• Stationary phases, columns (Tips Nos. 01-11)• Buffers, pH value (Tips Nos. 12-22)• Optimization, checking peak homogeneity (Tips Nos. 23-34)• Troubleshooting (Tips Nos. 35-54)• Miscellaneous lips (Tips Nos. 55-73)
In general, every tip is a self-contained unit discussing a specific problem, whichmeans that the book does not have to be read from cover to cover. The reader canjump back and forth at leisure. However, a very important and complex subject maybe spread over several tips, e.g., 'Tailing in HPLC" is discussed in Tip Nos. 45 and46.
Or the same problem may be discussed from different angles and crop up in twoor three different tips, e.g., "sources of errors when using buffers" in Tip No. 14, and"Shift of pH value in the eluent" in Tip No. 18. What I am trying to achieve is toopen up a variety of routes to the reader to make the most of these tips.
Where appropriate, references are given regarding tips that are related to the topicor provide additional information. For easier reference, the tips have been numbered.As some of you may already possess Volume 1 of the series "Practical Problem Solv-ing in HPLC", I have also included it in my references. Whenever I refer to it, thefigure 1 will appear behind a forward slash, e.g., Tip No. 34/1. If not stated other-wise, the chromatograms are results of my own measurements or they are examplesfrom practical separation classes held at NOVIA GmbH, Frankfurt/Main to whom Iwould like to express my thanks.
Part 2 (specific questions)Over recent years, many variants of classical HPLC as well as related separation
techniques have been developed. The most important of these are in my opinion LC-MS coupling and micro- or nano-LC. Both have an important role to play in the fu-ture, which is why you will find tips referring to them in Part 2.
Finally, a word about quantification.
More Practical Problem Solving in HPLC. S. KromidasCopyrighi © 200S WILEY-VCH Vcrlag GmbH & Co. KGaA, WeinheinISBN: 3-527-31113-0

In Lieu of an Introduction
Dear Reader,Now you hold this book in your hands and you may feel a little reluctant to jump
in at the deep end and go straight to the serious subjects. If that's the case, take iteasy and go through the fun pages first before you start on any earnest work. There issomething for every taste.1. Do you like a challenge? Have a go at the crossword on page 4.2. Do you like solving riddles? There is a quiz waiting for you on page 7.3. Are you a child at heait? Do you still enjoy being told stories? Then read the chro-
matographic tale of Peaky and Chromy on page 9.You will find the answers from page 261 on.Are you far too grown-up and serious to waste your time with childish games? All
right, then go ahead and dive into the fountain of wisdom on page 11.
More Practical Problem Solving in HPLC. S. KromidasCopyright © 2005 WILEY-VCH Vcrlag GmbH & Co. KGaA. WeinhciirISBN; 3-527-31113-0

With [he software programs thai arc now available, quantitative evaluation of chro-matograms has become child's play. However. I thought it would perhaps be a goodidea to sive a brief overview of the integration and data handling methods, and thereader could draw some educational benefit from hands-on quantification using arange of methods. Both the pocket calculator and the personal computer approach areoffered: the latter using MS Exal. This might even help to memorize and internalizethese various methods. What we also wanted to achieve was to give some backgroundto the integration process and demonstrate the impact of individual parameters onpeak area and height to round off the discussion in Part 2.
The Appendix contains a bibliography, an index and further information on HPLC.
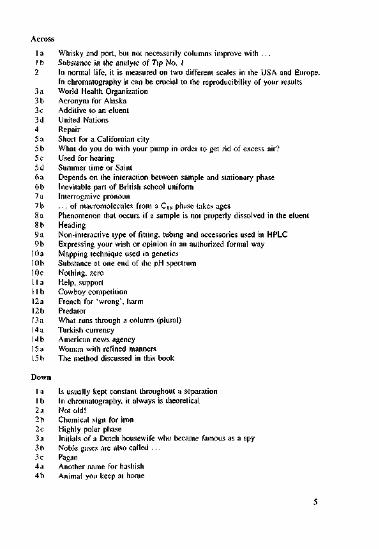
Across1 a Whisky and port, but not necessarily columns improve with ...1 b Substance in the analyte of Tip No. I2 In normal life, it is measured on two different scales in the USA and Europe.
In chromatography it can be crucial to the reproducibility of your results3 a World Health Organization3 b Acronym for Alaska3 c Additive to an eluent3d United Nations4 Repair5 a Short for a Californian city5 b What do you do with your pump in order to get rid of excess air?5 c Used for hearing5d Summer time or Saint6 a Depends on the interaction between sample and stationary phase6b Inevitable part of British school uniform7a Interrogative pronoun7 b ... of macromolecules from a Cls phase takes ages8 a Phenomenon that occurs if a sample is not properly dissolved in the eluent8 b Heading9 a Non-interactive type of fitting, tubing and accessories used in HPLC9b Expressing your wish or opinion in an authorized formal way10a Mapping technique used in genetics10b Substance at one end of the pH spectrum10c Nothing, zero11 a Help, support11 b Cowboy competition12a French for 'wrong', harm12b Predator13 a Whai14a Turkish currency14b Amci15 a
runs through a column (plural)
ican news agencyin with refined manners15 b The method discussed in this book
1 a Is usually kept constant throughout a separation1 b In chromatography, it always is theoretical2a Not old!2 b Chemical sign for iron2 c Highly polar phase3 a Initials of a Dutch housewife who became famous as a spy3 b Noble gases are also called ...3 c Pagan4a Another name for hashish4b Animal you keep at home

Chromatography - and more - Crossword
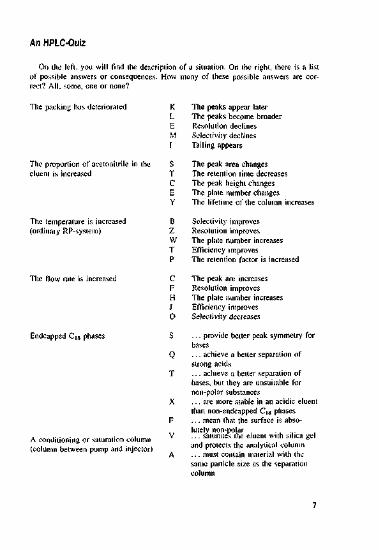
An HPLC-Quiz
On the left, you will find the description of a situation. On the right, there is a listof possible answers or consequences.rect? All, some, one or none?The packing has deteriorated
The proportion of acetonitrile in theeluent is increased
The temperature is increased(ordinary RP-system)
The flow rate is increased
Endcapped C|8 phases
A conditioning or saturation column(column between pump and injector)
KLEMISTCEYBZWTPCFHJ0S
Q
T
XFV
A
The peaks appear laterThe peaks become broaderResolution declinesSelectivity declinesTailing appearsThe peak area changesThe retention time decreasesThe peak height changesThe plate number changesThe lifetime of the column increasesSelectivity improvesResolution improvesThe plate number increasesEfficiency improvesThe retention factor is increasedThe peak are increasesResolution improvesThe plate number increasesEfficiency improvesSelectivity decreases... provide better peak symmetry forbases... achieve a better separation ofstrong acids... achieve a better separation ofbases, but they are unsuitable fornon-polar substances... are more stable in an acidic eluentthan non-endcapped Cis phases... mean that the surface is abso-lutely non-polar... saturates the eluent with silica geland protects the analytical column... must contain material with thesame particle size as the separationcolumn
7
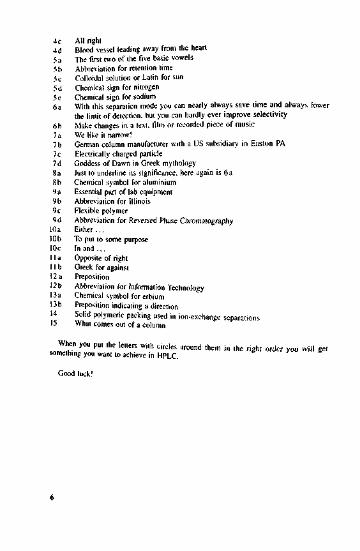
4 c AH right4d Blood vessel leading away from the heart5 a The first two of the five basic vowels5 b Abbreviation for retention time5 c Colloidal solution or Latin for sun5 d Chemical sign for nitrogen5e Chemical sign for sodium6a With this separation mode you can nearly always save time and always lower
ihe limit of detection, but you can hardly ever improve selectivity6b Make changes in a text, film or recorded piece of music7a We like it narrow!7b German column manufacturer with a US subsidiary in Easton PA7c Electrically charged particle7d Goddess of Dawn in Greek mythology8a Just to underline its significance, here again is 6a8 b Chemical symbol for aluminium9a Essential part of lab equipment9 b Abbreviation for Illinois9c Flexible polymer9d Abbreviation for Reversed Phase Chromatography10a Either...10 b To put to some purpose10c In and ...11 a Opposite of right11 b Greek for against12 a Preposition12b Abbreviation for Information Technology13a Chemical symbol for erbium13b Preposition indicating a direction14 Solid polymeric packing used in ion-exchange separations15 What comes out of a columnsorllli!" Pl" 'he iaKTS Wi'h drdeS arOund them in tlK right order you will get Isomething you want to achieve in HPLC. |
Good luck! j
An HPLC Tale
The Tale of Peaky and ChromyOnce upon a time there were two peaks who were very good friends - little Peaky
Acid and big Chromy Silicasky. Whenever they met up in the "The Last Drop" tavernafter a long retention time, they usually had enough time to tell each other their latestadventures. Today it was the turn of the lively little chap Peaky:• You know, we had really great fun when our friend Nicolas W. Pump - remember
Pumpous Nick - wanted to separate me and the other strong boys of the AcidGang. His boss, Mr. Chromadis. wanted to have us all quantified. Well, Nick tooka 125 mmx4 mm endcapped Super-X-fantastic-pura pura C\n column and used an85/15 (w/w) mixture of ACN/100 mmol phosphate buffer, pH=5 at a flow rate of1 mL min"1.
• And?• Well, some of the others made their appearance after 1-2 minutes, while others
look 4-5 minutes. He seemed to be quite happy. Using his software, he alreadyhad us measured.
• How is that?• Just the usual things: height, area, asymmetry factor and theoretical plate number.• And were you all tall and slender?• No, two or three of us were on the small side, and they were carrying something
that looked like a tail ...• So there was some tailing.• Yes, and because they were so small he couldn't really measure them, but that
didn't seem to bother him.• So was everything O.K.?• No, he suddenly wanted us all to move towards the back. So he took a little more
water, and we all came a little later. Our height and area changed untilsuddenly ...
• What happened?• One of us appeared as a double peak. You know it was a very o]d column and the
packing was past its best. But fortunately, Nick not only have his wits about him,he even had a second column in his cupboard!
• Did it at least work then?• No, I don't think so. Anyhow, he started cursing and then soon went home. The
next day ...Peaky had no time to finish his sentence, as the two friends had to leave their cozy
place and move on to the large cafeteria "The Dregs".

1 ... raises the pressureK .-- must be filled with the same sta-
tionary phase as the separation col-umn
C ... must also be thermostatically con-trolled in order to ensure the constantviscosity
The letters in front of the correct answers, put in the right order, will give you athermodynamic factor that is a measure of the relative retention of two compounds.Its value is determined by the choice of stationary phase, the mobile phase composi-tion and the temperature. Find the solution!
Happy puzzle-solving!
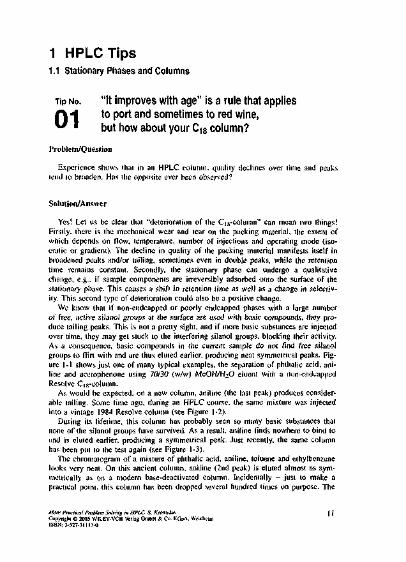
1 HPLCTips1.1 Stationary Phases and Columns
Tip NO. "It improves with age" is a rule that appliesf\H to port and sometimes to red wine,** • but how about your C18 column?
Problem/QuestionExperience shows lhat in an HPLC column, quality declines over time and peaks
tend to broaden. Has the opposite ever been observed?
Solution/AnswerYes! Let us be clear lhat "deterioration of the Cut-column" can mean two things!
Firstly, there is the mechanical wear and tear on the packing material, the extent ofwhich depends on flow, temperature, number of injections and operating mode (iso-cratic or gradient). The decline in quality of the packing material manifests itself inbroadened peaks and/or tailing, sometimes even in double peaks, while the retentiontime remains constant. Secondly, the stationary phase can undergo a qualitativechange, e.g., if sample components are irreversibly adsorbed onto the surface of thestationary phase. This causes a shift in retention time as well as a change in selectiv-ity. This second type of deterioration could also be a positive change.
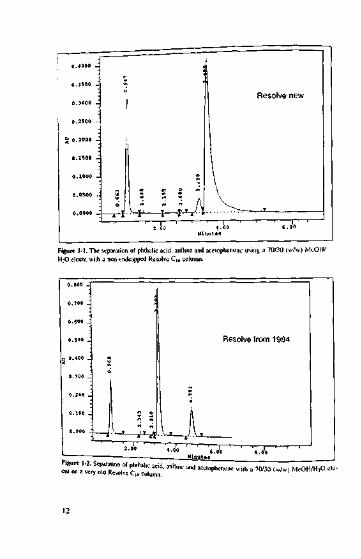
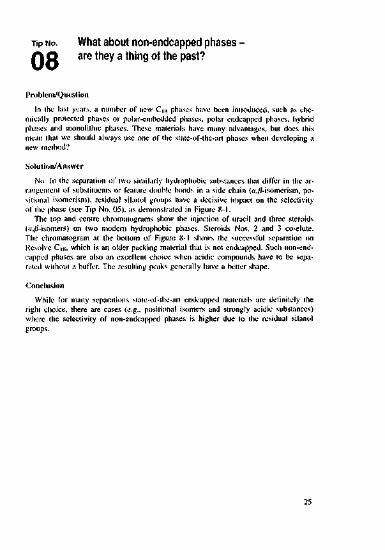
We know that if non-endcapped or poorly endcapped phases with a large numberof free, active silanol groups at the surface are used with basic compounds, they pro-duce tailing peaks. This is not a pretty sight, and if more basic substances are injectedover time, they may get stuck to the interfering silanol groups, blocking their activity.As a consequence, basic compounds in the current sample do not find free silanolgroups to flirt with and are thus eluted earlier, producing neat symmetrical peaks. Fig-ure l-l shows just one of many typical examples, the separation of phthalic acid, ani-line and acetophenone using 70/30 (w/w) MeOH/H2O eluent with a non-endcappedResolve C|R-column.
As would be expected, on a new column, aniline (the last peak) produces consider-able tailing. Some time ago, during an HPLC course, the same mixture was injectedinto a vintage 1984 Resolve column (see Figure 1-2).
During its lifetime, this column has probably seen so many basic substances thatnone of the silanol groups have survived. As a result, aniline tlnds nowhere to bind toand is eluted earlier, producing a symmetrical peak. Just recently, the same columnhas been put to the test again (see Figure 1-3).
The chromatogram of a mixture of phthalic acid, aniline, toluene and ethylbenzenelooks very neat. On this ancient column, aniline (2nd peak) is eluted almost as sym-metrically as on a modern base-deaciivated column. Incidentally - just to make apractical point, this column has been dropped several hundred times on purpose. The
More Practical Problem Solving in HPLC. S. Kromidas.Copyrighl © 2005 WILEY-VCH Nfcrlag GmbH & Co. KGaA. WcinhdrJISBN: 3-527-31113.0

Is there anythin- you don't like about this story or is there something not quite.ogtataL, it' Perhaps good old Mr. Pump did no, take the best decisions or couldPeaky be wrong in places?
,0.4000 -0.3500 -0.3000 _0.3500 -
•
3 0 . 2 0 0 0 -
0 . 1 S O 0 -
0 . 1 Q O O -
0 . 0 0 0 0 -
a
•
s s "
; '" L / v
• , . 1 , '
M i
R e s o l v e n e w
1
i . O O 6 . 0 0
u t o s
F i g u r e 1 - 1 . T h e s e p a r a t i o n o f p h t h a l i c a c i d , a n i l i n e a n d a c e l o p h e n o n e u s i n g a 7 0 / 3 0 ( w / w ) M c O H /
H ; O e l u e n t w i t h a n o n - e n d c a p p e d R e s o l v e C 1 K c o l u m n .
O . B O O -
0 . 7 0 0 -
0 . 6 0 0 _
0 . 5 0 0 _ R e s o l v e f r o m 1 9 8 4
w i t h ' ™ ' 3 0 ( w / w )

Resolve from 1984PLOT ONCHANNEL A INJECT 01/27/9? 10:57:56
=3.35 ,Figure 1-3. Separation of phlhalic acid, aniline, toluene and elhylbenzenc on the old (see Figure 1-2)Resolve column.
clear peaks of the other three components show that if a column, e.g., Resolve, iswell packed, the packing material can easily survive such shock treatment.
ConclusionIf an HPLC phase irreversibly adsorbs problematic components, it may affect its
properties, mainly in a negative way, but occasionally it may even turn out to be animprovement.

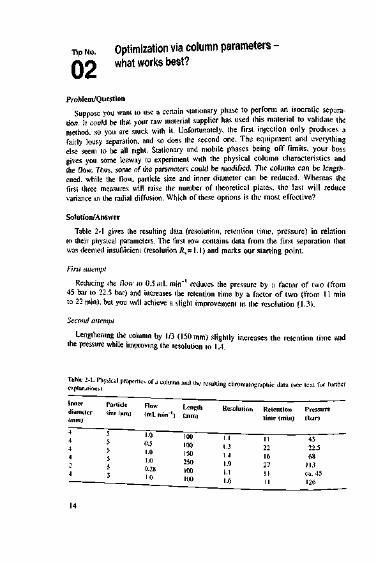
Third attemptThe result of the second attempt may indicate that it would be worth trying out an
even longer column. The best resolution could be achieved using a 250 mm column -but at a price! The pressure increased to 113 bar and the analysis time rose to27 min.Fourth attempt
Imagine you are reducing the inner diameter of the column from 4 mm to 2 mm,adjusting the flow to keep the linear velocity and thus the retention times constant.The increase in pressure (through reducing the inner diameter) and its reduction(through decreasing the flow) by a factor of 4 cancel each other out. Not only thepressure, but also the resolution will remain constant. What will change, however, isthe peak height, which will increase if the same amount of sample is injected whilethe band-spreading in the column will be reduced.
Fifth attemptStick to the original column dimensions and the original flow but use 3 um parti-
cles. While the analysis time remains constant at 11 min (owing to the column lengthand flow remaining constant) adequate resolution of 1.6 is obtained at a pressure of126 bar.
Conclusion
1. Reducing the flow is easy to do. Unless the flow is reduced drastically, e.g., to 0.2Or 0.3 mL min"1, this does not achieve very much {if you use small particles), andthe drawback is an extremely long analysis time.
2. In isocratic separations where many peaks need to be separated and/or you aredealing with a complex matrix, the classical approach using a long column is stillthe best. Higher pressure and long analysis times are the downsides one has to putup with.
3. Reducing the inner diameter may not improve resolution, but it is a way of cuttingdown on eluent use and of lowering the detection limit (higher peaks!), which canbe of some advantage when it comes to trace analysis and small samples.
4. If demands on peak capacity are not too extravagant and the samples are reason-ably "clean", using small particles is often a sensible compromise - as long as thepressure remains acceptable.
Let us summarizeFor isocratic separations:
• Matrix-loaded sample, high demands on selectivity? -> Long column.• Relatively "clean" sample? -* 3 \im particles and a column length of 100 mm are
adequate in most cases.
Tip NO. Optimization via column parameters -n n what works best?
Problem/QuestionSuppose you want to use a certain stationary phase to perfonn an isocratic separa-
tion. It could be that your raw material supplier has used this material to validate themethod, so you are stuck with it. Unfortunately, the first injection only produces afairly lousy separation, and so does the second one. The equipment and everythingelse'seem to be all right. Stationary and mobile phases being off limits, your bossgives you some leeway to experiment with the physical column characteristics andthe flow. Thus, some of the parameters could be modified. The column can be length-ened, while the flow, particle size and inner diameter can be reduced. Whereas thefirst three measures will raise the number of theoretical plates, the last will reducevariance in the radial diffusion. Which of these options is the most effective?
Solution/AnswerTable 2-1 gives the resulting data (resolution, retention time, pressure) in relation
to their physical parameters. The first row contains data from the first separation thatwas deemed insufficient (resolution Rs= 1.1) and marks our starting point.First attempt
Reducing the flow to 0.5 mL min~' reduces the pressure by a factor of two (from45 bar to 22.5 bar) and increases the retention time by a factor of two (from 11 millto 22 min), but you will achieve a slight improvement in the resolution (1.3).Second attempt
Lengthening the column by 1/3 (150 mm) slightly increases the retention time andthe pressure while improving the resolution to 1.4.
!,a!i'r V' ^ prapenics of a colum« a»d *= resulting chromalogniphic dala (sec test for furtherInnerdia mete i Particle Flow Length
sizef|im) <mL miif1) (mm)Resolution Retention Pressure
time (min) (bar)
1.00.51.01.00.281.0
100100150250100100

Tip No.
0 3
Can selectivity always be put downto chemical interactionswith the stationary phase?
Problem/QuestionWe have ail been taught that chromatographic separation results from interactions
between the analytes and the stationary phase - with the exception perhaps of size ex-clusion chromatography. Depending on the mechanism, we presume that ionic or hy-drophobic, or some other interactions, take place. Discussion of partitioning mecha-nisms has completely gone out of fashion. Are these interaction mechanisms the onlythings that are happening or is there anything else that has an impact on the selectiv-ity of the chromatographic separation?
Solution/AnswerThese interactions are not the only factors. Even for small molecules steric aspects
can be important, see Figure 3-1. A separation of a mix of metabolites of tricyclicantidepressants using two "polar" RP-phases yields five peaks (centre, left). Whenusing a material with a pore diameter of 300 A six peaks appear. The desired selectiv-ity is only achieved via an additional steric aspect introduced by the use of a packingmaterial with a larger pore size.
Separation from metabolites(demethylates derivativesofantidcprcssiva)ondifferent phases inacctoniirile/phosphatc buffer
Left: LicbrosorbMiddle: Reprosil AQRight: Jupiter
Figure 3-1.

,-> R.TihciiT1 vour 4 mm columns with 3 mmDo you care a b o u t ^ — - ^ « ^ ^ (,, ,„ lhis day and age, you- * ; X an — -ha. will no. we* with a 3 mm column anyway.
Su^lmeTnoUha, cntical (see Tips Nos. 63 and 64,. so keep i, smalH For. I " "an easily use a 75 mm or even shorter column.

Today it is popular to talk far too seriously about everyday matters.It is about time somebody used everyday language for serious matters!
Tip NO. A matter of perspective...f\A 0r: Selectivity and peak symmetry" " of basic compounds using reversed-phase packing
materials
Problem/QuestionAre you planning to separate strongly basic compounds'? Well, well, well - be
careful! Take, if you will, your favourite clean, expensive, state-of-the-art, metal-ion-free, super-endcapped phases with maximum surface coverage. Your peaks will beimmaculate, sharp and symmetrical - the separation looks very neat, I will grant youthat (see Figure 4-1).
But - are you sure you are getting the full picture? It pays to be circumspect whenusing polar/ionic components and hydrophobic stationary phases.
Solution/AnswerJust to be on the safe side, double-check your results - at least for the most impor-
tant samples - using a polar RP phase and an unbuffered (!) mcthanol/water eluent. Ifyou get the same number of naturally tailing peaks as you had using the hydrophobicphase, all is well. Don't be fooled by the sharpness of those peaks in Figure 4-1! Itcould be that this only gives the illusion of high selectivity. As Figure 4-2 shows,there should be four not just three peaks.
A phase with good surface coverage cannot produce polar/ionic interactions, sodon't expect good polar/ionic selectivity! Be on your guard!
Your best bet is of course to find a polar phase that can produce polar interactionsbut that only has a small number of interfering silanol groups, such as SynergiPOLARRP, Fluofix IEW or Zorbax SB C8. These materials yield good selectivity, due to theirpolar character, as well as good peak symmetry, due to good coverage of the surface(see Figure 4-3).
ConclusionIf you are now convinced that you have to be vigilant when it comes to the separa-
tion of hydrophobic bases that's half the battle. Don't trust those sharp peaks - theymay hide some crucial unresolved peak lurking in the background. However strictyour supervisor, if you have actually checked peak homogeneity by using polarphases you will be able to prove that you have been taking extra care. This will earnyou some brownie points in your laboratory. After all, your boss can't see everything,and as you don't (want to) know how he reacts if you overlook something, this mightbe a precaution worth taking.

ConclusionSleric aspects cannot be excluded out of hand when separating an unknown sam-
ple. When developing a method and choosing a column, I therefore recommend con-sidering phases with large and small pore diameters as well.
Examples of phases with a small pore diameter (60-80 A);NovaPak, Nucleosil 50. Spherisorb ODS 1/2 Superspher Select B.Examples of phases with a large pore diameter (180-300 A):Symmetry 300. Jupiter, ProntoSIL 300. Zorbax SB 300. Discovery C,K.
Tip NO. Separation of isomers
0 5
Problem/QuestionThe separation of isomers can prove to be quite difficult, as such compounds often
have very similar properties. Which columns and eluents should be used in suchcases?
Solution/AnswerPreliminary remark:Difficult cases often call for unorthodox solutions. This general principle applies par-ticularly when specific important problems such as customer complaints or acute tox-icity issues need to be dealt with. We are not talking about developing a routinemethod where robustness and reproducibility of results are a major consideration.Keep this in mind when looking at the following suggestions!
Choice of columnModern hydrophobic phases are hardly suitable for this problem. I recommend the
following alternatives:• "Old classics" with polar functionality:
e.g., LiChrospher, Spherisorb ODSI, Zorbax ODS or Nucleosil 100.• State-of-the-art polar phases:
e.g., "embedded phases" such as XTerra RP, Nucleosil Nautilus or Prontosil ACE,or even more strongly polar phases such as Fluofix, SynergiPOLAR RP or Plati-num EPS.
• Phases with a short chain and/or a polar functional group:e.g., CCNordiol.
• Phases with a particularly small (50-60 A) or a particularly large pore diame-ter (300 A):e.g., Nucleosil 50, NovaPak, Symmetry 300 or Jupiter.
• "Outlandish" but promising experiments (to be tried initially on a clean column,which can otherwise be discarded):e.g., use an ordinary CIK/Q column and as an elucnt just water acidified using per-chloric acid (pH value around 2 to 3) or a CH column and 30% acetic acid, or simplypump an Ag+ or Cu2+ (AgCl or CuSO4) solution over a C[S/C8 or a silica gel columnusing a 40-60% water/acetonitrile elueni. You could also try using a polar column(e.g., silica gel) and separate hydrophobic isomers in pure methanol or acetonitrile.If you have to work with a buffer use a 0.5 M phosphate buffer and a middle-of-the-road (with respect to hydrophobicity) column, e.g., Spherisorb ODS 2.I would also like to mention the following phases that are renowned for their selec-
tivity in isomer separations, although I have no practical experience with them:

© 4Figure 4-2. Separation of uracil (inert), pyri-dine, benzylamine, phenol in an acidic phos-phate buffer wilh a polar RP phase.
Figure 4-1. -Separation" of pyridine/ben-zylamine. uracil (inert!), phenol in anacidic phosphate buffer wilh a hydropho-bic RP phase.
Figure 4-3. Separation of uraci] (inert), pyridine, ben/ylaminc, phenol in an acidic phos-phate buffer wilh a Fluofk RP phase
20
Tip NO. When should I use a "polar" C18 phase?
0 6
Problem/QuestionIn recent years, a number of hydrophobic Cm and CN phases have been introduced
that are low in metal ions and have good coverage. The strength of these phases liesmainly in the excellent peak symmetry achieved when analysing basic compounds.Moreover, if used to determine other organic molecules they have proved highly se-lective, even when polar groups are involved. In the light of all these advantages,should such phases be given preference when developing a new method?
Solution/AnswerNot necessarily, because the separation of some types of analytes rely heavily on
polar interaction. Phases with distinctly hydrophobic, well-covered surfaces cannot beexpected to perform well under these circumstances (see also Tip No. 4).
For a variety of reasons, columns that have a high polar functionality have a betterselectivity for the following types of analytes:• Large hydrophobic aromatic compounds• Positional and double bond isomers• Strong acids (in dissociated form)• Strongly polar metabolites• Planar/non-planar molecules
Some examples of phases with polar functionality:• Non-cndcapped phases, e.g., Spherisorb ODS I, LiChrospher• Phases with polar groups on the surface, e.g.. Platinum EPS. Supelcosil ABZ
PLUS• Phases with a polar group embedded in the alkyl chain, known as embedded
phases, EPG, e.g., Nucleosil Nautilus, Hypersil ADVANCE, SymmetryShield RPN• Hydrophilic endcapped phases (only to a certain extent!), e.g., YMC AQ. Reprosil
AQ• Combination of the above, e.g., short alkyl chain plus an embedded polar group,
such as SynergiPOLAR RP• Specialized phases, e.g., with steric and chemical protection or a short, fluorinated
chain, e.g.. Zorbax Bonus, Fluofix INW
ConclusionWhat is true for nature and everyday life also applies to HPLC, ihc more special-
ized a species (column), the better adapted it is to perform a certain task (separation).The results speak for themselves. There is always a trade-off between the high perfor-mance of a specialist and the less brilliant result from a jack-of-all-trades.

Calhxarene. polymer gels. Hypercarb. C,, with hydrophilic endcapping.
Choke of eluentsConsider .he organic portion of the eluent. my first choice would be methanol.
Th aks ma"v be broader, bu, its selectivity is higher compared w.th accon.trile. IwoulLso work with unbuffered mixtures rather than w,th buffered ones.
ConclusionWhen separatin» isomers you have to rely primarily on ionic/polar interactions, not
just the normal interaction with polar groups on the RP surface, but also try to exploitthe ion exchange capacity of the SiOH groups. Alternatively, you could also look atthe steric aspect and use a stationary phase with a small/large pore diameter (see TipNo. 3).
Tip NO. What about non-endcapped phases -are they a thing of the past?
0 8
Problem/QuestionIn the last years, a number of new Cm phases have been introduced, such as che-
mically protected phases or polar-embedded phases, polar endcapped phases, hybridphases and monolithic phases. These materials have many advantages, but does thismean that we should always use one of the state-of-the-art phases when developing anew method?
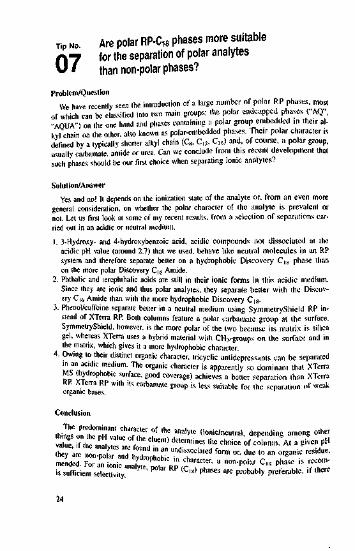
Solution/AnswerNo. In the separation of two similarly hydrophobic substances that differ in the ar-
rangement of substituents or feature double bonds in a side chain («./f-isomerism, po-sitional isomerism), residual silanol groups have a decisive impact on the selectivityof the phase (see Tip No. 05), as demonstrated in Figure 8-1.
The top and centre chromatograms show the injection of uracil and three steroids(«,/f-isomers) on two modern hydrophobic phases. Steroids Nos. 2 and 3 co-elute.The chromatogram at the bottom of Figure 8-1 shows the successful separation onResolve C1}{, which is an older packing material that is not endcapped. Such non-end-capped phases are also an excellent choice when acidic compounds have to be sepa-rated without a buffer. The resulting peaks generally have a better shape.
ConclusionWhile for many separations staie-of-lhe-arl endcapped materials are definitely the
right choice, there are cases (e.g., positional isomers and strongly acidic substances)where the selectivity of non-endcapped phases is higher due to the residual silanolgroups.
Tip NO Are polar RP-C18 phases more suitablefor the separation of polar analytes
U ' than non-polar phases?
Problem/QuestionWe have recently seen the introduction of a large number of polar RP phases, most
of which can be classified into two main groups: the polar endcapped phases ("AQ","AQUA") on the one hand and phases containing a polar group embedded in their al-kvl chain on the other, also known as polar-embedded phases. Thetr polar character isdefined by a typically shorter alkyl chain (Q, C12. C,f)) and, of course, a polar group,usually carbamate, amide or urea. Can we conclude from this recent development thatsuch phases should be our first choice when separating ionic analytes?
Solution/AnswerYes and no! It depends on the ionization state of the analyte or, from an even more
general consideration, on whether the polar character of the analyte is prevalent ornot. Let us first look al some of my recent results, from a selection of separations car-ried out in an acidic or neutral medium.1. 3-Hydroxy- and 4-hydroxybenzoic acid, acidic compounds not dissociated at the
acidic pH value (around 2.7) that we used, behave like neutral molecules in an RPsystem and therefore separate belter on a hydrophobic Discovery Cis phase thanon the more polar Discovery C|& Amide.
2. Phthalic and terephthalic acids are still in their ionic forms in this acidic medium.Since they are ionic and thus polar analytes, they separate better with the Discov-ery CK, Amide than with the more hydrophobic Discovery C,a.
3. Phenol/caffeine separate better in a neutral medium using SymmetryShield RP in-stead of XTerra RP. Both columns feature a polar carbamate group al the surface.SymmetryShield, however, is the more polar of the two because its matrix is silicagel, whereas XTerra uses a hybrid material with CH,-groups on the surface and inthe matrix, which gives it a more hydrophobic character.
4. Owing to their distinct organic characler, tricyclic antidepressants can be separatedin an acidic medium. The organic character is apparently so dominant that XTerraMS (hydrophobic surface, good coverage) achieves a better separation than XTerraKP. Xlerra RP with Us carbamate group is less suitable for the separation of weakorganic bases.
Conclusion
things"onhe'™ vi'lu T0'" °f llK analyle ('onic/neulral, depending among othertherare'non" !,1" T hT1 '" "" undissoda":<1 f™n"or. ducto'Torganic residue,mended For an ionic a ,ydrO|>hobic in character- <• »™-P°ta C,» phase is recom-is sufficient selectivity''"'' yte' P°'ar RP lC|s) phases are ProDab|y preferable, if there

Tip NO. How can I separate acids using RP
0 9
Problem/QuestionSuppose you want to separate acidic organic compounds, Let us also assume that
these arc not aniino acids - there are excellent standard applications available forthese, and to be honest, MS-MS coupling is so much more rapid and elegant as amethod that it will soon replace the HPLC analysis of aniino acids altogether. Yoursubstances don't fall into the category of strong organic or inorganic acids either, asyou would then use strong or weak ion exchangers to separate them. So which RPsystems should you consider?
Solution/AnswerUse the following set-up:
1. The column"Classical", non-endcappfd columns because of their greater stability in an acidicmedium, such as LiChrospher. or some of the newer columns developed especiallyfor use in an acidic medium such as ZorbaN SB.
2. The eluentThe eluent has to be acidic, because only in an acidic medium can the acidic com-ponents remain undissociated, and only then can they interact with the C\% surface,which, in turn, is a precondition for a reasonable retention.Weak acids should be separated at a pH of about 4-5 (eluent containing acetic.formic acids), stronger acids at a pH of about 2-3 (eluent containing phosphoric,acetic acid generally produces an improved peak form in comparison with phos-phoric, trifluoroacetic acid). For a pH of about 1.5-2, perchloric acid has proved tobe an excellent choice, but also consider methane sulfonic acid. There are other in-teresting, more exotic alternatives, which I will not mention here.Should we just use the acid or do we need to prepare a buffer".'As a general rule, using buffers (in this case acetate, phosphate, formate, trifluor-
acetate and perchlorate in the form of potassium, ammonium or sodium salts) contrib-utes to the robustness of the result. More on this in Tip No. 15. Bear in mind, though.that the critical range is above pH 4.3. Other factors
Further steps towards optimization:• Adding ion pair reagents, such as tetrabutyl ammonium chloride or tetrabutyl
hydrogen sulfate• Lowering the temperature
Figure 8-1. Separation of three steroids using two endcapped phases (lop and ccapped Cm phase (sec tcxi for further explanations). re) and ;i nun-end-
27

Tip NO. The nitrile phase - some like it polar
1 0
I'rnbl em/QuestionMany HPLC users seem to think that RP phases other than the usual C\x or Csphases are something exotic. Indeed they are. For example, the nitrile phase, also
known as the eyano phase is one such unusual polar phase. When should it be used?What type of rules can we derive for its use?
Solution/AnswerA nilrile phase has a polar as well as a non-polar side to it. The CN group ac-
counts for its polar character, while the propyl group (the link between the CN groupand the silica gel surface) gives it non-polar properties. Thus, with respect to polarity.CN sits in the middle between C]N and silica gel.
This means:If non-polar components interact too strongly with C]% or C« (resulting in tediously
long retention times), you could think of using a CN phase. If. for example you wantto separate polar substances from neutral components it is an ideal choice. There ishardly any retention as far as the non-polar, hydrophobie compounds are concerned.They elutc at the dead time or shortly after, while the polar components follow later.
Another example:If your analytes take a long time to elute. you could of course add more aeeloni-
(rile to the eltient or perform a gradient separation. However, a cheaper and certainlymore environmentally friendly alternative would be to use a CN column, but keep inmind that the life span of a CN phase is normally shorter than that of an alkyt phase<C*. CIK).
As a phase of medium polarity, CN can also be used in normal phase mode in con-nection with hexanc, heptane etc. as the mobile phase. It is not as polar as silica.Here is a list of its characteristics and possible advantages over silica gel:• Traces of water left in the eluent (which results in a layer of water on the surface
of the stationary phase) are less noticeable. Results are therefore more reproduci-• Adding polar substances to the CN eiuent is a quick way of modifying selectivity,
and it works faster than with silica gel.• Using silica in a gradient separation is often touch-and-go: using a CN phase
makes it so much easier!• In general. CN is more robust than silica gel.
There is. however, a major drawback to using the CN-phase - there is a risk of theCN group being irreversibly hydrolysed into hydroxylamine or it can form carboxylicacid.
29

. Including a short polar column, such as CN in a serial arrangement with Cl8 -you til be am Jd how neatly polar components can be separated (see I,p No.34).
ConclusionTo put it simply, separating acids by HPLC resembles GC separation. It cither
works or it does not. and apart from the measures just mentioned, there is nt.t muchone can do to optimize the separation.

Tip NO. The selectivity of RP columns
1 1
Problem/QuestionAs we all'know, the separation mechanism that determines selectivity in RP chro-
matography can be a complicated issue at times. Are there any rules that govern thisprocess? Yes, there are, and some of them are given below,Solution/Answer
From a wide range of experiments with various substances and eluents, the follow-ing rules about the suitability of polar and non-polar RP phases can be deduced.
Suitability of polar RP phases:1. Unbuffered eluents
- Hydrophobic, unsubstituted "large" aromatic compounds- Planar/non-planar aromatic compounds- Isomers (positional and cisl trans isomers)
2. Buffered eluents- Basic substances, however good selectivity is often overshadowed by a messy
appearance of the peaks {peak tailing)- Moderately strong acids (in dissociated form)- Strongly polar metabolitesSuitability of hydrophobic RP phases:
1. Unbuffered eluents- Polar and non-polar small neutral organic molecules (aldehydes, hydroxy benzo-
ates, mononuclear aromalics)- Analytes that differ in polarity; the difference in polar character may be due
either to a group (C=O, CH2, etc.) or the result of isomerism2, Buffered eluents
- Weak acids (in undissociatcd form)- Organic basesWhich RP phases can be considered as "polar"?The polar character of C|g-alkyl phases decreases in the following order:
• Polar groups on the surface, e.g., Supelcosil ABZ PLUS, Platinum EPS• High overall concentration of silanol groups, e.g.. Resolve, Spherisorb 0DS1• Embedded phases (Cts to C$)• Endcapped but silanophilic, metal ion-containing phases, e.g.. Bondapak• AQ-phases
1 would also like to mention combination phases (e.g., SynergiPOLAR RP),specialized phases (e.g., Fluofix) or classical polar RP phases such as CN or diol.

One more thing:It is of course possible to use a CN column with hexane one day, then give it a
rinse and use it for a separation that involves an RP eluent, and vice versa. In otherwords, you could use the column sometimes in normal and sometimes in RP mode.At least, that is the theory. In practice, it is safer to work with one CN column in nor-mal phase mode (the manufacturer will send it with the correct solvent) and reserveanother one for use in RP mode. Some manufacturers supply CN phases specificallyfor normal-phase and for reversed-phase applications.
Conclusion• CN is more polar ihan the usua! alkyl phases C , Ca and C4. It is suitable for the
separation of highly polar substances though with a considerably lower stability incomparison with the alkyl phases.
• CN is less polar than silica gel. and separations using CN arc more robust thanthose using silica gel.Should you want even higher polarity, think diol. Here you could use, for example,
heptane plus one drop of water, this system is more stable than the other example ofhexane and silica gei.
1.2 Buffers, pH Value
Tip NO. Does it always have to be potassium phosphate?
1 2
Problem/QuestionPotassium phosphate seems to be by far the most popular buffer in RP chromatog-
raphy. Potassium dihydrogen is used for the acidic pH range, while dipotassium hy-drogen phosphate covers the neutral and weakly alkaline range of the spectrum. Firstof all, I would like to emphasize that if you are happy with your potassium phos-phate, by all means stick to your guns, continue as before and go on to the next page.If, however, you are not particularly happy with it, think about ammonium phosphate,which has several advantages over potassium phosphate, as listed below,
Solution/Answer
• Ammonium phosphate is available in greater purity, thus reducing the likelihood ofinterfering peaks in sensitive gradient separations.
• Ammonium phosphate has a better solubility, which reduces the risk of unwantedprecipitates when using 80/90% acetonitrile.
• Filtration is not always necessary.• Ammonium phosphate has a lower UV absorption, which reduces drift in the lower
ranges of [he UV wavelength spectrum.
ConclusionAmmonium phosphate may offer a viable alternative for the determination of trace
substances, possibly in combination with high acetonitrile concentrations and lowwavelengths.
33

Conclusion• Non-polar substances can be separated selectively in an unbuffered clucnt on polar
phases. With increasing polarity of the analyie, there is a greater need for non-po-lar phases.
• Polar substances can be separated in unbuffered eluents on non-polar phases, yield-ing good results. This is also true for substances that differ in polarity due to thepresence of an isomeric form or a diverging substituent, e.g., OH or H vs. CH3 orperhaps CH3 vs. C=O.
• Polar substances can be separated in buffered eluents on polar phases, while non-polar analytes require non-polar phases for good separation.In order to achieve good selectivity, unbuffered eluents call for opposites in analytc
and phase polarity, while buffered eluents call for similarity.Hints1. These rules apply to a substantial number of the analytes examined. However, to
be valid in general, they would have to be verified for additional classes of sub-stances.
2. Suitability here only refers to selectivity, not to peak symmetry.

Tip NO. Sources of errors when using buffers
1 4
Problem/QuestionWhen separating ionic anaiytes. buffered eluents are indispensable, as they render
the results more reproducible. However, a variety of problems may crop up, such as alack of stability in retention times, changes in peak shapes or a short lifetime of thecolumn. What could be the causes?
Solution/AnswerPlease keep the following possible causes in mind:
1. Wrong buffer in relation to the desired pH range, e.g., phosphate buffer for pH = 5.2. Buffer too weak, e.g., separation of strong bases using a 5 mM buffer: 10 mM or
20 mM would be a safer bet.3. Chromatography within ± 1 pH unit around the pK,, value of the analyie, e.g., sepa-
ration of aniline at pH 5.5.4. The standard operating procedure (SOP) does not tell you whether the buffer salt
is in the hydrated form or not. This would have an impact on the ionic strength,e.g., sodium hydrogen phosphate with 1,2.... water molecules.
5. There is a noticeable difference between the pH levels of the eluent and the silicagel base of the packing (see also point 6). e.g., a weakly alkaline buffer (pH valuearound 7.5) and UChrospher (pH value of the base silica about 3.5).
6. It could be forgotten that following the addition of acetonitrile or methanol the pHvalue of acidic buffers drifts towards the alkaline. If you use a phosphate bufferwith a pH of 7.6 and add 70% methanol you will end up with a pH of about 8.4.In this context you should also remember unintentional pH gradients that resultfrom separations where solvent A and solvent B differ in pH value.The most common cause for the shift in retention time in buffered systems is a
change in pH. Clearly other causes such as a malfunctioning pump must be excluded.Checking whether your system is stable with respect to the pH value is prettystraightforward.
Simply measure the following three pH values:1. pH level of the ready-to-use eluent, i.e., after adding acetonitrile or methanol. Ob-
viously, owing to the proportion of organic solvent this is not the same pH valueas measured in water, but here we are talking of comparative measurements only.
2. pH level of eluent after 2, 8. 24 h, depending on for how long you run your separa-tions.
3. pH level of the eluate leaving the column.Ideally, you should end up with three identical pH values.
Tip NO UV cut-off of buffer solutions
1 3
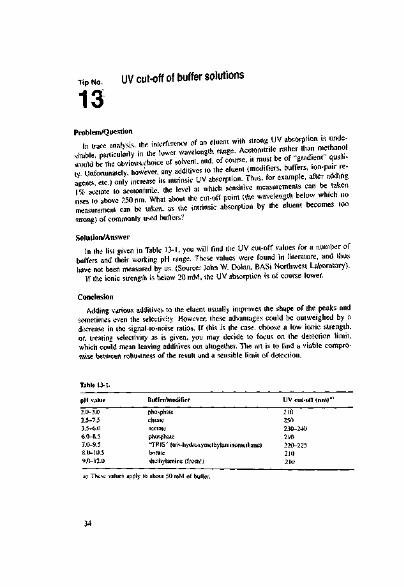
Problem/QuestionIn trace analysis, the interference of an eluent with strong UV absorption is unde-
sirable, particularly in the lower wavelength range. Acetonitrile rather than methanolwould be the obviouschoice of solvent, and, of course, it must be of "gradient" quali-ty. Unfortunately, however, any additives to the eluent (modifiers, buffers, ion-pair re-agents, etc.) only increase its intrinsic UV absorption. Thus, for example, after adding1% acetate to acetonitrile. the level at which sensitive measurements can be takenrises to above 250 nm. What about the cut-off point (the wavelength below which nomeasurement can be taken, as the intrinsic absorption by the eluent becomes toostrong) of commonly used buffers?Solution/Answer
In the list given in Table 13-1, you will find the UV cut-off values for a number ofbuffers and their working pH range. These values were found in literature, and thushave not been measured by us. (Source: John W. Dolan, BASi Northwest Laboratory).
If the ionic strength is below 20 mM, the UV absorption is of course lower.Conclusion
Adding various additives to the eluent usually improves the shape of the peaks andsometimes even the selectivity However, these advantages could be outweighed by adecrease in the signal-to-noise ratios. If this is the case, choose a low ionic strength.or, treating selectivity as is given, you may decide to focus on the detection limit,which could mean leaving additives out altogether. The art is to find a viable compro-mise between robustness of the result and a sensible limit of detection.
pH valuiTable 13-1.pH value2.0-3.02.5-7.53.5-6.06.0-8.57.0-9.58.0-10.59.0-12.0
Buffer/modifierphosphalccitrateacetatephosphate"TRIS1' (tris-hydroxymelhylaminomothanc)boratediethylaminc (fresh!)
UV cut-off (nm)a>
210250230-2402i0220-225210210
a) These values apply to about 50 mM of buffi
34
Tip NO. The drawbacks of using buffers
1 5
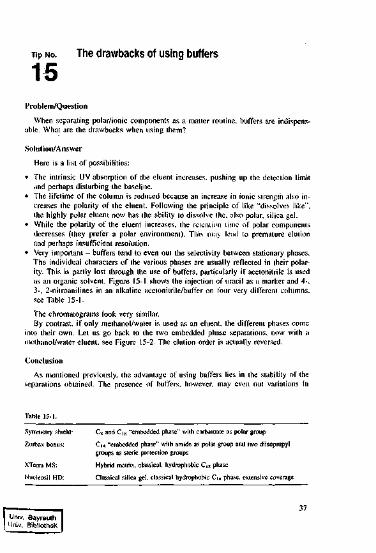
Problem/QuestionWhen separating polar/ionic components as a matter routine, buffers are indispens-
able. What are the drawbacks when using them?Solution/Answer
Here is a list of possibilities:• The intrinsic UV absorption of the ekient increases, pushing up the detection limit
and perhaps disturbing the baseline.• The lifetime of the column is reduced because an increase in ionic strength also in-
creases the polarity of the eluent. Following the principle of tike "dissolves like",the highly polar eluent now has the ability to dissolve the. also polar, silica gel.
• While the polarity of the eluent increases, the retention time of polar componentsdecreases (they prefer a polar environment). This may lead to premature elutionand perhaps insufficient resolution.
• Very important - buffers tend to even out the selectivity between stationary phases.The individual characters of the various phases are usually reflected in their polar-ity. This is partly lost through the use of buffers, particularly if acetonitrile is usedas an organic solvent. Figure 15-1 shows the injection of uracil as a marker and 4-,3-, 2-nitroanilines in an alkaline acetonitrile/buffer on four very different columns,see Table 15-1.The chromatograms look very similar.By contrast, if only methanol/water is used as an eluent, the different phases come
into their own. Let us go back to the two embedded phase separations, now with amethanol/water eluent, see Figure 15-2. The elution order is actually reversed.
ConclusionAs mentioned previously, the advantage of using buffers lies in the stability of the
separations obtained. The presence of buffers, however, may even out variations in
Symmetry shield: Cg and C|K "embedded phase" wiih carbamate as polar groupZorbax bonus: Cu "embedded phase" with amide as polar group and two diisopropyl
groups as steric protection groupsXTerra MS: Hybrid matrix, classical, hydrophobic C|« phaseNuelcosil HD: Classical silica gel. classical hydrophobic Ct8 phase, extensive coverage
Univ. Bayreuth! Univ. Bibliothek

If you find major inconsistencies, your system is flawed, and you should checkwhether one of the causes given above applies to your system.
ConclusionGetting a system io work with ionic analytes and buffers may be troublesome, but
think how much more trouble it would be to use ionic analytes with an unbufferedetuent in routine separations! There is nothing for it but to find a reasonably robustbuffer. When running isocratic separations, use the recycling mode and an Elusaver todiscard the peak to waste. With these tools, you can establish a well-balanced and re-producible method.
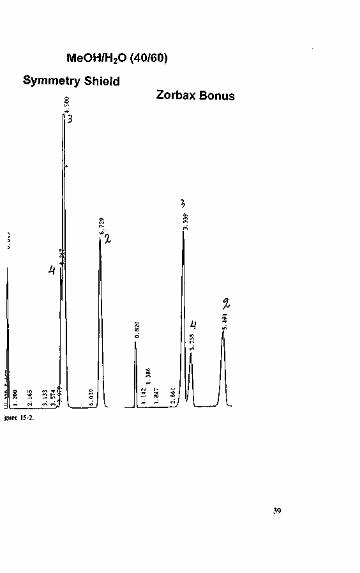
MeOH/H2O (40/60)
Symmetry ShieldZorbax Bonus
ijiurc 15-2.

ACN/Phosphate buffer (32/68), pH = 7.6
Symmetry Shield Zorbax Bonus XTerra MS Nucleosil HD
eloni(rile/phosphate buffer on four different
the polar properties of the phases The phases appear to become similar to each other,the stationary phase can hardly be used as an optimization tool. The more polar theanalytes to be separated, the more pronounced the lack in selectivity will be, as forexample in highly polar metabolites. The disadvantage of using more selective non-buffered systems obviously lies in the difficulty of reproducing retention time andpeak shapes. While for intricate one-off separations this may be a price worth paying,for routine separations the use of buffers is a must.

bases, they just won't let go, and often.ugly tails (the dreaded "chemical tailing" inbases) are the result. If we want our bases to interact with the C|S alkyl chains inpeace we must distract the silanol groups by offering them a decoy: another base.This is why many SOPs say "add triethylamine", "add diethylamine" or some otherbase to the eluent or simply use an alkaline buffer. By using such additives with aneluent it is even possible to obtain reasonable peaks from older, non-endcapped mate-rials such as LiChrospher. Whether a robust method is possible on these phases andsystems is a completely different question.
ConclusionRemember: •
• An acidic eluent is the righs choice for the separation of acids (good selectivityand good peak symmetry) and weak organic bases (good peak symmetry, but selec-tivity?). The organic character of the latter may be sufficient 'o trigger interactionwith the non-polar stationary phase and thus result in sufficient resolution. It istherefore a good idea to begin your methods development and separation experi-ments using an acidic eluent.
• Stronger bases must be separated in a neutral/alkaline medium, there is no doubtabout it, and endcapped phases are the first choice. The suitability of an additivefor the eluent or the suitable pH range of the buffer is determined by the ionizationof the analyte, i.e., by the basicity of the compound to be analysed. See also TipNo. 4.

Tip No.1 6
Why is the pH value so important,and what does it do?
Problem/QuestionAnyone whoVorks with polar/ionic or ionisable analyles knows lhal the pH value
of the eiuent is crucial: but what exactly does it do?ThiTTsuch a complex matter that one could easily spend a whole day in a semi-
nar or write a 10-page article on the subject. Here, we will only outline a few basicpoints.
Comment 2:We will concentrate on RP-HPLC, as things are pretty clear-cut m ion exchange
and ion chromatography: there is usually only one mechanism involved, the ion ex-change mechanism.Solution/Answer
The pH level affects the degree of dissociation of acidic/basic compounds and otfree (residual) silanol groups on the surface of the stationary phase. This means thatthe pH value could be used as a means of controlling the degree of interaction be-tween an polar/ionic analyie and the stationary phase. Thus, pH can be used to influ-ence retention time anJ peak shape. Let us first concentrate on what happens with theresidual silanol groups. We have the following equilibrium:
SiOH «=> SiO" + H+
Only if a silanol group carries a negative charge, can it interact strongly with basiccompounds. This slows down the kinetic desorption process of the basic analytesfrom the stationary phase, resulting in pronounced tailing or even irreversible sorp-tion. By using an acidic eiuent, we can shift the equilibrium to the left (law of massaction!), which leaves us with undissociated silanot groups. They have been tamednow and will not attack our analytes, and we will be rewarded by a show of neatsymmetrical peaks. This is why many SOPs say "add phosphoric acid" or "add phos-phate buffer" or perhaps acetic acid or trifluoroacetic acid, etc. The acidic eiuent en-sures that peaks elute symmetrically, as the silanol groups are deactivated and there-fore unable to interfere. However, if we want to separate stronger bases we have towork in a neutral or even alkaline medium, as this is where the bases, in their neutralform, can interact best with a non-polar RP surface. In an acidic medium, strongerbases carry a positive charge, and being ionic, polar species they would simply whizthrough the column. They would produce symmetrical peaks all right, but within sucha short time that we would stand no chance of separating them. There is nothing forit but to work with these bases in a neutral or alkaline medium.
So far, so good, but there is a small problem. From a pH value of around 4-5 thenow negatively charged silanol jroups are waiting for their chance to pounce on the
40

Tip No.
1 8
Changes to the pH value in the eluent:the extent of the shift and the reasons behind it
Problem/QuestionThe longer I study the role of the pH value in the RP-HPLC separation of acidic
and basic compounds, the more it strikes me how complex a subject this is and whatan impact it can have. Here I just want to concentrate on one single aspect: the rea-sons for an unintentional shift. Under what circumstances can we expect a pH shift?Solution/Answer
Table 18-1 gives the results from some of my recent experiments.
Reason for the shift Extent of the pH value shiftAfter adding McOH or ACN (he pH value shiftstowards the alkaline (sec Tip No. 17)
During the chromatography of basic compoundsand isocraiic scparalions in recycling mode with-out Elusavcr. a more or less noticeable shift of thepH value can be observedWith increased ionic strength, the pH value alsoslightly shifts towards the alkaline, whereas thechoice of the cation hardly seems to affectthe pH at alt20mMLiH2PO4:pH3.l620 mM NH4H2PO4: pH 3.20If the buffer does not match the pH level, theremay be a shift. Read more about this in Vol. ITip No, 27
Examples:a) pH of H2O = 5.2, after adding 40% MeOH or
32% ACN pH value 7.4 ... 7.6b) potassium phosphate buffer set at pH 2.68,
after adding 32% ACN new pH-value 3.15c) potassium phosphate buffer set at pH 7.59,
after adding 40% McOH new pH value 8.51d) MeOH/phosphatc buffer [40/60 (v/v)]. 20 mM,
original pH value 7.40. After about 400 injec-tions of basic samples, the pH value of tlie elu-ent increased to 7.98
Shift in the region of 0.3-0.8 pH units
5 mmol KH2PO.|/McOH (60/40) pH 2.9620 mMol KH2POVMcOH (60/40) pH 3.1540 mMol KH2POVMeOH (60/40) pH 3.24
Moreover the salt concentration and therefore the buffer capacity after the additionf methanol/acetonitrile is reduced due to the dilution.What are the consequences?
43
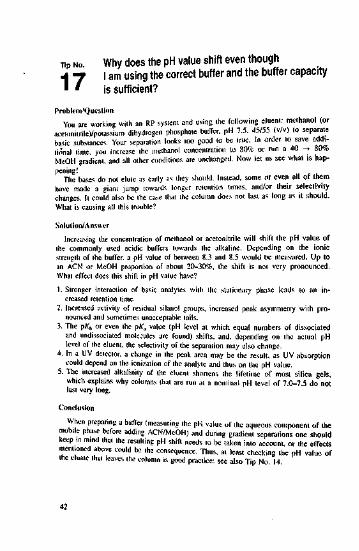
Tip No.Why does the pH value shift even thoughI am using the correct buffer and the buffer capacityis sufficient?
Problem'QuestionYou are working with an RP system and using (he following eluent: melhanol (or
acetonilrile)/potassium dihydrogen phosphate buffer. pH 7.5. 45/55 (v/v) (o separalebasic substances. Your separation looks too good to be (rue. In order lo save addi-tional time, you increase the methanol concentration to 80% or run a 40 -» 80%MeOH gradient, and all other conditions are unchanged. Now let us see what is hap-pening!
The bases do not elute as early as they should. Instead, some or even all of (hemhave made a giant jump towards longer retention times, and/or their selectivUychanges. It could also be the case that the column does not last as long as it should.What is causing all this trouble?Solution/Answer
Increasing the concentration of methanol or acetonitrile will shift the pH value ofthe commonly used acidic buffers towards the alkaline. Depending on the ionicstrength of the buffer, a pH value of between 8.3 and 8.5 would be measured. Up toan ACN or MeOH proportion of about 20-30%. the shift is not very pronounced.What effect does this shift in pH value have?1. Stronger interaction of basic analytes with the stationary phase leads to an in-
creased retention time.2. Increased activity of residual silanol groups, increased peak asymmetry with pro-
nounced and sometimes unacceptable tails.3. The pKb or even the pKa value (pH level at which equal numbers of dissociated
and undissociated molecules are found) shifts, and. depending on the actual pHlevel of the eluent. the selectivity of the separation may also change.
4. In a UV detector, a change in the peak area may be the result, as UV absorptioncould depend on the ioni/ation of the analyte and thus on the pH value.
5. The increased alkalinity of the eluent shortens the lifetime of most silica gels,which explains why columns that are run at a nominal pH level of 7.0-7.5 do notlast very long.
ConclusionWhen preparing a buffer (measuring the pH value of the aqueous component of the
mobile phase before adding ACN/MeOH) and during gradient separations one shouldkeep m mind that the resulting pH shift needs to be taken into account, or the effectsmenuoned above could be the consequence. Thus, at least checking the pH value ofthe eluatc that leaves the column is good practice: see also Tip No 14
Conclusion• When working with buffers in the "neutral" pH range, remember that the column
might not last very long because the actual pH value of the eluent drifts towardsthe alkaline, where many columns are unstable: see Tip No. 17.
• Reproducibility can become a problem in the weakly acidic range.• In order to achieve robust separation, the best choice is either a highly acidic or a
highly alkaline medium. This means that we only have to deal with one type ofmolecule, either 100% protonated or 100% non-protona!ed, and we are well awayfrom the critical range around the pKa value of the acid/base. It is in this rangewhere both types of molecules occur that tailing has been observed. One should,however, use columns that are made specifically for extreme pH levels.Recommendation;Obtain the pKiiA> values for the known components in your samples. It is worth-
while, when needed, to use software tools (e.g., ACD) to calculate ihese! This is be-cause this is an interesting area both for selectivity, and also for robust experiments.
45
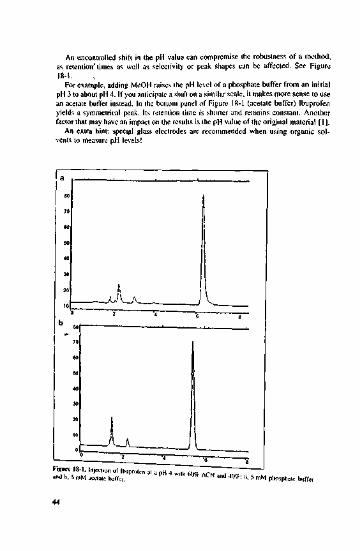
An uncontrolled shift in the pH value can compromise the robustness of a method,as retention" times as well as selectivity or peak shapes can be affected. See Figure18-1.
For example, adding MeOH raises (he pH level of a phosphate buffer from an initialpH 3 to about pH 4. If you anticipate a shift on a similar scale, it makes more sense to usean acetate buffer instead. In the bottom panel of Figure 18-1 (acetate buffer) Ibuprofenyields a symmetrical peak. Its retention time is shorter and remains constant. Anotherfactor that may have an impact on the results is the pH value of the original material [1],
An extra hint: special glass electrodes are recommended when using organic sol-vents to measure pH levels!
figure 18-1. Injection of Ibuprofen at a i>H 4 u.-;th ww/ Aami b. 5 mM .cam boftV. * ACN and 4()%: ;1- 5 mM phosphate buffer

-*<v 12
MAX 270
MAX 266
MAX 258
MX 245
Ay
\
\
I
J
1
L
1
1
/
f
\
\
\
\
\
\
\
\\,
Figure 19-1. pH dependence of the UV absorp-tion from L-ascorbic acid,
240 290 340 390Wavelength (nm)
One last hint:If you make coffee at 8:30 a.m. and put it in a thermos flask it will still be quite
drinkable at 11:00 a.m.. whereas coffee prepared at the same time but kept on thewanning plate of a coffee machine is an acquired taste, because of a whole host ofcarbonic acids that develop - quite a challenge for the tastebuds and the stomach.From coffee back to sample preparation: if the sample solution is left to stand forsome time, even at a normal temperature, the pH value and with it the chromatogrammay change, so please check the consistency of your pH!

Tip No.1 9
An unintentional pH shift and its consequences
Problem/QuestionAn unintentional pH shift in the eluent is one of the main reasons for a lack of ro-
bustness in RP chromatography. In Tip No. 18 we were discussing the causes and theextent of such a pH shift. Now we are looking in more detail at the changes in peaksize.Solution/Answer
A pH shift can lead to a variation in signal intensity (peak area), as the UV absorp-tion of ionisable compounds can be affected by the pH value. Figure 19-1 shows thespectrum of L-ascorbic acid at different pH values. When we look at the pH rangerelevant to HPLC, namely pH 2 to 9. we can see. for example, a smaller peak al240 nm in Ihe alkaline. At pH 5 it would be considerably higher, somewhat smaller atpH 4, and in an acidic medium (pH 2) it would reach its highest level. Now let uslook at Figure 19-2, the pH dependency of the UV spectrum of three barbiturates.Considering the absorption spectra at 240 nm for pH 6.0 and 7.7: the difference insignal intensity is enormous for barbital, small for thiogenal and minimal for phenpro-
ConclusionThe peak area can change as a result of .in intentional (method optimization) or an
unintentional pH shift. This may affect the individual peaks within the same chroma-togram in different ways. In this context, I just want to remind you that the pH valuealso depends on the temperature. However, now let us look on the bright side - thepH value can also be used as a tool to improve the detection limit in trace analysis.
Here are some of the effects a pH shift can have:• A change in interaction results in a change in retention time. Keep the possibility
of a reversal in the elulion order in mind!• A change in the kinetics, resulting in tailing.• Prototropic equilibrium of interconvertable isomers: one substance may appear as
two peaks. This may change with pH. Example: pro! ine-con lain ing molecules suchas captopnl.
• Chemical change in the original component, yielding new substances and severalpeaks. In these cases, one should also remember that the stationary phase couldalso have a catalytic effect. For example, silica gel is popular as a solid catalyst inorganic synthesis.
• Suppose a basic eluent contains methanol. This makes the eluent even more basic.As a result, the silica gel also dissolves more quickly and thus reduces the lifetime
Tip NO. RP separations in the alkaline medium
2 0
Problem/QuestionAn RP separation at a pH value of, say, between 7.5 and 9.5 is no fun. Suppose
that for selectivity reasons an alkaline pH value and a column based on silica gel in-stead of polymer gels is required. Depending on the column type, this may have agreater or lesser impact on the longevity of the column, and the robustness of the re-sults may also be affected. Wfcat is to be done?
Solution/AnswerIf you are tied to an SOP, then just do what you are told, there is no room for dis-
cussion. If, however, you are allowed some freedom, then you could consider the fol-lowing measures (the simplest ones are marked with an x).- Column
• Strongly hydrophobic phases with a high surface coverage above 2.5 umol m"2are fairly stable in an alkaline medium.
• Hybrid phases, e.g., the XTerra-series.• Phases with bridged bonding, e.g., Zorbax Extend.• A phase with a polymer layer, e.g., Gromsil CP or SMT OD Cm.
- Eluent• Use organic buffers instead of phosphate buffers. TRIS or borate buffers fit the
bill.• If you have to use phosphate buffers, make sure it is Li, Na or K. Avoid NH4-
salts!• Eluents containing ACN are usually gentler to the column than those containing
MeOH.• The salt concentrations {ionic strength) in the eluent should be kept to a mini-
mum.- Other measures
x • Use a conditioning column (saturation column) between the pump and injec-tor: see Tip No. 07/1.
x • Keep the temperature below 40 °C wherever possible.x • Even if only a minimal decrease of the pH level can be achieved this will
have a positive effect not only on the lifetime of the column but also on thereproducibility of retention times. Find out whether the separation could per-haps also be done at pH 7.8 instead of pH 8.3!
x • Finally, flush the column with MeOH/H2O or ACN/H2O, weakly acidic (pHx 34) for storage.

—pH 6.0pH 7.7
Thiogenal
210.0 <* 250.0 310.0 350.0Wavelength {nm)
Figure 19-2. pH dependence of ihe UV abscrpiion :.pectra for three barbiturates. Comments see text.
Tip NO. Separation of basic and acidic compoundsO -I contained in the same sample
Problem/QuestionA variety of state-of-the art columns are now available that are perfectly suited to
the separation of strongly basic analytes. By contrast, when it conies to the separationof strong acids, returning to non-endcapped classics is usually advisable. As a rule ofthumb we can say: •1. For strongly basic analytes (i.e., in protonated form) RP phases with good coverage
and low in silanol activity should be used combined with an alkaline cluent. Seealso Tip No. 4.
2. For weaker organic bases thai have a pronounced organic character (in the undisso-ciated form) use phases as in I combined with an acidic eluent.
3. For weaker acids (undissociated) use phase antj eluent as in 2.4. For stronger acids (dissociated) use silanophilic polar Rp phases combined with a
(strongly) acidic eluent.What if a sample contains basic as well as acidic compounds?
Solution/AnswerIn this case, the answer is less clear-cut. As I mentioned before, non-endcapped si-
lanophilic materials can be useless for strong bases, resulting in pronounced peak tail-ing or even irreversible adsorption onto the stationary phase. Conversely, materialswith good coverage tend to yield strongly tailing peaks if very acidic components arcinjected; see Figure 21-1, injection of the highly acidic phthalic acid on two state-of-the-art well-covered ds-materials. The few still remaining silanol groups form hydro-gen bridges with acids. This in itself would not be worrying, the only snag is that dueto the scarcity of silanol groups in these well-covered state-of-the-art materials, thekinetics are slowed down (cause: overloading). Thus, tailing becomes inevitable.
In this case one should either resort to endcapped classics, which still contain aconsiderable number of silanol groups, or use modern phases of medium polarity. Thedissociation status of the silanol groups and the analytes is crucial and can bemanipulated by choosing the appropriate pH value of the eluent.
Take a buffer of low acidity, around pH 4, and change its pH value by 0.5 pH unitsup or down. Columns that have sufficient polarity as well as hydropliobic propertiesshuuld be used, e.g., LiChrospher, Spherisorb ODS 2, Zorbax ODS, Prontosil ACE,Purospher, MP-Gel or AQUA.
ConclusionSuitm cuique ~ each to his own, and don't ignore each other's idiosyncrasies - is a
good motto in real life as well as in HPLC ...

ConclusionJust one or two of the measures mentioned above could noticeably lengthen the
lifetime of your column. However, it is usually not worth going to extreme lengthsjust to prolong the life of a column. After all, the price of a column makes up a smallpercentage of the entire cost of an analysis, in the region of 1-2%: but then again, ifit helps to achieve a robust method, it is certainly worth the trouble.
50
1.3 Optimization, Peak Homogeneity
np NO. The peaks appear too soon - what can be done?
2 2
Problem/QuestionSuppose that in an RP system (C|H, ACN/phosphate buffer 30/70) a peak appears
too soon and you are not even sure if it is just OIK single peak - there could be morelurking behind it. It would appear that you are dealing with one or more highly polarcompounds. What can you do to increase their retention time?Solution/Answer
1. Modify the chromatographic parameters - use a longer column, slow down theflow and/or decrease the temperature. This can all be done fairly quickly, whateverthe specific separation problem may be.
2. Modify the stationary phase:• Use a material with a smaller pore diameter, e.g., Si 60 A instead of Si 120 A,
which increases the specific surface area and hence also interaction.• Use non-endcapped material.
The (supposedly) ionic components can now interact with free silanol groupsand thus elute later. The likely drawback would be some [ailing.
• Either use polar phases that have the ability to interact but are free of active si-lanol groups, which could cause annoying tails, or use phases with a large num-ber of active silanol groups that speed up the kinetics. Suitable phases for polaranalytes are, e.g., Zorbax SB Cs. Fluofix, SynergiPOLAR RP, perhaps also phe-nyl, nitrile or diol (see also Tip No. 6).
3. Modify the eluent - increase the water content, lower the buffer capacity, changethe pH value (by far the most effective parameter!), add ion-pair reagents.
4. Combination of options 2 and 3.Be bold when choosing a stationary phase and an eluent for strongly ionic compo-nents. For example,• 30% acetic acid with a C8 phase.• 100% H2O with a diol phase.• Phosphate buffer + lOOmMol heptane sulfonic acid, pH around 2 with a non-
endcapped C|S-phase.• Borate buffer, pH around 9 with an endcapped CiR phase with high coverage(more than 2.5 uMol rrf2) or a polymer-based stationary phase; see also TipNo. 5.

>s.u|d j;, .-ii sppo SUOJK jo sadEip yoj -,-,7 3jn8ij
Tip NO. What can I do if the peaks elute late?
2 3
Problem/QuestionYour separation yielded a good resolution - now your next question could or
should be "What is the most irouble-free way of reducing the analysis time?"
Solution/AnswerEasy - simply increase the flow! I know, many of my readers think this a trivial
answer. So it is, but 1 think it is still worth pointing it out in a world where far toomany protocols just stipulate, "flow 1 mLmin"1". Increasing the flow always savestime and sometimes even improves the resolution. Apart from the smaller peak areas,the disadvantages are negligible.
Here is why -Isocratic separation: Increasing the flow means saving time without noticeably re-
ducing efficiency (theoretical plates), as today's spherical 5 or 3 urn particles have avery flat van Deemter C-term. The number of theoretical plates remains high, espe-cially for real substances, i.e., if the peaks elute significantly later than an inert com-ponent. This has often been described in the literature as well as being confirmed bymy own measurements.
Here are two simple examples.Figure 23-1 shows the separation of four components on a 5 um column at a flow
rate of between 2 and 0.5 mLmin"1. Is the separation at I mL min~' really signifi-cantly better than at 2 mL min"1?
Figure 23-2 shows another separation at 2 mLmin""1, and the same separation inFigure 23-3 at a flow rate of I mL min"1. Again, the improvement due to the reducedflow rate is only marginal.
If a major improvement is to be achieved, a really low flow rate must be chosen.Figure 23-4 shows the separation from the previous example at a flow rate of0.2 mL min"1. Peaks one and two are barely separated at 2mLmin~\ and quiteclearly at 1 mLmin"1, and at 0.2 mLmin"1, they are base-line separated. It dependsvery much on the individual case whether it is worth putting up with the excessiveanalysis time.
Gradient separation: Increasing the flow means saving time and/or an improvedresolution.
At a constant gradient time /Gr. an increased flow rate F results in an increasedgradient volume, VGr (VGl=Fx/Gr). and thus in an increase in peak capacity. As morepeaks can be separated per unit time, resolution increases; or an increase in flow by afactor of 2 and a simultaneous reduction in gradient time, also by a factor of 2, yieldsthe same separation at an analysis time which is reduced by a factor of 2.
Figure 23-5 shows a separation using a linear gradient at a flow rate of 1, 1.5 and2 mL min"' (flow increasing from lop to bottom). While the separation takes 2.5 min

ConclusionThe most effective way of dealing with the problem at hand is through modifying
the pH value, while changes in buffer strength, ion pair concentration and stationaryphase only come second. If chromatography is to be carried out in a strongly alkalinemedium on a silica gel-based column, state-of-the-art phases with high coverage,polymeric phases or hybrid materials are recommended because of their stability inthis range, see Tip No. 20.

Figure 23-2. Separation of five compounds at
at 2 mL min~\ it requires 4.6 min at 1 mL min '. At all flow rates, the resolution be-tween peaks remains practically the same.
What about the drawbacks? If you are not dealing with trace analysis, I do notthink they really matter.1. Will the increased pressure shorten the lifetime of the column?
The usual RP column withstands pressures of 300-350 bar without any ill effects.Just set the high-pressure limit on your pump to 4000 psi (1 bar= 145.038 psi).Besides, does it really matter if you use up four columns instead of three per yearif you can save a significant amount of time?
2. Will the injector and pump seals wear out more quickly?Well, yes, you may have to spend a few cents more on them...
3. What if the column connection begins to leak when the pressure rises above 200bar?In my opinion the time saving effect is such an overriding benefit that I would nothesitate to replace PEEK capillaries with steel ones.

I100:
A-0
AS
2; 6
Time (min)FiKure 23-1. Separation of four compounds on a 5 jim column at flow rates of between 2 and0.5 mL min . Comments sec text.
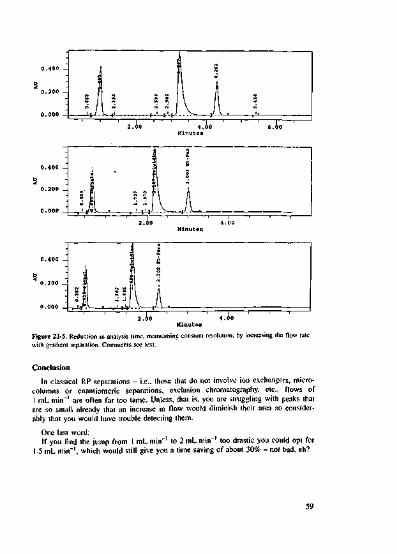
0.000 _2.00
MinutesFigure 23-5. Reduction in analysis time, maintaining constant resolution, by increasing the How ratewith gradient separation. Comments sec text.Conclusion
In classical RP separations - i.e., those that do not involve ion exchangers, micro-columns or enantiomeric separations, exclusion chromatography, etc., flows of1 mL min"1 are often far too tame. Unless, that is, you are struggling with peaks thatare so small already that an increase in flow would diminish their area so consider-ably that you would have trouble detecting them.
One last word:If you find the jump from 1 mL min"' to 2 mL min"1 too drastic you could opt for
i .5 mL min"1, which would still give you a time saving of about 30% - not bad, eh?

Figure 23-3, Separation of five compounds ai I ml. min . Comments sec text.
Figure 23-4. Separation of five compounds ai 0.2 mL min"1. Comments sec text.
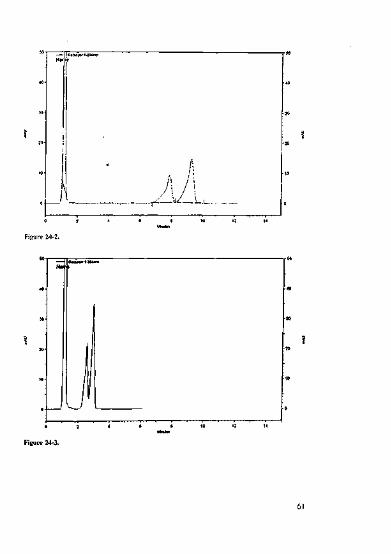
t Fisure 24-2.
i / L _ _
R 10 12
Figure 24-3.
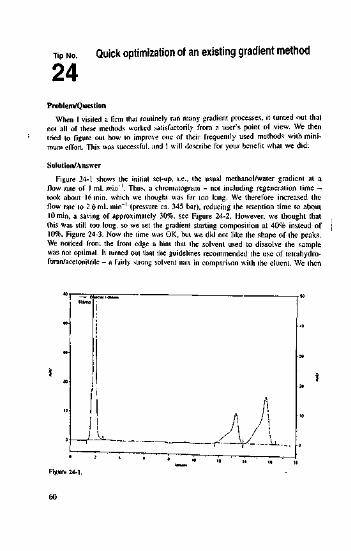
Tip NO Quick optimization of an existing gradient method
2 4
Problem/Q uestionWhen I visited a firm that routinely ran many gradient processes, it turned out that
not all of these methods worked satisfactorily from a user's point of view. We thentried to figure out how to improve one of their frequently used methods with mini-mum effort. This was successful, and I will describe for your benefit what we did:Solution/Answer
Figure 24-1 shows the initial set-up, i.e., the usual methanol/water gradient at aflow rate of 1 mLmin"'. Thus, a chromatogram - not including regeneration time -took about 16 inin. which we thought was far too long. We therefore increased theflow rate to 2.6 mL inin"1 (pressure ca. 345 bar), reducing the retention time to aboutlOmin, a saving of approximately 30%, see Figure 24-2. However, we thought thatthis was still too long, so we set the gradient starting composition at 40% instead of10%. Figure 24-3. Now the time was OK, but we did not like the shape of the peaks.We noticed from the front edge a hint that the solvent used to dissolve the samplewas not optimal. It turned out that the guidelines recommended the use of tetrahydro-furan/acetonitrile - a fairly strong solvent mix in comparison with the eluent. We then
Figure 24-1.
60

Tip NO. Increasing efficiency -often the fast track to success
2 5
Problem/QuestionIt should be slated at the onset that the most important and safest way of improv-
ing chromatographic resolution is increasing selectivity. The following examplesshould clarify this statement.
For a separation factor of 1.01, 160000 theoretical plates are needed to elute twobaseline-separated peaks. If, with the help of pH value, modifier, etc., you can im-prove the separation factor to 1.05, only 6000 plates are needed, at 1.10, 1940 platesand at a separation factor of 1.20 no more than 575 plates.
When the separation factor is raised, e-g., from i .05 to 1.10, then the improvementin the resolution is by a factor of 2. See also Chapter 3.2.
Suppose you have been experimenting with a given separation and reached someresolution that you still find is insufficient. Should you try to continue to increase se-lectivity, or are there other ways of achieving the desired resolution?
Solution/AnswerSuppose you achieved a separation factor a of 1.1, but you are still not happy with
the resolution. This can only mean that your peaks are too broad (poor efficiency)and resolution needs to be improved. You have now two options to achieve this:1. You try to improve selectivity further by modifying the chromatographic condi-
tions, such as column, eluent, etc. As 1 said before, this can be rather tedious (im-proving resolution via selectivity).
2. You leave the chromatographic conditions and thus the selectivity unchanged buttry to increase efficiency, i.e., the plate number. This often proves to be the quickerway (improving resolution via efficiency).Let me give you two examples.The left panel of Figure 25-1 shows the separation of tricyclic antidepressants on
Luna C]8, 5 jam, in an acidic acetonitrilc buffer. The a-value (separation factor) be-tween peaks 3 and 2 is 1.05. In this case, improving selectivity is not a trivial task ittakes time and some genius. On the right of Figure 25-1 you see a separation of thesame material on a 3 |im column.
While selectivity remains nearly the same at a =1.04, baseline separation is almostachieved. The increase in pressure to 230 bar does not pose a significant problem.
The left panel of Figure 25-2 shows the separation of chrysene and perylcne on Sym-metry C18 in methanol. The a-value is 2.13, but the peak shape is nothing to write homeabout. If you replace the capillary that connects the injector with the column by a thinnerone, you can reduce the dead volume within the instrument and achieve a somewhat bet-ter separation at an almost identical separation factor of 2.10. By the way, once I hadmade up my mind, the second improvement was done in 70 s!
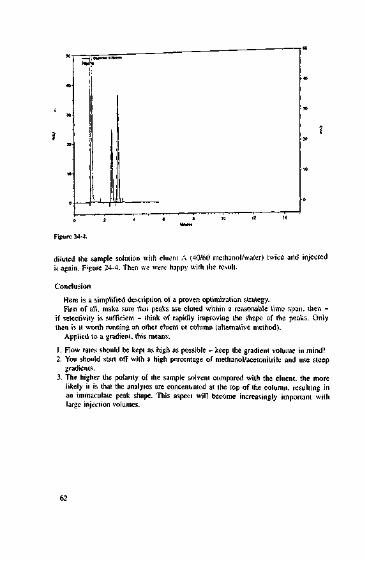
diiuted the sample solution with eluent A (40/60 methanol/water) twice and injectedit again. Figure 24-4. Then we were happy with the result.
ConclusionHere is a simplified description of a proven optimization strategy.First of all, make sure that peaks are eluted within a reasonable time span, then -
if selectivity is sufficient - think of rapidly improving the shape of the peaks. Onlythen is it worth running an other eluent or column (alternative method).
Applied to a gradient, this means:1. Flow rates should be kept as high as possible - keep the gradient volume in mind!2. You should start off with a high percentage of methanol/acetonitrile and use steep
gradients.3. The higher the polarity of the sample solvent compared with the eluent, the more
likely it is that the analytes are concentrated at the top of the column, resulting inan immaculate peak shape. This aspect will become increasingly important withlarge injection volumes.
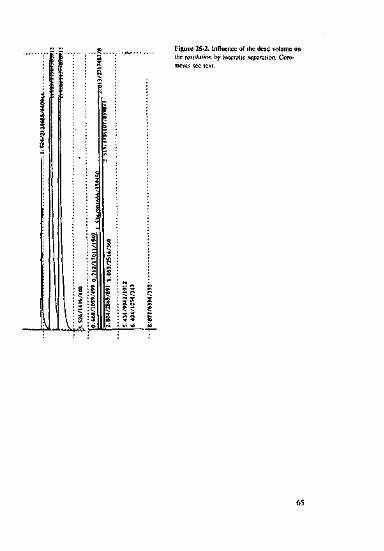
Figure 25-2. Influence of the dead volume onthe resolution by isocratic separation. Com-ments see text.

Figure 25-1. Influence of (he particle size on resolution using the sus. Comments sec
ConclusionIf the retention time and the selectivity are acceptable but the resolution is not, aim
for maximum efficiency ~ in other words, make the peaks narrower - before you tryout more laborious ways of optimizing your separation.
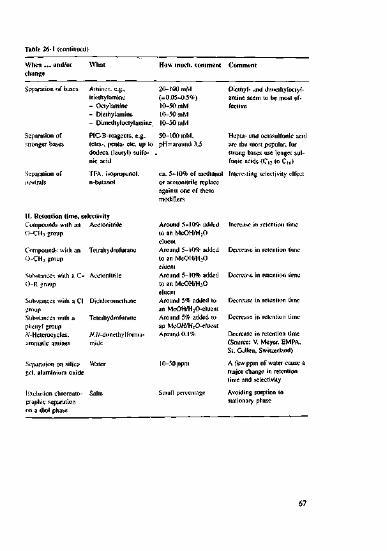
Table 26-1 (continued)When ... und/orchange How much, comment Comment
Separation of bases
Separation ofstronger bases
Separation ofneutrals
Amines, e.g.,triethylamine- Octylamine- Dieihylamine- Dimethyloctylamin
20-100 mM(=0.05-0.5%)10-50 mM10-50 mM10-50 mM
PIC-B-reagents. e.g.. 50-100 mM,ictra-, penta- elc, up lo pH = around 3.5dodeca (lauryl) sulfo- ,nic acid
Diethyl- and dimethyloctyl-amine seem to be most ef-fective
Hepla- and oclasulfonic acidare (tie most popular, forsirong bases use longer sul-fonic acids (C,2 to Cl6)
TPA, isopropanol.n-buta-iol
II. Retention lime, selectivityCompounds with an AcetonitrileO-CHi groupCompounds with an TetrahydrofuraneO-CH., groupSuhstances with a C- AcetonitrilcO-R groupSubstances with a Cl DicliloromethancgroupSubstances vviih a Tcirahydrofuranepheny] group/V-Heterocycles, AUV-dimethylfomiu-uromatic amines midc
Separation on silica Watergel. aluminium oxide
Kxdusion chromato- Saltsgraphic separationon a diol phase
ca. 5-10% of methanol Interesting selectivity effector acetonitrile replaceagainst one of thesemodi Tiers
Around 5-10% addedio an MeOH/HzOelueniAround 5-10% addedto an MeOH/H;>OelucntAround 5-10% addedto an MeOH/H:OelucntAround 5% added Ioan MeOH/H2O-eluentAround 59c added toan Me0H/H2O-eluentAround 0.1%
10-50 ppm
Small percentage
Increase in retention time
Decrease in retention lime
Decrease in retention timeDecrease in retention time(Source: V. Meyer, EMPA.St. Gallen, Switzerland)A few ppm of water cause amajor change in retentiontime and selectivityAvoiding sorption tostationary phase
67
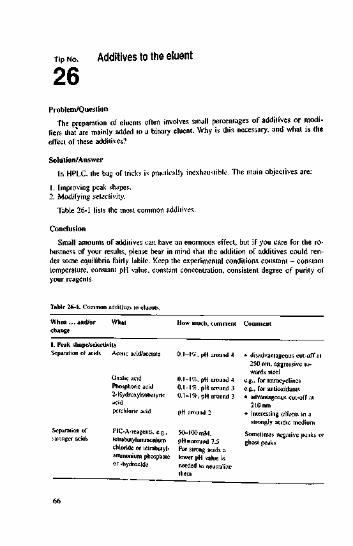
Tip No.2 6
Additives to the eluent
Problem/QuestionThe preparation of eluents often involves small percentages of additives or modi-
fiers that" are mainly added to a binary eluent. Why is this necessary, and what is theeffect of these additives?Solution/Answer
In HPLC. the bag of tricks is practically inexhaustible. The main objectives are:). Improving peak shapes.2. Modifying selectivity.
Table 26-1 lists the most common additives.
ConclusionSmall amounts of additives car. have an enormous effect, but if you care for the ro-
bustness of your results, please bear in mind that the addition of additives could ren-der some equilibria fairly labile. Keep the experimental conditions constant - constanttemperature, constant pH value, constant concentration, consistent degree of purity ofyour reagents.
Table 26-1. CommoWhen... and/orchange
n additives to eluents.What
1. Peak shape/selectivitySeparation of acids
Separation ofstronger acids
Acetic acid/acetate
Oxalic acidPhosphoric acid2- H y d roxy i sobu lyricacidperchloric acidPlC-A-reagenls, e.g.,tetrabutylainmoniumchloride or tetrabutyl-ammonium phosphateor -hydroxide
How much, comment
0.1-1%, pH around 4
0.1-1%, pH around 4O.M9,pHanuind30.1-1%. pH around 3pH around 250-100 mM.pH=around7.5For strong acids alower pH value isneeded to neutralizethem
Comment
• disadvantageous cut-off at250 nm, aggressive to-wards steele.g.. for tetracyclines
e.g., for antioxidants• advantageous cut-off at2l0nm
• interesting effects in astrongly acidic medium
Sometimes negative peaks orghost peaks
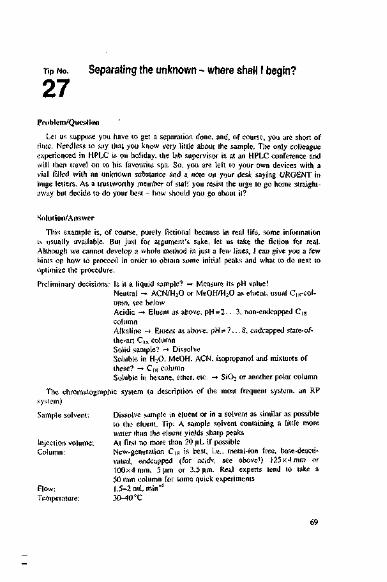
Tip NO. Separating the unknown - where shall I begin?
2 7
Problem/QuestionLet us suppose you have to get a separation done, and, of course, you are short of
time, Needless to say that you know very little about the sample. The only colleagueexperienced in HPLC is on holiday, the lab supervisor is at an HPLC conference andwill then travel on to his favourite spa. So, you are left to your own devices with avial filled with an unknown substance and a note on your desk saying URGENT inhuge letters. As a trustworthy member of staff you resist the urge to go home straight-away but decide to do your best - how should you go about it?
Solution/AnswerThis example is, of course, purely fictional because in real life, some information
is usually available. But just for argument's sake, let us take the fiction for real.Although we cannot develop a whole method in just a few lines, I can give you a fewhints on how to proceed in order to obtain some initial peaks and what to do next tooptimize the procedure.Preliminary decisions: Is it a liquid sample? -* Measure its pH value!
Neutral -• ACN/H2O or MeOH/H20 as eluent, usual Cm-col-umn, sec belowAcidic -* Eluent as above, pH=2-. -3. non-endcapped Ci«columnAlkaline ~> Eluent as above, pH=7... 8, endcapped state-of-the-art Cls columnSolid sample? -» DissolveSoluble in H2O, MeOH. ACN, isopropanol and mixtures ofthese? -» C)8 columnSoluble in hexane, ether, etc. -* SiO2 or another polar column
The chromatographic system (a description of the most frequent system, an RPsystem)Sample solvent: Dissolve sample in eluent or in a solvent as similar as possible
to the eluent. Tip: A sample solvent containing a little morewater than the eluent yields sharp peaks
Injection volume: At first no more than 20 uL if possibleColumn: New-generation C]S is best, i.e., metai-ion free, base-deacti-
vated, endcapped (for acids, see above!) 125x4 mm or100x4 mm, 5 j.im or 3.5 urn. Real experts tend to take a50 mm column for some quick experiments
Flow: 1.5-2 mL min"'Temperature: 30-40 X

Table 26-1 (continued)How much, comment Comment
HI. OtherSeparation of com- Ethyldiamincurtra- 10-20 mMpounds that form acetate (EDTA)complexesPreventing growth Sodium acid 0.05-0.1%of fungiIn siiu endcitpping: Trirnetiiylchlorosilane Lower per mL rangeMocks activity of iTMS) 'silanol groups inRP columns andon glass surfaces
EDTA forms complexes withmetal ions (steel, stationaryphase)NaN3 elmes with the front inan RP systemPrevention of uncontrolledsorption of bases or large po-lar molecules (e.g.. proteins)

ConclusionIt is very rare indeed to have as little information about a sample as in the situation
described above. In any case, you should try and retrieve as much information as pos-sible from the following sources: internal/external customers, internal/external litera-ture databases, internet, manufacturer brochures, etc. They might just give you a firsthint.
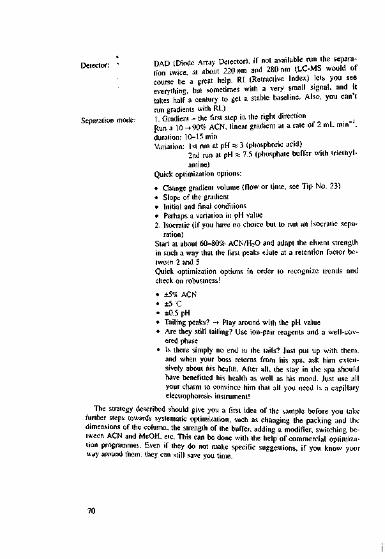
Detector • DAD (Diode Array Detector), if not available run the separa- ition twice at about 220 nm and 280 nm (LC-MS would ofcourse be a great help. RI (Retractive Index) lets you seeeverything, but sometimes with a very small signal, and ittakes half a century to get a stable baseline. Also, you can'trun gradients with RI.)
Separation mode: 1. Gradient - the first step in the right direction ]Run a 10 -• 90% ACN, linear gradient at a rate ol 2 tnL mm ,duration: 10-15 minVariation: 1 st ran at pH a 3 (phosphoric acid)
2nd run at pH « 7.5 (phosphate buffer with triethyl-amine)
Quick optimization options:• Change gradient volume (flow or time, see Tip No. 23)• Slope of the gradient• Initial and final conditions• Perhaps a variation in pH value2. Isocratic (if you have no choice but to run an isocratic sepa-
ration)Start at about 60-80* ACN/HiO and adapt the eluent strengthin such a way that the first peaks elute at a retention factor be-tween 2 and 5Quick optimization options in order to recognize trends andcheck on robustness!• ±5% ACN• ±5 C• ±0.5 pH• Tailing peaks? -> Play around with the pH value• Are they still tailing? Use ion-pair reagents and a well-cov-
ered phase• Is there simply no end to the tails? Just put up with them.
and when your boss returns from his spa, ask him exten-sively about his health. After all, the stay in the spa shouldhave benefittcd his health as well as his mood. Just use allyour charm to convince him that all you need is a capillaryelectrophoresis instrument!
The strategy described should give you a first idea of the sample before you takefurther steps towards systematic optimization, such as changing the packing and thedimensions of the column, the strength of the buffer, adding a modifier, switching be-tween ACN and MeOH, etc. This can be done with the help of commercial optimiza-tion programmes. Even if they do not make specific suggestions, if you know yourway around them, they can still save you time.
70
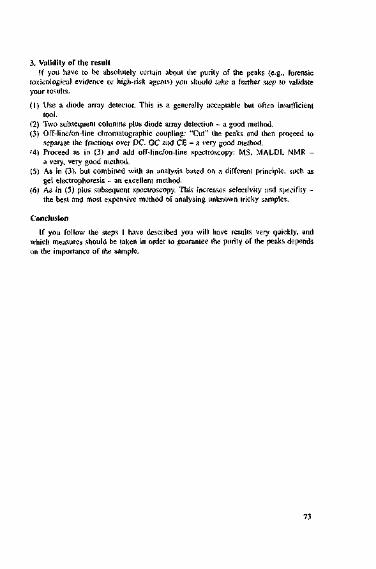
3. Validity of the resultIf you have to be absolutely certain about the purity of the peaks (e.g., forensic
toxicological evidence or high-risk agents) you should take a further step to validateyour results.(1) Use a diode array detector. This is a generally acceptable but often insufficient
tool.(2) Two subsequent columns plus diode array detection - a good method.(3) Off-line/on-line chromatographic coupling: "Cut" the peaks and then proceed to
separate the fractions over DC. GC and CE - a very good method.'4) Proceed as in (3) and add off-line/on-line spectroscopy: MS, MALDI, NMR -
a very, very good method.(5) As in (3), but combined with an analysis based on a different principle, such as
gel electrophoresis - an excellent method.(6) As in (5) plus subsequent speclroscopy. This increases selectivity and specifity -
the best and most expensive method of analysing unknown tricky samples.
ConclusionIf you follow the steps I have described you will have results very quickly, and
which measures should be taken in order to guarantee the purity of the peaks dependson the importance of the sample.
73

Tip No.Separation of an unknown sampleusing a reversed-phase C18 column -how do I go about it?
Problem/QuestionSuppose you want to separate a sample you know very little about, and you are
using an RP Cl8 system. How do you choose the chromatographic conditions? Thislime. I want to give you a different point of view from that in Tip No. 27.
Solution/AnswerIn the following, I will give you rough guidelines which may be adapted to indi-
vidual circumstances.1. Basic requirements• The sample should be at least partly soluble in the eluent (H2O/MeOH or H2O/
ACN).• For isocratic separations the molecular weight should not exceed 600.• For gradient separations the molecular weight can be much higher. If you do not
know the molecular weight, you could use the following trick: elution before /M(dead time) means that the sample is being excluded because the molecules in thesample are too large or their charge density is too high - see Tip No.73. Elutionafter fM means that the molecules can diffuse into the pores.
• Where can the compounds be detected? Find the appropriate wavelength.• Stability of the sample solution? Store a sample solution at room temperature for
24 h and in the refrigerator for 24 h. Then inject both samples and compare thechromatograms.
• Measure the pH in order to be able to choose a vaguely appropriate column foracidic/basic/neutral components.
2. The chromiitographic set-up• The sample solution is neutral: simply take a good C!S column (3-4 mm, 100-
125 mm) Gradient: 10 to 90%, H2O/ACN at 2 mL min"1 and 30-40 C.• The sample solution is acidic: take a good Cl8-column (see above). Eluent: H2O/
ACN about 40/60 w/w, pH ^ 3-3.5 (e.g., phosphoric, acetic or perchloric acid).For a very acidic solution, choose a polar, non-endcapped column. Eluent: HiO/ACN plus tetrabutyl ammonium chloride or tetrabutyl hydrogen sulfate, ca. 2 g L"1eluent.
• The sample solution is basic: state-of-the-art C,s-phase with excellent or even dou-ble endcapping, free of metal ions, protected phase, etc. Eluent: H2O/ACN, seeabove, plus diethylamine or triethylamine, about 2 mL L~' of eluent.
• For a strongly alkaline solution, eluent: H2O/ACN plus about 50-70 mM hexane orheptane sulfonic acid.In a second step, put the usual optimization procedures i
the eluent, buffer and ionic strength, temperature, etc. place, such as varying

After the first run you will have a rough idea of how many peaks are in the sam-ple. The gradient can then be slightly varied depending on the circumstances (e.g..initial and final ACN concentration, gradient slope, etc.) so that all peaks elute withina reasonable time span. It should take you 1.5 h to run an "overview" gradient. If youalso try MeOH and/or a basic medium you would need about 3 h - everything run-ning smoothly, that is. If you began your work at 8.30 a.m. you should have finishedat 11.30 a.m. To be on the safe side, let us say 12.30 p.m.
Using your column-switching valve and timing the column switching using yoursoftware, run this roughly optimized eluent (or, if necessary, the corresponding iso-craiic mix) on the six columns linked to the valve. The time needed is about 30 minper column or 3h overall. Meanwhile, you might as well go out for lunch, have anice cup of coffee and get on with the rest of your work while the columns run on.tulopilot.
Now comes the crucial question - which six columns should you choose to run thisfust experiment?
Have a look at Tables 29-1 and 29-2. Table 29-1 lists phases that cover a variety ofretention mechanisms in RP HPLC. Table 29-2 covers a wider range from hydropho-bic to polar RP phases, listing some typical examples. The columns listed are exam-ples of suitable types rather than recommendations.
Comments on the choice of columns:Obviously, the composition of your column portfolio depends on the task at hand.
Thus, the number of polar phases in Table 29-1 could be reduced in favour of additionalhydrophobic phases. If you know, for example, that the sample consists of neutral organ-ic molecules, you could leave out non-endcapped polar phases. Conversely, if you knowthat you have components of similar polarity but differing in structure, classical hydro-
Tabie 29-1. Various types oF RP phases ISelectivity characteristic Examples of columns Characteristic feature of columnSieric aspect Jupiter
Nucleosil 50Hydrophobic surface Luna
Gromsil CPi:rce silanol groups Spherisorb ODS 1
Zwtoax ODSPolar group in (he alkyl chain HyPURlTY Advance(embedded phases) Prontosil ACEStrongly polar surface SyncrgiPOLAR RP
Platinum EPSee choice according io needs e.g.,
HyperearbFluollx 1EW/INWXTerra MS, etc.
Large pore diameterSmall pore diameterClassical coveragePolysiloxane layerAcidic silanol groups and low coverageAcidic silanol groups and high coveragePolar embedded phasehydrophobic embedded phaseShort alkyl chain, built-in polar group,polar end group, hydrophitic endcap-pingPolar groups at the surface
Very hydrophobicVery hydniphilic. fluorine atomsHybrid material, etc.
Tip No.2 9
Developing an RP separation - the two-day-method
Part 1: Choice of column and cluentHypothesis: Is it realistic to expect to have developed 80% of a method within two
working days? Let us look at the following - fictional - example!
Problem/QuestionYour boss conies into your lab on a Tuesday morning in a state of panic. He gives
you an extremely important sample he got straight from the research lab. He imploresyou to do a separation before tomorrow night because he is going overseas on Thurs-day morning and urgently needs information about the number of components in (hesample. So he wants you to pull qualitative analysis out of your hat. and as he isusually such a nice guy and not in the habit of making unreasonable requests, you aregoing to give it your best shot. How would you go about it?
Solution/AnswerWe all know that there is more than one way to skin a cat. 1 will restrict myself to
just one possibility.You need at least:
• A gradient separation instrument with diode array detection (DAD)• A 6-way column-switching valve or ideally a 12-way valve• A collection of about 20 different RP columns
if you really don't know what is in the sample - which is rare in real life - or ifyou want to enhance your repertoire and flexibility - always a good thing to develop- the following requirements are recommended:• An additional detector, such as a refractive index or a fluorescence detector or even
LC-MS(MS)-coupling• A 3- or 6-way eluent switching valve - unless you have a low pressure gradient• A column oven with cooling capabilityProcedure
Run a 10% - 90% linear H2O/ACN gradient, e.g.. at 2 mL min1 and at a pH ofaround 3 (TFA. phosphoric or perchloric acid) over 20 min. There is nothing wron»wuh using your favourite type of C18 column, such as a 125 mmx4 mm, 3 or 5 urn.as long as it is a new one!
If you have the time, you should also consider the following variations.1. Try also an H2O/MeOH eluent!2 Run one gradient at a pH value of around 7.5 and combine 1 and 2.

ConclusionA column-switching valve is an effective time-saving tool when it co
ing columns. Overnight experiments are highly recommended. You can, ._. r._,find out in three overnight runs, which of 18 columns is best suited to deal with yourspecific separation problem - while you sleep!
)mes to choos-fou can, for example,
77
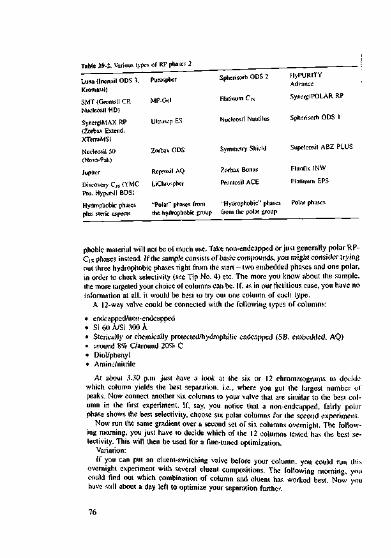
s types of RP phases 2Luna (Inertsil ODS 3, PurospherKromasil)SMT (Gromsil CP,Nucleosil HD)SynergiMAX RP(Zorbax Extend.XTerraMS)Nucleosil 50(Nova-Pak)JupiterDiscovery C,8 (YMCPro. HypcrsilBDSlHydropliobic phasesplus steric aspects
MP-GclUltrasep ES
Zorbax ODS
Reprosil AQLiChrospher
Spherisorb ODS 2
Platinum Cm
Nuclcosil Nautilus
Symmetry Shield
Zorbax BonusProniosil ACE
"Polar" phases from -Hydrophobic" phasesthe hydrophobic group from the polar group
HyPURlTYAdvance
SynergiPOLAR RP
Spherisorb ODS 1Supelcosit ABZ PLUSFluofix INWPlatinum EPS
Polar phases
phobic material will not be of much use. Take non-endcapped or just generally polar RP-C[« phases instead. If the sample consists of basic compounds, you might consider tryingout three hydrophobic phases right from the start - two embedded phases and one polar,in order to check selectivity (sec Tip No. 4) etc. The more you know about the sample.the more targeted your choice of columns can be. If, as in our fictitious case, you have noinformation at all, it would be best to try out one column of each type.
A 12-way valve could be connected with the following types of columns:• endcapped/non-endcapped- Si 60 A/Si 300 A• Sterically or chemically protected/hydrophilic endcapped (SB, embedded, AQ)• around 8% C/around 20% C• Diol/phenyl• Amine/nitrile
At about 3.30 p.m. just have a look at the six or 12 chromatograms to decidewhich column yields the best separation, i.e., where you got the largest number ofpeaks. Now connect another six columns to your valve that are similar to the besl col-umn in the first experiment. If, say, you notice that a non-endcapped, fairly polarphase shows the besl selectivity, choose six polar columns for the second experimcni.
Now run the same gradient over a second set of six columns overnight. The follow-ing morning, you just have to decide which of the 12 columns tested has the best se-lectivity. This will then be used for a fine-tuned optimization.
Variation:If you can put an eluent-switching valve before your column, you could am this
overnight experiment with several eluent compositions. The following morning, youcould find out which combination of column and eluent has worked best. Now youhave still about a day left to optimize your separation further.

Other fairly quick optimization methods for an isocratic run:• Use MeOH instead of ACN, perhaps also exchange about 5% of the organic phase
with THF, which will have intriguing effects on selectivity. See Tip No. 26-• Use a longer column or two consecutive columns - the ones that worked best in
the overnight experiments. See Tip No. 34.Of course, such optimization procedures can be carried out much more elegantly
and rapidly if you have an optimization programme and you are reasonably familiarwith it. However, even if your optimization skills are rather pedestrian, with a system-atic approach you should be able to achieve good results within a day (approx. 7 h).
ConclusionWith a concept such as the one described in Tips Nos. 29 and 30, perhaps modified
according to your needs, you can achieve a rough separation fairly quickly. If needed,further systematic fine-tuning can follow. Whether you need two or four days to de-velop your method - in any case, my advice would be:• Be intelligently lazy - the night will do the work for you...• This is the sequence to follow for the optimisation process:1. Aim for a reasonable retention time.2. When improving selectivity, try not to go overboard.1 Improve the peak shapes, which also gives you an indirect double-check on peak
homogeneity.

Tip NO Developing an RP separation - the two-day method
3 0
Part 2: Fine-tuning of the separationProblem/Question
Following the procedure in Tip No. 29, you have found the optimum column, andyou have around a day left for the fine-tuning of the separation. Where do you gofrom here?Solution/Answer
Suppose you have many peaks, thus you will probably continue to work with a gra-dient.1. Goal: Reasonable analysis time plus overall good separation
Options:• Increase/decrease the gradient volume - best done by changing the flow rate. See
Tips Nos. 23 and 24• Vary ihe initial and final conditions• Possibly change the slope and profile of the gradient or include an isocratic step
Time required: about 2 h.2. Goal: Improve selectivity
Options:• Vary pH value by ± 0.5 pH unils• Try out several organic modifiers, such as THF• Lower temperature to 1G-15 <JC
Time required about 3 h.3. Goal: Improve peak shapes
Options:• Increase the polarity of the sample solvent. See Tip No. 24• Check wavelength and other adjustable parameters and set them at their optimum.
See Tips Nos. 31-34• Inject a smaller amount of sample
Time required: about 2 h.If your overnight experiment yielded 3 lo 5 peaks that elute reasonably close to
each other, you should perhaps now try Lo run an isocratic separation. In principle,what I mentioned in 2 and 3 is also valid for isocratic separations.
• Reducing the injection volumeColumn overloading, and peak broadening as a result of this, is more commonthan you might think. The risk is particularly high with ionic or ionisable com-ponents. Simply inject 5 or 2 j.il instead of your normal 10 or 20 ul. If you get abetter resolution, then you know what the problem was.
• Change in wavelengthJust try your luck and inject the sample using two different wavelengths. If youhave a diode array, this can be done much more elegantly.
Incidentally, these are all measures that could be carried out without too much fusseven when you are tied by tightly regulated protocols.
Comment:Without question, LC-MS (MS) or perhaps LC-NMR are vastly superior methods.
but they belong to a different world.
ConclusionThe possibilities of testing the peak homogeneity pointed out above can be carried
out with minimum fuss, which is important nowadays where time is always at a pre-mium.

Tip No.3 1
Quick check on peak homogeneity
PartiProblem/Question
You have finally optimized your separation, and your peaks look acceptable. Nowthe question is how to make a quick eheck on the homogene.ly of the peaks. Qutckin this ease means that no major change is needed in hardware e 8.a ddnq, .c 1-umn-switching valve, or at a chemical level, such as ustng a different buffer. Th supand parts of Tips Nos. 32 and 33 give you simple measures that will only take a fewminutes. 15 inin at the most. Tip No. 34 will look at more labour-intens.ve methods.
Solution/Answer1. Change of settings . .
Of course changing the settings on the instrument will not improve selectivity, butthe peaks will become narrower. This will be particularly noticeable with earlypeaks. Some examples are given in Table 31-1.Changing the settings given in the table is a matter of seconds. Try it out, and youwill be surprised how narrow your (early) peaks can become, and it is quite possi-ble that you will discover one or two more small peaks as shoulders on others.
2. Small changes in the chromatographic set-up• Reducing the flow rate
In 10 urn columns, which are quite often chiral columns, reducing the flow rateby 1.2 or 1 mL min~' to 0.8 or 0.7 mL min~' can significantly improve a separa-tion. However, in 5 um, not to mention 3 urn columns, one would have to reducethe flow quite drastically (as low as 0.3 or even 0.2 mL mirf1) to achieve a no-ticeable effect: see Tip No. 23.
• Concentrating the sample at the column inletDissolve ihe sample in 70-80% water in a reversed-phase system. The remain-der should be the organic component of the eluent. The peak shape improves.
Response lime, rise time, time constant,see Tip No. 68.Sampling time, sample ratePeak width, see Tip No. 34/1Slil width of the diode arrayDetector output
Increase to 4 lo 5 data points per secondDecrease to 0.01 minLarge slit widih lowers the detection limitInstead of using the 1 V output, use ihe 100or even better the in mV output
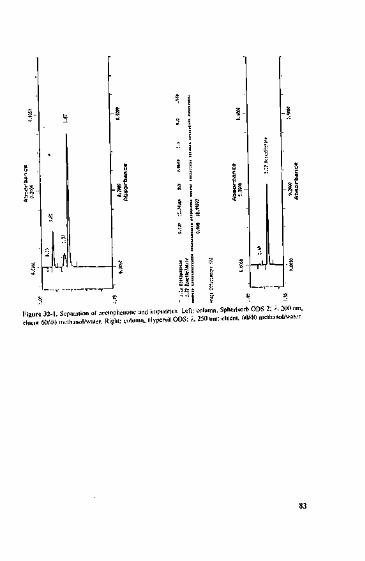
re 32-1. Separation of aceiophenone and impurities. Left: column, Spherisorb ODS 2; /. 200 nm,il 60M0 mclhanol/walcr. Right: column. Hypcrsil ODS; /. 250 nm: eluent. 60/40 mclhanol/wator.
Tip No.3 2
Quick check on peak homogeneity
Part 2Problem/Question
You are in the final stages of developing a method. Your peaks look well definedand symmetrical, the peak resolution appears to be satisfactory. How can you checkwithout too much trouble that all components present in the sample show up?Solution/Answer
Clearly there is a variety of possible solutions, ranging from modifying the chro-matographic parameters (e.g., pH value, temperature, stationary phase) to couplingtechniques such as LC-MS. Depending on your particular situation, the importance ofthe sample, etc., one method may be more appropriate than another.
A suggestion that can be put into practice with relative ease is as follows:Repeat the separation using a combination of column, eluent and wavelength that
is as different from the previous one as possible. The more variation in the parametersof 'he set-up (orthogonal conditions), the more revealing the results will be.
Here is an example:You have just carried out a separation in an acidic aceton it rile/phosphate buffer
mobile phase using a hydrophobic endcapped RP phase at 230 nm. Now is there per-haps a colleague in your lab who is using a polar RP phase (e.g., an embedded phaseor some non-endcapped older material) and a methanol/water eluent at 260 nm? Thisis the time to put on your sweetest smile and ask him or her if he or she would mindif you used his/her set-up. Otherwise, go to the bottom of your drawer of old col-umns, dig out an old LiChrospher or Spherisorb ODS I and take a 50/50 methanol/water mixture. Flush the column at a flow rate of 2 mL mirf' for 10 to 15 in in andthen inject your sample. See also Tip No. 4. The probability that two or more compo-nents behave identically under different chromatographic conditions and at differentwavelengths is relatively low. Therefore, you will get two quite different chromato-grams. Figure 32-1 shows a simple example involving only two variables (column,wavelength).
Many other variables can be used in a similar way: different detector, differentsample solvent, different pH value etc.
Two injections under orthogonally varied conditions are a convenient way of dou-ble-checking peak homogeneity and/or selectivity.

Figure 33-1. HPLC is good for a few surprises .in 30/70 ACN/H2O. This will concentrate the analytcs onto the head of the column,resulting in narrow peaks. See Tip No. 24.All of these measures lead to narrow peaks but do not affect selectivity, the one
thing you are not allowed to change. The result is better resolution through an in-creased number of theoretical plates, while the selectivity remains unchanged.
If you are lucky enough just to have to stick to the eluent and the column, youhave the following additional options:• Reduce the injection volume.• Reduce the flow rate (for 3 Jim particles, the improvement will be barely noticeable
(and for 5 u.m particles minimal).• Change the temperature (depending on the mechanism, the change in the resolution
may sometimes be imperceptible, in other cases quite substantial).
ConclusionIf you want to stick to the rules in strictly regulated austere environments such as
quality control, certain monasteries or dictatorial regimes and you want to achievesensible results within the legal limits, you have to be creative and use your imagina-tion.
Tip NO.Tied to a standard operating procedure -how can a bad separation be improved further?
Problem/QuestionSuppose you work in quality control and are tied rigorously to your operating pro-
cedures. One of them requires a resolution > 1.5. but there is no way you can achievethis. Is there any perfectly legal way of doing this?
Solution/Aosv.erUnfortunately, not all validated, long established methods deliver optimal peaks.
You can experience much in everyday life.. • I admit I saw the chrumatogram in Fig-ure 33-1 a couple of times shortly before Chrislmas (upper) and similarly only whena certain type of boss suddenly appears from behind me in the lab (lower). With greatsincerity I said that I didn't know how I could improve the peak shapes - but whatcan you do in simple cases?
The specifications in the SOP determine your options. If everything is prescribedto the smallest detail, including the composition of the eluent as well as PC settings,your only option is to try using a new column. If there is a little more flexibility inthe SOP, i.e., only the most important parameters such as column, eluent. temperature,flow, wavelength and injection volume arc laid out, you would have some other op-tions. Some cf these are given below:• Minimize the dead volume of the instrument using 0.12 mm capillaries, and per-
haps you could also have a look at the connections between the various pieces oftubing or to the column. This could be quite effective. See Tip No. 25!
• Tie two or three knots into the capillary between the column and detector. Thissounds like a joke, but the point is that a knot destroys the laminar flow profile,and therefore counteracts band broadening. See Tip No. 71.
• Inject between 10 and 15 M' of air with the sample. This air cushion ensures thatthe sample will not be diluted on its way from the injector to the column. In fact,some injectors produce such air segments on a regular base. When the air bubblereaches the column, the pressure built up in the column will cause it to be dis-solved in the eluent and it will not cause any problems. See Tip No. 35/1. Considerusing a restrictor capillary behind the detector. In this way, the increased pressurewill ensure that air bubbles that could be in the eluent remain there and do not es-cape into the deteclor cell, where they could cause air peaks and spikes.
• The following trick can probably not be used in quality control, but keep it inmind, just in case. When injecting your sample, add some guanidine, thiourea orglycerol. This will act as a highly viscous stopper, that is pushed in front of thesample zone and prevent dilution. The good new is that guanidine elutes with thesolvent front and will not affect the chromatogram.
• Dilute the sample in a solvent weaker than the eluent. If for example you are usin-an RP system with a C,8-column and a 60/40 ACN/H2O eluent dilute the sample
84

[.So sSi «5T" ' ulto ' is!FiRuCom
34-1. Gradents see
Jradicnt separation of a mixture of different components at 20"C and 0.5 mL min'1text (Source Walter Nussbaum, Pfizer, Freiburg, Germany).
Tip NO. More elaborate measures to check peakO 4 homogeneity
Problem/QuestionIn the previous tips, we discussed quick ways of checking peak homogeneity after
a separation, leaving the chromatographic system more or less unchanged. The mea-sures we will now discuss are more labour intensive.Solution/Answer1. Modifying the eluent• Without any doubt, changing the pH value is the most effective method of chang-
ing the selectivity of ionic or even polar analytes. Suggestion: change the pH valueby ±0.5 or +1 pH units while keeping everything else constant. A second relativelysimple option would be to keep the original pH value of the eluent the same, butto use a different acid or base additive, e.g., replace phosphoric acid (phosphatebuffer) by perchloric acid (perchlorate). Finally, you could change the buffer ion -use ammonium instead of potassium.
• A well known classical trick is often successful - increase the proportion of waterin the eluent by 5 to 10%.
• Keep the peiccntage of the organic phase in the eluent constant, e.g., at 50%, butreplace 5 or 10% of it with a different organic solvent.Some examples:
50% H2O/50% ACN, replaced by: 50% H2O /45% ACN5% THF
or 50% H3O/50% MeOH, replaced by: 50% H2O/40% MeOH10% butanol
etc.Or you simply replace acetonitrile with methnnol, keeping the eluiion strength thesame. The peaks will probably broaden, but the selectivity is quite likely to improve.
2. Changing the temperatureif you have a column heater/cooler, try to run the separation at a lower temperature,e.g.. at 15 C, or even IOC. Here, also, the peaks will broaden and selectivity willimprove, particularly where ionic interaction and steric interactions are involved. Fig-ures 34-1 and 34-2 show the effect of an increase in flow and a simultaneous reductionin temperature - both by a factor of 2. At a temperature of 20 T and a flow of0.5 mL min"1 14 peaks appear, two are jusl about separated (look at 19 min, Figure34-1). At 10°C and I mL min"1 there are 16 peaks, the two problematic peaks areseparated at the baseline (look at 20 min, Figure 34-2).
3. Changing the column• Hardware
In isocratic runs, use a longer column or smaller particles. The increased numberof theoretical plates often results in a more acceptable resolution.

• Stationary phaseAs might be expected, the choice of stationary phase has quite an impact on selec-tivity. However, this is so complex a subject that it cannot be adequately dealt within the limited space of this book. Read more about it in [3].A final comment on columns - what about reviving an idea popular in the seven-
ties, that of dual columns? Arrange two columns one after the other. Figures 34-3to 34-5 are intended to be an encouragement. The separation on a Nucleosil C]g col-umn is not brilliant, and on a CN column, it is even worse: see Figure 34-4. In Fig-ure 34-5, both columns are now connected in series, and everything else being con-stant, they yield a very neat separation.
Rctter resolution is achieved, especially in the first part of the chromatogram. Thelast peak, which is non-polar, is slightly delayed by the polar CN material, but thissmall increase in analysis time is a price worth paying.Conclusion
The changes suggested above can usually be achieved without going to too muchtrouble.
However, if you have to analyse a really important sample you should considerusing tools that involve more work but yield more rigorous results, for example:• Miniaturization down to nano-LC, see Part 2 of this book• Column and eluent choice combined with optimization programmes
Figure 34-3. Isocratic separationof 5 peaks on a Nucleosil C1S col-umn.
89

3 ri fe ffi Sfrfeyasfey'ittHiy--
Figure 34-2. Separation as in Fig. 34-1. [his time at IOC and I ml. mitT1. Comments see text.
Dear ReaderWhat I have given you snnut i nuvK given ymt so far was perhaps a bit hard to digest in places. If that isthe case I do apologize. May I offer you a lighter diet now? Tips Nos. 35 to 37 areshort, crisp and easy to digest. Bon appetit!
Tip NO. First easily digestible tip
3 5
It you do not have a degasser and helium is too expensive, simply use (clean!) ni-trogen. It is cheap and works well enough. However, you might encounter a slightproblem, as some pumps tend to choke a bit more often on nitrogen. A good alter-native to helium is argon.It is well known that an ultrasonic bath on its own is an ineffective degassing tool.However, it has been shown that in buffered eluents 5 min degassing following vac-uum filtration enhances the reproducibility of retention times. Apparently, thiskeeps the COi concentration in the buffer constant, which, in turn, keeps the pHvalue of the eluent also at a reproducible level.During routine operation, a void may form in the column, and you get doublepeaks. Sometimes this can be fixed by turning the column around (backflushing).Figure 35-1. Before you say goodbye to your column, you can try the following:place the column in an ultrasonic bath for approximately 5-15 min.If you work with labile compounds and try to dissolve them in an ultrasonic bath,you may end up with irreproducible results or ghost peaks, The natural propagationof ultrasound produces nodes and bulges. The energy reaches a maximum betweenthe nodes. In other words, it is a matter of chance whether labile substances are to-tally, partially or not destroyed at all in an ultrasonic bath, depending on the loca-tion of the vial in the ultrasonic Held. Whether you put a sample vial at the edgeor in the centre, to the right or to the left, in metal mesh or a beaker - you willfind that sometimes the water is lukewarm, sometimes hot - it is very unpredict-able. If you want to achieve an even distribution of ultrasonic waves, add a tinydrop of detergent, isopropanol or higher alcohols, to the water. When validatingyour method in order to ensure robustness, pay special attention to the impact ofthe ultrasonic bath.Suppose you are working with an ordinary phosphate buffer. Its pH value is set at7 or 7.5, and you notice that your column does not last very long. What could bethe reason? After adding acetonitriie or methanol the pH value of the eluent shiftsand is more likely to be around 8. See Tip No. 18. At this level, the silica gel be-gins to dissolve. If you want to extend the lifetime of your column, put a saturationcolumn between the pump and the injector (Tip No. 07/1).Very clean water could have a negative effect on reproducibility and peak symme-try. Very clean water, i.e., water that is practically ion-free is aggressive. As soonas this clean water comes into contact with a glass surface, it extracts the alkaliand alkaline earth ions from the glass. This makes a reproducible eluent prepara-
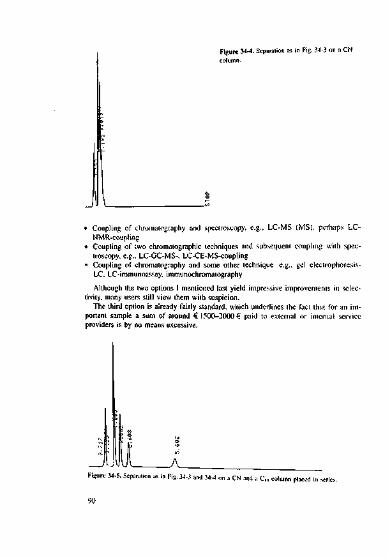
Figure 34-4. Separation as in Fig. 34-3 on a CNcolumn.
• Coupling of chromatcgraphy and speciroscopy, e.g., LC-MS (MS), perhaps LC-NMR-coupIing
• Coupling of two chromalographic techniques and subsequent coupling with spec-troscopy. e.g., LC-GC-MS-, LC-CE-MS-coupling
• Coupling of chromatography and some other technique e.g., gel electrophoresis-LC, LC-immunoassay. immunochromatographyAlthough the two options I mentioned last yield impressive improvements in selec-
tivity, many users still view them with suspicion.The third option is already fairly standard, which underlines the fact that for an im-
portant sample a sum of around € 1500-2000 € paid to external or internal serviceproviders is by no means excessive.
Figure 34-5. Separation as in Fig. 34-3 and 34-4 on a CN and a CIH column placed in series.
90

What to do:1. Wherever possible use a mixture, even 10-15% water will do.2. Swap the inlets A and B of the mixing chamber once or twice a month, but check
whether the mixing characteristics remain unchanged, because this can be a trickybusiness with some mixing chambers.
3. If necessary, remove the polymer layer using THF (tetrahydrofuran).• An isocratic separation has two main advantages over a gradient separation - it is
more straightforward and thus more robust, and it yields a better resolution. In agradient, resolution is always inferior because the distance between the peaks de-creases compared with isocratic chromatography. However, the analysis time isshorter, and the peak shapes are nearly always better. Thus, a choice has to bemade between robustness plus good resolution on the one hand and short analysistime plus better peak shapes on the other. You might want to opt for a compromisein the form of a shallow gradient. Simply turn your isocratic separations into shal-low gradients, starting off with a gradient so shallow that it is almost isocratic. andthen gradually increasing the slope until you find the optimum solution for yourspecific separation problem.

Figure 35-1- Left chromatogram: doublepeaks through dead volume in the columnpacking. Right chromatogram: removal ofthe problem by turning the column round.
tion difficult. Some ionic "dirt" in the water acts as a buffer and ensures reproduci-ble results, especially in columns with older silica gel material.
• Normally you can expect to elute buffer residues from the column within 20 min ata flow rate of 2 mL min"1 using water or a water/methanol solution. If for somereason (LC-MS-coupling, isolation of fractions, etc.) you can't have any buffer ionson the surface of your column, it is more effective to flush the column overnight ata lower flow rate. You must, however, calculate the flow rate and elution time care-fully in order tp keep the water volume that flows over the column the same, as alarger volume would cause the silica gel to disintegrate slightly and thus affect thequality of the column.
» Nowadays, analytic software and HPLC apparatus often come from different manu-facturers. Sometimes this causes some difficulties. If the network is overburdened,it can take 3. 4 or even 10 min for the AD converter to transfer the data to thecomputer. My advice is to enter 40 min even if the injector finishes after 30 min.
• Using 100% acetonitrile may prove to be tricky, as ball valves, especially thosemade of plastic, tend to slick because of the polymers that form in acetonitrile.There is a general risk of a polymer layer developing, e.g., at the acetonitrile inletof a mixing chamber.

Ghost peaks part five:Ghost peaks as a result of some degradation process can be really annoying. Letme just tell you about a case that happened in Switzerland. It will raise yourawareness of unusual causes. As a sample was known to be extremely sensitive,extra care was taken to store it in brown glass wrapped in aluminium foil. How-ever, it turned out that this protection was not enough. Only when the analysis wasperformed in a lab that had no fluorescent ceiling lights did the ghost peaks goaway. .Are you looking for an alternative to phosphoric acid in the acidic range? Thinkperchloric acid, acetic acid, methanesulfonic acid, trifluoroacetic acid, formic acidor hydrochloric acid. The effects on selectivity can be intriguing. Hydrochloric acidmay make your pump go a little rusty if you don't give it a neutral flush-throughsiraight ut'ier use. Well, think about it - it may be a price worth paying for whatyou gain in selectivity.Do you have to work in the pH range between 4 and 6? As you know, phosphatebuffers cannot be used in this range. Here are some alternatives:- Acetate, between pH 3.8 and 5.8. Drawback: the UV absorption of the eluent in-
creases, which may cause problems for a detection limit in the lower wavelengthrange.
- Citrate, between pH 3.5 and 5.5. Drawback: citrate may attack steel. It is betterto use PEEK capillaries. Do not leave your pump standing in this buffer over along period of time.
- Formate, between pH 2.8 and 4.8. As is the case for the other two organic buf-fers, the absorption in the low UV increases.
Solid samples that have been kept in the refrigerator should be gently warmed be-fore they are dissolved, i.e., they should be left to stand in the lab for about 20 minbefore you prepare them. The reason is that they could be hygroscopic and absorb,say, 0.1% of water. This may not matter for the first batch of samples, but by thetime you have prepared the last sample it may be noticeable. You will end up witha systematic error that leads to an area reduction over time. In this context, youshould also keep in mind that the volume injected is also temperature dependent. Ifthe bottles with the standard solution and the samples differ in temperature, a sys-tematic error due to inaccuracies in the proportions could be the result.
IV* are continuing our light diet of HI'LC
Tip No.3 6
Second easily digestible tip
If you have to store polar RP phases, be they non-endcapped C,« phases, polar em-bedded phases or phases with short alkyl chains over a longer period of time, e.g.,several months, keep them in mixtures containing aprotic acetonitrile (about 70-8O5fc ACN> instead of methanol, which is rather polar. With methanol, hydrolysiscould cause a chemical change on the surface of the phase. Some column supplierseven recommend doing this with all reversed-phase columns.Ghost peaks part one:Suppose some extra peaks that had not been called for turn up in your chromato-gram or the peak of one component suddenly shows a hump, etc. This may, ofcourse, have several causes, but keep in mind that silica gel has a catalytic effect.It is an excellent solid catalyst. It may well be that some of those many smallpeaics were not originally components of the sample but emerged in situ under thecatalytic effect of the stationary phase. You can check this by switching off thepump whiie the sample is still in the stationary phase. Now your sample has timeto flirt with the stationary phase - give them 10 to 20 inin before you switch onthe pump again. Did the number and intensity of your peaks change? This is theway to discover the secret life of your silica gel...
> Ghost peaks part nvo:When working in a low concentration range you discover unexplainable ghostpeaks in your chromatogram. Remember that there could be interference from theenvironment of your HPLC instrument, e.g., a new floor is being laid in the corri-dor, and solvent vapours are released, or some other maintenance work is going onnearby. Is the air conditioning system frequently switched on and off.' Could therebe the occasional open solvent container near the ventilator of your detector?Could a security guard have used a walkie-talkie in the lab near the HPLC appara-tus?
• Ghost peaks part three:You have got a very stubborn ghost peak that does not go away no matter how wellyou flush column and apparatus. Don't forget the degasser! If the mobile phase iscontaminated, e.g., by ion-pair chromatography, some of the constituents can beadsorbed onto the membrane with its large specific surface, and then slowly de-sorbed again. Just to find out if this is the reason, leave out the degasser for onceand run the mobile phase directly to the pump. Has the ghost peak gone now?
• Ghost peaks part four.Some acetonitnle batches don't meet the purity requirements for gradient applica-tions. Polymers, propionitrile. mcthacrylonitrile, acrylamide - all sorts of thingshave been found in acetonitrile. a problem colleagues working on LC-MS knowonly too well. To solve it, add a short A13O, column to your acetonilrile solventline. You can thus purify the acetonitrile online and at least mitigate the problem.
94

9 - 30% ACN/water gradient; 185 mFigure 37-1. Improving drift in Ihc lower wavelength rangein gradient separations by adding a drop of HNO., per L toeluent A (aqueous phase) (Source: John Dotan. BASi North-west laboratory).
6 ppm HNO3 in water
produce! Enough of that - let us concentrate on what is feasible if LC-MS or othercoupling options are not available. Inject the standard substance as well as the sam-ple at the same concentration and subtract the two chromatograms using appropri-ate software. Is there anything hiding on the tailing flank? Could there be a smallshift in retention time? This would mean your peak was not homogenous after all,and you should look again at section 1.3 to optimize your separation.Are you planning to work with an eluent containing 90 or 100% water, but there isno AQ or embedded phase available? Simply use a phase with low coverage, e.g.,-Sphcrisorb ODS 2, Platinum EPS, perhaps Platinum C]S, NovaPak C|8 or PolarisC)8. The other thing to do is to add a pre-column or a 0.13 mm capillary in orderto build up the pressure behind the column. Both measures will help to reduce oreliminate the decrease in retention time due to wettability problems.Do you want to separate proteins/peptides without using an ion exchanger or gelcolumn? Very sensible! Use the following material: 3 \im, 300 A, or alternatively,if your apparatus is suitably optimized, a non-porous material. Coverage: C4, Cy ora phase with perfluonnated propyl or octyl chains or simply use a monolith suchas Chromolith Performance.
97

Anil here is the last of those easily digestible tips
•np NO Third easily digestible tip
3 7
Hcxane and heptane suifonic acid are both popular ion pair reagents, and quiterightly so. If. however, one of your bases appears too soon, you should perhapsthink of camphor sulfonic acid as an alternative. Your peak then elutes later andthis may facilitate your separation.Are you intending to separate fairly strong bases such as /f-blockers or organicbases such as tricyclic antidepressants, but you only have a few older ordinary col-umns? Take your run-of-the-mill column and use the following eluent: 100-200mM sodium dodecyl sulfate with about 15% I-propanoI at a pH around 7 inwater or phosphate buffer, or 100-200 mM sodium dodecyl sulfate with about 10%acetonitrile at a pH around 3 in water or phosphate buffer. The chances are that se-lectivity and peak shape will be satisfactory'.Does the following description sound familiar? The first peak(s) in your chromato-gram show considerable tailing, while those peaks that elute later are more symme-trical. This hints at a fairly high dead volume for your instrument with this type ofseparation. It affects mainly the early-eluting peaks with peak volumes between150 and 250 J.L (the peak volume is the volume in which the peak is dissolved).The peaks that elute later are broad anyway, and the additional 50 or 100 jiL ofband spreading do not matter anyway at a peak volume of 1000 or 2000 uL. Togive an example in figures - a band spreading of 50 u.L ("extra column effect") isequivalent 10 20-30% of the volume of early-eluting peaks. For the later-elutingpeaks, the same dead volume accounts only for 5-10% of the peak volume, andthe resulting broadening of the peaks hardly matters. As a consequence, the peakselute symmetrically. Now if you are particularly interested in the early-elutingpeaks, you need to lower the dead volume in your instrument. In this way, you willincrease the number of theoretical plates and be able to perform more demandingseparations.
• In a gradient separation in the lower wavelength range, drift can be an annoyingphenomenon. There are several ways of compensating for the UV absorption ofeluents A and B and thus reducing or even avoiding drift. One of them is prettystraightforward - adding a drop of HNO3 per litre of H2O to eluent A (aqueousphase) gets rid of the drift. See Figure 37-1 (Source: John W. Dolan BASi North-west Laboratory).
• Check peak homogeneity (see also Tips Nos. 33 and 34)Your DAD seems to indicate that your chromatogram is fine, the critical peak ishomogenous, the spectra on the two flanks of the peak look identical, and thematch factor is over 990. Don't take all this evidence at face value! I don't want torepeat the old arguments that DAD often provides nothing more than a respectablealibi for unreliable separation results, because it is not sensitive enough at tracelevel and UV spectra can be irrelevant - think of the identical spectra that isomers
96
1.4 Troubleshooting
/ am afraid your relaxation period is over - back to the grindstone!
Tip NO. How to approach problems. in a systematic manner
3 8
Problem/QuestionYou work in a lab that does a lot of routine work. You are constantly faced with
problems, and it would be wonderful if you always had the solution at your fingertips.However, instant solutions are hard to find in real life. If you are lucky, you may findsome useful tips in the professional literature, pick up some advice from an experi-enced colleague or learn something useful at conferences. What I am suggesting hereis a strategy on how actually to proceed. Even if it looks fairly theoretical and rathergeneral at first glance, such a systematic approach can be very helpful.
Diagnosing and Eliminating HPLC Problems1. Is the problem reproducible?2. When does it occur?
(only on a Friday, only when you are operating the instrument etc.?)3. Write down the exact symptoms, e.g., the difference in retention time, peak area,
peak height, etc., everything that changes.4. Write down all the causes you can think of, check how plausible they are and tick
the most important causes.5. Decide which of the causes you want to investigate and what cure could be avail-
able.6. Write a hit list of the most common problems with this method or this instrument.
If possible, discuss them with colleagues, boss, method developer and supplier.a) Change is possible (this is rare, I am afraid).b) You have to put up with the situation, but at
least you know it is not your fault!
Respective Comments1. It is only worth looking at a problem if it is reproducible - a one-off does not
count. You or your pump could just be having a bad hair day. or there was a hugeair bubble in the system, etc.
2. Very important: Is there a correlation between a certain type of change and thesymptom? This may be the first step towards identifying of the problem.
99

Do you have a sample that is not stable in water? Keep the following mixtures inmind as possible eluents: acetonitrile/methanol, methanol/methylene chloride, tetra-hydrofuran/isopropanol. jV-butanol and dimethylfomiamide could be used as modi-fiers.Follow the rule that says the more polar the eluent (e.g.. high proportion of watervs. water/acetonitrile mixtures) the greater the differences in selectivity due to tem-perature changes. By analogy, this can be applied to polar phases vs. non-polar,highly covered phases.
Tip NO. Spikes in the chromatogram
3 9
Problem/QuestionYour chromatograms look fine, the only annoying thing are the spikes that keep
popping up - longer or shorter vertical lines at various places in the chromatogram.What could be the cause and what can be done to prevent them?Solution/Answer
Air bubbles, the detector, electronics and other problems are the main causes ofspikes. Let us look at these causes one by one;1. Air bubbles• Air bubbles in the pump (A/R) are easily detected - simply switch off the pump,
and the spikes disappear.• Air bubbles in the detector make a mess of the baseline. The baseline may even
rise and it will take ages before it sinks again to its normal level (/R=const.).Remedy: Improve your degassing and put a restrictor capillary (50 cm, 0.13 mm)
after the detectorStill having problems with air bubbles? In this case it must be a leakage before the
pump, or your input frit is dirty. Clean it with isopropanol, acetone or 6 M HNO3. Fi-nally a knick in the tubing between the solvent reservoir and pump (water jet pumpeffect) can lead to air bubbles.2. Detector• The UV lamp is too old -» get a new one.• The detector cell is dirty -» clean with isopropanol and/or hot water.3. Electronics
This would be the most unpleasant scenario, especially as the measures to be takenvary from one manufacturer to the next. It often helps if you ground only one mod-ule, e.g., the detector or PC. You could also use one single socket strip for all themodules. Using a power surge filter can be extremely effective. Also, think of shield-ing your interfaces, your AD converter, controller, etc., that are close to the detector.Furthermore, avoid running other large appliances such as a water-bath heater or acentrifuge on the same power circuit as your HPLC apparatus.
diagram with air bubbles in the detector cell.
101
?. The most important criteria are retention time, peak area and peak height. Youshould take a further look at pressure, baseline drift or jumps in the baseline,spikes, etc.
4. With some simple logical reasoning, the range of possible causes can be narroweddown.For example:• If there is a shift in the retention time but not in (he column dead time, the elu-
ent composition may be the culprit, but not the flow rate.• If there is a change in peak area but not in peak height, the problem must lie
with the pump or there may be a leak (change in flow!). But it cannot be the in-jector.
• If peaks have broadened while the retention time has remained constant, cluentand temperature will be okay, but not the packing etc.
5. With the various causes in mind you can decide fairly quickly what you would liketo investigate by which method and what you would like to change in the future.
6. This is the crucial and - alas - the most difficult bit! If communication betweenall parties involved works reasonably well, a change for the better may beachieved. If not. you will experience the stifling and frustrating effect psychologi-cal, social and bureaucratic barriers can have - not only in HPLC.
1
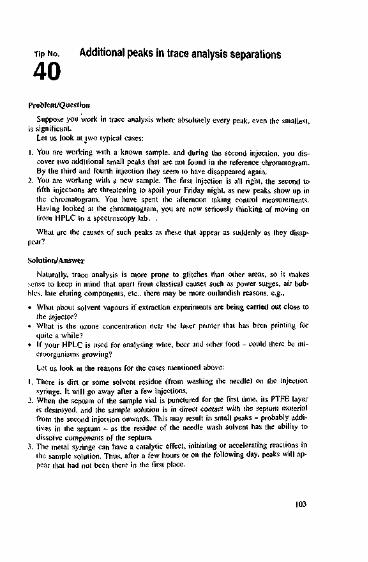
Tip NO. Additional peaks in trace analysis separations
4 0
Problem/QuestionSuppose you work in trace analysis where absolutely every peak, even the smallest,
is significant.Let us look aijwo typical cases:
1. You are working with a known sample, and during the second injection, you dis-cover two additional small peaks that are not found in the reference chromatogram.By the third and fourth injection they seem to have disappeared again.
2. You are working with a new sample. The first injection is all right, the second tofifth injections are threatening to spoil your Friday night, as new peaks show up inthe chromatogram. You have spent the afternoon taking control measurements.Having looked at the chromatogram, you are now seriously thinking of moving onfrom HPLC to a spectroscopy lab...What arc the causes of such peaks as these that appear as suddenly as they disap-
pear?
Solution/AnswerNaturally, trace analysis is more prone to glitches than other areas, so it makes
sense to keep in mind that apart from classical causes such as power surges, air bub-bles, late eluting components, etc.. there may be more outlandish reasons, e.g.,• What about solvent vapours if extraction experiments are being carried out close to
the injector?• What is the ozone concentration near the laser printer that has been printing for
quite a while?• If your HPLC is used for analysing wine, beer and other food - could there be mi-
croorganisms growing?Let us look at the reasons for the cases mentioned above:
1. There is dirt or some solvent residue (from washing the needle) on the injectionsyringe. It will go away after a few injections.
2. When the septum of the sample vial is punctured for the first time, its PTFE layeris destroyed, and the sample solution is in direct contact with the septum materialfrom the second injection onwards. This may result in small peaks - probably addi-tives in the septum - as the residue of the needle wash solvent has the ability todissolve components of the septum.
3. The metal syringe can have a catalytic effect, initiating or accelerating reactions inthe sample solution. Thus, after a few hours or on the following day, peaks will ap-pear that had not been there in the first place.
103
4. Other causesDepending on the detector, the immediate or even the more distant environment
can have an impact. With very sensitive detectors such as electrochemical or fluores-cence detectors spikes can be caused by electric storms, trams, construction work orstrong vibrations through the building. If your electrochemical detector is not sittingin a Faraday cage, it might even be that when you are all wound up after some dis-pute with your boss or a colleague and come too close to your detector, spikes and adisrupted baseline appear - I am serious!Conclusion• Once again it shows that air and dirt are the greatest enemies of HPLC. Keep them
firmly out of your HPLC instrument.• Sensitive detectors need a quiet corner and good ventilation.• Although there are a few things you can do when the electronics go awry, let us
pray that it won't happen.
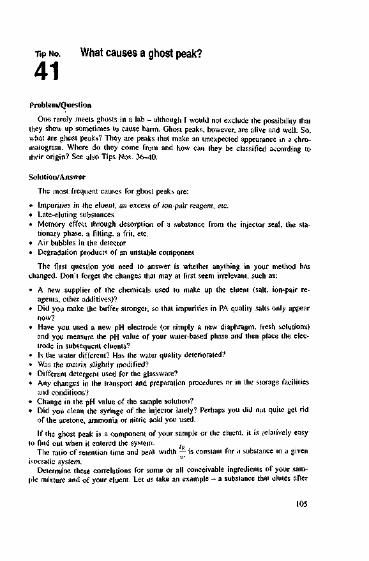
Tip No. What causes a ghost peak?
4 1
Problem/QuestionOne rarely meets ghosts in a lab - although I would not exclude the possibility that
they show up sometimes to cause harm. Ghost peaks, however, are alive and well. So,what are ghost peaks? They are peaks that make an unexpected appearance in a chro-matogram. Where do they come from and how can they be classified according totheir origin? See also Tips Nos. 36-40.
Solution/AnswerThe most frequent causes for ghost peaks are:
• Impurities in the eluent, an excess of ion-pair reagent, etc.• Late-eluting substances• Memory effect through desorption of a substance from the injector seal, the sta-
tionary phase, a fitting, a frit, etc.• Air bubbles in the detector• Degradation products of an unstable component
The first question you need to answer is whether anything in your method haschanged. Don't forget the changes that may at first seem irrelevant, such as:• A new supplier of the chemicals used to make up the eluent (salt, ion-pair re-
agents, other additives)?• Did you make the buffer stronger, so that impurities in PA quality salts only appear
now?• Have you used a new pH electrode (or simply a new diaphragm, fresh solutions)
and you measure the pH value of your water-based phase and then place the elec-trode in subsequent elucnts?
• Is the water different? Has the water quality deteriorated?• Was the matrix slightly modified?• Different detergent used for the glassware?• Any changes in the transport and preparation procedures or in the storage facilities
and conditions?• Change in the pH value of the sample solution?• Did you clean the syringe of the injector lately? Perhaps you did not quite get rid
of the acetone, ammonia or nitric acid you used.If the ghost peak is a component of your sample or the eluent, it is relatively easy
to find out when it entered the system. tThe ratio of retention time and peak width - is constant for a substance in a given
isocratic system.Determine these correlations for some or all conceivable ingredients of your sam-
ple mixture and of your eluent. Let us take an example - a substance that elutes after
105

ConclusionPeaks that rise or fall slowly often hint at the instability of a sample or at satura-
tion effects (column, steel capillaries, sealing, frits). In the cases discussed here, how-ever, the peaks appeared and disappeared rather suddenly.
Here is a list of simple measures that can help you to get to the bottom of theproblem:1. Clean the tip of the syringe with acetone, cone. NH, or nitric acid. Hush it with
eluent and then inject.2. After the first injection, shake the viai and inject again. This will intensify the con-
tact of the sample solvent with the septum material, and if interaction betweenthem is the problem, you will know very soon.
3. if technically possible, inject with and without the septum.4. Change the composition of the washing fluid in the injector.5. Leave the metal syringe in the sample solution overnight. Inject again the follow-
ing morning and compare the chromatograms. Have the areas of certain peaks in-creased?
i
Tip NO. Ghost peaks in a blank gradient
4 2
Problem/QuestionIt is general practice to run a blank gradient before analysing samples in gradient
runs. If this test shows a significant amount of drift or even ghost peaks you need toaci. How can we establish the source of the contamination?Solution/Answer1. Allow for a longer equilibration period before your next injection.
If the previously found ghost peak increases in size or the drift increases, the aque-ous phase is the culprit. Check the purity of the water and of possible additives. Ifalgae in the water are a problem, use UV light. Replace the cartridges in yourMilli-Q system, try out some different water, or use a different type of detergentfor your glassware. Are you using a new piece of tubing in your water line? Inci-dentally, the flushing process seems to cause quite a lot of headaches. If the peakremains the same size, then the contamination is from the acetonitrilc.
2. Does the ghost peak decrease in size during the second ran?Then the column or some other part of the apparatus is contaminated. The answeris to flush for longer and/or more thoroughly.Note: If the contamination is not in the column, it is very often in the syringe orinjection block of the autosampler.
Recommended procedure• Run a blank gradient with "zero injection".
If a ghost peak appears, clean the capillaries and detector cell.• Blank gradient with eluent injection.
If a ghost peak appears, clean injector parts, using, depending upon the sample,cone. NH.-u 6 M HNO> acetone, isopropanol, tetrahydrofuran, dimethyl sulfoxide,hexanc or ether. This will drastically reduce the chances of any contaminationclinging to any surfaces.By the way - ghost peaks often appear when you have just replaced a seal, but
they usually disappear again very quickly.Conclusion
It makes sense to look for the source of what appears to be a contamination.Tracking down the culprit module and cleaning it can save having to flush the wholesystem with acetonitrile.
107
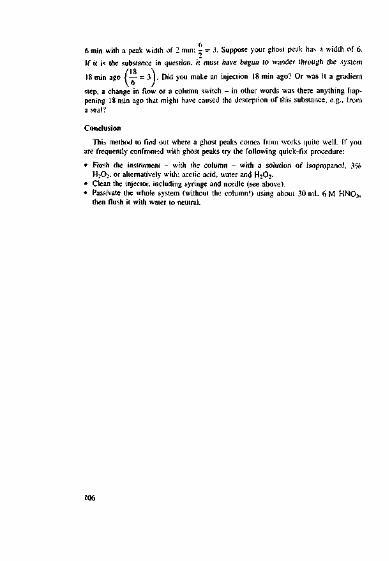
6 min with a peak width of 2 min: - = 3. Suppose your ghost peak has a width of 6.If ii is ihe substance in question, it must have begun to wander through the system
(18 \— = 3 I. Did you make an injection 18 min ago? Or was it a gradient6 /step, a change in flow or a column switch - in other words was there anything hap-pening 18 min ago that might have caused the desorption of this substance, e.g.. froma seal'.'Conclusion
This method to find out where a ghost peaks comes from works quite well, if youare frequently confronted with ghost peaks try the following quick-fix procedure:• Flush the instrument - with the column - with a solution of isopropanol, 3%
H;C>2. or alternatively with: acetic acid, water and H2O2.• Clean the injector, including syringe and needle (see above).• Passivate the whole system (without the column!) using about 30 mL 6M HNO3,then flush it with water to neutral.

only the pH of the fresh eluent, but also its refractory index, if there is a problem,it can be compared with the known values.
4. Sample unstableAsk yourself basically the same questions as in 1. Did you change anything aboutthe conditions or the hardware that could have had an impact on the stability ofthe compound?
ConclusionParticular symptoms can be associated with particular causes. It is therefore impor-
tant to be absolutely clear about whether certain changes affect all the peaks or onlyone or a few. Such problems have mainly been observed during the separation of ion-ic subsiances. Even minute changes in the method or hardware should always be con-sidered as possible causes.
Tip No.4 3
Strange behaviour of a peak.What could be the cause?
Problem/QuestionIn repeat measurements, nearly all peaks behave as expected - retention time, area,
peak shape, etc., remain constant. There is just one peak or maybe two that worryyou. perhaps because it is constantly on the move or it does not show the area youexpect it to show. What could be the reason?Solution/Answer
I can only give you some answers, as this is one of the most troublesome problemswe have to deal with in our daily HPLC routines, and I am sure that the more experi-enced amongst my readers could come up with any number of additional reasons.
Change in retention time:If one ur more peaks begin to wander, it could mean that there is a complex inter-
action between the compound in question and the stationary phase, as is nearly al-ways the case where ionic substances are involved. Something in the chromatographicenvironment must have changed in such a way that only this component shows a no-ticeable reaction, e.g., a subtle change in pH value, saturation of the free silanolgroups at ihe C18 surface, wettability problems of the Cls pores if the proportion ofwater in the eluent is high (in the meantime this is a hypothesis that is disputed) etc.Some packings with embedded polar groups contain residual amino groups that arenot very stable. If one of your analytes interacts with them, you could get a drift inretention for this compound only.
Change in peak height and area:1. Partial (physi)sorption on steel surfaces, seals and frits
Did you change anything in your hardware or method, e.g., are you using a steelinstead of a PEEK capillary, different sealing material, a different or a new pre-col-umn. different or new septa or did you prepare your sample differently (water, pHvalue, solvent)'.'
2. Change in UV absorption• If the UV absorption of the component in question is pH dependent, even a mar-
ginal pH shift can result in larger or smaller peaks. See also Tip No. 19.• If there is just a small shift in wavelength you may be measuring on a Hank of
the UV spectrum of the compound in question.3. Change in the refractory index of the eluent
A small impurity in the eluent can cause a change in its refractory index. Now therefractive index of the eluent is not so different from the RI of eluent plus sample,so the area becomes smaller. If at all possible, it would be worth measuring not
108
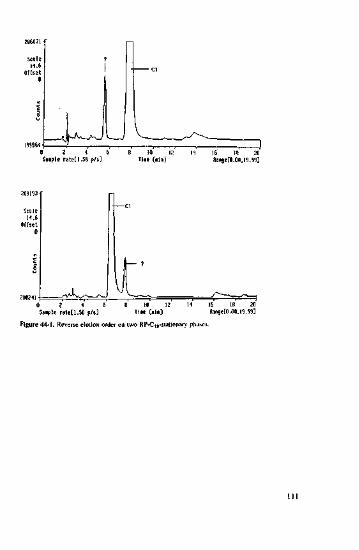
Siiple ratetl.SS p/s]16 ISRange[0.00,l9.99]
Scale11.6Offset0
Saiplt rate[1.56 p/s] Tin din)Figure 44-1. Reverec eludon order on two RP-Cm-slationary phase
15 18 208an9et0.00.l9.SS]
111
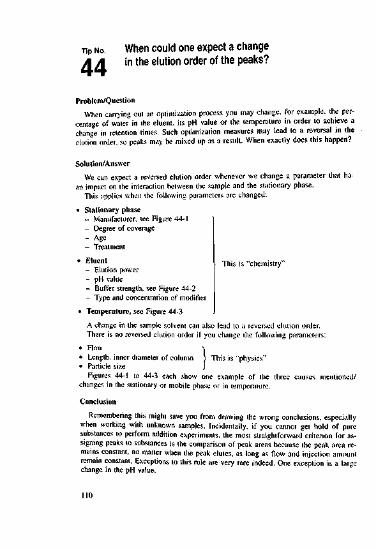
pWhen could one expect a changein the elution order of the peaks?
Problem/QuestionWhen carrying out an optimization process you may change, for example, the per-
centage of water in the eluent. its pH value or the temperature in order to achieve achange in retention times. Such optimization measures may lead to a reversal in theelution order, so peaks may be mixed up as a result. When exactly does this happen?
Solution/AnswerWe can expect a reversed elution order whenever we change a parameter that has
an impact on the interaction between the sample and the stationary phase.This applies when the following parameters are changed:
• Stationary phase-- Manufacturer, see Figure 44-1- Degree of coverage- Age- Treatment
This is "chemistry"• Eluent- Elution power- pH value- Buffer strength, see Figure 44-2- Type and concentration of modifier
• Temperature, see Figure 44-3A change in the sample solvent can also lead to a reversed elution order.There is no reversed elution order if you change the following parameters:
• Flow >• Length, inner diameter of column > This is "physics"• Particle size j
Figures 44-1 to 44-3 each show one example of the three causes mentioned/changes in the stationary or mobile phase or in temperature.Conclusion
Remembering this might save you from drawing the wrong conclusions, especiallywhen working with unknown samples. Incidentally, if you cannot get hold of puresubstances to perform addition experiments, the most straightforward criterion for as-signing peaks to substances is the comparison of peak areas because the peak area re-mains constant, no matter when the peak elutes, as long as flow and injection amountremain constant. Exceptions to this rule are very rare indeed. One exception is a largechange in the pH value.

ProntoSlLC18ASS
Ion75500
IJ l
5I4
JUL
s
J L .
10
.
156 7I A
2040
2
0 b io ia u t[min] «1 uracil 2 propranolol, 3 butylparaben, 4 dipropylphthalat 5 naphthalene, 6 acenaphlhene, 7 amltriptyline;MeOH / phosphate buffer 20mM pH=7 65/35 v/v; column: 125 x 4mmFigure 44-3. Reverse eluiion order due to a change of separation temperature, see separation of peaks3 ;ind 4 or 6 and 7 at 21 and 45 "C. (Source: Prof. Engelhardt, University of Saarbrilcken, Germany)
113

Figure 44-2. Reverse eliSnydcr. Orinda, USA)
Time (mln)n order due to a change ii rcngih in l!ie eluent. (Source: Lloyd
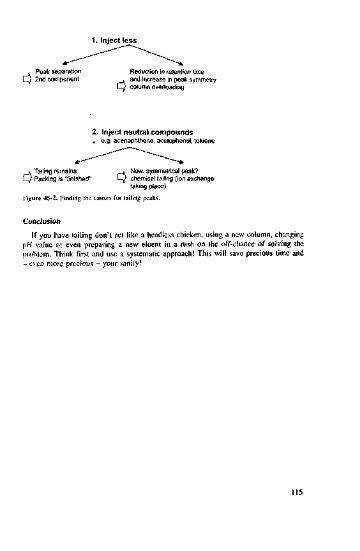
1. Inject less
Peak separation} 2nd component Reduction in retention timeand increase in peak symmetry1 column overloading
2. Inject neutral compounds, e.g. acenaphthene, acetophenol, toluene
i Tailing remainsPacking is "finished"
Fij>urc 45-2. Finding the
i Now, symmetrical peak?L) chemicals iling (ionexchangetaking place)s for tailing peaks.
ConclusionIf you have tailing don't act like a headless chicken, using a new column, changing
pH value or even preparing a new eluent in a rush on the off-chance of solving theproblem. Think first and use a systematic approach! This will save precious time and- even more precious - your sanity!

Tip NO. Tailing in RP HPLC
4 5
Part 1: Fast troubleshootingProblem/Question
Suppose you inject an unknown sample, and the peak tails. It has the shape of oneof those shown in Figure 45-1. How can you quickly identify the cause?Solution/Answer
The most common causes for tailing are:• A second compound on the flank, i.e., insufficient resolution• Column overload (when overloading the detector, you mostly get broad, round but
more or less symmetrical peaks and the retention time remains constant, sec alsoTip No. 46)
• Chemical tailing, e.g., additional ionic/polar interaction between a base and the re-sidual silanol groups of the stationary phase
• The quality or the packing is in decline, i.e., channels and dead volumes appear inthe columnFigure 45-2 gives you a diagram that can help you find the cause within minutes
with just two injections.Comments on Figure 45-2:Overloading of the column leading to insufficient resolution is more common than
you might expect. When you have critical peaks, only inject 2-3 uL of sample, andyou might be (positively?) surprised. The remaining three conclusions are easy to un-derstand and should not need further comment. Tip No. 46 will discuss further gene-ral reasons for the occurrence of tailing and what to do about it.
Figure 45-1. Typical (ailing peak shapes in HPLC.
114

Figure 46-1. Typical peak shapes of sirongor ba.*and on a non-endcappcd phase (right).
;s on a hydrophobic well-covered C,K phase (left)
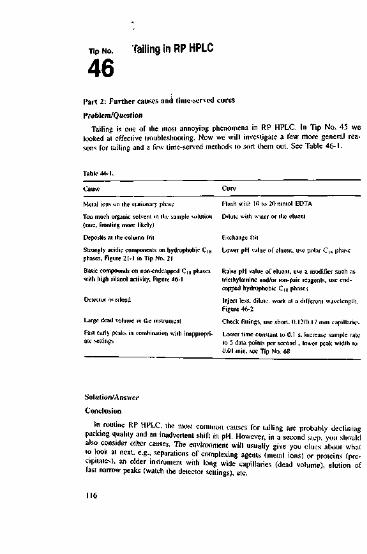
•np NO. Tailing in RP HPLC
4 6
Part 2: Further causes and time-served curesProblem/Question
Tailing is one of the most annoying phenomena in RP HPLC. In Tip No. 45 we 5looked at effective troubleshooting. Now we will investigate a tew more general rea-sons for (ailing and a few time-served methods to sort them out. See Table 46-1.
Metal ions on the stationary phaseToo much organic solvent in the sample solutioi(rare, fronting more likely)Deposits at the column fritStrongly acidic components on hydrophobic Cifphases, Figure 21-1 in Tip No. 21Basic compounds on non-endcapped C|S phaseswith high silanol activity, Figure 46-1
Detector crload
Large dead volume iFast early peaks in cate settings
Flush with 10 to 20mmol EDTADiluie with wuier or the elucntF.xchange fritLower pH value of eluent. use polar C,s phase
Raise pH value of elucnt, use a modifier such astriethylamine and/or ion-pair reagents, use end-capped hydrophobic C,K phasesInject less, dilute, work at a different wavelength.Figure 46-2
; instrument Check Fittings, use short. 0.12/0.17 mm capillariesinaiion with inappropri- Lower time constant to 0.1 s. Increase sample rate
to 5 data points per second , lower peak width to0.01 min, see Tip No. 68
Solution/AnswerConclusion
In routine RP HPLC, the most common causes for tailing are probably decliningpackmg quality and an inadvertent shift in pH. However, in a second step, you shouldalso consider other causes. The environment will usually give you clues about whatto look at next, e.g., separations of complexing agents (metal ions) or proteins (pre-cipiiates), an older instrument with long wide capillaries (dead volume), elution oflast narrow peaks (watch the detector settings), etc.
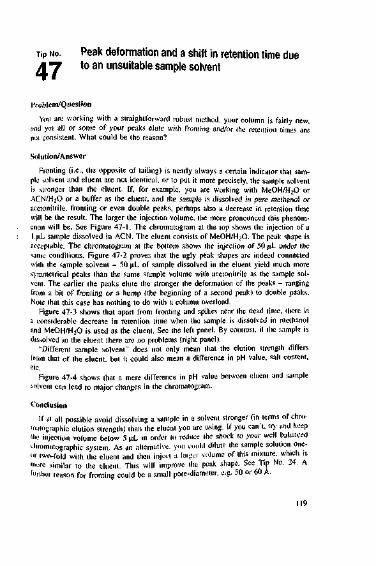
Tip No.
4 7
Peak deformation and a shift in retention time dueto an unsuitable sample solvent
Problem/QuestionYou are working with a straightforward robust method, your column is fairly new,
and yet all or some of your peaks elute with fronting and/or the retention times arenot consistent. What could be the reason?
Solution/AnswerFronting (i.e., the opposite of tailing) is nearly always a certain indicator that sam-
ple solvent and eluent arc not identical, or to put it more precisely, the sample solventis stronger than the eluent. If, for example, you are working with MeOH/H2O orACN/H2O or a buffer as the eluent, and the sample is dissolved in pure methanol oracetonitrile, fronting or even double peaks, perhaps also a decrease in retention timewill be the result. The larger the injection volume, the more pronounced this phenom-enon will be. See Figure 47-1. The chromatogram at the top shows the injection of aI,uL sample dissolved in ACN. The eluent consists of MeOH/HaO. The peak shape isacceptable. The chromatogram at the bottom shows the injection of 50 uL under thesame conditions. Figure 47-2 proves that the ugly peak shapes arc indeed connectedwith the sample solvent - 50 pL of sample dissolved in the eluent yield much moresymmetrical peaks than the same sample volume with acetonitrile as the sample sol-vent. The earlier the peaks elute the stronger the deformation of the peaks - rangingfrom a bit of fronting or a hump (the beginning of a second peak) to double peaks.Note that this case has nothing to do with a column overload.
Figure 47-3 shows that apart from fronting and spikes near the dead time, there isa considerable decrease in retention time when the sample is dissolved in methanoland MeOH/H2O is used as the eluent. See the left panel. By contrast, if the sample isdissolved in the eluent there arc no problems (right panel).
"Different sample solvent" does not only mean that the elution strength differsfrom that of the eluent. but it could also mean a difference in pH value, salt content,etc.
Figure 47-4 shows that a mere difference in pH value between elucnt and samplesolvent can lead to major changes in the chromatogram.
ConclusionIf at all possible avoid dissolving a sample in a solvent stronger (in terms of chro-
niatographic elution strength) than the eluent you are using. If you can't, try and keep'lie injection volume below 5 uL in order to reduce the shock to your well balancedchmmatographic system. As an alternative, ymi could dilute the sample solution one-»r iwo-foid with the eluent and then inject a larger volume of this mixture, which is"lore similar to the eluenl. This will improve the peak shape. See Tip No. 24, Afurther reason for fronting could be a small pore-diameter, e.g. 50 or 60 A.
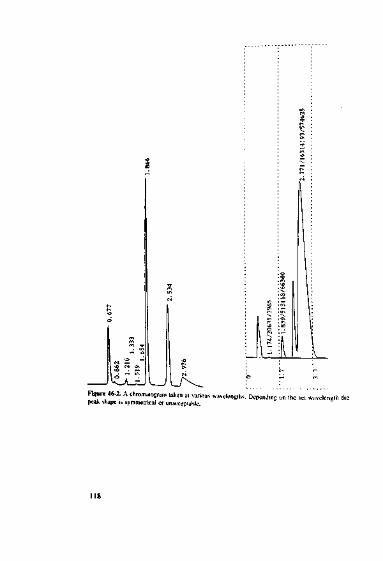
Figure 46-2. A chromalogram taken al varioipeak shape is symmetrical or unacceptable.avelengihs. Depending on the set wavelength ihe

n i i / i
Figure 47-1. Strong sample solvent: impact of the injection volume on the peak shape. Comments seetext.
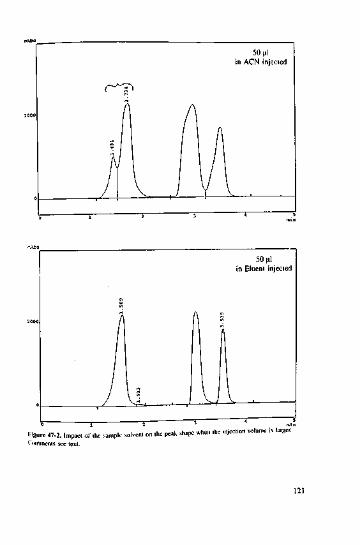
Hfii.™ 47-2. Impaa of the ample solvent on Ihc peak shape when the injection volume is larger.Comments see text.
121
Tip NO. Is flushing with water or acetonitrile sufficient?
4 8
Problem/QuestionIncreased back-pressure, ghost peaks suddenly appearing, a broadening of peaks -
all these are clear indications that there must be some contamination and you need toHush your system. Flushing seems to be an ever-topical subject in HPLC, and thenecessity and effectiveness of the various steps in the process are widely discussed inHPLC courses. A frequently asked question in these classes is: "Is it enough if I flushout polar impurities with water and organic matter with acetonitrile?"
Solution/AnswerIn most cases, the answer is yes. However, if the contamination is persistent it is
possible that the elution power of water or acetonitrile is not strong enough, in whichcase one should resort to stronger eluents, see below.
HPLC labs often have their own flushing procedures in place that work well forcertain samples and matrices. These arc invaluable, so not only stick to them but lookat [hem as part of your method. Even so, I am going to give you some general recom-mendations that have proved useful in RP columns, independent of any specific prob-lem. There is an obvious distinction between flushing the column and flushing the ap-paratus.
You can also use mixtures, e.g., for inorganic contamination plus microorganisms:approximately 45% acetic acid, 45% water and 5% hydrogen peroxide.
As a rule of thumb, the amount of flushing fluid used in every step should beabout 10 to 15 times the column volume. For a 125x4 mm column this would meanabout 15-20 mL. By the way, to speed up the process, you should turn the columnupside down.
For the instrument itself, excluding the column use (see also Tip No. 49):• Hot water (about 80 °C)• Hot water with a drop of detergent• Acetone• Diluted NH3 solution• 6 M HNO3 plus a subsequent neutral flush
Special tip:Inject the solvent you are using two or three times. This ensures that the injector is
also flushed. It may sound trivial and should be common knowledge, but since somuch depends on it, let me emphasize again that in the last flushing step - i.e., beforeyou leave the column or instrument to stand for a white - the eluent should containM least 20-30% methanol, or even better acetonitrile. This will prevent the growth ofalgae.
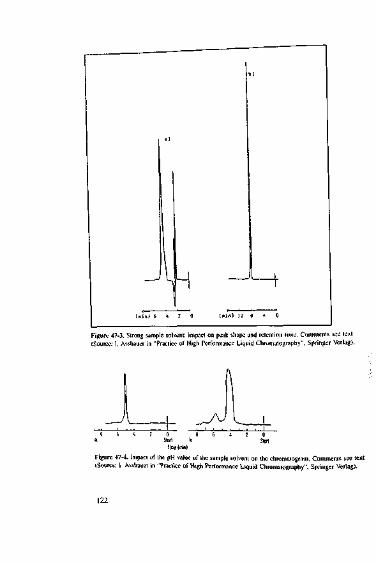
Figure 47-3. Sirong sample solvent: impact on peak shape and retention lime. Comments see text(Source: I. Assliauer in "Practice of High Performance Liquid Chromatography", Springer Verlag).
J — ±0 8 6 i 2 0Start b startTime (mini
Figure 47-4. Impact of the pH value of the sample solvent on the chromatogram. Comments sec text ,(Source: I. Asshauer in -Practice of High Performance Liquid Chromatography", Springer Vcrlag). I
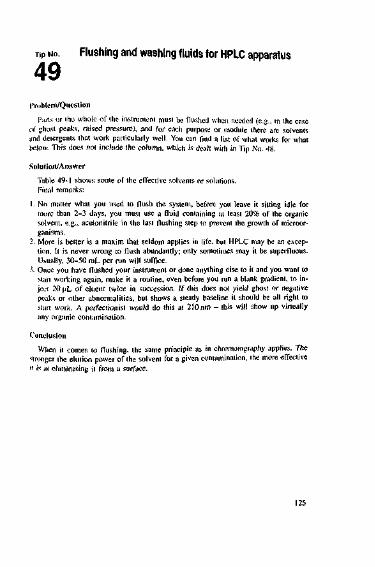
Tip NO. Flushing and washing fluids for HPLC apparatus
4 9
I
problem/QuestionParis or the whole of the instrument must be flushed when needed (e.g., in the case
of ghost peaks, raised pressure), and for each purpose or module there are solventsand detergents that work particularly well. You can find a list of what works for whatbelow. This does not include the column, which is dealt with in Tip No. 48.Solution/Answer
Table 49-1 shows some of the effective solvents or solutions.Final remarks:
1. No matter what you used to (lush the system, before you leave it sitting idle formore than 2-3 days, you must use a fluid containing at least 20% of the organicsolvent, e.g., acetonitrile in the last flushing step to prevent the growth of microor-ganisms.
2. More is better is a maxim that seldom applies in lite, but HPLC may be an excep-tion. It is never wrong to flush abundantly; only sometimes may it be superfluous.Usually. 30-50 mL per run will suffice.
3. Once you have flushed your instrument or done anything else to it and you want tostart working again, make it a routine, even before you run a blank gradient, to in-ject 20 u.L of eluent twice in succession. If this does not yield ghost or negativepeaks or other abnormalities, but shows a steady baseline it should be all right tostart work. A perfectionist would do this at 210 nm - this will show up virtuallyany organic contamination.
ConclusionWhen it comes to flushing, the same principle as in chromatography applies. The
stronger the elution power of the solvent for a given contamination, the more effectiveii is at eliminating it from a surface.
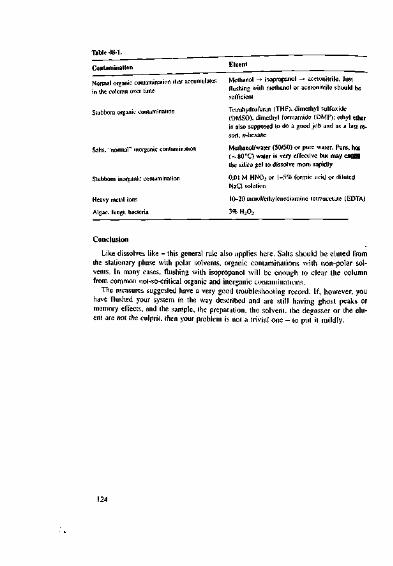
I
Normal organic contamination ilin ihe column over time
Stubborn organic contamination
Sails, "normal" inorganic conUu
Stubborn inorganic contaminalii
Heavy melal ionsAlgae, fungi, bacteria
Mcthitnol -* isopropanol -» acetonilrile. Justflushing with mcthanol or acetonitrilc should besufficientTetrahydrofuran (THF). dimethyl sulfoxide(DMSO), dimethyl formamide (DMF); ethyl etheris also supposed to do a good job and as a last re-sort, n-hexaneMethanol/water (50/50) or pure water. Pure, h(~80"C) water is very effective but may cthe silica gel to dissolve more rapidly0.01 M HNO3 orNaCl solution -5% formic acid or diluted
10-203% H2
lol/ethylcncdiamine tctraacctate (EDTA)
ConclusionLike dissolves like - this general rule also applies here. Salts should be eluted from
the stationary phase with polar solvents, organic contaminations with non-polar sol-vents. In many cases, flushing with isopropanol will be enough lo clear the columnfrom common not-so-critical organic and inorganic contaminations.
The measures suggested have a very good troubleshooting record. If, however, youhave flushed your system in the way described and are still having ghost peaks ormemory effects, and the sample, the preparation, the solvent, the degasser or the elu-ent are not the culprit, then your problem is not a trivial one - to put it mildly.
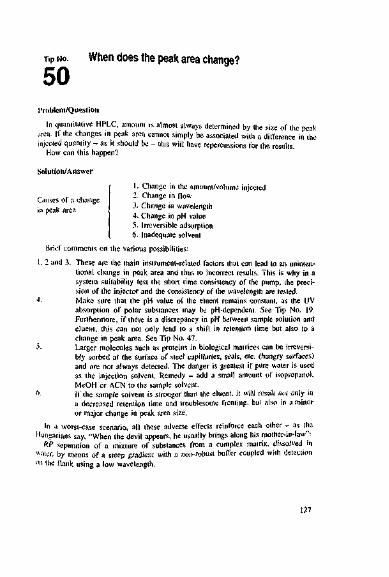
Tip NO. When does the peak area change?
5 0
Problem/QuestionIn quantitative HPLC, amount is almost always determined by the size of the peak
area. If the changes in peak area cannot simply be associated with a difference in theinjected quantity - as it should be - this will have repercussions for the results.
How can this happen?
Solution/Answer
Causes of a changein peak area
1. Change in the amount/volume injected2- Change in flow3- Change in wavelength4. Change in pH value5. Irreversible adsorption6- Inadequate solvent
Brief comments on the various possibilities:1, 2 and 3. These are the main instrument-related factors that can lead to an uninten-
tional change in peak area and thus to incorrect results. This is why in asystem suitability test the short lime consistency of the pump, the preci-sion of the injector and the consistency of the wavelength are tested.
4. Make sore that the pH value of the eluent remains constant, as the UVabsorption of polar substances may be pH-dependent. See Tip No. 19.Furthermore, if there is a discrepancy in pH between sample solution andeluent, this can not only lead to a shift in retention time but also to achange in peak area. See Tip No. 47.
5. Larger molecules such as proteins in biological matrices can be irreversi-bly sorbed at the surface of steel capillaries, seals, etc. (hungry surfaces)and are not always detected. The danger is greatest if pure water is usedas the injection solvent. Remedy - add a small amount of isopropanoi.MeOH or ACN to the sample solvent.fi- If the sample solvent is stronger than the eluent, it will result not only ina decreased retention time and troublesome fronting, but also in a minoror major change in peak area size.
In a worst-case scenario, all these adverse effects reinforce each other - as theHungarians say, "When the devil appears, he usually brings along his mother-in-law":
RP separation of a mixture of substances from a complex matrix, dissolved inwater, by means of a steep gradient with a non-robust buffer coupled with detection°n the flank using a low wavelength.
127
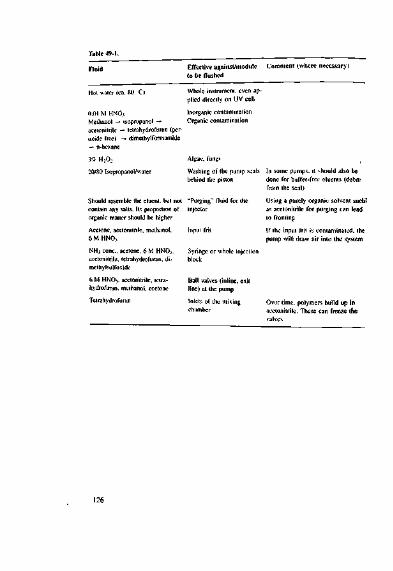
Effective against/module Comment (where necessary)to be flushed
Hot water (ca. 80 C)0.01 M HNO,Methanol -* isopropanol -+acetonitrile ~* teirahydrofuran (per-oxide free) -• dimeihylformamide-• n-hexane3<2 H2O2
20/80 Isopropanol/watcr
Whole instrument, even ap-plied directly on UV cellinorganic contaminationOrganic contamination
Algae, fungiWashing of the pump seabehind the pislon
Should resemble the clucnt. but notcontain any salts. Its proportion oforganic matter should be higherAcetone, aceionitrilc, methanol,6 M HNOjNH3 cone, acetone, 6 M HNO.,,acetonitrile. tetrahydrofuran. di-methylsulfoxide6 M HNOj. acctoniirilc, tctra-hydrofuran, methanol, acetoneTetrahydrofuran
"Purging" fluid for theinjector
Input fritSyringe or whole injecticblock
Ball valves (inline, exitline) at the pumpInlets of the mixingchamber
In some pumps, it should also beldone for buffer-free cluents (debt|from ihe seal)Using a purely organic solvent sas acetonitrile for purging can leadto frontingIf the input frit is contaminated, thepump will draw air into the system
Over lime, polymers build up ill]accioniirile. These can freeze tlvalves

Tip No.
5 1
Reasons for a change in either peak heightor peak area, but not in both
>'roblem/QuestionThere is a whole host of reasons for a simultaneous change in peak height and
;raik area, as the more experienced readers will know - such as a change in injectionvolume, instability of the sample, a leakage in the injector, perhaps a change in pH(see Tip No. 19), irreversible sorption on "hungry surfaces" (Tip No. 50) or a changein wavelength. Now what about a change in peak height with the peak area remainingconstant or vice versal Let us suppose that you have not deliberately changed aroundany of hardware, such as replacing a column by a longer one or by one with smallerparticles.
Solution/Answer/. Change in peak height with the peak area remaining constant
In principle, we can distinguish two reasons:A. A change in interaction. Here the retention time also changes.• The eluent or its pH value• The packing material, e.g., a chemical change on the surface of the stationary
phase.• The temperature, e.g., if the column oven has been open for a while.B. A change in the theoretical plate number. The retention time remains constant.
The reason for this is:• The quality of the packing of the column is in decline. There may be channels in
the packing.The most common causes are usually either a decline in packing quality (constant
retention time) or an inadvertent change in the eluent (change in retention time).
2. Change of peak area with the peak height remaining constantOnly two reasons for this should be considered - a change in flow or an air peak
under the main peak.The cases above describe an ideal situation. In real life, there may be aberrations
from the pure doctrine. The following three examples demonstrate this:• A change in flow also entails a (minor) change in peak height.' A change in temperature can lead to a change in pH value, which, in turn, can
have an effect on the peak area because sometimes UV absorption depends on thepH value.
' The addition of modifiers to the eluent can have an impact on us UV absorpuon,and if the signal-to-noise ratio changes, the peak area may also change.
129

Conclusion1. Aim for robustness when developing a method.2. Check your instrument frequently. This does not mean you have to run system suit-
ability tests all the time or do a daily calibration. It is far better to use controlcharts intelligently, which renders daily calibration superfluous [4].

Tip NO. Excesses and their pitfalls
5 2
Problem/QuestionYou are working with an ordinary linear gradient, trying to make assay analysis.
Your system is reliable and you know your injector as well as your pump is in topcondition. The content of some of the peaks is fine, but in some, or maybe only inone, you find a slight but reproducible and significant excess. By performing severaltests you exclude all the reasons for this that you can think of. Are there any otherstrange reasons for this phenomenon?
Solution/AnswerI am sure there are any number of them - after all HPLC is full of mysteries! Let
me give you just one:Run a blank gradient. It is important that you can see the profile of the gradient. If
necessary, add an eluent B, 0.1-0.2% acetone or some other UV modifier. Look atthe profile of the gradient - is it linear or does it sag slightly? If the latter is the case,check if the problem peak happens to elute when a specific eluent composition isreached and a discrepancy between the expected linear shape and the actual, slightlyconcave shape can be observed. You could use a ruler and draw in the expected lineargradient, and if you find a discrepancy you may have a certain degree of decrease inthe volume, i.e., perhaps the flow of the pump is not the preset 1 mL min"1 but only0.97 mL min"1, and this is being reproduced. This would be a typical case of a sys-tematic error, resulting in a slight increase in the area and therefore the analysis, asthe product of flow time areas remains constant. In this context the following shouldlie noted: in case of critical measurements you should consider the compressibility ofthe fluids, generally \% per 100 bar. Working at 200-300 bar and mixing solventswith a large difference in compressibility (e.g., methanol and water), you should usethe correction possibilities that modern instruments allow.
ConclusionOccasional air peaks that elule under the peak and have an effect on the area but
not on the height, co-eluting impurities that are indistinguishable in their UV behav-iour from the relevant component, and the case described above, these are, alas, themore difficult-to-find reasons for a lack of reproducibility if the composition of asample is determined via the peak area.

ConclusionEven takine into account that there arc special cases such as those I
above it is well worth having a close look at the chromalogram to track d-with respect lo peak height or area.
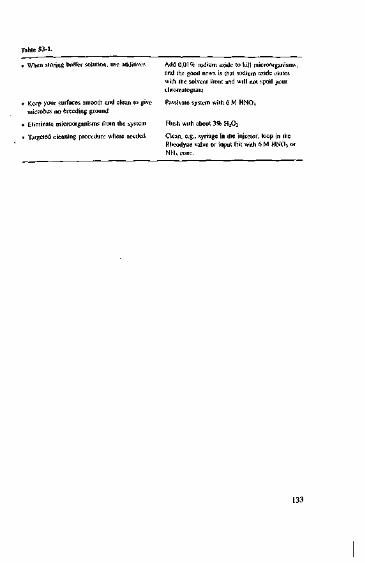
Table 53-1-• When storing buffer solution, use additi1
, Kc-p your surfaces smooth and clean lo givemicrobes no breeding ground
. Eliminate microorganisms from the system• Targeted cleaning procedure where needed
Add 0.01% sodium a*ide lo kill microorganisms,and the good news is that sodium azidc ciutcswith the solvent front and will nol spoil yourchromatogramPassivatc system with 6 M HNO3
Flush with about 1% H2O2Clean, e.g.. syringe in the injector, loop in theRheodyne valve or input frit with 6 M HNO5 orNH., cone.
133
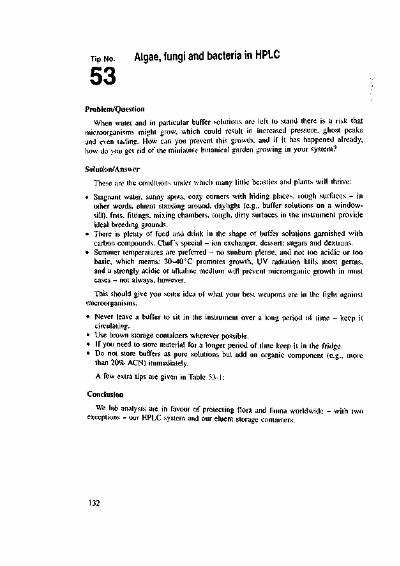
Tip NO Algae, fungi and bacteria in HPLC
5 3
Problem/QuestionWhen water and in particular buffer solutions are left to stand there is a risk that
microorganisms might grow, which could result in increased pressure, ghost peaksand even tailing. How can you prevent this growth, and if it has happened already,how do you get rid of the miniature botanical garden growing in your system?Solution/Answer
These are the conditions under which many little beasties and plants will thrive:• Stagnant water, sunny spots, cozy corners with hiding places, rough surfaces - in
other words, eluent standing around, daylight (e.g., buffer solutions on a window-sill), frits, fittings, mixing chambers, rough, dirty surfaces in the instrument provideideal breeding grounds.
• There is plenty of food and drink in the shape of buffer solutions garnished withcarbon compounds. Chef's special - ion exchanger, dessert: sugars and dextrans.
• Summer temperatures are preferred - no sunburn please, and not too acidic or toobasic, which means: 30-40&C promotes growth, UV radiation kills most germs,and a strongly acidic or alkaline medium will prevent microorganic growth in mostcases - not always, however.This should give you some idea of what your best weapons arc in the fight against
microorganisms.• Never leave a buffer to sit in the instrument over a long period of time - keep it
circulating.• Use brown storage containers wherever possible.• If you need to store material for a longer period of time keep it in the fridge.• Do not store buffers as pure solutions but add an organic component (e.g., more
than 20% ACN) immediately.A few extra tips are given in Table 53-1:
ConclusionWe lab analysts are in favour of protecting flora and fauna worldwide - with two
exceptions - our HPLC system and our eluent storage containers.
132
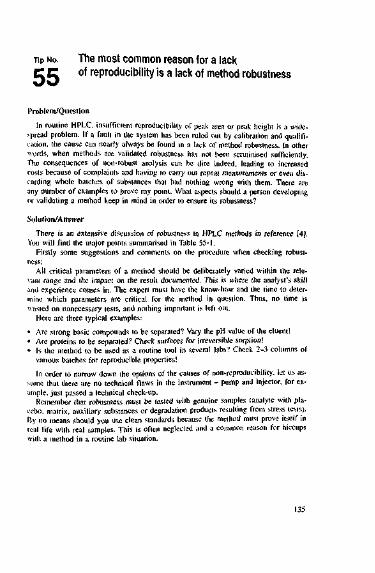
Tip NO. The most common reason for a lackE C of reproducibility is a lack of method robustness
Problem/QuestionIn routine HPLC, insufficient reproducibility of peak area or peak height is a wide-
spread problem. If a fault in the system has been ruled out by calibration and qualifi-cation, the cause can nearly always be found in a lack of method robustness. In otherwords, when methods are validated robustness has not been scrutinised sufficiently.The consequences of non-robust analysis can be dire indeed, leading to increasedcosts because of complaints and having to carry out repeat measurements or even dis-carding whole batches of substances that had nothing wrong with them. There areany number of examples to prove my point. What aspects should a person developingor validating a method keep in mind in order to ensure its robustness?
Solution/AnswerThere is an extensive discussion of robustness in HPLC methods in reference [4],
You will find the major points summarised in Table 55-1.Firstly some suggestions and comments on the procedure when checking robust-
ness:All critical parameters of a method should be deliberately varied within the rele-
vant range and the impact on the result documented. This is where the analyst's skilland experience comes in. The expert must have the know-how and the time to deter-mine which parameters are critical for the method in question. Thus, no time iswasted on unnecessary tests, and nothing important is left out.
Here are three typical examples:• Arc strong basic compounds to be separated? Vary the pH value of the eluent!• Arc proteins to be separated? Check surfaces for irreversible sorption!• Is the method to be used as a routine tool in several labs? Check 2-3 columns of
various batches for reproducible properties!In order to narrow down the options of the causes of non-reproducibility. let us as-
Mime that there are no technical flaws in the instrument - pump and injector, for ex-ample, just passed a technical check-up.
Remember that robustness must be tested with genuine samples (analyte with pla-cebo, matrix, auxiliary substances or degradation products resulting from stress tests).By no means should you use clean standards because the method must prove itself inreal life with real samples. This is often neglected and a common reason for hiccupswiih a method in a routine lab situation.
135

Tip No.5 4
Does 40°C always mean 40°C?
Problem/QuestionWe have frequently discussed the various reasons for a shift in retention time, and
a difference in the actual separation temperature was one of them. Suppose you arefollowing a protocol that stipulates 40cC, so you set your column oven accordingly.If you now notice that (he retention time has shifted a bit. you would normally notihink of a discrepancy in temperature as the reason, as the temperature display says i40 C. Beware - could it be that 40 C does not always equal 40°C? iSolution/Answer
1 am afraid so! The actual separation or detection temperature depends on manyparameters. I could easily fill several pages on this subject - but here, we want tokeep it short and snappy and just concentrate on essentials.
Note: The extent of the heat dissipation depends on the immediate surroundings ofthe column, which means that not only the set temperature matters but also the tem-pering. You need to investigate the following questions:• Is the column housed in an aluminium block or docs it have a fan thermostat?• Is the eluenl temperature also set by a thermostat?• Are you using a steel or a PEEK capillary (difference in conductivity!)?• Are you using the same capillary diameter?• Could there be a heat exchanger capillary in the detector?• Is there a thermostat in the detector'?• There is a pressure gradient in the column that follows the direction of flow, which
entails a reverse temperature gradient. The temperature difference can be 2-4'Cper 100 bar and depends on the polarity of the eiuent. Are you really working atthe pressure given in your protocol?In an RP mechanism, an absolute temperature difference of 2-4 ;:C is not so criti-
cal, but if you are separating polar substances and using buffers (pH dependence ontemperature) differences in temperature could show up in retention time as well as inpeak shape.
ConclusionKeep in mind that user-friendly operation protocols not only give you the parame-
ters for the separation, but also indicate the hardware and settings you should use -i.e.. not only evaluation software XYZ, but also the sample rate, not only 40 C, butalso the type cf column oven, not only 0.12 mm capillary, but steel or PEEK, Itshould further let you know whether the eiuent is also subject to thcrmostatic controland whether the detector used lias a heat exchange capillary, etc.

Comment"Neither too much nor too little" is a good maxim to follow. It is recommended
that you always carry out points 1-5. The work involved is within reason. If you aredealing with ionic substances, points 6-8 are a must. Checking point 9 with controlcharts is by far the more economical solution. Point 10 gives examples of importantfactors that can influence the result. For economic reasons, these need not always bevaried but must be documented scrupulously. These factors must be included in anySOP, as well as the specification of the dwell-volume in gradient systems, settingssuch as threshold and sample rate, procedures of eluent preparation, duration of ultra-sonic exposure, details of the solvents used when dissolving the sample, specificationsregarding the installation of a precolunin and the quality of eluent additives (p.a. forchromatography, for spectroscopy), etc.Conclusion
When considering projects concerned with reducing costs and increasing efficiency,I often find that inadequate or non-robust analytical methods are to blame for a costexplosion that can worry a company and its board over many years. I cannot discussthis extensively here, but it has to be said that money spent on early verification ismoney well spent. Careful decisions about an objective-related analysis design inquality control (e.g., a decision between DAD and the more robust, more sensitive;ind cheaper but not so fashionable multiple channel detector) are crucial investmentdecisions.

Table 55-1- Robustness tests in HPLC (example)What can be checked? Where can a change Comment (if needed)
occur?1 10 or sin repeat injections
(perhaps replace steel capillar-ies vuth PEEK capillaries)
2 injection of twice the usualamount or volume
3 Vary wavelength by ±2 nm
Area, height
Area, height
Area, height
4 Vary temperature by ±5 C Retention time, height(perhaps also area)
5 Eluiion strength; vary organic Retention time, heightproportion by ±5%
6 pH value, e.g.. ±0.5 pH units Retention time, peakshape (perhaps also areaand height)
7 pH valiK of the freshly pre- Retention time, peakpared elucnt (after addition of shape (perhaps also areameihanol/acetonitrile) at the be- and height)ginning and towards the end ofthe measurement as well as pHvalue of the eluate
Irreversible sorption of the sample orsome analytes? When are all acini,centres covered?Has the peak area doubled while (heretention lime remained constant? Isthere a risk of column overload underthese conditions''Are you perhaps measuring on a UVflank and if so, what is the effect onthe signal?In this and the following experimentkeep in mind the possibility of an in-version of the elution order
8 Vary ionic strength by1 i 5 mmo!
9 Ageing of phase
10 Brcaking-in time of a columcalibration time in gradient saration, duration and mecha-nism of degassing, etc.
Retention time, peakshape, heightEverywhere
•
After several days, another chromato-gram is run, or the influence of phaseageing is continually monitored withthe help of control charts. Recordchromatographic parameters such asresolution, area, retention time andtailing factor in relation to the timeelapsed
i Temperature has an impact on the pH value, which, in turn, can infUon and thus the UV absorption of ionic analytcs. The signal changesmce the degree of dissocia-
:cordingly.
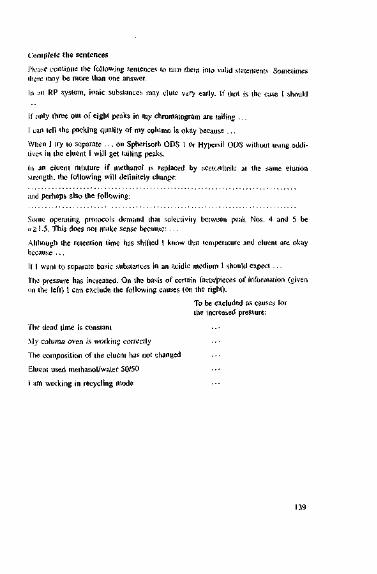
Complete the sentencesPlease continue the following sentences to turn them into valid statements. Sometimesthere may be more than one answer.In an RP system, ionic substances may clute very early. If that is the case I should
If only three out of eight peaks in my chxomatogram are tailing .,.I can tell the packing quality of my cplumn is okay because ...When I try to separate ... on Spherisorb ODS 1 or Hypersil ODS without using addi-tives in the eluent I will get tailing peaks.In an eluent mixture if methanol is replaced by acetcnitrilc at the same elutionstrength, the following will definitely change;
and perhaps also the following:
Some operating protocols demand that selectivity between peak Nos. 4 and 5 be«> 1.5. This does not make sense because: . •.Although the retention time has shifted I know that temperature and eluent are okaybecause ...If I want to separate basic substances in an acidic medium I should expect ...The pressure has increased. On the basis of certain facts/pieces of information (givenon the left) I can exclude the following causes (on the right).
To be excluded as causes forthe increased pressure:
The dead time is constantMy column oven is working correctlyThe composition of the eluent has not changedEluent used methanol/water 50/50I am working in recycling mode

Have a break ...Dear Reader,
You have bravely soldiered on to reach this point in the book - quite an achieve-ment. You truly deserve a break. Of course I don't mean that you should shut thebook;and go away. It's playtime.
When you look at page 139, you will find the beginnings of a list of sentences.Please complete the sentences so that they make sense! If you can think of several al-ternatives - so much the better.
On page 140 you will find bits of sentences, beginnings and ends, all over theplace. Please match up the beginnings and the ends of the sentences! You may findthat the first half could be completed by more than one bit. However, you shouldmatch the halves in a way that: (a) none of them are left over and (b) all of themmake sense.
On page 141 there will be a happy reunion with Peaky and Chromy. What do youthink of what Peaky has to say? Has he learnt his lesson properly?
The answers are to be found on page 265.

Has I'eaky remembered his lessons correctly?Our two old friends Peaky Acid and Chromy Siiicasky met up again after a long
lime, this time on a giant roundabout at a fair, also known as an autosampler. Theywere only No. 96 in the queue, also called a sequence. Given all the usual delays atdie lair, otherwise known as retention times, they had plenty of time for a chat. Peakyproudly reported that he had been listening in when chief lab operator Nicolas Pumpintroduced his younger colleague. Ms Cell, into the secrets of HPLC. "You know it'sreally exciting stuff, real science. ;ill to do with acids and bases. Let me tell you alew things so you don't have to die in ignorance!" This is what he told Chromy whowas listening with awe:1. It makes sense to use endcapped phases to separate acids and bases. This will re-
sult in symmetrical peaks.2. Many of the latest CIM phases are not so suitable for the separation of strong
acids.1 Methanol/buffer eluents are better for the lifetime of a column than acetonitrilc/
buffer eluents of the same elution strength.4. Adding methanol or acetonitrile will cause the pH value of the cluent to drift into
the alkaline.>. The greatest changes in selectivity usually happen around the pKa values of the
analytes, whereas the greatest robustness is achieved with a separation at a pHvalue that differs from the pKa by ±2 pH units.
6. When the pH value changes from 3 to 5, with everything else remaining constant,the following parameters may change:• Peak height • Lifetime of the column• Peak area • Peak symmetry• Retention time * Plate number
7. When permanently used in an acidic (pH ca. 2) or in an alkaline (pH ca. 10) en-vironment, silica gel will slowly but surely dissolve.
8. Selectivity permitting, one should work at a pH value of around 2.5-3.5 becausemany silanol groups are undissociated in this range. This reduces their interactionwith polar compounds, and peaks become more symmetrical.
9. KH2P04 as a buffer salt is less aggressive towards the column than (NH-OJCOJI.10. Ionic substances elutc earlier when the ionic strength (buffer strength, salt con-
centration) is increased.11. The pH value of the eluent should only be measured after the addition of metha-
nol/acetonitrile, because a considerable drift could occur if they are subsequentlyadded to the original aqueous phase. The final pH value may not even be known.
12. Increasing the flow rate shortens the analysis time but also increases the use ofsolvent.
Did Peaky remember everything correctly?
141

"Matching pairs"The area depends ...
depends on temperature, eluent and the type of column packing.When there is a shift in dead time ...
selectivity (separation factor «) usually decreases while efficiency (theoreticalplate number N) increases.The resolution depends ...... than an alkaline eluent.When you change your C]S-supplier ...... on the flow rate and the injection volume.When you change the composition of the eluent ...... than salt in the pump.Cold columns ...... there is no need to prepare a fresh eluent.Better a 5% error margin in the integration ...... not only the retention time, but also the elution order may be changed.When you raise the temperature ...... on flow, stationary phase, temperature, particle size and the dead volume of theapparatus.If you want sharp peaks ...... will change the retention time and peak shape of ionic substances dramatically.Belter sour cherries ...... everything except the area can change (unless something is caught up).Retention factor k ...... yield hot (good) separations.Changing the pH value.... does not depend on the flow or the length of the column.Selectivity ...... than 10% in the sample preparation.Pepper in the soup is belter ...... you must have acetonitrile in the elueni.
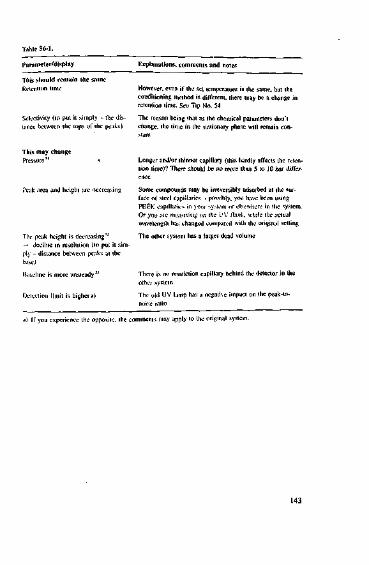
Table 56-1.parameter/display Explanations, comments and notesThis should remain the sameRetention timeSelectivity (to put it simply - the dis-tance between the tops of the peaks)
However, even if the set temperature is the same, but theconditioning method is different, there may be a change inretention lime. See Tip No. 54The reason being that as the chemical parameters don'tchange, the time in the stationary phase will remain con-
This may changePressure a)
Peak area and height arc decreasing
The peak height is decreasing"1-• decline in resolution (to put it sim-ply - distance between peaks at thebase)Baseline is more unsteady3'
Detection limit is highera)
Longer and/or ihinner capillary (this hardly affects the reten-tion time)? Ther2 should be no more than 5 to 10 bar differ-enceSome compounds may be irreversibly adsorbed at the sur-face of stcd capillaries - possibly, you have been usingPEEK capillaries in your system or elsewhere in ihe system.Or you are measuring on the UV flank, while the actualwavelength hs changed compared with the original settingThe other system has a larger dead volume
There is no restriction capillary behind the detector in theother systemThe old UV lamp has a negative impact on the peak-to-noise ratio
a) If you experience the opposite, the comments may apply to the original system.
1.5 General HPLC Tips
After the short break, we wilt continue with renewed vigor
•np NO. What changes can you expectwhen switching from one HPLC system to another?
5 6
Problem/QuestionYour pump has gone on strike, and no amount of coaxing, threatening or changing
seals will make it work ayain. You notice that another isocratic HPLC system is sit-ting in the coiner and is not being used. You are under pressure to finish your seriesof experiments, so you take your column, your eluent, your samples, etc. and try yourluck with that system. What should you expect to be different from your old system,and what should remain the same - at least in theory?Solution/Answer
Let us assume that: (a) the system has been properly flushed after the last use, (b)it is in good working order and (c) you are using the same settings as in your system,including the PC settings, such as sample rate, threshold, etc.
Consider the overview in Table 56-1.Conclusion
When transferring gradient methods lo another system, differences in mixing cham-ber characteristics, mixing chamber volume and dwell volume can lead to a change inretention times. In the worst case, the whole chromatogram may look completely dif-ferent. By contrast, in isocratic methods, for reasons given in Table 56-1, the signalmay change while the retention time could be expected to remain more or less con-stant. Furthermore, there may be system-specific differences, such as pressure andbaseline noise.

V O.I mL(lOOuL)"*j~—ns7is^ = a imin
This delay can be observed in an inert as well as in a retained compound. If, forexample, we assume a dead time of 1 min in the analysis of four compounds with theretention times of 2, 4. 8 and 15 min, we would find the following new k values
Now2.1 - 1.1 : 0.91'""'"- 1.1
W = i^_H = 2.73etc.
ConclusionWhen transferring a method, you should not only think of the chemical parameters
(stationary and mobile phase, temperature), which should remain constant, but also ofthe dead volume. As in the example cited, there may be minimal variation in retentiontime, while retention factors show a greater discrepancy. This makes the comparisonof results difficult where k values and not retention times are used as criteria.
0-9)2-736.3612.73

Tip No.5 7
What changes can be expected in a chromatogramif the dead volume is larger in one isocratic systemthan in another?
Problem/QuestionAn isocratic method is going to be applied to another instrument. The system in
question has a dead volume that exceeds that of the original instrument by 100 L.What noticeable changes in the chromatogram can be expected, if any?Solution/Answer
As you know, .1 dead volume has a broadening effect on peaks, which means thatresolution will deteriorate, and perhaps even be insufficient where early eluting criti-cal pairs are concerned. What else might happen? Retention factors {k values) alsodecrease.
ExplanationThe following formula applies:
k =retention factor (formerly capacity factor if)iK = retention time of a component/\i =dead time (retention time of an inert component)Although with increasing dead volume, fncl (dwell time of the component on the
stationary phase) remains constant, the dead time will increase because an inert com-ponent will, of course, elute later. Result: the k value decreases. The following equa-tion will yield the same result:
>-*•£K distribution coefficienlV\ = volume of the stationary phaseVm = volume of the mobile phasesAn increase in dead volume leads to an increase in the volume of the mobile
phase. This does not affect the volume of the stationary phase or the distribution coef-ficient, as the chemistry does not change. This means that the k value must decrease,and more noticeably so with longer than with shorter retention times. Let me demon-strate this by the following examples:
At an increase in dead volume by 100 uL and assuming a flow rate of I mL min"1,a delay of 0.1 min in retention time can be expected.
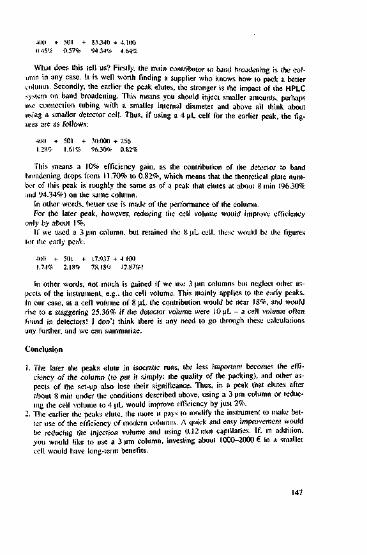
400 + 501 + 83.340 + 4.1000.45* 0.57% 94.34% 4.64%What does this tell us? Firstly, the main contributor 10 band broadening is the col-
umn in any case. It is well worth finding a supplier who knows how to pack a bettercolumn. Secondly, the earlier the peak elutes, the stronger is the impact of the HPLCsystem on band broadening. This means you should inject smaller amounts, perhapsuse connection tubing with a smaller internal diameter and above all think aboutusing a smaller detector cell. Thus, if using a 4 pL cell for the earlier peak, the fig-ures are as follows:
400 + 501 + 30.000 + 25612%9, 1.61 % 96.30* 0.82%
This means a 10% efficiency gain, as the contribution of the detector to bandbroadening drops from 11.70% to 0.82%, which means that the theoretical plate num-ber of this peak is roughly the same as of a peak that elutes at about 8 min (96.30%and 94.34%) on the same column.
In other words, better use is made of the performance of the column.For the later peak, however, reducing the cell volume would improve efficiency
only by about 1%.If we used a 3 \xm column, but retained the 8 pL cell, these would be the figures
for the early peak:400 +1.74%
501 +2.18*
17.937 -78.18*
4.10017.87%!
In other words, not much is gained if we use 3 |.im columns but neglect other as-pects of the instrument, e.g.. the cell volume. This mainly applies to the early peaks.In our case, at a cell volume of 8 uL the contribution would be near 18%, and wouldrise to a staggering 25.36% if the detector volume were 10 u.L - a cell volume oftenfound in detectors! I don't think there is any need to go through these calculationsany further, and we can summarize.
Conclusion1. The later the peaks elute in isocratic runs, the less important becomes the effi-
ciency of the column (to put it simply: the quality of the packing), and other as-pects of the set-up also lose their significance. Thus, in a peak that elutes afterabout 8 min under the conditions described above, using a 3 urn column or reduc-ing the cell volume to 4 uL would improve efficiency by just 2%.
2. The earlier the peaks elute. the more it pays to modify the instrument to make bet-ter use of the efficiency of modern columns. A quick and easy improvement wouldbe reducing the injection volume and using 0.12 mm capillaries. If, in addition,you would like to use a 3 pm column, investing about 1000-2000 € in a smallercell would have long-term benefits.
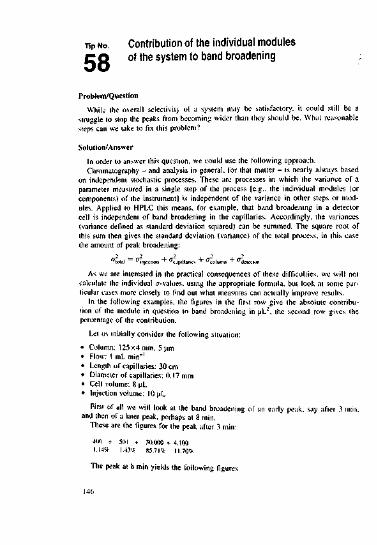
Tip No.
5 8
Contribution of the individual modulesof the system to band broadening
Problem/QuestionWhile the overall selectivity of a system may be satisfactory, it could still be a
struggle 10 stop the peaks from becoming wider than they should be. What reasonablesteps can we take to fix this problem?Solution/Answer
In order to answer this question, we could use the following approach.Chromiitography - and analysis in general, for that malter - is nearly always based
on independent stochastic processes. These are processes in which the variance of aparameter measured in a single step of the process [e.g., the individual modules (orcomponents) of the instrument] is independent of the variance in other steps or mod-ules. Applied to HPLC this means, for example, that band broadening in a detectorcell is independent of band broadening in the capillaries. Accordingly, the variances(variance defined as standard deviation squared) can be summed. The square root ofthis sum then gives the standard deviation (variance) of the total process, in this casethe amount of peak broadening:
"foul = njeoo + <4p,llarie. + Column + <4t.tt.orAs we are interested in the practical consequences of these difficulties, we will not
calculate the individual <7-values, using the appropriate formula, but look at some par-ticular cases more closely to find out what measures can actually improve results.
In the following examples, the figures in the first row give the absolute contribu-tion of the module in question to band broadening in u.L", the second row gives thepercentage of the contribution.
Let us initially consider the following situation:• Column: 125x4 mm, 5 um• Flow: 1 mL min"1• Length of capillaries: 30 cm• Diameter of capillaries: 0.17 mm• Cell volume: 8 uL• Injection volume: 10 uL
First of all we will look at the band broadening of an early peak, say after 3 min,and then of a later peak, perhaps at 8 min.
These are the figures for the peak after 3 min:4(XJ +1.14'* 30.000 + 4.100
8571% 11.70%
The peak at 8 min yields the following figures

0.2 0.3 6;4 0.5 "0.6" 0.7 0.8u (cm/scc)
""0.5 Q.8~ 1,0 1.2 1,5 2.0 2,5 ""j.0 tfi i,0
0.10 "b.'n 0.21 0,25 " 0,31 0.42 " (!.»" <i.63Figure 59-1. Constant linear velocity with various flow rates.

Tip No.5 9
How to keep retention times constantwhile reducing the diameter of the column
Problem/QuestionReducing the inner diameter has two substantial advantages - the limit of detection
can be lowered and the use of solvent can be reduced. Suppose you just reduce theinner diameter of the column while keeping all the other chromatographic conditionsunchanged, i.e. stationary phase, eluent, temperature, etc. What flow rate should youchoose in order to keep the retention times constant?Solution/Answer
The following formula will help you calculate the flow rate you are looking for.
ID\ mlF] =original flow rate (mL min"1)ID\ original inner diameter (mm)F2 =new flow rate {mL min"1)/£>? =new inner diameter (mm)Setting the flow rate obtained by applying this formula will give you the same lin-
ear velocity for both experiments while keeping retention times more or less constant,as long as you do not overload the column. The formula above is applied easily en-ough, but I can make life even easier for you. Table 59-1 gives you the flow settingsfor the most frequently found column diameters.
Example: You are working with a 4.6 mm column at a flow rate of 2.5 mL min""1.For a 4.0 mm column you should set the flow rate to about 1.9 mL mhr1. for a3.0mm column to 1.1 mLmin"1 and for a 2.1 mm column to 0.5 mLmirf1. In allthese cases, the linear velocity remains constant at 0.7 cm sec"1, and all peaks elute atapproximately the same time.
ConclusionPeople mighi feel more inclined to modify their existing HPLC method if retention
times could be kept constant. Table 59-1 should help in this process.
higher theoretical plates and thus higher peaks. This, in turn, will lower the limit ofdetection.
What about the downside?|. More expensive to purchase.2. Pressure raised by a factor of 2-3.3. Higher demands on the instrument (extra-column band spreading).4. If samples are contaminated, 3 [.mi columns are more likely to suffer.
Discussion of points 1—4:1. This is for the individual usei to decide.2. This drawback can be at least partially compensated for by using a shorter column.3. In gradient separations, the advantages of using 3.5 urn are only marginal, as the
separations yield sharp peaks anyway. In isocratic separations, the dead volume ofthe instrument should not exceed about 30 uL. This means the volume of the detec-tur cell should not be larger than 8-10 uL and the inner dmmetcr of the capillariesno larger than 0.12 mm.
4. 3 urn columns are indeed more suitable for clean samples unless you are prepaiedto go to all sorts of trouble when preparing a sample.Recommendation: Those among you who are keen on narrow peaks should perhaps
make up your minds and part with those cherished 0.25 mm capillaries that were cut-ting-edge technology in the seventies. I know how hard it is to say farewell - don'tremind me of that 18 year-old VW van sitting in my garage - but I am sure you cando it.
ConclusionOnce you have overcome the problem of the increase in pressure and found a col-
umn supplier who knows how to pack 3.5 m material, all you need is a reasonablydecent system, and you can begin some serious work on those 3.5 p.m particles. Bythe way, even 1.8 to 2 urn particles can be used very successfully, but only if youhave taken the time to optimize your instrument adequately.

Tip NO. Has 3 nm material been developedsufficiently to be used in routine separations?
6 0
Problem/QuestionWhen I hold HPLC classes, various questions are raised that are probably on the
minds of many users. One question I came across recently is: "In recent brochuresthe advantages of 3 urn columns over 5 urn columns have been advertised. Are theyreally ready io be used in routine separations?"Solution/Answer
Yes, if certain requirements are met.Preliminary comment: They are called 3 \xm, but in most materials the actual parti-
cle diameter is 3.5 um, the reason being that the panicles have m he just large enoughnot to slip through the most commonly used frits and filters. Reducing the particle di-ameter even further would involve changing too many of the things that you arc usedto, and the manufacturers are very wise not to ask too much of the user at once.
Let us look briefly at the advantages!Under the same chrcmatographic conditions (identical properties of stationary
phase, identical packing quality, etc.) 3.5 urn material can yield the same theoreticalplate number as 5 u.m material, but at a higher flow rate. As a result, the analysislimes are shorter. Alternatively, the same separation can be achieved at the same flowrate using a shorter column. This also shortens analysis time. The following figureswill serve as an illustration. There is a rule-of-thumb formula to work out roughly thenumber of theoretical plates (Source: John W. Dolan and Lloyd R. Snyder, Trouble-shooting LC-Systems).
N as 3000—dL = length of column in cm
dp- particle diameter in urnFor an ordinary 12.5 cmx5 \im column this would give
12.53000•- . about 7500 plates
When switching to a 10cmx3 urn column, the result will be3000 • — . about 8500 plates
Even leaving aside the gain of about 1000 theoretical plates, shortening the analy-sis lime by around 20% would be a considerable advantage. If the original columnwas 15 cm long, the reduction in analysis time would be by one third, as there is alinear correlation between column length and analysis time. It is therefore logical toassume lhat column length and flow remaining constant. 3.5 um material will yield

These are the advantages to be gained in both cases:• Reduction of analysis time• Increase in efficiency (higher peaks)• Decrease in solvent consumption
Here are two cases in point:1. Reducing the inner diameter from 4 to 3 mm also reduces solvent usage by about
50%. Nowadays you are very unlikely tc come across a system of such poor quali-ty that it won't'work with 3 mm columns.
2. Transferring a separation from a 150 mm, 5 urn column to a 100 mm, 3 urn column(same stationary phase!) will yield the same resolution, but reduce the analysistime by around 30%!This shows it is worth thinking about miniaturization, doesn't it?
ConclusionA sensible isocratic system (dead volume under 50 u.L) will work perfectly with
the following column parameters: L 60-100 mm, ID 3 mm, dp 5 u.m, i.e.. 0.12-0.17 mm connection tubing, 4-8 j.iL cell volume.
Switch to columns with the following parameters:ID 2 mm and dp 3 urn involves a lot of adjustments within the instrument. The in-
strument needs to be first class - dead volume around 15 u.L, i.e.. 0.10 mm capillaries,cell volume 2-4 u,L.
Suggestions on how to proceedFirst reduce the length of the column, e.g., from 125 to 100 mm, then even further
io 60 mm (or you might go for 60 mm straightaway!). Once you have succeeded andarc happy with the results, you should next think of reducing the inner diameter, from4.6 to 4 mm, then to 3 mm. Once this has been successful, take a deep breath andbrace yourself for a more complicated change. Optimize your instrument and thensuccessively try out a 3 u.m material and/or a 2 mm column. This is where the averageuser's capacity for experimenting ends. If you are allowed more leeway and have asense of adventure, you could try the next step - capillary liquid chromatography(CLC): %250u,m capillaries, flow rates around 10-20 u,Lmin~l, injection volume< 1 nL, cell volume 1-2 [iL. This is only worth going into if you have a lot of time toexperiment with (or a lot of money to buy a special CLC instrument) and nobodybothers you with other work. For more about micro and nano LC, see the contributionby Jurgen Maier-Rosenkranz in Part 2.
Tip No.6 1
Miniaturization may be all well and good -but when does it really work and does it make sensein routine separations? <
Problem/QuestionFor economic and analytical reasons, miniaturization is often a sensible approach.
What can be achieved using an ordinary instrument, and when is it worth taking theplunge?Solution/Answer
Preliminary comment:I can understand why some of my colleagues are rather sceptical about miniaturiza-
tion and I even share their attitude in certain circumstances, such as tightly regulatedenvironments, samples with a high matrix content and/or a large number of compo-nents, shortage of specialists in routine analysis labs, lack of time to follow up poten-tial errors, etc. This does not necessarily mean that in such cases miniaturizationwould not make sense - it only means that you have to assess your situation carefullyand base your final decision on objective and verifiable facts. You should be askingquestions such as these:• How much time would it save me - not only in the analysis, but also or even more
so in terms of productivity? How much work would be involved in a new registra-tion or in a changing control procedure?
• Is there room for any further optimization in the sample preparation procedures?• Is the selectivity sufficient to separate all the peaks clearly on a shorter column?
These are the parameters that can be minimized:• Length and inner diameter of the column• Particle size• Interaction of analytes with the stationary phase
The third point should be discussed extensively; but we will just look at the variousaspects concerned with the instrument.
Here are some concise hints that could be put into practice in a "real-life" lab situ-ation:• Column length 60 to 100 mm. inner diameter 3 mm, particle size 5 pm
Preliminary condition: The dead volume of an instrument for isocratic analysisshould be <30 to 35 uL in order to take full advantage of the miniaturization, e.g.,higher peaks. For a gradient separation under the aforesaid conditions the dwellvolume of the apparatus is of minor significance.
» Column length 60 mm, inner diameter 3 mm, particle size 3 ftmPreliminary condition: Dead volume < 15 to 20 u,L, clean samples.

Tip No.
6 3
Column length, flow and retention timesin gradient separations
Problem/QuestionBackground:Reasonable interaction is the key to HPLC. In isocratte separations, for example,
the relevant analytes should ekite in a retention factor window of between 2 and 8.This is a sensible compromise between sufficiently strong interaction, robust condi-tions and acceptable retention time. By analogy, a mean retention factor k that appliesto gradient separations is shown in the following equation:
&%Bj •\T)
F
k = mean k value; the analyte is in the middle of the column (lengthwise)=duration of gradient (min)= flow (mL min"1)=column dead volume
ff=changes in B from the beginning to the end of the gradientS =slope of the %B/ta curve; for smaller molecules, S is set at about 5An optimal I would be about 5, thus simplifying the equation, solved for the dura-
tion of the gradient, as follows:
*= \&%B,
la \A%Bj \Vmla &%B-Vm-Sk" 100 • F
k • A%B VmS<c ~ 100 • F
5 • A%S • Vra • 5'"" 100-F "
„ . / A%B N
"- " "" \\00 FjNow let us look at the retention limes in some typical combinations of column di-
mensions and flow.
155
Tip No.6 2
Why is it that peaks appear laterwith a new column?
Prob lent/QuestionThe new column you ordered has just arrived. Although it has the same stationary
phase and the same dimensions and you have used the same supplier, the peaks comelater, however constant you keep the chromatographic conditions. Why?
Solution/AnswerSuppose the chromaiographic conditions (temperature, eluent including the pH val-
ue, ionic sttength, etc.) and sample preparation have indeed remained constant. Nowcheck whether the retention time of the solvent from is also delayed. If that is thecase, the flow rate has probably changed. Check your pump and look for leaks. Onceyou have made sure, with the help of a flow-meter or a stopwatch and a measuringcylinder, that the flow is okay, look at your column as the likely cause for the dis-crepancy. The density of the packing may vary from one column to the next if yoursupplier does not follow consistent packing procedures. You could now have a columnthat contains a greater amount of material than its predecessor, e.g., 0.90 g instead of0.82 g. It is no surprise that all peaks - including the solvent front - elute later.
Let us now look at the second reason why the peaks could elute later, but whenthe dead time /\i remains constant. If t%\ remains constant while tn changes, so toodoes the retention factor k. Now this means that there is a change in the interactionbetween the analytes and the stationary phase, thus a chemical change has takenplace. If you are certain that the chemistry that you are in control of (temperature,eluent composition, pH value, ionic strength, modifier concentration) has remainedconstant, the problem must lie with the supplier. Although the stationary phase carriesthe same label, its properties are not identical with the previous one, which shows upin the differences between various batches. However, it is also possible that you haveunintentionally changed the surface of the previous column, perhaps by injecting asubstance that was irreversibly sorbed, thus modifying the properties of the stationaryphase and its interaction with the components, or that retention has changed becausethe previous column has been in use for a long time.Conclusion
Is fM constant or not? This is the detail that points you to the cause of your prob-lem - be it physical changes in your system (flow), at the supplier's end (density ofpacking) or chemical problems either at your end (temperature, eluent) or at the sup-plier's end (properties of stationary phase) - unless you have tampered with thechemistry of the stationary phase.
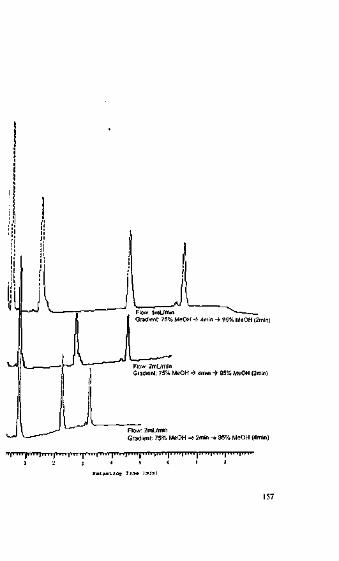
Flow: 1mL/mGradient- 75% MeOH -> 4min -> 95% MeOH (2min)
Flow: 2mL/minGfadient: 75% MeOH - 4min -> 95% MeOH (2min)
Flow: 2mL/minGradient: 75% MeOH -> 2min -» 95% MeOH {4m
i| ii.!••.•! i.••!•.• ip •••! !!•• up ni|
1S7

Answer/SolutionLet us first consider a classical 250x4.6 mm column at a flow rate of 1 mL min '
and a linear gradient of 20» to 80* B. The gradient duration is about 37.5 min:
tomment 1:It turns out that in contrast to the isocratic mode, the column length does not
usually matter so much in gradient separation. The sample is effectively concentratedonto the head of the column, and while the proportion of methano] or acetonitrile inthe eluent is increasing, the individual components of the sample leave the stationaryphase one by one. The column length and thus the number of theoretical plates is lesscrucial here, since the peaks are sharp and narrow anyway.
On a 125x4 mm column under the same conditions, the duration of the gradient isaround 18.75 min:
tG = 25 - 1.25 -60 = 18.75 min
Comment 2:We have already discussed the gradient volume (gradient duration x flow) - the
larger the better (e.g.. increasing the flow while keeping the gradient duration con-stant) or faster (increasing the flow while the gradient time becomes shorter) the sepa-ration will be. For the column just mentioned (125x4 mm), a gradient run at a flowrate of 2 mL min"1 will take 9.38 min - and the resolution is the same as in the firsttwo cases!
= 25-1.25- _60_VuxTl
I = 9.375 rIn fairly straightforward separations (the number of peaks is less than 10) you
should always think about using shorter columns. On a 75x4 mm column and a flowrate of 2 mL min~' the gradient duration is around 5.63 min:
la •= 25 • 0.75 •' 60 '100-2 = 5.625 min
If there are only 4 to 5 peaks to separate, a column ot 20-30 mm will be sufficientin any case. The chromatogram in Figure 63-1 was produced during an HPLC classgiven by Daniel Stauffer, Roche, Basel, using a 25 mm column and an ancient instru-ment. There is, of course, plenty of scope lor further optimization.
Figure 63-1. Separation of alkyl beniumn at various flow rates. a linear water/melhanol gradient on a 25 x 4 mm tol-

Tip NO. Column dimensions and gradient separations
6 4
Problem/QuestionI know we have already discussed column dimensions for gradient separations in
Tip No. 63, but after several discussions I have had with colleagues out there in thelabs I feel very strongly that the subject has not yet been exhausted.
How often do 1 come across the following situation in gradient separations:!25x4 mm column, flow rate 1 mL mirT1, gradient duration 20 mm. This can be easi-ly changed. If the flow rate were set at 1.5 mLmirT1 the same resolution would beachieved after 13-14 min. In both cases the gradiem volume remains roughly thesame: 1 mL min~'x20 min = 20 mL and 1.5 mL min~' xl3 min= 19.5 mL No doubt,setting the desired gradient volume (and thus the resolution) by adjusting the flowrather than the gradient duration (analysis time decreases!,) is a very elegant method.However, this time we are talking about the volume or the dimensions of the column.How important are they in gradient separations?
Solution/AnswerNot very important, really! Normally, a simple separation will run on a 125x4 mm
as well as on a 50 or a 75x4 mm column. This means in practical terms that if youexpect only 7-10 peaks you should consider abandoning the classic 125x4 mm in fa-vour of a 50 or 75x4 or 4,6 mm. That will save \mi time.
To give you food for thought I would like to id I you about a case where even mi-ni-columns or even pre-columns were used successfully in an ordinary system. In acompany with which we cooperate we ran a quick experiment - trying to transfer asimple separation of five peaks from a 150x4.6 mm to a 10x2 mm, 2 m columnwithout changing anything else in the set-up. It was an immediate success, and the re-tention time was around 4 min. See Figure 64-1. Of course, there is still plenty ofroom for improvement, but in this case, we only wanted to make our point,
ConclusionDuring a gradient, the sample is enriched at the head of the column and then
eluted from the column by raising the elution strength of the eluent. In relativelystraightforward separations where no cumbersome matrices have to be dealt with, thevolume of the column is usually of minor significance, and the optimization shouldbe achieved through adjustment of the gradient volume. In straightforward separationsit is worth thinking twice about using the classical arrangement of 125x4 mm, C1S,5 urn, 1 mL min"1. Remember that small is beautiful - at least in HPLC!
For a detailed discussion on gradient optimization see [2].
159

ConclusionIf there is not a good reason to use one, such as a badly contaminated sample or a
problem matrix, long columns are not a good idea for gradient separations - they aresimply superfluous. If you expect fewer than 10-15 peaks, even 125 mm could seemrather long.
Once you have sorted out the separation set-up you should increase the flow. Youwill be pleased with the result - either the separation will be even better or you willachieve approximately the same resolution in a shorter period of time. The only dis-advantage is that the peak areas will become smaller, but this is the subject of anotherdiscussion.
158

Tip No.6 5
What is the difference between dead timeand dead volume on the one handand selectivity and resolution on the other?
Problem/QuestionAgain and again I find that terminology is nol always used in the same way in
HPLC lab-speak. -As this must result in confusion, I would like to give clear-cut defi-nilions to at least some of the terms.
Solution/AnswerDead lime t0 recently also referred to as JA1 (retention time of an unreiained peak,
solvent peak, front, breakthrough timel is the time all analytes remain in the eluent,i.e., it is the same for all compounds. In other words, it is the time that an inert com-pound (a compound that can diffuse into all the pores of the packing material butdoes not interact with the stationary phase) remains in the eluent. In an RP system,uracil, thiourea or potassium nitrate could be used as markers. Dead time can also becalculated using the following rule of thumb:
L (cm) for 4.6 mm columns'M ~ F (mLmin-1)
L (cm) for 4.0 mm columnsF (mL min""1)
Example: For a 125x4 mm column at a flow rate of 1 mL min"1 the dead time /Mcould be expected to lie around.
tiA « 0.08 • ~- as 1 minNote:Dead lime depends on flow, packing density and dimensions of the column. It is
independent of the stationary phase, the eluent or the temperature. Dead volume isthe volume of the isocratic instrument excluding the column, i.e., the volume of capil-laries, fittings, etc., between the injector and the detector, including the cell. It is bet-ter to call this the extra-column volume, to differentiate it clearly from the columndead time defined above. Depending on the manufacturer, the extra-column volumemay lie between 20 and 120 j.iL!
So just remember: Dead time always includes the columnDead volume always excludes the column
The word dead volume is also sometimes used in the context of column packingand refers to the hollow spaces that can develop in the packing over time. It has noth-ing, to do with the dead volume (i.e., the extra-column volume) of the instrument, butit will kill the peak shapes.
Selectivity describes the ability of a chromatographic system to separate compo-nents. The chromatographic system is a combination of stationary phase and eluent
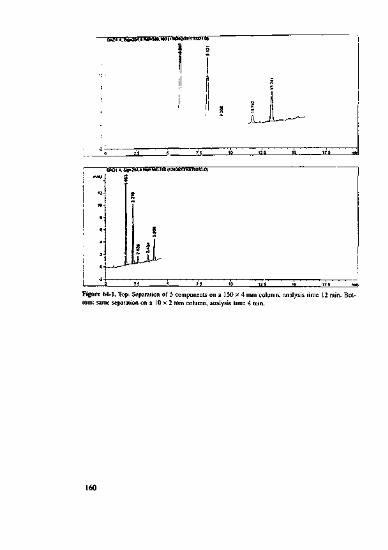
i ii1 • JL.
i
1
15
\LJ-
Figure 64-1. Top: Separation of 5 components <torn: same separation on a 10 x 2 mm column,:
n a 150 x 4 mm columnalysis time 4 min. analysis e 12 min. Bot-
160
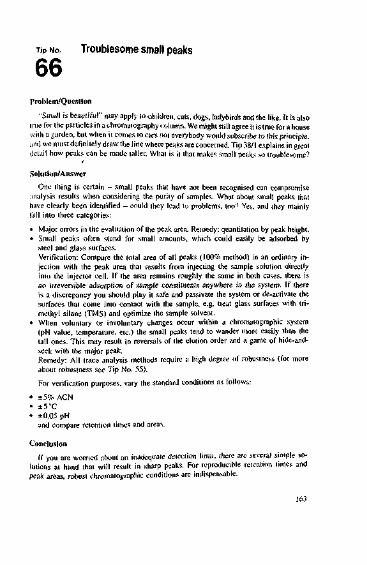
Tip NO. Troublesome small peaks
6 6
Problem/Question"Small is beautiful" may apply to children, cats, dogs, ladybirds and the like. It is also
true for the particles in a chromatography column. We might still agree it is true for a housewith a garden, but when it comes to cars not everybody would subscribe to this principle,and we must definitely draw the line where peaks are concerned. Tip 38/1 explains in greatdetail how peaks can be made taller. What is it that makes small peaks so troublesome?
Solution/AnswerOne thing is certain - small peaks that have not been recognised can compromise
analysis results when considering the purity of samples. What about small peaks thathave clearly been identified - could they lead to problems, too? Yes. and they mainlyfall into three categories:• Major errors in the evaluation of the peak area. Remedy: quantitation by peak height.• Small peaks often stand for small amounts, which could easily be adsorbed by
steel and glass surfaces.Verification: Compare the total area of all peaks (100% method) in an ordinary in-jection with the peak area that results from injecting the sample solution directlyinto the injector cell. If the area remains roughly the same in both cases, there isno irreversible adsorption of sample constituents anywhere in the system. If thereis a discrepancy you should play it safe and passivate the system or de-activate thesurfaces that come into contact with the sample, e.g. treat glass surfaces with tri-methyl silane (TMS) and optimize the sample solvent.
• When voluntary or involuntary changes occur within a chromatographic system(pH value, temperature, etc.) the small peaks tend to wander more easily than thetall ones. This may result in reversals of (he elution order and a game of hide-and-seek with the major peak.Remedy: All trace analysis methods require a high degree of robustness (for moreabout robustness see Tip No. 55).For verification purposes, vary the standard conditions as follows:
• ±5% ACN• ±5°C• ±0.05 pH
and compare retention times and areas.
ConclusionIf you are worried about an inadequate detection limit, there are several simple so-
lutions at hand that will result in sharp peaks. For reproducible retention times andpeak areas, robust chromatographic conditions are indispensable.

including additives and temperature. The measure for selectivity is the separation fac-tor a (formerly known as selectivity factor).
time component A remains on stationary phase~ time component B remains on stationary phase
The prerequisite of a separation is that a>\.Resolution - to put it simply - is the distance between the peaks at the base. Natu-
rally, this is dependent on selectivity, but also on the degree of interaction (capacityfactor) and efficiency (= separation performance measured in theoretical plates) of acolumn. Figure 65-1 illustrates the difference between selectivity and resolution in adiagram.
The selectivity is the same in (a) and (b) (same distance from peak tip to peak tip)because the substances remain on the stationary phase for the same amount of lime.The resolution, however, is poorer in (b) because the efficiency (e.g., due to poorerquality packing or a 'arger dead volume because of wider capillaries) is lower in (b)than in (a).
ConclusionI hate anyone being pedantic and red tape as much as you do, but being clear
about terminology makes life much easier for everybody who deals with HPLC. Theghost of Halloween will love us for explaining clearly all the different dead things inan HPLC instrument.
Figure 65-1. (a) Good selectivity; good resolution, (b) Good selectivity; poor resolution (due to ineffi-ciency of the column = poor separation performance).
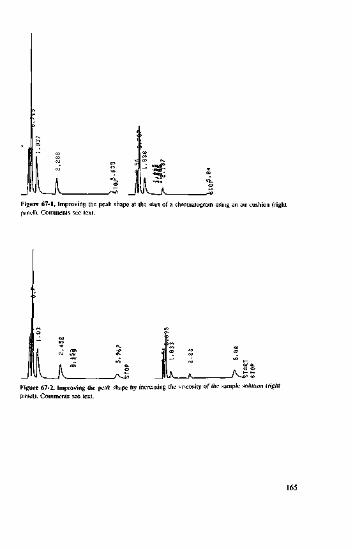
JFigure 67-1. Improving the peak shape at the start of a chromatogram usinpanel). Comments sec text.
Figure 67-2. Improving the peak shupe by increasing the vpanel). Comments see text. jsiiy of the sample solution (right

Tip NO. Lowering the detection limitby optimizing the injection
6 7
Problem/QuestionNowhere is the improvement of peak shapes as crucial as in trace analysis (purity,
siabilit) and toxicily tests, cleaning validation, environmental analysis). If the amountinjected and thus the peak area are kept constant and there is a discrepancy in peakheight, then there must be a minor error in quantification. There are several time-hon-oured methods that will result in narrower or higher peaks, e.g.. thinner or shorter col-umns, smaller particles, lowering the dead volume in the instrument, optimization ofdetection, improving the kinetics (temperature, modifier), etc. Here we will discusssome simple tricks used in the injection process.
Solution/AnswerThere are two approaches:
1. Preventing dilution of the sample zone2. Concentrating the sample onto the head of the column (enrichment)
Discussion of I:Laminar flow causes a dilution of the sample zone. This must be prevented.
• Inject 10 to 20 uL of air together with your sample (take up the air first, then thesample) in order to create an air cushion that prevents the dilution of the samplezone travelling from the injector to the column. See Figure 67-1. Incidentally, thereare injectors that produce such air segments automatically.
• Inject some guanidine, urea or 2% glycerol together with your sample. These sub-stances act as highly viscous stoppers that serve the same purpose as the air bub-bles. Since these substances elute with the solvent front, they won't get in the way.See Figure 67-2.
• Does the loop volume match the injection volume? Did you connect the injectionvalve correctly? Please check!Discussion of 2:You can try and concentrate the sample onto the column head. This will succeed if
the sample solvent is weaker (from an elution strength perspective) than the eluent.Here are three typical cases:Neutral samples, RP system: The sample solvent should be more polar than the
eluent. e.g., eluent 50/50 acetonitrile/water, sample solvent 25/75 acetonitrile/water.tonic substances: Increase the ionic/buffer strength - and thus the polarity - of the
sample solvent, i.e., take a fluid containing more salt than the eluent to dilute thesample, e.g.. eluent 20 mmol phosphate buffer, 50 mmol buffer for the sample dilu-tion.

Tip NO. Setting the parameters of an HPLC instrument
6 8
Problem/QuestionYou are probably aware of the importance of the correct setting of parameters in
an analytic tool, and yet I come across so many systems that are not set at their opti-mum for the particular purpose. What a waste of opportunity, as there is such scopefor achieving sufficient resolution without having to change the column or the eluent.What settings are we talking about?
Solution/Answer1 think we can skip the obvious parameters such as flow, temperature or injection
volume. Table 68-1 gives a brief overview of "secondary" parameters.More about integrator/PC settings and their impact in this context can be found in
ihe section by Hans-Joachim Kuss in Part 2.Each of the points mentioned in the lable can be illustrated by an example. Let us
look at the time constant. See Figures 68-1 and 68-2.If we work with a time constant of 1.1 s (Figure 68-1) we lose out unnecessarily
on resolution and detection limit, compared with working with a time constant of0.1 s under otherwise equal conditions. This means that using a high time constantprevents us from fully exploiting the separation capacity of modern materials.
Figure 68-2 shows three chromatograms - top, at a time constant of 4 s, middle at2 s and lower at 0.1 s. In the top panel, a hump can be distinguished at 1.6 min, whileat 1.3 min there could be something, but this is no more than a suspicion. The graphin the middle clearly shows two peaks on the flank of the large peak, and in the dia-gram below a peak integration is actually possible without any changes to the chro-malographic conditions.
At the top of Figure 68-3, a time constant of 4 s yields three peaks - one of themsitting on the flank of another peak. Once the time constant is reduced to 0.1 s, afurther component can be clearly distinguished from the main peak. Also note thenarrow shape of the first peak. Low time constants can lower the detection limit con-siderably.
Comment:If a change of the time constant does not result in a noticeable change in peak
shape, the cause might well lie in the output of your detector. Check if it is better touse the |0 or 100 rnV output. Or you manipulate at the "bunching factor" or "bunch-ing rate". Sec also the contribution from Hans-Joachim Kuss in Part 2.
ConclusionBefore you eo through the trouble of changing a column or eluent you should opti-
mise the instrument settings, which can be done in a few seconds at the most!

Organic bases: For example if working in an acidic medium, dilute the solvent ina weakly alkaline solvent. The bases are now depmtonated and can be more easily re-tained at the head of the column.Conclusion
If you work in trace analysis, it is worth thinking about optimizing your injectiontechnique.
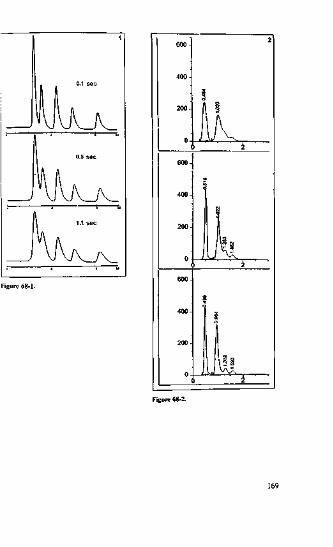
Figure 68-2.

Pump: high (low) pro
Injector: aspiration rale
DetectorI. Time constant, alsc
known as response
2. Slit width in DAD
PC: sample rale
Effect CommentAutomatically switches on or off This is often set too low, deprivingwhen a given pressure value is you of the opportunity to workreached with higher flow rates and cut
down on analysis time. Ordinarycolumns can take pressures up to300-350 bar with hardly any lossin efficiency
Speed at which the sample solution If the speed is too high for a vis-is taken up by the syringe cous solution, air bubbles will form
and affect the reproducibilily ofthe injection. Also when usingwater as the sample solvent chnosca slow aspiration rate!
This is the time a detector needs toregister 66% of a signal, in otherwords the response time of the de-tector: how long does the detectortake to respond to the analyte?Controlling the amount of lightthat falls into the detector cell
The number of data recorded persecond
A small time constant (e.g. 0.1 s)results in narrow peaks while alarge one produces wide peaks{e.g. 2 s)
A narrow slit gives good opticalresolution (good UV-spectrum) butaffects sensitivity (detection limitgoes up), while a wide slit keepsthe detection limit low at the ex-pense of good optical resolutionSame effect as with the time con-stant, e.g., at a sample rate of twodata points per second narrowearly-eluting peaks can be com-pletely obliterated unless they olutein a broad band
168
Tip No.6 9
The right wavelength -old hat to some, a revelation to others
Problem/QuestionFor quite a while, I was not at all sure whether I should write an HPLC tip on such
trivia, but after I spent half a day on a wild-goose chase for lost peaks and ended upswearing in Greek, standard German and the Saarbruecken dialect, I decided some-thing had to be done about this. I urgently advise you before you begin optimizing aseparation or look for errors, to check whether your wavelength is set at the optimumor at least correctly. Well, you may think I am exaggerating - until you get yourselfinto the same trouble.
Solution/AnswerWell, maybe you are more meticulous or smarter than most or the rest of us, but
here are three real-life examples of this problem:
Analysis of active ingredients {Figure 69-1):There was a lively discussion in a lab on how best to integrate the peak (a contam-
ination) sitting on the flank of the first peak (left panel, 254 nm). An injection at300 nm yielded a chromatogram as shown on the right. Need I say more, especiallyas, given the correct scale, the peaks can be plotted just as "wonderfully" as on theleft?
Pharmaceutical analysis (Figure 69-2):To integrate the peak on the flank at 1.66 (right panel, 220 nm) is a brave decision,
lo say the least. At 280 nm the integration is quite unproblematic, sec the left panel.
Environmental analysis (Figure 69-3):When monitoring the direct discharge of waste water it is sufficient to monitor the
areas of certain lead substances - peaks Nos. 6, 7 and 45 in our example. At 254 nm,peak No. 45 cannot be properly integrated (top panel). To impiove the chromato-graphic resolution would probably be a complicated procedure. At 280 nm, however.quantification does not pose a problem (bottom panel).
ConclusionBefore you do anything else, optimize your instrument settings. This should
become second nature to you. Here we discussed the detector settings. See also TipNo. 68 for some things that you can do with respect to the injection.
171
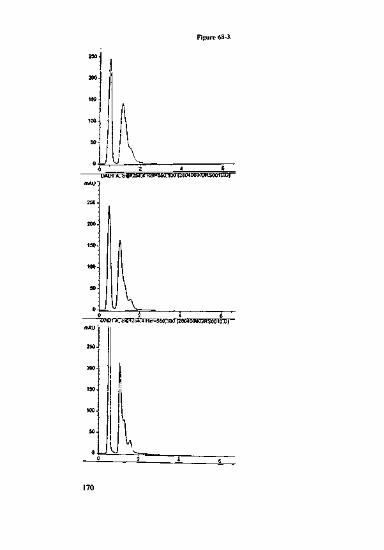
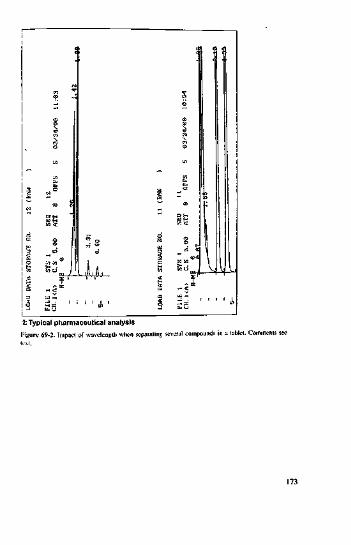
2: Typical pharmaceutical analysisFigure 69-2. Impact of wavelength when separating several cmpounds in a table!. Comments see

1:Active ingredientFigure S9-1. Impact of wavelength on the separation of two active: substances plus contaminaiions.
172
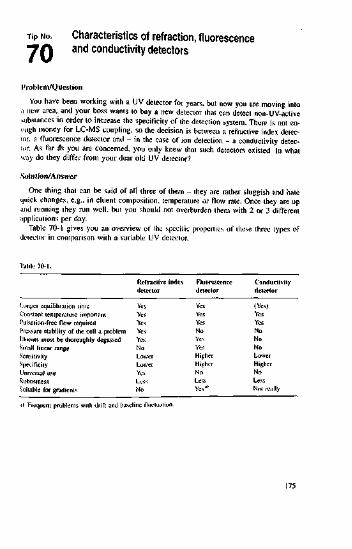
Tip NO. Characteristics of refraction, fluorescence"7fl and conductivity detectors
Problem/QuestionYou have been working with a UV detector for years, but now you are moving into
a new area, and your boss wants to buy a new detector that can detect non-UV-activesubstances'in order to increase the specificity of the detection system. There is not en-ough money for LC-MS coupling, so the decision is between a refractive index detec-tor, a fluorescence detector and - in the case of ion detection - a conductivity detec-:or. As far a*s you are concerned, you only knew that such detectors existed In whatway do they differ from your dear old UV detector?
Solution/AnswerOne thing that can be said of all three of them - they are rather sluggish and hate
quick changes, e.g., in eluent composition, temperature or flow rate. Once they are upand running they run well, but you should not overburden them with 2 or 3 differentapplications per day.
Table 70-1 gives you an overview of the specific properties of these three types ofdetector in comparison with a variable UV detector.
Refractive indexdetector
Fluorescent!detector Conduct! v
detectorLonger equilibration timeConstant temperature importantPulsation-free flow requiredPressure stability of the cell a problemEhients must be thoroughly degassedSmalt lineaSensitivitySpecificityUniversal useRobustnessSuitable for gradi
nge
YesYesYesYesYesNoLowerLowerYesLessNo
YesYesYesNoYesYesHigherHigherNoLessYes1"
(Yes)YesYesNoNoNoLowerHigherNoLessNol really
i) Frequent problems with drift and baseline flui
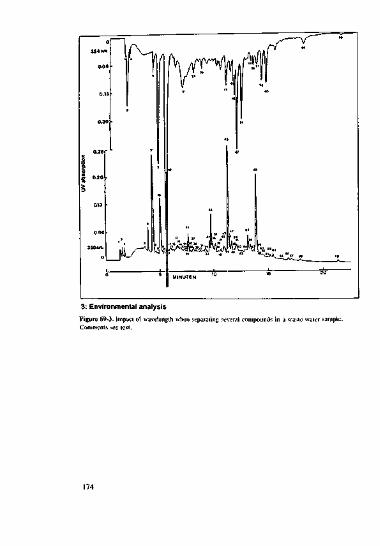
3: Environmental analysisFigure 69-3. Impact of wavelength when separatingComments see text. sample.

Tip No. Does it always have to be HPLC?
7 1
Some of you may ask "What a strange question to ask - and in an HPLC textbookof all places'?" Well, let us have a closer look...Problem/Question
You are determining the amount of an active ingredient, for example, from a tabletor after dissolution. Or it could be that you have to check whether the container is ab-soluicly clean before it is used for the next production batch (cleaning validation).You may end up with a single peak. Your column is short, say 50 mm, and the chro-iratogram takes only 6 min. If everything goes well and you are happy then there isno need to change anything. Just skip the rest of this page and go on to the next tip,
However, at seminars and in labs I keep hearing complaints about such cases, forexample:• We have a memory effect. The area keeps decreasing. The retention time is not
constant. It seems that the problem lies within the column.» A retention time of 6 min is far too long. We need a greater throughput for the dis-
solution test.What can be done in these cases?
Solution/AnswerJust leave out the column!Since we are dealing with only one peak, we do not really need a column because
there is no need for separation. What matters is the peak area, not the ehromatogra-phy. There is nothing for it but to replace the column with a capillary.
Use a PEEK (polyether ether ketone) restriction capillary instead of a column,maybe 1-2 m long. Set the flow to 0.3-0.5 mL min""1. This low flow rate requires asmaller injection volume (remember, flowxpeak area=constant). The restricting capil-lary should have 10-20 knots, see Figures 71-1 and 71-2 in order to avoid those ed-dies and laminar flow that tend to broaden the peaks.
Note: Diffusion in a laminar flow is slow, with turbulent flow it is quicker. Withturbulent currents, the middle velocity amounts to 80%. with laminar flow approxi-mately 50% of the maximum velocity (velocity vector). The length of the capillaryand the injection volume must be carefully matched.

ConclusionThe binary ("yes/no") statements in the table are just a rough guide. In trace analy-
sis for example, consistency in flow is crucial even when a UV detector is used, anda conductivity detector can detect minute ion concentrations only if the eluent hasbeen thoroughly degassed.
Some of these detectors are very specific, which makes them indispensable for cer-tain applications (sugars, inorganic ions, PAHs. etc.). As long as you accept their idio-syncrasies and let them do their job (a very therapeutic exercise for interfering busy-bodies!) they will perform wonderfully for you.
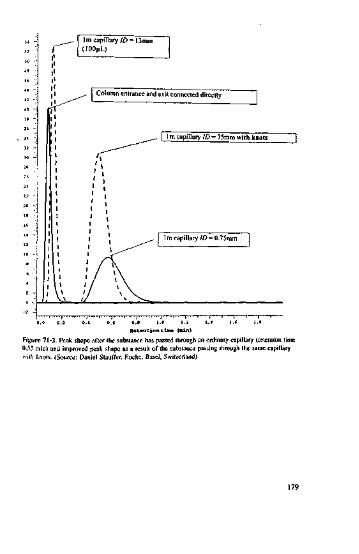
Column entrance and exit connected directly
K«tanCion Cina (nln)Figure 71-2. Peak shape after the substance has passed ihrough an ordinary capillary (retention time
h i0.55 ruin) and improved peak shape as a result of the substance passing through the sawith knots. (Source: Daniel Stauffer, Roche, Basel, Switzerland). e capillary

:c :ext (Source: Daniel Stauffcr, Roche. Basel, Swit-
ConclusiunSometimes, analysis is about identification rather than separation, in which case
you should have the courage to leave out the column. You can thus avoid a majorsource of errors and dramatically increase the throughput in your routine analysis.Using your real standards (analyte plus matrix, auxiliary substances, salicylic acid orprednisolone in dissolution tests), you can check whether the changes you made inyour instrument set-up had a positive or negative effect on variance, robustness, etc.
If you are still not convinced mat you can do without a column, just use a 10 mmor 20 mm pre-column as your separation column - that's all you really need.

Figure 72-1. Selectivity in acid pliosphate bufl'er/meihaiink1 (right). Comments see text. icid phosphate buffer/ace to i
Conclusion1. Eluents containing methanol can enhance the ability of phases for polar interaction.
In difficult separations - and only then! - preference should be given to methanol.The resulting broadening of peaks is unavoidable.Remember to use methanol for the separation of stronger acids, strongly polar me-tabolites and isomers. Choose acetonitrile for neutral molecules and organic basesprovided the selectivity is sufficient (see also the tips in the section on phases).
2. In extreme gradient runs on hydrophobic RP phases it is better to choose acetoni-trile. Thus, the phase surface remains wetted over a wider range of polarity than ifusing methanol, and acetonitrile ensures a better reproducibility of retention timein the early peaks than methanol would.
181
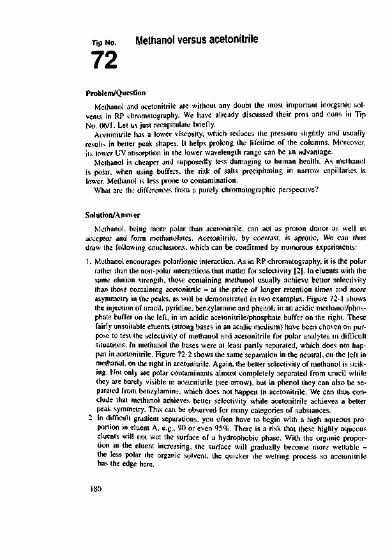
Tip No.7 2
Methanol versus acetonitrile
Problem/QuestionMethanol and acetonitrile are without any doubt the most important inorganic sol-
vents in RP chromatography. We have already discussed their pros and cons in TipNo. 06/1. Let us just recapitulate briefly.
Acetonitrile has a lower viscosity, which reduces the pressure slightly and usuallyresults in better peak shapes. H helps prolong the lifetime of the columns. Moreover,its iower UV absorption in the lower wavelength range can be an advantage.
Methanol is cheaper and supposedly less damaging to human health. As methanolis polar, when using buffers, the risk of salts precipitating in narrow capillaries islower. Meihanol is less prone to contamination.
What are the differences from a purely chromatographic perspective?
Solution/AnswerMethanol. being more polar than acetonitrile, can act as proton donor as well as
acceptor and form methanolates. Acetonitrile, by contrast, is aprotic. We can thusdraw the following conclusions, which can be confirmed by numerous experiments:1. Meihanol encourages polar/ionic interaction. As in RP chromatography, it is the polar
rather than the non-polar interactions that matter for selectivity |2|. In eluents with thesame elution strength, those containing methanol usually achieve better selectivitythan those containing acetonitrile - at the price of longer retention times and moreasymmetry in the peaks, as will be demonstrated in two examples. Figure 72-1 showsthe injection of uracil, pyridine, benzylamine and phenol, in an acidic mcthanol/phos-phate buffer on the left, in an acidic acetonitrile/phosphate buffer on the right. Thesefairly unsuitable eluents (strong bases in an acidic medium) have been chosen on pur-pose to test the selectivity of methanol and acetonitrile for polar analytes in difficultsituations. In methanol the bases were at least partly separated, which does not hap-pen in acetonitrile. Figure 72-2 shows the same separation in the neutral, on the left inmethanol, on the right in acetonitrile. Again, the better selectivity of methanol is strik-ing. Not only are polar contaminants almost completely separated from uracil whilethey are barely visible in acetonitrile (see arrow), but in phenol they can also be se-parated from benzylamine, which does not happen in acetonitrile. We can thus con-clude that methanol achieves better selectivity while acetonitrile achieves a betterpeak symmetry. This can be observed for many categories of substances.
2. In difficult gradient separations, you often have to begin with a high aqueous pro-portion in eluent A, e.g., 90 or even 95%. There is a risk that these highly aqueouseluents will not wet the surface of a hydrophobic phase. With the organic propor-tion in the eluent increasing, the surface will gradually become more wettable -the less polar the organic solvent, the quicker the wetting process so acetonitrilehas the edge here.

Tip No.7 3
Tale of a foursome pub-crawl - can peaks elutebefore the front?
Problem/QuestionWe all know the meaning of dead time tM (solvent front, breakthrough time, sol-
vent peak, air peak). It means the time a substance takes to travel from the injectionpoint to the detector - unless it is caught up on the stationary phase. This could behappening to a sample compound that shows inert behaviour within the given chroma-tographic system. Its elution time should therefore coincide with the elution time of
•an eluent molecule, and no substance should elute before /M. No substance could befaster than, say, a methanol molecule - or could it?Solution/Answer
Yes, peaks eluting before the front are indeed possible, and they arc real samplecomponents. We arc not talking about ghost peaks, memory effect, peaks from a pre-vious injection or contamination from an eluent. etc.
Explanation:An inert molecule is a molecule that can diffuse into the pores of the packing with-
out interacting with the stationary phase. It simply diffuses out of the pores again,into the next one and so on and elutes at tM. If it is a large molecule such as a poly-mer, it cannot diffuse into the pores. It is excluded and has to remain in the space be-tween the particles known as interstitial volume. As a consequence, it elutes before/N1. in what is called interstitial retention time i\, see Figure 73-1.
Some of you may now say. "Well, that's all very interesting, but it does not con-cern me. I am only dealing with small molecules." Nevertheless, you might comeacross some form of exclusion. Some strongly ionic .substances such as salts withtheir high charge density or bases with their positive charge in a neutral or acidic elu-ent are downright rejected by silanol groups, due to the Donan potential (like chargesrepel each other). Thus, even small molecules may elute before /M. See Figure 73-2,where NaCl elutes before the dead time.
The two bases in Figure 4-1. Tip No. 4. also elute before uracil. If you work fre-quently with strongly ionic substances, this may happen quite often.Conclusion
The first early peak in a chromatogram is not necessarily the inert peak - in otherwords: an elephant, a quarrelsome person, a tee-totaller and a sociable individual gopub-crawling together and make arrangements - just in case - to meet up again in thehotel at the reception desk (our detector). The elephant does not fit through any doorof the pubs, and the quarrelsome person cannot get past the bouncers. The poor soulsare soon back in the hotel (rL). The tee-totaller is allowed into the pub, but he doesnot want to drink, so he comes back at midnight (/M). The sociable person is havinga whale of a time and does not come back to the hotel until 3 a.m. (/R) - well, per-haps not in the best of shape, but still recognizable.

Figure 72-2. Selectivity ii(righi). Comments sec tex
erAiiethanol cluunl (left) and ii:ulrai watcr/acetonitrile cluent
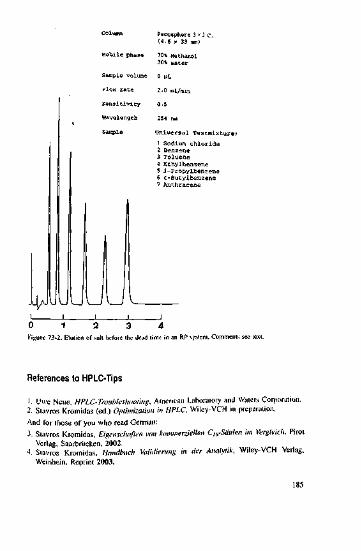
Column
Mobile phaseSample volumiflow rateSensitivityWavelengthSample
Pecosphere 3"3c,(4.6 x 33 mm)70% «ethanol30* water
2.0 ml/oin0.52S4 rmUniveri1 Sodium chloride2 Benzene3 Toluene4 EChylberizene5 J-Propylbenzene6 fc-Butylbenzene1 Anthracene
0 1 2 3Figure 73-2. Elulion of salt before the dead tin RP system. Comm
References to HPLC-Tips1. Uwe Neue, HPLC-Tmubleshooting, American Laboracory and Waters Corporation.2. Slavros Kromidas (ed.) Optimization in HPLC, Wiley-VCH in preparation.And for those of you who read German:3. Stavros Kromidas, Eigenschaften van hmtmerziellen Ca-SUulen im Vergleich, Pirot
Vcrlag, Saarbriicken, 2002.•1. Stavros Kromidas, Handbuch Valiiliemng in der Analytik, Wiley-VCH Verlag,
Weinhein, Reprint 2003.
185
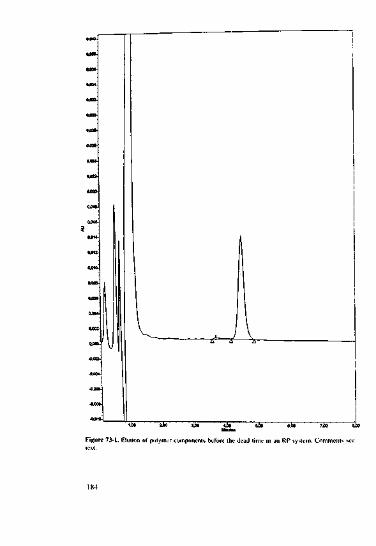
ajau-«02-
0.012-
-0.00-
ibo' ' ' ' ajxt' ' *bo ' ROD ' ' e5T " "7i»' ' ' 8.1Figure 73-1. Elution of polymer eomponenLs before the dead limu in an RP system. Comments sec
2 LC-MS Coupling, Micro- and Nano-LC,Quantification
2.1 LC-MS Coupling
liiediich Mandet
LC-MS - The one and only universal tool?If you are already using an LC-MS system or are planning to do so you must have
good reasons for it, and buying one does not mean you should discard "traditional"optical detection techniques altogether. While detection limit, selectivity and strengthof evidence of LC-MS(/MS) may be unequalled, the initial investments in equipmentand time are considerable before a rock-solid LC-MS method can be established. Ingeneral, all LC-MS detection methods are not as linear as UV detection and they pro-vide a smaller dynamic range and lower reproducibilhy. IF you determine compoundsin complex sample matrices, you should give some thought to interferences of thesample matrix and the analyte signal.
Why this substantial investment in manpower and equipment? It will save you timewhen developing new methods of detection. This is not a contradiction to what hasbeen said above because while it may take longer to develop a detection method, thisextra investment is compensated for many times over by the resulting simplificationof sample preparations and chromatographic separations. LC-MS is the method ofchoice when it comes to quick chromatography of complex samples. Those of us whohave spent most of their career perfecting the art of baseline separation will find thatLC-MS means a change of paradigm - the quantification of co-eluting peaks. Thismeans that the buffer system has to be chosen and optimized with respect to the de-tector rather than chromatographic separation. Compared with UV detection, LC-MSoffers not only more rapid separations but also better detection sensitivity. Fragmenta-tion patterns provide the possibility for unambiguous identification of substances.However, the LC-MS spectral libraries are still in their early stages - what is lackingis a standardization of instrumental parameters.
Similar to driving a car, where you won't reach your destination without havingconsidered some of the rules of physics, you cannot "just start" with LC-MS. In thefollowing LC-MS tips we will show you how to find the LC-MS technique that besttits your analytical problem. You will also learn about the strengths and weaknessesof the various LC-MS techniques as well as to recognize possible sources of errorand how to minimize them. As you may already know - the LC-MS technique thatfits everything does not exist, unfortunately. You have the opportunity to choose fromvarious ionization techniques and mass analysers, the application ranges of whichmostly overlap. This is why we will compare the most common ionization techniquesand discuss their advantages and disadvantages in the following sections. No need tobe scared, this will not end up in a lesson on ion physics - it will be a rather prag-matic approach to questions such as, "How does the charge gel on my molecule?"and "How can I detect the charged molecule?" My intention is to describe not only
M"n- Prat-iical Problem Solving iu HPLC. S. Kromidaj.Cop) right © 2005 WILEY-VCH Verlag GmbH & Co. KG;iA. WeirISBN: 3-527-31113-0187

Tip NO. Choosing the right LC-MS interface
7 4
In all decisions you take in LC-MS, [he most important criterion is innization.Whatever you may undertake in order to achieve highly sensitive, highly selectiveand/or high-resolution measurements - it is most important to ionize the analytes asgently as possible. A mass spectrometer is only capable of measuring either positivelyor "negatively charged molecules ("pseudomolecular ions"). Unfortunately, very often,the chemistry of these ions doesn't make it easy for you — the analytes to be mea-sured can cover a wide range of polarities and molecular weights. They may also bemore or less thennolabile (otherwise we would use GC-MS instead of LC-MS). In ad-dition, a mass spectrometer has to be operated at high vacuum. Therefore, we Firsthave to evaporate the mobile phase and then remove it from the analytes ("desolva-liorT). As we will see in the following sections, some LC-MS interfaces are capableof handling high LC flow rates, while others show their strengths at low flow rales.Whatever technique you choose, it will be an API technique (atmospheric pressureioni/ation), such as API-electrospray (ESI), atmospheric pressure chemical ioni/aiion(APCI) or atmospheric pressure photoionization (APPI). All other interfacing tech-niques (thermospray, particle beam) are either just of historical interest or they arenot suitable for routine work.
Polar, thermolabile analyte, high molecular weight -shall I use capillary or nano-HPLC?
Try electrospray first! Before you begin you should understand how it works. Infact, electrospray is not a method for ionizing analytes, but a way of releasing cations
ESI
APPIAPCI
Figure 74-1. Applicationranges of API techniques
non-polar Polarity polar
189
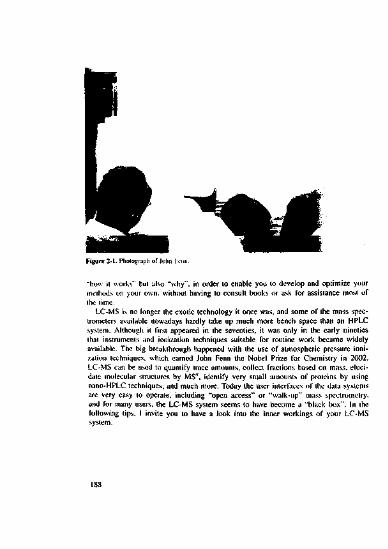
Figure 2-1. Photograph of John"how it works" but also "why", in order to enable you to develop and optimize yourmethods on your own, without having to consult books or ask for assistance most otthe time.
LC-MS is no longer the exotic technology it once was, and some of the mass spec-trometers available nowadays hardly take up much more bench space than an HPLCsystem. Although it first appeared in the seventies, it was only in the early ninetiesthat instruments and ionization techniques suitable for routine work became widelyavailable. The big breakthrough happened with the use of atmospheric pressure ioni-zation techniques, which earned John Fenn the Nobel Prize for Chemistry in 2002.LC-MS can be used to quantify trace amounts, collect fractions based on mass, eluci-date molecular structures by MS", identify very small amounts of proteins by usingnano-HPLC techniques, and much more. Today the user interfaces of the data systemsare very easy to operate, including "open access" or "walk-up" mass spectrometry,and for many users, the LC-MS system seems to have become a "black box". In thefollowing tips, I invite you to have a look into the inner workings of your LC-MSsystem.
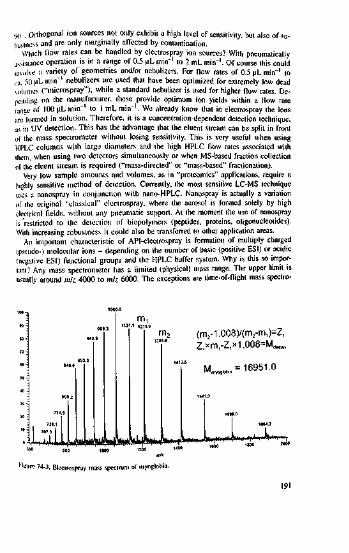
cjo . Orthogonal ion sources not only exhibit a high level of sensitivity, but also of ro-busliiess and are only marginally affected by contamination.
Which flow rates can be handled by electrospray ion sources? With pneumaticallyassistance operation is in a range of 0.5 uL min"' lo 2 mL min"'. Of course this couldinvolve a variety of geometries and/or nebulizers. For flow rales of 0.5 uL min"' toa. 50 uL min"' nebulizers are used that have been optimized for extremely low deadvolumes ("microspray"), while a standard nebulizer is used for higher flow rates. De-pending on the manufacturer, these provide optimum ion yields within a flow raterange of 100 ML min"' to I mLmin"'. We already know that in electrospray the ionsare formed in solution. Therefore, it is a concentration-dependent detection technique,as in UV detection. This has the advantage that the eluent stream can be split in frontof the mass spectrometer without losing sensitivity. This is very useful when usingHPLC columns with large diameters and the high HPLC flow rates associated with[hem, when using two detectors simultaneously or when MS-based fraction collectionof the eluent stream is required ("mass-directed" or "mass-based" fractionation).
Very l°w sample amounts and volumes, as in "proteomics" applications, require ahighly sensitive method of detection. Currently, the most sensitive LC-MS techniqueuses a nanospray in conjunction with nano-HPLC. Nanospray is actually a variationof the original '"classical" electrospray, where the aerosol is formed solely by highelectrical fields, without any pneumatic support. At the moment the use of nanosprayis restricted to the detection of biopolymers (peptides, proteins, oligonucleotides).With increasing robustness it could also be transferred to other application areas.
An important characteristic of API-eleclrospray is formation of multiply charged(pscudo-) molecular ions - depending on the number of basic (positive ESI) or acidic(negative ESI) functional groups and the HPLC buffer system. Why is this so impor-tant? Any mass spectrometer has a limited (physical) mass range. The upper limit isusually around mil 4000 to mil 6000. The exceptions are lime-of-flight mass spectro-
848,6
3 808.2771.5
738707.3
89:3
9919 2
m-1 12
LtLl
1" ,Z2 (m;-1.008)/(m2-m,)=Z,
Z,xm,-Z,»1.008=MMm
" M^m = 16951.0
1541.91696.0
1964.2Lu i l l r-i -,
? 74-3. Electrospray mass spectrum of myoglobin.
191

or mions thai have been formed in the HPLC buffer system by the acid/base equilib-riumTOs aspect is of fundamental importance when you develop your LC-MS meth-ods or when you are troubleshooting with your system. You should therefore choosePH conditions that force the formation of free analyte cations or anions in solution.The selection of "MS compatible" mobile phases will be the topic of one of the lipstO follow. .
API-electrospray usually utilizes a pneumatic nebulizer in order to convert the elu-ent into an aerosol. This is also called "pneumatically assisted electrospray" or "Ion-Spray*" The aerosol is then sprayed into an electrostatic field. A high voltage of sev-eral kilovolls is applied between the nebulizer and the entrance of the ions into thevacuum system ("orifice"). Depending on the polarity of the charged analyte mole-cules, the resulting aerosol droplets carry a positive or negative net charge. Thiscauses them to be attracted towards the orifice or the ion transfer capillary where theyare transferred to the ion optics of the mass spectrometer. II is important not lo intro-duce the charged droplets into Ihe mass spectromeler. This would trigger a high back-ground signal and therefore negatively affect detection sensitivity. Modern ion sourcedesigns are therefore based on an orthogonal geometry, spraying Ihc clucnt al a 90'angle onlo Ihe ion entrance and the ion palh. Simultaneously, heat is applied via astream of heated nitrogen, in order to evaporate Ihc solvent from the aerosol droplets.On their way towards Ihe orifice or ion transfer capillary, the droplets undergo a cas-cade of shrinkings and explosions into smaller droplets ("Coulomb explosions") in or-der to stabilize the droplet's surface charge. Also (pseudo-) molecular ions are sponta-neously emitted from the droplets. Orthogonally designed ion sources ensure that al-most exclusively desolvatcd (pseudo-) molecular ions find their way into the massspectrometer. Because of their high mass, residual droplets cannot be deflected by
CapillaryFigure 74-2. Schematic representa-tion of an API-elcclrospray ion
190

n API-electrospray at allf is not pH value of
ionize analytes of weak polarity, which are not aCtxor only under extreme pH conditions. In APCI the tU,,, .acior is not pH value ofthe mobile phase, but the gas phase acidity/basicity. This allows you to optimize thepH of the mobile phase solely for chromatographic separation without also having toconsider the mass spectrometer. In addition, in APCI you will not find "mixed ioniza-lion" caused by protonaiion and alkali adduct formation, As we will see in one of thesubsequent tips, APCI methods show a more linear response than API-clectrospraymethods and also suffer less from ion suppression effects.
Still no signal, analyte difficult to evaporate or non-polar,APCI not sensitive enough?
Although it is not yet a commonly used method. APPI could be the answer to yourproblems in analysis. Atmospheric pressure photoionization is a slight modification ofAPCI- After the evaporation step, the analyte and [he mobile phase are sprayed past akrypton UV lamp emitting light energy of 10 and 10.6 eV. This excitation energy in-ciuces photoionization of the analytes, the ionization energy of which, of course, hasto be below 10 or 10.6 eV, respectively. The widely used HPLC mobile phases, suchas water, methanol, acetonitrile and hexane. exhibit ionization energies above the ex-citation energy and will thus not be ioni/.ed. This first photoionization step leads tothe formation of a radical cation, to which a hydrogen atom originating from a non-ionized solvent molecule may be transferred. Sometimes, the radical cation and themolecular cation can be detected alongside each other. Should the detection sensitiv-ity of this direct photoionization not be sufficient, you can easily add an ionizablemodifier ("dopants") to the mobile phase directly in front of the ion source (about 5%v/v to the cluent). The photoionized dopant then serves as a proton donor, ionizingthe analyte. Typical dopants or modifiers are acetone and toluene. Acetone is also anexcellent donor of thermalized electrons, which can be used for analytu unions after
Vaporizer
UVCamp Figure 74-5. Schematics of ansource.

meters with hieh acceleration voltages. You probably know that in mass spectrometryit is always the mass/charge ratio that is determined. Only the ability of electrosprayto form multiply charged ions enables us to measure proteins of molecular weightsabove 100000 Da. Figure 74-3 shows the mass spectrum of a small protein. Eachpeak represents the various charged states of the molecular ion.
Low polarity, high HPLC How rates, volatile analyte?In this case. APCI is your interface of choice. The difference in construction be-
tween APCI and API-eleclrospray is minimal, however essential for the ionizationprocess. Unlike in electrospray, we do not make use of the ions formed in solution.but generate them in the gas phase instead. The aerosol formed from the mobile phaseand the analyte is sprayed into a heated ceramic or glass cartridge and completelyevaporated. That vapour is sent past a needle, to which several kilovolts are applied,and at the tip of which an corona discharge is formed. The plasma produced in theprocess enables chemical ionization to take place. While colliding with the (still) neu-tral analyte molecules, the ionized solvent molecules act as proton donors or accep-tors. The difference in proton affinities between the molecules colliding with eachother is important. With electronegative analyte molecules we can also observe elec-tron capture processes. As the charges are transferred to the analyte molecule throughsingle collisions, we only generate singly charged molecular ions in APCI. Of course,this limits the molecular weight range that is detectable compared with electrospray.A further restriction in the application of APCI is the need to evaporate the analytewithout thermal degradation - a step many thermolabite compounds do not survive.Therefore, the vaporizer temperature is an important parameter in APCI method de-velopment.
What are the reasons in favour of APCI as a detection technique in LC-MS? It isideally suited for high HPLC flow rates. Most APCI source designs reach their opti-mum performance at 0.5-1.5 mLmin"1. A great advantage of APCI is its ability to
Vaporizei
Capillary Figure 74-4. Schematics of an APCI iisource.
192
Tip NO. Which mobile phases are compatible with LC-MS'
7 5
You may have anticipated it already - that as an LC-MS user you will have to saygoodbye to a good old friend - the phosphate buffer. As you will see in a minute,there are exceptions to any rule. However, when converting existing HPLC methodsinio LC-MS or by developing new methods, you should base all of them on volatilebuffer systems. Before we start discussing buffers - let us talk about which solventswork best with which LC-MS interface.
The solvents
The following solvents are compatible with API-electrospray and APCI: alcohols,acctonitrile, tetrahydrofuran (THF), water, acetone, dimethyl formamide, methylenechloride and chloroform. If. in APCI, you at least partially replace acetonitrile withmethanol, you will enhance detection sensitivity as well as the long-term stability ofthe analyte signal. This is because gaseous acetonitrile is a relatively strong base andtherefore competes with the analytes for protontuion. Additionally, acetonitrile tendsto polymerize in the APCI plasma, coating the corona needle with an insulating layerafter some hours of operation. Consequently, more frequent abrasive cleaning of theAPCI needle will be required. Dimethyl formamide should be below \Wo v/v when run-ning API electrospray, while in APCI you should be prepared for a high background sig-nal. In APCI, THF also tends to polymerize, in particular when it contains traces of per-oxides. There is a trick to minimising the precipitate in the APCI ion source. Just beforethe mobile phase enters the ion source, you should add about 5% v/v of water. This alsostabilizes the corona discharge while running THF. Halogenated hydrocarbons can en-hance the ion yield when used as modifiers in APCI. In API-electrospray they showneither a positive nor a negative influence. In general, the less protic your solvent is,the less it will be suited for API-electrospray (acid/base equilibrium).
In APCI we make use of the mobile phase as a "'reagent gas" for chemical ioniza-lion of the analyte. Therefore, besides the ones already mentioned, aliphatic and aro-matic hydrocarbons are also permitted, as well as CS; and CC14. Toluene is an excel-lent proton donor in APCI.
The additivesWhat should be used instead of phosphate buffers? The most important rule is to
use volatile buffer additives and to use organic acids. I can hear the screams of protestof the experienced HPLC user. But, to be honest, most of the analytes can be sepa-rated sucessfully in an "MS-compatible" way by using the modern RP column materi-al*. Please take into account that mass spectrometers are able to d.fferentiale betweencompounds by the mlz signal if they cannot be separated chromatograpnicaliy j o>™r validated methods that use phosphate buffers, I will tell you what the exceptionlroni that rule is.lroni that rule is.
19?

an electron capture step. The optimum HPLC flow rates for APPI are in the range of0.5mLmin~'.
It is amazing which non-polar compounds can be analysed using APPI. It js theone and only ionization technique that enables the sensitive formation of polycyclicaromatic hydrocarbon cations. In contrast to APCI. the ionization process in APPI isnot neeatively affected by residual aerosol droplets. Because of this, the vaporizer canbe operated at lower temperatures. Of course, this helps in the detection of thermola-bile compounds that are not detectable by API-electrospray. In general, the sensitivityof APPI is fairly comparable to APCI. However, in APPI the range of analyte polarityand thermolability is significantly wider than in APCI.
194
Tip NO. Phosphate buffers - the exception
7 6
Please do not interpret the following hint as a general licence to follow old habitsof working with phosphate buffers. Do not deviate from the iron rule of developingany new LC-MS methods by using volatile buffers. But what if you have to investUgate a cinematographic peak - and unfortunately the method had been extensively de-veloped and/or been validated using phosphate buffers? In this case, you might be al-lowed to work with the "forbidden" buffers. However, you should be prepared for aheavy contamination of the spray chamber and a major cleaning-up effort. Many ionsource designs will allow you to keep your tools on hand. Please also consult themanufacturer of your mass spectrometer or other users of the same instrument type.
How does it work?Remember the first tips. If you want to determine analyte cations, then electrospray
suffers from a dramatic loss in detection sensitivity with sodium or potassium phos-phate buffers. The reason for this is the suppression effect caused by the alkali cationsin the aerosol. Therefore you should select APCI as an ionization technique whileusing these non-volatile buffers. In APCI, both analyte and mobile phase are evapo-rated before the ionization step. Of course, non-volatile buffer components will pre-cipitate as a white powder in your ion source. Nevertheless, the analytes will be pro-tonated in the corona discharge. Because of the severe contamination of the ionsource, your LC-MS system will 'survive" this procedure for only a few hours oreven just for a single chromalographic run. depending on the buffer concentration.When looking for analyte anions, however, you should choose API-electrospray in-siead of APCI. The reason is that the phosphate anion is volatile enough to be elimi-nated from the aerosol droplets, similarly to the analyte anions. However, please beaware of some reduction in sensitivity. The mass spectrometer will "forget" the phos-phate buffer treatment rapidly. Your HPLC system and your column however will de-liver alkali cations even weeks later, causing unwanted and often very disturbing ad-duct formation.
SummaryIn few exceptional cases (!) you can operate your LC-MS system with non-volatile
buffers. Use APCI for the detection of cations and API-electrospray tor the detection"I' anions. Be prepared for the rapidly increasing contamination of your ion source as«ell as for the frequently required cleaning procedures. Preferably use a separateHPLC system with non-volatile additives.
197

However, let us discuss the additives first:Use ammonium acetate or formate to buffer the pH. Acidify the pH by adding
acetic acid, formic acid, trifluoroacetic acid (TFA) when running positive ion electro-spray and adjust to a basic pH in negative ion electrospray by adding ammonia,triethylamine (TEA) or A'-methyl morpholine. Another rule is to use a buffer concen-tration as low as possible - below lOmmolL"' in electrospray and maximum100 mmol L"' in APCI or APPI. Please take into account that TFA is a weak ion-pair-ing reagent and therefore reduces the detection sensitivity for many analytes. So avoidthe use of even low TFA concentrations if you frequently change ion polarity in elec-trospray. The TFA anion gives a permanent background signal at mlz 113. If you needa basic pH for either the chromatographic separation and/or the ionization, you shoulduse ammonia instead of TEA. Ammonia will not show any memory effect in yourHPLC system while TEA shows a background signal at mlz 102 during subsequentmeasurements in positive ion electrospray. Both with TFA and TEA it could take daysuntil the background signal has dropped to an acceptable intensity level.
Why all that worry about volatile buffers and low buffer concentrations? After eva-poration of the solvents, non-volatile buffers will precipitate inside your ion sourceand. depending on the ion source geometry, will soon block the ion entrance or willcause current leakage or shortings. Even if this does not occur, the alkali cations willblock the aerosol droplet surfaces (potassium or sodium phosphate) in electrosprayionization and hinder the emission of the analyte ions. The need for low buffer con-centrations is also easily explained. With all API techniques, a cloud of charged spe-cies is formed together with the ionized sample matrix and buffer additives. Thecharge density in this cloud is limited by space charging (distraction) of species ofthe same polarity. Finally, this leads to a dispersed spray and a "dilution" of the ana-lyte ions in the cloud at higher buffer concentrations. As the spray is more collimatedin API-electrospray than in APCI or APPI, the latter two are more suited to high buf-fer concentrations.
196
the electrospray ion source, in order to displace the TFA anion from the ion pair. Ifyou cannot avoid the use of ion-pair reagents, you should take their volatility into ac-count. Acidic functional groups can be appropriately masked by aliphatic amines,such as triethylammonium acetate, n-butyl-dimethylammonium acetate or di-n-butyl-ammoniurn acetate. On the other hand, you can replace alkanesulfonic acids with per-fluorinated organic acids of different aliphatic chain lengths. In most cases, even inAPI-electrospray, there will only be very little suppression of detection sensitivity. Ifpossible, you should opt for APCI or APPI, as the weak ion pairs just described willbe cleaved by the evaporation process. Please be prepared for a significant back-around signal when you invert the ion polarity after your ion-pairing experiments. Justas when using high alkali concentrations - i.e., phosphate buffers - you should markthe bottles and HPLC columns used with the ion-pair reagents and never ever usethem with "normal" mobile phases. Moreover, it is not a good idea to put these "con-taminated" mobile phases through a vacuum degasser, which typically has a large in-ner surface consisting of porous Teflon and would thus produce an unpleasant mem-ory effect.
SummaryTraditional ion-pair reagents are not suited for use in LC-MS. It is better to use
volatile reagents such as aliphatic amines or perfluorinated organic acids at the lowestpossible concentration. Avoid contamination of your vacuum degasser and use solventbottles and HPLC columns that are dedicated to use with ion-pair chromatography.
199
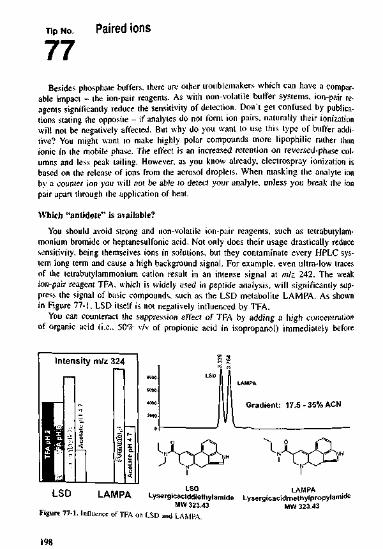
Tip NO. Paired ions
7 7
Besides phosphate buffers, there are other troublemakers which can have a compar-able impact - the ion-pair reagents. As with non-volatile buffer systems, ion-pair re-agents significantly reduce the sensitivity of detection. Don't get confused by publica-tions stating the opposite - if analytes do not form ion pairs, naturally their ionizationwill not be negatively affected. But why do you want to use this type of buffer addi-tive? You might want to make highly polar compounds more lipophilic rather thanionic in the mobile phase. The effect is an increased retention on reversed-phase col-umns and less peak tailing. However, as you know already, electrospray ionization isbased on the release of ions from the aerosol droplets. When masking the analyte ionby a counter ion you will not be able to detect your analyte, unless you break the ionpair apart through the application of heat.
Which "antidote" is available?You should avoid strong and non-volatile ion-pair reagents, such as tetrabutylam-
monium bromide or heptanesulfonic acid. Not only does their usage drastically reducesensitivity, being themselves ions in solutions, but they contaminate every HPLC sys-tem long term and cause a high background signal. For example, even ultra-low tracesof the tetrabutylammonium cation result in an intense signal at mlz 242. The weakion-pair reagent TFA. which is widely used in peptide analysis, will significantly sup-press the signal of basic compounds, such as the LSD metabolite LAMPA. As shownin Figure 77-1. LSD itself is not negatively influenced by TFA.
You can counteract the suppression effect of TFA by adding a high concentrationof organic acid (i.e.. 50<7r v/v of propionic acid in isopropanol) immediately before
Intensity m/z324 3 S
Gradient: 17.5-35%ACN
L.3U LAMPA Lysergicaciddiethylamide LysergicacidmethylpropylamideMW 323.43 uw 323.43
Figure 77-1. Influence of TFA on LSD and LAMPA.
198
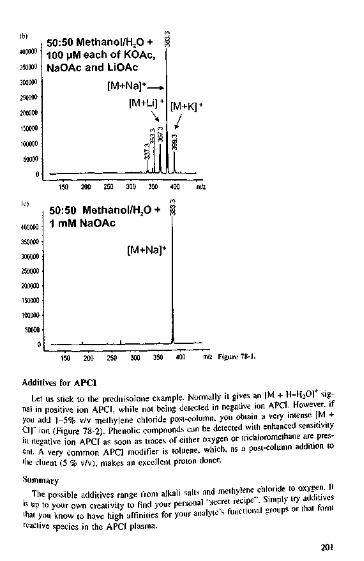
350000300000250000200000150000100000500000
W)
400000 •350000 •300000250000200000150000100000500000
50:50 Methanol/H20 +100 \iM each of KOAc,NaOAc and LiOAc
[M+Na]+_[M+Li] <
\
150 200 250 300 350 400
50:50 Methanol/H2O +1 mM NaOAc
[M+Na]+
150 200 250 300 350 40< m/2 Figure 78-1.
Additives for APCILet us stick to the prednisolone example. Normally it gives an [M + H-H2O]* sig-
nal in positive ion APCI. while not being detected in negative ion APCI. Howe™; "you add 1-5% v/v methylene chloride post-column, you obtain a very intense [M +CIJ- ion (Figure 78-2) Phenolic compounds can be detected with enhanced sensitivityin negative ion APCI as soon as traces of either oxygen or trichloromethane are pres-ent. A very common APCI modifier is toluene, which, as a post-column addition toHie eluent (5 % v/v), makes an excellent proton donor.
SummaryThe possible additives range from alkali salts and me.hylene chloride to oxyger. It
is up to your own creativity to find your personal "secret recipe . Simpl) try del,nve•hat you know to have high affinities for your analy.e's functional groups or that torn,reactive species in the APCI plasma.
201

Tip No.
7 8
Using additives to enhance API-electrosprayionization
In LC-MS, as in everything else in life, it is the dosage that matters. You can en-hance ionization and detection sensitivity by adding Na or K ions to the eluent, aslong as you obtain the correct concentration inside the ESI ion source - it should bein the region of 0.5 mmol L~'. Please make use of post-column addition and do notadd the modifier to your mobile phase upfront. This will avoid unwanted surprises bycontamination of your HPLC system.
Formation of cations through the addition of alkali salts is ideally suited for allcompounds that contain several OH functional groups, such as carbohydrates or ste-roids. These are difficult to protonate and thus not very sensitive to electrospray de-tection. By adding modifiers you obtain a uniform ion formation and therefore a high-er sensitivity and increased reproducibility. Figure 78-1 (a) shows that prednisoloneproduces multiple molecular cations, even when acidified with TFA. The intensity isdistributed across many molecular cations, the ratio of which can vary significantlydepending on the mobile phase composition. Therefore reproducible quantitation is al-most impossible. In Figure 78-1 (b) an equimolar mixture of different modifiers wasadded in order to evaluate their affinities to prednisolone. It can easily be seen thatthe Na adduct provides the most intense signal. Figure 78-1 (c) shows the result ofpost-column addition of sodium acetate. Now we have a uniform ionization and astable pseudomolecular ion. But it is not only alkali salts that make carbohydrate de-tection easier in ESI. You can also add 50 mM HC1 post-column (concentration in theESI source about 2 mmol L~') and force the formation of chloride adducts. These areof course detected in the neeative-ESI mode.
(a)
70000
60000-50000400003000020000toooo
[M+H] +
50:50 Methanol/H2Owith 0.1% TFA
i.. -
[M+Na]+
150 200 250 300 350 400 mft Figure 78-1. Adduct formation in ESI.

Tip NO. How can I enhance sensitivity of detection?
7 9
Think through all your method parameters step by step. Did you choose the rightionization technique? Usually ESI is more sensitive than APCI or APPI. However iffor chiomatographic reasons you must select a mobile phase where your analytes arenot ionized in solution - you must resort to one of the chemical ionization techniques.But let us assume that you selected an ionization technique that is suitable for youranalyte.
ElectrosprayThe optimal pH value is two units below (positive ion ESI) or above (negative ion
ESI) the p/fa value of the compounds to be detected. In this case, more than 99% ofyour analyte molecules exist as ions in solution. Maybe you have to add an acid orbase post-column in order to achieve these conditions. Some ESI nebulizers generateaerosol droplets that are too large when spraying 100% aqueous mobile phase. Youshould then apply more heat, for example, by applying "heated drying gas" or "turboion spray", or increase the percentage of organic solvent in the eluent by addingmethanol or isopropanol post-column. If necessary, combine this with adjustment ofthe pH value or the addition of modifiers. Is your background signal significantlystronger than your analyle signal? Then presumably your ESI detection will sufferfrom ion suppression. Eliminate the reasons for the high background signal. Try an-other batch or brand of your HPLC solvents. "HPLC grade" means that this particularsolvent is suitable for UV detection, but it does not necessarily mean it is LC-MScompatible, mlz 102 in positive ion ESI results from previous measurements usingtriethylamine, mlz 279 is most probably caused by dibutyl phthalate, while a series ofpeaks at intervals of mlz 44 result from ethoxylated surfactants. If you still use anHPLC column with a large internal diameter, you had better change to smaller col-umn dimensions (3 or 2.1 mm ID). Please remember - ESI is a concentration-depen-dent detection technique. Therefore, the detection sensitivity increases quadraticallywith a reduction in the column diameter. In addition, the associated lower HPLC flowrate also contributes to the sensitivity enhancement.
APCIIn APCI you should check the vaporizer temperature. Two extremes could cause
loss in sensitivity - temperatures that are too elevated induce pyrolysis, while too lowtemperatures result in incomplete evaporation of the analyte. Do you generate sufti-eient APCI reagent plasma? Try to increase the corona current in small steps. Inmost«ses this increases not only signal height but also signal stability. Is your HPLC (low•ate high enough? As APCI is a mass flow-dependent detector you gain sensitivity by"'creasing the column diameter, which increases the HPLC flow rate. Do not set theHow rate too high though - the optimum for most available APCI ion sources lies in
203

Intensity600000500000400000300000200000100000
0
[M+CI]-
with CH2CI2
with N,
150 200 250 300 350 400 m/z dnisolone.Figure 78-2. APC1 adducls of pre-
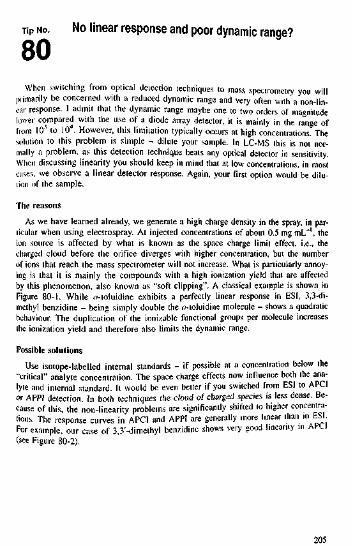
Tip NO. No linear response and poor dynamic range?
8 0
When switching from optical detection techniques to mass spectrometry you willprimarily be concerned with a reduced dynamic range and very often with a non-lin-ear response. I admit that the dynamic range maybe one to two orders of magnitudelower compared with the use of a diode array detector, it is mainly in the range offrom 101 to 104. However, this limitation typically occurs at high concentrations. Thesolution to this problem is simple - dilute your sample. In LC-MS this is not nor-mally a problem, as this detection technique beats any optical detector in sensitivity.When discussing linearity you should keep in mind that at low concentrations, in mostcases, we observe a linear detector response. Again, your first option would be dilu-tion of the sample.
The reasonsAs we have learned already, we generate a high charge density in the spray, in par-
ticular when using electrospray. At injected concentrations of about 0.5 mg mL~\ theion source is affected by what is known as the space charge limit effect, i.e., thecharged cloud before the orifice diverges with higher concentration, but the numberof ions that reach the mass spectrometer will not increase. What is particularly annoy-ing is that it is mainly the compounds with a high ionization yield that are affectedby this phenomenon, also known as "soft clipping". A classical example is shown inFigure 80-1. While o-toluidine exhibits a perfectly linear response in ESI, 3,3-di-methyl benzidine - being simply double the o-toluidine molecule - shows a quadraticbehaviour. The duplication of the ionizable functional groups per molecule increasesthe ionization yield and therefore also limits the dynamic range.
Possible solutionsUse isotope-labelled internal standards - if possible at a concentration below the
"critical" analyte concentration. The space charge effects now influence both the ana-lyte and internal standard. It would be even better if you switched from ESI to APCIor APPI detection. In both techniques the cloud of charged species is less dense. Be-cause of this, the non-linearity problems are significantly shifted to higher concentra-tions. The response curves in APCI and APPI are generally more linear than in ESIFor example, our case of 3,3'-dimethyl benzidine shows very good linearity in APCI(see Figure 80-2).
205

the ranee from 0.8 to 1.5 mL muT1. If your compounds exhibit lots of OH functionalgroups "you could also try the additives that were discussed in the previous chapter.
APPlThe optimal flow rate for APPl is around 0.6 mL rnirT1. If your analyte undergoes
direct photoionization (APPl without dopant) then APPl is fairly concentration depen-dent (Lambert-Beer's law), if you use a dopant (acetone or toluene) then APPl be-haves like a mass flow-dependent detector. You should adapt your chromatographicconditions accordingly. In addition, the vaporizer temperature and the capillary orcone voltage influences APPl sensitivity. Unfortunately it is virtually impossible topredict the analyte behaviour - you have to determine optimum APPl conditions em-pirically.
Optimizing instrument parameters in APPlAs the lamp intensity cannot be changed by the operator, the vaporizer tempera-
ture, the temperature of the added nitrogen stream and the capillary or cone voltageare options for optimization. If you cannot generate sufficient ionization by directphotoionization you should try dopant APPl. For this purpose, you add 1-5% v/v tol-uene or acetone to the eluent (T-piece immediately in front of the ion source). Ace-tone is the best electron donor available for negative ion APPL Please check on thesensitivity by running real samples, not standard samples. In APPl, the absolute inten-sities often seem to be low. The most important decision criterion, however, is the se-lectivity of analyte ionization in relation to the chemical background.

SummaryHigh sensitivity of detection can be a curse. High ionization yields result in space
charge effects in the spray chamber and harm both the dynamic and linear range ofdetection, in particular in the electrospray mode. Very often you can improve perfor-mance by simply adapting the concentration range of your samples (dilution) If youhave access to an APCI or APP1 ion source you should try to change your methodfrom ESI to these more linear detection techniques. Slight losses in sensitivity com-pared with ESI will be compensated for by a significantly better linearity.
207
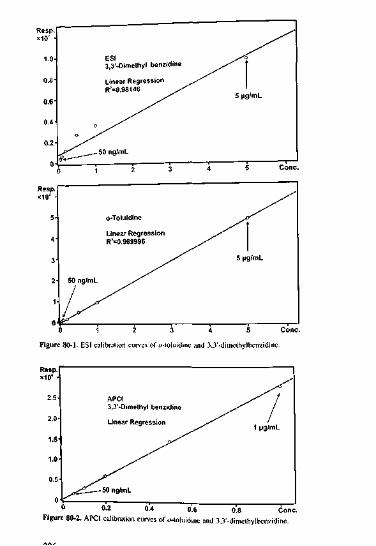
Resp.
5-
4-
3-
2
1
0
o-ToluidineLinear RegressionR'=0.999996
/ ^50 ng/mL J^
I s '
5 \iglmL
0 1 2 3 4 5 Cone.Figure 80-1. ESI calibration curves of o-toluidine and 3,3'-dimethy]bcnzidinc.
02 0.4 o!6 ole 80-2. APCl calibration curves or o-loluidine and 3,3-dimelhylbcnz
Cone,idinc.

ration, in a flow injection mode (FIA), and you would not need an MS-MS capablemass spectrometer either. Fragment ion spectra can be obtained by collision-induceddissociation (CID) inside the ion optics - even when using fairly simple mass spectro-meters (i.e., single quadrupole or time-of-flight instruments). If you follow a very se-lective sample preparation procedure and/or if you have developed a good chromato-graphic separation, you can work with high detection sensitivity and selectivity, with-out even using MS-MS.
SummaryDo not ask yourself "How much MS" do I need?" but "How much effort is needed
in the chromatographic separation in order to minimize MS-related artefacts?"
209
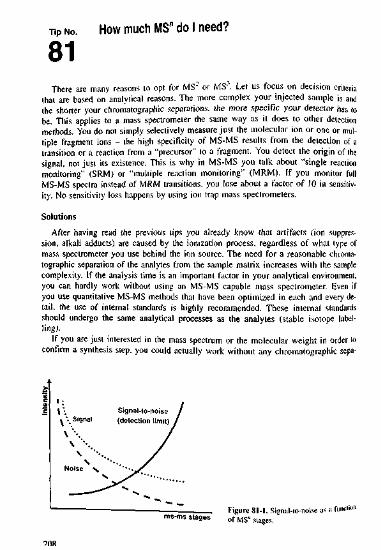
Tip NO. How much MS" do I need?
8 1
There are many reasons to opt for MS2 or MS3. Let us focus on decision criteriathat are based on analytical reasons. The more complex your injected sample is andthe shorter your chromatographic separations, the more specific your detector has tobe. This applies to a mass spectrometer the same way as it does to other detectionmethods. You do not simply selectively measure just the molecular ion or one or mul-tiple fragment ions - the high specificity of MS-MS results from the detection of atransition or a reaction from a "precursor" to a fragment. You detect the origin of thesignal, not just its existence. This is why in MS-MS you talk about "single reactionmonitoring" (SRM) or "multiple reaction monitoring" (MRM). If you monitor fullMS-MS spectra instead of MRM transitions, you lose about a factor of 10 in sensitiv-ity. No sensitivity loss happens by using ion trap mass spectrometers.
SolutionsAfter having read the previous tips you already know that artifacts (ion suppres-
sion, alkali adducts) are caused by the ionization process, regardless of what type ofmass spectrometer you use behind the ion source. The need for a reasonable chroma-tographic separation of the analytes from the sample matrix increases with the samplecomplexity. If the analysis time is an important factor in your analytical environment,you can hardly work without using an MS-MS capable mass spectrometer. Even ifyou use quantitative MS-MS methods that have been optimized in each and every de-tail, the use of internal standards is highly recommended. These internal standardsshould undergo the same analytical processes as the analytes (stable isotope label-ling).
If you are just interested in the mass spectrum or the molecular weight in order toconfirm a synthesis step, you could actually work without any chromatographic sepa-
ms-ms stages of Ms» slFigure 81-1. Signal-to-noise as a fundio"
References to LC-MS
Elecimspray lonization for Mass Spectrometry of Large Biomolecules Fenn J.B.,Mann M., Meng C.K., Wong S.F., Whitehouse CM., Science 1989 Oct 6246(4926), 64-71.
Elecimspray Mass Spectrometry of Polyethylene glycols) with Molecular Weights upto Five Million Nohmi T., Fenn J.B., 1992.
Three-dimensional Deconvolution of Multiply Charged Spectra Labowsky, M.J.,Whitehouse CM., Fenn, J.B., Rapid Commun. Mass Spectrom. 1993, 7, 71.
km Formation from Charged Droplets: Roles of Geometry, Energy and Time Fenn,J.B. J. Am. Soc. Mass Spectrom. 1993, 4, 524.
Mass Spectrometry with Ion Sources Operating at Atmospheric Pressure Bruins, A. P.Mass Spectrom. Rev. 1991, 10, 53-77.
Liquid Chromatography-Mass Spectrometry. General Principles and Instrumentation,Niessen, W.M.A., Tinke, A. P. J. Chromatogr. A 1995. 70,9, 37-57.
Capillary Liquid Chromatography Mass Spectrometry Tomer, K. B., Moseley, M.A.,Deterding, L.J., Parker, C.E. Mass Spectrom. Rev. 1994, 13, 431 57.
Liquid Chromatography-Mass Spectrometty and Related Techniques via AtmosphericPressure lonization, Wachs, T., Conboy, J.C, Garicia, F, Henion, J. D. J. Chroma-togr. Sci. 1991, 29, 357-366.

Need more help?
What else can you do in order to use LC-MS successfully? Read the manuals thatcome with your LC-MS system. Here you will find hints on how to enter method pa-rameters, trie optimization and tuning. In general the instrument manufacturers pro-vide default methods with their instruments, which appropriate as starting points foryour own method development.
It is false economy not to visit the operator training courses your instrument manu-facturer offers. There the features of your LC-MS system will be explained to you."Classroom training" will give you the opportunity to meet other users with similarinterests. After the training course, you should keep in touch with the other partici-pants. If you want to brush up on theory - there are manufacturer-independent train-ing programmes where you could become familiar with the fundamentals of LC-MS.
Rather than re-inventing the wheel you should ask colleagues or your manufac-turer's application chemists for advice. Application chemists are confronted with awide range of analytical problems on a daily basis. In most cases they are able tohelp you with your questions. For troubleshooting, they are also the right people tocontact.
Read LC-MS-relevant literature. Using Internet-based search engines you can easi-ly find suitable information. On the websites of the LC-MS manufacturers you canfind a variety of examples of applications. Methods that have been reported usingyour type of instrument are easy to transfer to your set-up. However, please considerthe different instrument designs of the different manufacturers - ESI sprayers, for ex-ample, can have orthogonal or off-axis geometry, heating could be realized via heatednitrogen or a heated ion transfer capillary, and much more. Increasing a "cone volt-age" may have the same effect as increasing a "fragmentor voltage" - more and morefragmentation of the molecular ions. However, the absolute voltage settings may differsignificantly. This is just one example of how different approaches (instrument param-eters) lead to the same result (mass spectrum).
The "take home message" is that LC-MS(-MS) is simple in principle. Troublearises because of the ionization chemistry and the fragmentation behaviour of the ana-lytes. Do not give up all too soon - even the so-called "experts" with five years' ex-perience had to go through those five years first.
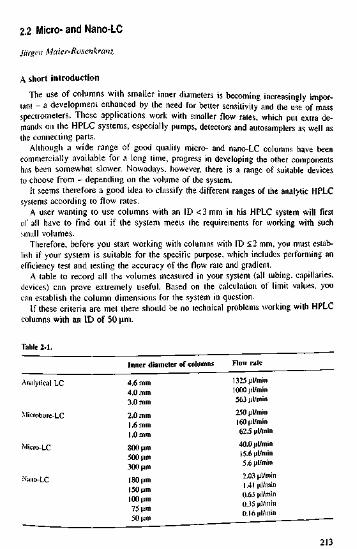
2.2 Micro- and Nano-LC
Jiirgen Maier-Rosenkranz
The use of columns with smaller inner d
the connecting parts.Although a wide range of good quality micro- and nano-LC columns have been
commercially available for a long time, progress in developing the other componentshas been somewhat slower. Nowadays, however, there is a range of suitable devicesto choose from - depending on the volume of the system.
It seems therefore a good idea to classify the different ranges of the analytic HPLCsystems according to flow rates.
A user wanting to use columns with an ID <3 mm in his HPLC system will firstof all have to find out if the system meets the requirements for working with suchsmall volumes.
Therefore, before you start working with columns with ID <2 mm, you must estab-lish if your system is suitable for the specific purpose, which includes performing anefficiency test and testing the accuracy of the flow rate and gradient.
A table to record all the volumes measured in your system (all tubing, capillaries,devices) can prove extremely useful. Based on the calculation of limit values, youcan establish the column dimensions for the system in question.
If these criteria are met there should be no technical problems working with HPLCcolumns with an ID of 50 u.m.
Table 2-1.Inner diameter of columns Flow rate
Analytical LC
Microbore-LC
Micro-LC
Nano-LC
4.6 mm4.0 mm3.0 mm2.0 mm1.6 mm1.0 mm8O0um500 Mm300 Mm180 Mm150 MmlOOMm75 Mm50 Mm
1325|il/minlOOOul/min563 Jtl/nlin250 Ml/min160 |al/min62.5 [il/min40.0 jil/minI5.6ut/min5.6 iiyniin2.03 pl/min1.41 nl/min0.63 nl/min0.35 ttl/min0.16nl/min
213

Internet addresses of interest for LC-MS coupling
http://www.spectroscopynow.comhttp://www. asms.orghttp://www. dgms. dehttp://www.lcms.comhttp://www. chemisiry.gatech.edu/stmshup://www. ionsource. comhttp://masspec.scripps.edu/infonnation/history/
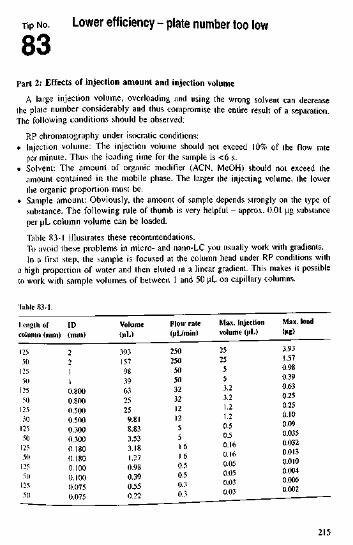
Tip No. Lower efficiency - plate number too low
8 3
Part 2: Effects of injection amount and injection volumeA large injection volume, overloading and using the wrong solvent can decrease
the plate number considerably and thus compromise the entire result of a separation.The following conditions should be observed:
RP chromatography under isocratic conditions:• Injection volume: The injection volume should not exceed 10% of the flow rate
per minute. Thus the loading time for the sample is <6 s.• Solvent: The amount of organic modifier (ACN, MeOH) should not exceed the
amount contained in the mobile phase. The larger the injecting volume, the lowerthe organic proportion must be.
• Sample amount: Obviously, the amount of sample depends strongly on the type ofsubstance. The following rule of thumb is very helpful - approx. 0.01 ug substanceper uL column volume can be loaded.Table 83-1 illustrates these recommendations.To avoid these problems in micro- and nano-LC you usually work with gradients.In a first step, the sample is focused at the column head under RP conditions with
a high proportion of water and then eluted in a linear gradient. This makes it possibleto work with sample volumes of between 1 and 50 uL on capillary columns.
Length ofcolumn (mm)12550125501255012550125501255012550125W
ID(mm)22110.8000.8000.5000.5000.3000.3000.1800.1800.1000.1000.0750.075
Volume(uL)39315798396325259.818.833.533.181.270.980.390.550"
Flow rate(uL/min)250250505032321212551.61.60.50.50.30.3
Max. injectionvolume (uL)2525553.23.21.21.20.50.50.160.160.050.050.030.03
Max. load<|ig)3.931.570.980.390.630.250.250.100.090 0350.0320.0130.0100.0040.0060.002
215
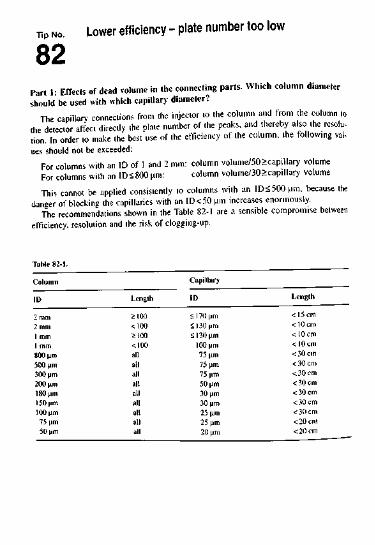
Tip No.
8 2
Lower efficiency - plate number too low
Part 1: Effects of dead volume in the connecting parts. Which column diametershould be used with which capillary diameter?
The capillary connections from the injector to the column and from the column tothe detector affect directly the plate number of the peaks, and thereby also the resolu-tion. In order to make the best use of the efficiency of the column, the following val-ues should not be exceeded:
For columns with an ID of 1 and 2 mm: column volume/50>capiilary volumeFor columns with an ID<800 um: column volume/30>capillary volumeThis cannot be applied consistently to columns with an ID<500um, because the
danger of blocking the capillaries with an ID < 50 urn increases enormously.The recommendations shown in the Table 82-1 are a sensible compromise between
efficiency, resolution and the risk of clogging-up.
CapillaryID Length ID Length2 mm 2100 < 170 Mm <15cm2 mm <100 < 130 Mm <10cmI mm 2100 < 130 urn <10cmI mm <100 100 Mm <IOcm800 um all 75 um <30cm5O0Mm all 75 um <30cm300 (im all 75 um <30cm200 um all 50 um <30cm180 jim all 30 Mm <30cm150 um all 30 Mm <30cmlOOum all 25 um <30cm75 Mm all 25 Mm <20cm50 urn all 20 Mm <20cm

V53i
7
&54321
a)
I
I
5 10 15 20 25 30 35 40 45 SO 55
i
t [min]
3 |iL cell
i IU M ' L
5 10 15 20 25 30 35 40 45 50 55t [min]
Figure 84-1. Comparison of two cells, one with 8 and Ihe other with 3 nl volume. M. Breyer,M. Twcle. K. Schmeer, P. Foldi. Stationary Phase: Nucleosil 100 C18 HD,Column diameter: 125x1 mm 3 pm. Flow rate: 37.5 pl/min, Eluent: A: lOmM NK,Ac pH 3.0,B: ACN, Flow cell: a) 8 ul, b) 3 ul. Sample: Drug+Metabolite, Injection: 40 nl.
217
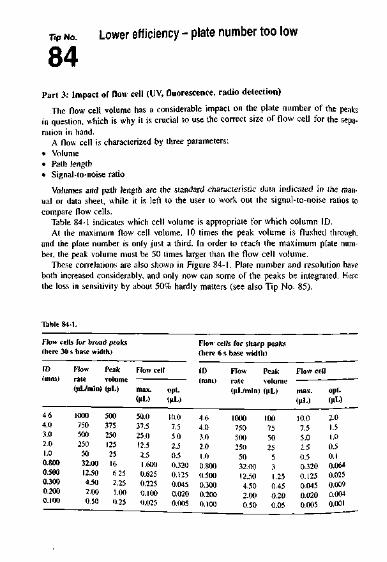
Tip No.
8 4
Lower efficiency - plate number too low
Part 3: Impact of flow cell (UV, fluorescence, radio detection)The flow cell volume has a considerable impact on the plate number of the peaks
in question, which is why it is crucial to use the correct size of flow cell for the sepa-ration in hand.
A flow cell is characterized by three parameters:• Volume• Path length• Signa!-to-noise ratio
Volumes and path length are the standard characteristic data indicated in the man-ual or data sheet, while it is left to the user to work out the signal-to-noise ratios tocompare flow cells.
Table 84-1 indicates which cell volume is appropriate for which column ID.At the maximum flow cell volume, 10 times the peak volume is flushed through,
and the plate number is only just a third. In order to reach the maximum plate num-ber, the peak volume must be 50 times larger than the flow cell volume.
These correlations are also shown in Figure 84-1. Plate number and resolution haveboth increased considerably, and only now can some of the peaks be integrated. Herethe loss in sensitivity by about 50% hardly matters (see also Tip No. 85).
Flow cells for broad peaks(here 30 s base width)ID(mm)
4.64.03.02.01.00.8000.5000.3000.2000.100
Flowrate
Peakvolume
OiL/min) QiL)
10007505002505032.0012.504.502.000.50
50037525012525166.252.251.000.25
Flow cell
max.(fL)50.037.525.012.52.51.6000.6250.2250.1000.025
opt.(|iL)10.07.55.02.50.50.3200.1250.0450.0200.005
Flow cells for sharp peaks(here 6 s base width)ID(mm)
4.64.03.02.01.00.8000.5000.3000.2000.100
Flowrate(flL/min)
10007505002505032.0012.504.502.000.50
Peakvolume(|"L)
100755025531.250.450.200.05
Flow cell
max.0>L)10.07.55.02.50.50.3200.1250.0450.0200.005
opt.(|iL)2.01.51.00.5O.I0.0640.0250.0090.0040.001

Tip NO. Fused silica and PEEK capillary connections
8 6
Insufficient capillary connections are frequently to blame for a loss in resolution.In order to achieve a good connection and avoid a dead volume, the end of the capil-lary must be smooth and cut at right angles. It is best to use tools with a knife rotat-ing round the capillary. To finish off, use a grinding block, which is cheap and easyto use and suitable for all materials (steel, PEEK, fused silica). Using a PEEK finger-tight fitting, the capillary can be locked into the block so that it sticks out by just afew tenths of a millimetre. Then put very fine abrasive paper (400-800) on a smoothflat surface and run the block over it in circular movements. To finish, flush the capil-lary thoroughly.
Before installing capillaries in your apparatus it is vital to check their ends thor-oughly. Use a magnifying glass with 10-20 fold magnification.
For stabilizing and sealing fused silica or thin PEEK capillaries, special sleeveswith an outer diameter of 1/161'1 inch (=1.6 mm) that fit on all standard HPLC con-nections can be used. There are even thinner l/32nd inch (=0.8 mm) ones availablefor micro finger-tight fittings, which are easier to handle and help seal the connec-tions.
UNF32-28G
1/16 Inch holeFigure 86-1. Cross-section of grindingbook.
219
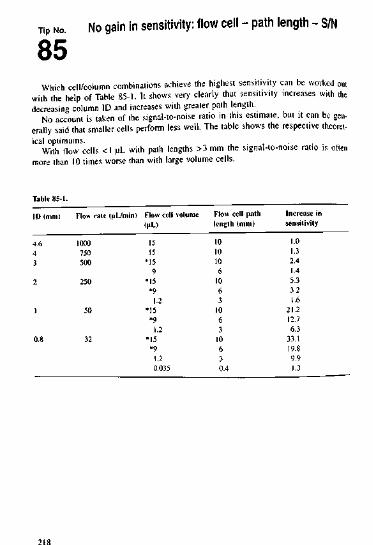
Tip No.
8 5
No gain in sensitivity: flow cell - path length - S/N
Which cell/column combinations achieve the highest sensitivity can be worked outwith the help of Table 85-1. It shows very clearly that sensitivity increases with thedecreasing column ID and increases with greater path length.
No account is taken of the signal-to-noise ratio in this estimate, but it can be gen-erally said that smaller cells perform less well. The table shows the respective theoret-ical optimums.
With now cells <1 uL with path lengths >3 mm the signal-to-noise ratio is oftenmore than 10 limes worse than with large volume cells.
ID (mm)
4.6432
1
0.8
Flow rate (|iL/mln)
1000750500250
50
32
Flow cell volume<|iL)1515
•159
•15*91.2
•15*91.2
•15•91.20.035
Flow cell pathlength (mm)10101061063106310630.4
Increase insensitivity1.01.32.41.45.33.21.6
21.212.76.3
33.119.89.91.3
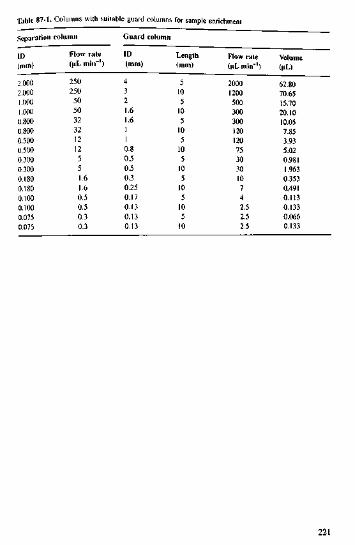
Table 87-1. Columns with suitable guard columns for sample enrichmentSeparation
ID(mm)2.0002.0001.0001.0000.8000.8000.5000.5000.3000.3000.1800.1800.1000.1000.0750.075
i column
Flow rate(uL min"1)250250505032321212551.61.60.50.50.30.3
Guard column
ID(mm)4321.61.6110.80.50.50.30.250.170.130.130.13
Length(mm)510510510510510510510510
Flow rate(pL min"1)2000120050030030012012075303010742.52.52.5
Volume(uL)62.8070.6515.7020.1010.057.853.935.020.9811.9630.3530.4910.1130.1330.0660.133
221
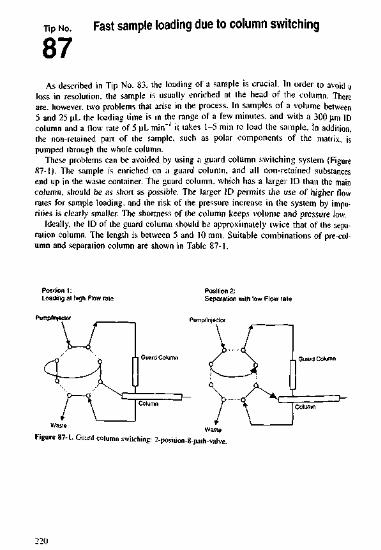
rip NO Fast sample loading due to column switching
8 7
As described in Tip No. 83. the loading of a sample is crucial. In order to avoid aloss in resolution, the sample is usually enriched at the head of the column. Thereare. however, two problems that arise in the process. In samples of a volume between5 and 25 uL the loading time is in the range of a few minutes, and with a 300 um IDcolumn and a flow rate of 5 uL min"' it takes 1-5 min to load the sample. In addition,the non-retained part of the sample, such as polar components of the matrix, ispumped through the whole column.
These problems can be avoided by using a guard column switching system (Figure87-1). The sample is enriched on a guard column, and all non-retained substancesend up in the waste container. The guard column, which has a larger ID than the maincolumn, should be as short as possible. The larger ID permits the use of higher flowrates for sample loading, and the risk of the pressure increase in the system by impu-rities is clearly smaller. The shortness of the column keeps volume and pressure low.
Ideally, the ID of the guard column should be approximately twice that of the sepa-ration column. The length is between 5 and 10 mm. Suitable combinations of pre-col-umn and separation column are shown in Table 87-1.
Position 1:Loading at high Flow fate
Position 2:Separation with low Flow rate
Pump/lnj&ctor Pump/Injector
Figure 87-1. Guard column switching: 2-position-8-palh-v;
220
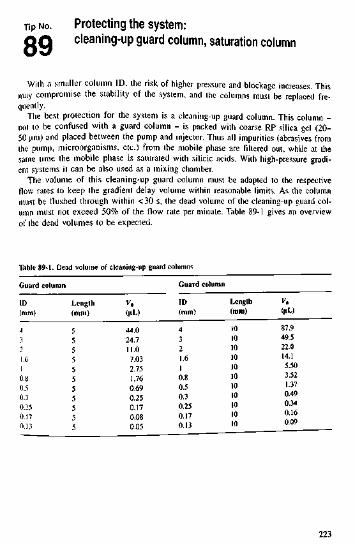
Tip NO. Protecting the system:n Q cleaning-up guard column, saturation column
With a smaller column ID, the risk of higher pressure and blockage increases. Thismay compromise the stability of the system, and the columns must be replaced fre-quently.
The best protection for the system is a cleaning-up guard column. This column -not to be confused with a guard column - is packed with coarse RP silica gel (20-50 urn) and placed between the pump and injector. Thus all impurities (abrasives fromthe pump, microorganisms, etc.) from the mobile phase are filtered out, while at thesame time the mobile phase is saturated with silicic acids. With high-pressure gradi-ent systems it can be also used as a mixing chamber.
The volume of this cleaning-up guard column must be adapted to the respectiveflow rates to keep the gradient delay volume within reasonable limits. As the columnmust be flushed through within <30 s, the dead volume of the cleaning-up guard col-umn must not exceed 50% of the flow rate per minute. Table 89-1 gives an overviewof the dead volumes to be expected.
Table 89-1. Dead volume of cleaning-up guard columnsGuard columnID(mm)4
i1.610.80.50.30.250.170.13
Length(mm)55555555555
v»(uL)44.024.711.07.032.751.760.690.250.170.080.05
Guard columnID(mm)4321.610.80.50.30.250.170.13
Length(mm)1010101010101010101010
(|iL)87.949.522.014.15.503.521.370.490.340.160.09
223

Tip NO. Injection system: full loop injection,Q Q partial loop fill injection,O O timed programmed injection, direct injection
As described in Tips Nos. S3 and 87. the loading of the sample has a substantialeffect on the quality of the result, which is why I would like to describe the mostcommon techniques from a micro- and nano-LC perspective.
Full loop injectionThis injection method usually provides good accuracy and reproducibility. If the
sample is concentrated onto the column or guard column after the injection, normalanalytical injectors can be used, as long as the flow rate is kept high enough to flushthrough the total volume of the injector within 30 s. For lower flow rates specificnano-injectors should be used, which come in two types:1. The loop is cut into the rotor (60 or 200 nL). The injection volume remains con-
stant with this type.2. Micro-6-way-2-position-valve. Fused silica capillaries serve as a loop.
The use of different capillaries makes injecting a range of volumes possible.Partial loop injection
This method is only practicable in combination with sample enrichment on theguard column or on the column head. Here, too, the volume is crucial.
Nano-injectors cannot be used for partial loop injection.
Timed programmed injectionThis is a special form of full or partial loop injection. It involves partially or com-
pletely filling the loop and using a timing control to regulate the flow rate towardsthe column. Thus volumes of from 10 nL to 10 uL can be injected accurately andflexibly.
Example:Flow rate 5 uL min~'. the loop is connected for 6 s - injected volume 0.5 uL.
Direct injectionWith this variant the looped injection needle is always in the flow towards the col-
umn. This is not suitable for flow rates <15uL because the gradient delay volumewould become too large.
222

5 min for the column. The total equilibration time is thus at least twice the gradienttime. Therefore, the next sample has often been injected although the column has notyet equilibrated, and this causes varying retention times.
Therefore, it is recommended that the gradient delay volume is kept small so thatit can be flushed within 1 min. Subsequently, the time needed to reach a safe and con-stant equilibration should be determined.
The same applies even if you are working with a splitter. The primary flow ratemust also flush the primary gradient delay volume within I min (see also Tip No.91).
225
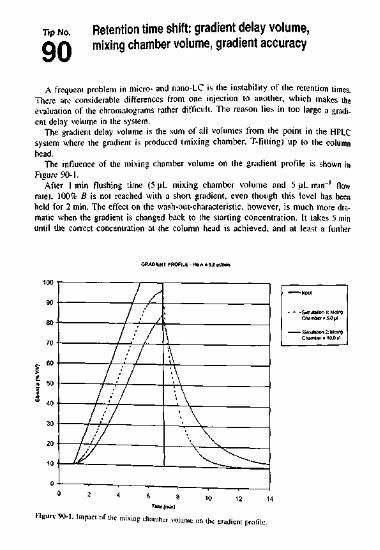
Tip No.
9 0
Retention time shift: gradient delay volume,mixing chamber volume, gradient accuracy
A frequent problem in micro- and nano-LC is the instability of the retention times.There are considerable differences from one injection to another, which makes theevaluation of the chromatograms rather difficult. The reason lies in too large a gradi-ent delay volume in the system.
The gradient delay volume is the sum of all volumes from the point in the HPLCsystem where the gradient is produced (mixing chamber, T-fitting) up to the columnhead.
The influence of the mixing chamber volume on the gradient profile is shown inFigure 90-1.
After 1 min flushing time (5 uL mixing chamber volume and 5 uL min~' flowrate). 100% B is not reached with a short gradient, even though this level has beenheld for 2 min. The effect on the wash-out-characteristic, however, is much more dra-matic when the gradient is changed back to the starting concentration. It takes 5 minuntil the correct concentration at the column head is achieved, and at least a further
GRADIENT PROFILE - Flow = 5.0 pl/mln100
90 1 /
/ / /
/ / /
/ • • ' ' /
I 1 /
l f /
1 /
w
w
\ \
Figure 90-1. Impact of the mixing chamber volume on the gradient profile.
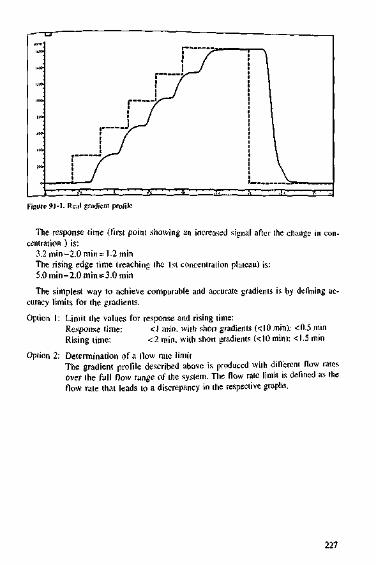
»
c
\ l
1 /
f
\
Figure 91-1. Real gradient profile
The response time (first point showing an increased signal after the change in con-centration ) is:
3.2 min-2.0 min = 1.2 minThe rising edge time (reaching the 1st concentration plateau) is:5.0 min-2.0 min = 3.0 minThe simplest way to achieve comparable and accurate gradients is by defining ac-
curacy limits for the gradients.Option 1: Limit the values for response and rising time:
Response time: <l min. with short gradients (<IO min): <0.5 minRising time: <2 min, with short gradients (<10 min): <l.5 min
Option 2: Determination of a flow rate limitThe gradient profile described above is produced with different How ratesover the full flow range of the system. The flow rate limit is defined as theflow rate that leads to a discrepancy in the respective graphs.
227
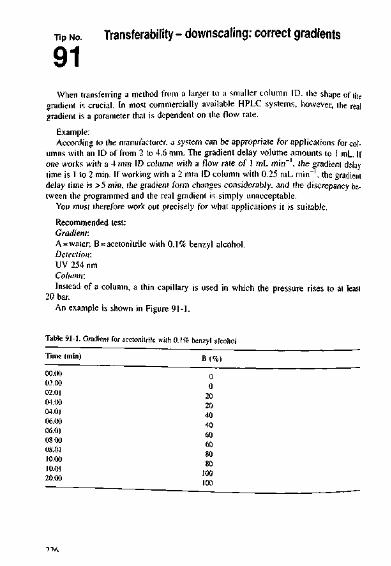
•np NO Transferability - downscaling: correct gradients
9 1
When transferring a method from a larger to a smaller column ID, the shape of thegradient is crucial. In most commercially available HPLC systems, however, the realgradient is a parameter that is dependent on the flow rate.
Example:According to the manufacturer, a system can be appropriate for applications for col-
umns with an ID of from 2 to 4.6 mm. The gradient delay volume amounts to 1 mL. Ifone works with a 4 mm ID column with a flow rate of 1 mL min"1, the gradient delaytime is 1 to 2 min. If working with a 2 mm ID column with 0.25 mL min"1, the gradientdelay time is >5 min, the gradient form changes considerably, and the discrepancy be-tween the programmed and the real gradient is simply unacceptable.
You must therefore work out precisely for what applications it is suitable.Recommended test:Gradient:A = water; B=acetonitrile with 0.1% benzyl alcohol.Detection:UV 254 nmColumn:Instead of a column, a thin capillary is used in which the pressure rises to at least
20 bar.An example is shown in Figure 91-1.
Table 91-1. Gradient for acetonitrile with 0.1% benzyl alcoholTime (min)00.00 002.00 002.01 2Q04.00 20
otw ^06.01 „08.00 „08.0. »10.00 !?1001 100
2

2.3 Quantification
2.3.1 Practical aspects of quantification in HPLCStavros Krotnidas
The first part of this chapter (2.3.1) will highlight just a few points concerningquantitative analysis with the emphasis on practical issues.• Peak area or peak height?• What factors have an impact on the peak area?• Formulae that apply to individual quantification methods• Examples of calculations
The second part (2.3.2) will deal extensively with various aspects of quantitativeanalysis, including the not-so-trivial question of weighted regression.
2.3.1.1 Peak area or peak height?Nearly all regulations say explicitly that quantification can be carried out using the
peak area as well as peak height. The fact is, however, that, apart from a few excep-tions, it is the peak area that is normally referred to for quantification. This is per-fectly all right, except for the following cases:1. Insufficiently resolved peaks.2. Peaks near the limit of quantification, especially if there is tailing or a drift on the
baseline.3. The short-term consistency of the flow rate is unsatisfactory and no remedial or
other such measures improve the situation.Case 1:If the resolution is insufficient (peaks close together, shoulder peaks, etc.), quantifi-
cation by peak area is always somewhat risky. Whether you use the tangent methodor draw a perpendicular line, the problem will not go away: no software can reallywork out the shape of an un-resolved peak. It simply does not "know" if the peak issymmetrical or if it is tailing. Thus, quantification by peak area can lead to consider-able errors, given that the peak shape of the analyte from the standard solution coulddiffer from the shape it has when it is close to another peak. By contrast, the peakheight is fairly independent of the degree of peak overlap. In any case, the quantifica-tion by peak height seems to be the lesser of two evils - unless you can find an easyway of improving chromatographic resolution.
Case 2:Even in manual integration it is often difficult to find objective criteria to define
*e beginning and the end of small tailing peaks. These peaks need to be looked at in-dividually, and there may be inconsistencies of between 5 and 10% in repeat measure-ments. In automatic integration, inconsistencies may arise from an incorrect setting otthe integration limit. For small peaks, this could amount to an error ot several per-cent, see Figure 2-2.
229
References to Micro- and Nano-LC
Versele. M., Dewaele. C.J. High Resolui. Chromatogr. Commim. 1987, 10, 280.Novotny, M. Anal. Chem. 1988. 60. 500.Ishii. D.. Takeuchi. T. Trends Anal. Chem. 1990. 9. 152.Groin. E., Maier-Rosenkranz. J.. Foldi. P. Laborpraxis 1996/3, 16-22.van Siraien. M.A.. Vermeer. E. A., Claessens, H. A.. LC-CC Int. 1996, /, 42.Vissers. J.P.C.. Claessens. H. A., Cramers. C.A. J. Chromatogr. A 1997, /, 779Vissers. J.P.C. J. Chromatogr. A 1999, 856. 117-143.Maier-Rosenkranz. J.. Laborpraxis 2000/3, 24. 18-23.Breyer, M.. Twele, K., Schmeer. K., Foldi. P. Laborpraxis 2001, 09. 18-22.Palmer. C. Remcho. V. Anal. Bioanal. Chem. 2002, 372, 35.Kientz. C.E.. Langenberg, J.P.. De Jong. G.J., Brinkman. U.A.T. J. High Resolui
Chromatogr. 1991. 14. 460.Klein. C. Foldi, R Lahorpraxis 2002. 02, 34-38.Pru'B. A., Kempter. C, Gysler. J., Jira. T. J. Chromatogr. A 2003. 1016, 129-141.
228
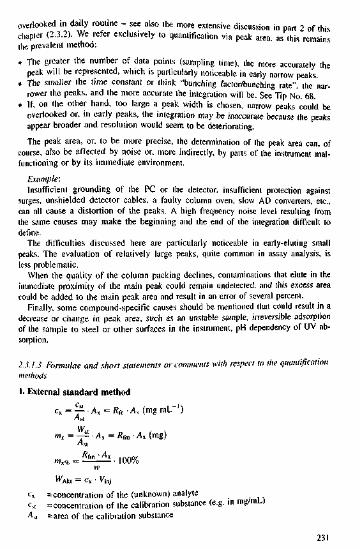
overlooked in daily routine - see also the more extensive discussion in part 2 of thischapter (2.3.2). We refer exclusively to quantification via peak area, as this remainsthe prevalent method:. The greater the number of data points (sampling time), the more accurately the
peak will be represented, which is particularly noticeable in early narrow peaks.. The smaller the time constant or think "bunching factor/bunching rate", the nar-
rower the peaks, and the more accurate the integration will be. See Tip No. 68.• If, on the other hand, too large a peak width is chosen, narrow peaks could be
overlooked or, in early peaks, the integration may be inaccurate because the peaksappear broader and resolution would seem to be deteriorating.The peak area, or, to be more precise, the determination of the peak area can, of
course, also be affected by noise or, more indirectly, by parts of the instrument mal-functioning or by its immediate environment.
Example:Insufficient grounding of the PC or the detector, insufficient protection against
surges, unshielded detector cables, a faulty column oven, slow AD converters, etc.,can all cause a distortion of the peaks. A high frequency noise level resulting fromthe same causes may make the beginning and the end of the integration difficult todefine.
The difficulties discussed here are particularly noticeable in early-eluting smallpeaks. The evaluation of relatively large peaks, quite common in assay analysis, isless problematic.
When the quality of the column packing declines, contaminations that elute in theimmediate proximity of the main peak could remain undetected, and this excess areacould be added to the main peak area and result in an error of several percent.
Finally, some compound-specific causes should be mentioned that could result in adecrease or change in peak area, such as an unstable sample, irreversible adsorptionof the sample to steel or other surfaces in the instrument, pH dependency of UV ab-sorption.
2.11.3 Formulae and short statements or comments with respect to the quantificationmethods1. External standard method
cx = — -A, = RfC -A, (mg mL~')AslWm, = -2--As = Rtm-A, (mg)
=concentration of the (unknown) analyte= concentration of the calibration substance (e.g. in mg/mL)=area of the calibration substance
231

Figure 2-2. Concerning individual (subjective) integration boundaries: Depending on their choice, thepeak at 4.6 min can vary by up to 77c in area.
Case 3:Short-term flow fluctuations in the pump (we are talking about fluctuations during
the elution of the peaks) mainly influence the peak area, but the peak height is af-fected to a much lesser extent. If the problem persists even after the pump has beenrepaired, evaluation by peak height is the preferred option. Finally, if retention timesare unstable, the quantification becomes more reliable if the calculation is based onthe product of retention time and peak height. This very effective trick for reliablequantification in isocratic analysis is not known to many people.
2.3.1.2 What factors have an impact on the peak area?AH parameters that can affect peak area or height have an impact on quantification.
In this section, we are not including such familiar parameters as injection volume orwavelength, but put the emphasis on those parameter settings that are more easily
230
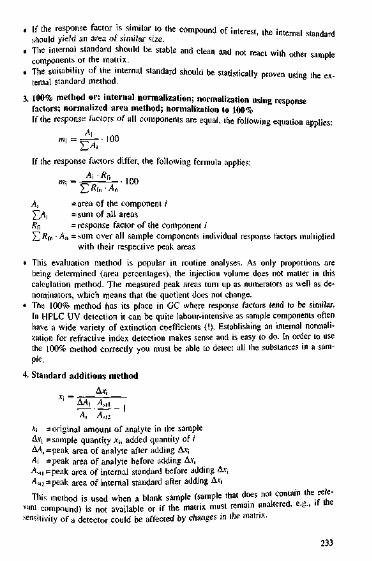
. If the response factor is similar to the compound of interest, the internal standardshould yield an area or similar size.
. The internal standard should be stable and clean and not react with other samolecomponents or the matrix. v
. The suitability of the internal standard should be statistically proven using the ex-ternal standard method.
3. 100% method or: internal normalization; normalization using responsefactors; normalized area method; normalization to 100%If the response factors of all components are equal, the following equation applies:
If the response factors differ, the following formula applies:
A; =area of the component iYAi =sum of all areasRR = response factor of the component iHfifn n =sum over all sample components individual response factors multiplied
with their respective peak areas• This evaluation method is popular in routine analyses. As only proportions are
being determined (area percentages), the injection volume does not matter in thiscalculation method. The measured peak areas turn up as numerators as well as de-nominators, which means that the quotient does not change.
• The 100% method has its place in GC where response factors tend to be similar.In HPLC UV detection it can be quite labour-intensive as sample components oftenhave a wide variety of extinction coefficients (!). Establishing an internal normali-zation for refractive index detection makes sense and is easy to do. In order to usethe 100% method correctly you must be able to detect all the substances in a sam-ple.
4. Standard additions methodAt;
*\ = original amount of analyte in the sampleA.V| =sample quantity x-,, added quantity of iM, = peak area of analyte after adding A.V;i =peak area of analyte before adding A-Y;
^ul = peak area of internal standard before adding Ax,Asl2 = peak area of internal standard after adding Av,This method is used when a blank sample (sample that does not contain the rele-
vant compound) is not available or if the matrix must remain unaltered, e.o., itsensitivity of a detector could be affected by changes in the matrix.
233

A =area of the analyteRlcm = response factor (concentration or amount)m» =mass of analyte in weighed sample»•,, = 100% calibration substance weighted in mgmla =mass of the analyte in the sample in %W = weighted sample in mgWAk, = injected mass of the analyteVjnj = injection volume
• The main advantage of the external standard method is that the standard is usuallythe same compound as the compound you are looking for. Thus, there is no dis-crepancy in the response factor (relationship between signal-concentration) [5],
• If the method is robust and the instrument is in impeccable working order (highquality and stable standard, easy sample preparation, constant injection volume,stable chromatographic conditions, etc.), the external method is the simplest andshould be the method of choice.
2. Internal standard method"ist "x
cx - unknown concentration of the analyte in the sampleckomp = concentration of the analyte in calibration;4jst =area of internal standard in calibrationkomp =area of analyte in calibration
Ax = measured area of analyteA'ia = measured area of the internal standard
• The internal standard is recommended for all those cases where something unto-ward may happen, such as:- Several complex steps in the sample preparation that could lead to sample
losses, e.g., extraction, precipitation or derivatization- Unstable sample- Losses during the injection process
• Slightly simplified, the difference between the internal and external standard meth-od could be described as follows: for the external standard method, there is a rela-tionship between peak areas and concentrations, whereas for the internal standardmethod there is a relationship between area ratios and the corresponding concentra-tions.What are the properties of a good internal standard?
• Its chemical and physical properties should resemble those of the component to beanalysed as far as possible. However, the chance of it being in the sample must beexcluded, even as a possible future event.
• It separates well from other compounds and it elutes near the relevant peak in thechromatogram. Sometimes two internal standards are needed to meet these require-ments, one that elutes early and one that elutes late in the chromatogram.
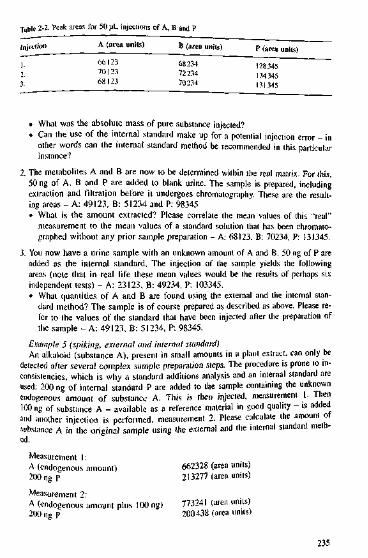
Table 2-2. Peak are;Injection1.
3.
is for 50 uL injections of A, BA (area units)66 1237012368123
andPB (area units)682347223470234
P (area units)128345134345131345
• What was the absolute mass of pure substance injected?• Can the use of the internal standard make up for a potential injection error - in
other words can the internal standard method be recommended in this particularinstance?
2. The metabolites A and B are now to be determined within the real matrix. For this,50 ng of A, B and P are added to blank urine. The sample is prepared, includingextraction and filtration before it undergoes chromatography. These are the result-ing areas - A: 49123, B: 51234 and P: 98345• What is the amount extracted? Please correlate the mean values of this "real"
measurement to the mean values of a standard solution that has been chromato-graphed without any prior sample preparation - A: 68123, B: 70234, P: 131345.
3. You now have a urine sample with an unknown amount of A and B. 50 ng of P areadded as the internal standard. The injection of the sample yields the followingareas (note that in real life these mean values would be the results of perhaps sixindependent tests) - A: 23123, B: 49234, P: 103345.• What quantities of A and B are found using the external and the internal stan-
dard method? The sample is of course prepared as described as above. Please re-fer to the values of the standard that have been injected after the preparation ofthe sample - A: 49123, B: 51234, P: 98345.
Example 5 (spiking, external and internal standard)An alkaloid (substance A), present in small amounts in a plant extract, can only be
detected after several complex sample preparation steps. The procedure is prone to in-consistencies, which is why a standard additions analysis and an internal standard areused: 200 ng of internal standard P are added to the sample containing the unknownendogenous amount of substance A. This is then injected, measurement 1. Then100 ng of substance A - available as a reference material in good quality - is addedand another injection is performed, measurement 2. Please calculate the amount ofsubstance A in the original sample using the external and the internal standard meth-od.
Measurement 1:A (endogenous amount) 662328 (area units)200 ng P 213277 (area units)
Measurement 2:A (endogenous amount plus 100 ng) 773241 (area units)200 ng P 200438 (area units)
235
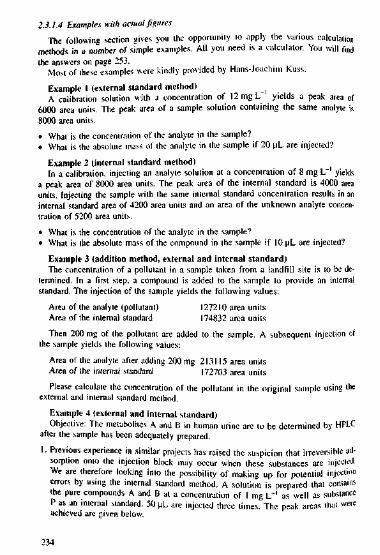
2.3.1.4 Examples with actual figuresThe following section gives you the opportunity to apply the various calculation
methods in a number of staple examples. All you need is a calculator. You will findthe answers on page 253.
Most of these examples were kindly provided by Hans-Joachim Kuss.Example 1 (external standard method) ^A calibration solution with a concentration of 12mgL yields a peak area of
6000 area units. The peak area of a sample solution containing the same analyte is8000 area units.• What is the concentration of the analyte in the sample?• What is the absolute mass of the analyte in the sample if 20 uL are injected?
Example 2 (internal standard method)In a calibration, injecting an analyte solution at a concentration of 8 mg L~' yields
a peak area of 8000 area units. The peak area of the internal standard is 4000 areaunits. Injecting the sample with the same internal standard concentration results in aninternal standard area of 4200 area units and an area of the unknown analyte concen-tration of 5200 area units.• What is the concentration of the analyte in the sample?• What is the absolute mass of the compound in the sample if 10 uL are injected?
Example 3 (addition method, external and internal standard)The concentration of a pollutant in a sample taken from a landfill site is to be de-
termined. In a first step, a compound is added to the sample to provide an internalstandard. The injection of the sample yields the following values:
Area of the analyte (pollutant) 127210 area unitsArea of the internal standard 174832 area unitsThen 200 mg of the pollutant are added to the sample. A subsequent injection of
the sample yields the following values:Area of the analyte after adding 200 mg 213115 area unitsArea of the internal standard 172703 area unitsPlease calculate the concentration of the pollutant in the original sample using the
external and internal standard method.Example 4 (external and internal standard)Objective: The metabolites A and B in human urine are to be determined by HPLC
after the sample has been adequately prepared.1. Previous experience in similar projects has raised the suspicion that irreversible ad-
sorption onto the injection block may occur when these substances are injected.We are therefore looking into the possibility of making up for potential injectionerrors by using the internal standard method. A solution is prepared that containsthe pure compounds A and B at a concentration of 1 mg IT1 as well as substanceP as an internal standard. 50 uL are injected three times. The peak areas that wereachieved are given below.
234

We analysed one sample containing 2 ng (xl) and one with 20 ng (xu)icn times each. We now want to calculate the two cv's to compare theprecision at these two concentrations, which arc the lower (xl) and the upper(xu) limits of a working range. We enter the corresponding values of thesignals, yl, into cells B1-B10 of an Excel spreadsheet, mark them and namethem "yl". Likewise, we enter yu into cells C1-C10, mark them and namethem "yu". Use the name box of "B1" to enter "yl" or use <insert> <name>.Enter into B11: |=AVERAOE(yl)j and into B 12:|=STDEV(yl)|, to get the twoterms necessary to estimate the cv in cell BI3. Enter into B13:|=B12*100/Bl 11. in BI4: j=B12/10A0.5| and in BI5: |=B14*TINV(0.05,9)|.Mark Bl 1-B15 and expand by one column to the right. Replace yl by yu inCll andC12.
5443532353255377536151975294522053115293
nVK(%) 1.35uSDMy 22.7015 VB[95%) 51.36
The precision of the estimated area yis characterised by the coefficient ofvariation (cv): | Q
MySDy = standard deviation of yMy-mean ofyThis is the precision of the individualvalues. To get the precision of themean (SDMy, standard error of themean), ihe standard deviation mustbe divided by the square root of thenumber of values, n. The 95%confidence interval (ci) is obtainedby multiplication with the t value.
c/(95%) = -
Figure 2-4. How to calculate the coefficient of variation and the confidence interval.
improvement in the method. With these considerations, anything that happens afterthe detector is often neglected because it can be correctly assumed that the computeris working with high precision. Indeed, you can assume that the error contributed bythe integration system is usually very low. However, is that true in all circumstances.Let us take a look at three cases:
. You have only large, baseline-separated peaks. You see a chromatogram with aight line due to the baseline, along with narrow individual peaks Under these
a straight line through zero. ,. . ,_ nnt ,vvre•f .hi, is not the ca.se, it is possib.e that the integrate con*ions ae no. £n
«. If your slope (threshold) is too high, the data system will find the cut
237
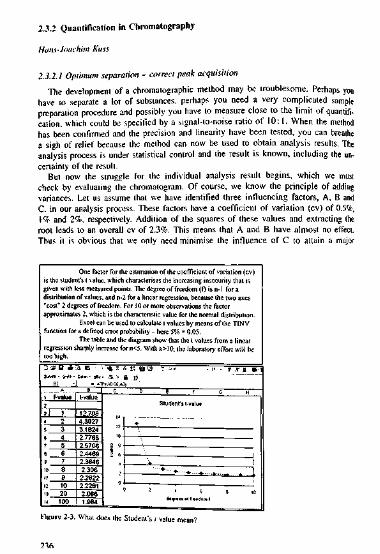
2-3.2 Quantification in Chromatography
Hans-Joachim Kuss
2.3.2.1 Optimum separation - correct peak acquisitionThe development of a chromatographic method may be troublesome. Perhaps yon
have to separate a lot of substances, perhaps you need a very complicated samplepreparation procedure and possibly you have to measure close to the limit of quantifi-cation, which could be specified by a signal-to-noise ratio of 10:1. When the methodhas been confirmed and the precision and linearity have been tested, you can breathea sigh of relief because the method can now be used to obtain analysis results. Theanalysis process is under statistical control and the result is known, including the un-certainty of the result.
But now the struggle for the individual analysis result begins, which we mustcheck by evaluating the chromatogram. Of course, we know the principle of addingvariances. Let us assume that we have identified three influencing factors, A, B andC. in our analysis process. These factors have a coefficient of variation (cv) of 0.5%,\% and 2%, respectively. Addition of the squares of these values and extracting theroot leads to an overall cv of 2.3%. This means that A and B have almost no effect.Thus it is obvious that we only need minimise the influence of C to attain a major
One factor for the estimation of the coefficient of variation (cv)is the student's t value, which characterises the increasing insecurity that isgiven with less measured points. The degree of freedom (0 is n-1 for adistribution of values, and n-2 for a linear regression, because the two axes"cost" 2 degrees of freedom. For 10 or more observations the factorapproximates 2, which is the characteristic value for the normal distribution.
Excel can be used to calculate t values by means of the TINVfunction for a defined error probability - here 5% = 0.05.
The table and the diagram show that the t values from a linearregression sharply increase for n<5. With n>10, the laboratory effort will betoo high.0 a= H S3*94- irV*-
53i f-value3 } 1*. 2
7 5B 69 710 8it Sis 20u 100
A K •
t-value12.7064.3027
2.44692.36462.306226222.0861.984
<4 £ f' SI jjJl &l t *** • » • F x n W\\£ > a a
WO C6AiJ Student's t-valut
!2 •io •
J :
02 * e o
deqruetol freedom f0
Figure 2-3. What does the Student's ; value mean?
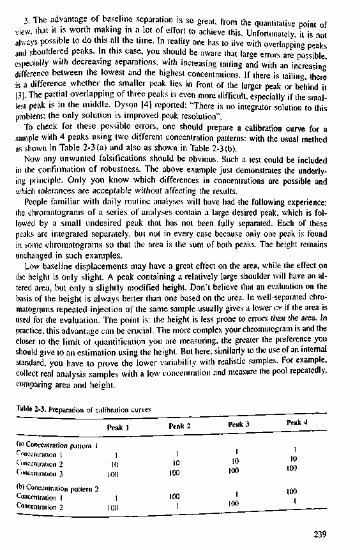
3. The advantage of baseline separation is so great, from the quantitative point ofview, that it is worth making in a lot of effort to achieve this. Unfortunately it is notalways possible to do this all the lime. In reality one has to live with overlapping peaksand shouldered peaks. In this case, you should be aware that laree errors are possibleespecially with decreasing separations, with increasing tailing and with an increasingdifference between the lowest and the highest concentrations. If there is tailing, thereis a difference whether the smaller peak lies in front of the larger peak or behind it[3]. The partial overlapping of three peaks is even more difficult, especially if the smal-lest peak is in the middle. Dyson |4] reported: "There is no integrator solution to thisproblem; the only solution is improved peak resolution".
To check for these possible errors, one should prepare a calibration curve for asample with 4 peaks using two different concentration patterns: with the usual methodas shown in Table 2-3 (a) and also as shown in Table 2-3 (b).
Now any unwanted falsifications should be obvious. Such a test could be includedin the confirmation of robustness. The above example just demonstrates the underly-ing principle. Only you know which differences in concentrations are possible andwhich tolerances are acceptable without affecting the results.
People familiar with daily routine analyses will have had the following experience:the ehromatograms of a series of analyses contain a large desired peak, which is fol-lowed by a small undesired peak that has not been fully separated. Each of thesepeaks are integrated separately, but not in every case because only one peak is foundin some ehromatograms so that the area is the sum of both peaks. The height remainsunchanged in such examples.
Low baseline displacements may have a great effect on the area, while the effect onthe height is only slight. A peak containing a relatively large shoulder will have an al-tered area, but only a slightly modified height. Don't believe that an evaluation on thebasis of the height is always better than one based on the area. In well-separated ehro-matograms repeated injection of the same sample usually gives a lower cv if the area isused for the evaluation. The point is: the height is less prone to errors than the area. Inpractice, this advantage can be crucial. The more complex your chromatogram is and thecloser to the limit of quantification you are measuring, the greater the preference youshould give to an estimation using the height. But here, similarly to the use of an internalstandard, you have to prove the lower variability with realistic samples. For example,collect real analysis samples with a low concentration and measure the pool repeatedly,comparing area and height.
Table 2-3. Preparation of calibration curvesfakl Peak 2 Peak 3 Pc"k 4
(ill Concentration pattern 1 jConcentration 1 ] ' ' 10Concentration 2 10 10 10 .„„Concentration 3 100 100 10°(b) Concentration pattern 2 JQQConcentration 1 1 100 ' !Concentration 2 100 ' 10°
239
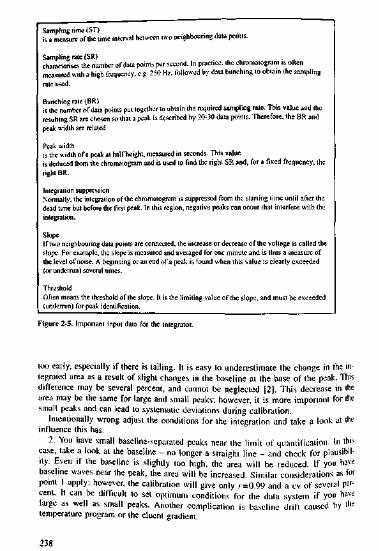
Sampling time (ST)is a measure of the lime interval between two neighbouring data points.Sampling rate (SR) .characterises the number of data points per second. In practice, the chromatogram is oftenmeasured with a high frequency, e.g. 250 Hz, followed by data bunching to obtain the samplingrate used.Bunching rate (BR)is the number of data points put together to obtain the required sampling rate. This value and theresulting SR are chosen so that a peak is described by 20-30 data points. Therefore, the BR andpeak width are related.Peak widthis the width of a peak at half height, measured in seconds. This valueis deduced from the chromatogram and is used to find the right SR and, for a fixed frequency, theright BR.Integration suppressionNormally, the integration of the chromatogram is suppressed from the starting time until after thedead time but before the first peak. In this region, negative peaks can occur that interfere with theintegration.SlopeIf two neighbouring data points are connected, the increase or decrease of the voltage is called theslope. For example, the slope is measured and averaged for one minute and is thus a measure ofthe level of noise. A beginning or an end of a peak is found when this value is clearly exceeded(or underrun) several times.ThresholdOften means the threshold of the slope. It is the limiting value of the slope, and must be exceeded(undcrrun) for peak identification.
Figure 2-5. Important input data for the integrator.
too early, especially if there is tailing. It is easy to underestimate the change in the in-tegrated area as a result of slight changes in the baseline at the base of the peak. Thisdifference may be several percent, and cannot be neglected [2]. This decrease in thearea may be the same for large and small peaks; however, it is more important for thesmall peaks and can lead to systematic deviations during calibration.
Intentionally wrong adjust the conditions for the integration and take a look at theinfluence this has.
2. You have small baseline-separated peaks near the limit of quantification. In thiscase, take a look at the baseline - no longer a straight line - and check for plausibil-ity. Even if the baseline is slightly too high, the area will be reduced. If you havebaseline waves near the peak, the area will be increased. Similar considerations as forpoint 1 apply; however, the calibration will give only r=0.99 and a cv of several per-cent. It can be difficult to set optimum conditions for the data system if you havelarge as well as small peaks. Another complication is baseline drift caused by thetemperature program or the eluent gradient.
238
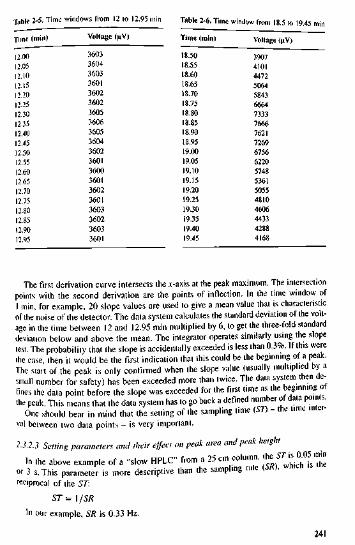
Table 2-5. Time windows from 12 to 12.95 min Table 2-6. Time window from 18.5 to 19.45 rTime (min)12.0012.0512.1012.1512.2012.2512.3012.3512.4012.4512.5012.5512.6012.6512.7012.7512.8012.8512.9012.95
Voltage ((iV)
36033604360336013602360236053606360536043602360136003601360236013603360236033601
Time (mint18.5018.5518.6018.6518.7018.7518.8018.8518.9018.9519.0019.0519.1019.1519.2019.2519.3019.3519.4019.45
Voltage (uV)39074101447250645843666473337666762172696756622057485361505548104606443342884168
The first derivation curve intersects the -t-axis at the peak maximum. The intersectionpoints with the second derivation are the points of inflection. In the time window of1 min, for example, 20 slope values are used to give a mean value that is characteristicof the noise of the detector. The data system calculates the standard deviation of the volt-age in the time between 12 and 12.95 min multiplied by 6, to get the three-fold standarddeviation below and above the mean. The integrator operates similarly using the slopetest. The probability that the slope is accidentally exceeded is less than 0.3%. If this werethe case, then it would be the first indication that this could be the beginning of a peak.The start of the peak is only confirmed when the slope value (usually multiplied by asmall number for safety) has been exceeded more than twice. The data system then de-fines the data point before the slope was exceeded for the first time as the beginning otthe peak. This means that the data system has to go back a defined number of data points.
One should bear in mind that the setting of the sampling time (ST) - the time inter-val between two data points - is very important.
2.3.2.3 Setting parameters and their effect on peak area and peak heightIn the above example of a -slow HPLC" from a 25 cm column, the S7Ms O05 >mn
or 3 s.This parameter is more descriptive than the sampling rate (SR). which isreciprocal of the ST:
ST = ]/SRIn our example, SR is 0.33 Hz.
241

2.3.2.2 Understanding the "mind" of the integration systemIt is well known that computers only process digital data - only the information 0
or 1. as shown in Table 2-4.The number 20 is represented by 010100 (16+4) and 45 by 101101 (32 + 8+4 + 1).
The analogue signal is convened by an analogue-to-digital converter (ADC). An ADCwith 20 bit can divide the maximum signal of a UV detector (usually 1 V) into 10*parts, that is 1 uV. because 22" corresponds to approximately 1 million. If a verynoise-free UV detector is used, this could be insufficient.
An HPLC chromatogram of 30 min is shown in Figure 2-6.Three main peaks are immediately obvious. The same chromatogram looks even
more simple to the integrator, but it is more complicated to "see" the peaks. In thelime window in Table 2-5 from 12 to 12.95 min a baseline is shown.
In the time window from 18.5 to 19.45 min (Table 2-6), there is a peak with amaximum at 18.85 min.
The data system fits a parabolic curve to the highest values and estimates the exactretention lime and the exact height of the peak. The computer needs very little timeto analyse the chromatogram in its own way, but the "thinking" is different to oursand more simple. Excel can convert the entire table into a diagram that looks like ourusual chromatogram. The difference between two consecutive points is the slope, orthe first derivation with respect to time. The second derivation is found analogously.
Table 2-4.Exponent
20
Processing of digital dala5
32
0
4161
380
241
120
010
Figure 2-6. A chromalogram wilh 3 peaks [*=time(n,in), >=signal (uV)].
240
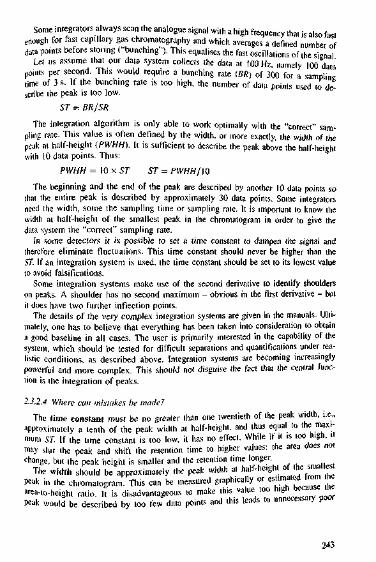
Some integrators always scan the analogue signal with a high frequency that is also fastenough for fast capillary gas chromatography and which ave
scribe the peak is too low.ST = BR/SR
The integration algorithm is only able to work optimally with the "correct" sam-pling rate. This value is often defined by the width, or more exactly, the width of thepeak at half-height (PWHH). It is sufficient to describe the peak above the half-heightwith 10 data points. Thus:
PWHH = 10 x ST ST = PWHH/10The beginning and the end of the peak are described by another 10 data points so
that the entire peak is described by approximately 30 data points. Some integratorsneed the width, some the sampling time or sampling rate. It is important to know thewidth at half-height of the smallest peak in the chromatogram in order to give thedata system the "correct" sampling rate.
In some detectors it is possible to set a time constant to dampen the signal andtherefore eliminate fluctuations. This time constant should never be higher than theST. If an integration system is used, the time constant should be set to its lowest valueto avoid falsifications.
Some integration systems make use of the second derivative to identify shoulderson peaks. A shoulder has no second maximum - obvious in the first derivative - butit does have two further inflection points.
The details of the very complex integration systems are given in the manuals. Ulti-mately, one has to believe that everything has been taken into consideration to obtaina good baseline in all cases. The user is primarily interested in the capability of thesystem, which should be tested for difficult separations and quantifications under rea-listic conditions, as described above. Integration systems are becoming increasinglypowerful and more complex. This should not disguise the fact that the central func-tion is the integration of peaks.
2.3.2.4 Where can mistakes be made?The time constant must be no greater than one twentieth of the peak width, i.e.,
approximately a tenth of the peak width at half-height, and thus equal to the maxi-mum ST. If the time constant is too low, it has no effect. While it it is too high, itmay slur the peak and shift the retention time to higher values: the area does notchange, but the peak height is smaller and the retention time longer.
The width should be approximately the peak width at half-height of the smallespeak in the chroma.ogram This ean be measured graphically or "'.mated Iron, hearea-to-height ratio. It is disadvantageous to make this value too high becausethepeak would be described by too few data points and this leads to unnecessary poor
243

8000 -I7501 •7c:: •6500 •6000 •5500 •5000 •4500 •4000 •3500 •3000 -1
18
800 -
400 -200 •
1 f
-400 ••600 -
200 -100 -
15-100•200•300•400
,4
,4
If
186
/
/
18,6
/18,6
-- — i
f \i \ .. ...
X !X !
^ - ^ T 1
18,8 19 19.2 19,4 19.6 19.8
.-— 1\
\•
\
18 3 \ 19 19.2 _^JS*-J*'J^9B 19.8
TO.8 1 9 / 19,2 19.4 19,6 1<
\ i
V
,8
Figure 2-7. One peak, ils first derivation as the difference of the data points and ils second derivationas difference of the points of the first derivation.
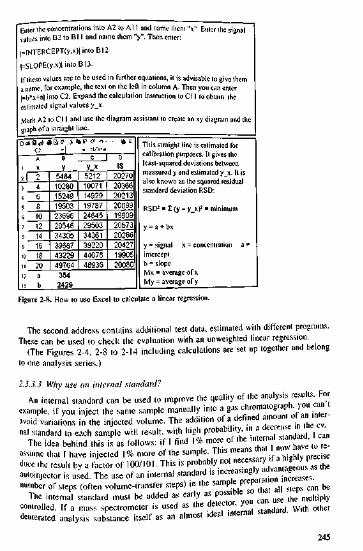
Enter the concentrations into A2 to Al 1 and name them "x". Enter the signalvalues into B2 to Bl 1 and name them "y"- Then enter:|=lKTERCEPT(y,X)|intoB12|=SLOPE(y.x)|intoB13.If these values are to be used in further equations, it is advisable to give thema name, for example, the text on the left in column A. Then you can enter|=b*x+a| into C2. Expand the calculation instruction to Ci 1 to obtain theestimated signal values y_x.Mark A2 to Cl 1 and use the diagram assistant to create an xy diagram and thegraph of a straight line.
l2?45fi7S91011
A2468101214161820
y5484102801524919503236962954634305396874322949764
• -bVa
y x5212100711492919787246452950334361392204407848936
DIS20270203662021320099199092057320266204271990520080354
2429
This straight line is estimated forcalibration purposes. It gives theleast-squared deviations betweenmeasured y and estimated y_x. It isalso known as the squared residualstandard deviation RSD:RSD! = 2 (y - yjCf = minimumy = a + bxy = signal x = concentration a =interceptb = slopeMx = average of xMy = average of y
Figure 2-8. How to use Excel to calculate a linear regression.
The second address contains additional test data, estimated with different programs.These can be used to check the evaluation with an unweighted linear regression.
(The Figures 2-4, 2-8 to 2-14 including calculations are set up together and belongto one analysis series.)2.3J.3 Why use an internal standard?
An internal standard can be used to improve the quality of the analysts ™f*J°?example, if you inject the same sample manually into a gas chromatograph >ou can tavoid variations in the injected volume. The addition of a dei.ned amountoannt rnal standard to each sample will result, with high probability m a dec ea«mUte™
The idea behind this is as follows: if I find 1% more of the intern I »»ndanU <assume that I have injected 1% more of the sample. This means that 1no. h u o educe the result by a factor of 100/101. This is probably not necessa r fa ghbP ecinjector is used. The use of an internal standard is ' " ^ ' ^ f ™ " ^ , "number of steps (often volume-transfer steps) in the sample pr p,««o» n c ^ ^
The internal standard must be added as early as poss,ble » < aU .J. ^ ^controlled. If a mass spectrometer is used as the <>etectorJou
dar(1 with olherdeuterated analysis substance itself as an almost .deal .nternal
245
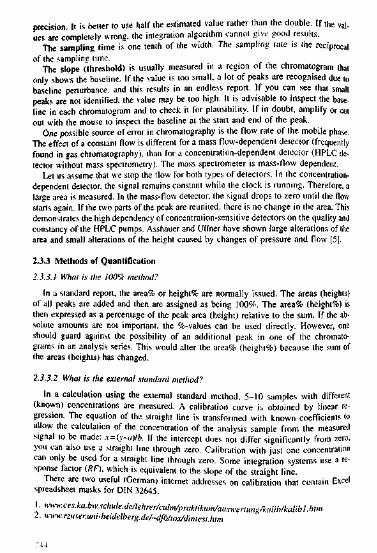
precision. It is better to use half the estimated value rather than the double. If the val-ues are completely wrong, the integration algorithm cannot give good results.
The sampling time is one tenth of the width. The sampling rate is the reciprocalof the sampling lime.
The slope (threshold) is usually measured in a region ot the chromatogram thatonly shows the baseline. If the value is too small, a lot of peaks are recognised due tobaseline perturbance. and this results in an endless report. If you can see that smallpeaks are not identified, the value may be too high. It is advisable to inspect the base-line in each chromatogram and to check it for plausibility. If in doubt, amplify or cutout with the mouse to inspect the baseline at the start and end of the peak.
One possible source of error in chromatography is the flow rate of the mobile phase.The effect of a constant flow is different for a mass flow-dependent detector (frequentlyfound in sas chromatography). than for a concentration-dependent detector (HPLC de-tector without mass spectrometry)- The mass spectrometer is mass-flow dependent.
Let us assume that we stop the flow for both types of detectors. In the concentration-dependent detector, the signal remains constant while the clock is running. Therefore, alarge area is measured. In the mass-flow detector, the signal drops to zero until the flowstarts again. If the two parts of the peak are reunited, there is no change in the area. Thisdemonstrates the high dependency of concentration-sensitive detectors on the quality andconstancy of the HPLC pumps. Asshauer and Ullner have shown large alterations of thearea and small alterations of the height caused by changes of pressure and flow [5].
2.3.3 Methods of Quantification2.3.3.1 What is the 100% method?
In a standard report, the area% or height% are normally issued. The areas (heights)of all peaks are added and then are assigned as being 100%. The area% (height%) isthen expressed as a percentage of the peak area (height) relative to the sum. If the ab-solute amounts are not important, the %-values can be used directly. However, oneshould guard against the possibility of an additional peak in one of the chromato-grams in an analysis series. This would alter the area% (height%) because the sum ofthe areas (heights) has changed.
2.3.3.2 What is the external standard method?In a calculation using the external standard method, 5-10 samples with different
(known) concentrations are measured. A calibration curve is obtained by linear re-gression. The equation of the straight line is transformed with known coefficients toallow the calculation of the concentration of the analysis sample from the measuredsignal to be made: x=(y-a)lb. If the intercept does not differ significantly from zero,you can also use a straight line through zero. Calibration with just one concentrationcan only be used for a straight line through zero. Some integration systems use a re-sponse factor (RF), which is equivalent to the slope of the straight line.
There are two useful (German) internet addresses on calibration that contain Excelspreadsheet masks for DIN 32645.
1. ^^••ces.ka.bw.schule.Je/lehrer/culni/praklikum/auswerlunii/kalib/kalibl.hlm2. K*-K.rzuser.uni-heidelberg.de/~df6/tnMintest.hlm
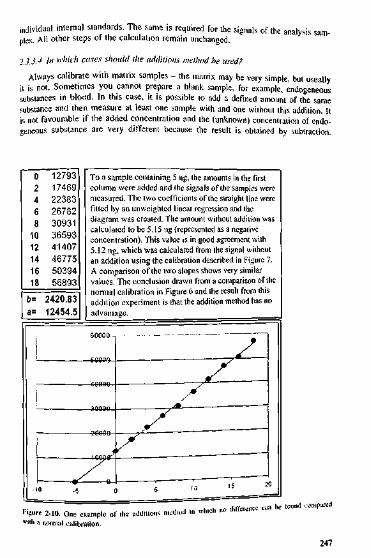
individual internal standards. The same is required for the signals of the analysis sam-ples AH other steps of the calculation remain unchanged.
9 jj4 fa which cases should the additions method be used?Always calibrate with matrix samples - the matrix may be very simple, but usually
it is not. Sometimes you cannot prepare a blank sample, for example, endogeneoussubstances in blood. In this case, it is possible to add a defined amount of the samesubstance and then measure at least one sample with and one without this addition. Itis not favourable if the added concentration and the (unknown) concentration of endo-oeneous substance are very different because the result is obtained by subtraction.
024681012141618b=a=
127931746922383267823093136593414074677550394568932420.8312454.5
To a sample containing 5 ng, the amounts in the firstcolumn were added and the signals of the samples weremeasured. The two coefficients of the straight line werefitted by an unweighted linear regression and thediagram was created. The amount without addition wascalculated to be 5.15 ng (represented as a negativeconcentration). This value is in good agreement with5.12 ng, which was calculated from the signal withoutan addition using the calibration described in Figure 7.A comparison of the two slopes shows very similarvalues. The conclusion drawn from a comparison of thenormal calibration in Figure 6 and the result from thisaddition experiment is that the addition method has noadvantage.
I • h i) difference can be found comparedF'8urc 2-10. One example of llie additions method in which nwilli a normal calibration.
247
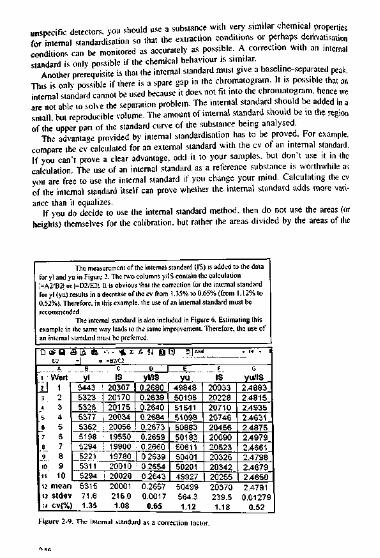
unwcific detectors, you should use a substance with very sim.lar chemtcal propertiesfor internal standardisation so that the extraction conditions or perhaps denvatisationcondition, can be mon.tored as accurately as poss.ble. A correction w,th an mtcmalstandard is only possible if the chemical behaviour is sim.lar.
Another prerequisite is that the internal standard must give a baseline-separated peak.This is onlv possible if there is a spare gap in the chromatogram. It is posS1ble that aninternal standard cannot be used because it does not fit into the chromatogram. hence weare not able to solve the separation problem. The internal standard should be added in asmall but reproducible volume. The amount of internal standard should be in the regionof the upper part of the standard cune of the substance being analysed.
The advantage provided by internal standardisation has to be proved. For example,compare the calculated for an external standard with the cv of an internal standard.If you can't prove a clear advantage, add it to your samples, but don't use it in thecalculation. The use of an internal standard as a reference substance is worthwhile asyou are free to use the internal standard if you change your mind. Calculating the cvof the internal standard itself can prove whether the internal standard adds more vari-ance than it equalizes.
If you do decide to use the internal standard method, then do not use the areas (orheights) themselves for the calibration, but rather the areas divided by the areas of the
The measurement of the internal standard (IS) is added to the datafor yl and yu in Fieurei=A2/B2! oO2/E2I.
2. The two columns y/IS contain the calculationt is obvious that the correction for the internal standard
for yl (yu) results in a decrease of the cv from.35% to 0.65% (from0.52%). Therefore, in this example, the use of an internalrecommended.
.12% totandard must be
The internal standard is also included in Figure 6. Estimating thisexample in the same wan internal
D2Ai Wert
U 13 24 36 46 57 6B 79 810 911 1012 mean13 stdev14 CV(%
ay leads to the same improvement. Therefore, the use ofstandard must be preferred.9tA 6
Byi5443532353265377536251985294522153115294531571.61.35
.-, - 41
cIS203072017020175200342005619550199001978020010
| 2002820001216.01.08
r- n U Ul SU**
Dyl/IS0.26800.26390.26400.26840.26730.26590.26600.26390.26540.26430.26570.00170.65
Eyu4984850196516415109950883501835061150401502014992750499564.31.12
FIS2003320228207102074620456200902052320325203422025520370239.51.18
.14 .; i
Gyu/IS2.48832.48152.49352.46312.48752.49792.46612.47982.46792.46502.47910.01279
0.52Figure 2-9. The internal standard as a correction factor.
2.3,4 Weighted Regression2J.4.1 What about the F-test? What are the other possibilities?The F-test
The data of Figures 2-4 and 2-8 were measured in one series and belong togetherTherefore, in addition to the data of the linear regression in Figure 2-8 we carriedout a ten-fold measurement of the outer points of the working range This gave thestandard deviations SDy» = 71.62 and S%o = 564.31. The F-value, calculated as thequotient of the squared standard deviations, is 62.08. Therefore, we have a very sig-nificant difference in the variances, that is. they are inhomogeneous.
What can we do?1. Ignore the F-test.2. Divide the working range into two similarly sized parts.3. Use a weighted linear regression [6].
Case 1:This is critical. It is common practice to use a (passed) F-test. The least-squares
equations assume homogeneous variances.Case 2:Unfortunately, this is associated with a considerable amount of extra work. It may
be necessary to split a very large working range of 100 or 1000 into more than twoparts.
Case 3:This method is not widely used, and is not required by DIN. EN or ISO standards.
In spite of this, a weighting with I/A' or \lx" is often used to fit exponentials in phar-macokinetics. However, in simple cases, this is done by trial and error, and often in-tuitively with l/.v because I/*2 seems too high.
Although weighting seems to have a coarse and arbitrary influence in the least-squares equations, this is not the case because the measurement of the two standarddeviations shows that SDo is significantly larger than SDu. The normal linear regres-sion is really weighting all deviations with a factor of I. This means that the devia-tions at higher concentrations are taken into account too much, while those at lowconcentrations are not considered enough. Therefore, in the above example, theweighting cancels an incorrect supposition and is a return to reality!
In a concentration range of (ABx=) 10, F has to be 10 (100) so that it is balancedby a l/.v (I/A-2) weighting In our example, F=62.08, that is, it lies between 10 and100. but closer to 100 Therefore, a 1// (1/y2) weighting could be adequate. This cor-responds to a weighting exponent W£=2. It would be more precise to calculate tneindividual weighting exactly [7|:
logFllog/lfiy ~~ logyo - logy"
In our example, the estimated weighting exponent would be 1 87. With this ••modelopposition", we have the additional advantage that the signal of an unknown, anal>MSample is associated with a defined weighting. Without a model tins would be a prob
249

To a sample containing 15 ng. amounts between 2 to 18 ng were added.The least-squares calculation resulted in two parameters, a and b. Theintercept, a, is the signal calculated for the sample without an addition. Anamount of 15.1 ns was calculated by extrapolation to y=0. A comparisonof the slope of the two examples for the addition method shows a largedifference. Therefore, the addition method has a definite advantage in thiscase, comparing only the data from Figures 2-10 and 2-11.
44334.2 49206~f 55055"
8 64654-ttr—73208-12 7803514 84381
16-—89WH18 95934
X
X
b= 2882
-20 -15 -10 -5 15 20
Figure 2-11. A second example of the additions method wilh large deviations from the first example.
Therefore, more than one concentration of added substance is commonly used - i.e.,one individual calibration curve for each sample.
The calculated result using the addition method must be in the "working range" ofthe added concentrations. Otherwise the added concentrations are not adequate.
This clearly demonstrates the disadvantage of this method: you need a multiple ofthe number of analysis samples. If you find that different analysis samples give differ-ent slopes for the straight line, then the real advantage of the additions method be-come obvious: the matrix effects will be considered individually. This means that theadditions method gives better results then normal calibration, if the matrix is variable.Some samples can only be analysed with the additions method.
248

It is best to reserve the upper rows for the results so that the spreadsheet can be extendeddownwards. Let's write an identifier for the columns into row 6. Thus, type the follow™text cell-by-cell into A6 to 16: x, y, g, w, i«, yw. xyw, xxw. y x. If, for example amaximum of 24 concentrations is expected, mark A7 to A30 and enter the cell name intothe name box. This name and not the text in A6 can be used in the calculation instructions(which always begin with "=") to simplify them and make them more concise. To sec thisname, click on the cell or mark the cell region. The text in row 6 is always visible and isused for visual identification. If you want to give regions of the spreadsheet a backgroundcolour, use <format> <cclls> <pattcms>.Type |-numbcr(x)| into HI and give cell HI the name "n". In Gl you can enter (optionally)|n=], which is only an explanatory text. Then into Al enter Regression with weightingexponent WE-|. Into cell El type "0" (zero) and name it "WE". Type |y=| into A2 and |x+|intoC2.Row 5 is reserved for the sums of the variables between rows 7 to 30. Therefore, enterj=SUM(x)l into A5 and so on up to |=SUM(y_x)| in 15. Each cell should be named with "S"followed by the identification text in row 6, for example, Sx to Sy x. Now enter|»lf(y>0,yA-WE,"")| into C7 and expand this instruction to C30. You can then sec thepreliminary weighting, g, but only if a concentration is given in column A. Otherwise thecell is empty: {""). In D7 enter Hf(y<0,n*g/Sg,"")| and expand to D30. Column D nowcontains the final weighting, w, whose sum, Sw, must be equal to n.Enter ]«IHyX),x*w,"")l into E7, |=If(y>0,y«w,"")| into F7, HHyO,x*y*w."")l into G7 and|-IiTy>0,x*x*w,"")| into H7 and expand to row 30. Now we only need the average of xwand yw to be able to calculate the intercept aw and the slope bw. Therefore, typei=AVERAGE(xw)| into E4 and name it "Mxw". Type j=AVERAGE(yw)| into F4 and nameit "Myw".Enter j=(Sxvw-n*Mx\v*Myw)/(Sxxw-n*Mxw*Mxw)| into B2 and name it "b". Type|=Myw-b*Mxw| into D2 and name it "a". Now you only need to enter j=a+b*x[ into 17 andexpand to 130 to obtain the spreadsheet shown in Figure 11.
Figure 2-12. Weighted regression with Excel.
The measurement uncertainty (mu) can be read from a graph of the prediction in-terval (pi) in the x direction [pi(95%) for 30000: 11.8 to 12.6]. As the measurementof the standard deviation at the endpoints of the working range demonstrates, the un-certainty reflects the real world. In practice, every analysis result is calculated directly[II], including the mu:
, t-RSD + E >" bl £(.v - Atafv,, is the measured signal of the analysis sample, w, the related weightingWithout weighting, the mu is too high at low concentrations [121. In addition, the
limit of detection and the limit of quantification are (unnecessarily) estimated toohigh, as shown by Castillo 11O|. With weighting, the limit of detection is foundvery similar to the signal-to-noi.se method, which is realistic in chromatograpny
The possibility given in some integration programs to weight withJft. 1>">aybe not at all is a decision that has to be made for the vahdation. It leappliesto«« lifetime of the method. The calculation of the weighting expo,, , ^ h e r etakes account of it as an individual variable for the description of h -u ht mwording to slope and intercept. Therefore, it provides a greater flex,b,ht> ot tnt y
251
lem. In our example, we balanced a nearly nine-fold difference in the standard devia-tions by multiplying SDu by 3 and dividing SDo by 3.
2.3.4.2 How do we weigh: 'he individual values?It is better to base the weighting on the v values because the measured standard de-
viations. SDy, should be more closely related to y than to .v. The weighting is per-formed in two steps. The preliminary weighting factor is given by:
and g is normalised [8] so that 2Zw=n:gn
w = =—E«
Almeida [9] has pointed out that the equations for the normal linear regression canbe converted into those for weighted linear regression '"by adding a term wt to anysum and changing any term n into Ziij". Conversely, equations with weighting con-tain the normal (unweighted) case by changing £»', into n and setting all w-, to 1.
Vxyw —n-Mw-Mvir ,, , ,,bw — J-. f— aw = Myw — b • Mxw2jx2w — n • Mxw-If you know the weighting factor, w, it is no problem to calculate aw and bw with
only a pocket calculator. It is even simpler with Excel, as is demonstrated in Figure2-12.
2.3.4.3 How to use Excel for weighted regressionOf course, it is not possible to use the Excel functions slope and intercept. Also
only very few statistics programs are able to take a weighting factor into considera-tion.
In Excel you can arrange your calculation to suit. Figure 2-12 shows how to inputthe necessary calculations. This results in a spreadsheet (Figure 2-13), in which theestimated weighting factor W£=1.87 was used. The corresponding diagram (use thediagram assistant) is shown in Figure 2-14. To recognise the effect of the weighting,the prediction interval was also calculated [10] and represented graphically:
,v, are the single concentrations of the calibration curveThe effect of weighting on the position of the straight line is less than expected.
Without weighting, there is a constant band positioned around and parallel to thestraight line. There is a slight widening towards the ends.
The weighting has the effect of lowering the "mobility" of the best fit of thestraight line at low concentrations and increasing it at high concentrations, in agree-ment with reality. It is no wonder that the parameters of the straight line are barelyinfluenced by the weighting.
250
lion/time curve.A weighted regression does not require too much additional effort and is more
closely based on reality than a ordinary regression, which is included as a specialcase. It is to be expected that a weighted regression will be used more frequently
References
1. Funk, W., Dammann, V., Donnevert, G. Qttalitatssicherung in der AnalytischenChemie, VCH-Verlag, Weinheim, 1992, p. 14.
2. Neue, U.D., Phillips, D.J., Walter, T.H., Capparella, M., Alden, B Fisk R PLC-GC INT. 1995, S, 26-33.
3. Meyer, V. R. Falhtricke und Fehlerquellen der HPLC in Biklern, Hiithig Verlag,Heidelberg, 1996, p. 94 onwards.
4. Dyson, N. Chromalographic Integration Methods, The Royal Society of Chemis-try, Cambridge, 1990, p. 141.
5. Asshauer, J., Ullner, H. in: Practice of High Performance Liquid Chromatography,Engelhardt, H. (ed.), Springer-Verlag, Berlin, 1986, p. 83.
6. Miller, J.N., Miller, J.C. Statistics and Chemometrics for Analytical Chemistry,Prentice Hall, New York, 2000.
7. Kuss, H.J. LCGC Europe 16(12), December 2003, 819-823.8. Burke, S. Sri. Data Managem. 1998, 2, 32-40.9. Almeida, A.M., Castel-Branco, M.M., Falcao, F.C. J. Chromatogr. B 2002, 774,
215-222.10. Castillo, M.A., Castells, R.C. J. Chromatogr. A 2001, 921, 121-133.11. Caulcutt, R., Boddy, R. Statistics for Analytical Chemists, Chapman and Hall,
London, 1983, p. 106.12. Doerffel, K., Statistik in der analytischen Chemie, Deutscher Verlag fur Grund-
stoffindustrie, 1990.
253

_234JL6-8-
- • •
y ? i
1 5 "
« [
% r ft * i t i a * _ ^ _
A " B 1 c ; P _ , .
R e g r e s s i o n w i t h w e i g h t i n g e x p o n e n t W E =
v * ! 2 3 9 3 5 7 2 4 3 1 « • 6 8 0 . 8 5 1 7 0 4
8
1 0
1 2
1 6
1 8
2 0
1 0 2 7 8 9
1 5 2 4 8 9
1 9 5 0 3 . 1
2 3 6 3 6 4
2 9 5 4 5 5
3 4 3 0 4 5
3 9 6 8 6 6
4 3 2 2 8 8
4 9 7 6 3 5
• 5 E - O 7
: . 0 1 8 2 6 - 0 7
3 1 4 4 7 E - 0 8
1 5 0 4 3 E - 0 8
9 . 4 9 5 2 E - O 9
6 . 5 9 7 E - 0 9
4 . 3 6 7 E - 0 9
3 . 3 0 2 9 E - 0 9
2 5 1 5 E - 0 9
2 . 1 4 3 4 6 - 0 9
1 6 4 7 3 E - 0 9
1 0
w
5 . 7 0 8 1 5 3 8
1 . 7 6 2 9 2 1 9 8
0 8 4 3 3 2 7 5 5
0 . 5 3 2 3 0 2 4 9
0 . 3 6 9 8 2 5 0 1
0 2 4 4 8 1 2 4 5
0 . 1 8 5 1 5 9 4
0 1 4 0 9 8 9 9 8
0 1 2 0 1 5 9 0 5
0 0 9 2 3 4 8 3
1 . 8 7
4 . 3 2 S 0 2 8 0 3
4 3 2 8 0 2 8 0 3
X W
1 1 . 4 1 6 3 0 7 6
7 . 0 5 1 6 8 7 9 1
5 . 0 5 9 9 6 5 3 3
4 . 2 5 8 4 1 9 9
3 . 6 9 8 2 5 0 1 2
2 . 9 3 7 7 4 9 4 2
2 5 S 2 2 3 1 6 4
2 2 5 5 8 3 9 6
2 . 1 6 2 8 6 2 8 2
1 . 8 4 6 9 6 5 9 8
- 1 3 .
1 1 0 4 0 3 0 0 3
1 1 0 4 0 3 . 0 0 3
y w
3 1 3 0 5 . 2 2 7 9
1 8 1 2 2 6 6 1 6
1 2 8 5 9 . 8 1 7 5
1 0 3 8 1 . 5 4 8 6
8 7 6 3 . 5 2 1 4 2
7 2 3 3 . 1 0 6 2 9
6 3 5 1 . 8 0 0 7 3
5 5 9 5 4 1 2 7 5
5 1 9 4 . 3 3 1 3 4
4 5 9 5 5 7 4 5 7
n =
8 3 3 6 0 6 . 1 5 6
x y w
6 2 6 1 0 4 5 5 7
7 2 4 9 0 6 4 6 5
7 7 1 5 8 . 9 0 5 3
8 3 0 5 2 . 3 8 9 1
8 7 6 3 5 . 2 1 4 2
8 6 7 9 7 . 2 7 5 4
8 8 9 2 5 . 2 1 0 2
8 9 5 2 6 . 6 0 4 1
9 3 4 9 7 . 9 6 4 2
9 1 9 1 1 . 4 9 1 4
1 0
3 3 5 . 9 5 7 5 3 9
x x w
2 2 . 8 3 2 6 1 5 2
2 8 . 2 0 6 7 5 1 6
3 0 . 3 5 9 7 9 2
3 4 . 0 6 7 3 5 9 2
3 6 . 9 8 2 5 0 1 2
3 5 . 2 5 2 9 9 3
3 5 . 2 9 1 2 4 2 9
3 6 . 0 9 3 4 3 3 7
3 8 . 9 3 1 5 3 0 7
3 6 . 9 3 9 3 1 9 5
2 7 0 1 0 1 4 8 4
y _ x
5 4 6 7 . 9 9 6 5 7
1 0 2 5 5 . 1 4 1 4
1 5 0 4 2 . 2 8 6 3
1 9 8 2 9 4 3 1 2
2 4 6 1 6 . 5 7 6
2 9 4 0 3 7 2 0 9
3 4 1 9 0 . 8 6 5 7
3 8 9 7 8 . 0 1 0 6
4 3 7 6 5 . 1 5 5 5
4 8 5 5 2 . 3 0 0 3
F i g u r e 2 - 1 3 . T h e e x a m p l e f r o m F i g u r e 6 w i t h w e i g h t i n g .
Figure 2-14. Weighting in chromatography often resulls in a more realistic prediction interval and amore realistic uncertainty of the result.
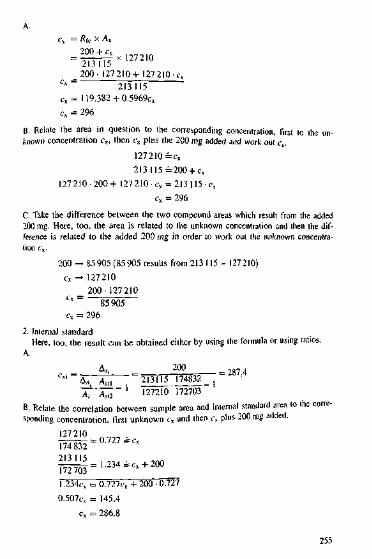
= Rfc x A%200 + cxx 127210213115200- 127210+ 127 210-cxCx ~ 213 115
cx = 119.382+ 0.5969cx
c, = 296B. Relate the area in question to the corresponding concentration, first to the un-known concentration cx, then cx plus the 200 mg added and work out cx.
127 210 =cs
213 115 =200 + cx
127210 200+ 127 210-cx = 213 115-c,cx = 296
C. Take the difference between the two compound areas which result from the added200 mg. Here, too, the area is related to the unknown concentration and then the dif-ference is related to the added 200 mg in order to work out the unknown concentra-tion cx.
200^ 85 905 (85 905 results from 213 115- 127 210)c, - 127210
_ 200- 127210'* ~ 85 905cx = 296
2. Internal standardHere, too, the result can be obtained either by using the formula or using ratios.
A.
c . - _ A L _ _ _ _ _ J 2 2 _ _ = 287,4"~&A. AM ~2131_15 174832 _,
~A~'A^~1 127210'172703B. Relate the correlation between sample area and internal standard area to the corre-sponding concentration, first unknown c, and then c\ plus 200 mg added.
127210
1.234c7 0.727fx + 200 • 07270.507c, = 145.4
cx = 286.8
255

23.5 Solutions to the examples of 2.3.1.4Preliminary remark
We all have our own approaches to figures and mathematical operations. This iswhy 1 will describe 2-3 alternative methods, so you can pick and choose. You mightfind small discrepancies in the results due to rounding errors.Example 1
Concentration
C=£.A, = Kfc.^ = -8OOO=16mgL-'
Absolute mass injected
m = c- VM = r • 20 uL = 320 ng1 uL
Example 2Required concentration - via the formula ...
Ah, Ax 4000 5200 ,Cs = C k O r a P ^ ' ^ = 8000 4200 = 4 9 5 m g L
... and with help of the "rule of three":8000 52004TO = 2and4200='-238
That means:2=8 mgL-1
1.238=cx
c, = i ^ » = 4.95mgL-Absolute mass injected
4 95 n°m = Cx Vmj = -T—£ = 10 uL = 49.5 ng
Example 31. External standard
The result can be obtained using the formula or simple ratios - in fact, the formulais nothing but a "rule of three" in disguise. You decide what you prefer.
254
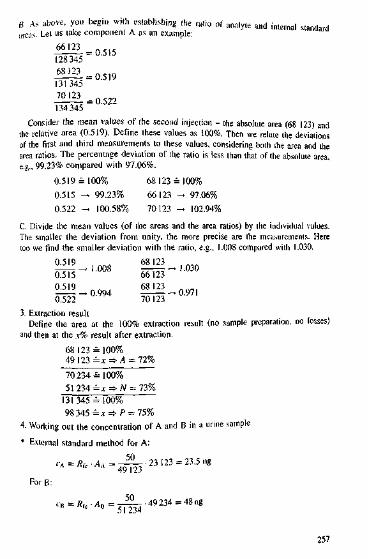
B. As above, you begin with establishing the ratio of analyte and internal standardareas. Let us take component A as an example: "airaara
^ 1 - 0 5 1 545"128345
Consider the mean values of the second injection - the absolute area (68 123) andthe relative area (0.519). Define these values as 100%. Then we relate the deviationsof the first and third measurements to these values, considering both the area and thearea ratios. The percentage deviation of the ratio is less than that of the absolute area,e.g., 99.23% compared with 97.06%.
0.519 = 100% 68123 = 100%0.515 -> 99.23% 66 123 -> 97.06%0.522 -» 100.58% 70123 -• 102.94%
C. Divide the mean values (of the areas and the area ratios) by the individual values.The smaller the deviation from unity, the more precise are the measurements. Heretoo we find the smaller deviation with the ratio, e.g., 1.008 compared with 1.030.
» S iS i -
3. Extraction resultDefine the area at the 100% extraction result (no sample preparation, no losses)
and then at the x% result after extraction.68 123 = 100%49 123 =x=* A = 72%70234 = 100%
131345 = 100%98 345 =*=>/> = 75%
4. Working out the concentration of A and B in a urine sample* External standard method for A:
ForB:50
257
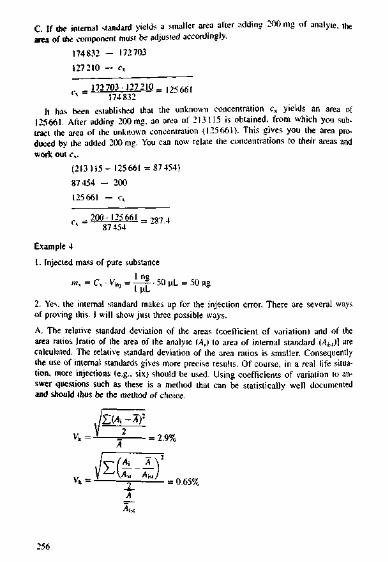
C. If the internal standard yields a smaller area after adding 200 nig of analyte, thearea of the component must be adjusted accordingly.
174 832 - 172703127 210 - c.
_ 172703- 127210 __
174832It has been established that the unknown concentration cx yields an area of125561. After adding 200 mg. an area of 213 115 is obtained, from which you sub-tract the area of the unknown concentration (125661). This gives you the area pro-duced by the added 200 mg. You can now relate the concentrations to their areas andwork out cv.
(213 115- 125661 =87 454)87454 — 200125661 — c,
= 200-125661 __^v ,87454 ' '
Example 41. Injected mass of pure substance
m, = C, • V'mj = -|-^ • 50 uL = 50 ng
2. Yes. the internal standard makes up for the injection error. There are several waysof proving this. I will show just three possible ways.A. The relative standard deviation of the areas (coefficient of variation) and of thearea ratios (ratio of the area of the analyte (A,) to area of internal standard Mi,,)] arecalculated. The relative standard deviation of the area ratios is smaller. Consequentlythe use of internal standards gives more precise results. Of course, in a real life situa-tion, more injections (e.g., six) should be used. Using coefficients of variation to an-swer questions such as these is a method that can be statistically well documentedand should thus be the method of choice.
Vt = J J. = 2.9%
256

For A:0.952 • 23.5 = 22.4
ForB:0.952 • 48 = 45.69
We recommend checking the suitability of a substance as an internal standard earlyon in the process of developing a method. For this purpose, the internal standard isconsidered as a reference and its coefficient of variation is worked out. Thus, thequality of an internal standard can be assessed at an early stage.Example 51 External standard method
Here, too, the areas are related to the corresponding unknown concentration cx and(c, + 100) after the addition of 100 ng.
773241 = 100 + cx662 328 =cs
773 241 • c, = 66 232 800 + 662 328 • cxcx = 597 ng
2. Internal standard methodThe areas are related to the corresponding amounts.
_ 3.11 • 100 + 3.11 -cxCx~ 186
3.86 cx = 3.11 Cx+3110.75 • cx = 311
cx = 415 ng200438 662 328
213277cx = 100 • 0.259 • 3.105 + cx • 0.259 • 3.105cx = 80.5 + Cx • 0.804cx = 413 ng
Another possibility would be to work with the differences as in Example 3, ver-sion C.
213277^ 200438662 328 -^cx
200438-662 328Cx~ 213 277
259
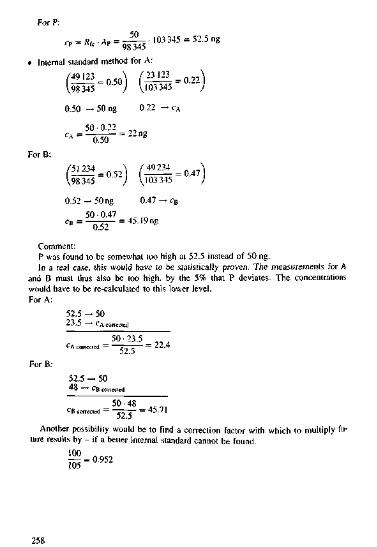
ForP:^ - 1 0 3 345 = 52.5 ng
Internal standard method for A:49 123 \ fi!123_ =98345 " a 5 7 V103 345
0.50 -• 50 ng 0.22 -> cA
50-0.22CA=^3<r = 22ng
ForB:5 1 ^ = 0 5^ (98 345 J V103 345
0.52-*50ng 0.47 -^ c50 • 0.47
0.52 - = 45.19ng
Comment:P was found to be somewhat too high at 52.5 instead of 50 ng.In a real case, this would have to be statistically proven. The measurements for A
and B must thus also be too high, by the 5% that P deviates. The concentrationswould have to be re-calculated to this lower level.For A:
ForB:
52.5Another possibility would be to find a correction factor with which to multiply fu-
ture results by - if a better internal standard cannot be found
52.523.5
CAcor
52.548-
fRrot
^50
^50•• CB con
rrectcd50-23.5
52.5
etted50-48
-22.4
45.71
258
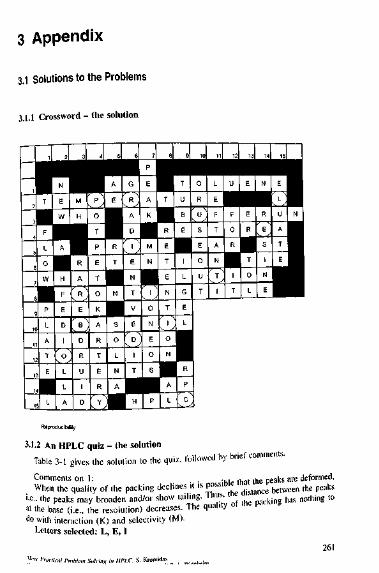
3 Appendix
3.1 Solutions to the Problems
3.1.1 Crossword - the solution
1J
i
12
J15
1•|T|FL0W|pLATE|L
2•NEW•AHFED1[ojLLA
3|M fHRAREBDRU1D
4IP J0TPET0KARTERY
|A•RT•N•s0LNAi
•GR 1ADENTVE °)1T•H
7Ip 1E 1AKMN•1")0NE0S•P
elIITRETENT0N•AL
g|TUBE•1LGELIRPLc
•0RUSE0uT
\
|LEFTANTI
12I•UF0R•1T
13EER•T0L
14•N•REjs1NE
15I• lE MI J^MU NA |T HE H
Reproducibilily3.1.2 An HPLC quiz - the solutionTable 3-1 gives the solution to the quiz, followed by brief comments.
*> with interaction (K) and selectivity (M).Letters selected: L, E, I 261rr l'rllt-,icat I'mblcfi in lll'iC. S. Kroniidiis
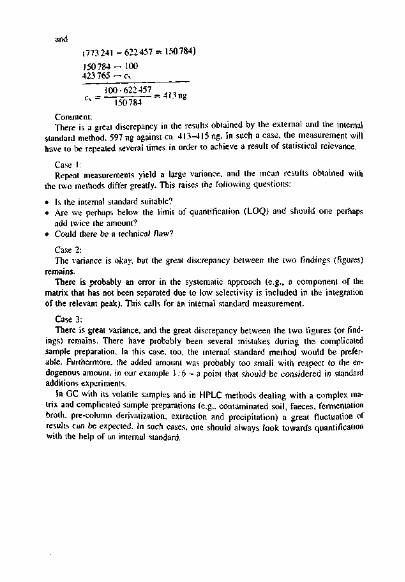
and1773241 -622457 = 150784)150784— 100423 765 ->c\
150784Comment:There is a areat discrepancy in the results obtained by the external and the internal
standard method, 597 ng against ca. 413-415 ng. In such a case, the measurement willhave to be repeated several times in order to achieve a result of statistical relevance.
Case 1:Repeat measurements yield a large variance, and the mean results obtained with
the two methods differ greatly. This raises the following questions:• Is the internal standard suitable?• Are we perhaps below the limit of quantification (LOQ) and should one perhaps
add twice the amount?• Could there be a technical flaw?
Case 2:The variance is okay, but the great discrepancy between the two findings (figures)
remains.There is probably an error in the systematic approach (e.g., a component of the
matrix that has not been separated due to low selectivity is included in the integrationof the relevant peak). This calls for an internal standard measurement.
Case 3:There is great variance, and the great discrepancy between the two figures (or find-
ings) remains. There have probably been several mistakes during the complicatedsample preparation. In this case, too, the internal standard method would be prefer-able. Furthermore, the added amount was probably too small with respect to the en-dogenous amount, in our example 1:6 — a point that should be considered in standardadditions experiments.
In GC with its volatile samples and in HPLC methods dealing with a complex ma-trix and complicated sample preparations (e.g.. contaminated soil, faeces, fermentationbroth, pre-column derivatization, extraction and precipitation) a great fluctuation ofresults can be expected. In such cases, one should always look towards quantificationwith the help of an internal standard.

Comments on 2:When the elution strength of an eluent increases through an increase in its organic
content, the peaks appear earlier (I), consequently they are higher (C) and narrower(E). The peak area is of course unaffected (S). As the polarity of the eluent decreases(higher ACN content), the polar silica gel is dissolved to a lesser extent, which pro-longs the lifetime of the column (Y).
Letters selected: C, E, I, YComments on 3:When the temperature increases the peaks become narrower, and the efficiency in-
creases (T). Selectivity usually deteriorates (B), which outweighs the advantage of theimproved efficiency, so in the end the resolution, in general, will be poorer (Z). Atthe higher temperature, the peaks appear earlier (W). Thus, the retention factor (k val-ue) as a measure of interaction decreases (P).
Letter selected: TComments on 4:When the flow increases, the peak area decreases (flowxarea = mass), which re-
mains constant (C), the plate number - and with it efficiency - decreases (van Deem-ter equation!) (H, J). As a consequence, resolution also deteriorates (F). Selectivity isindependent of the flow rate (0). It only depends on chemical parameters such as sta-lionary phase, mobile phase and temperature.
Letters selected: noneComments on 5:Endcapping provides additional removal of some residual silanol groups [note the
word some - it is impossible to make a surface absolutely non-polar (F)]. Bases areless retained, kinetics improve; so do peak shapes (S). Strong acids in their disso-ciated form do not hang around on a non-polar surface, so they elute early (Q). Non-polar substances do not have anything to do with the polar residual silanol groups(T). The short CH, groups used for endcapping are rapidly hydrolysed, i.e., acidiceluents make endcapped phases unstable (X).
Letter selected: SComments on 6:V is the correct answer. After all, this is the purpose of such columns. Since this
column is installed before the injector and thus not involved in the actual separation,particle size (A) and type of packing (K) hardly have any effect. The column oven(C) provides the constant temperature needed for consistent viscosity. There is usually"0 temperature control for the eluent before the injector - whether a saturation col-umn is used or not. Finally, such a column provides some flow resistance, which in-creases the pressure (I).
Letters selected: V, TThus all of these letters give L,E,I,C.E,I,Y,T,S,V,TPut in the right order, the solution is SELECTIVITY
263

Table 3-11. The packing has deteriorated
2. The proportion of acetonitrile in theeluent is increased
3. The temperature is increased(ordinary RP-system)
4. The flow rate is increased
5. Endcapped C,* phases
XX
X
KLEMI
The peaks appear laterThe peaks become broaderResolution declinesSelectivity declinesTailing appears
6. A conditioning or saturation column X(column between pump and injector)
S The peak area changes[ The retention time decreasesC The peak height changesE The plate number changesY The lifetime of the column increasesB Selectivity improves2 Resolution improves\V The retention time increasesT Efficiency improvesP The retention factor is increasedC The peak area increasesF Resolution improvesH The plate number increasesJ Efficiency improvesO Selectivity decreasesS ... provide better peak symmetry for
basesQ ... achieve a belter separation of strong
acidsT ... achieve a better separation of bases,
but they are unsuitable for non-polarsubstances
X ... are more stable in an acidic eluentthan non-endcapped CIH phases
F ... mean that the surface is absolutelynon-polar
V ... saturates the eluent with silica geland protects the analytical column
A ... must contain material with the sameparticle size as the separation column
T ... raises the pressureK ... must be filled with the same station-
ary phase as the separation columnC ... must also be thermostatically con-
trolled in order to ensure the constantviscosity
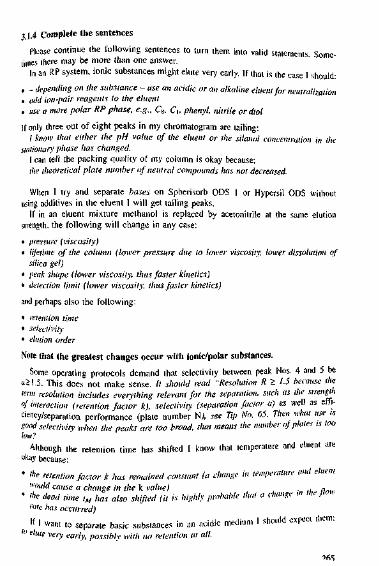
31.4 Complete the sentencesPlease continue the following sentences to turn them into valid statements Some-
times there may be more than one answer.In an RP system, ionic substances might elute very early. If that is the case I should:
. - depending on the substance - use an acidic or an alkaline eluent for neutralization• udd ion-pair reagents to the eluent• use a more polar RP phase, e.g.. C8, C,, phenyl, nitrite or dialIf only three out of eight peaks in my chromatogram are tailing:
; know that either the pH value of the eluent or the silanol concentration in thestationary phase has changed.
I can tell the packing quality of my column is okay because:the theoretical plate number of neutral compounds has not decreased.When I try and separate bases on Spherisorb ODS 1 or Hypersil ODS without
using additives in the eluent I will get tailing peaks.If in an eluent mixture methanol is replaced by acetonitrile at the same elution
strength, the following will change in any case:• pressure (viscosity)• lifetime of the column (lower pressure due to lower viscosity, lower dissolution of
silica gel)• peak shape (lower viscosity, thus faster kinetics)• detection limit (lower viscosity, thus faster kinetics)and perhaps also the following:• retention time• selectivity• elution orderNote that the greatest changes occur with ionic/polar substances.
Some operating protocols demand that selectivity between peak Nos. 4 and 5 bea>!.S. This does not make sense. // should read "Resolution R > 1.5 because theterm resolution includes everything relevant for the separation, such as the strength
• • -- -" —, effi-
vity when the pe<lo
Although the retention time has shifted I know that temperature and eluent are*ay because:• tlie retention factor k has remained constant (a change in temperature and eluent
would cause a change in the k value) . . „* ">e dead time tM has also shifted (i, is highly probable that a change tn the Jlon
r<ite has occurred)If I want to separate basic substances in an acidic medium I should expect them:
'" elute wry early, possibly with no retention at all.
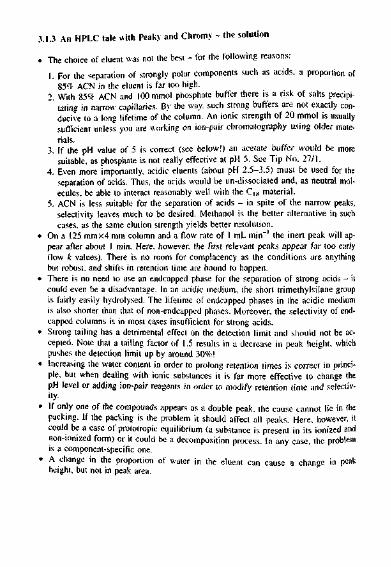
3.1 J An HPLC tale with Peaky and Chromy - the solution
. The choice of eluent was not the best - for the following reasons:1. For the separation of strongly polar components such as acids, a proportion of
857f ACN in the eluent is far too high.2. With 85% ACN and lOOmmol phosphate buffer there is a risk of salts precipi-
tatina in narrow capillaries. By the way. such strong buffers are not exactly con-ducive to a long lifetime of the column. An ionic strength of 20 mmol is usuallysufficient unless you are working on ion-pair chromatography using older mate-rials.
3. If the pH value of 5 is correct (see below!) an acetate buffer would be moresuitable, as phosphate is not really effective at pH 5. See Tip No. 27/1.
4. Even more importantly, acidic eluents (about pH 2.5-3.5) must be used for theseparation of acids. Thus, the acids would be un-dissociated and, as neutral mol-ecules, be able to interact reasonably well with the C|S material.
5. ACN is less suitable for the separation of acids - in spite of the narrow peaks,selectivity leaves much to be desired. Methanol is the better alternative in suchcases, as the same elution strength yields better resolution.
• On a 125 mmx4 mm column and a flow rate of 1 rnL mirf' the inert peak will ap-pear after about 1 min. Here, however, the first relevant peaks appear far too early(low k values). There is no room for complacency as the conditions are anythingbut robust, and shifts in retention time are bound to happen.
• There is no need to use an endcapped phase for the separation of strong acids - itcould even be a disadvantage. In an acidic medium, the short trimethylsilane groupis fairly easily hydrolysed. The lifetime of endcapped phases in the acidic mediumis also shorter than that of non-endcapped phases. Moreover, the selectivity of end-capped columns is in most cases insufficient for strong acids.
• Strong tailing has a detrimental effect on the detection limit and should not be ac-cepted. Note that a tailing factor of 1.5 results in a decrease in peak height, whichpushes the detection limit up by around 30%!
• Increasing the water content in order to prolong retention times is correct in princi-ple, but when dealing with ionic substances it is far more effective to change thepH level or adding ion-pair reagents in order to modify retention time and selectiv-ity.
• If only one of the compounds appears as a double peak, the cause cannot lie in thepacking. If the packing is the problem it should affect all peaks. Here, however, itcould be a case of prototropic equilibrium (a substance is present in its ionized andnon-ionized form) or it could be a decomposition process. In any case, the problemis a component-specific one.
• A change in the proportion of water in the eluenl can cause a change in peakheight, but not in peak area.
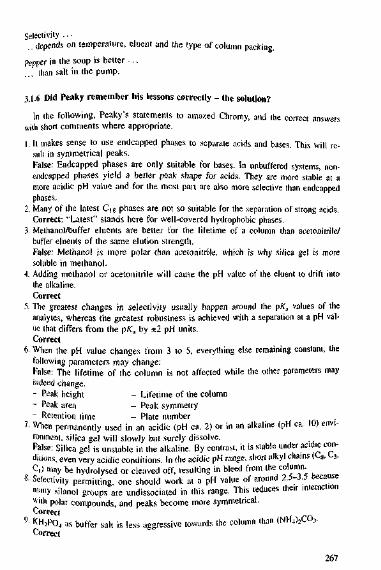
Selectivity ...depends on temperature, eluent and the type of column packing.
Pepper in the soup is better ...than salt in the pump.
3.1.6 Did Peaky remember his lessons correctly - the solution?In the following, Peaky's statements to amazed Chromy, and the correct answers
with short comments where appropriate.1. It makes sense to use endcapped phases to separate acids and bases. This will re-
sult in symmetrical peaks.False: Endcapped phases are only suitable for bases. In unbuffered systems, non-endcapped phases yield a better peak shape for acids. They are more stable at amore acidic pH value and for the most part are also more selective than endcappedphases.
2. Many of the latest C|8 phases are not so suitable for the separation of strong acids.Correct: "Latest" stands here for well-covered hydrophobic phases.
3. Methanol/buffer eluents are better for the lifetime of a column than acetonitrile/buffer eluents of the same elution strength.False: Methanol is more polar than acetonitrile, which is why silica gel is moresoluble in methanol.
4. Adding methanol or acetonitrile will cause the pH value of the eluent to drift intothe alkaline.Correct
5. The greatest changes in selectivity usually happen around the p£a values of theanalytes, whereas the greatest robustness is achieved with a separation at a pH val-ue that differs from the pKa by ±2 pH units.Correct
6. When the pH value changes from 3 to 5, everything else remaining constant, thefollowing parameters may change:False: The lifetime of the column is not affected while the other parameters mayindeed change.- Peak height - Lifetime of the column- Peak area - Peak symmetry- Retention time - Plate number
7- When permanently used in an acidic (pH ca. 2) or in an alkaline (pH ca. 10) envi-ronment, silica gel will slowly but surely dissolve.False: Silica gel is unstable in the alkaline. By contrast, it is stable under acidic con-ditions, even very acidic conditions. In the acidic pH range, short alkyl chains (Ls, <~i,Ci) may be hydrolysed or cleaved off, resulting in bleed from the column.
8- Selectivity permitting one should work at a pH value of around 2.5-3.5 becausemany silanol groups are undissociated in this range. This reduces their interaction*ith polar compounds, and peaks become more symmetrical.Correct
'• KH2PO4 as buffer salt is less aggressive towards the column than (NH4)2CO,.Correct
267
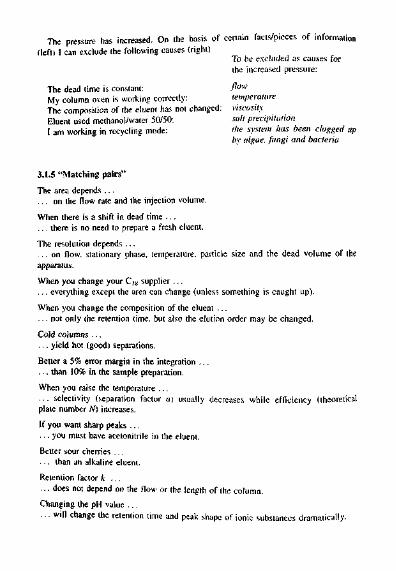
The pressure has increased. On the basis of certain facts/pieces of information(left) I can exclude the following causes (right)
To be excluded as causes forthe increased pressure:
The dead time is constant: flmv
My column oven is working correctly: temperatureTrie composition of the eluent has not changed: viscosityEluent used methanol/water 50/50: salt precipitationI am working in recycling mode: the system has been clogged up
bv algae, fungi and bacteria
3.1.5 "Matching pairs"The area depends ...... on the flow rate and the injection volume.When there is a shift in dead time ...... there is no need to prepare a fresh eluent.The resolution depends ...... on flow, stationary phase, temperature, particle size and the dead volume of theapparatus.When you change your Cjg supplier ...... everything except the area can change (unless something is caught up).When you change the composition of the eluent ...... not only the retention time, but also the elution order may be changed.Cold columns ...... yield hot (good) separations.Better a 5% error margin in the integration ...... than 10% in the sample preparation.When you raise the temperature ...... selectivity (separation factor o) usually decreases while efficiency (theoreticalplate number N) increases.If you want sharp peaks ...... you must have acetonitrile in the eluent.Better sour cherries ...... than an alkaline eluent.Retention factor k ...... does not depend on the flow or the length of the column.Changing the pH value ...... will change the retention time and peak shape of ionic substances dramatically.

3 2 From Theory to Practice - Empirical Formulae,Rules of Thumb and Simple Correlations in Everyday HPLC
In this section I have compiled some rules of thumb, simple formulae, etc., takenfrom theoretical chromatography and hydrodynamics. Some of them can even beworked out mentally and thus provide a rough estimate as to the basis of which deci-sions can be made.
Examples:• How high a pressure do I have to put up with if I want to reduce retention time by
a factor of two by increasing the flow rate? (Example 7)• What do I gain from a reduction in column length and particle size if I am happy
with the resolution I am achieving with my system as it is? (Example 3)• How much solvent do I save in real terms if I switch from my usual 4 mm to
3 mm columns? (Example 9)Each formula or rule of thumb is accompanied by an example with figures. Where
needed, a short comment is added. The first three rules of thumb were provided byJohn Dolan and Lloyd Snyder.
1. Dead time (breakthrough time, hold-up time, rM), see also Tip No. 65Empirical formula for estimating dead time if you cannot or are not allowedto add an inert compound to the sample, such as sodium nitrate,uracil or thiourea.
/M ~ 0.1 x — for 4.6 mm columns
rM ss 0.08 x — for 4.0 mm columns
f\i =dead time in minL = length column in cm/•" =flow in mL mirT1
Generally applicable formula independent of inner diameter:
IMKO.5X-X d1
dinner diameter of the column in mmExample:
At a flow rate of 1 mL min"1 with a 125x4 mm column we expect the dead timeto be around 1 min.
12.5'M ~ 0.08 x —— — 1 min
and with the help of the generally applicable formula:
'M ss 0.5 x —— x 0.42 = 1 min
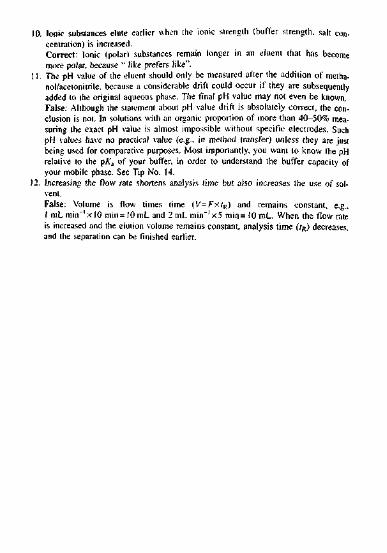
10. Ionic substances elute earlier when the ionic strength (buffer strength, salt con-centration) is increased.Correct: Ionic (polar) substances remain longer in an eluent that has becomemore polar, because " like prefers like".
11. The pH value of the eluent should only be measured after the addition of metha-nol/acetonitrile, because a considerable drift could occur if they are subsequentlyadded to the original aqueous phase. The final pH value may not even be known.False: Although the statement about pH value drift is absolutely correct, the con-clusion is not. In solutions with an organic proportion of more than 40-50% mea-suring the exact pH value is almost impossible without specific electrodes. SuchpH values have no practical value (e.g.. in method transfer) unless they are justbeing used for comparative purposes. Most importantly, you want to know the pHrelative to the pKa of your buffer, in order to understand the buffer capacity ofyour mobile phase. See Tip No. 14.
12. Increasing the flow rate shortens analysis time but also increases the use of sol-vent.False: Volume is flow times time (V=FxtR) and remains constant, e.g..I mL min"' x 10 min= 10 mL and 2 mL mirf' x5 min= 10 mL. When the flow rateis increased and the elution volume remains constant, analysis time (/R) decreases,and the separation can be finished earlier.
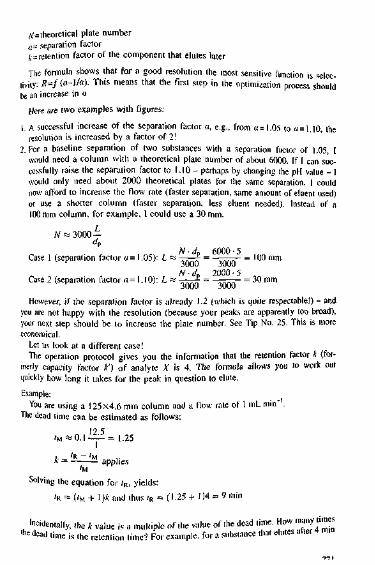
,V=theoretical plate numbera= separation factorjt = retention factor of the component that elutes laterThe formula shows that for a good resolution the most sensitive function is selec-,ity: R=f(a-\la). This means that the first step in the optimization process should
rt iimfjncp in fttivbe an increase in oHere are two examples with figures:I A successful increase of the separation factor a, e.g., from o = 1.05 to a=1.10, the
resolution is increased by a factor of 2!2. For a baseline separation of two substances with a separation factor of 1.05, I
would need a column with a theoretical plate number of about 6000. If I can suc-cessfully raise the separation factor to 1.10 - perhaps by changing the pH value - Iwould only need about 2000 theoretical plates for the same separation. I couldnow afford to increase the flow rate (faster separation, same amount of elucnt used)or use a shorter column (faster separation, less eluent needed). Instead of a100 mm column, for example, I could use a 30 mm.
N « 3000 —dp
Case 1 (separation factor a= 1.05): L « * = - = 100 mm3000 3000
Case 2 (separation factor a = 1.10): L «; ^ = = 30 mmHowever, if the separation factor is already 1.2 (which is quite respectable!) - and
you are not happy with the resolution (because your peaks are apparently too broad),your next step should be to increase the plate number. See Tip No. 25. This is moreeconomical.
Let us look at a different case!The operation protocol gives you the information that the retention factor k (for-
merly capacity factor k') of analyte X is 4. The formula allows you to work outquickly how long it takes for the peak in question to elute.Example:
You are using a 125x4.6 mm column and a flow rate of 1 mL mm" .The dead time can be estimated as follows:
»„-0.1 — -1.25
—— applies'M
Solving the equation for /R, yields:'R = (<M + 1)* and thus /R = (1.25 + 1)4 = 9 min
Incidentally, the k value is a multiple of the value of the dead time. How many times* dead time is the retention time? For example, for a substance that elutes alter
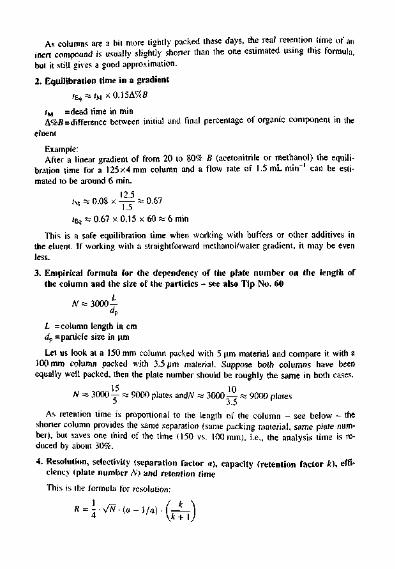
As columns are a bit more lightly packed these days, the real retention time of aninert compound is usually slightly shorter than the one estimated using this formula,but it still gives a good approximation.2. Equilibration time in a gradient
/M =dead time in minA%B = difference between initial and final percentage of organic component in the
eluentExample:After a linear gradient of from 20 to 80% B (acetonitrile or methanol) the equili-
bration time for a 125x4 mm column and a flow rate of 1.5 mL min" can be esti-mated to be around 6 min.
rM = 0.08 x ~ a, 0.67IE, » 0.67 x 0.15 x 60 SB 6 min
This is a safe equilibration time when working with buffers or other additives inthe eluent. If working with a straightforward methanol/water gradient, it may be evenless.3. Empirical formula for the dependency of the plate number on the length of
the column and the size of the particles - see also Tip No. 60
N « 3000 —df
L = column length in cmdp =particle size in urnLet us look at a 150 mm column packed with 5 um material and compare it with a
100 mm column packed with 3.5 um material. Suppose both columns have beenequally well packed, then the plate number should be roughly the same in both cases.
N K 3000 y a 9000 plates and/V =a 3000— ss 9000 plates
As retention time is proportional to the length of the column - see below - theshorter column provides the same separation (same packing material, same plate num-ber), but saves one third of the time (150 vs. 100 mm), i.e., the analysis time is re-duced by about 30%.4. Resolution, selectivity (separation factor a), capacity (retention factor k), effi-
ciency (plate number N) and retention timeThis is the formula for resolution:
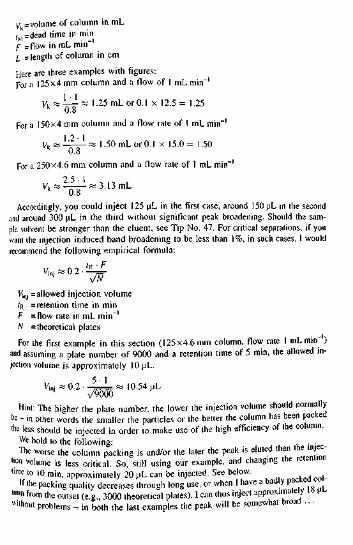
Vt=volume of column in mL(Nl = dead time in minf =flow inmLmin"I = length of column in cmHere are three examples with figures:por a 125x4 mm column and a flow of 1 mL min"1
Vt~l—lx 1.25 mL or 0.1 x 12.5 = 1.250.8
For a 150x4 mm column and a flow rate of 1 mL min"1
Kt» — K 1.50 mL or 0.1 x 15.0= 1.500.8For a 250x4.6 mm column and a flow rate of 1 mL min"
Accordingly, you could inject 125 uL in the first case, around 150 uL in the secondand around 300 uL in the third without significant peak broadening. Should the sam-ple solvent be stronger than the eluent, see Tip No. 47. For critical separations, if youwant the injection induced band broadening to be less than 1 %, in such cases, I wouldrecommend the following empirical formula:
V a0.2-'^-l
Vjnj = allowed injection volume1R =retention time in minF =flow rate in mL min"N = theoretical platesFor the first example in this section (125x4.6 mm column, flow rate 1 mLmin )
and assuming a plate number of 9000 and a retention time of 5 min, the allowed in-jection volume is approximately 10 uL.
,_.._ 10.54 uL/9000
Hint: The higher the plate number, the lower the injection volume should normallybe - in other words the smaller the particles or the better the column has been packed*e less should be injected in order to make use of the high efficiency of the column.
We hold to the following: , . .The worse the column packing is and/or the later the peak is eluted then the injec-
tion volume is less critical. So, still using our example, and changing the retentionlin«: to 10 min, approximately 20 uL can be injected. See below.
•f the packing quality decreases through long use, or when I have a badly packea co"mn from the outset (e.g., 3000 theoretical plates), I can thus inject approximately is jwithout problems - in both the last examples the peak will be somewhat broad ...

on a 125 x4 mm column at a flow rate of I mL min"1. the k value is 4. If at a flow rate of2 mL min"' the substance would also elute after 4 min. the k value would be 8.
iM in the first case:rM * O.O8x-! =1.25 retention time equals 4 times the dead time: 4x1=4
;M in the second case:
,M =* ()08x i = 0.5 retention time equals 8 times the dead time: 8x0.5=4
5. Rules of thumb regarding the correlation between retention time and pH value,solvent and temperature
pH valueThere is no general rule concerning the pH value. The shift in retention time depends
on the pKa value of the acid or base. In particular, with strongly ionic analytes, suddenchanges in retention time by about 20-40% are fairly common when the pH valuechanges by 0.1 pH unit. If the analyte occurs in its undissociated form at a given pH value(i.e., it behaves like a neutral component) there will be - if any - only minimal changes.Temperature
Rule of thumb: Al C -» 1-5% in the retention factorSolvent
Rule of thumb: A 107c B -> A retention factor by 2-3Example:
Suppose you are working with a 45/55 (v/v) acetonitrile/water eluent and find thatthe retention factor for a substance is k=3. A 47/53 mixture, which would differ byabout 5%. would yield a k value of 4.5 (assumed change of k value by a factor of1.5). This would mean that on a 125x4mm column at a flow rate of 1 mLmin~' theretention time would increase from 6 to 9 min.
Case 1: (R = (l + 1) 3 = 6 minCase 2: <K = (1+I) 4.5 = 9 minThis is the reason why a difference of only 1-2% of the eluent composition often
results in a shift of several minutes in retention time.8. How high can the injection volume be without resulting in unacceptable peak
broadening?Assuming that the sample has been dissolved in the eluent or a solvent with similar
elution strength, the following rule of thumb applies:The injection volume should not be higher than 10% of the column volume. In this case,
the contribution from the injection to the total band broadening is approximately 10%.The volume of the column can be calculated approximately as follows:
Or even more simply for 4 mm columns: Vk x 0.1 L

plate number is linearly proportional to the length, and resolution is proportional tothe root of the plate number).
2. You are working with a 250 mm column, packed with 10 pm material, the flowrale is 1 mL min"' and the pressure is 80 bar. In order to save time you want touse a 125 mm column filled with 5 um material. What will the pressure be in thenew column? It will be 160 bar. If you had only halved the particle size the pres-sure would have gone up by a factor of 4 to 320 bar, but since you ulso halved thelength of the column, the pressure decreases again by a factor of 2. The result is160 bar.
3. A 100x4 mm column, packed with 10 urn, produces a pressure of 20 bar. Whatwould the pressure be in a column of the same length but an inner diameter of2 mm, filled with 5 um material? 320 bar, because the reduced inner diameter in-creases the pressure by a factor of 4 and because of the particle size, the pressuregoes up by another factor of 4.Thus, the pressure is increased by a factor of 16.
8. Resolution, gradient duration and flow, see also Tip No. 63A fictional case:The development lab sends you a gradient method (linear gradient from 0 to 100%
methano!) that has been developed on the hoof, so many things can still be changed.As usual, the specifications require a resolution R > 1.5, and the flow rate should be2mLmirf'. The gradient duration is given as 15 min. During the analytical processyou notice that at this flow rate, the pump keeps stopping because its upper pressurelimit is reached. Thus, the flow must be reduced to 1.5 mL min"1.• What gradient duration is required in order to achieve the specified resolution?
It should be 20 min because then the gradient volume would remain constant at30 mL, and the resolution, in turn, depends on the gradient volume.
Vgra(i = F x t = 2 mL min"1 X 15 min = 30 mLand 1.5 mL x 20 min = 30 mL
• You notice that the last peaks elute even at 80% methanol. By how much can thegradient duration be reduced in order to save analysis time?The gradient duration can of course be worked out using the formula in Tip No.
M, but using a rule of three is easier still:20 min -
20 min • 80%B
• The resolution achieved with a 250 mm column is far too good. It makes sense tochange over to a 150 mm column. How long should the gradient run?Again, the rule of three makes the answer easy:
20 min -> 250 mmJrmin -» 150
20-150' 12

3000In conclusion, another empirical formula, to assist in directly estimating the al-
lowed injection volume:"The injection volume should be approximately 15% of the peak volume . Peak
volume is the volume of the peak (to be more exact, for each measured component ofthe sample) found or resolved. The peak volume is simply the peak width at the peakbase in minutes multiplied by the flow rate in mL min .
So. with an allowed flow rate of 1 mL min~' for a fast, relatively narrow peak witha peak width of 0.2 min. injection volume 30 uL and for a late eluting peak with apeak width of 1 min the injection volume of I50UL should not in any case be ex-ceeded.
y _ F x , _ i x o.2 = 0.2 mL 200 u.L from which 15% = 30 uLV = Fxi=lxl = lmL = 1000 uL from which 15% = 150 |iL
7. Correlations between retention time, pressure, length, flow, particle size andinner diameter of the columnThe following relations apply:
tK,P=f{LF)
~ = constant
rR =/'(!)7\ pH, %B, IIn words this means:Retention time and pressure are linearly proportional to length and flow.Pressure has an inverse-quadratic relationship to particle size and inner diameter.The ratio of retention lime to peak width is constant for a particular compound un-
der conditions that are not varied.Finally, retention time depends on temperature and eluent composition, and for po-
lar/ionic substances also on the pH value and the ionic strength.The last relationships mentioned do not follow any unique mathematical function,
but are generally exponential and also depend on the analytes and specific separationconditions. This is why it is difficult to make precise predictions as to what is goingto happen in the optimizing process and why occasionally substances that differ inchemical character may elute in reverse order.
Three examples:1. Increasing the length of a column from 125 to 250 mm results in a doubling of the
retention lime and pressure while the separation is improved by a factor of 1.4 (the
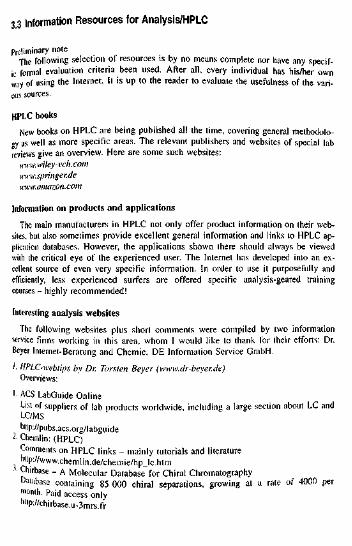
3 3 Information Resources for Analysis/HPLC
preliminary noteThe following selection of resources is by no means complete nor have any specif-
ic formal evaluation criteria been used. After all, every individual has his/her ownway of using the Internet. It is up to the reader to evaluate the usefulness of the vari-ous sources.
HPLC booksNew books on HPLC are being published all the time, covering general methodolo-
gy as well as more specific areas. The relevant publishers and websites of special labreviews give an overview. Here are some such websites:
www.wiley-vch.comwww.springer.dewww.amazon.com
Information on products and applicationsThe main manufacturers in HPLC not only offer product information on their web-
sites, but also sometimes provide excellent general information and links to HPLC ap-plication databases. However, the applications shown there should always be viewedwith the critical eye of the experienced user. The Internet has developed into an ex-cellent source of even very specific information. In order to use it purposefully andefficiently, less experienced surfers are offered specific analysis-geared trainingcourses - highly recommended!
Interesting analysis websitesThe following websites plus short comments were compiled by two information
service firms working in this area, whom I would like to thank for their efforts: Dr.Beyer Internet-Beratung and Chemie. DE Information Service GmbH.'• HPLC-webtips by Dr. Torsten Beyer (www.dr-beyer.de)
Overviews:1 ACS LabGuide Online
List of suppliers of lab products worldwide, including a large section about LC andLC/MShttp://pubs.acs.org/labguide1 Chemlin: (HPLC)Comments on HPLC links - mainly tutorials and literaturehttp://www.chemlin.de/chemie/hpjc.htm
•• Chirbase - A Molecular Database for Chiral ChromatographyDatabase containing 85 000 chiral separations, growing at a rate of 4000 permonth. Paid access onlyhUp://chirbase.u-3mrs.fr
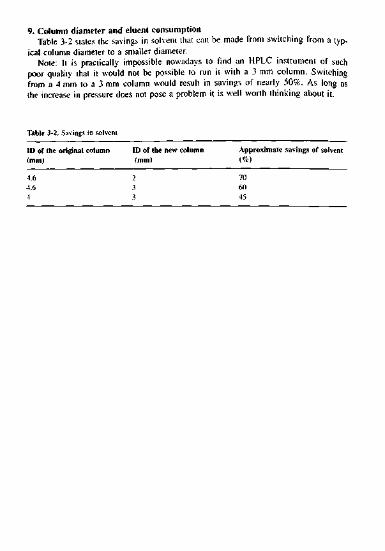
9. Column diameter and eluent consumptionTable 3-2 states the savings in solvent that can be made from switching from a typ-
ical column diameter to a smaller diameter.Note: It is practically impossible- nowadays to find an HPLC instrument of such
poor quality that it would not be possible to run it with a 3 mm column. Switchingfrom a 4 mm to a 3 mm column would result in savings of nearly 50%. As lon° asthe increase in pressure does not pose a problem it is well worth thinking about it.
Table 3-2. Savings in solventID or the original column ID of the new column Approximate savings of solvent(mm) inun) WTt ' 2 ™4.6 3 «'4 3 45

the type of detector, the mobile and stationary phase. A graph and a description ofthe analytical conditions are available.
http://www.quimifarma.net/crom/Chemconnect - Journals and Magazines [E]Over 600 hyperlinks to chemistry journals around the world, with alphabetical in-
dex.http://www.chemconnect.com/library/journals/index.html or alternativelyhttp://www.chemconnect.com/about.html... and finally:A motely collection of websites relevant to analysis/HPLC I can recommend:The first two websites can be searched entering up to three items in the first case,
even more in the second.www.interscience.wiley.com/cgi-bin/advancedsearchewww.link.springer.de/searche.htmwww.ingenta.comLinking up various libraries and publishers worldwidewww.sciencedirect.comGives access to several reviews on chromatographywww.scirus.comScience search engine run by Elsevier Publisherswww.logP.comlog/" values calculated according to substance structureesc.syrres.comSearch for various substance data and other information using a range of criteriawww.chemistry.deLook under databases to access a variety of databases in the field of chemistrywww.chromatographyonline.comArticles from the journal "LC-GC" North Americawww.chemistry.about.comInformed links and also news on analysiswww.cheniweb.com/analyticalLois ot interesting information on analysiswww.solventcentral.comPhysical and chemical data on solventswww.saphirwerk.comCheap sapphire pistons for HPLC pumpswww.zirchrom.com•"Formation on buffers, dissociation constants, etc.
4. HPLC web .Web portal featuring •'Links". "News". "Education . "Literature ."Events". "HPLC Columns" and "Equipment"http://www.hplcweb.com
5. LC-GC EuropeHomepage of "LC-GC Magazine" featuring specialist articles, reviews of newproducts'and applications, troubleshooting, literature, useful links and a manufac-turers' directoryhttp://www.lcgceurope.com
6. Sciquest - Chromatography ColumnReSourceProduct database containing information on 90 000 columns manufactured by 90manufacturers worldwide. Paid access onlyhttp://www.sciquest.com/columnshopper
7. separationsNOWPortal with suppliers' list. news, book tips, diary of events, forum, job offers, com-mented link lists and a newsletter dealing with HPLC, GC, electrophoresis andcoupling technologyhttp://www.separationsnow.com
8. www.chemie-datenbanken.deOverview of a range of general chemistry databases
Discussion forums1. chrom-L - The chromatography email discussion list
http://groups.yahoo.com/group/chrom-l2. Discussing.Info
http://www.discussing.info3. Newsgruppe sci.chem.analytical
htip://groups.google.com/groups?oi=djq&as_ugroup=sci.chem.analytical4. LC Resources Chromatography Discussion Group
http://chromforum.com2. Websites for analysts, compiled by Stephan Knecht (www.chemie.de)
Chromatography Forum [E]The most extensive discussion forum on gas and liquid chromatography to be
found on the Web. Moderators review forum contributions prior to publication in or-der to maintain the high quality standards of the forum. http://www.chromatography-forum.com (see above)
LC/GC-Magazine [E]LC/GC-Magazine offers a good starting point for chromatography users, giving not
only the latest news but also reviews of the latest products and software. A chroma-tography shopping guide helps find manufacturers and products.
http://www.lcgcmag.comChromatography Database [E]Access to a wide range of HPLC chromatograms. The database can be searched by
entering up to three chemical compounds. You can also focus your search by entering
3.4 Analytical Chemistry Today
This section gives an - admittedly subjective - description of general currenttrends and their effects in analytical chemistry, underpinned by examples. Section 3.5will focus on HPLC trends in particular. I do not intend to make a moral judgment -after all, we are all part of an ongoing process and may be perpetrators one day andvictims the next. I am simply trying to establish facts and document my observations- hoping that lessons can be learned as far as our own responsibility is concerned.
The situation in the laboratoryWe live in the age of globalization and turbo-capitalism. These terms may not be par-
ticularly beautiful, but they do describe the global economic situation accurately and ob-jectively. Although there has been some resistance here and there, these are large-scalephenomena that have been shaping our patterns of thought, action and behaviourthroughout, especially in business life. Let us restrict ourselves to the effects they havehad on the chemical and pharmaceutical industry and on analytical labs in particular!First problem - lime
The focus on verifiable short-term economic success leads to ever-shorter productlife cycles, with the inescapable result of ever increasing time pressure. This obstnictssensible, well thought-out courses of action.
Here are some examples:• Well-established mature techniques - e.g., miniaturization - that could help cut costs
and save time are not being used because there is no time to come to grips with them.• There is no time - or to put it more bluntly, because we or the person in charge
sets the wrong priorities - we do not take the time to think our projects through. Itis a matter of ticking boxes rather than dealing with the matter at hand. Thus, amethod is rashly adopted or a transfer plan "read through" - i.e., skimmed through.In both cases, one critical glance would have been enough to recognize that themethod would not work in the real world of lab routine.
• We have become used to being in a constant rush and acting like headless chick-ens, which is easy to do in an environment that behaves in the same way. We havebeen tacitly accepting that the predominant objective "maximizing profits in theshortest possible time" does not only lead politicians astray. In other words, thebenchmarks of decency and self-respect are being constantly lowered. Here aretwo examples, taken from everyday life:- A new column that can separate a wider range of degradation products due to
its better selectivity is removed from the instrument and replaced by a columnfrom the seventies. This last-century technology column does fulfil the formalrequirements of providing a peak - albeit just one. Who has the time to fill outa document control form anyway?
- The dead volume used in the formula is just a figure that will tit in nicely withthe k value stipulated in the SOP.
Anybody who questions such procedures will at best be greeted with indifference,impatience or condescension. Often, even the neutral act of questioning is seen as

www.bi.umist.ac.uk/users/mjfrbn/Buffers/makebuf.aspAutomatic calculations for the preparation of bufferswww.mac-mod.comAdvice on choosing columnswww.forumsci.co.il/HPLC/Troubleshooting_Guide_Q_A.pdfGood discussion of various points regarding troubleshooting. Reference kindly pro-
vided by Mrs Renate FitzRoy, St Andrews, UK.www.acdlabs.com/columnselectorPossibility of finding similar columnsI would like to bring this compilation to a close on a reflective note.
1. Since we are living in an information society, it may be worth keeping the follow-ing aphorism in mind:"Acquiring information is cheap, disposing of it can cost you a fortune!"I think we should try and become more efficient.
2. Another statement seems also to capture the Zeitgeist or spirit of the times:"We are drowning in information without ever quenching our thirst for knowledge"The art is to turn information into knowledge by processing it. This is where thepersonal environment can have a catalytic effect, and using it efficiently meansgood communication. This will not only improve interpersonal relations in a com-pany, but there are also very pragmatic reasons to put real communication at thetop of your personal as well as your company's priority list, for your long-term aswell as your short-term goals.
Here are some examples:Since nobody has been prepared to take any risks, hundreds of millions or even bil-lions of hours have been wasted in quality assurance labs over the past 20-25 yearsbecause a flow rate of 1 mL min~' and/or 250 mm columns have been used in as-say analysis. Why not be slightly more adventurous and set the flow rate at1 5 mL min"' or even - perish the thought - at 2 mL min~'? I can understand thatI mL min"1 is used in ancient methods, but even recently developed methods oftenstipulate the same old flow rate, and an analysis time of 12-15 min is still deemedacceptable for just 3-4 peaks.
• We may talk to one another, but we do not communicate efficiently, as the follow-ing example shows.You drive 400 km to take part in a seminar, and when you arrive you find to yoursurprise that two of your colleagues made the same journey in their individual cars.All seminar bookings were made by the same secretary. I have seen it happen morethan once, and not only in big companies ...
It is the exception rather than the rule that there is effective communication be-tween the developer and the routine user of a method in the initial stages of a project.We all know the consequences. Let me give you the following example!
A development department has developed and validated a low-pressure gradientmethod. The control lab only possesses a new high-pressure gradient instrument. Itgoes without saying that the retention times differ, but since the method has alreadybeen validated, nothing can be changed.
It was therefore decided that the same low-pressure gradient instrument the devel-opment department had been using should be bought costing 55000 €. Under the giv-en circumstances, this seemed to be the cheapest and least risky policy. Although Iunderstood the reasons behind the decision, I asked if it would not have been possiblelo contact the colleagues in the development department beforehand. The answer wasjust what I expected - a wry smile.
• The exact amount of an active ingredient has to be given right down to the seconddecimal point, and great care is taken that the coefficient of variation is not 1.6%but 1.5%, as required, but the leaflet that comes with the medication reads: "Adultsshould take 2 to 4 tablets daily, depending on their body weight". Well, analysis isone thing, marketing the product quite another ...By switching the raw material supplier, the purchasing department has made a sav-ing of 20000 €. This was in line with the target savings set at 10% by the manage-ment board. While the purchasing department thus managed to reach its target, theloss caused by rejects went up by 200000 €, due to insufficient purity of the rawmaterial.n scnsitive, GMP conforming workspace it is on the one hand quite clear that allthe employees and visitors must pass through air locks. Lab coats will of course bei lsintccted etc. Also, possibly or definitely contaminated samples or other materialswill only be handled with disposable gloves. On the other hand, employees fromexternal cleaning companies are in practice rarely required to follow any shict dis-posal procedures for these areas. Contaminated waste is removed "as is", and waste"is and other containers are handled without precautions. And the untrained eye
an act of insubordination. After a few frustrated attempts, most people give up.However, yesterday's best practice need not be right for today, and an attitude of-constructive discontent" would be the real key to success.
• Furthermore, time pressure leads to a dangerous emphasis on formal criteria andcreates a mindset that focuses on superficial, easily obtainable evidence. Lookingfor quality assurance criteria rather than true quality is much easier under the cur-rent stressful conditions. It is always easier to prove a trivial point than to stand upfor innovation in the face of tradition. What are the consequences?The spirit of our time manifests itself in the collection of what is known as hardfacts - signatures, figures, water-tight contracts, standard deviations and correlationcoefficients. While focusing all our thoughts, time and energy on them, we hardlyhave any resources left for the "soft facts", such as strategic orientation, intuition,creativity, sensitivity and courage. These are the real keys to success, and to devel-op them, ever)' person only has a limited supply of time, energy, etc.Wealth is created not by being economical but by promoting good ideas.What gives somebody the edge over a competitor is not a low standard deviation,but integrated interdisciplinary thinking, and these indispensable prerequisites ofsuccess are now in decline. They have become suspect or even the butt of a jokein the eyes of our modern busybodies. What was meant to be the - albeit important- framework to secure the future has become its objective, the be-all and end-all.Our efforts will go no further than our targets - the contract has been sorted out,the correlation coefficient is 0.999, the expert who will sort out things has beenhired, the programme - whatever its content - has been agreed upon, a method hasbeen submitted, etc.Let us summarize: Life is much easier for those who can produce visible results,such as measurements, statistics or diagrams than for those setting aside time forreflection and improvement - things that cannot always be measured and - Itorri-bile dictit - may come to nothing. What a disaster in an environment where erroris synonymous with weakness! Curing symptoms rather than the underlying diseaseis topical, cheap and does not pose any risks. Two examples will illustrate the pointbefore we proceed to the next topic.During an audit, it is easier to check whether the refrigerator has been adapted tospecifications than to investigate how the variance of a method relates to the spe-cification criteria.In order to make an existing method faster, more robust and cheaper, if you arelucky, all you need to do is write up a document control report and perhaps revali-date, but if you are unlucky, you have to fight invisible internal and external ene-mies. Since you have neither the time nor the nerve to persist and your co-workershave enough samples to work through as it is, you will not bother. If you are inter-ested in some proof of your success in order to be promoted, spending your timeon increasing the number of samples or with laboratory co-workers is a far moresuccessful strategy.
Second problem - time and short-term ROI (return on investment)Lack of time, apathy and ROI-oriented short-termism must lead to a situation
where networked thinking and action is replaced by individual isolationism and com-partmentalized thinking.
282

3.5 Trends in HPLC
The hardware
Pumps, injectors and detectors
In a technology that has matured over the years, you do not expect quantum leapsto be made in developments with the equipment. What we see in the latest HPLCmodules is young, fresh and compact designs and often some small but interestingimprovements. Examples are the long UV cells with considerably increased sensitivity- by a factor of up to 5 - or intelligent injectors that only begin to inject once thepreset injection volume has been verified. While the hardware has become more ro-bust and thus more service-friendly, there is now far less the user can do to correct aproblem unless a defective unit can be exchanged as a whole.
Columns
1. Column chemistry"New RP Columns Suitable for Pharmaceutical Analysis" may sound like a quotation
from a catalogue dating from the early eighties, the gold rush period in phase technol-ogy. Let me tell you that ever since the days of Tswett there has not been a single sym-posium on chromatography that did not see the introduction of a host of new materials.This may come as a surprise, but somehow, in spite of the huge development costs, itseems that there is still money to be made - or is there? We shall see. The trend ofthe nineties is continuing - and while still churning out the odd classical hydrophobicRP phases, most manufacturers seem to focus on very specific, mostly polar phaseson the one hand, and phases that provide good selectivity for both polar and nonpolaranalytes on the other. These hybrids are a compromise between two extremes - "RP"phases of a polar character that resemble silica gel and hydrophobic RP phases that re-semble a purely polymer matrix. Let us take a closer look:
• MonolithsMonoliths have finally been established as a valid alternative to the classic parti-
cles. They will become increasingly important in analytical LC as well as in capillaryLC, but also in preparative or even process LC. As monoliths on silica gel bases havealready been patented, firms are now developing organic monoliths, which - just likethe classical columns - will not be of any risk to the position of silica gel. Hybridmaterial has also been widely accepted now, because separations in the alkaline re-main an attractive subject.• Embedded phases and others
New embedded phases are being developed that vary in polarity, depending on theembedded group, ranging from carbamate, urea and amide to ether, ethane and anion-pairing group. The last renders classical ion-pair chromatography superfluous. Lessprominent, but still widely discussed are hydrophilic endcapped phases. The objective of'he manufacturers can be put in a nutshell: "We would like to provide you with the goodselectivity of the polar materials of the seventies and early eighties using 'cleaned silicagel, better batch-to-batch reproducibility and higher stability in routine analysis".
cannol tell (he difference between flour and any other white powders "But whathave we got to do with this? And which of us is responsible?"
• A validation process is rushed through in two weeks using standards because thesubmission deadline cannot be changed. Any analyst will know that validating amethod under real life conditions at such short notice is not serious science. Thecosts caused by reclamation, repeat measurements, putative or de facto SOS situa-tions are spiralling up. weighing heavily on the controller's budget who will have alot of explaining to do. etc. ... However, since this is not a book about cost analy-sis. I only want to point out that these are not production costs but avoidable errorcosts that do not appear on the balance sheet. What does not appear in the bookseither is a figure that accounts for frustration, loss of motivation, etc. of staff. Un-used human resources are the dead capital of every firm and can amount to manytimes the value of storage, current assets, etc. which are the subject of so manyboard meetings and strategic planning sessions. This shows again just how flaweddecisions taken in companies and elsewhere often are. It seems different when welet the people develop their opportunities - when not from conviction, at a mini-mum on the basis of ethical capitalism: only those who build upon self responsibil-ity have long term success.
More examples could be easily added to the list, but I think I have made my point.From our own experience, we all know how easy it is to get stuck in a rut, but the
situation is currently exacerbated by a mindset that makes it difficult even to usewell-established and recognized methods effectively. If the situation persists, companysuccess could be in jeopardy. I am convinced that if a company could change its pol-icy in any of the cases mentioned and adopt a longer-term perspective, considerablesums could be saved or gained, not to mention the improvement in staff morale. Letme just mention one point. A leader of a team or company unit who has establishedreasonably good long-term communication within his or her group will be rewardedin commercial as well as staff-motivational terms. I am not talking about high-handeddecisions to send team members to conflict-handling and communication workshops,but of genuine communication between team leaders and colleagues as part of theirdaily life.
Pessimists (realists?) may find some consolation in the idea that the problems dis-cussed affect us all. and people have always wanted to be seen to be doing something- however ineffective, as the following quotation suggests:
"We trained hard ... but it seemed that every time we were beginning to form upinto teams we would be reorganised. I was to learn later in life that we tend to meetany new situation by reorganising: and a wonderful method it can be for creating theillusion of progress while producing confusion, inefficiency, and demoralisation".
This very topical comment was written by Petronius Arbiter around 65 A.D. It justdemonstrates how little has changed over the last couple of thousand years. Howmuch of a comfort this really is remains a matter of opinion
Examples of couplings that could become more important in the future:. LC-NMR and LC-NMR/MS. CE and CLC-NMR• Two-dimensional nano-LC-MALDI-MS-micro fraction collector• Multidimensional on-line sample preparation ("clean up") - LC-MS• Multidimensional chromatography plus spectroscopy, e.g., strong cation exchanger
> nano-LC (capillary with RP packing) > MS-MSFrom today's perspective we can come to the following conclusions about current andfuture developments in HPLC:• Silica gel as the matrix and RP as the mode will remain the number I in HPLC.• In everyday lab practice, the most widely used particle size will be between 3 and
4 um, while 2 u.m material will remain an interesting niche product.• Monoliths will become more widely available and cheaper, and they will offer a
wider range of functionalities. The applications range from capillary LC and IXon a chip to preparative chromatography (e.g., 200 g protein; flow 2 Lmirf'; col-umn volume 8 L).
• Molecular imprints will increasingly replace the classical affinity media.• Proteomics, metabolomics, diagnosis, etc., make CLC and nano-LC attractive op-
tions that will be developed further.• LC-MS coupling will expand into more areas, and LC-NMR will be invaluable
where new compounds or impurities are investigated.• Multidimensional chromatography - perhaps with subsequent spectroscopy - is be-
coming increasingly important in sample preparation as well as in separation.• Columns gain in stability and versatility while batch-to-batch reproducibility is im-
proving, even for polar phases.
The softwareLet us take a closer look at the software, specifically the part that is involved in in-
tegration, peak identification and data analysis. Apart from the column, this is whatthe user has to deal with most in a daily routine.
Originally an improvement on the humble electric typewriter, the PC has mutatedinto a jack-of-all-trades in the office. A similar development - albeit on a more mod-est scale - has taken place in chromatography data handling programs. More andmore functions have been added to the classical process of chromatography (peakarea and height, percentage area, asymmetry factors, plate numbers, etc.). Here is alist:• Supervision and control of other equipment including GC• All but complete validation• Unrestricted functions for importing/exporting pre-treated or raw data, easy com-
munication with a range of other programs• QA-requirements met (GLP, CFR Part 11 etc.)• Hierarchical structure of user levels, such as administrator, supervisor, user
Furthermore, the manufacturers are trying to make their products more attractiveby introducing further add-ons.
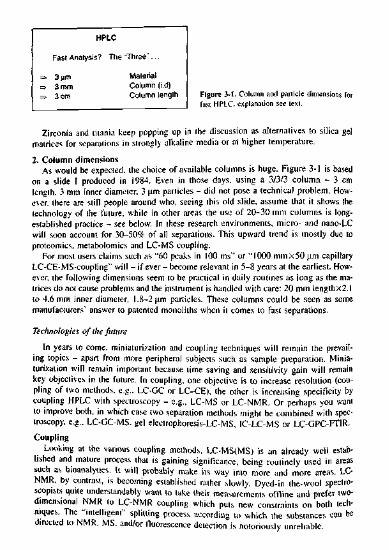
HPLC
Fast Analysis'
=> 3fim=> 3 mm=* 3 cm
The "Three"...MaterialColumn (i.d)Column length Figure 3-1. Column and particle dimensions for
fast HPLC. explanation see text.
Zirconia and titania keep popping up in the discussion as alternatives to silica gelmatrices for separations in strongly alkaline media or at higher temperature.2. Column dimensions
As would be expected, the choice of available columns is huge. Figure 3-1 is basedon a slide I produced in 1984. Even in those days, using a 3/3/3 column - 3 cmlength. 3 mm inner diameter, 3 u.m particles - did not pose a technical problem. How-ever, there are still people around who, seeing this old slide, assume that it shows thetechnology of the future, while in other areas the use of 20-30 mm columns is long-established practice - see below. In these research environments, micro- and nano-LCwill soon account for 30-50% of all separations. This upward trend is mostly due toproteomics. metabolomics and LC-MS coupling.
For most users claims such as "60 peaks in 100 ms" or "1000 mmx50 urn capillaryLC-CE-MS-coupling" will - if ever - become relevant in 5-8 years at the earliest. How-ever, the following dimensions seem to be practical in daily routines as long as the ma-trices do not cause problems and the instrument is handled with care: 20 mm Iengthx2.1to 4.6 mm inner diameter, 1.8-2 urn particles. These columns could be seen as somemanufacturers' answer to patented monoliths when it comes to fast separations.
Technologies of the futureIn years to come, miniaturization and coupling techniques will remain the prevail-
ing topics - apart from more peripheral subjects such as sample preparation. Minia-turization will remain important because time saving and sensitivity gain will remainkey objectives in the future. In coupling, one objective is to increase resolution (cou-pling of two methods, e.g.. LC-GC or LC-CE), the other is increasing specificity bycoupling HPLC with spectroscopy - e.g., LC-MS or LC-NMR. Or perhaps you wantto improve both, in which case two separation methods might be combined with spec-troscopy, e.g.. LC-GC-MS. gel electrophoresis-LC-MS, IC-LC-MS or LC-GPC-FTIR.Coupling
Looking at the various coupling methods, LC-MS(MS) is an already well estab-lished and mature process that is gaining significance, being routinely used in areassuch as bioanalytics. It will probably make its way into more and more areas. LC-NMR. by contrast, is becoming established rather slowly. Dyed-in the-wool spectro-scopists quite understandably want to take their measurements offline and prefer two-dimensional NMR to LC-NMR coupling which puts new constraints on both tech-niques. The •'intelligent" splitting process according to which the substances can bedirected to NMR. MS. and/or fluorescence detection is notoriously unreliable.
tion graphs, etc., be integrated into mainstream word processing and statistics pro-grams?
• What do 1 make of the frequent updates of the program? Are they a sign of hyper-activity or real innovation on the manufacturer's side?
• Has the software validation been carried out in a practice-relevant way?
TrendsFinally, I would like to draw your attention to 2-3 developments that I personally
find remarkable and may give some idea of what the future holds.1. The opportunities the Internet offers are more widely and more purposefully used.
Examples:• An increasing number of firms offer web-based control software.• Intelligent filters help you find colleagues that are dealing with just the same sepa-
ration problems you are trying to solve.• Freshly generated MS spectra can be compared with spectra from spectral libraries
within seconds.2. Straightforward, well thought out solutions protect the environment and enhance
flexibility, as the following examples show:• "Environment-responsive chromatography" - a functional group at the surface of a
stationary phase shows hydrophobic properties at elevated temperature, whereas thesame ligand is hydrophilic at lower temperature. Thus, the selectivity can be con-trolled just via the temperature.
• There are several functional groups incorporated in the stationary phase, whichmeans that the same column can be used in NP as well as in RP mode, dependingon the eluent chosen. This helps reduce the number of columns needed for differ-ent applications.
3. Two trends can be observed in the pharmaceutical industry - the emphasis on strictformal requirements on the one hand, and more customer-friendliness and pragma-tism on the other. This can be illustrated by three examples:
• In purity profiles, it will soon be a legal requirement to separate all potentially oc-curring impurities. By contrast, in stability indicating assays, demands are slightlymore modest - only all possible degradation products (i.e., not all peaks) have tobe separated. This could be achieved using two different methods. A system suit-ability test is to be carried out and documented exclusively for the reporting limit.
• As long as requirements - e.g., a certain resolution - are met. -adjustments' arehandled quite generously. "Change control" or even revalidation can be reduced toa minimum by using "intelligent wording" in the validation report.
• A company that has an impurity to report for a product that has been licensed inthe USA, Europe and Japan will have to do so following three validated (!) meth-ods - in order to meet the USP, EP and JP regulatory standards.

Here are some examples:• Taking into account data that give information about the state of the column, such
as pressure, peak width, retention time, etc.. plus individual user settings, a pro-gram may send reminders along the lines of "regenerate column" or "replace col-umn".
• Simple optimization steps as you would find them in professional optimization pro-grams are carried out by the software automatically.
• Troubleshooting programs contain video sequences that explain simple repair steps.• Online repairs via a modem can be carried out by service engineers, or the user
can get precise repair instructions via the internet.• There are initial cautious attempts to predict the chromatographic behaviour of a
compound based on available physicochemical data.• Data analysis outside chromatography, such as principle component analysis of a
large and complex data set. for example to find metabolites in urine matrices.Obviously, the suitability of any software depends on individual requirements. In
this sense, my comments made in Volume I are still valid, I regret to say. Some soft-ware packages may offer too much for your actual purposes, which makes them un-wieldy and user-unfriendly. Far too little thought is given to the perspective of theanalyst/chromatographer, and the special requirements of the two major applicationareas - routine analysis and method development ~ are barely taken into accountwhen new HPLC software is conceived.
From my point of view, the ideal software consists of a basic package with two ad-ditional modules to choose from - a routine module and a method development mod-ule. These would have to be made compatible with each other in order to facilitatemethod transfer. A software manufacturer who could meet these needs would prob-ably increase his sales considerably. When it comes to evaluating chromatographysoftware you should make a personal checklist to see to what extent the programmeets your needs before you make the purchasing decision. Here are some examples:
• Is it easy to change a method parameter quickly or do superfluous GLP require-ments get in the way, making it necessary to open several windows to document/save/update changes in X/Y/Z?
• Is there enough memory' left if everything has to be saved? Does the backup ofraw data work without hitches or can data be lost?
• Are AD-converters/interfaces sufficiently protected against electronic interferences?• How many difierent LC instruments (and what types of LC instruments) or - if re-
quired - GC equipment from other manufacturers can be run with this softwarewithout running into difficulty?
• Can I view the current UV spectrum in real-time mode and then get it back at anylime?
• Is there a version that meets the requirements of routine work (including templates,GLP-standard documentation, supervisor routine) as well as a developer version(flexibility in changing method parameters)?
• Is software available for LC, LC-MS, LC-DAD and perhaps GC?• How user-friendly is the software? Are there convenient export/import functions
catering to a variety of formats? Can reduced data such as chromatograms, calibra-
Index
100% method (normalized areamethod) 233, 244
acetonitril vs. methanol 180acids, separation of 24, 27, 51addition/additional- method 233, 247 ff.- peaks 103 ff.additives (modifier)- to the eluent 66 ff.- inLC-MS 195ff.adduct- alkali in LC-MS 208- formation 197 ff.aerosol 192f.- alkali cations in 197aging of polar stationary phases 11 ff.air bubbles 84, 101, 105, 168algae 132ammonium phosphate vs. potassium
phosphate 33analysis time, reducing of 55 f.antidepressants, tricyclic 24, 63antidote 198APCl (Atmospheric Pressure Chemical
Ionisation) 189 ff.- linearity of APCl methods 193API (Atmospheric Pressure Ionisa-
tion) ! 89 ff.APPI (Atmospheric Pressure Photoioni-
sation) 189 ff.aspiration rate 168Almospheric Pressure (AP) 189 ff.- Atmospheric Pressure Chemical Ioni-
sation (APCl) I89ff.- Atmospheric Pressure Ionisation
(API) 189 If.
- Atmospheric Pressure Photoionisation(APPI) 189ff.
bacteria 132band broadening, contribution of the in-
dividual moduls to 146ff.basic compounds- selectivity of 19ff.- separation of 51 ff.- in the alkaline medium 49 ff.- tailing by 116breakthrough time (dead time) 214buffers- capacity (ion strength) 34, 112- in common HPLC 35 ff.- in LC-MS 195 ff.bunching rate 238
calibration 237, 247- curves 239- - in LC-MS 206catalytic effect- of the metal syringe- of the silica gel 94cell- impact of 216 f.- path length 218CID (collision-induced dissocia-
tion) 209coefficient of variation 237 ff.collision-induced dissociation
(CID) 209column /column parameters- dual columns 89- diameter and eluent consump-tion 276- dimensions
103

3.6 Thoughts About a Dead Horse
Dear Reader,What I am trying to do in my trilogy of HPLC tips - Volume 3 will be published
soon - is to approach everyday problems in HPLC rationally. This may go against thegrain of the Zeitgeist. Reason is up against what is called logic. We live in an agewhere contents, basic insights and long-term strategies don't seem to matter. Excel ac-robats, rubber stamp fetishists, packaging whiz kids, label designers and experts insurface treatment rule supreme, be it in the chemical or pharmaceutical industry orelsewhere.
It is quite likely that in the long run, this mindset will be eroded from within andcollapse, but until then there is nothing left but to grin and bear it. I think this note,which I found on the pinboard of a pharmaceutical firm, will help us do just that.
A saying of the Dakota Indians goes:"If You Find Yourself Riding a Dead Horse, Get Off"
In our professional life, however, when confronted with such a situation, we wouldoften follow different strategies:1. Get a stronger whip.2. Change riders.3. Say "That's the way we have always ridden our horses".4. Found a committee that analyses the horse.5. Go elsewhere to learn how dead horses are ridden there.6. Raise our quality standards for riding dead horses.7. Create a task force to resuscitate the dead horse.8. Go on a training course to improve our riding skills.9. Initiate a comparative study of dead horses.10. Change the criteria that define when a horse is dead.11. Hire new people to ride the dead horse.12. Harness several dead horses together to speed them up.13. Proclaim that no horse is so dead that it cannot be whipped.14. Find additional funds to raise the performance of the horse.15. Initiate a study to reduce consulting costs.16. Buy a tool that promises to make dead horses run faster.17. Claim that our horse is dead in a better, faster and cheaper way.18. Found a quality circle investigating how dead horses can be put to good use.19. Revise the operating conditions for dead horses.20. Introduce independent auditing for dead horses.
integration- conditions 237 f._ parameters, effect on peak area and
peakhight 241 ff.interfaces, LC-MS 189 ff.internal standard method 232, 245 ff.interstitial retention time 183ion- molecular ion 190ff.- paired ions in LC-MS 189 ff.- source 190 ff.- strength (buffer capacity) 34,112- suppression 208isomers, separation of 21
knots in capillaries 171 ff.
LC (Liquid Chromatography)- micro-LC 213 ff.- nano-LC 213ff.LC-MS (Liquid Chromatography - Mass
Spectrometry)- additives in ] 95 ff.- adduct alkali in 208- buffers in 195 ff.- calibration curves in 206- coupling 187ff.- flow in 189 ff.- interfaces in 189 ff.- linear response in 205- paired ions in 189 ff.- pH-value in 192, 196- post-column addition in 200- sensitivity, enhance in 203- thennolability in 194lifetime of the column 141limit of quantification 236 ff., 251linear response in LC-MS 205linearity of APCI methods 193
mass- range 191- spectrometer 189 ff.memory effect 105, 177methanol vs. acetonitril 180method develoment in RP chromatogra-
phy 74 ff.. 78 ff.
micro-LC 213 ff.microspray 191miniaturization 152f.modifier (additives) 66ff., 195 f.molecular ion 190 ff.monoliths 285MS-MS 208
nano-LC 213 ff.nanospray 191nebulizer 190,203nitrile phase 29nitrogen 190, 204non-endcapped phases 25normalized area method
(100% method) 233,244
orifice 190orthogonal conditions 82overlapping peaks, quantification
of 229overloading 215- of the column 115
paired ions in LC-MS 189ff.parameters of an HPLC instru-
ment 167 ff.peak- additional peaks 103 IT.- area- - change of peak area 127, 129 f.- - effect on integration parame-
ters 241 ff.impact on peak area 230
- - quantification using 229 f.- capacity 55- double peaks 9If.- ghost peaks 94f.. 103 ff.. 105 f.. 107- night- - change of peak high! 129t.- - effect on integration parame-
ters 241 ff._- quantification using 2291.- overlapping peaks, quantification
of 229- small peaks, problems with 163- width 23S. 243
- and gradient separation 159ff.- by gradient runs 155- guard 223- lifetime of 141- optimization of 14- oven 134- overloading of 115- post-column addition in LC-MS 200- RP-columns, selectivity of 31 f.- saturation 223column-selection 75 f.column-switching valve 75 f., 220conductivity detector 175Coulomb explosions 190coupling 90, 286 f.cut-off of buffer solutions 34
dead- time (breakthrough time) 214- volume 65, 114, 144, 166--in u-LC 214detection limit, optimization via injection
volume 164f.dopants 193double peaks 9If.drift, elimination of, in gradient
runs 96 f.dual columns 89
efficiency- increasing 63 ff.- lower 214ff.electrochemical detectors 102Electrospray Ionisation (ESI) 189ff.eluent consumption, and column
diameter 276elution order (reversed elution) 35, 37,
42,46.91- change of HOff.embedded phases 24enrichment of the sample 220environment-responsive
chromatography 289equilibration time in a gradient 270equilibrium- acid-base 195- silanol groups 40
ESI (Electrospray Ionisation) 189 ff.EXCEL- calculation of the coefficient of varia-
tion 237- calculation of a linear regression 245- weighted regression with 251excesses by assay analysis 131exclusion 183external standard method 231, 244 ff.
flow- in gradient runs 60 f., 155- in isocratic runs 55 ff.- in LC-MS ] 89 ff.- rate limit 227fluorescence detector 175fragment 208fronting 119 ff-F-test 249fungi 132fused silica 219
ghost peaks 94 f., 103 ff., 105f., 107gradient- accuracy of 224 ff.- delay volume in u-LC 224- duration, dependance of resolution
on 275- runs- correction in u-LC 226- optimization of 60f., 155f.- separation, and column dimen-
sions 159 ff.guard column 223
HPLC- buffers in common HPLC 35 ff.- parameters of an HPLC
instrument 167 ff.- software for 287 ff.- websites for analytical
chemistry 277 ff.hydrophilic endcapping 24
injection- systems in U.-LC 222- volume 81,215, 272ff.

pHvalue- the dependance of UV-absorp-
lion 47 f.- in LC-MS 192, 196- Ihe role of 40- shift of 42 ff.. 46 ff.plasma 192, 195. 203polar C,s phases, selectivity of 23post-column addition in LC-MS 200potassium phosphate vs. ammonium
phosphate 33precursor 208
quantification, limit of 236 ff., 251
refraction detector 175regression, linear 244ff.resolution 14. 161 f.. 270response time/time constant 168. 243rcstrictor capillary 84retention factor 270reversed elution (see elution order) 35,
37, 42. 46. 91rise time/time constant 168. 243robustness 135ff.RP-chromatography. method develoment
in 74 ff.. 78 ff.RP-columns, selectivity of 31 f.
sampling- rate 168,238, 244- time 238. 241, 244saturation column 223selectivity 161 f.sensitivity
- enhance in LC-MS 203- gain in 218separation factor 162. 270silica, fused 219single reaction monitoring 208slit width 168slope 238, 244small peaks, problems with 163soft clipping 205software for HPLC 287 ff.standard deviation 251- relative 256standard method- external 231, 244 ff.- internal 232, 245 ff.steric aspects, impact on resolution 17steroids 25 f.student's value t 236suppression, integration 238
F-test 249thermolability in LC-MS 194threshold 238, 244time constant 168, 243
uncertainty 250
variance 146variation, coefficient of 237 ff.wavelength, the right 171 ff.websites for analytical chemistry,
HPLC 277 ff.weighted regression 249 ff.wettability 108


![Spyros Louis’s Bréal Cup [Stavros Niarchos Foundation]](https://static.fdocuments.in/doc/165x107/577c7f4c1a28abe054a3f13a/spyros-louiss-breal-cup-stavros-niarchos-foundation.jpg)