Status&of&Krell&Tools&Built&using&Dyninst/MRNet& · 04/30/2013...
28
04/30/2013 Status of Krell Tools Built using Dyninst/MRNet Paradyn Week 2013 Madison, Wisconsin April 30, 2013 1 Paradyn Week 2013 LLNLPRES503431
Transcript of Status&of&Krell&Tools&Built&using&Dyninst/MRNet& · 04/30/2013...

04/30/2013
Status of Krell Tools Built using Dyninst/MRNet
Paradyn Week 2013 Madison, Wisconsin
April 30, 2013
1 Paradyn Week 2013
LLNL-‐PRES-‐503431

04/30/2013
Presenters v Jim Galarowicz, Krell v Don Maghrak, Krell
v Larger team Ø William Hachfeld, Dave Whitney, Dane Gardner: Krell Ø MarHn Schulz, MaK Legendre, Chris Chambreau: LLNL Ø Jennifer Green, David Montoya, Mike Mason, Phil Romero: LANL Ø Mahesh Rajan, Anthony Agelastos: SNLs Ø Dyninst group: • Bart Miller, UW and team • Jeff Hollingsworth, UMD and team
Ø Phil Roth, Michael Brim: ORNL
2 Paradyn Week 2013

04/30/2013
Outline v Welcome ① Open|SpeedShop overview and status ② Component Based Tool Framework overview and status ③ SWAT (Scalable Targeted Debugger for ScienPfic and
Commercial CompuPng) DOE STTR Project Status ④ GPU Support DOE SBIR Project Status ⑤ Cache Memory Analysis DOE STTR Project Status ⑥ Parallel GUI Tool Framework DOE SBIR Project Status v QuesPons
3 Paradyn Week 2013

04/30/2013
Open|SpeedShop
(www.openspeedshop.org) Paradyn Week 2013
April 20, 2013
4 Paradyn Week 2013

04/30/2013
v What is Open|SpeedShop? Ø HPC Linux, pla^orm independent applicaHon performance tool Ø Linux clusters, Cray, Blue Gene pla^orms supported
v What can Open|SpeedShop do for the user? Ø pcsamp: Give lightweight overview of where program spends
time Ø usertime: Find hot call paths in user program and libraries Ø hwc,hwctime,hwcsamp: Give access to hardware counter event
information Ø io,iot: Record calls to POSIX I/O functions, give timing, call paths,
and optional info like: bytes read, file names... Ø mpi,mpit: Record calls to MPI functions. give timing, call paths,
and optional info like: source, destination ranks, ..... Ø fpe: Help pinpoint numerical problem areas by tracking FPE
Paradyn Week 2013 5
Project Overview: What is Open|SpeedShop?

04/30/2013
v Maps the performance information back to the source and displays source annotated with the performance information.
v osspcsamp “How you run your application outside of O|SS”
v openss –f smg2000-pcsamp.openss for GUI
v openss –cli –f smg2000-pcsamp.openss for CLI (command line)
Paradyn Week 2013 6
Project Overview: What is Open|SpeedShop?
>openss –cli –f smg2000-pcsamp.openss openss>>Welcome to OpenSpeedShop 2.0.2 openss>>expview Exclusive CPU Hme % of CPU Time FuncHon (defining locaHon) in seconds.
3.630000000 43.060498221 hypre_SMGResidual 2.860000000 33.926453144 hypre_CyclicReducHon 0.280000000 3.321470937 hypre_SemiRestrict 0.210000000 2.491103203 hypre_SemiInterp 0.150000000 1.779359431 opal_progress

04/30/2013
v Update on status of Open|SpeedShop Ø ConHnued to focus more on CBTF the past year Ø Completed port to Blue Gene Q
• StaHc executables using osslink • Dynamic (shared) executable using osspcsamp, ossuserHme, etc.
Ø Added funcHonality to Open|SpeedShop • Added MPI File I/O support to MPI experiment. • Keeping up with components like: libunwind, papi, dyninst, libmonitor... • Derived metric support: arithmeHc on gathered performance metrics • More pla^orms, users & applicaHon exposure -‐> more robust
Ø New CBTF component instrumentor for data collecHon • Leverages lightweight MRNet for scalable data gathering and filtering. • Uses CBTF collectors and runHmes • Passes data up the transport mechanism, based on MRNet • Provides basic filtering capabiliHes currently
Paradyn Week 2013 7
Open|SpeedShop
04/30/2013
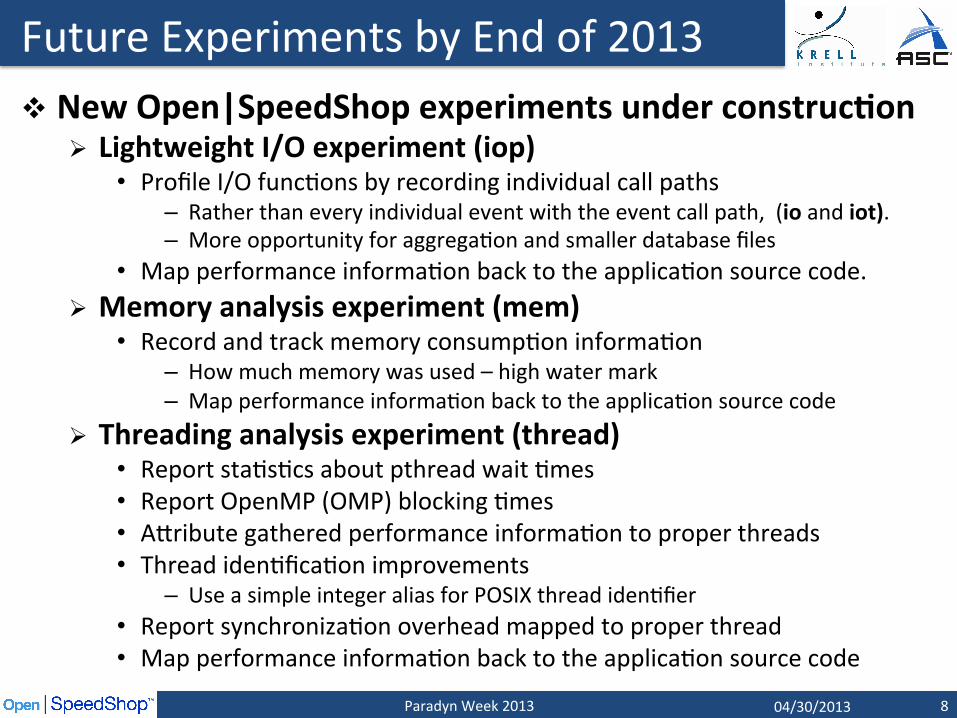
Future Experiments by End of 2013 v New Open|SpeedShop experiments under construcPon
Ø Lightweight I/O experiment (iop) • Profile I/O funcHons by recording individual call paths
– Rather than every individual event with the event call path, (io and iot). – More opportunity for aggregaHon and smaller database files
• Map performance informaHon back to the applicaHon source code. Ø Memory analysis experiment (mem)
• Record and track memory consumpHon informaHon – How much memory was used – high water mark – Map performance informaHon back to the applicaHon source code
Ø Threading analysis experiment (thread) • Report staHsHcs about pthread wait Hmes • Report OpenMP (OMP) blocking Hmes • AKribute gathered performance informaHon to proper threads • Thread idenHficaHon improvements
– Use a simple integer alias for POSIX thread idenHfier • Report synchronizaHon overhead mapped to proper thread • Map performance informaHon back to the applicaHon source code
8 Paradyn Week 2013

04/30/2013
Scaling Open|SpeedShop v Open|SpeedShop designed for tradiHonal clusters
Ø Tested and works well up to 1,000-‐10,000 cores Ø Scalability concerns on machines with 100,000+ cores Ø Target: ASC capability machines like LLNL’s Sequoia (20 Pflop/s BG/Q)
v Component Based Tool Framework (CBTF) Ø hKp://r.ornl.gov/doku/cb^w/start Ø Based on tree based communicaHon infrastructure Ø PorHng O|SS on top of CBTF
v Improvements: Ø Direct streaming of performance data to tool without wriHng temporary raw data I/O files
Ø Data will be filtered (reduced or combined) on the fly Ø Emphasis on scalable analysis techniques
v IniHal prototype exists, working version: Mid-‐2013 Ø LiKle changes for users of Open|SpeedShop Ø CBTF can be used to quickly create new tools Ø AddiHonal opHon: use of CBTF in applicaHons to collect data
9 Paradyn Week 2013
04/30/2013
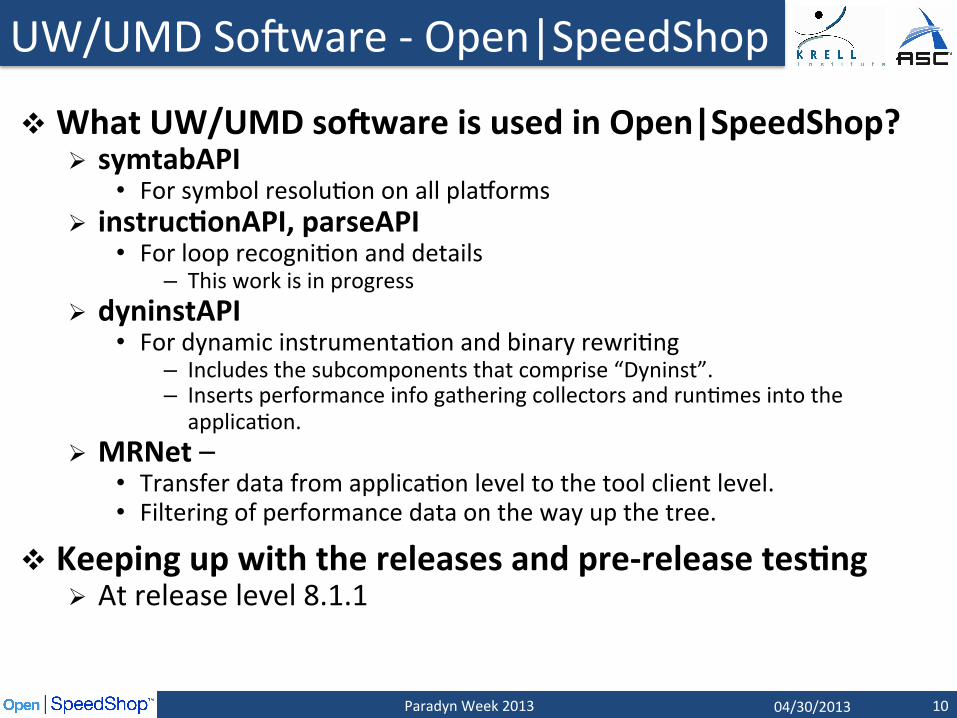
v What UW/UMD so_ware is used in Open|SpeedShop? Ø symtabAPI
• For symbol resoluHon on all pla^orms Ø instrucPonAPI, parseAPI
• For loop recogniHon and details – This work is in progress
Ø dyninstAPI • For dynamic instrumentaHon and binary rewriHng
– Includes the subcomponents that comprise “Dyninst”. – Inserts performance info gathering collectors and runHmes into the applicaHon.
Ø MRNet – • Transfer data from applicaHon level to the tool client level. • Filtering of performance data on the way up the tree.
v Keeping up with the releases and pre-‐release tesPng Ø At release level 8.1.1
Paradyn Week 2013 10
UW/UMD Sorware -‐ Open|SpeedShop

04/30/2013
Component Based Tool Framework (CBTF)
Paradyn Week 2013
April 20, 2013
11 Paradyn Week 2013

04/30/2013
v What is CBTF? Ø A Framework for wriHng Tools that are Based on Components. Ø Consists of:
• Libraries that support the creaHon of reusable components, component networks (single node and distributed) and support connecHon of the networks.
• Tool building libraries (decomposed from O|SS)
v Benefits of CBTF Ø Components are reusable and easily added to new tools. Ø With a large component repository new tools can be wriKen quickly with liKle code.
Ø Create scalable tools by virtue of the distributed network based on MRNet.
Ø Components can be shared with other projects
Paradyn Week 2013 12
CBTF
Input
Input
Output
A B
C

04/30/2013
v CBTF uses a transport mechanism to handle all of its communicaPons.
v CBTF uses MRNet as its transport mechanism Ø MulHcast/ReducHon Network Ø Scalable tree structure Ø Hierarchical on-‐line data aggregaHon
v CBTF views MRNet as “just” another component.
Paradyn Week 2013 13
MRNet

04/30/2013
v Three Networks where components can be connected Ø Frontend, Backend, mulHple Filter levels Ø Every level is homogeneous
v Each Network also has some number of inputs and outputs.
v Any component network can be run on any level, but logically Ø Frontend component network
• Interact with or Display info to the user Ø Filter component network
• Filter or Aggregate info from below • Make decisions about what is sent up or down the tree
Ø Backend component network • Real work of the tool (extracHng informaHon)
Paradyn Week 2013 14
CBTF Networks

04/30/2013
v What can this framework be used for? v CBTF is flexible and general enough
Ø To be used for any tool that needs to “do something” on a large number of nodes and filter or collect the results.
v Sysadmin Tools Ø Poll informaHon on a large number of nodes Ø Run commands or manipulate files on the backends Ø Make decisions at the filter level to reduce output or interacHon
v Performance Analysis Tools Ø Massively parallel applicaHons need scalable tools Ø Have components running along side the applicaHon
v Debugging Tools Ø Use cluster analysis to reduce thousands (or more) processes into a small number of groups
Paradyn Week 2013 15
Using CBTF Beyond O|SS

04/30/2013
v Tool startup invesPgaPons (Libi, launchmon) v ConPnuing porPng to Cray and Blue Gene
Ø Cray • Working, but needs some further automaHon for node allocaHon
Ø Blue Gene • Delayed, because lightweight MRNet does not currently work on BG/Q • InvesHgaHon with MaK Legendre, LLNL, on an alternaHve way to transfer performance informaHon from the applicaHon to the CBTF/OSS tool.
v Add more advanced data reducPon filters Ø Cluster analysis Ø Data matching techniques: keep a representaHve rank/thread
v Full Open|SpeedShop integraPon v Completed Phase I DOE SBIR to research and add performance analysis support for GPU/Accelerators
Paradyn Week 2013 16
CBTF Related and Next Steps

04/30/2013
Scalable Targeted Debugger for ScienHfic and Commercial CompuHng (SWAT) STTR Project
Paradyn Week 2013 April 20, 2013
17 Paradyn Week 2013

04/30/2013
v What is SWAT? Ø A Commercialized version of the STAT debugger primarily developed by LLNL/UW
Ø AKach to a hung job, find all call paths and expose the outliers. v UW and Argo Navis* teamed together on STTR to:
Ø Port SWAT to more pla^orms Ø Test and extend the stack walking component used by SWAT, the StackwalkerAPI to work with more compilers, pla^orms, … • This was done
Ø Enhance the GUI so that it is portable, robust, and easy to use. • New GUI was wriKen based on the Parallel Tools GUI Framework (PTGF)
Ø Develop more advanced call tree reducHon algorithms Ø Improve SWAT’s ability to display complex stack trees
v Uses StackWalkerAPI and MRNet v Looking for new funding and markePng opportuniPes for
SWAT. *Commercial enPty associated with Krell
Paradyn Week 2013 18
SWAT

04/30/2013
Paradyn Week 2013 19
SWAT

04/30/2013
Open|SpeedShop Support GPU SBIR
Phase I Project
Paradyn Week 2013 April 20, 2013
20 Paradyn Week 2013

04/30/2013
v Argo Navis* GPU DOE SBIR phase I Ø Prototype applicaHon profiling support for GPUs into OpenSpeedShop
v Using the CUDA and PAPI CupP interfaces v These were the goals we proposed for the GPU SBIR:
Ø Report the Hme spent in the GPU device (when exited -‐ when entered). • Completed
Ø Report the cost and size of data transferred to and from the GPU. • Completed
Ø Report informaHon to help the user understand the balance of CPU versus GPU uHlizaHon. • Close to compleHon
Ø Report informaHon to help the user understand the balance between • The transfer of data between the host and device memory and the execuHon of computaHonal kernels.
• Have info to derive this, need to create the views. Ø Report informaHon to help the user understand the performance of the internal computaHonal kernel code running on the GPU device. • Close to compleHon
*Commercial enPty associated with Krell
Paradyn Week 2013 21
GPU support: CBTF & OpenSpeedShop
04/30/2013
v Because transiPoning Open|SpeedShop to use CBTF to collect performance data. Ø GPU collecHon capabiliHes were added to the CBTF collector set. Makes the funcHonality available in CBTF as well.
v Rudimentary views are available. Ø Info external to GPU displays based on I/O tracing collector view Ø Info internal to GPU displays based on the hwc sampling collector view
v Current status: Ø CollecHon of external GPU kernel staHsHcs is completed Ø Working on gathering informaHon about the GPU kernels themselves. Ø Looking for new funding opportuniHes for further GPU related development, as we did not win phase II funding. • CLI and GUI view work needed.
*Commercial enPty associated with Krell
Paradyn Week 2013 22
GPU support: CBTF & OpenSpeedShop

04/30/2013
Cache Memory Analysis STTR
Phase I Project (acHve) Paradyn Week 2013
April 20, 2013
23 Paradyn Week 2013

04/30/2013
Automated Cache Performance Analysis and OpPmizaPon in Open|SpeedShop v Teamed with Kathryn Mohror and Barry Roundtree, LLNL v Use Precise Event-‐Based Sampling (PEBS) counters v With the newest iteraPon of PEBS technology
Ø Cache events can be Hed to a tuple of: • InstrucHon pointer • Target address (for both loads and stores) • Memory hierarchy and observed latency
v With this informaPon we can analyze Cache usage for: Ø Efficiency of regions of code Ø How these regions interact with parHcular data structures Ø How these interacHons evolve over Hme.
v Short term, research focus: Ø Performance analysis: understanding and opHmizing the behavior of applicaHon codes related to their memory hierarchy.
v Long term, research focus: AutomaHon Paradyn Week 2013 24
Automated Cache Performance Analysis

04/30/2013
Parallel Tools GUI Framework (PTGF)
Phase I Project (acHve) Paradyn Week 2013
April 20, 2013
25 Paradyn Week 2013

04/30/2013
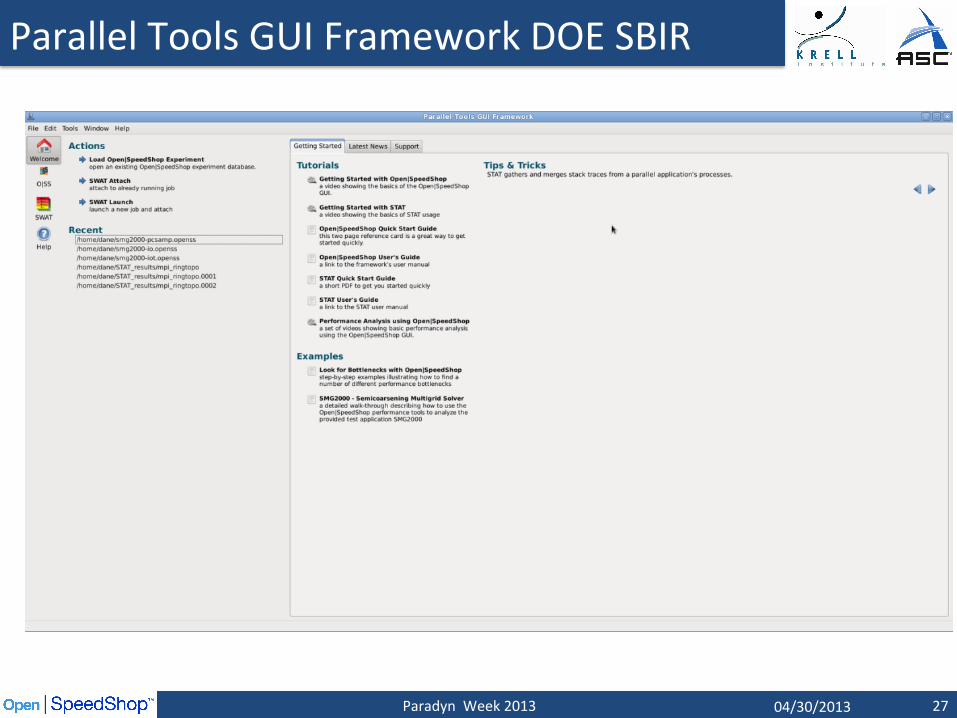
Parallel Tools GUI Framework Goals: v Facilitate the rapid development of cross-‐plaform user interfaces
for new and exisPng parallel tools. v Target a stable version of Qt4 which is currently available on
many exisPng clusters. It is forward compaPble with Qt5. v Provide abstracted visualizaPons for easy inclusion in mulPple
parallel tools. These abstracted visualizaPons will accept a simple dataset. Ø The visualizaHon plugins will also act as dynamic libraries, which can be easily
extended by tool developers looking to specialize a parHcular view. v Provide a scalable design/model which will allow tools with very
large datasets to be used effecPvely within the PTGF. v Provide a standardized interface such that users will find enough
similariPes between tools to make learning addiPonal ones easier.
v Provide faciliPes for user learning of a new parallel tool from within PTGF, and the ability to link to online resources.
Paradyn Week 2013 26
Parallel Tools GUI Framework DOE SBIR
04/30/2013
Paradyn Week 2013 27
Parallel Tools GUI Framework DOE SBIR

04/30/2013
QuesPons v Jim Galarowicz
v Don Maghrak Ø [email protected]
v QuesPons about Open|SpeedShop or CBTF Ø oss-‐[email protected]
28 Paradyn Week 2013