Status, Topics, and Questions regarding the Federal Land Manager Environmental Database (FED) March...
15
Status, Topics, and Questions regarding the Federal Land Manager Environmental Database (FED) March 20, 2011
-
date post
19-Dec-2015 -
Category
Documents
-
view
217 -
download
4
Transcript of Status, Topics, and Questions regarding the Federal Land Manager Environmental Database (FED) March...

Status, Topics, and Questions regarding the
Federal Land Manager Environmental Database (FED)
March 20, 2011
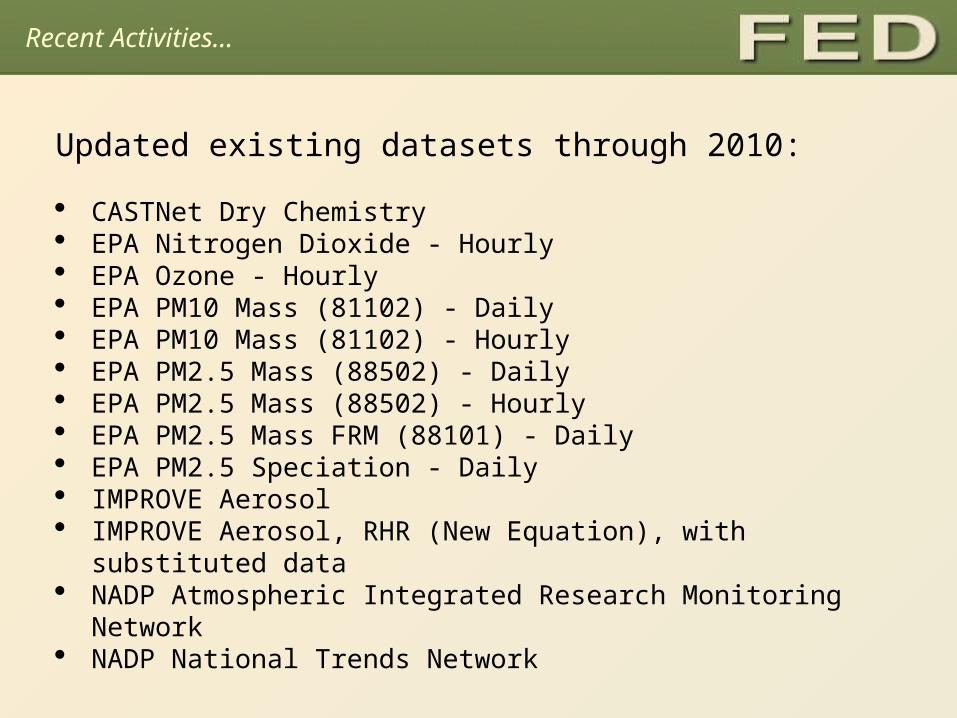
Updated existing datasets through 2010: CASTNet Dry Chemistry EPA Nitrogen Dioxide - Hourly EPA Ozone - Hourly EPA PM10 Mass (81102) - Daily EPA PM10 Mass (81102) - Hourly EPA PM2.5 Mass (88502) - Daily EPA PM2.5 Mass (88502) - Hourly EPA PM2.5 Mass FRM (88101) - Daily EPA PM2.5 Speciation - Daily IMPROVE Aerosol IMPROVE Aerosol, RHR (New Equation), with substituted data NADP Atmospheric Integrated Research Monitoring Network NADP National Trends Network
Recent Activities…
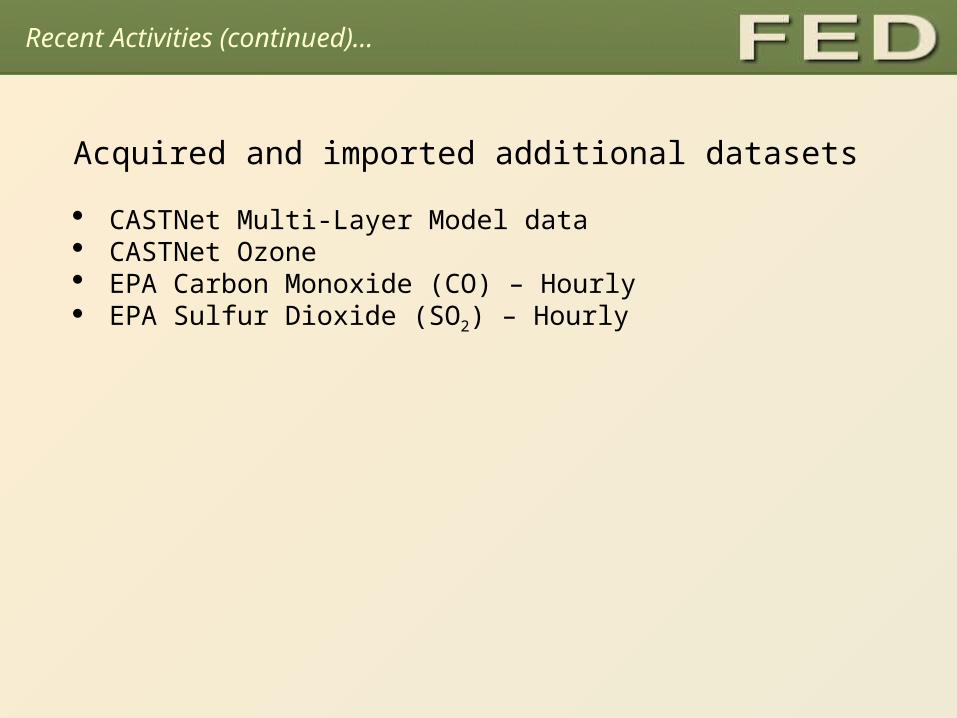
Acquired and imported additional datasets CASTNet Multi-Layer Model data CASTNet Ozone EPA Carbon Monoxide (CO) – Hourly EPA Sulfur Dioxide (SO2) – Hourly
Recent Activities (continued)…
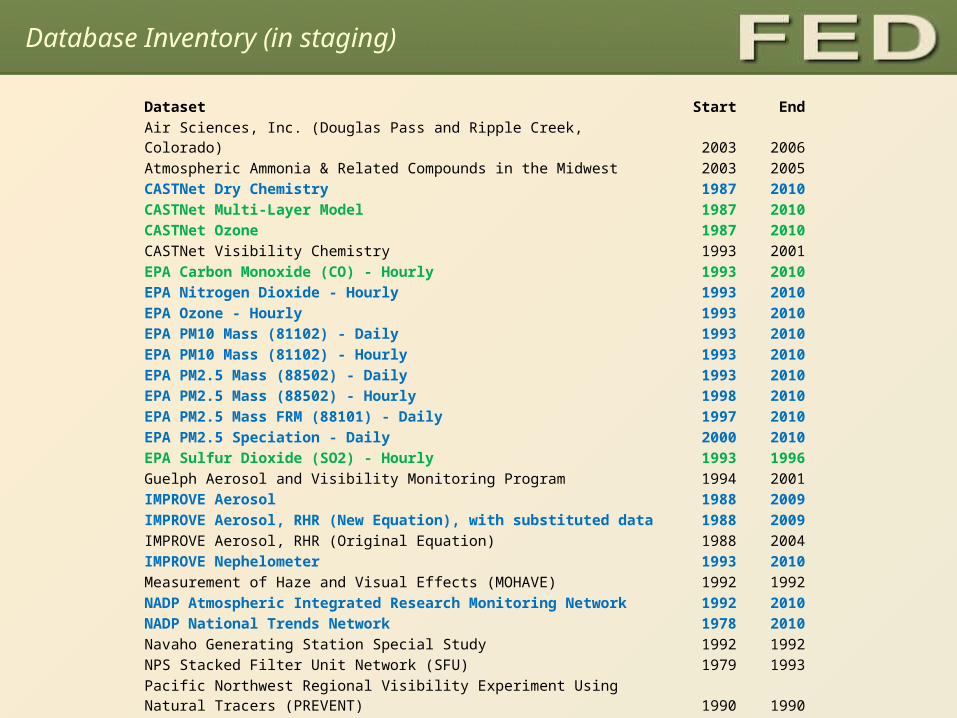
Dataset Start EndAir Sciences, Inc. (Douglas Pass and Ripple Creek, Colorado) 2003 2006Atmospheric Ammonia & Related Compounds in the Midwest 2003 2005CASTNet Dry Chemistry 1987 2010CASTNet Multi-Layer Model 1987 2010CASTNet Ozone 1987 2010CASTNet Visibility Chemistry 1993 2001EPA Carbon Monoxide (CO) - Hourly 1993 2010EPA Nitrogen Dioxide - Hourly 1993 2010EPA Ozone - Hourly 1993 2010EPA PM10 Mass (81102) - Daily 1993 2010EPA PM10 Mass (81102) - Hourly 1993 2010EPA PM2.5 Mass (88502) - Daily 1993 2010EPA PM2.5 Mass (88502) - Hourly 1998 2010EPA PM2.5 Mass FRM (88101) - Daily 1997 2010EPA PM2.5 Speciation - Daily 2000 2010EPA Sulfur Dioxide (SO2) - Hourly 1993 1996Guelph Aerosol and Visibility Monitoring Program 1994 2001IMPROVE Aerosol 1988 2009IMPROVE Aerosol, RHR (New Equation), with substituted data 1988 2009IMPROVE Aerosol, RHR (Original Equation) 1988 2004IMPROVE Nephelometer 1993 2010Measurement of Haze and Visual Effects (MOHAVE) 1992 1992NADP Atmospheric Integrated Research Monitoring Network 1992 2010NADP National Trends Network 1978 2010Navaho Generating Station Special Study 1992 1992NPS Stacked Filter Unit Network (SFU) 1979 1993Pacific Northwest Regional Visibility Experiment Using Natural Tracers (PREVENT) 1990 1990Regional Visibility Experimental Assessment in the Lower Fraser Valley (REVEAL) 1994 1995SEARCH All Variables 1998 2005SEARCH Best Estimate 1998 2005SEARCH FRM 1998 2005Southeastern Aerosol and Visibility Study (SEAVS) 1995 1995
Database Inventory (in staging)

Refined the FED website Removed more VIEWS-specific references and resources Removed pages, content, and code specific to VIEWS Refined the user management subsystem Made other refinements and infrastructural improvements Upgraded various third-party software components Upgraded the operating system and web server software Migrated the FTP server to a newer machine with larger hard drives
Refined the FED database
Made various improvements to the integrated database schema Refined the metadata management subsystem Updated metadata references for new and updated datasets Modified and optimized various indexes and table keys

Recent Activities (continued)…
Created a local SAS environment Installed and configured SAS in preparation for:
o Generating the IMPROVE RHR metrics (via Debbie Miller’s scripts)
o Generating the various ozone metrics (via Debbie Miller’s scripts)
Worked with Scott Copeland to better understand Debbie Miller’s SAS scripts
Made preliminary design plans for reorganizing and “tightening” the scripts into a redistributable SAS package
Investigated the mechanisms for “driving” SAS from other programs (i.e. integrating it into the import process)
Short Term Activities…
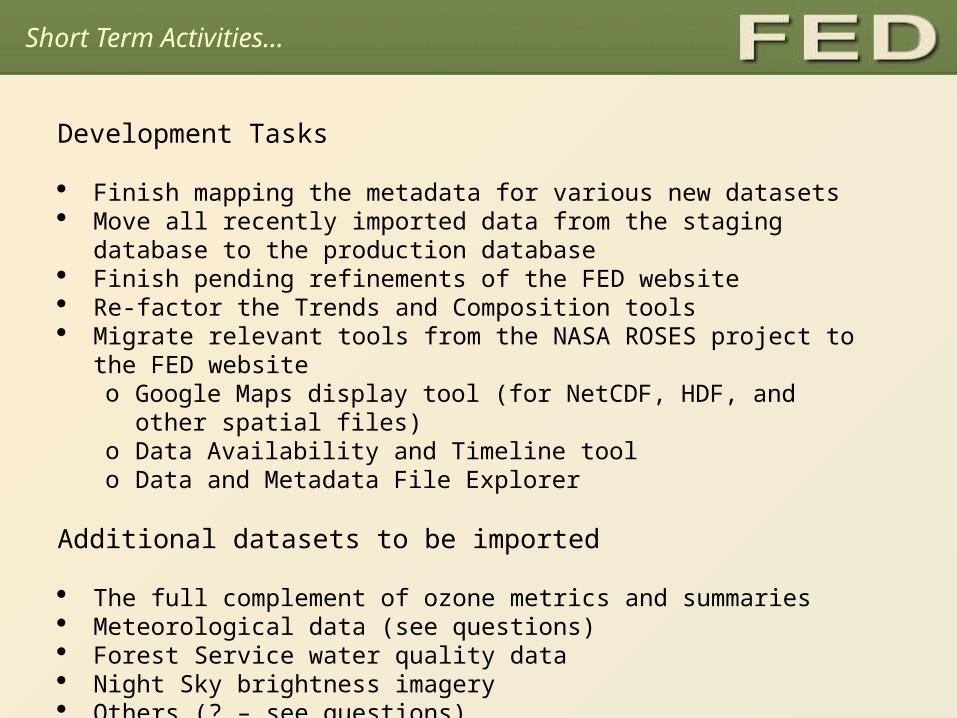
Development Tasks
Finish mapping the metadata for various new datasets Move all recently imported data from the staging database to the production
database Finish pending refinements of the FED website Re-factor the Trends and Composition tools Migrate relevant tools from the NASA ROSES project to the FED website
o Google Maps display tool (for NetCDF, HDF, and other spatial files)o Data Availability and Timeline toolo Data and Metadata File Explorer
Additional datasets to be imported
The full complement of ozone metrics and summaries Meteorological data (see questions) Forest Service water quality data Night Sky brightness imagery Others (? – see questions)
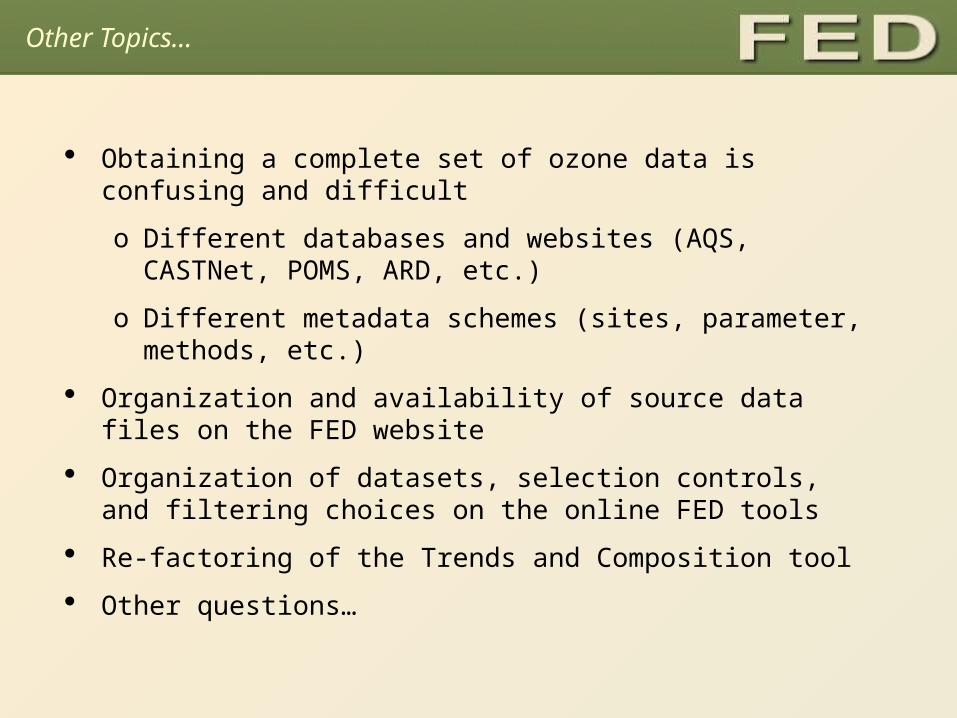
Obtaining a complete set of ozone data is confusing and difficult
o Different databases and websites (AQS, CASTNet, POMS, ARD, etc.)
o Different metadata schemes (sites, parameter, methods, etc.)
Organization and availability of source data files on the FED website
Organization of datasets, selection controls, and filtering choices on the online FED tools
Re-factoring of the Trends and Composition tool
Other questions…
Other Topics…

Questions…
Do the following items (from the SOW) refer exclusively to AQS datasets? Hourly PM 2.5 concentrations Hourly PM10 concentrations Hourly NO2 concentrations Hourly SO2 concentrations Hourly CO concentrations
Do the following items (from the SOW) refer exclusively to CASTNet datasets (and/or others, like NADP)? Weekly wet deposition concentrations, including Ca, Cl, K, Mg, Na, NH4, NO3, SO4, Hg (mg/l
and eq/l) Weekly wet deposition, including Ca, Cl, K, Mg, Na, NH4, NO3, SO4, Hg (kg/ha) Annual mean deposition concentrations, including Ca, Cl, K, Mg, Na, NH4, NO3, SO4, Hg (mg/l
and eq/l) 3- and 5-year averages of annual mean deposition concentrations (mg/l), including Ca, Cl, K,
Mg, Na, NH4, NO3, SO4, Hg Annual total wet deposition, including Ca, Cl, K, Mg, Na, NH4, NO3, SO4, Hg 3- and 5- year averages of annual total wet deposition, including Ca, Cl, K, Mg, Na, NH4, NO3,
SO4, Hg

Questions…
Where do we get the required meteorological data? Temperature Relative humidity Scalar wind speed and wind direction Vector wind speed and wind direction Dew point Solar radiation Rainfall Barometric pressure
How should the following derived datasets be generated and/or obtained? Interpolated values of summary statistics, determined at park locations Interpolated estimates of air quality condition, determined at park locations Monitors used to compute trends for each park
Questions…
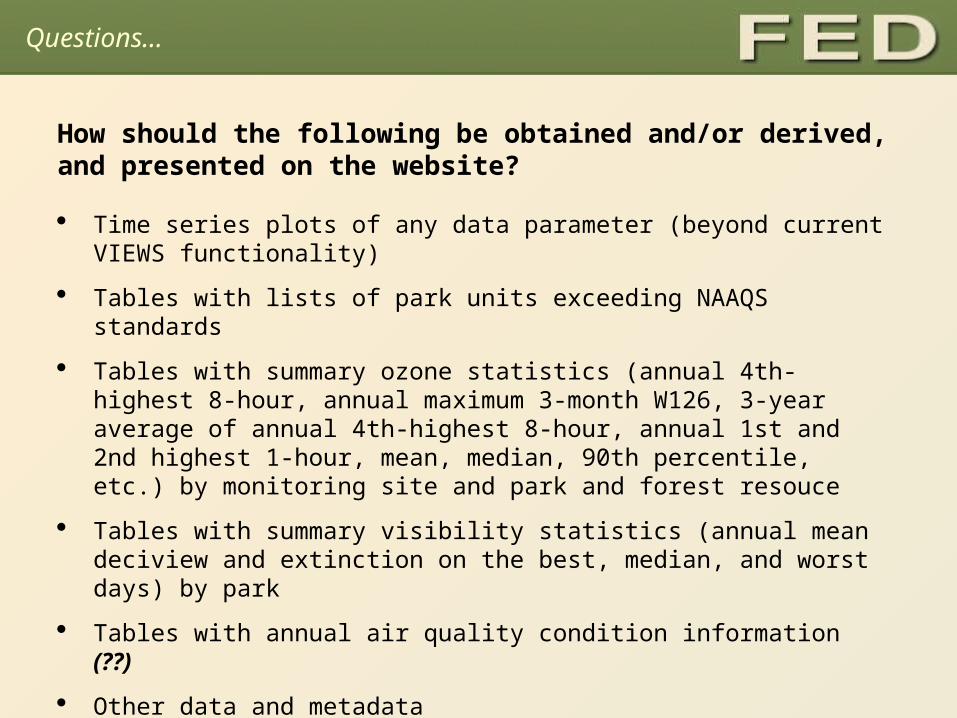
How should the following be obtained and/or derived, and presented on the website? Time series plots of any data parameter (beyond current VIEWS functionality)
Tables with lists of park units exceeding NAAQS standards
Tables with summary ozone statistics (annual 4th-highest 8-hour, annual maximum 3-month W126, 3-year average of annual 4th-highest 8-hour, annual 1st and 2nd highest 1-hour, mean, median, 90th percentile, etc.) by monitoring site and park and forest resouce
Tables with summary visibility statistics (annual mean deciview and extinction on the best, median, and worst days) by park
Tables with annual air quality condition information (??)
Other data and metadata

Thank you.
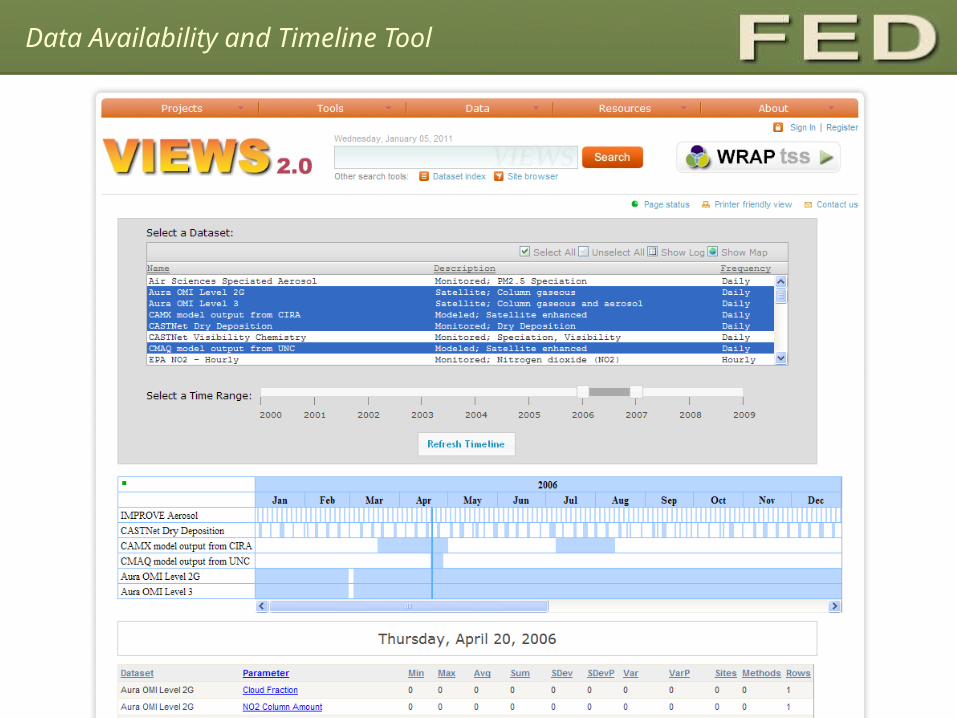
Data Availability and Timeline Tool

Google Maps Spatial Display Tool
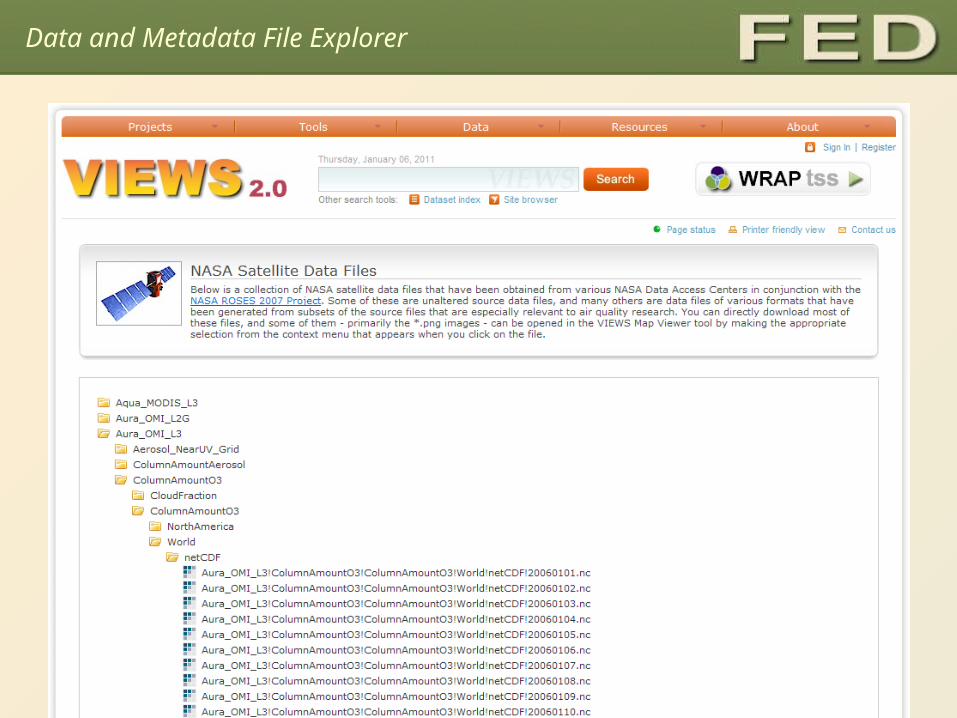
Data and Metadata File Explorer