Status report on the universal design of websites in the ... · Status report on the universal...
57
Digital barriers on Norwegian websites Status report on the universal design of websites in the private and public sector – 2014 Difi report 2015:7 ISSN 1890-6583
-
Upload
truongphuc -
Category
Documents
-
view
213 -
download
0
Transcript of Status report on the universal design of websites in the ... · Status report on the universal...
Digital barriers on Norwegian websites Status report on the universal design of websites in the private and public sector – 2014
Difi report 2015:7
ISSN 1890-6583

1
Preface
Everyone should be able to use the online solutions they encounter in everyday life properly and easily. This is the purpose of the regulations on universal design of information and communication technology (ICT). The Norwegian Agency for Public Management and eGovernment (Difi), represented by the Authority for Universal Design of ICT in Norway, monitors compliance with the regulations on universal design of ICT as part of its supervisory activities. The vision is a society without digital barriers.
The Authority has carried out a survey to assess the universal design status of Norwegian websites. The survey was conducted in the period September 2014 to January 2015. We evaluated some 300 websites in the private sector and public sector against a sample of the requirements defined in the regulations.
The survey builds on the international standard Web Content Accessibility Guidelines (WCAG) 2.0. This report contains an explanation of the technical requirements for the online solutions assessed in the survey and the way in which the requirement affects the use of the solutions. The report presents the results for topics and areas of society that the Authority has identified as particularly important for equal participation.
The digital barriers detected in this survey provide an indication of the topics it is important to take into account in developing web-based solutions. The report has several target audiences and shall be a source of information for organisations that use websites in their contact with customers and users, user and industrial organisations, developers, designers and webmasters. Although the starting point for the survey was technical requirements, importance has been attached to preparing a report that does not require in-depth technological expertise.
The survey was conducted by Mokhtar Eliassi, Martin Skifte Swartling and Geir Sindre Fossøy of the Authority for Universal Design of ICT in Norway, with assistance from Kari Anne Reitan Andersen of Steria AS. Dagfinn Rømen of the Authority for Universal Design of ICT in Norway was in charge of the execution of the survey and quality assurance of the test results. He was also in charge of the quality assurance of the content in the report related to technical aspects of universal design of web-based solutions. Product Manager Inger Tvenning of Intelytics Norway AS performed the data analysis and quality assurance of the use of the results of the analysis.
Senior Adviser Brynhild Runa Sterri wrote the report and is also project manager for the "Knowledge base for universal design of ICT" project, of which this status survey is one of the main elements. Malin Rygg, head of the Authority for Universal Design of ICT in Norway, was the responsible project coordinator.
Oslo, 15 June 2015
Ingelin Killengreen
Director

2
Contents
Preface .................................................................................................................. 1
Contents ................................................................................................................ 2
1 Summary of the status survey – risk areas ....................................................... 4
1.1 Coding of web-based solutions is the greatest risk ................................................ 4
1.2 Widespread non-compliance on text alternatives for images ............................... 4
1.3 Challenges related to navigability .......................................................................... 5
1.4 Varying results for keyboard navigation ................................................................. 5
1.5 Forms ...................................................................................................................... 6
1.6 The public sector has the most accessible solutions .............................................. 6
1.7 Greatest risk in the private sector .......................................................................... 6
2 The status survey ........................................................................................... 7
2.1 Regulations governing universal design of ICT ....................................................... 7
2.2 The objective of the survey .................................................................................... 8
2.3 Selection of organisations / web-based solutions for inclusion in the survey ....... 8
2.4 Methods for measuring and analysing results ....................................................... 9
2.5 Risk assessment .................................................................................................... 10
3 Topics in the status survey ............................................................................ 10
3.1 Web Content Accessibility Guidelines, version 2.0 .............................................. 10
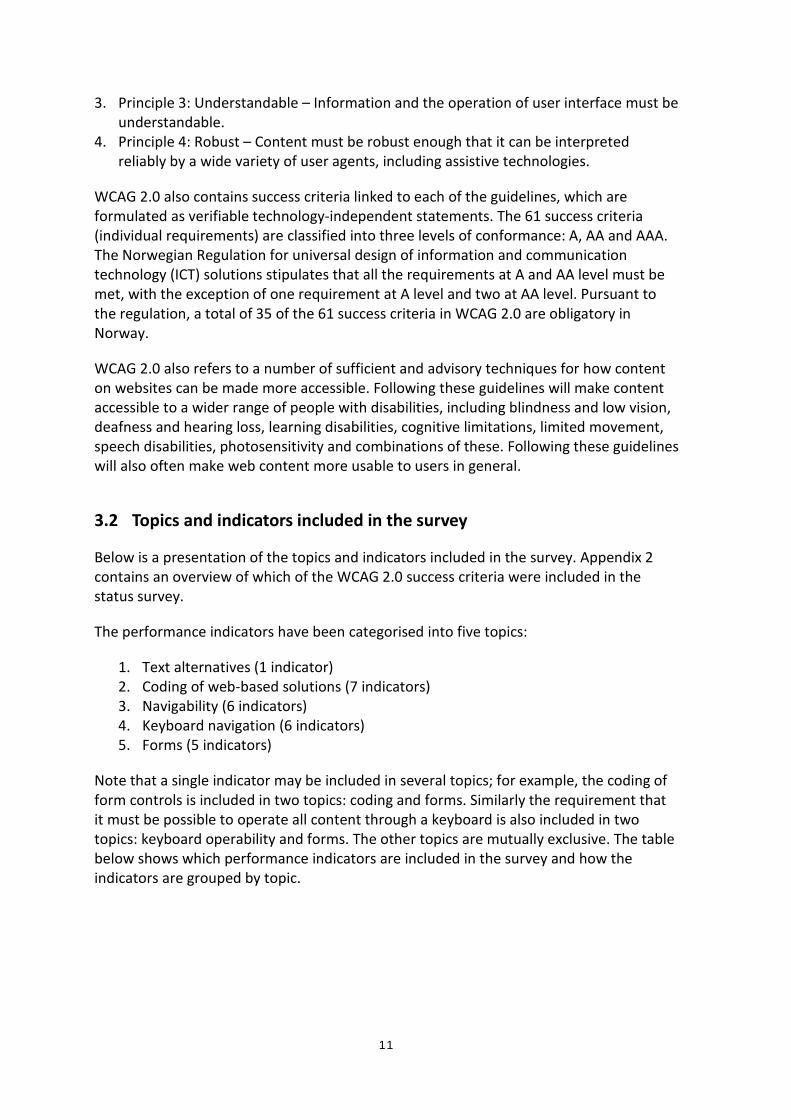
3.2 Topics and indicators included in the survey ....................................................... 11
4 Result: Status of digital barriers on Norwegian websites ............................... 13
4.1 Text alternatives for images and diagrams – a risk area ...................................... 13
4.2 Major challenges in the coding of web-based solutions ...................................... 14 4.2.1 Coding of different types of content elements .............................................. 15 4.2.2 Correct use of code (avoid syntax errors) ...................................................... 19
4.3 Varying results for navigability ............................................................................. 20 4.3.1 Links distinguishable from headings and body text ....................................... 22 4.3.2 The purpose of links is understandable ......................................................... 23 4.3.3 Sufficient contrast between text and its background .................................... 23 4.3.4 Text can be resized without loss of content or functionality......................... 24 4.3.5 There are several ways of getting to a web page .......................................... 25 4.3.6 Labels in search fields .................................................................................... 26
4.4 Varying results for keyboard navigation ............................................................... 27 4.4.1 All content and all functionality can be operated through a keyboard ......... 29 4.4.2 No keyboard traps .......................................................................................... 30 4.4.3 Link to skip to the main content of a web page ............................................. 31 4.4.4 Content navigated to by keyboard has a visible focus indicator ................... 32 4.4.5 Selecting form controls through keyboard has predictable effects .............. 32
4.5 Digital forms ......................................................................................................... 33 4.5.1 Labels in form controls ................................................................................... 34

3
4.5.2 Summary of areas linked to forms ................................................................. 35
5 Which sector is the most accessible – private or public? ................................ 35
5.1 Overview – comparison of industries ................................................................... 36
5.2 Public sector ......................................................................................................... 37
5.3 The primary industries, manufacturing, construction, power supply, etc. .......... 39
5.4 Wholesale & retail trade ....................................................................................... 40
5.5 Transport, travel, accommodation and food service ........................................... 41
5.6 Media and information ......................................................................................... 43
5.7 Banking, finance and other service activities ....................................................... 44
6 References ................................................................................................... 46
7 Appendix 1 Selection of organisations........................................................... 47
8 Appendix 2 Testing and assessment methods ................................................ 49
9 Appendix 3 Overview of success criteria and performance indicators ............ 51
10 Appendix 4 Code-related indicators and test methods ................................... 55

4
1 Summary of the status survey – risk areas
In the autumn of 2014, the Authority for Universal Design of ICT in Norway conducted a survey to identify the universal design status of more than 300 organisations in a range of different industries in both the private and the public sector. The starting point for the survey was the Norwegian Regulation for universal design of information and communication technology (ICT) solutions, with WCAG 2.01 providing more detailed requirements for web-based solutions. The areas assessed in the survey were text alternatives for images, the coding of websites, navigability, keyboard navigation and online forms.
In view of the high degree of digitisation in both the private and the public sector, it is essential that ICT solutions are universally designed and accessible to all. The survey is intended to help identify risk areas that make it difficult or impossible for many people to use web-based solutions. The risk assessments have also been used as the basis for the selection of focus areas in connection with supervisory activities. The assessment of the risks is based on the results of the status survey, together with an assessment of the extent to which digital barriers impact different user groups.
The average result for the web-based solutions included in this status survey is 51 per cent of the total points available. However, there is considerable variation in the results, with scores ranging from 18 to 78 per cent for some individual organisations.
1.1 Coding of web-based solutions is the greatest risk
The coding of any web solution should, among other things, ensure that the content on the website is also accessible in other ways than through visual expression. In this context, headings, charts and tables, search fields and form controls were assessed. Substandard coding represents a potential digital barrier for large groups of users, including people with low vision who use a screen reader or Braille display and others who benefit from having content read aloud to them, for example people with reading and writing difficulties and people with memory and concentration challenges.
The Authority considers the coding of content on websites to be the most extensive risk area. With the exception of coding of tables, the main impression from the tests was that only a minority of the websites comply fully with the WCAG 2.0 coding requirements. Fairly major challenges were detected related to coding of headings, table content, form controls and search fields. A relatively high degree of erroneous coding was also found.
1.2 Widespread non-compliance on text alternatives for images
Images on websites, such as photographs, illustrations, organisation charts and diagrams, must have a text explanation that the user can have read aloud. Only 7 per cent of the
1 Web Content Accessibility Guidelines, version 2.0

5
organisations achieved a full score in this area, while 93 per cent had varying degrees of non-compliance. Text alternatives for images are essential to enable, for example, blind users who use a screen reader or Braille display, to access the content. People with reading and writing difficulties and people with other cognitive challenges can also benefit greatly from an explanation of the content in illustrations. This requirement is thus important for very many users.
1.3 Challenges related to navigability
The navigability of web-based solutions means how the users can get to and use various content types. The topics assessed in this survey are compliance with the requirement that there must be several ways of accessing a website, resizing possibilities, sufficient contrast, and the use of links and labels. The requirements pertaining to navigability are intended to ensure content is accessible to many different user groups and will also make content more accessible to all, including people without disabilities.
Navigability as a whole is not regarded as a risk area, but challenges have been identified in several navigation-related areas, primarily contrast between the text and its background and the identification of links. In both these areas only 16 per cent of the web-based solutions met the requirements. The fact that more than one third of the websites supported only one means of navigation also represents a potential risk for many users. The same also applies to the requirement regarding information in and around search fields.
There was widespread compliance with the requirement regarding possibilities for content resizing, and good results were found for the formulation of links.
1.4 Varying results for keyboard navigation
It must be possible for people to reach and operate all the content on websites using only a keyboard. There are requirements regarding links to skip to the main content of a web page and clear visual focus indication of content that has been reached using the keyboard. This applies to all content types.
The Authority does not consider this topic as a whole to be a risk area, although varying results were found for keyboard navigation. Around three quarters of the websites analysed in this survey met the requirement that it must be possible to use all the content on the website using the keyboard alone, while a quarter did not. This may represent a major barrier that could prevent access by users who can only use a keyboard.
In addition, fairly poor results were found for the prevalence and positioning of keyboard skip links and visible keyboard navigation focus indicators. Significantly better results were found for the requirements regarding the operability of forms through a keyboard and absence of keyboard traps.

6
1.5 Forms
This topic partially overlaps with the other areas assessed in the survey and is discussed in connection with coding, navigability and keyboard navigation.
Overall the status survey did not find grounds to classify "forms" as a risk area. Most of the challenges we uncovered that are relevant to forms are related to navigability and coding. These are areas that we have already identified as digital barriers. Nevertheless, the Authority would emphasise that universally designed forms are a prerequisite for ensuring that self-service solutions are accessible to all. In this perspective "forms" are a potential risk area.
1.6 The public sector has the most accessible solutions
In general the public sector scored better in this status survey than the various private-sector industrial groups. The average result for the public sector is 54 per cent compliance, while the equivalent figure for the private sector is 49 per cent. Nevertheless, even though the public sector achieved higher scores on average, there are grounds to stress that there is considerable variation in the results among the various organisations and subgroups in the public sector.
The public sector is highly digitised. The Internet is now one of the most important channels for information, communication and provision of services to the population. Even though parts of the public sector achieved high scores in the status survey, this sector will nevertheless remain a priority area for Difi.
Ministries, directorates and inspectorates had the best results (61 per cent). Several of the large public-service producers in the central government sector also achieved good results. Indeed, 15 of the top 20 results in the status survey are public-sector bodies.
The municipalities and counties included in the survey achieved an average of 54 per cent of the total points available. There is broad variation in the results, and there does not seem to be any link between the size of the municipality and degree of universal design. Nor have any significant differences been found in the results between municipal and state bodies.
A number of organisations in the public sector face challenges in terms of universal design of ICT. Several of the municipalities, health-related organisations and county governor's offices have relatively poorly accessible solutions.
1.7 Greatest risk in the private sector
Banking and finance attained 45 per cent of the total points available. The banking and finance group achieved the weakest group result in the Authority's status survey. Banking and finance, which also includes insurance, has a high degree of digitised services aimed at the public. Since this group was found to have weaker results than other industries, the Authority finds that "banking and financial organisations" is a risk area.

7
Two of the industrial divisions in the private sector scored 50 per cent or more, namely wholesale & retail trade and the group that encompasses the primary industries, manufacturing, building & construction, power supply, etc.
The results for transport, travel, accommodation and food service are slightly below the average for the status survey (51 per cent). This group achieved a score of 48 per cent of the total points available. In light of the results of the status survey and considering that online solutions are often the main interface with the public, the Authority is going to continue to focus on the transport industry.
The status survey also revealed that media and information organisations have below average results in terms of universal design, with an average group score of 46 per cent.
2 The status survey
This chapter contains information about the background to and objectives of the status survey. An account is also provided of how the test sample was selected, how the survey was conducted and the analysis of the results.
Importance has been attached to keeping this part of the report concise; more detailed information can be found in the appendixes. See appendix 1 for a more detailed account of the selection of organisations and appendix 2 for an overview of which of the requirements in the WCAG 2.0 standard have been included in the survey. Appendixes 3 and 4 provide information on the survey execution methods and analysis of the results.
2.1 Regulations governing universal design of ICT
The Norwegian Anti-Discrimination and Accessibility Act2 lays down requirements regarding universal design of information and communication technology (ICT). The purpose of the Act is to promote equality and ensure equal opportunities in and rights to social participation for everyone, irrespective of ability, and to prevent discrimination based on disability. The Act is intended to help dismantle disabling barriers created by society and prevent new ones from being created.
The Regulation for universal design of information and communication technology (ICT) solutions was adopted in pursuance of section 14 of this Act. The Regulation specifies standards that have been defined as minimum requirements for web-based solutions and ICT-based self-service devices (e. g. ticket machines). Net-based solutions are also subject to the requirements in the Web Content Accessibility Guidelines (WCAG) 2.0. This is discussed in more detail in chapter 3. The rules and regulations currently apply to web-based solutions that were acquired or substantially upgraded after 1 July 2014.
2 Act no. 61 of 21 June 2013 relating to a prohibition against discrimination on the basis of disability (the Anti-discrimination and Accessibility Act)

8
The universal design of ICT is a broad-reaching subject. In legal terms an ICT solution is universally designed if it has been designed in accordance with the minimum requirements defined in the Regulation. The status survey that the Authority conducted in the period September 2014 to January 2015 uses this approach to the concept of universal design of ICT.
2.2 The objective of the survey
It follows from the Authority's strategy for 2014–153 that the Authority's mission is to:
• promote equal digital participation in society • dismantle and prevent new digital barriers • help prevent discrimination
The Authority will focus its exercise of authority, information work and guidance on areas that are regarded as critical to ensure equal social participation. To identify these kinds of risk areas, we conducted a status survey of universal design on a sample of web-based solutions, as discussed in this report. The purpose of the survey is to provide information on digital barriers that users encounter in everyday life and that fall under the Authority's supervision. In addition to providing information on the universal design status of online solutions, the survey will also provide the Authority with useful experience in carrying out volume surveys.
The risk assessments that the Authority undertook in connection with this status survey were also used as the basis for the selection of topics in connection with supervision, even though most of the web-based solutions included in the survey are not yet subject to universal design requirements, as they were acquired before 1 July 2014.
The information we collected in connection with the status survey has been used for statistical and analytical purposes. We will not use the information to identify potential objects for inspection. The results from the survey were anonymised before publication.
2.3 Selection of organisations / web-based solutions for inclusion in the survey
The survey was carried out on a sample of 304 organisations: 178 in the private sector and 126 in the public sector. The sample of organisations is intended to ensure the best possible information on the universal design status of ICT solutions in the Authority's priority areas. The priority areas were defined in the Authority's strategy for 2014–2015, based on an assessment of which societal areas and industries have:
• services that are particularly important to ensure equal social participation • a high volume of users of ICT solutions
3 Supervision Strategy 2014–2015. Authority for Universal Design of ICT in Norway
9
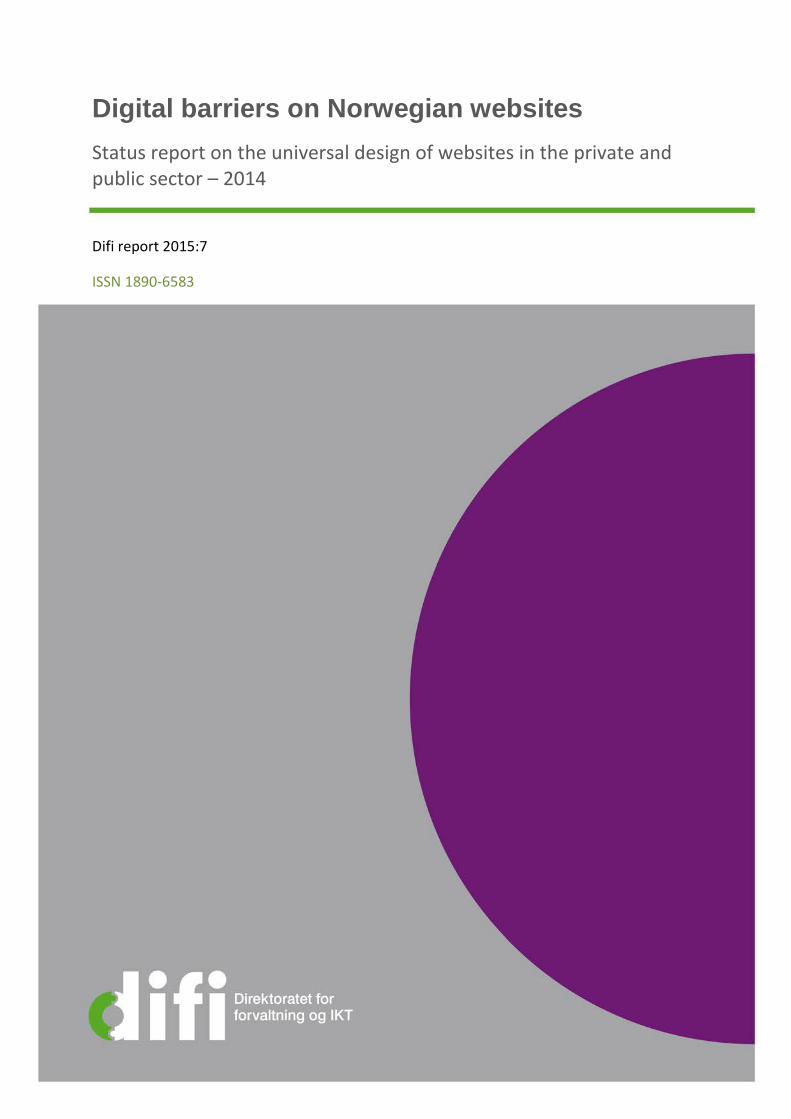
Based on these assessments, the Authority has decided to give priority to monitoring public services, banking and financial services, and transport and travel. These industries were therefore weighted more heavily in the survey. Accessible digital solutions for information and communication services are also important from a user perspective. Media organisations were therefore also a focus area in the survey.
Based on the Standard Industrial Classification4 (SN2007) the organisations have been categorised into industrial groups at the aggregate level, as set out in the table below.
Table 1: The organisations in the sample classified into main categories of industrial groups
Group Contents Number of organisations in the sample
Group 1 Agriculture, forestry & fishing. Mining and quarrying. Manufacturing. Electricity, gas, steam and air conditioning supply. Water supply; sewerage, waste management and remediation activities. Construction.
20
Group 2 Wholesale & retail trade. Repair of motor vehicles and motorcycles. 34 Group 3 Transportation and storage. Accommodation and food service activities. 40 Group 4 Information and communication. Arts, entertainment and recreation. 36 Group 5 Financial and insurance activities. Real estate activities. Administrative
and support service activities. Other service activities. 48
Group 6 Public administration. Human health and social work activities, etc. 126 TOTAL 304
2.4 Methods for measuring and analysing results
The survey was carried out on the basis of the requirements for web-based solutions derived from the Web Content Accessibility Guidelines (WCAG) 2.0. The Authority developed indicators for measuring universal design of ICT by operationalising the mandatory requirements stipulated in the standard. The test topics, test procedures and assessment criteria comply with the techniques referred to in WCAG 2.05.
The processing of the material focused largely on descriptive statistics with frequency tables and assessments of prevalence. Statistical methods were also used to compare results across industrial groups, topics and indicators.
The results for the individual indicator and topic were measured as a percentage of the tests that met the requirements and the percentage that did not comply fully with the requirements. In comparisons of the results for the various sectors / industrial groups, we give the score as the points awarded as a percentage of the total points available.
4 http://stabas.ssb.no/ItemsFrames.asp?ID=8118001&Language=nb
5 http://www.w3.org/WAI/WCAG20/quickref/

10
2.5 Risk assessment
The survey was designed to enable us to identify risk areas as far as is possible. Our assessment of the risks builds on both the scope of the non-compliances / digital barriers that were identified and the consequences that the non-compliances may have for the various user groups or characteristics. The user characteristics we looked at in this survey are related to vision, dexterity and cognition.
The performance indicators have been grouped according to topic. The Authority categorised an area as a risk area if we consistently found relatively major non-compliances with the indicators included for a particular topic, for example, that more than 50 per cent of the web-based solutions did not comply with the requirements for a particular indicator. Once a risk area was identified, the consequences of non-compliance were assessed using professional judgement.
Risk was rated higher if failure to comply with the requirements would have consequences for large groups of users or profoundly affect the degree to which a web-based solution was even accessible to users with disabilities. If a non-compliance was considered to be decisive for the usability of a web-based solution (for example, accessibility using a keyboard), the area was categorised as high-risk even if more than 50 per cent of the organisations had solutions that satisfy the requirements.
In cases where we found varying results within a single topic, i.e. the majority of the web-based solutions satisfied the requirements relating to some indicators, while major non-compliance was found for other indicators, we categorised the area as partially high-risk.
3 Topics in the status survey
3.1 Web Content Accessibility Guidelines, version 2.0
The topics assessed in this survey are based on a sample of the requirements that apply to web-based solutions through the Norwegian Regulation for universal design of information and communication technology (ICT). This regulation stipulates that all web-based solutions that are procured or substantially upgraded after 1 July 2014 must as a minimum be designed in compliance with the standard Web Content Accessibility Guidelines 2.0 (WCAG) 2.0, with some exceptions.
WCAG 2.0 has a hierarchical structure with four principles, followed by 12 guidelines linked to the overarching principles. All four principles are represented in the survey.
The four principles of WCAG 2.0 are:
1. Principle 1: Perceivable – Information and user interface components must be presentable to users in ways they can perceive.
2. Principle 2: Operable – User interface components and navigation must be operable.
11
3. Principle 3: Understandable – Information and the operation of user interface must be understandable.
4. Principle 4: Robust – Content must be robust enough that it can be interpreted reliably by a wide variety of user agents, including assistive technologies.
WCAG 2.0 also contains success criteria linked to each of the guidelines, which are formulated as verifiable technology-independent statements. The 61 success criteria (individual requirements) are classified into three levels of conformance: A, AA and AAA. The Norwegian Regulation for universal design of information and communication technology (ICT) solutions stipulates that all the requirements at A and AA level must be met, with the exception of one requirement at A level and two at AA level. Pursuant to the regulation, a total of 35 of the 61 success criteria in WCAG 2.0 are obligatory in Norway.
WCAG 2.0 also refers to a number of sufficient and advisory techniques for how content on websites can be made more accessible. Following these guidelines will make content accessible to a wider range of people with disabilities, including blindness and low vision, deafness and hearing loss, learning disabilities, cognitive limitations, limited movement, speech disabilities, photosensitivity and combinations of these. Following these guidelines will also often make web content more usable to users in general.
3.2 Topics and indicators included in the survey
Below is a presentation of the topics and indicators included in the survey. Appendix 2 contains an overview of which of the WCAG 2.0 success criteria were included in the status survey.
The performance indicators have been categorised into five topics:
1. Text alternatives (1 indicator) 2. Coding of web-based solutions (7 indicators) 3. Navigability (6 indicators) 4. Keyboard navigation (6 indicators) 5. Forms (5 indicators)
Note that a single indicator may be included in several topics; for example, the coding of form controls is included in two topics: coding and forms. Similarly the requirement that it must be possible to operate all content through a keyboard is also included in two topics: keyboard operability and forms. The other topics are mutually exclusive. The table below shows which performance indicators are included in the survey and how the indicators are grouped by topic.

12
Table 2: Overview of the indicators in the status survey, ranked by topic.
Ref. to WCAG Indicators 1. Text alt. 2. Coding 3. Navig-
ability
4. Keyboard navigation
5. Forms
1.1.1 Text alternatives for images X 1.3.1 Headings are coded with correct
markup X
1.3.1 Headings are coded with the correct
nesting level X
1.3.1 Data tables are coded with correct
markup X
1.3.1 Data tables have correctly defined
header cells X
1.3.1 Form controls have correct markup X X 1.3.1 Search fields have correct markup X
4.1.1 The code does not contain syntax errors X
3.3.2 Search fields have instructions or labels. X
2.4.4 Purpose and function of links are understandable
X
1.4.1 Links are distinguishable from headings and body text
X
1.4.3 There is sufficient contrast between text and its background
X
1.4.4 Text can be resized without loss of content or functionality
X
2.4.5 There are multiple ways of navigating the website
X
2.1.1 All content can be operated through a keyboard
X X
2.1.2 No keyboard traps X 2.4.1 There is a link to skip to the main
content of a web page X
2.4.1 The skip link has a visible focus
indicator X
2.4.7 Links and form controls have a
visible focus indicator X X
3.2.2 Selecting form controls through keyboard has predictable effects
X X
2.4.6 Form controls have descriptive instructions / labels
X
No. of indicators included in the topic 1 7 6 6 5

13
4 Result: Status of digital barriers on Norwegian websites
In this chapter we present the results from the status survey specified according to the topics listed in chapter 3. We have focused on the following aspects in this presentation:
• The content of the requirements in each individual area, the Authority's interpretation and operationalisation of the requirements, and how the tests and assessments were carried out
• The results of the tests and assessments – the degree of non-compliance – within each individual topic and the indicators pertaining to the topic
• Possible consequences of non-compliance with the requirements (i.e. the results of the survey) for various user groups or characteristics
The combined results from the status survey can be illustrated in several ways. The scores achieved can be presented as a percentage of the total points available for each website. We use this method when we look at the results for each individual website or each of the industrial divisions.
Alternatively, we can show how large a percentage of the indicators and tests demonstrated full compliance6 with the requirements laid down in the standard and how large a share of the tests revealed some degree of non-compliance. We use this method to compare the results for each of the success criteria / indicators and to make comparisons across topics.
Overall, the Authority has awarded about half (50.5 per cent) of the total points available in the status survey. There is wide variation in the results, among the individual organisations / websites, industrial groups, indicators and topics, with scores ranging from 18 to 78 per cent for some individual organisations.
Below we present the results for each topic assessed in the status survey.
4.1 Text alternatives for images and diagrams – a risk area
WCAG 2.0 requires that illustrations that convey meaning shall have a descriptive text alternative ("alt-text") that the user can have read aloud. The requirements are that:
• The text should provide a precise, brief description of the content of the image or illustration
• For more complex illustrations, such as organisation charts and diagrams, in addition to the alt-text there must be more detailed information about the content of the image, either on the same page as the image, or via a link to another page
• For illustrations that are linked, the alt-text must describe the link destination
6 The results were measured using a scale from 0 to 3 points. 3 points were awarded for full compliance. 0, 1 and 2 points indicate varying degrees of non-compliance.
14
• Images that are not essential for understanding and making sense of the content, such as logos and decorative elements, shall have empty alt-text fields. The reason for this is to ensure that irrelevant information is not read aloud to the user
The requirement for text alternatives follows from WCAG 2.0, success criterion 1.1.1, which with certain exceptions states that "All non-text content that is presented to the user has a text alternative that serves the equivalent purpose."
Text alternatives for images are essential to enable, for example, blind users who use a screen reader or Braille display to access the content. People with reading and writing difficulties and people with other cognitive challenges can also benefit greatly from having the content of websites read aloud. This requirement is thus important for very many users. It should also be emphasised that the requirement of text describing complex illustrations, such as data charts, benefits all users.
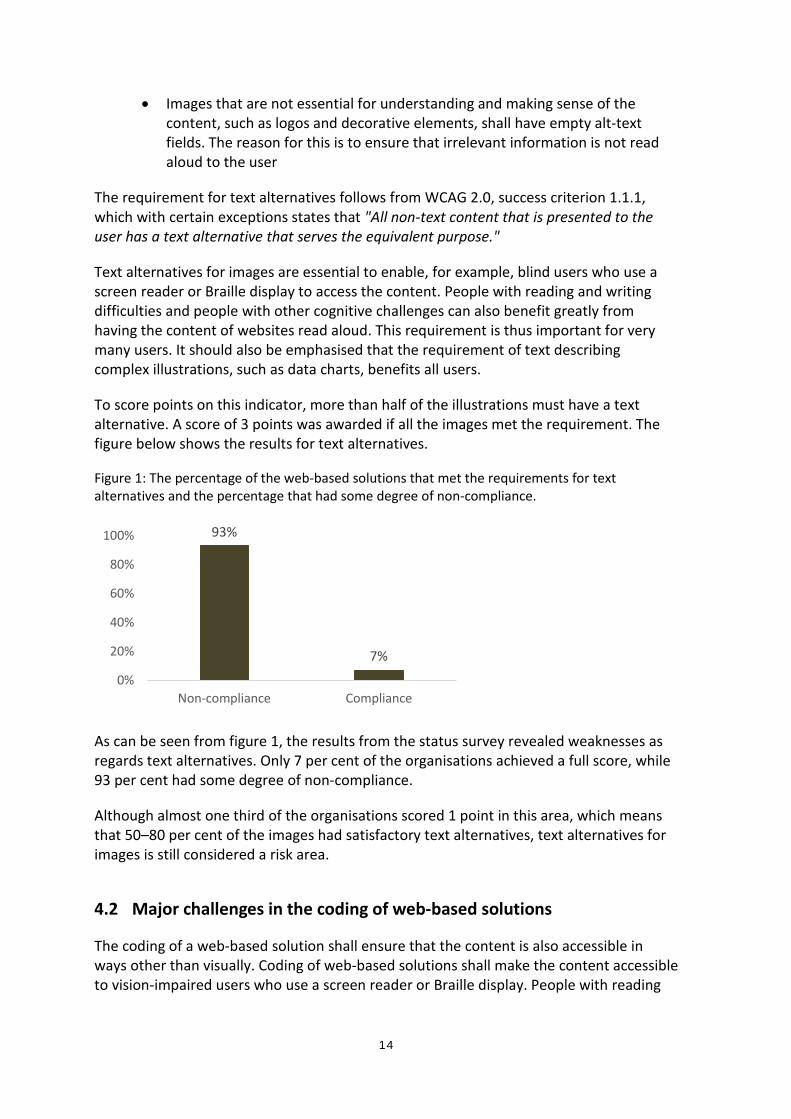
To score points on this indicator, more than half of the illustrations must have a text alternative. A score of 3 points was awarded if all the images met the requirement. The figure below shows the results for text alternatives.
Figure 1: The percentage of the web-based solutions that met the requirements for text alternatives and the percentage that had some degree of non-compliance.
93%
7%
0%
20%
40%
60%
80%
100%
Non-compliance Compliance
As can be seen from figure 1, the results from the status survey revealed weaknesses as regards text alternatives. Only 7 per cent of the organisations achieved a full score, while 93 per cent had some degree of non-compliance.
Although almost one third of the organisations scored 1 point in this area, which means that 50–80 per cent of the images had satisfactory text alternatives, text alternatives for images is still considered a risk area.
4.2 Major challenges in the coding of web-based solutions
The coding of a web-based solution shall ensure that the content is also accessible in ways other than visually. Coding of web-based solutions shall make the content accessible to vision-impaired users who use a screen reader or Braille display. People with reading

15
and writing difficulties and people with other cognitive challenges may also benefit from having the content of websites read aloud.
The topic "coding of web-based solutions" is covered by two of the success criteria included in the survey: 1.3.1 and 4.1.1. These criteria define both requirements regarding the coding of different types of content and requirements regarding the proper use of code. The content types assessed in this survey are headings, data tables, form controls and search fields. Figure 2 presents an overview of the combined results for code-related indicators.
Figure 2: Percentage of the organisations that achieved a full score on code-related indicators.
2%
12%
20%
33%
44%
46%
91%
0% 20% 40% 60% 80% 100%
Data tables are coded with correct markup
Code validation (W3C)
Headings are coded with the correct nesting level
Form controls have correct markup
Headings are coded with correct markup
Search fields have correct markup
Data tables have correctly defined header cells
Figure 2 shows broad variation in the results for the code-related indicators. With the exception of coding of tables, the overall impression was that only a minority of the websites were coded in accordance with the WCAG 2.0 requirements.
Coding errors were relatively widespread (assessed by code validation). In addition, there was far too little structural markup (coding) of content of the types headings, form controls, search fields and table content (row labels and column headings).
Based on the results for the code-related indicators and in view of the user groups whose interests the coding requirements are intended to safeguard, the Authority regards this as the main risk area revealed by the survey.
In the following section we will look more closely at the results from the status survey for coding of web-based solutions. See appendix 4 for more detailed information on how coding was tested in the survey.
4.2.1 Coding of different types of content elements
Success criterion 1.3.1 in WCAG 2.0 states: "Information, structure and relationships conveyed through presentation can be programmatically determined or are available in text." The aim is that the content of the website shall be accessible in other ways than through visual expression alone. To enable this, the content must be programmed in accordance

16
with the visual appearance, i.e. that elements that look like headings on the website are also coded as headings, for example.
This success criterion is extremely far-reaching and complex and applies to most content types. It should be noted that Difi will monitor compliance with this requirement more closely in connection with its exercise of supervisory authority; in this status survey we have simply selected a sample of topics / performance indicators that can be verified relatively quickly and easily.
4.2.1.1 Markup of headings
Verification of compliance with the coding requirements consists of an initial visual assessment of the page to identify visual headings, followed by a check to see if they are also coded as headings. To get a full score on this indicator, all visual headings must also have correct markup, i.e. be coded as headings. In addition, there must not be other content that is coded as a heading that does not look like a heading on the web page. It is also a requirement that the visual heading hierarchy is reflected in the markup, so that headings are read aloud in the right order.
The results for markup of visual headings and heading hierarchy ("nesting") are presented in the figure below.
Figure 3: The percentage of the web-based solutions that met the requirements for coding of headings and the percentage that had some degree of non-compliance.
80%
20%
56%44%
0%
20%
40%
60%
80%
100%
Non-compliance Compliance
Headings are coded with correctmarkup
Headings are coded with thecorrect nesting level
Figure 3 shows that 20 per cent of the organisations were awarded a full score (3 points) for markup of visual headings, while 80 per cent had varying degrees of non-compliance. Approximately 40 per cent of the organisations scored 0 points for markup of headings.
The results were slightly better for heading hierarchy. Here we only tested headings that were coded as headings, and checked whether they were coded at the correct nesting level. Just under half (44 per cent) were coded correctly in terms of hierarchy, while over a quarter (27 per cent) scored 0 points for heading hierarchy.

17
In view of the fact that a large majority of the web-based solutions have different types of challenges in terms of coding of headings, the Authority considers coding of headings to be a risk area.
4.2.1.2 Markup of data tables
A data table is information that is structured into rows and/or columns, where the information in each cell can be linked to a row label and/or a column heading. Layout tables were not tested as tables in this context. We also made exceptions for small tables containing, for example, contact information, and menus and submenus.
Compliance with the requirement for markup of data tables was measured in two ways. We checked whether data presented in table format was coded as a table and whether the column headings and/or row labels were correctly coded as heading cells. The results are presented in the figure below.
Figure 4: Percentage of the web-based solutions that achieved a full score or had non-compliances for the indicators relating to markup of tables.
9%
91%98%
2%0%
20%
40%
60%
80%
100%
Non-compliance Compliance
Data tables are coded withcorrect markup
Data tables have correctlydefined header cells
As can be seen from figure 4, there were widely divergent results for the two indicators that measure markup of data tables. Nearly all (91 per cent) of the tables we assessed were coded as tables, whereas only 2 per cent have table content correctly coded in the form of row labels and column headings. See appendix 4 to this report for more information on the testing of data tables.
Correct markup of tables, and particularly the content of data tables, is very important for people who depend on having content read aloud. For example it is very difficult to orient oneself in a timetable if the content is not read in a structured manner.
Based on the results for the indicator to measure coding of content in tables, the Authority finds it necessary to review both the testing methods and the criteria for evaluation of the test results for this indicator next time we revise the set of indicators. Despite this, we nevertheless find grounds to conclude that coding of tables, and particularly table content, is a risk area.
18
4.2.1.3 Markup of form controls and search fields
Search fields and form controls were tested in much the same way7. We have therefore chosen to present the results for these two indicators together.
It is a requirement that form elements are correctly coded so that the user is informed about each individual element in the form. The labels must be linked to the relevant form element, so that users who use text-to-voice tools can identify which label belongs to which element in the form. In addition, the code must contain information about the function of each individual form element. Coding of form controls is also important to ensure maximum clickable area, which makes a huge difference to people with reduced dexterity.
To get a full score (3 points), all the inspected form controls must have correct markup. This applies to text fields, radio buttons, check-boxes and drop-down menus alike.
With regard to search fields, we considered both search boxes and search buttons, or any other tool provided to start a search. It must be clear that the field is a search field. It is also a requirement that the search field must have a label that is both correctly bound to the search field and specifies that this is a search feature. Search buttons or equivalent tools to start the search can be coded in a number of different ways.
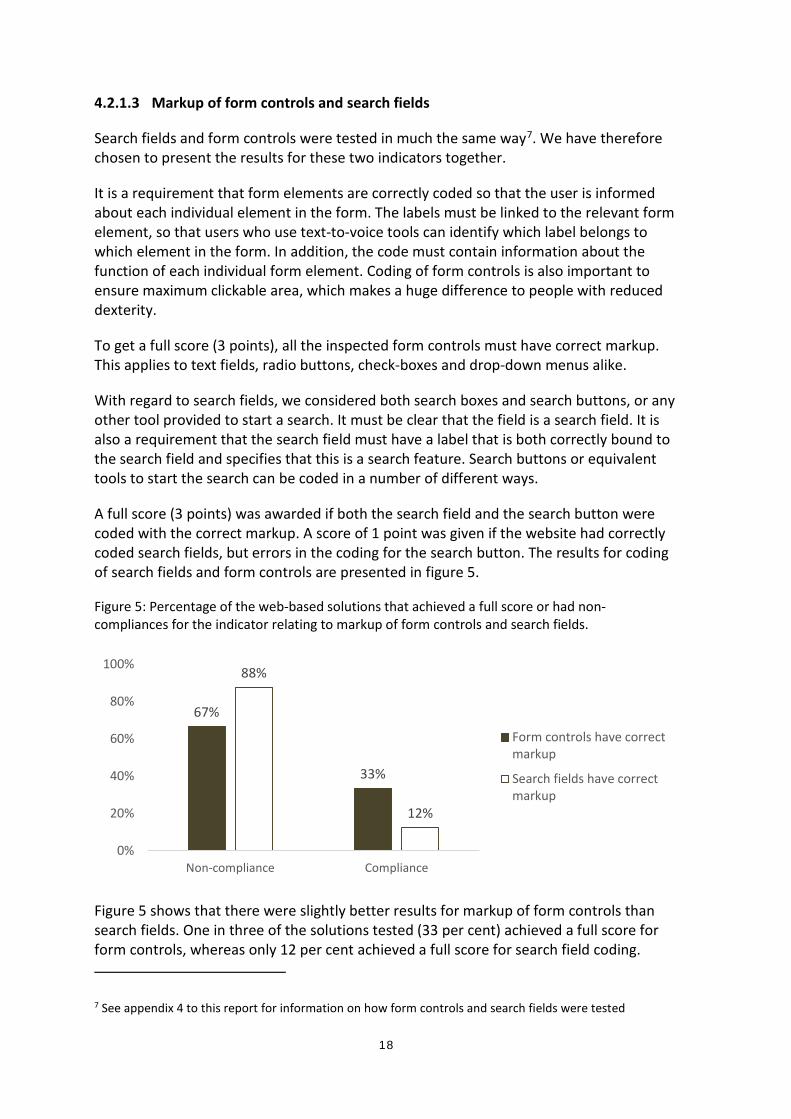
A full score (3 points) was awarded if both the search field and the search button were coded with the correct markup. A score of 1 point was given if the website had correctly coded search fields, but errors in the coding for the search button. The results for coding of search fields and form controls are presented in figure 5.
Figure 5: Percentage of the web-based solutions that achieved a full score or had non-compliances for the indicator relating to markup of form controls and search fields.
67%
33%
88%
12%
0%
20%
40%
60%
80%
100%
Non-compliance Compliance
Form controls have correctmarkup
Search fields have correctmarkup
Figure 5 shows that there were slightly better results for markup of form controls than search fields. One in three of the solutions tested (33 per cent) achieved a full score for form controls, whereas only 12 per cent achieved a full score for search field coding. 7 See appendix 4 to this report for information on how form controls and search fields were tested
19
Some 88 per cent of the web-based solutions had varying degrees of non-compliance with the requirements regarding markup of search fields, while 82 per cent received 0 points on this indicator. For markup of form controls, two out of three websites (67 per cent) had some degree of non-compliance.
Despite the rather variable results for search fields and form controls, both areas were defined as risk areas.
4.2.2 Correct use of code (avoid syntax errors)
The requirement for correct semantics in the coding of a web-based solution follows from WCAG 2.0, success criterion 4.1.1: "In content implemented using markup languages, elements have complete start and end tags, elements are nested according to their specifications, elements do not contain duplicate attributes, and any IDs are unique, except where the specifications allow these features."
Compliance with this requirement was verified using W3C's8 markup validator. The following searches were performed9:
• Incorrect nesting of elements • Elements that are not ended properly • Elements with several duplicate attributes • Whether an ID has been used for several elements
This requirement is key to enable use of assistive technology to access information and functionality on web-based solutions. This applies in particular to blind people and people with severe visual impairments who use a screen reader or Braille display, people with reading and writing difficulties and others who use text-to-voice software.
To get a full score (3 points), a website must not have any of the failures listed in the previous paragraph. If non-compliances were found for more than 15 per cent of the inspected code elements, a score of 0 points was awarded. The results for the validation of code are presented in figure 6.
8 W3C stands for the World Wide Web Consortium, an international standardisation organisation for the Internet 9 See appendix 1 for information on which aspects were given weight in connection with the validation of code

20
Figure 6: Percentage of the organisations that achieved a full score or had non-compliances for inspection of code.
54%46%
0%
20%
40%
60%
80%
100%
Non-compliance Compliance
Figure 6 shows that markup errors were found in over half (54 per cent) of the web-based solutions tested. Some 46 per cent of the web-based solutions were validated without error. A closer study of the material revealed that as many as 37 per cent of the websites tested had non-compliances on more than 15 per cent of the tests. This means that more than one third of the web-based solutions scored 0 points in this test. The results thus show relatively broad variation.
When we compare the results for this indicator with other code-related indicators related to headings, search features, form controls and data tables, the Authority finds grounds to identify coding of web-based solutions as the largest risk area. This is primarily related to the results of the tests performed on the web-based solutions, but also partly because good quality coding of web-based solutions is important for user groups who are particularly vulnerable in terms of digital participation.
4.3 Varying results for navigability
Within the overarching topic navigability, importance was attached to testing and evaluating the following:
• whether it is possible to enlarge a web page without content and/or functionality being hidden
• whether link texts are formulated in compliance with the requirements in WCAG 2.0
• whether links are identified in such a way that they are distinguishable from headings and body text
• whether there is sufficient contrast between text and its background in various content elements
• whether there are multiple possibilities for navigating a website, for example, menu, search and site map
• labels in connection with search functions
Figure 7 presents an overview of the combined results for navigability.

21
Figure 7: Percentage of the organisations that achieved a full score on navigation-related indicators.
16%
16%
43%
63%
72%
81%
0% 20% 40% 60% 80% 100%
Links are distinguishable from headings and bodytext
There is sufficient contrast between text and itsbackground
Search fields have instructions or labels
There are multiple ways of navigating the website
Purpose and function of links are understandable
Text can be resized without loss of content orfunctionality
Figure 7 shows broad variation in the results for navigability. There is widespread compliance with the requirement regarding content resizing possibilities, with 81 per cent achieving a full score. We also found fairly good results for link texts (the purpose and function of links). Here 72 per cent received a full score.
A total of 63 per cent of the web-based solutions offer several ways to navigate the site. There is wide variation in the user requirements for the web-based solutions. The fact that more than one third of the websites only have one means of navigation may represent a digital barrier for many users. We measured relatively weak results for the requirement regarding information in and around search fields: 43 per cent of the tests found compliance with WCAG 2.0. This requirement is intended to protect the interests of the same user groups that are targeted by the requirements regarding contrast and link identification.
Two areas related to navigability appear to be particularly high-risk areas: contrast between text and its background and the identification of links so that they are distinguishable from headings and body text. In both these areas only 16 per cent of the web-based solutions met the requirements. These requirements are intended to make content accessible to people with low vision, people with colour blindness, people with reduced dexterity, people with reading and writing difficulties, people with memory problems, people with concentration problems and people with other cognitive challenges. Contrast and link identification also serve to make content more accessible to all groups, whether they have a disability or not.
Overall the Authority categorises several areas related to navigability as high-risk, primarily contrast, link identification and information about search options.
The results for the individual indicators linked to the topic "navigability" are presented below.

22
4.3.1 Links distinguishable from headings and body text
The requirement that links should be easily distinguishable from other content is derived from success criterion 1.4.1 of WCAG 2.0, which states that "Color is not used as the only visual means of conveying information, indicating an action, prompting a response, or distinguishing a visual element."
In the status survey we restricted our tests in this area to verifying the extent to which links were distinguished from headings and body text by means other than colour alone. Means of identifying links other than colour include underlining, bold, using a different font, icons or symbols. Links can also be identified through contrast between the link and the text of a ratio of 3:1, combined with mouseover effects and visible keyboard focus.
To achieve a full score (3 points) on this indicator, all the inspected links must be identified by some means other than colour, and the method used to identify links must not be used for any other content. We have interpreted this requirement quite strictly and required that a minimum of 80 per cent of the links are satisfactorily identified to get any points. If fewer than 80 per cent of the links are adequately identified, the organisation was given a score of 0 points on this indicator. The results for identification of links are presented in figure 8.
Figure 8: Percentage of the web-based solutions that achieved a full score or had non-compliances for the indicator relating to the identification of links.
84%
16%
0%
20%
40%
60%
80%
100%
Non-compliance Compliance
Figure 8 shows that 16 per cent of the organisations identified links in accordance with the requirement, while 84 per cent had varying degrees of non-compliance. Slightly fewer than 79 per cent of the organisations received 0 points, while 6 per cent received 1 point.
This success criterion is intended to make content accessible to people with low vision, people with colour blindness, people with reduced dexterity, people with reading and writing difficulties, people with memory problems, people with concentration problems and people with other cognitive challenges. Link identification is also important to be able to see what is clickable and to ensure that the web-based solutions are predictable in use. Satisfactory link identification thus helps make content more accessible to all groups, whether they have a disability or not.
Based on the results for this indicator and the scope of the user groups whose interests it is intended to safeguard, the Authority considers link identification to be a risk area.

23
4.3.2 The purpose of links is understandable
Success criterion 2.4.4 of WCAG 2.0 requires that "The purpose of each link can be determined from the link text alone or from the link text together with its programmatically determined link context, except where the purpose of the link would be ambiguous to users in general."
In the status survey the Authority tested a sample of links in body text. It was considered whether the link text alone, or the link text combined with the preceding heading and surrounding text are adequate to enable the user to understand the purpose of the link. In its exercise of supervisory authority Difi would also consider exceptions from the requirement, as defined in success criterion 2.4.4. For reasons of practicality, however, exceptions were not made in the status survey.
A full score (3 points) was given if the purpose and function of all the tested links was understandable from the link text, or link text combined with the context. A score of 1 point was awarded if 80 per cent of the links tested met the requirement. If non-compliance was found for more than 20 per cent of the links, a score of 0 points was awarded.
This requirement is very important for many user groups and is intended to safeguard the needs of blind people or people with severe visual impairments who use a screen reader or Braille display, people with reading and writing difficulties, people with memory or concentration problems and people with other cognitive challenges. Understandable link texts also improve the usability of the solutions for everyone, regardless of whether they are disabled or not. The results of the tests of link purpose are presented in figure 9.
Figure 9: Percentage of the web-based solutions that achieved a full score or had non-compliances for formulation of link purpose.
28%
72%
0%
20%
40%
60%
80%
100%
Non-compliance Compliance
Figure 9 shows that almost three quarters (72 per cent) of the organisations received a full score on the test of link purpose. This is an excellent result that will benefit large groups of users.
4.3.3 Sufficient contrast between text and its background
The requirement regarding minimum contrast is derived from success criterion 1.4.3 in WCAG 2.0, which states that "The visual presentation of text and images of text has a

24
contrast ratio of at least 4.5:1 (...) Large-scale text and images of large-scale text have a contrast ratio of at least 3:1."
Large-scale text is defined as text that is at least 24 pixels high or at least 19 pixels high in bold. Logos, text or images of text that are purely for decoration are not subject to these contrast requirements.
To get a full score (3 points) on this indicator, all the test objects must have adequate contrast between text and the background in normal view. One point was awarded if at least 80 per cent of the content items had adequate contrast.
Contrast is important for all users when navigating websites, but particularly so for people with low vision, people with colour blindness, people with reduced dexterity, people with reading and writing difficulties, people with memory problems, people with concentration problems and people with other cognitive challenges. The results for contrast are presented in figure 10.
Figure 10: Percentage of the web-based solutions that achieved a full score or had non-compliances for contrast.
84%
16%
0%
20%
40%
60%
80%
100%
Non-compliance Compliance
As can be seen from figure 10, most of the tested websites had significant challenges in terms of contrast between text and its background. Only 16 per cent of the websites had adequate contrast on all the tested content, while 84 per cent had some degree of non-compliance. More than half (53 per cent) scored 0 points, and just under one third (30 per cent) received one point. To get one point on this indicator, minimum 80 per cent of the tested content must have contrast that satisfies the requirements defined in WCAG 2.0.
In light of the widespread challenges linked to contrast detected in the survey and the fact that this requirement is intended to safeguard the interests of large groups of users, the Authority defines contrast on websites as a risk area.
4.3.4 Text can be resized without loss of content or functionality
The requirement that it must be possible to resize the content on websites without loss of content or functionality ensues from success criterion 1.4.4 in WCAG 2.0: "Except for captions and images of text, text can be resized without assistive technology up to 200 percent without loss of content or functionality."

25
Compliance with this requirement was tested by setting the browser window size to 800 x 600 pixels and then enlarging the content to 200 per cent. The presentation on the page was then compared with that in normal view.
A full score (3 points) was awarded if all functionality and content were available in the resized view. It is also a requirement that the content should not cover other content or cause any menus, text, etc. to disappear from view. There must also be access to horizontal scrolling if necessary. Adaptations for mobile devices and responsive design were approved, as long as all important content was accessible to the user.
This is an "either/or" requirement, i.e. any web-based solution that did not meet the requirements to achieve 3 points was given 0 points. This requirement is essential for people with low vision; however, other users will also benefit from being able to enlarge the content on a web page without loss of content or functionality to enable more accurate navigation. Examples include people with reduced dexterity or other motor challenges. The results for resizing possibilities are presented in figure 11.
Figure 11: Percentage of the web-based solutions that achieved a full score or had non-compliances on testing of possibility to resize text without loss of content or functionality.
19%
81%
0%
20%
40%
60%
80%
100%
Non-compliance Compliance
As can be seen in figure 11, the tested websites had good possibilities for resizing content. An impressive 81 per cent of the websites achieved a full score on this indicator. In addition to this requirement's user groups, resizing possibilities also help make websites more accessible to all, including people without disabilities.
4.3.5 There are several ways of getting to a web page
The requirement that there must be several ways of reaching a web page is based on the fact that people have very different user requirements. WCAG 2.0, success criterion 2.4.5, reads: "More than one way is available to locate a Web page within a set of Web pages, except where the Web Page is the result of, or a step in, a process".
This requirement makes web-based solutions more accessible to all users, with a particular focus on the needs of blind people, people with low vision, people with reduced dexterity, people with reading and writing difficulties, people with memory problems, people with concentration problems and people with other cognitive challenges.

26
Compliance with this requirement was tested by mapping the extent to which the following were available:
• Menu • Search field or link to a search feature • Table of contents listing all content on the website in alphabetical order, or a link
to a table of contents • Link to a site map
A full score (3 points) was awarded if at least two of the means of navigation listed above were present. If there was only one way to navigate, the website was given 0 points. The results for navigation options are presented in figure 12.
Figure 12: Percentage of the web-based solutions that achieved a full score or had non-compliances for navigation possibilities.
37%
63%
0%
20%
40%
60%
80%
100%
Non-compliance Compliance
Figure 12 shows that 63 per cent of the organisations tested had at least two different ways for users to navigate their website. This is a significantly better result than we found for several of the other navigation-related indicators. We nevertheless find that there are grounds to underline that more than one third (37 per cent) of the tested solutions only had one or no navigation functionality. Based on this and the number of users whose needs this requirement is intended to serve, the Authority will define navigation options on websites as a possible risk area.
4.3.6 Labels in search fields
WCAG 2.0, success criterion 3.3.2 a, states: "Labels or instructions are provided when content requires user input." In the status survey we have chosen to focus on search fields in connection with our verification of compliance with this requirement.
This requirement is intended to safeguard the needs of a variety of user groups, such as blind people, people with low vision, people with reading and writing difficulties, people with memory or concentration problems and people with other cognitive challenges. Labels in search fields also help make web-based solutions more user-friendly for all users, whether they have a disability or not.
Compliance was tested by means of a visual inspection of the online solutions to see whether the pages had visible information identifying search fields, for example a

27
magnifying glass. This information may be in the form of text stating that the field is a search field, a search button labelled "Search" or a text that appears in the search box before the user clicks on the field (a "placeholder"). The information may also take the form of an image that indicates that the field is a search field.
The results for labels in search fields are presented in figure 13.
Figure 13: Percentage of the web-based solutions that achieved a full score or had non-compliances for labels in search fields.
57%43%
0%
20%
40%
60%
80%
100%
Non-compliance Compliance
Figure 13 shows that less than half (43 per cent) of the web-based solutions had labels in search fields that comply fully with the requirement. To get a full score (3 points) on this indicator, there must be text stating that the field is a search field, and this text must be linked directly to the search field and be available elsewhere, for example linked to the search button. This is to make sure the text does not disappear when the user navigates to or clicks on the search field.
In all, 57 per cent of the tested solutions had some degree of non-compliance with this requirement (i.e. they received a score of 2, 1 or 0 points). 10 per cent of the websites scored 0 points. A score of 0 points means there was no text identifying the search field or there was only an image to indicate that the field is a search field.
Accessible search features are essential to enable users to search for information efficiently. Given that less than half of the web-based solutions meet this requirement, "label in search fields" is considered to be a risk area. This is primarily due to the survey results for this indicator, but the assessment of the risk is also linked to the results for other performance indicators such as markup of search fields and multiple navigation possibilities.
4.4 Varying results for keyboard navigation
The topic keyboard navigation too includes several performance indicators. These are largely overlapping and mutually dependent, meaning it is only by considering them together that we can gain an impression of the current status with regard to keyboard navigation.
28
The status survey considered the following factors in connection with keyboard navigation:
• whether all content can be accessed and operated through a keyboard, and whether there are any so-called keyboard traps on the page making it difficult or impossible for users to navigate to and from various content components
• whether there are links to skip to the main content of a web page, and whether these are visible when they are in focus
• links and form controls have a visible focus indicator • selecting form controls through keyboard has predictable effects
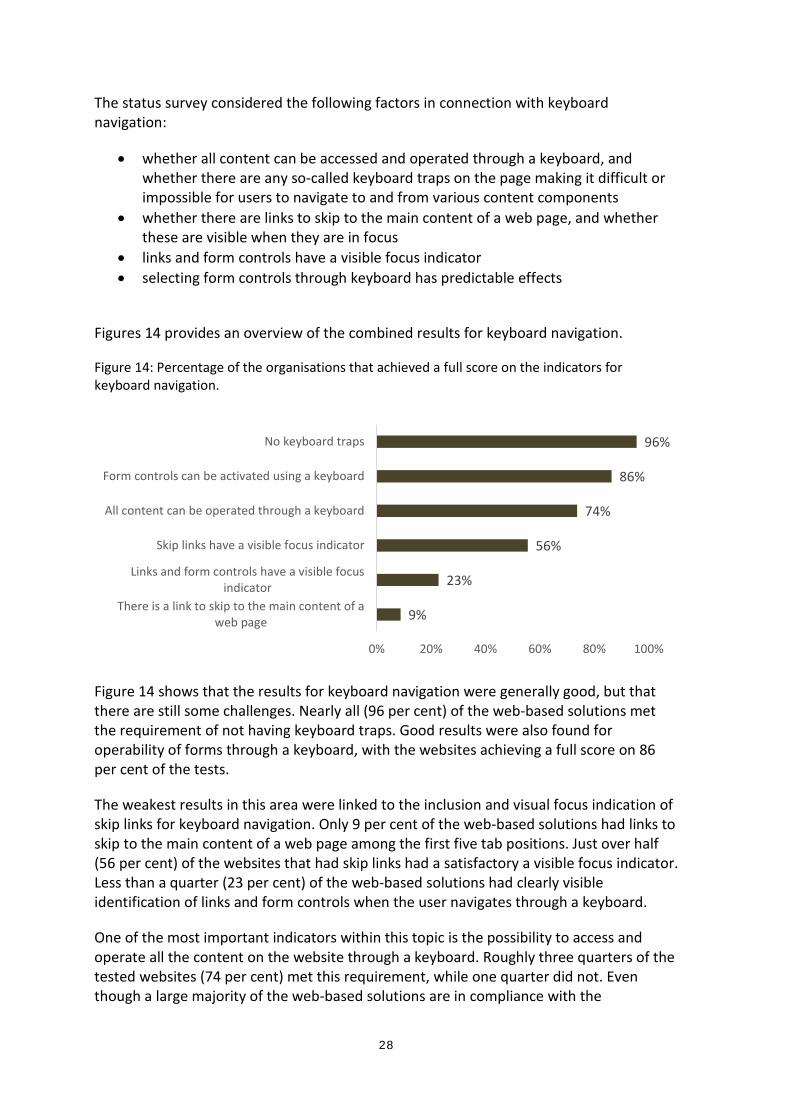
Figures 14 provides an overview of the combined results for keyboard navigation.
Figure 14: Percentage of the organisations that achieved a full score on the indicators for keyboard navigation.
9%
23%
56%
74%
86%
96%
0% 20% 40% 60% 80% 100%
There is a link to skip to the main content of aweb page
Links and form controls have a visible focusindicator
Skip links have a visible focus indicator
All content can be operated through a keyboard
Form controls can be activated using a keyboard
No keyboard traps
Figure 14 shows that the results for keyboard navigation were generally good, but that there are still some challenges. Nearly all (96 per cent) of the web-based solutions met the requirement of not having keyboard traps. Good results were also found for operability of forms through a keyboard, with the websites achieving a full score on 86 per cent of the tests.
The weakest results in this area were linked to the inclusion and visual focus indication of skip links for keyboard navigation. Only 9 per cent of the web-based solutions had links to skip to the main content of a web page among the first five tab positions. Just over half (56 per cent) of the websites that had skip links had a satisfactory a visible focus indicator. Less than a quarter (23 per cent) of the web-based solutions had clearly visible identification of links and form controls when the user navigates through a keyboard.
One of the most important indicators within this topic is the possibility to access and operate all the content on the website through a keyboard. Roughly three quarters of the tested websites (74 per cent) met this requirement, while one quarter did not. Even though a large majority of the web-based solutions are in compliance with the

29
requirement, the materiality of access to web-based solutions means this is a potential risk area.
The requirements related to this topic are important for blind and severely vision impaired people who use a screen reader or Braille display, for people with low vision, and for people with motor disabilities, such as reduced dexterity. Errors and omissions relating to keyboard navigation can thus constitute a potential barrier for many users.
The Authority does not consider keyboard navigation as a whole to be a risk area. Nevertheless, it is important to emphasise that some areas within this topic represent a risk in terms of poor accessibility. This applies in particular to inclusion of keyboard skip links and visible focus indicators for skip links, other links and form controls.
The results for each of the indicators in the area "keyboard navigation" are presented below.
4.4.1 All content and all functionality can be operated through a keyboard
The possibility to navigate using a keyboard is important for many users. The requirement that a website should be operable using a keyboard is formulated thus in WCAG 2.0, success criterion 2.1.1: "All functionality of the content is operable through a keyboard interface without requiring specific timings for individual keystrokes, except where the underlying function requires input that depends on the path of the user's movement and not just the endpoints."
To get a full score (3 points) on this indicator, all links, buttons and other features that the user can navigate to using a mouse must also be reachable using a keyboard. An exception is made for functionality that cannot reasonably be controlled using a keyboard, for example drawing programs.
In the same way as for the requirement regarding resizing of content without loss of content or functionality, the requirement regarding keyboard navigation is also formulated as an "either/or" requirement. This means that if there is content on the page that it is natural to operate using a keyboard, but that cannot be reached using a keyboard, the website is given a score of 0 points. The results for keyboard navigation are presented in figure 15.
Figure 15: Percentage of the web-based solutions that achieved a full score or had non-compliances for keyboard navigation.
26%
74%
0%
20%
40%
60%
80%
100%
Non-compliance Compliance

30
Figure 15 shows the results of the tests to verify whether the content on the websites could be accessed using a keyboard. Roughly three quarters of the tested websites (74%) met this requirement. This requirement is important for blind and severely vision-impaired people who use a screen reader or Braille display, for people with low vision, and for people with motor disabilities, such as reduced dexterity.
We note that about a quarter (26 per cent) of the websites had some degree of non-compliance with this success criterion. This area is critical for users who rely on being able to navigate using a keyboard and therefore represents a potential barrier, which is why the Authority, despite the relatively good survey results, nevertheless considers that there is a certain risk related to the possibility to operate all the content through a keyboard.
4.4.2 No keyboard traps
Keyboard traps prevent users from being able to navigate away from the components of a web page navigated to using only the keyboard, i.e. they prevent the user from being able to continue further or navigate back to the previous component. As mentioned in section 4.4.1, it is a prerequisite for operation of a website using a keyboard that there are no keyboard traps.
This requirement is derived from standard WCAG 2.0, success criterion 2.1.2: "No keyboard trap: If keyboard focus can be moved to a component of the page using a keyboard interface, then focus can be moved away from that component using only a keyboard interface, and, if it requires more than unmodified arrow or tab keys or other standard exit methods, the user is advised of the method for moving focus away."
To get a full score on this indicator, keyboard navigation must not stop in any component of the content. A score of 1 point was given if there were keyboard traps that it is possible to "back-track" out of, i.e. navigate away from. The results for keyboard traps are presented in figure 16.
Figure 16: Percentage of the web-based solutions that achieved a full score or had non-compliances for keyboard traps.
As can be seen from figure 16, the results for keyboard traps were very good. Keyboard traps were only identified in 4 per cent of the tested solutions, indicating that virtually all the websites (96 per cent) met this requirement.
4%
96%
0%
20%
40%
60%
80%
100%
Non-compliance Compliance

31
4.4.3 Link to skip to the main content of a web page
The objective of skip links for keyboard navigation is to allow users who navigate using a keyboard interface to skip directly to for example the main content of a page, without having to go through content that is repeated on many pages on the website, for example navigation menus. This requirement is worded as follows in WCAG 2.0, success criterion 2.4.1: "A mechanism is available to bypass blocks of content that are repeated on multiple Web pages."
Links to skip to the main content of a web page are important. Although this feature is not crucial for operation of a website using a keyboard, it strongly affects the usability of the solution. We assessed the prevalence, positioning and visible focus indication of skip links for keyboard navigation.
A full score of 3 points was given if the link to skip to the main content of a web page was among the first three tab positions on the web page, and both visual and functional focus moves correctly. 1 point was given if the skip link was among the first five tab positions and the focus requirements were met. 3 points were also awarded if the skip links were visible either all the time or on keyboard focus. If the skip links did not have visible focus, the solution was given 0 points.
The results for links to skip to the main content of a web page are presented in figure 17.
Figure 17: Percentage of the web-based solutions that achieved a full score or had non-compliances for links to skip to the main content of a web page.
91%
9%
44%56%
0%
20%
40%
60%
80%
100%
Non-compliance Compliance
There is a link to skip to the maincontent of a web page
Skip links have a visible focusindicator
Figure 17 shows that very few web-based solutions had links to skip to the main content of a web page positioned in a way that makes keyboard navigation an efficient way of using the web page. Fewer than 10 per cent of the websites tested had keyboard skip links among the first five tab positions. Among the websites that had keyboard skip links, the skip links were visible on just over half (56 per cent) of the web-based solutions.
This result must be seen in the context of the other tests that the Authority conducted in the area keyboard navigation. Despite the good results found for the possibility to use websites through a keyboard and very few keyboard traps, we believe there are grounds to focus on the usability of keyboard navigation. The reason for this is that only 9 per cent of the websites had skip links positioned such that the user can bypass blocks of content

32
that is repeated on several pages. Links to skip to the main content of a web page are therefore considered a risk area.
4.4.4 Content navigated to by keyboard has a visible focus indicator
WCAG 2.0, success criterion 2.4.7, requires that "Any keyboard operable user interface has a mode of operation where the keyboard focus indicator is visible."
In order to navigate a web-based solution using the keyboard, the users must at all times have an overview of where on the page they are. This requirement is particularly aimed at people with low vision or reduced dexterity, but is also important for people with memory or concentration limitations.
In the status survey we delimited verification of compliance with this requirement to inspecting all links and form controls that it was possible to navigate to using a keyboard. If the website had several different focus indicators, the score was based on the weakest focus indicator.
To get a full score (3 points) on this indicator, all the inspected links and form controls must have a clear visible focus indicator. If one of these components did not have a visible focus indicator, a score of 0 points was given. The reason for this is that visible focus indicators, together with the requirement that all content must be accessible using a keyboard, are essential for users with, say, impaired vision or motor challenges, to be able to use a web-based solution through a keyboard. The results for visible focus indicator for content navigated to by keyboard are presented in figure 18.
Figure 18: Percentage of the web-based solutions that achieved a full score or had non-compliances for visible focus indicator for content navigated to by keyboard.
Figure 18 shows that more than three quarters (77 per cent) of the web-based solutions did not comply fully with the requirement that content that the user navigates to with a keyboard shall have visible focus. The Authority therefore considers visible focus indicators in connection with keyboard navigation to be a risk area.
77%
23%
0%20%40%60%80%
100%
Non-compliance Compliance
4.4.5 Selecting form controls through keyboard has predictable effects
Another requirement that is decisive for the navigability of web-based solutions is success criterion 3.2.2 in WCAG 2.0, which reads: "Changing the setting of any user interface

33
component does not automatically cause a change of context unless the user has been advised of the behavior before using the component."
Verification of compliance with this requirement was restricted to inspection of drop-down menus, radio buttons and check-boxes in digital forms. We investigated whether users can navigate and activate choices in forms without focus disappearing from the choice the user has made. Even if activation of a choice results in the page being reloaded, the focus should still be on the component the user navigated to using the keyboard.
Compliance with this requirement benefits people with low vision, reduced dexterity or people who for some other reason have difficulties interpreting visual signals. In addition this requirement helps make digital solutions more user-friendly for everyone.
The results for unchanged focus when the status of drop-down menus, radio buttons and check-boxes is changed are presented in figure 19.
Figure 19: Percentage of the web-based solutions that achieved a full score or had non-compliances for unchanged focus when the status of an input element changes.
14%
86%
0%
20%
40%
60%
80%
100%
Non-compliance Compliance
Figure 19 shows that a total of 86 per cent of the web-based solutions that the Authority inspected in the status survey had good functionality in respect of using different types of form controls with a keyboard, without the user losing focus on the selected object. This is an excellent result, which together with other indicators, helps lower the barriers for using digital forms.
4.5 Digital forms
Accessible digital forms are very important for most users of digital solutions. The areas "descriptive labels", "keyboard operability" and "markup of form controls" are all linked to online forms. For practical reasons forms that require log-in were not assessed. Nor were error messages or the opportunity to check data in connection with the completion / submission process.
In this chapter we make an overall analysis of the results on the five indicators that can be linked to the area "forms". Four of the indicators are also linked to other topics, and the

34
results for these indicators are presented in other chapters10. The combined results for the five indicators related to forms are presented in figure 20.
Figure 20: Percentage of the organisations that achieved a full score on the indicators for online forms.
23%
33%
74%
86%
92%
0% 20% 40% 60% 80% 100%
Links and form controls have a visible focusindicator
Form controls have correct markup
All content can be operated through akeyboard
Form controls can be activated using akeyboard
Form controls have descriptive instructions/ labels
Figure 20 illustrates the broad variation in the results for indicators linked to forms. Labels in form controls achieved the best results: 92 per cent of the websites tested had user guidance that met the requirements.
There was variation in the results for the indicator operability of forms through a keyboard. Three quarters (74 per cent) of the web-based solutions had forms that could be reached using only a keyboard, and it was possible to activate choices in a user-friendly way in 86 per cent of the form solutions. It is also important to emphasise that less than one quarter (23 per cent) of the web-based solutions had a satisfactory visible focus indicator in connection with keyboard navigation.
The greatest challenges linked to online forms are related to the markup of form controls. This represents a significant risk for users who use various assistive technologies to operate forms.
For the other topics, we have analysed the results for the individual indicators more closely in connection with the individual topics. Four of the five indicators related to forms have already been discussed above. Since labels in form controls is not linked to any other topic, we will present the results for this indicator here.
4.5.1 Labels in form controls
According to WCAG 2.0, success criterion 2.4.6, it is a requirement that "Headings and labels describe topic or purpose." In the status survey we limited verification of compliance with this requirement to assessing labels in digital forms.
10 Markup of form controls (section 4.2.1). Possibility to reach and operate forms through a keyboard (chapters 4.4.1 and 4.4.5). Form controls have a visible focus indicator (section 4.4.4).
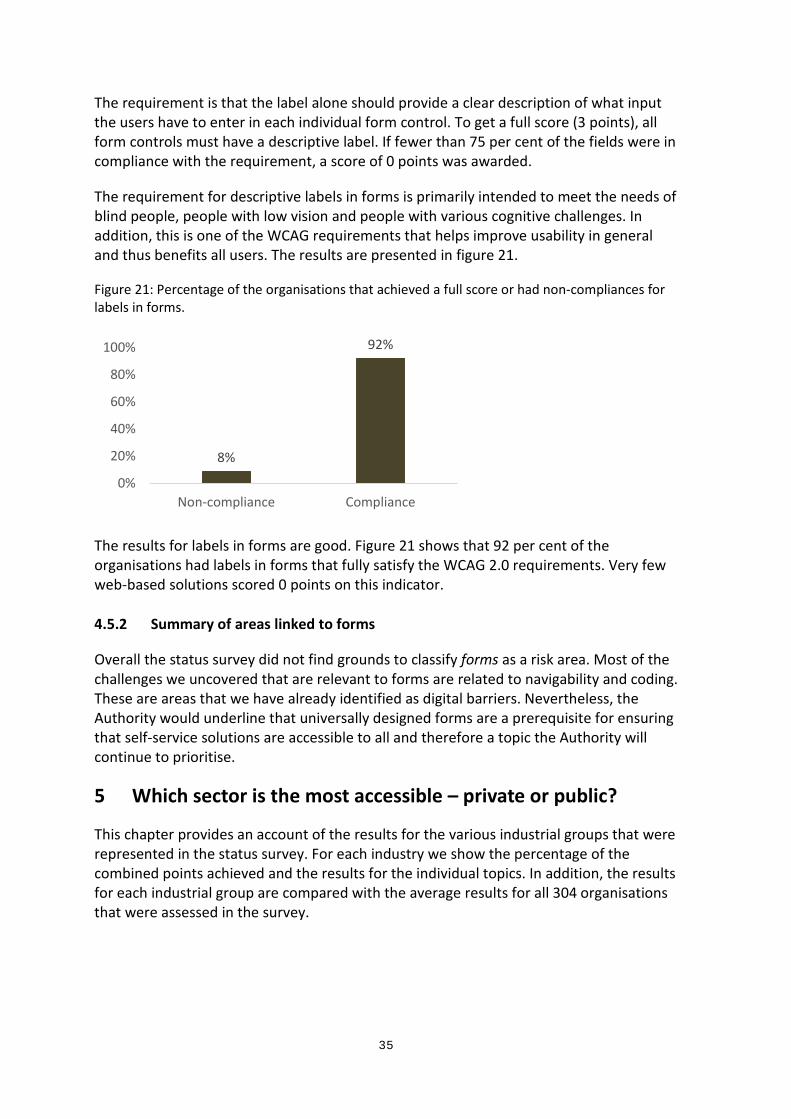
35
The requirement is that the label alone should provide a clear description of what input the users have to enter in each individual form control. To get a full score (3 points), all form controls must have a descriptive label. If fewer than 75 per cent of the fields were in compliance with the requirement, a score of 0 points was awarded.
The requirement for descriptive labels in forms is primarily intended to meet the needs of blind people, people with low vision and people with various cognitive challenges. In addition, this is one of the WCAG requirements that helps improve usability in general and thus benefits all users. The results are presented in figure 21.
Figure 21: Percentage of the organisations that achieved a full score or had non-compliances for labels in forms.
8%
92%
0%
20%
40%
60%
80%
100%
Non-compliance Compliance
The results for labels in forms are good. Figure 21 shows that 92 per cent of the organisations had labels in forms that fully satisfy the WCAG 2.0 requirements. Very few web-based solutions scored 0 points on this indicator.
4.5.2 Summary of areas linked to forms
Overall the status survey did not find grounds to classify forms as a risk area. Most of the challenges we uncovered that are relevant to forms are related to navigability and coding. These are areas that we have already identified as digital barriers. Nevertheless, the Authority would underline that universally designed forms are a prerequisite for ensuring that self-service solutions are accessible to all and therefore a topic the Authority will continue to prioritise.
5 Which sector is the most accessible – private or public?
This chapter provides an account of the results for the various industrial groups that were represented in the status survey. For each industry we show the percentage of the combined points achieved and the results for the individual topics. In addition, the results for each industrial group are compared with the average results for all 304 organisations that were assessed in the survey.

36
5.1 Overview – comparison of industries
The figures from the survey show that on average the public sector had slightly better results than the private sector. The public sector achieved 54 per cent of the total points available, compared with 49 per cent for the private sector, as is shown in figure 22.
Figure 22: Score as a percentage of the total number of points available. Private sector and public sector.
49% 54%
0%
20%
40%
60%
80%
100%
Private sector Public sector
There are some marked differences between the industrial groups in respect of the average results for each group. This is shown in figure 23.
Figure 23: Score as a percentage of the total number of points available. The combined result for all the industrial groups together and the results for each individual industrial group.
45%
46%
49%
50%
52%
54%
51%
0% 20% 40% 60%
Banking, finance, etc.
Media, information, etc.
Transport and accommodation
Wholesale and retail trade
Primary industries, manufacturing, building &construction, etc.
Municipal and central-governmentorganisations
Combined result
Figure 23 shows that the public sector (municipal and central-government organisations) scored better than the various industrial groups and categories in the private sector. Figure 23 also shows that two of the industrial groups in the private sector scored 50 per cent or more, namely wholesale & retail trade and the group that encompasses the primary industries, manufacturing, building & construction, power supply, etc.

37
The results for transport, travel, accommodation and food service are slightly below the average for the status survey. This group achieved a score of 48 per cent of the total points available.
Banking and finance attained 45 per cent of the total points available. As a group, banking and finance had the weakest results. The status survey also appears to indicate that the media and information organisations have below average results in terms of universal design, with an average group score of 46 per cent.
Below we present the results for the various industrial groups in more detail.
5.2 Public sector
The public sector covers both local-government (municipal) and central-government (state) organisations, and has been identified as one of the Authority's priority areas. The municipal sector comprises the municipalities and county authorities. The central-government sector includes the major public service providers, ministries, directorates and inspectorates, as well as a number of organisations linked to the health trusts and purely informational activities. The results for the public sector are presented in figure 24.
Figure 24: Score as a percentage of the total points available in the public sector (black bars). The average result for the industrial group as a whole and for each topic. The results for this group have been compared with the combined result for all the organisations assessed in the survey (white bars).
62%
60%
57%
41%
25%
54%
54%
53%
58%
44%
19%
51%
0% 20% 40% 60% 80%
Navigability
Keyboard navigation
Forms
Coding
Text alternatives
Combined result
Combined result – all industries Municipal and central-government organisations
Figure 24 shows that the public sector achieved an average score of 54 per cent of the total points available, compared with 51 per cent for all the organisations that participated in the survey.

38
The public sector scored better than the private sector in the areas navigability, keyboard navigation and text alternatives for images, but had weaker results than the other groups for coding of web-based solutions. For the area "forms", the results are roughly the same as the average for all the organisations.
The overview of the results from the status survey illustrates the very wide variation in the results for the individual organisations in this group, with scores ranging from 30 to 78 per cent of the total number of points available. This sector is very broad, and there are major differences in both the function and the scope of the providers of public services, which is why we have chosen to also present the results for subgroups in the public sector. It should be noted that the sources of error are larger when we split the material up into subgroups than when we treat the public sector as a whole.
In figure 25 we present the results for different parts of the public sector.
Figure 25: Score as a percentage of the total number of points available. Results for subgroups in the public sector and the combined result for all the organisations assessed in the status survey.
37%
53%
61%
54%
51%
0% 20% 40% 60% 80%
Central-government sector (county governors)
Central-government sector (services forindividuals)
Central-government sector (ministries,directorates, inspectorates)
Municipal sector (municipal authorities, countyauthorities)
Combined result – all organisations
Figure 25 shows that the ministries, directorates and inspectorates achieved the best results in this survey (61 per cent). This applies no matter which group it is compared with, in the private and the public sector.
Several of the public service providers in the central-government sector also achieved good results and are among the top 20 in the survey. These are bodies that most of the population has contact with. They are quick to digitise services and implement major restructurings in their first-line services and contact with the public. Accessible solutions are important to ensure that information and services are available to the population.
If we rank the organisations assessed in the status survey by results, we find central-government organisations in eight of the top ten places. Indeed, 15 of the top 20 results are public-sector bodies. Of these, 11 are state-run and 4 are municipal websites.
Figure 25 also shows that the municipalities and county authorities included in the survey achieved an average score of 54 per cent of the total points available. There are large and small municipalities spread over the entire list of results, suggesting no correlation between municipality size and degree of universal design in this survey. Nor were any

39
significant differences found in the results between municipal and central-government organisations.
Although the results in the municipal sector vary from 30 to 71 per cent, two thirds of the municipalities nevertheless have results that are better than average for the survey. After the central-government service providers that provide services aimed at individuals, the municipalities are the organisations that have the highest degree of public-oriented activity. Universal design in the municipal sector is therefore very important.
In the same way as in the private sector, there are also a number of organisations in the public sector that have challenges in terms of universal design of ICT. Whilst we cannot really generalise at this level, there are nevertheless grounds to mention that several municipalities, health-related organisations and county governor's offices were found to have relatively inaccessible solutions.
5.3 The primary industries, manufacturing, construction, power supply, etc.
The organisations in this group represent several different industries. We chose to treat them as a single industrial group in the status survey because these industries have less individual-oriented production than the other industries. For the same reason these industries were not weighted heavily in this survey. Because this group was not underrepresented in the sample, there is greater uncertainty about the results for this group than for the others.
It is nevertheless worth mentioning that the organisations involved in, for example, power supply, are increasingly using web-based solutions in their contact with the public. In keeping with other organisations that use ICT-based solutions as the main interface for contact with the general public, the WCAG rules also apply to the organisations in this industrial division.
The most important results for these groups combined are shown in figure 26.
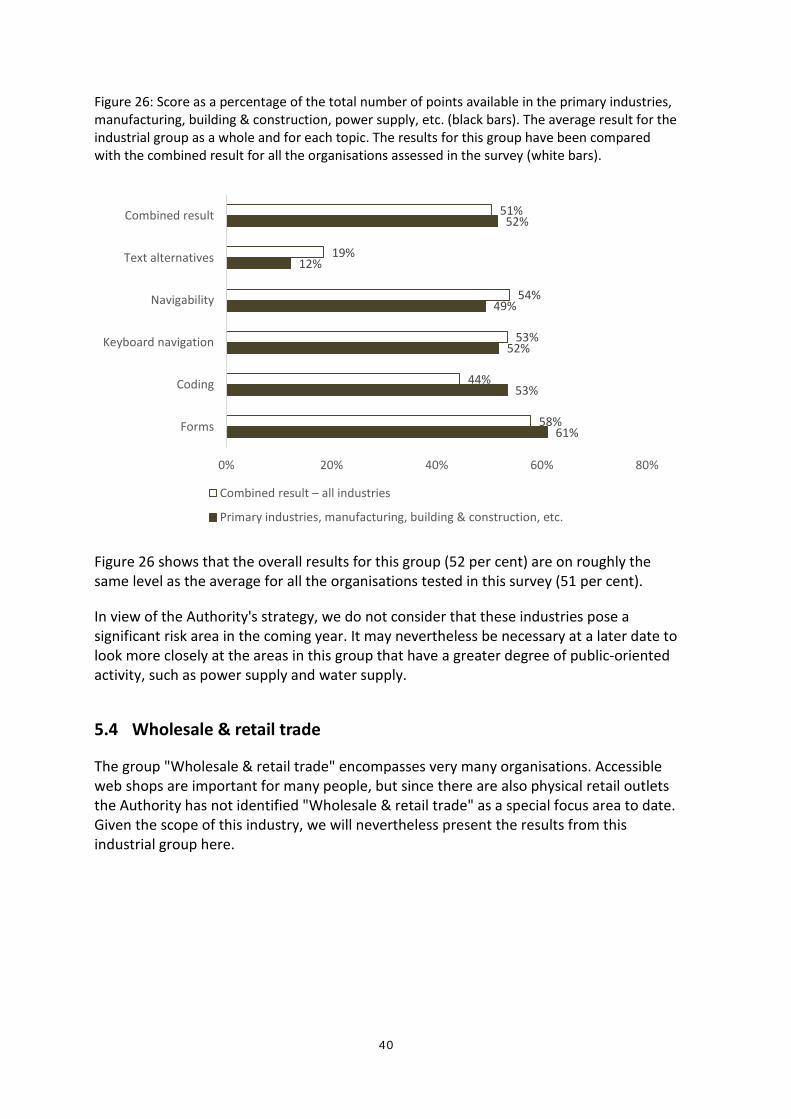
40
Figure 26: Score as a percentage of the total number of points available in the primary industries, manufacturing, building & construction, power supply, etc. (black bars). The average result for the industrial group as a whole and for each topic. The results for this group have been compared with the combined result for all the organisations assessed in the survey (white bars).
61%
53%
52%
49%
12%
52%
58%
44%
53%
54%
19%
51%
0% 20% 40% 60% 80%
Forms
Coding
Keyboard navigation
Navigability
Text alternatives
Combined result
Combined result – all industries
Primary industries, manufacturing, building & construction, etc.
Figure 26 shows that the overall results for this group (52 per cent) are on roughly the same level as the average for all the organisations tested in this survey (51 per cent).
In view of the Authority's strategy, we do not consider that these industries pose a significant risk area in the coming year. It may nevertheless be necessary at a later date to look more closely at the areas in this group that have a greater degree of public-oriented activity, such as power supply and water supply.
5.4 Wholesale & retail trade
The group "Wholesale & retail trade" encompasses very many organisations. Accessible web shops are important for many people, but since there are also physical retail outlets the Authority has not identified "Wholesale & retail trade" as a special focus area to date. Given the scope of this industry, we will nevertheless present the results from this industrial group here.

41
Figure 27: Score as a percentage of the total number of points available in wholesale & retail trade (black bars). The average result for the industrial group as a whole and for each topic. The results for this group have been compared with the combined result for all the organisations assessed in the survey (white bars).
59%
52%
52%
46%
26%
50%
58%
54%
53%
44%
19%
51%
0% 20% 40% 60% 80%
Forms
Navigability
Keyboard navigation
Coding
Text alternatives
Combined result
Combined result – all industries Wholesale and retail trade
Figure 27 shows that the results for wholesale & retail trade do not differ significantly from the results we found for the organisations assessed in the survey as a whole. The wholesale & retail trade organisations achieved a score of 50 per cent of the total points available, while the result for all 304 organisations was 51 per cent.
The biggest difference between the results for wholesale & retail trade and the combined figures for the survey as a whole was in the area text alternative for images, where wholesale & retail trade scored slightly better than several other industries. This is important in terms of presenting information that is essential to be able to use the website.
5.5 Transport, travel, accommodation and food service
This industrial group, with particular emphasis on transport organisations, has been identified as one of the areas the Authority will monitor more closely. Many of the organisations use online channels to communicate with the public. Booking functionality, information about prices and timetables are particularly important to users of web-based solutions in this division.

42
Figure 28: Score as a percentage of the total number of points available for transport, travel, etc. (black bars). The average result for the industrial group as a whole and for each topic. The results for this group have been compared with the combined result for all the organisations assessed in the survey (white bars).
Figure 28 shows that the results for transport, travel, accommodation and food service are slightly below the average score for all the web-based solutions included in the status survey. This group achieved a score of 48 per cent of the total points available, while the combined result for all the industrial groups was 51 per cent. However, this industrial group is so broad and varied that grounds were not found for concluding that this group differs systematically from the organisations in the other groups.
Text alternatives for images and coding of web-based solutions are the main risk areas for this group too. The organisations in this group achieved particularly low scores on coding of data tables – an aspect that is especially important for the transport organisations, which often convey key information about timetables and prices in table format.
The results for navigability are roughly the same for this group as for the other industrial groups, with the exception of the indicator for formulation of link purpose, where this group did significantly better. Net-based solutions related to transport etc. also had slightly weaker results in the area of keyboard navigation. This is related to the requirement that all content can be operated through a keyboard and has a visible focus indicator in connection with keyboard navigation.
Some of the large transport organisations scored better than average, but several of the major travel companies that serve a large volume of passengers had weak results. In light of the results of the status survey and considering that online solutions are often the main interface with the public, the Authority is going to continue to focus on the transport industry.
55%
54%
50%
42%
10%
49%
58%
54%
53%
44%
19%
51%
0% 20% 40% 60% 80%
Forms
Navigability
Keyboard navigation
Coding
Text alternatives
Combined result
Combined result – all industries Transport and accommodation
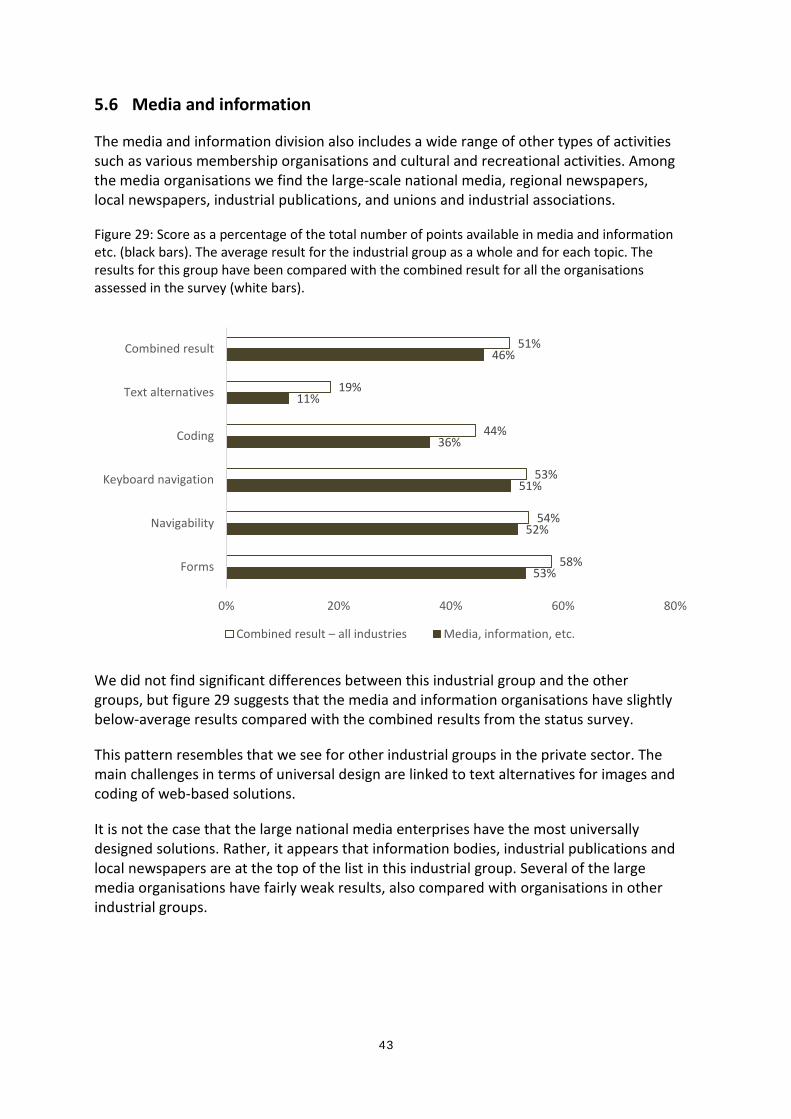
43
5.6 Media and information
The media and information division also includes a wide range of other types of activities such as various membership organisations and cultural and recreational activities. Among the media organisations we find the large-scale national media, regional newspapers, local newspapers, industrial publications, and unions and industrial associations.
Figure 29: Score as a percentage of the total number of points available in media and information etc. (black bars). The average result for the industrial group as a whole and for each topic. The results for this group have been compared with the combined result for all the organisations assessed in the survey (white bars).
53%
52%
51%
36%
11%
46%
58%
54%
53%
44%
19%
51%
0% 20% 40% 60% 80%
Forms
Navigability
Keyboard navigation
Coding
Text alternatives
Combined result
Combined result – all industries Media, information, etc.
We did not find significant differences between this industrial group and the other groups, but figure 29 suggests that the media and information organisations have slightly below-average results compared with the combined results from the status survey.
This pattern resembles that we see for other industrial groups in the private sector. The main challenges in terms of universal design are linked to text alternatives for images and coding of web-based solutions.
It is not the case that the large national media enterprises have the most universally designed solutions. Rather, it appears that information bodies, industrial publications and local newspapers are at the top of the list in this industrial group. Several of the large media organisations have fairly weak results, also compared with organisations in other industrial groups.

44
5.7 Banking, finance and other service activities
This industrial group includes a broad range of enterprises: the largest banks, local banks, insurance companies, estate agencies and private service providers of varying sizes. The results for this industrial group are presented below.
Figure 30 Score as a percentage of the total number of points available in banking and finance, etc. (black bars). The average result for the industrial group as a whole and for each topic. The results for this group have been compared with the combined result for all the organisations assessed in the survey (white bars).
55%
51%
50%
32%
10%
45%
58%
54%
53%
44%
19%
51%
0% 20% 40% 60% 80%
Forms
Navigability
Keyboard navigation
Coding
Text alternatives
Combined result
Combined result – all industries Banking, finance, etc.
Figure 30 shows that the average score for banking, finance and other service activities was 45 per cent of the total points available. This is the group that had the weakest results in the status survey. There is a difference of roughly 9 percentage points between this group and the public sector. The highest score among the banking and finance organisations was 60 per cent. The highest score among the sample as a whole was 78 per cent.
Otherwise figure 30 shows that the main barriers in the web-based solutions within the group banking and finance are linked to text alternatives for images, where this group scored only 10 per cent of the total points available, and coding, where it achieved a score of 32 per cent. These are also the two areas where the tested solutions in this group are furthest behind the average for the survey has a whole. Navigation-related indicators, including the individual topics related to keyboard navigation, also stand out as a risk area.
There is no evidence to suggest that the largest organisations are best at universal design. Three quarters of the web-based solutions in this industrial group achieved a score that is lower than the average for all the organisations tested. Several local banks are at the top of the group, whereas a number of major financial organisations have weaker results.

45
Banking and finance, which also includes insurance, has a high degree of digitised services aimed at the public. Since this group was found to have weaker results than other industries, the Authority finds that "banking and financial organisations" is a risk area.

46
6 References
• World Wide Web Consortium (W3C), 2011. Web Content Accessibility Guidelines (WCAG), version 2.0
• Act no. 61 of 21 June 2013 relating to a prohibition against discrimination on the basis
of disability (the Anti-discrimination and Accessibility Act).
• Regulation no. 951 of 3. July 2013: Regulation for universal design of information and communication technology (ICT) solutions
• Difi, http://uu.difi.no/ Difi's website with information on universal design of ICT
• Difi Report 2014:03. Digitalisering for alle? Ei undersøking om universell utforming av
IKT i private og offentlege verksemder ["Digitisation for all? A survey of universal design of ICT in private and public organisations"].
• Difi. http://kvalitet.difi.no/ Difi's website with information on quality assessment of
public-sector web-based solutions
• Difi, 2014. Supervision Strategy 2014–2015.
• Statistics Norway 2007, Standard Industrial Classification http://stabas.ssb.no/ItemsFrames.asp?ID=8118001&Language=nb
• Frode Eika Sandnes, 2001. Universell utforming av IKT-systemer. Brukergrensesnitt for
alle ["Universal design of ICT systems – One user interface for all"]. (Universitetsforlaget)

47
7 Appendix 1 Selection of organisations
The survey was carried out on a sample of 304 organisations: 178 in the private sector and 126 in the public sector.
The Regulation applies to all public and private undertakings, associations and organisations that use web-based solutions or automated self-service devices in their contact with the general public, regardless of the size of the organisation. We have nevertheless chosen to delimit the sample for this status survey to organisations with four or more employees. Delimitations of this kind are made in many surveys, in part because more than 70 per cent of the organisations that have fewer than four employees do not have any turnover and/or activity.
We have also designed the sample to ensure the best possible information about the Authority's priority areas. The priority areas were defined in the Authority's supervision strategy for 2014–2015, based on an assessment of which areas in society and industries have:
• services that are particularly important to ensure equal social participation • a high volume of users of ICT solutions
Based on these assessments, the Authority has decided to give priority to monitoring public services, banking and financial services, and transport and travel. These industrial groups have been ascribed greater weight in the sample, while other industries, which are not as highly prioritised in the Authority's supervision strategy for the current period, have been accorded less weight. The exception is media, which is overrepresented in the sample for the status survey, in the same way as municipal and central-government organisations, banking, finance and insurance, and transport and travel.
This sample composition provides us with more reliable information on the industries that the Authority wants to monitor more closely. When we look at all the organisations together, the results are corrected for these kinds of sample distortions. This is to ensure that the results of the status survey provide a representative reflection of the reality.
The sample of private organisations included in the status survey was recruited from a questionnaire survey that TNS Gallup conducted for Difi in 2013. This survey aimed to measure knowledge about universal design of ICT and the regulations that apply in this area. In connection with this survey the participants were asked whether Difi could use the organisation's web-based solutions for test purposes. The current sample of private-sector organisations was selected from among the respondents that answered yes to this question. This may in itself constitute a source of error, in that it may be the case that the respondents that agreed to participate in the status survey have websites that are more universally designed than the respondents that declined. However, we believe this source of error is small. This conclusion is based on the fact that the vast majority of the respondents consented to participation in status surveys, and no differences were found in knowledge of universal design of ICT between organisations that agreed to participate and those that declined.

48
The sample of public-sector organisations was drawn from Difi's quality control of websites in the public sector, Quality Online 2013. This quality control consisted of an evaluation of all the municipal websites and a large volume of central-government websites against a set of criteria11, approximately half of which were related to WCAG 2.0. The difference between the Quality Online assessment and this universal design status survey is that the current status survey also includes private-sector organisations.
The sample of municipal and central-government organisations included in the status survey was composed such that the organisations included in the sample had approximately the same score for the WCAG-related criteria in Quality Online 2013 as those that were not included in the sample. The purpose of this is to avoid major sources of error in the survey.
Based on the Standard Industrial Classification12 (SN2007) the organisations have been categorised into industrial groups at the aggregate level, as set out in the table below.
Table: The organisations in the sample classified into main categories of industrial groups
Group Contents Number of organisations in the sample
Group 1 Agriculture, forestry & fishing. Mining and quarrying. Manufacturing. Electricity, gas, steam and air conditioning supply. Water supply; sewerage, waste management and remediation activities. Construction.
20
Group 2 Wholesale & retail trade. Repair of motor vehicles and motorcycles. 34 Group 3 Transportation and storage. Accommodation and food service activities. 40 Group 4 Information and communication. Arts, entertainment and recreation. 36 Group 5 Financial and insurance activities. Real estate activities. Administrative
and support service activities. Other service activities. 48
Group 6 Public administration. Human health and social work activities, etc. 126 TOTAL 304
All surveys based on a sample of study objects must be interpreted with caution, and there will always be uncertainty when a sample of entities is used to draw conclusions about an entire population. The sample of web-based solutions was designed to provide an adequate basis for analysis and at the same time the smallest margin of error that is practically possible within the framework of some 300+ organisations / web-based solutions.
11 http://kvalitet.difi.no/kriteriesett/kvalitet-pa-nett
12 http://stabas.ssb.no/ItemsFrames.asp?ID=8118001&Language=nb

49
8 Appendix 2 Testing and assessment methods
The survey was carried out on the basis of the requirements for web-based solutions derived from the Web Content Accessibility Guidelines (WCAG) 2.0. The Authority developed indicators for measuring universal design of ICT by operationalising the obligatory requirements stipulated in the standard, with emphasis on the following:
• Specification of content elements and types of web pages that are to be tested for each individual performance indicator.
• Detailed description of the test procedures and templates for registration of test results.
• Criteria for assessing the degree to which the results of the tests comply with the requirements laid down in WCAG 2.0.
• Score scale from 0–3 to quantify the results of the assessment or test. 3 points indicates compliance with the requirement, while 0 points indicates a significant degree of non-compliance. For some indicators, scores of 1 and 2 were also used to classify degrees of non-compliance with the requirement. This is not relevant for all the indicators and has therefore only been used on some of the indicators.
The test topics, test procedures and assessment criteria comply with the techniques referred to in WCAG 2.013. As a general rule, we have defined one performance indicator with an appurtenant test procedure and assessment criteria for each success criterion in WCAG 2.0. However, some success criteria are so complex that we have broken them down into several performance indicators, which together form the basis for assessing whether the success criterion is met.
The survey was carried out in Difi's test lab in the period 26 August 2014 to 10 January 2015. The assessment method used varied according to what was being tested, but most tests consisted of a visual inspection and assessment of the various content elements and navigation possibilities and a check of the markup language / code for the success criteria where this is applicable.
The web-based solutions were tested using computers that run on Windows 7, using the web browser Internet Explorer version 11. Internet Explorer is the most widely used browser and has tools that can be used to verify compliance with the WCAG 2.0 requirements. The most commonly used tools are:
1. Web Accessibility Toolbar14 (WAT), to test: • Contrast (Colour Contrast Analyser) • Text alternatives for images • Headings • Data tables • Keyboard skip links and other links • Resizing possibilities
13 http://www.w3.org/WAI/WCAG20/quickref/ 14 http://www.paciellogroup.com/resources/wat/

50
2. Developer Tools in Internet Explorer for inspection of code 3. WhatFont15 for measuring font size 4. W3C's HTML validator16
A single tester assessed a single web-based solution on the basis of the performance indicators included in the survey. The results of each test were quality assured by someone else. Random spot checks were also carried out to compare the testers' assessments, with a main focus on the indicators that required discretionary judgement. The aim was to ensure the best possible data quality.
The processing of the material focused largely on descriptive statistics with frequency tables and assessments of prevalence. Statistical methods were also used to compare results across industrial groups, topics and indicators.
We chose to use an uneven scale for the test results. All the indicators were assessed using a scale with scores of 0 and 3, and the scores 1 and 2 were also used for some indicators. This was based on a professional assessment of what it was relevant to award points for in the individual case, despite non-compliance with the requirements defined in the standard. For "either/or" requirements, the scale reflects either full compliance (3 points) or non-compliance (0 points).
Comparing requirements and indicators with different scales is quite challenging. In comparisons of the results for individual indicators we therefore added up the score on the scale such that full compliance was recorded as one result and various degrees of non-compliance as a separate result.
To compare the various sectors and industrial groups, we used the points awarded as a percentage of the total number of points available as the score. Given that we could potentially award 3 points for each indicator and the survey encompassed 21 indicators, each individual website could potentially achieve up to 63 points. If a certain type of content was not found on a given website, for example, data tables, we corrected the maximum possible score for this website, so that it was neither "punished" nor "rewarded" for non-existent content or functionality.
15 http://chengyinliu.com/whatfont.html 16 http://validator.w3.org/

51
9 Appendix 3 Overview of success criteria and performance indicators
The survey tested compliance with a total of 15 of the 35 compulsory success criteria in WCAG 2.0. The table below shows which success criteria in WCAG 2.0 are included in the survey and the performance indicators used to measure compliance with each criterion.
Table: WCAG 2.0. Overview of success criteria and performance indicators included in the survey.
WCAG 2.0 success criterion included in the 2014 status survey
Performance indicator for each success criterion
1.1.1 Non-text content: All non-text content that is presented to the user has a text alternative that serves the equivalent purpose (with the exception of certain situations described in WCAG)
• Text alternatives for images: Illustrations that
convey meaning have a text alternative that describes the content or meaning of the image (different requirements for different types of images).
1.3.1 Info and relationships: Information, structure and relationships conveyed through presentation can be programmatically determined or are available in text.
• Visual headings are also coded as headings. • Headings are coded with the correct level. • Data tables are coded with correct markup • Data tables have correctly defined header cells. • Form controls have correct markup. • Search fields have correct markup.
1.4.1 Use of colour: Colour is not used as the only visual means of conveying information, indicating an action, prompting a response, or distinguishing a visual element.
• Links are distinguishable from headings and
body text by means other than colour alone.
1.4.3 Contrast (minimum): The visual presentation of text and images of text has a contrast ratio of at least 4.5:1 (with the exception of certain situations described in WCAG).
• There is sufficient contrast between text and
its background.
1.4.1 Resize text: Except for captions and images of text, text can be resized without use of assistive technology up to 200 per cent without loss of content or functionality.
• Content may be enlarged, and resizing does
not result in loss of content or functionality.
2.1.1 Keyboard: All functionality of the content is operable through a keyboard interface without requiring specific timings for individual keystrokes (except for certain situations described in WCAG).
• All links, buttons and functions can be accessed
and operated through a keyboard.

52
WCAG 2.0 success criterion included in the 2014 status survey
Performance indicator for each success criterion
2.1.2 No keyboard trap: If keyboard focus can be moved to a component of the page using a keyboard interface, then focus can be moved away from that component using only a keyboard interface (this success criterion is an excerpt of the full text in WCAG).
• Keyboard navigation does not get trapped in
any components (no keyboard traps).
2.4.1 Bypass block: A mechanism is available to bypass blocks of content that are repeated on multiple web pages, e.g. navigation menus.
• There is a skip link for keyboard navigation
from the start page to the primary content. • Skip links for keyboard navigation have a
visible focus indicator 2.4.4 Link purpose (in context): The purpose of each link can be determined from the link text alone or from the link text together with its programmatically determined link context, except where the purpose of the link would be ambiguous to users in general.
• The purpose and function of the link is clearly
conveyed by the link text, or the link text together with the context.
2.4.5 There are multiple ways of navigating the website: More than one way is available to locate a web page within a set of web pages, except where the web page is the result of, or a step in, a process.
• There must be multiple ways of navigating the
website.
2.4.6 Headings and labels: Headings and labels describe topic or purpose.
• Labels describe the purpose of form controls.
2.4.7 Focus visible: Any keyboard operable user interface has a mode of operation where the keyboard focus indicator is visible.
• Links and form controls must be clearly
highlighted visually when they have keyboard focus.
3.2.2 On input: Changing the setting of any user interface component does not automatically cause a change of context unless the user has been advised of the behaviour before using the component.
• Changing the status in drop-down menus,
radio buttons and check-boxes does not lead to the user losing focus on the object.
3.3.2 Labels or instructions: Labels or instructions are provided when content requires user input.
• Search fields have instructions or labels.

53
WCAG 2.0 success criterion included in the 2014 status survey
Performance indicator for each success criterion
4.1.1 Parsing: In content implemented using markup languages, elements have complete start and end tags, elements are nested according to their specifications, elements do not contain duplicate attributes, and any IDs are unique, except where the specifications allow these features.
• The code does not contain syntax errors
Total 15 success criteria Total 21 performance indicators
To provide a clearer overview of the results of the status survey, the performance indicators are not only grouped according to the success criteria in WCAG 2.0, also by broader topics.
These topics are:
1. Text alternatives (1 indicator) 2. Coding of web-based solutions (7 indicators) 3. Navigability (6 indicators) 4. Keyboard navigation (6 indicators) 5. Forms (5 indicators)
The table below shows how the performance indicators are linked to the topics.
Table: Overview of the indicators in the status survey, ranked by topic.
Ref. to WCAG
Indicators 1. Text alt. 2. Coding 3. Navig-ability
4. Keyboard navigation
5. Forms
1.1.1 Text alternatives for images X 1.3.1 Headings are coded with correct
markup
X
1.3.1 Headings are coded with the correct nesting level
X
1.3.1 Data tables are coded with correct markup
X
1.3.1 Data tables have correctly defined header cells
X
1.3.1 Form controls have correct markup
X
X 1.3.1 Search fields have correct markup
X
4.1.1 The code does not contain syntax errors
X
3.3.2 Search fields have instructions or labels.
X
2.4.4 Purpose and function of links are understandable
X
1.4.1 Links are distinguishable from headings and body text
X
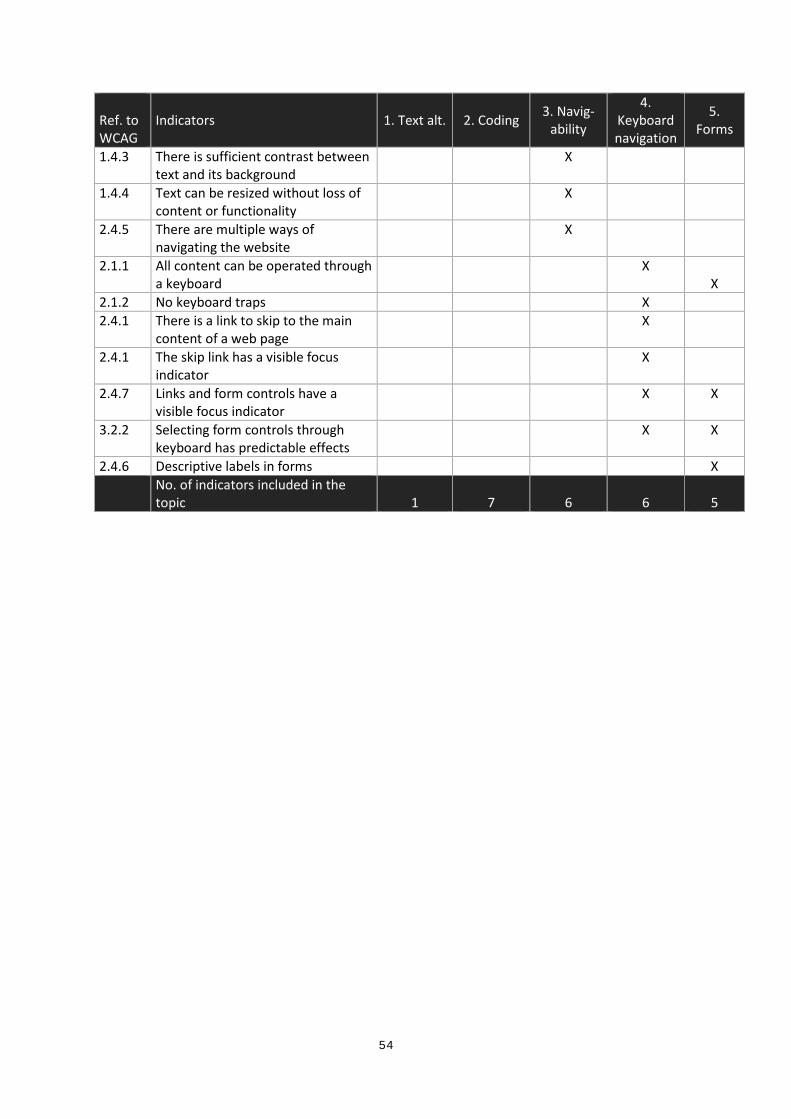
54
Ref. to WCAG
Indicators 1. Text alt. 2. Coding 3. Navig-ability
4. Keyboard navigation
5. Forms
1.4.3 There is sufficient contrast between text and its background
X
1.4.4 Text can be resized without loss of content or functionality
X
2.4.5 There are multiple ways of navigating the website
X
2.1.1 All content can be operated through a keyboard
X X
2.1.2 No keyboard traps
X 2.4.1 There is a link to skip to the main
content of a web page
X
2.4.1 The skip link has a visible focus indicator
X
2.4.7 Links and form controls have a visible focus indicator
X X
3.2.2 Selecting form controls through keyboard has predictable effects
X X
2.4.6 Descriptive labels in forms
X No. of indicators included in the
topic 1 7 6 6 5

55
10 Appendix 4 Code-related indicators and test methods Table: Overview of code related indicators and test methods.
Ref. to WCAG Indicators Test method 1.3.1
Headings are coded with correct markup
All visual headings on the website must also be coded as headings. We tested whether headings were coded with the <h> tag in HTML. Headings can be coded with six different levels, from <h1> to <h6>. Text that does not have visual headings must not be coded with <h> tag in HTML.
1.3.1
Headings are coded with the correct nesting level
The headings that are coded as headings must be coded so that they are in the correct hierarchical order. For example: A heading on level 2 may be followed by a heading on levels 1, 2 or 3, but not by a heading level 4 or lower. There are errors in the hierarchy if the headings skip two or more levels.
1.3.1
Data tables are coded with correct markup
Visual data tables must be coded with the <table> tag in HTML.
1.3.1
Data tables have correctly defined header cells
Visual row labels and column headings in tables must be coded as table headings with the HTML element <th> and the attribute scope. The scope attribute must be scope="row" for row labels and scope="col" for column headings.
1.3.1
Form controls have correct markup
Form elements in HTML must be coded correctly. We tested text fields, radio buttons, check-boxes and drop-down menus. • The labels must be connected to the relevant form control.
Labels must be coded with the HTML element <label> and form controls must be coded with, for example, <input>, <select> or <textarea>, depending on the type of form element. The HTML code for the label must have a "for" attribute and the form input element must have an "id" attribute. For the label to be correctly bound to the form element, the values in "for" and "id" must be identical.
• In HTML, the <label> tag can enclose the form element with the label text and the relevant element nested between the opening and closing tags.
• In HTML, form elements can have a title attribute specifying what function the element has.
1.3.1
Search fields have
The search field and search button must be coded correctly.

56
Ref. to WCAG Indicators Test method
correct markup Coding of the search fields is similar to the coding of the other form controls. In addition, it must be clear that the element is a search field. • The search field must have a label that is correctly bound to
the search field and that specifies that this is a search feature. • In HTML, the <label> tag can enclose the search field with the
label text and the relevant element nested between the opening and closing tags. The label must indicate that this is a search feature.
• In HTML, search fields can have a title attribute specifying that this is a search field.
• For websites coded in HTML5, search fields can have a type attribute of the form type="search".
Search buttons or equivalent tools to start the search must be coded as follows: • The search button is coded with the <input> tag or <button>
tag in HTML. • In addition, the search button must either have the attribute
value="Search" or both attributes type="image" and alt="search".
4.1.1
The code does not contain syntax errors
The website must meet these four coding requirements when tested using W3C's HTML validator: HTML tags must have complete start and end tags: • Any error messages from validation contained the text
"Unclosed element [name of element]." Elements are nested in accordance with the HTML specification • Any error messages from validation contained the text
"Element [name of element] not allowed…". The element must not contain duplicate attributes • Any error messages from validation contained the text
"Duplicate attribute [name of attribute]." Any IDs in elements must be unique. • Any error messages from validation contained the text
"Duplicate ID [name of ID]."