Status and Priorities of Soil Management in Japan - Kazuyuki Yagi
18
Status and Priorities of Soil Management in Japan Kazuyuki Yagi National Institute for Agro-Environmental Sciences, Tsukuba, Japan GSP Technical Workshop “Managing Living Soils” 5-7 December 2012, FAO Headquarters, Rome, Italy
Transcript of Status and Priorities of Soil Management in Japan - Kazuyuki Yagi

Status and Priorities of Soil Management in Japan
Kazuyuki Yagi
National Institute for Agro-Environmental Sciences, Tsukuba, Japan
GSP Technical Workshop “Managing Living Soils” 5-7 December 2012, FAO Headquarters, Rome, Italy

Japan: Geography and Climate Japan has a total of 6,852 islands extending along the Pacific
coast of East Asia, lies between latitudes 24º-46ºN. The climate of Japan is predominantly temperate, but varies
greatly from north to south. Pacific summer monsoon brings warm and humid, while Siberian winter monsoon brings cold weather. The average winter temperature in Japan is 5.1 ºC and the average summer temperature is 25.2 ºC . About 66% of Japan’s land is covered with forests, and 12%
with agricultural lands.

Japan: Distribution of Major Soils
B. Peat soil D. Andosol
H. Red-yellow soil
I. Brown forest soil
F. Fluvic soil

Japan: Distributions of Soil Types in Crop Lands
Paddy
Upland Crop
Grass land
2.81 M ha
Gley soils(Fluvisols)
16%
Gleyic Andosols(Gleic Andosols)
6%
Others
11%
Others 9%
Others6%
Andosols
10%Brown Forest soils (Cambisols)
3%
3%2%
Others
4%
Orchard
1.29 M ha
0.69 M ha
0.44 M ha
19%
Brown Lowland soils (Fluvisols)
3%
Gray Lowland soils(Fluvisols, Gleysols)
Andosols 6%
Brown Forestsoils (Cambisols) 2%
3%
Brown Lowland soils (Fluvisols)
Brown Forest soils (Cambisols)
Andosols

Japan: Priorities of Soil Management
Soil fertility management − Sustainability of soil fertility − Soil management for quality and quantity of products
Environmental assessment − Soil management for eco-farming − Contamination of pollutants (heavy metal, organic
pollutants, radionuclides, etc.) − Soil C sequestration and GHG emissions
Soil information for food security Capacity building and education

Regional
National
Japan: Research-Policy-Land Users Network
Prefectural Institutes &
Experimental Stations
Academic Societies
JSSSPN, etc.
Cabinet Office &
Other Ministries
Extension Stations
Ministry of Agriculture, Forestry
and Fisheries (MAFF)
Prefectural Governments
Associations of Producers
Land Users
Research Policy
National Institutes for Agriculture &
Forestry NIAES, NARO, FFPRI, others
Universities

History of National Soil Survey Programs in Japanese Agricultural Land (1953-1978)
・Soil Survey for Improving Fertilizer application (1953-1961)
・ Fundamental Soil Survey for Soil Fertility Conservation (1959-1978)
Mainly in paddy field, about 200,000 pedons were surveyed.
Mainly in upland field, the survey density was 500m.
Summaries of Pedon dataset (47 prefectures) Cultivated soil maps (1:50,000)

Digitalized and updated cultivated soil maps (1: 50,000)
Benchmarked soil dataset (about 20,000sites)
Cultivated soil maps (1:50,000)
・Soil Survey for Improving Fertilizer application ・ Fundamental Soil Survey for Soil Fertility Conservation
Benchmarked soil pedon database
Digital soil map
Digitalized soil inventory
Updating soil-land map
Urban sprawl impacts on fertile soils

Site information
・Site ・Latitude Longitude ・Soil type ・Sampling date others
Activity data
・Soil treatment ・Fertilizer application ・Crop rotation ・Irrigation/Drainage others
Soil profile description
・Depth of horizons ・Color ・Structure others
Soil properties
pH, EC, Soil texture, C and N content, Bulk density, available P, CEC, Ex-cations, pF, Solid-liquid-gaseous phase, Hydraulic conductivity, others
Location of stationary monitoring sites.
About 20,000 monitoring sites. 5-year-interval (Since 1979)
History of National Soil Survey Programs in Japanese Agricultural Land (1979-1999)
Basic Soil - Environment Monitoring
land use
greenhousepastureorcharduplandpaddy
Availa
ble
Phosp
hate
(P
2O
5m
g/100g)
800
600
400
200
0
1979-
1984-
1989-
1994-
1998
Paddy Upland Orchard Pasture Greenhouse
Avai
labl
e P
This soil database has been used for creating various agro-environmental indicators

Soil Erodibility (K) factor Map
Application of soil inventory in Japanese agricultural land 1
Soil Carbon Stock Map
Radioactive Cs Concentration map
(Aug. 2011)
Available Water Content
Soil Nitrogen Stock Map
Soil Temperature Map
Agro-environmental indicators

Long-Term Experiments in Japan
○ Since 1975, the MAFF has conducted long-term experiments with continuous organic matter application under typical soil type and cropping system of each prefecture (over 150 sites in total), which demonstrated that soil carbon stock increased through organic matter application such as compost.
○ Example of long-term experiment (Gray Lowland Soil; upland)
化学肥料単用区
稲わらたい肥0.25 t区
稲わらたい肥0.75 t区
0.5
1
1.5
2
2.5
1 2 3 4 5 6 7 8 9 10 11 12 13 14 15 16 17 18
(連用年数)
(全炭素(%))Total C (%)
Years
Plot with Chemical Fertilizer Only
Plot with Rice Straw Compost (2.5t/ha/year)
Plot with Rice Straw Compost (7.5t/ha/year)
Data:”Basic Survey of Soil Environment (Benchmark Survey)” Yamaguchi Pref. Agricultural Research Institute. Figure for a year is the three-year average including the previous and the next year to that year.

Long-Term Experiments in Japan
Change of Rice Production
Straw removed 5-10 t/ha manure
T. Ota, NARO (2011)
Straw removed 10-20 t/ha manure
Rice yield at no manure plot (g/m2) Rice yield at no manure plot (g/m2)
Ric
e yi
eld
at m
anur
e pl
ot (g
/m2 )
Ric
e yi
eld
at m
anur
e pl
ot (g
/m2 )
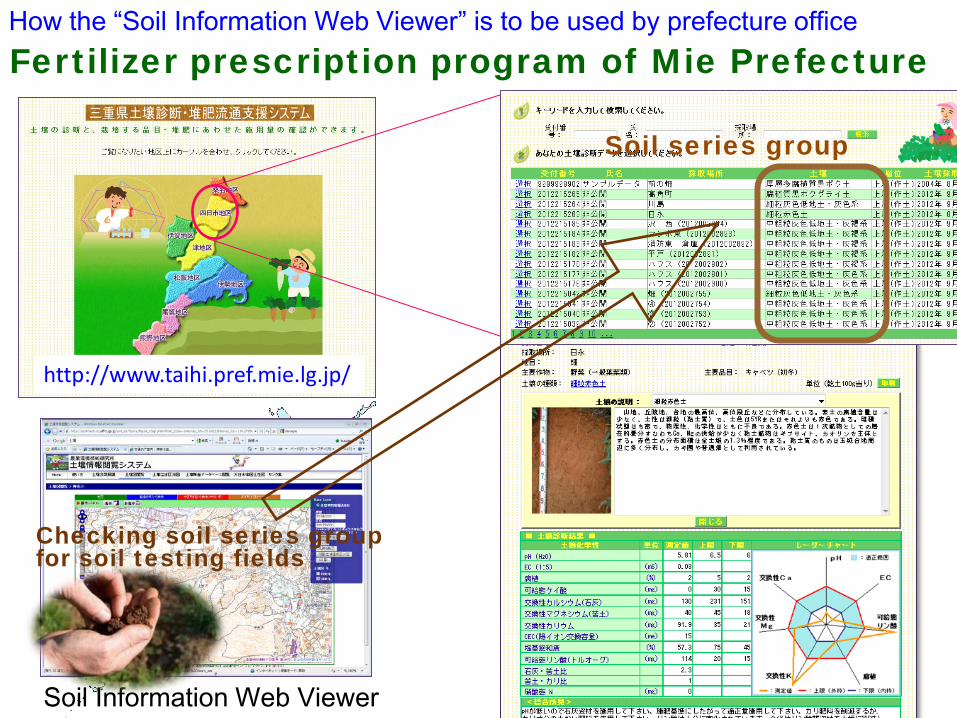
How the “Soil Information Web Viewer” is to be used by prefecture office Fertilizer prescription program of Mie Prefecture
http://www.taihi.pref.mie.lg.jp/
Soil series group
Soil Information Web Viewer
Checking soil series group for soil testing fields

Andosols Wet Andosols Brown Forest soils Gray Lowland soils Gley soils Other Soil Groups
Cultivated Soil Map (1:50,0000)
0.0
2.0
4.0
0 5000 10000
Equ
ival
ent d
ose
rate
at 1
m h
eigh
t (μSv
h-1 )
Total radioactive Cs concentration in soil (Bq kg-1)
Relationship between dose rate and Cs concentration in soil Radioactive contamination
Fukushima nuclear accident
℗ The Wall Street Journal
0 – 0.25
Dose rate (μSv/h)
0.25 – 0.5
0.5 – 0.75
0.75 – 1.0
1.0 – 1.5
1.5 – 2.0
2.0 – 2.5
2.5 <

Fukushima Prefecture
Fukushima City
Ministry of Agriculture, Forestry and Fisheries Research Council http://www.s.affrc.go.jp/docs/map/240323.htm
Radioactive Cs Map for Agricultural Lands

Japan: Challenges of Soil Management
To develop measures decreasing environmental risks, especially of climate change, nutrient imbalance, and contamination of radionuclides and heavy metal
To sustain soil fertility and productivity in the systems of environmentally-sound agricultural
To improve soil information system for public use To inherit soil knowledge to the next generation
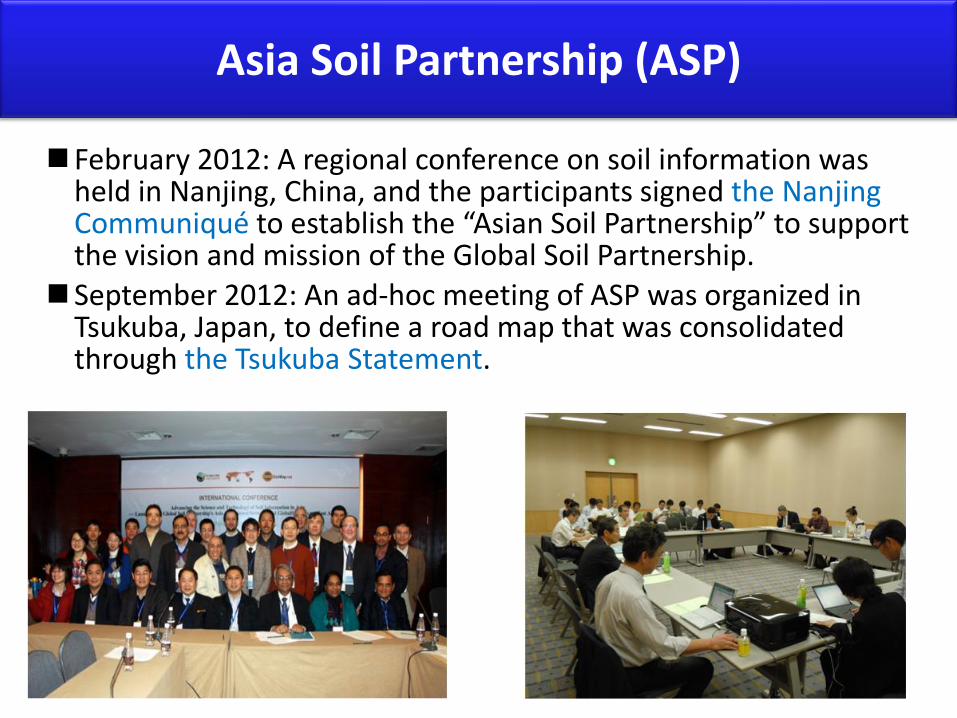
Asia Soil Partnership (ASP)
February 2012: A regional conference on soil information was held in Nanjing, China, and the participants signed the Nanjing Communiqué to establish the “Asian Soil Partnership” to support the vision and mission of the Global Soil Partnership. September 2012: An ad-hoc meeting of ASP was organized in
Tsukuba, Japan, to define a road map that was consolidated through the Tsukuba Statement.

Conserve the environment by listening to wind, observing soil and thinking of our future