Statistical Tools for Similarity Assessment of Quality ...
18
Statistical Tools for Similarity Assessment of Quality Attributes Aili Cheng, Ph.D, Director, Pfizer Statistics FDA-PQRI Conference on Evolving Product Quality Sept 16-17, 2014 1
Transcript of Statistical Tools for Similarity Assessment of Quality ...

Statistical Tools for Similarity Assessment of Quality Attributes
Aili Cheng, Ph.D, Director, Pfizer Statistics
FDA-PQRI Conference on Evolving Product Quality
Sept 16-17, 2014
1

• Comparability:
• Usually, process change by the same sponsor
• Historical data available (e.g. development, process qualification
and control )
• Acceptance criteria are relatively easy to set
• Similarity:
• Change in manufacturer
• Limited (no historical) data available
• May require more rigorous analytical and statistical evaluations
• This talk will focus on similarity
Comparability vs. Similarity
2

• Background
• Statistical challenges
• Possible statistical approaches
• Pros and cons of each method
• Comments / questions
Outline
3

• Objectives
– Biosimilar vs. US-licensed Reference Product
– For global development: non-US-licensed comparator vs. US-
licensed Reference Product
• Importance of Analytical Studies in Biosimilar
Development
– “Analytical studies provide the foundation for an assessment of the
proposed protein product for submission…”
– Include “analytical studies that demonstrate that the biological
product is highly similar to the reference product notwithstanding
minor differences in clinically inactive components”
Background
4 Source: FDA Guidance for Industry Quality Considerations in Demonstrating Biosimilarity to Reference
Protein Product, 2012
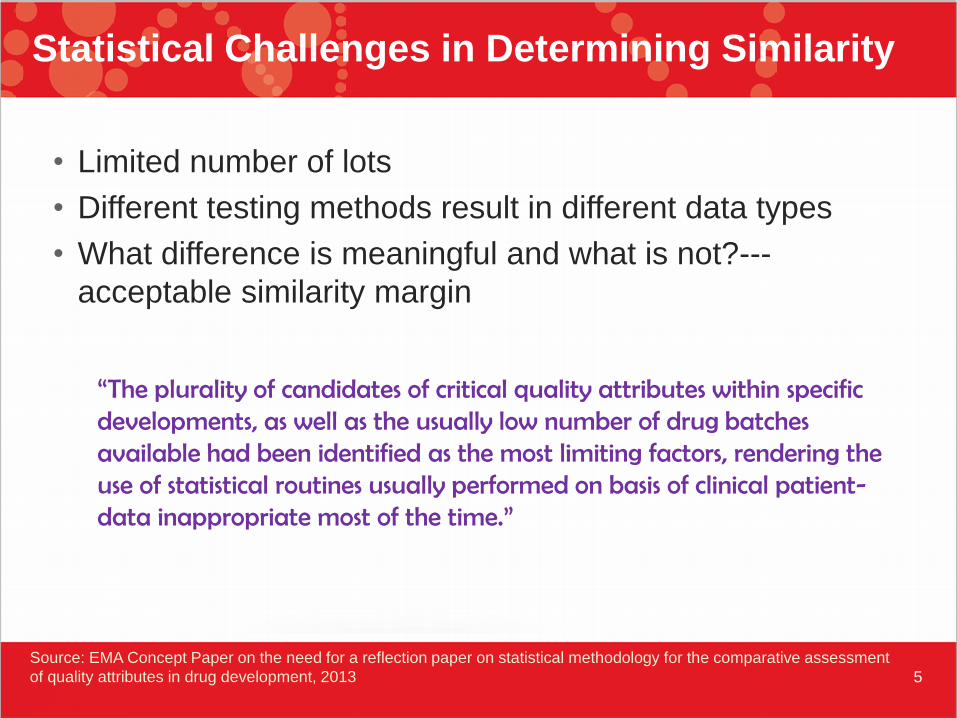
• Limited number of lots
• Different testing methods result in different data types
• What difference is meaningful and what is not?---
acceptable similarity margin
Statistical Challenges in Determining Similarity
5
“The plurality of candidates of critical quality attributes within specific developments, as well as the usually low number of drug batches available had been identified as the most limiting factors, rendering the use of statistical routines usually performed on basis of clinical patient-data inappropriate most of the time.”
Source: EMA Concept Paper on the need for a reflection paper on statistical methodology for the comparative assessment
of quality attributes in drug development, 2013

• +/- 3 Standard Deviation (SD)
• Tolerance Interval
• Equivalence testing
Possible Statistical Solutions
6

Pros • Simple to understand
• Easy to implement
• Consistent with quality control
principle
Cons • Assumes normal distribution
• Limited sample size in practice
• Concern is on the tails, so “usual”
sample size for means may be
too small here
+/- 3 Standard Deviation
7
• Calculate Mean+/-3SD range based on the Reference
lots
• Expect the comparator lots or biosimilars to fall within
the range

Relationship Between Sample Size and SD
8
𝝈 = 𝟒. 𝟓
10 lots:
96.4, 106.3, 97.8, 104.0
107.1, 100.5, 102.0, 109.2
96.6, 104.8
Mean=102.5, SD=4.6
Estimated +/-3SD range:
(88.67, 116.27)
5 lots:
101.1, 94.7, 104.1, 92.7,
105.3
Mean= 99.6, SD=5.6
Estimated +/-3SD range:
(82.8, 116.4)
99.73% of the sample values are expected to fall within (100-3*4.5, 100+3*4.5), i.e. (86.5, 113.5)
99.73%
86.5 113.5

9
For example, the estimated SD from a sample size of 10 can differ from the
true SD by 45% with 95% chance
See details in : Robert W. Burnett, CLINICAL CHEMISTRY, Vol. 21, No. 13, 1975
Relationship Between Sample Size and SD
55 145

• Interval within which we expect a stated proportion of the
population to lie with some confidence.
• +/- 3 std dev can be restated as a TI where we are xx%
confidence that 99.7% is within the stated limits where
xx% depends on the sample size
• Alternatively, any TI can be calculated on the reference
data and the comparator be expected to fall within this
limit
• Non-parametric tolerance interval is available if data does
NOT follow normal distribution, but large sample size is
generally required
Tolerance Interval
10

Univariate TI = 𝜇 ± 𝑘2𝜎 where k2 is a function of confidence,
coverage and sample size where 𝜇 and 𝜎 are estimated
reference mean and variability, respectively
Relationship between Tolerance Parameters and Sample Size
11
5040302010
8
7
6
5
4
3
2
Sample Size (N lots)
k2
Mu
ltip
lier
3 (Target)
20
3.63.4
2.6
[0.90/0.95]
[0.90/0.99]
[0.95/0.99]
confidence/coverage
Figure 3 k2 multiplier for various sample sizes and confidence/coverage TI
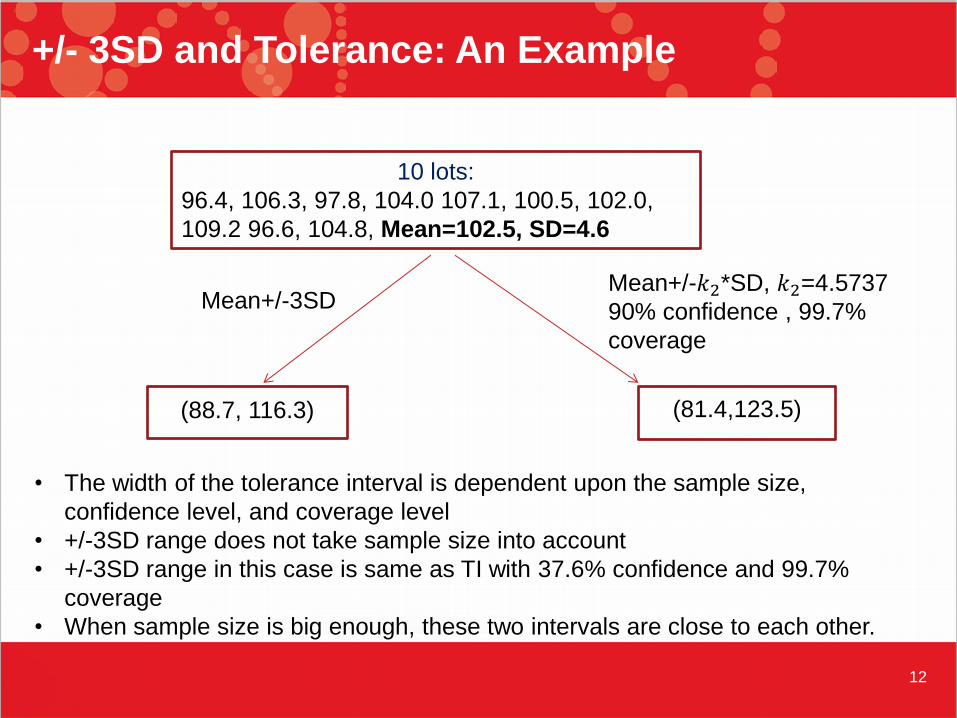
+/- 3SD and Tolerance: An Example
12
10 lots:
96.4, 106.3, 97.8, 104.0 107.1, 100.5, 102.0,
109.2 96.6, 104.8, Mean=102.5, SD=4.6
Mean+/-3SD Mean+/-𝑘2*SD, 𝑘2=4.5737
90% confidence , 99.7%
coverage
(81.4,123.5) (88.7, 116.3)
• The width of the tolerance interval is dependent upon the sample size,
confidence level, and coverage level
• +/-3SD range does not take sample size into account
• +/-3SD range in this case is same as TI with 37.6% confidence and 99.7%
coverage
• When sample size is big enough, these two intervals are close to each other.

Mean Difference
between reference
and comparator
mean+/- 3σ
(%)
90/99 TI*
(%)
0 σ 0.3 (1.5**) 0.08 (0.4)
0.50 σ 0.6 (3) 0.2 (1)
1.0 σ 2.2 (11) 0.9 (4)
2 σ 16 (58) 8.5 (36)
Probability of Failing Assuming Normal Distribution
13
*90/99 TI was based on n = 20 lots
Calculation assumes that SD is known.
**Probability of failing at least one in the next 5 lots

Testing for Equivalence
14
• Equivalence compares the expected difference, confidence
interval on the mean difference, (fat point) to similarity limits
(L1, L2)
• Similarity Limits are determined prior to experimentation
L
1L
2
HA= Equivalence
H0= Non equivalence
1-
2
H0= Non equivalence
0 L1 L2
( )
“Fat Point”
Confidence Interval
On Average Difference
Conclude: If Confidence Interval is within Similarity Limit
then reference and comparator are Equivalent
Not Equivalent Not Equivalent
Reference - Comparator

Pros • Assess if the mean difference is
within acceptable margin
• Relies on comparisons of means
which (in theory) follow a normal
distribution
Cons • How to determine the
equivalence margin?
• Bigger variability require bigger
sample size
• Determination of confidence level
and power
• Multiple comparisons
Equivalence Testing
15

• Focus on Individual lots
– +/- 3SD range
– Tolerance Interval
• Focus on mean
– Equivalence Testing
• Be careful of assumptions required by different
statistical tools
Summary
16

• Kim Vukovinsky
• Beverly Ingram
• Andrew Rugaiganisa
• Brad Evans
• Greg Steeno
• Debbie Kraus
Acknowledgement
17

Relationship Between Sample Size and SD
18
Re
lati
ve
Fre
qu
en
cy
Distribution
Estimates
for n = 3
Distribution
Estimates
for n = 5
Distribution
Estimates
for n = 10
Distribution
Estimates
for n = 20
= 100, = 4.5 = 2.0 = 0.5
0.0
0.1
0.2
0.3
0.4
0.5
90 100 110
0.0
0.1
0.2
0.3
0.4
0.5
90 100 110
0.0
0.1
0.2
0.3
0.4
0.5
90 100 110
0.0
0.1
0.2
0.3
0.4
0.5
90 100 110
0
1
2
3
4
95 105
0
1
2
95 105
0
1
2
95 105
0
1
2
95 105
0.3
70 75 80 85 90 95 100 105 110 115 120 125 1300.0
0.1
0.2
0.4
0.5
0.3
70 75 80 85 90 95 100 105 110 115 120 125 1300.0
0.1
0.2
0.4
0.5
0.3
70 75 80 85 90 95 100 105 110 115 120 125 1300.0
0.1
0.2
0.4
0.5
0.3
70 75 80 85 90 95 100 105 110 115 120 125 1300.0
0.1
0.2
0.4
0.5
True SD=4.5 True SD=2 True SD=0.5