Statistical methods highlights health economists
25
Statistical methods highlights for health economists Lecture notes Randy Ellis, March 16, 2015
Transcript of Statistical methods highlights health economists

Statistical methods highlights for health economists
Lecture notesRandy Ellis,
March 16, 2015
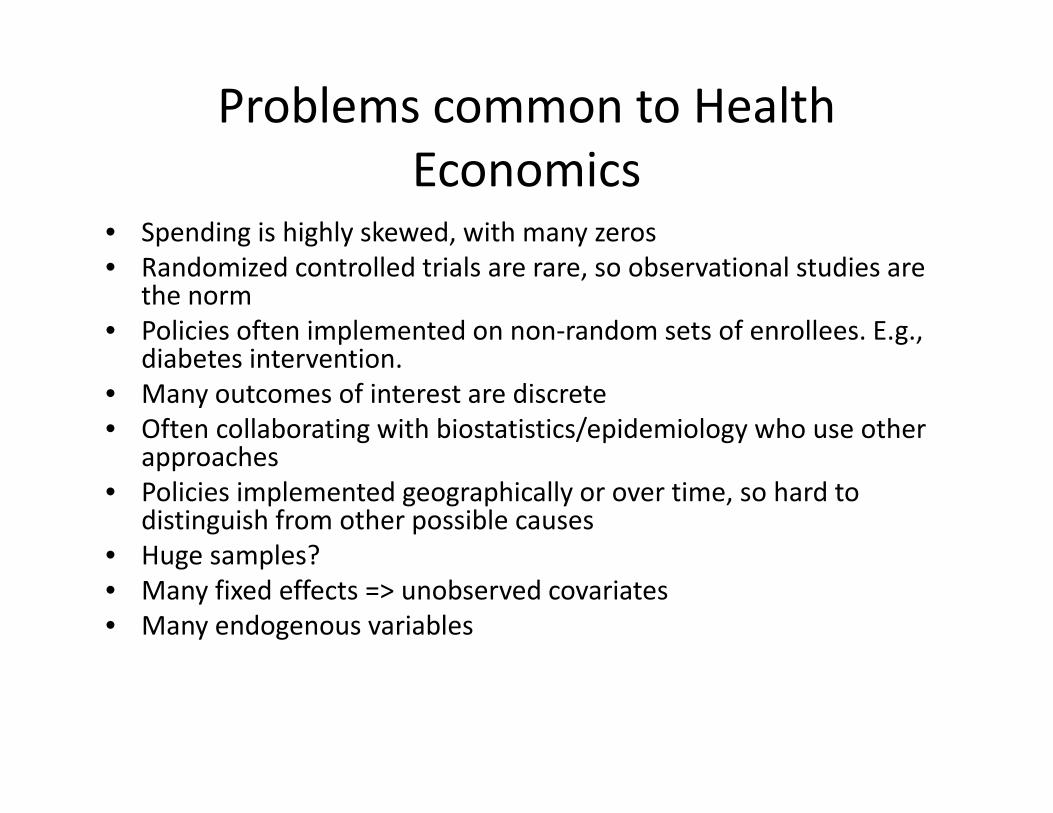
Problems common to Health Economics
• Spending is highly skewed, with many zeros• Randomized controlled trials are rare, so observational studies are
the norm• Policies often implemented on non‐random sets of enrollees. E.g.,
diabetes intervention.• Many outcomes of interest are discrete• Often collaborating with biostatistics/epidemiology who use other
approaches• Policies implemented geographically or over time, so hard to
distinguish from other possible causes• Huge samples?• Many fixed effects => unobserved covariates• Many endogenous variables
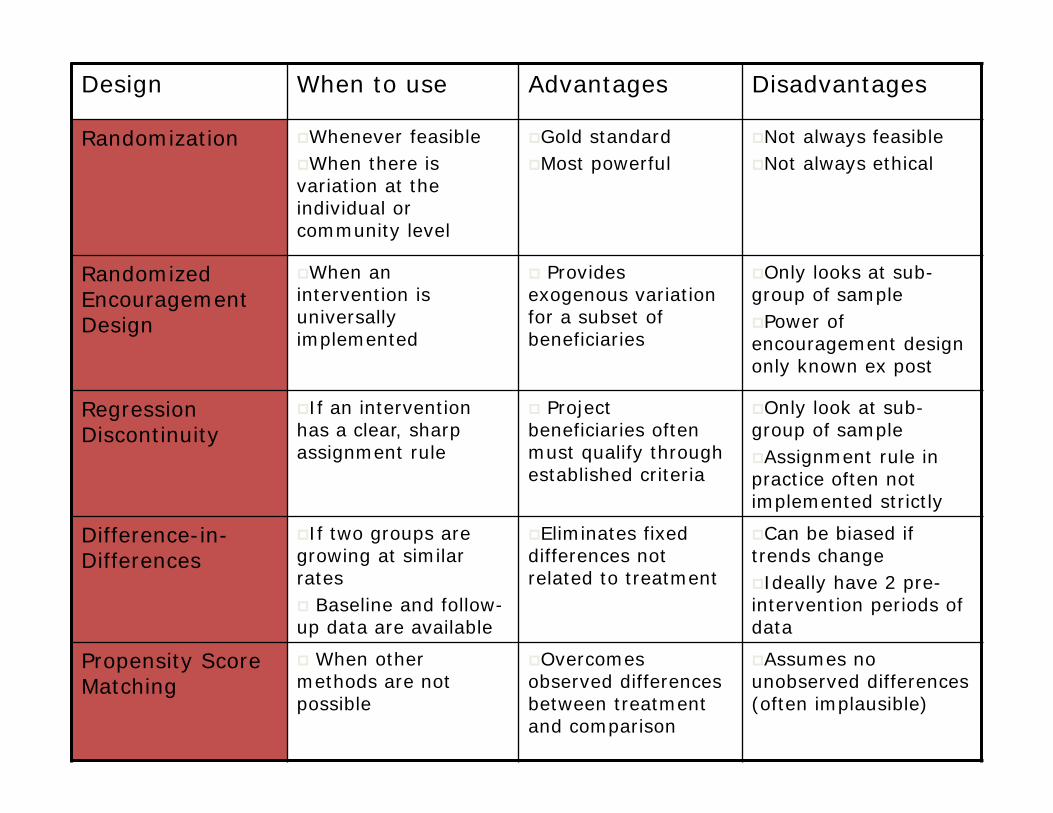
Design When to use Advantages Disadvantages
Randomization Whenever feasibleWhen there is variation at the individual or community level
Gold standardMost powerful
Not always feasibleNot always ethical
Randomized Encouragement Design
When an intervention is universally implemented
Provides exogenous variation for a subset of beneficiaries
Only looks at sub-group of samplePower of encouragement design only known ex post
Regression Discontinuity
If an intervention has a clear, sharp assignment rule
Project beneficiaries often must qualify through established criteria
Only look at sub-group of sampleAssignment rule in practice often not implemented strictly
Difference-in-Differences
If two groups are growing at similar rates Baseline and follow-up data are available
Eliminates fixed differences not related to treatment
Can be biased if trends changeIdeally have 2 pre-intervention periods of data
Propensity Score Matching
When other methods are not possible
Overcomes observed differences between treatment and comparison
Assumes no unobserved differences (often implausible)

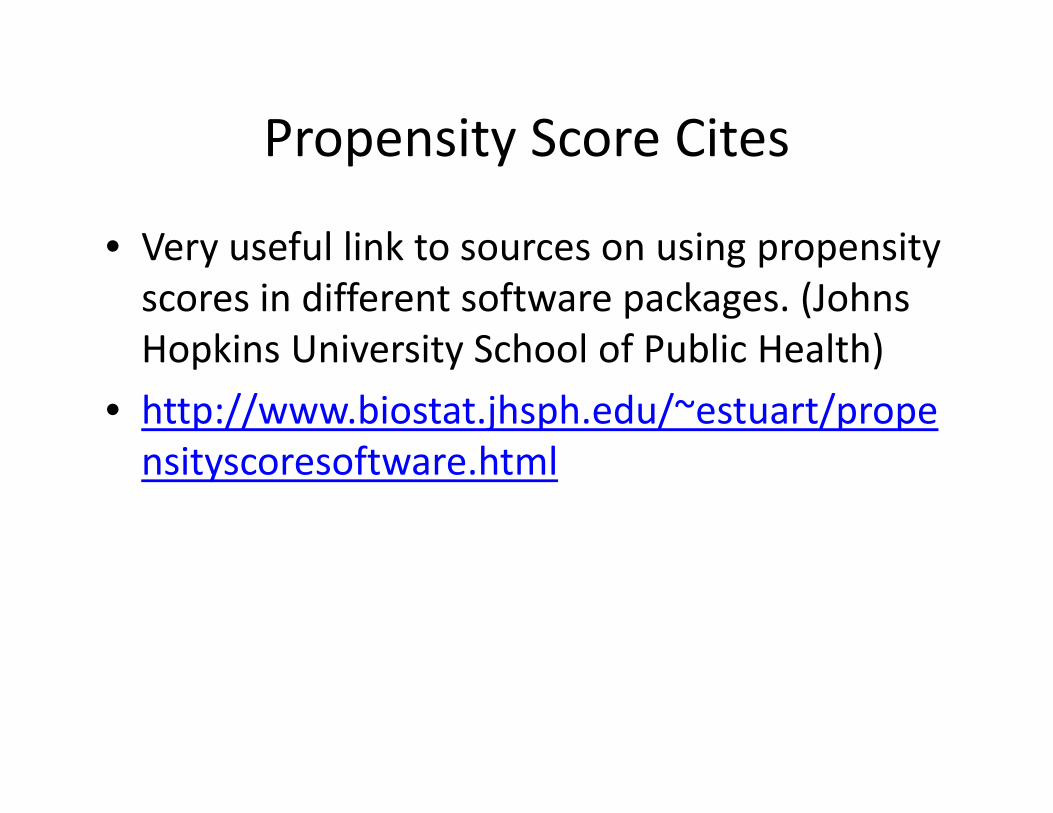
Propensity Score Cites
• Very useful link to sources on using propensity scores in different software packages. (Johns Hopkins University School of Public Health)
• http://www.biostat.jhsph.edu/~estuart/propensityscoresoftware.html
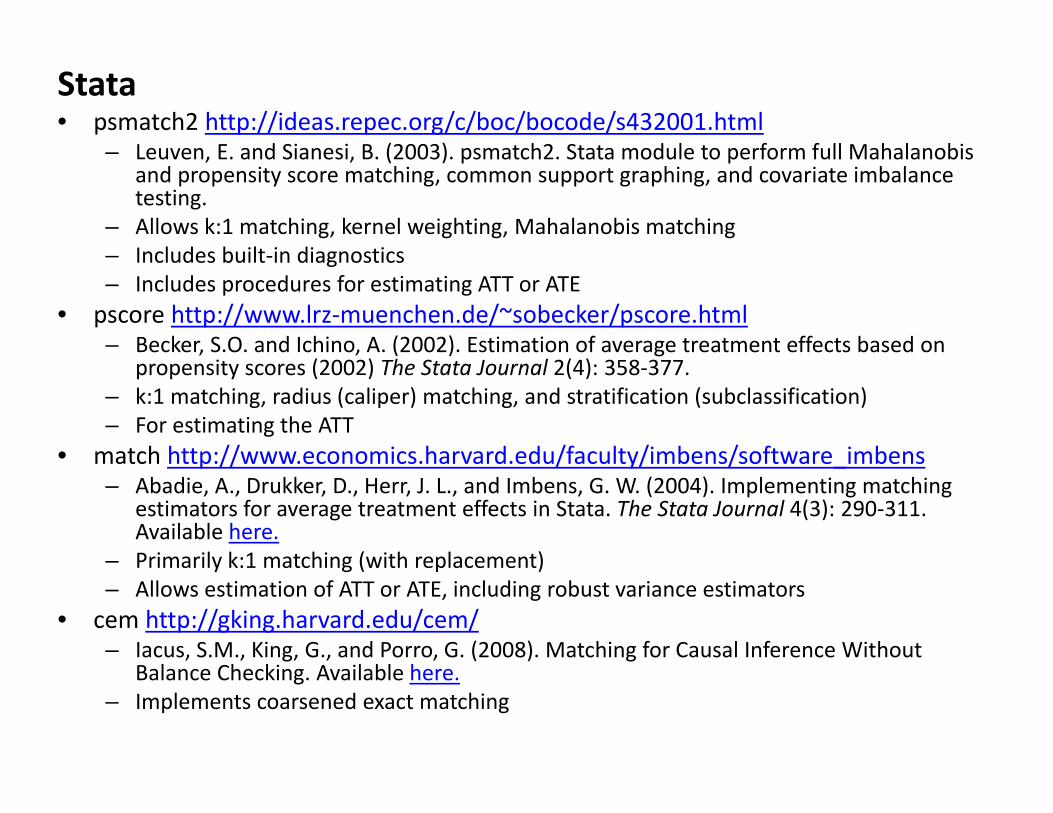
Stata• psmatch2 http://ideas.repec.org/c/boc/bocode/s432001.html
– Leuven, E. and Sianesi, B. (2003). psmatch2. Stata module to perform full Mahalanobisand propensity score matching, common support graphing, and covariate imbalance testing.
– Allows k:1 matching, kernel weighting, Mahalanobis matching – Includes built‐in diagnostics – Includes procedures for estimating ATT or ATE
• pscore http://www.lrz‐muenchen.de/~sobecker/pscore.html– Becker, S.O. and Ichino, A. (2002). Estimation of average treatment effects based on
propensity scores (2002) The Stata Journal 2(4): 358‐377. – k:1 matching, radius (caliper) matching, and stratification (subclassification) – For estimating the ATT
• match http://www.economics.harvard.edu/faculty/imbens/software_imbens– Abadie, A., Drukker, D., Herr, J. L., and Imbens, G. W. (2004). Implementing matching
estimators for average treatment effects in Stata. The Stata Journal 4(3): 290‐311. Available here.
– Primarily k:1 matching (with replacement) – Allows estimation of ATT or ATE, including robust variance estimators
• cem http://gking.harvard.edu/cem/– Iacus, S.M., King, G., and Porro, G. (2008). Matching for Causal Inference Without
Balance Checking. Available here.– Implements coarsened exact matching
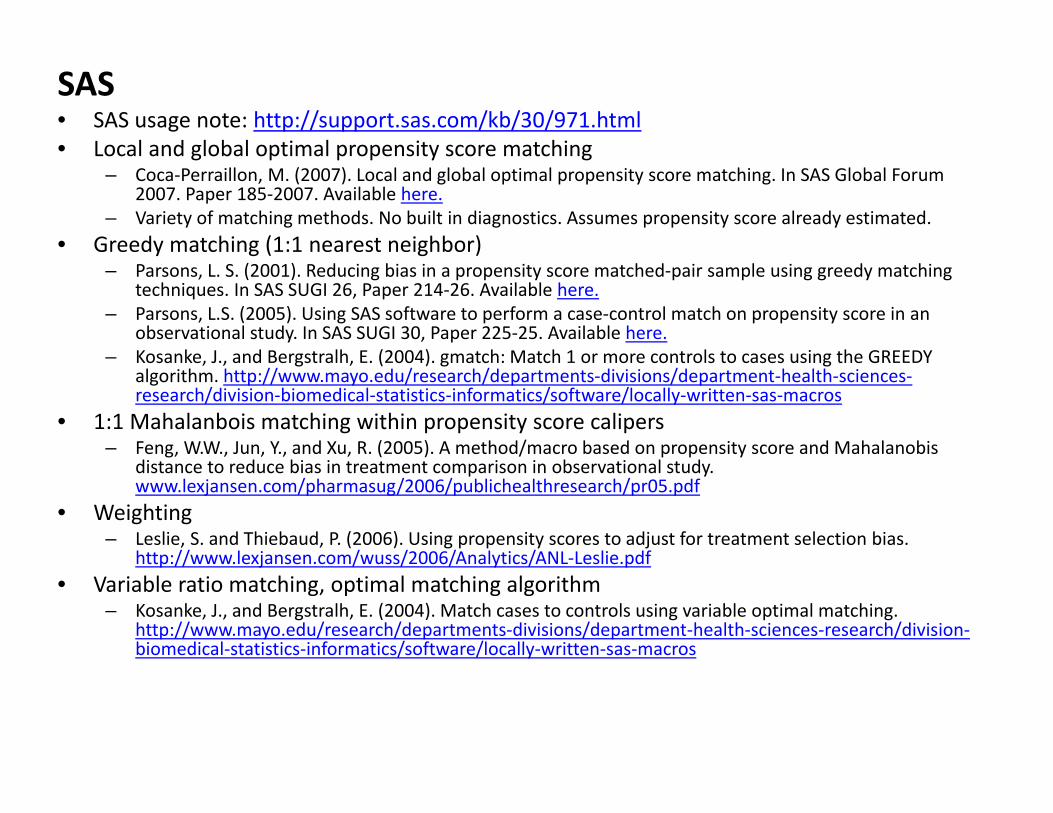
SAS • SAS usage note: http://support.sas.com/kb/30/971.html• Local and global optimal propensity score matching
– Coca‐Perraillon, M. (2007). Local and global optimal propensity score matching. In SAS Global Forum 2007. Paper 185‐2007. Available here.
– Variety of matching methods. No built in diagnostics. Assumes propensity score already estimated. • Greedy matching (1:1 nearest neighbor)
– Parsons, L. S. (2001). Reducing bias in a propensity score matched‐pair sample using greedy matching techniques. In SAS SUGI 26, Paper 214‐26. Available here.
– Parsons, L.S. (2005). Using SAS software to perform a case‐control match on propensity score in an observational study. In SAS SUGI 30, Paper 225‐25. Available here.
– Kosanke, J., and Bergstralh, E. (2004). gmatch: Match 1 or more controls to cases using the GREEDY algorithm. http://www.mayo.edu/research/departments‐divisions/department‐health‐sciences‐research/division‐biomedical‐statistics‐informatics/software/locally‐written‐sas‐macros
• 1:1 Mahalanbois matching within propensity score calipers – Feng, W.W., Jun, Y., and Xu, R. (2005). A method/macro based on propensity score and Mahalanobis
distance to reduce bias in treatment comparison in observational study. www.lexjansen.com/pharmasug/2006/publichealthresearch/pr05.pdf
• Weighting – Leslie, S. and Thiebaud, P. (2006). Using propensity scores to adjust for treatment selection bias.
http://www.lexjansen.com/wuss/2006/Analytics/ANL‐Leslie.pdf• Variable ratio matching, optimal matching algorithm
– Kosanke, J., and Bergstralh, E. (2004). Match cases to controls using variable optimal matching. http://www.mayo.edu/research/departments‐divisions/department‐health‐sciences‐research/division‐biomedical‐statistics‐informatics/software/locally‐written‐sas‐macros
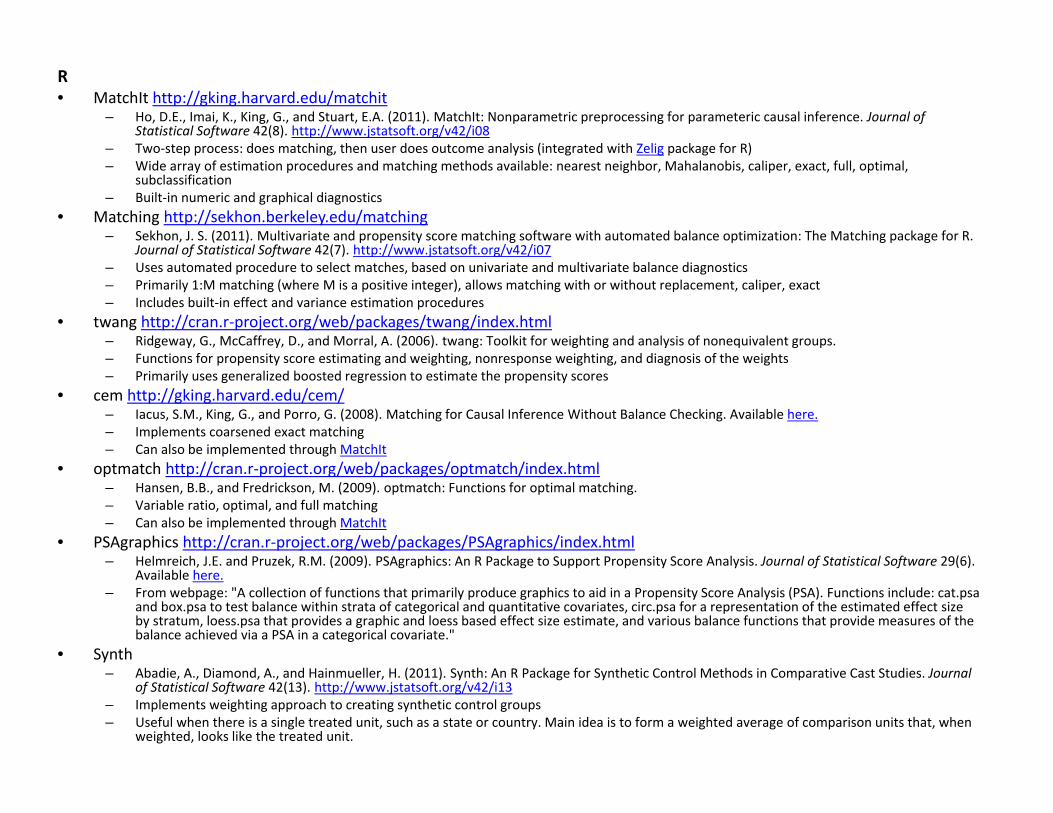
R• MatchIt http://gking.harvard.edu/matchit
– Ho, D.E., Imai, K., King, G., and Stuart, E.A. (2011). MatchIt: Nonparametric preprocessing for parameteric causal inference. Journal of Statistical Software 42(8). http://www.jstatsoft.org/v42/i08
– Two‐step process: does matching, then user does outcome analysis (integrated with Zelig package for R) – Wide array of estimation procedures and matching methods available: nearest neighbor, Mahalanobis, caliper, exact, full, optimal,
subclassification– Built‐in numeric and graphical diagnostics
• Matching http://sekhon.berkeley.edu/matching– Sekhon, J. S. (2011). Multivariate and propensity score matching software with automated balance optimization: The Matching package for R.
Journal of Statistical Software 42(7). http://www.jstatsoft.org/v42/i07– Uses automated procedure to select matches, based on univariate and multivariate balance diagnostics – Primarily 1:M matching (where M is a positive integer), allows matching with or without replacement, caliper, exact – Includes built‐in effect and variance estimation procedures
• twang http://cran.r‐project.org/web/packages/twang/index.html– Ridgeway, G., McCaffrey, D., and Morral, A. (2006). twang: Toolkit for weighting and analysis of nonequivalent groups. – Functions for propensity score estimating and weighting, nonresponse weighting, and diagnosis of the weights – Primarily uses generalized boosted regression to estimate the propensity scores
• cem http://gking.harvard.edu/cem/– Iacus, S.M., King, G., and Porro, G. (2008). Matching for Causal Inference Without Balance Checking. Available here.– Implements coarsened exact matching – Can also be implemented through MatchIt
• optmatch http://cran.r‐project.org/web/packages/optmatch/index.html– Hansen, B.B., and Fredrickson, M. (2009). optmatch: Functions for optimal matching. – Variable ratio, optimal, and full matching – Can also be implemented through MatchIt
• PSAgraphics http://cran.r‐project.org/web/packages/PSAgraphics/index.html– Helmreich, J.E. and Pruzek, R.M. (2009). PSAgraphics: An R Package to Support Propensity Score Analysis. Journal of Statistical Software 29(6).
Available here.– From webpage: "A collection of functions that primarily produce graphics to aid in a Propensity Score Analysis (PSA). Functions include: cat.psa
and box.psa to test balance within strata of categorical and quantitative covariates, circ.psa for a representation of the estimated effect size by stratum, loess.psa that provides a graphic and loess based effect size estimate, and various balance functions that provide measures of the balance achieved via a PSA in a categorical covariate."
• Synth – Abadie, A., Diamond, A., and Hainmueller, H. (2011). Synth: An R Package for Synthetic Control Methods in Comparative Cast Studies. Journal
of Statistical Software 42(13). http://www.jstatsoft.org/v42/i13 – Implements weighting approach to creating synthetic control groups – Useful when there is a single treated unit, such as a state or country. Main idea is to form a weighted average of comparison units that, when
weighted, looks like the treated unit.
Matching Methods
Selected slides from an unknown professor at UC Berkeley who posted
some slides.
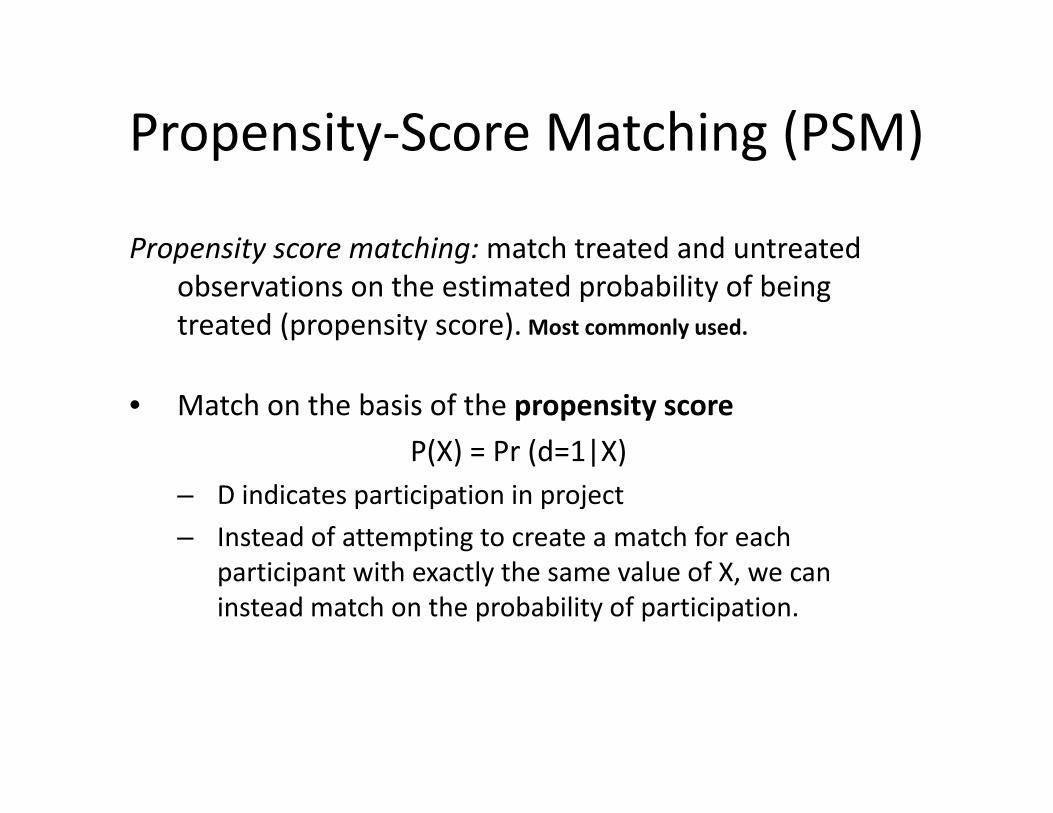
Propensity‐Score Matching (PSM)
Propensity score matching:match treated and untreated observations on the estimated probability of being treated (propensity score).Most commonly used.
• Match on the basis of the propensity scoreP(X) = Pr (d=1|X)
– D indicates participation in project– Instead of attempting to create a match for each
participant with exactly the same value of X, we can instead match on the probability of participation.
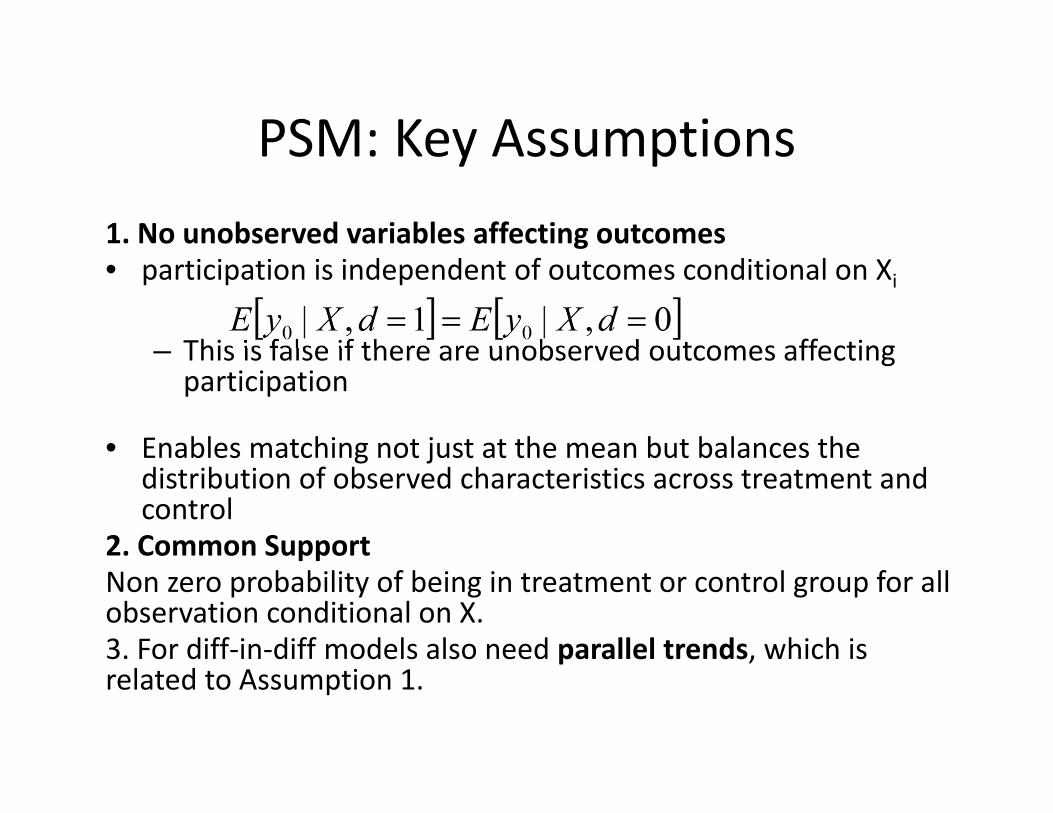
PSM: Key Assumptions1. No unobserved variables affecting outcomes• participation is independent of outcomes conditional on Xi
– This is false if there are unobserved outcomes affecting participation
• Enables matching not just at the mean but balances the distribution of observed characteristics across treatment and control
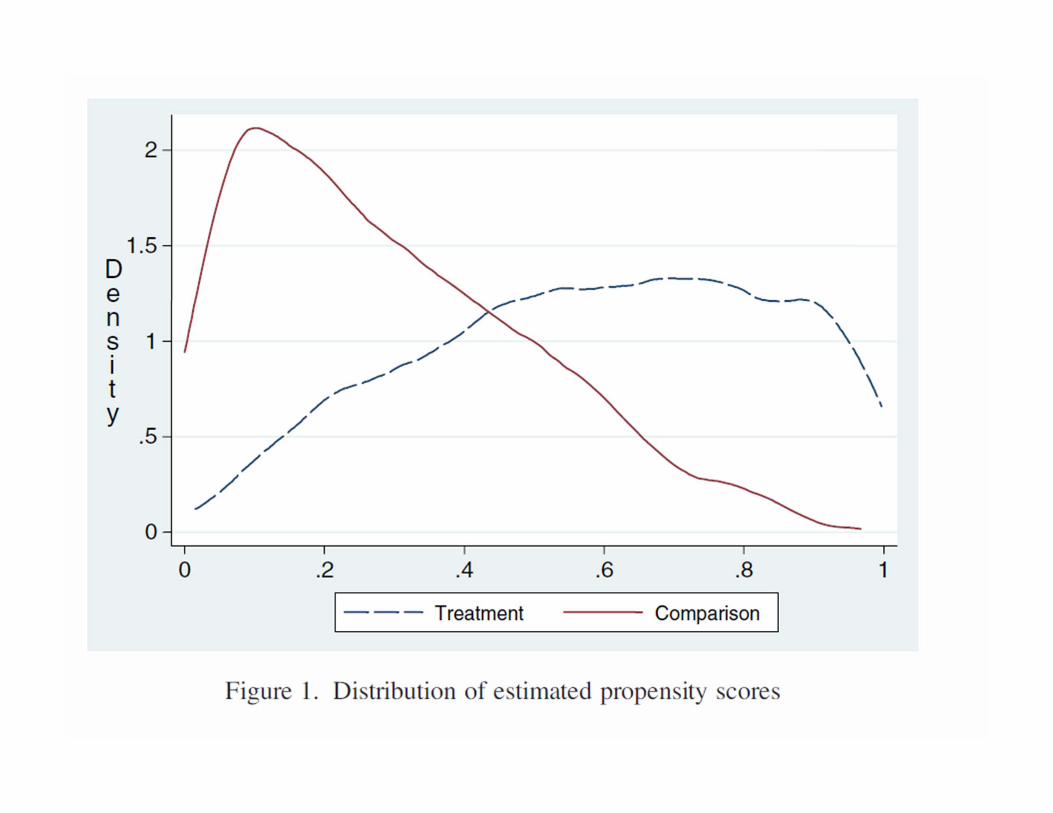
2. Common SupportNon zero probability of being in treatment or control group for all observation conditional on X.3. For diff‐in‐diff models also need parallel trends, which is related to Assumption 1.
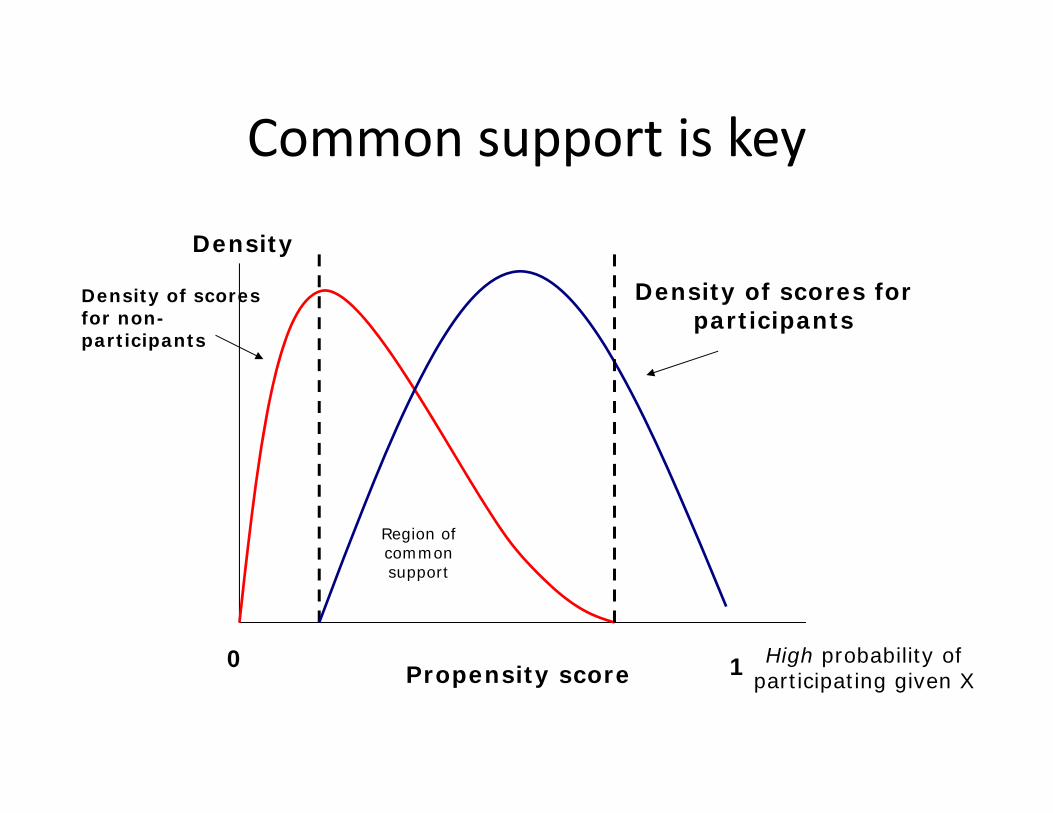
Density
0 1Propensity score
Region of common support
Density of scores for participants
High probability of participating given X
Density of scores for non-participants
Common support is key
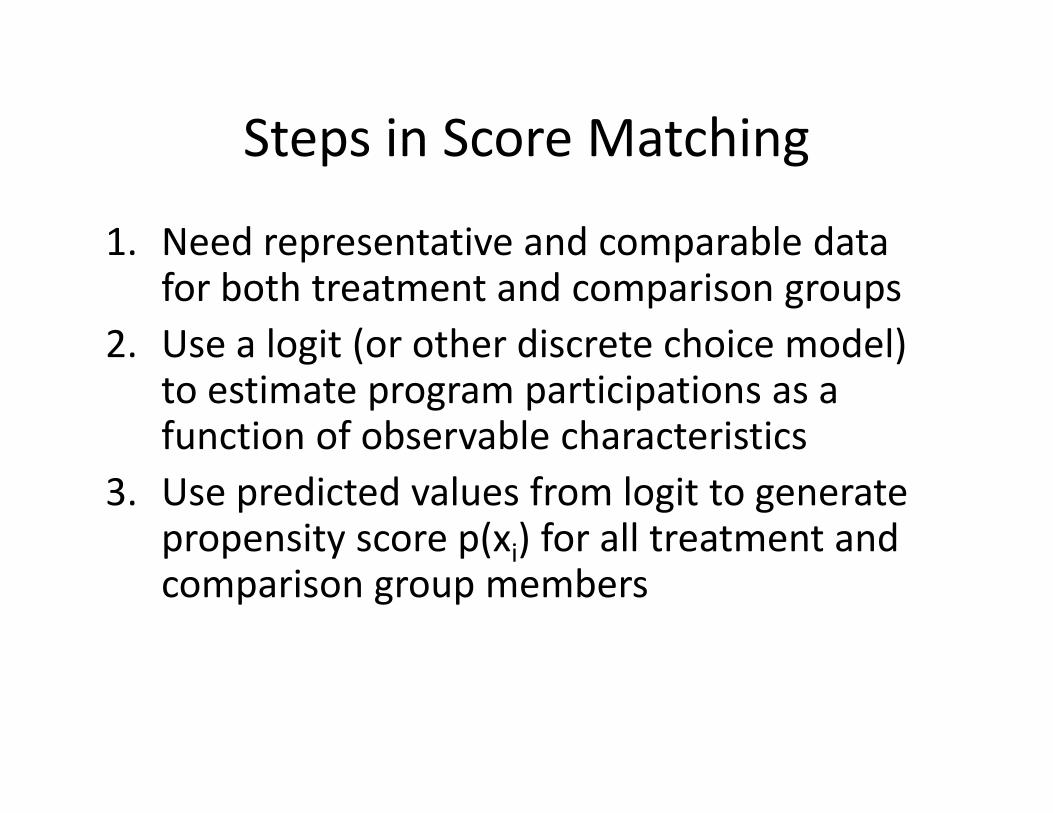
Steps in Score Matching
1. Need representative and comparable data for both treatment and comparison groups
2. Use a logit (or other discrete choice model) to estimate program participations as a function of observable characteristics
3. Use predicted values from logit to generate propensity score p(xi) for all treatment and comparison group members
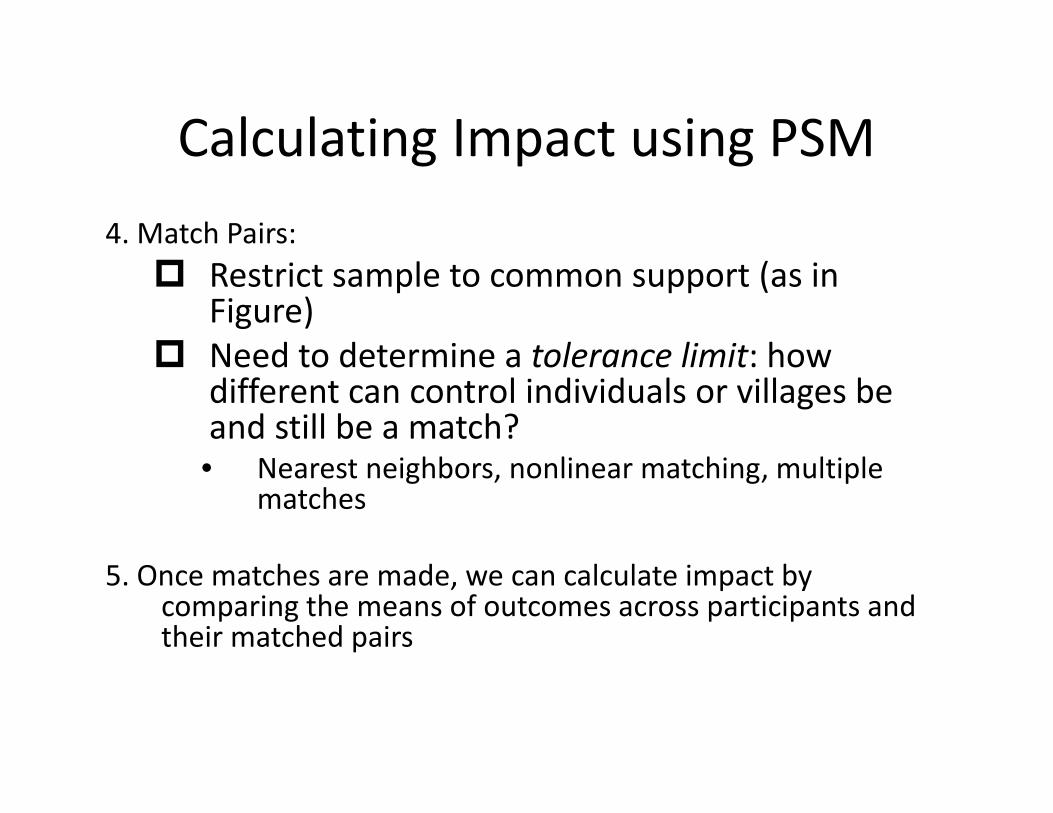
Calculating Impact using PSM4. Match Pairs: Restrict sample to common support (as in
Figure) Need to determine a tolerance limit: how
different can control individuals or villages be and still be a match?• Nearest neighbors, nonlinear matching, multiple
matches
5. Once matches are made, we can calculate impact by comparing the means of outcomes across participants and their matched pairs
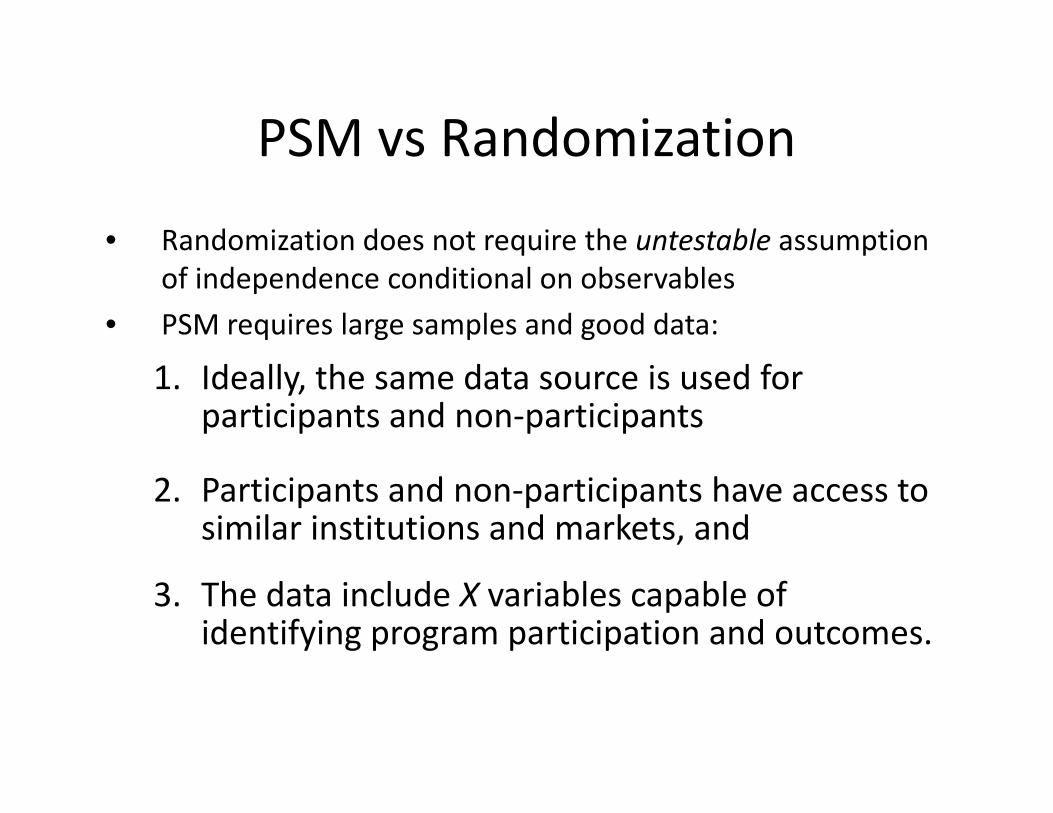
PSM vs Randomization
• Randomization does not require the untestable assumption of independence conditional on observables
• PSM requires large samples and good data:
1. Ideally, the same data source is used for participants and non‐participants
2. Participants and non‐participants have access to similar institutions and markets, and
3. The data include X variables capable of identifying program participation and outcomes.
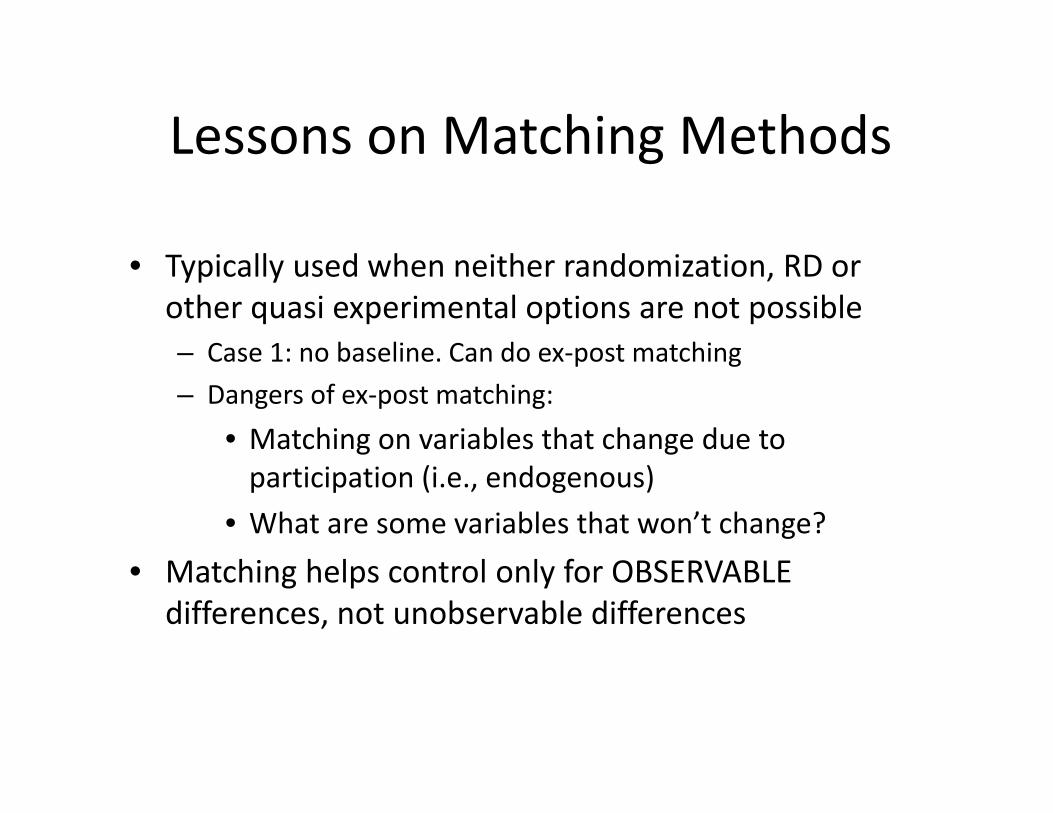
Lessons on Matching Methods
• Typically used when neither randomization, RD or other quasi experimental options are not possible – Case 1: no baseline. Can do ex‐post matching– Dangers of ex‐post matching:
• Matching on variables that change due to participation (i.e., endogenous)
• What are some variables that won’t change?• Matching helps control only for OBSERVABLE
differences, not unobservable differences
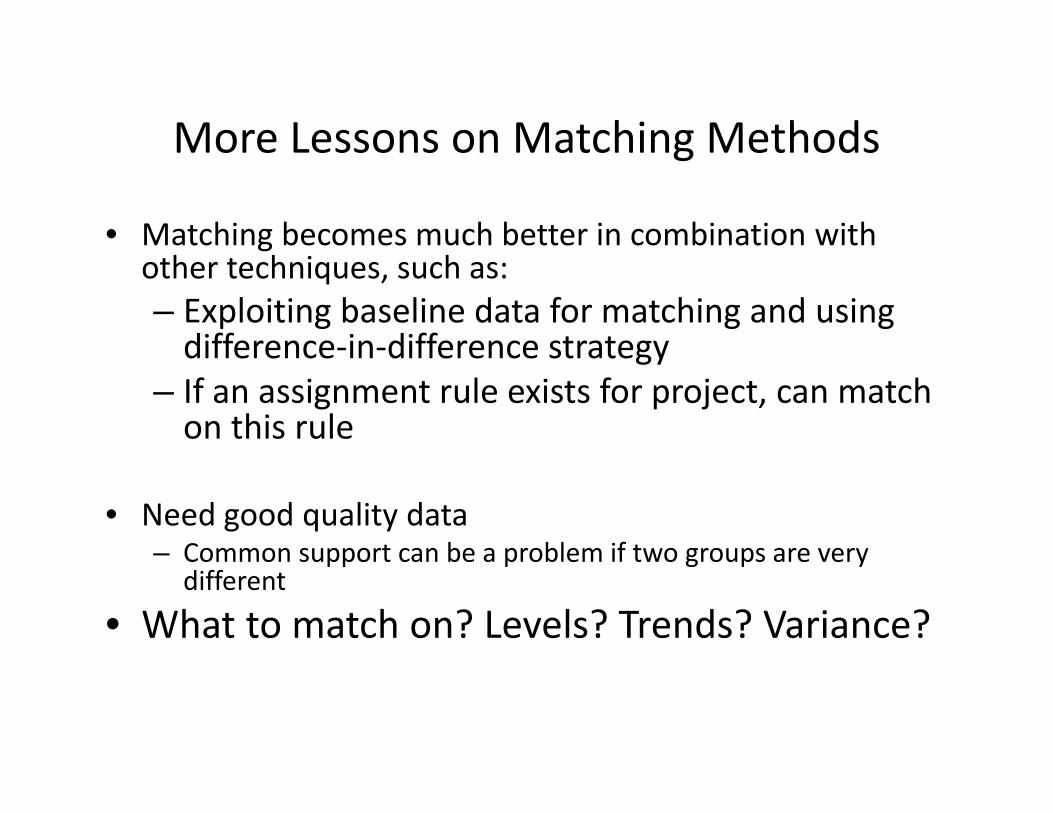
More Lessons on Matching Methods
• Matching becomes much better in combination with other techniques, such as:– Exploiting baseline data for matching and using difference‐in‐difference strategy
– If an assignment rule exists for project, can match on this rule
• Need good quality data– Common support can be a problem if two groups are very
different
• What to match on? Levels? Trends? Variance?
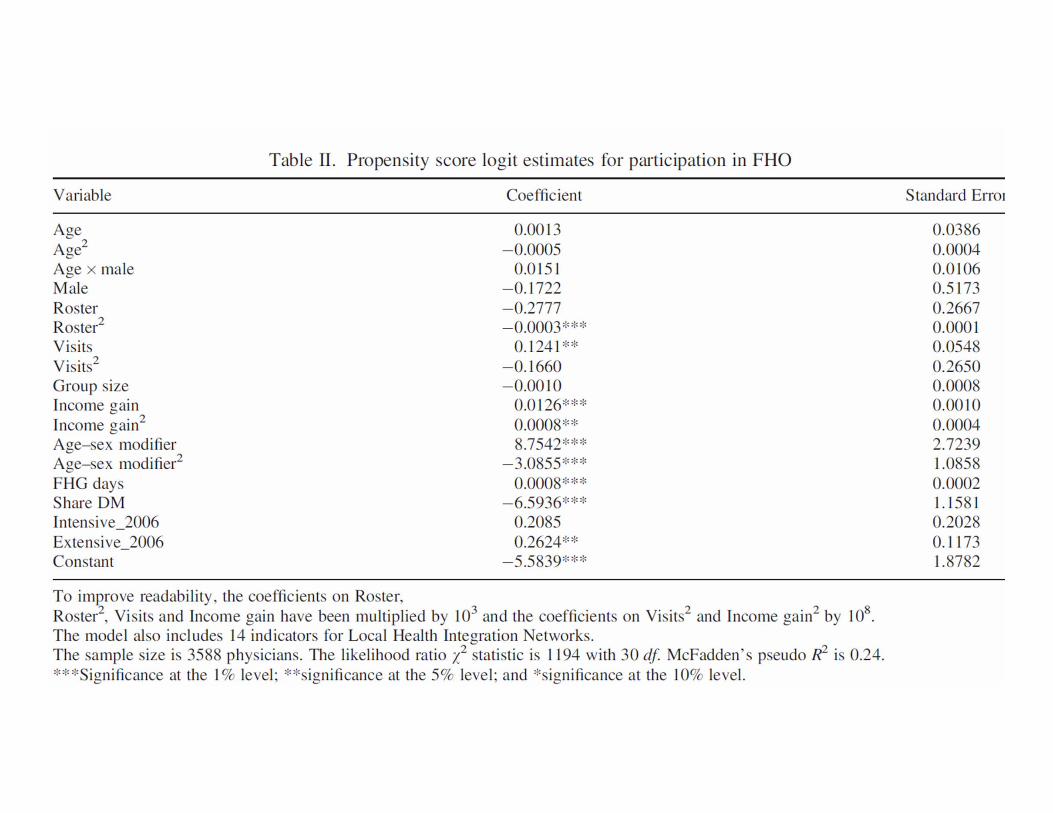
LINK BETWEEN PAY FOR PERFORMANCE INCENTIVES AND PHYSICIAN PAYMENT
MECHANISMS: EVIDENCE FROM THE DIABETES MANAGEMENT INCENTIVE IN ONTARIO
JASMIN KANTAREVICa and BORIS KRALJb
aOntario Medical Association, CanadabUniversity of Toronto, Canada
HEALTH ECONOMICSHealth Econ. 22: 1417–1439 (2013)
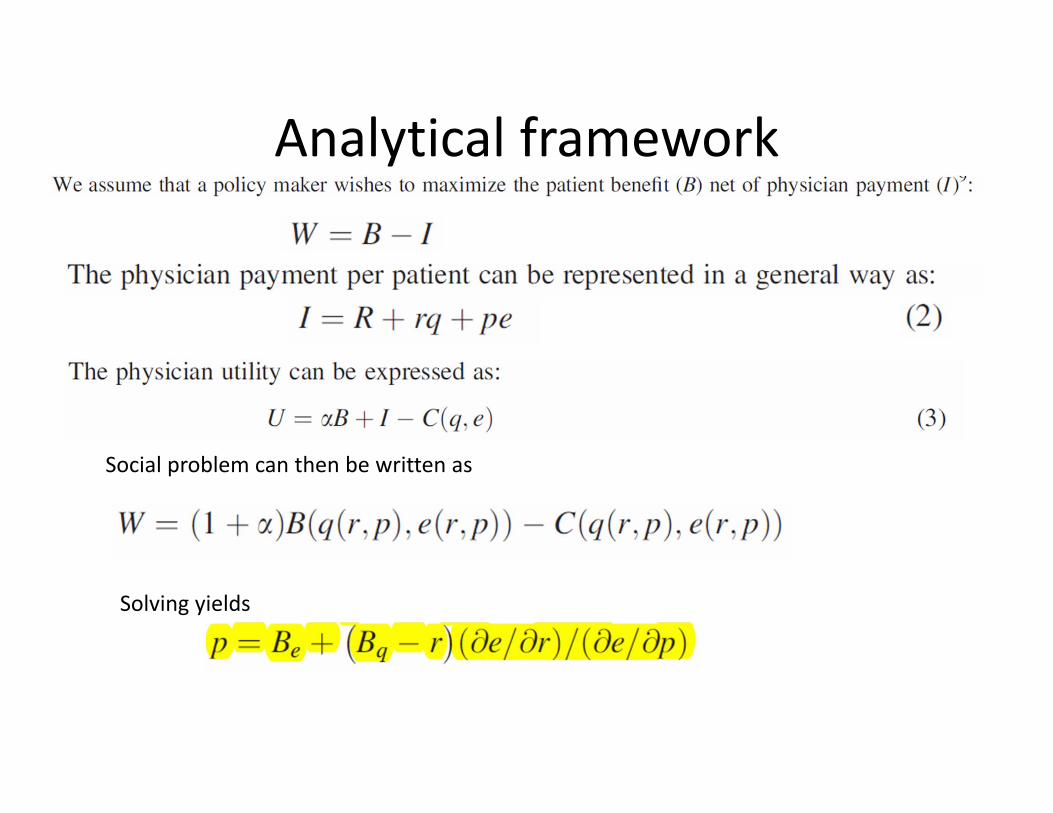
Analytical framework
Solving yields
Social problem can then be written as
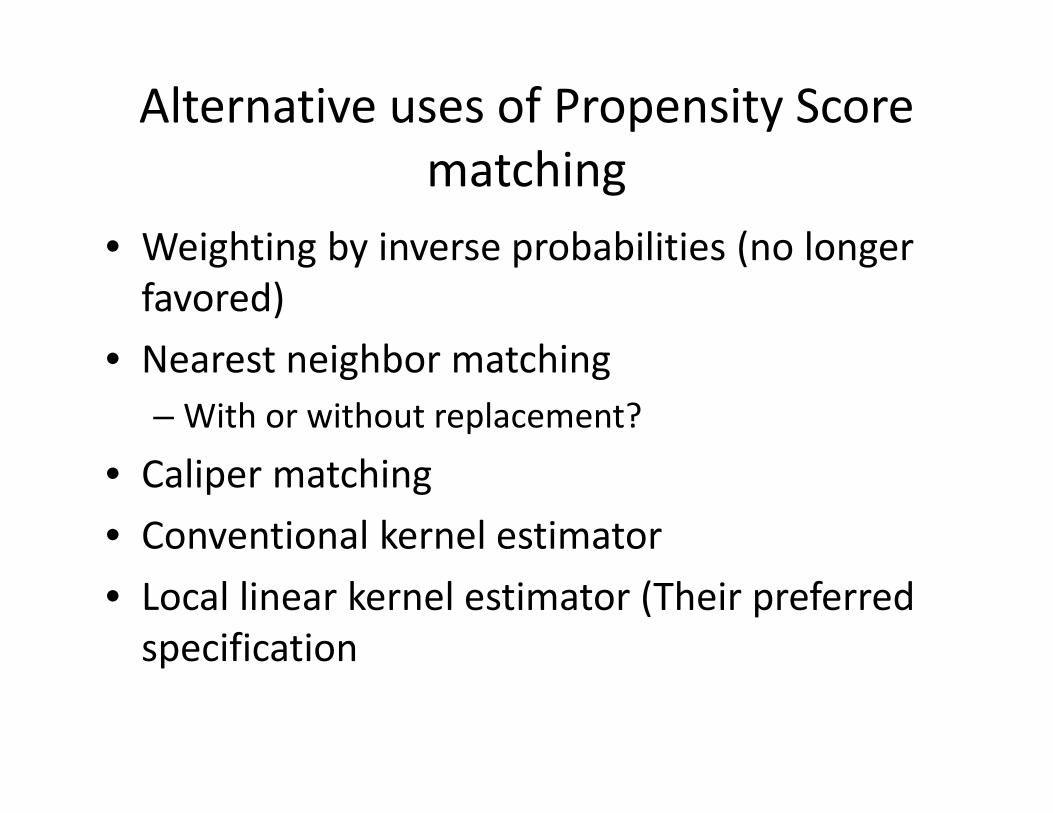
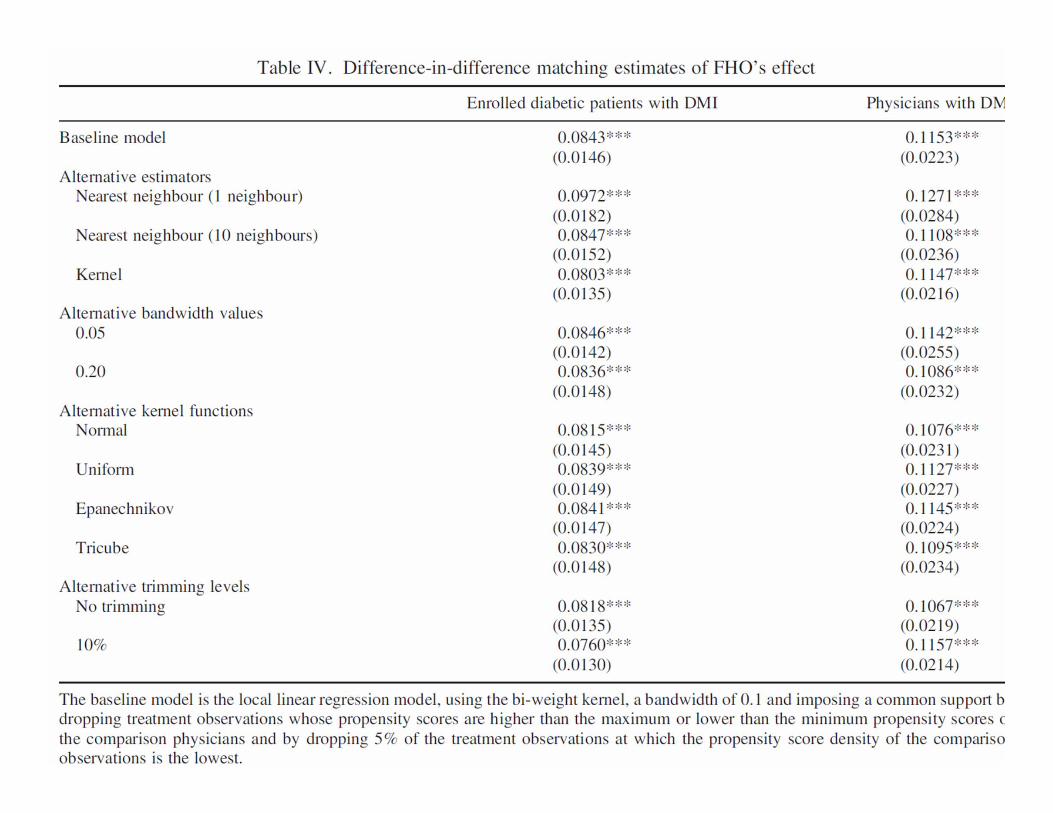
Alternative uses of Propensity Score matching
• Weighting by inverse probabilities (no longer favored)
• Nearest neighbor matching– With or without replacement?
• Caliper matching• Conventional kernel estimator• Local linear kernel estimator (Their preferred specification