Part 1 Ten statistical highlights in global public health
12
9 WORLD HEALTH STATISTICS 2007 Part 1 Ten statistical highlights in global public health
Transcript of Part 1 Ten statistical highlights in global public health
9
WORLD HEALTH STATISTICS
2007
Part 1Ten statistical highlights
in global public health

5683
583
347-
9473
10
WORLD HEALTH STATISTICS
2007
1. Monitoring progress: appropriate use of health statistics
The ability to monitor progress towards the Millennium Development Goals (MDGs) depends primarily on data availability. There is a stark contrast between the data available about the under-fi ve mortality rate, the indicator for MDG 4, and the maternal mortality ratio, against which MDG 5 is monitored.
Under-fi ve mortality rates are derived from vital registration systems, censuses and household surveys.1 In most countries, there are data points available over time, and these are analysed to obtain the best current estimate. Uncertainty occurs when there is a need to project estimates forward to the current year since the most recent data generally refer to a few years earlier. Measuring the maternal mortality ratio has been a greater challenge because, compared with deaths among children, maternal deaths are rare events. In countries without a complete death registration system and medical certifi cation, large-scale household surveys or censuses using verbal autopsy techniques provide estimates of the ratio, since facility-based statistics are inherently biased. Even then, much uncertainty remains. As a consequence, the global estimate of the maternal mortality ratio is published only once every fi ve years, and in 2000, 40% of countries’ estimates were based on fi gures pre-dicted by regression.4 The ability to reliably assess trends in maternal mortality is limited.
For monitoring, it is important to distinguish between corrected and predicted statistics.5,6 Corrected statistics use adjustments made for known biases and, if needed, are based on a systematic reconciliation of data from multiple sources using established, transparent methods. Predicted statistics use a set of assumptions about the associa-tion between other factors and the quantity of interest, such as maternal mortality, to fi ll gaps in the data over time (projecting into the present or future) or space (from one population with data to another with limited or no data). Predicted statistics are not suitable for monitoring progress. Unfortunately, the MDG monitoring process relies heav-ily on predicted statistics.5 This mismatch was created partly by the demand for more timely statistics and partly by the lack of data and good measurement strategies for certain statistics. It is crucial for the international community to invest in data collection and use indicators that are valid, reliable and comparable; the international community must also have well-defi ned measurement strategies for monitoring progress and evaluating health programmes.7
0
50
100
150
200
250
300
350
400
450
Und
er-fi
ve m
orta
lity
rate
per
1 0
00 li
ve b
irth
s
1960 1965 1970 1975 1980 1985 1990 1995 2000 2005
Best estimate
Year
Estimation of under-fi ve mortality rates from recent data: Malawi1–3
Note: Each point in the fi gure is a mortality rate for children under 5 years of age (under-fi ve mortality rate) derived from questions in household surveys or censuses about the survival history of children (direct method) or from questions on children ever born and still alive in the household (indirect method).
Note: The maternal mortality ratio was estimated for 173 countries.
How the maternal mortality ratio was estimated in 20004
Complete vital registration data
35%
Reproductive age mortality studies 8%
Household surveys or censuses
18%
Regression model of covariates
39%

11
WORLD HEALTH STATISTICS
2007
2. People living with HIV: better data, better estimates
Past estimates
Current estimates
0
10
20
30
40
50
Num
ber
of p
eopl
e in
fect
ed (
mill
ions
)
2000 2001 2002 2003 2004 2005 2006
Year
The exact number of people living with HIV is unknown despite the fact that HIV infection can easily be diagnosed by a widely used antibody test. Achieving 100% certainty about the number of people living with HIV globally would require testing every person in the world for HIV every year. Nonetheless, we can estimate the number by using data from different sources, such as surveillance of pregnant women attending antenatal clinics, household surveys with HIV testing and sentinel surveillance among populations at higher risk of HIV infection.
UNAIDS and WHO, in close consultation with countries, employ a standardized method for obtaining estimates of HIV prevalence among men and women. An increasing number of countries have adopted these methods to develop their own national estimates. But an estimate is only as good as the data. As more complete data become available, past estimates may need to be adjusted. This is the case for the AIDS epidemic. The bars in the fi gure estimate the number of people infected with HIV at the time of publication of each annual AIDS epidemic update since 2000.8–14 The line shows the best estimates for each year that were made in 2006 in the most recent update: this reveals not only that the size of the epidemic had been overestimated previously but also that it is still growing. The ranges around the estimates refl ect the degree of uncertainty about global HIV estimates.
Improvements in recent estimates are the result of revisions made using better data. These revisions used data from national population-based surveys and benefi ted from improvements in the quality and coverage of sentinel surveillance systems in many countries.
The latest estimates cannot be compared directly with estimates published previously. It would be incorrect to derive a trend by comparing the bars. The 2006 estimates for this year and past years (indicated by the line) are more accurate than those produced in previous years since they are based on improved methods and used more data than earlier estimates. The need to exercise caution is not unusual when comparing global estimates of disease over time.
Number of people living with HIV: comparing past and current estimates8–14

5683
583
347-
9473
12
WORLD HEALTH STATISTICS
2007
3. Future health: projected deaths for selected causes to 2030
0
2
4
6
10
8
12
Proj
ecte
d gl
obal
dea
ths
(mill
ions
)
2000 2010 2020 2030
Cancers
Ischaemic heart disease
Stroke
HIV/AIDS
Other infectious diseases
Road trafficaccidents
TuberculosisMalaria
Year
Predicted statistics have an important and useful role in helping to inform planning and strategic decision-making, and in prioritizing research and development issues. According to projections carried out by WHO and published in early 2006,15 the world will experience a substantial shift in the distribution of deaths from younger age groups to older age groups, and from communicable diseases to noncommunicable diseases during the next 25 years. Large declines in mortality are projected to occur between 2002 and 2030 for all of the principal communicable, maternal, perinatal and nutritional causes, with the exception of HIV/AIDS. Global deaths from HIV/AIDS are projected to rise from 2.8 million in 2002 to 6.5 million in 2030 under a baseline scenario that assumes antiretroviral drug coverage reaches 80% by 2012.
Although age-specifi c death rates for most noncommunicable diseases are projected to decline, the ageing of the global population will result in signifi cant increases in the total number of deaths caused by most non-communicable diseases over the next 30 years. Overall, noncommunicable conditions will account for almost 70% of all deaths in 2030 under the baseline scenario. The projected 40% increase in global deaths resulting from injury between 2002 and 2030 is predominantly due to the increasing number of deaths from road traffi c accidents.
The four leading causes of death globally in 2030 are projected to be ischaemic heart disease, cerebrovas-cular disease (stroke), HIV/AIDS and chronic obstructive pulmonary disease. The total number of tobacco-attributable deaths is projected to rise from 5.4 million in 2005 to 6.4 million in 2015 and to 8.3 million in 2030. Tobacco is projected to kill 50% more people in 2015 than HIV/AIDS and to be responsible for 10% of all deaths.
Projected global deaths for selected causes of death, 2002–203015
13
WORLD HEALTH STATISTICS
2007
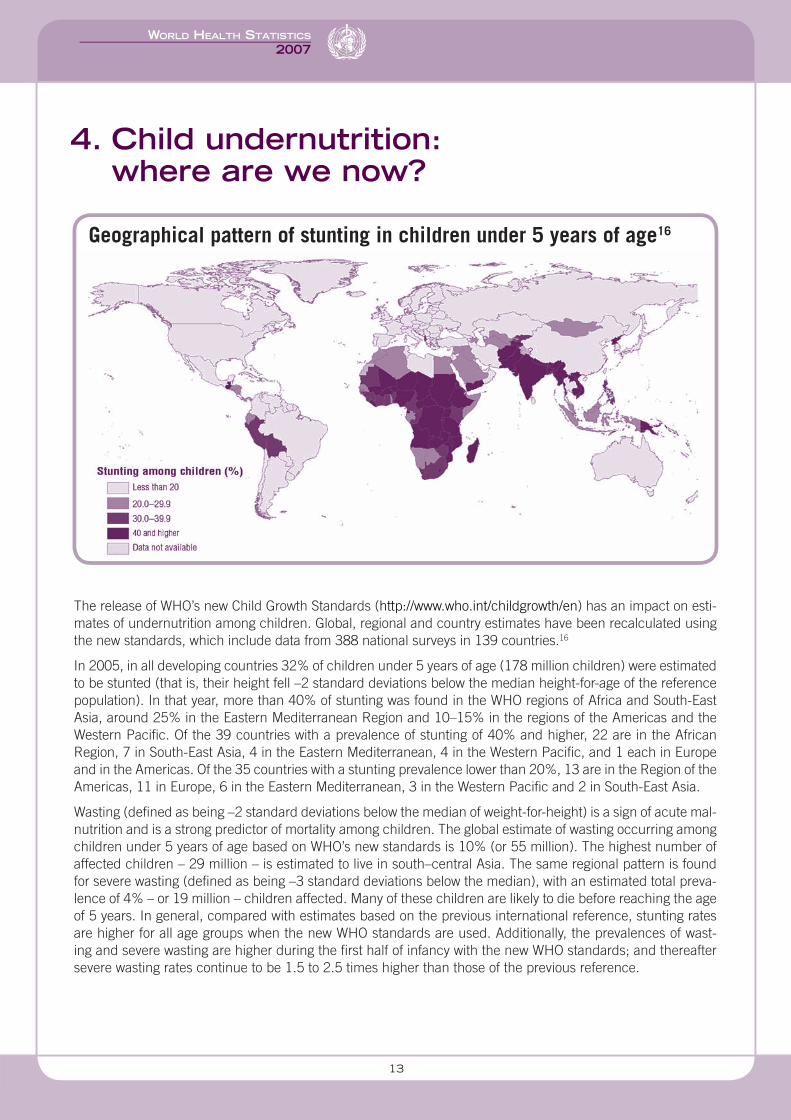
4. Child undernutrition: where are we now?
The release of WHO’s new Child Growth Standards (http://www.who.int/childgrowth/en) has an impact on esti-mates of undernutrition among children. Global, regional and country estimates have been recalculated using the new standards, which include data from 388 national surveys in 139 countries.16
In 2005, in all developing countries 32% of children under 5 years of age (178 million children) were estimated to be stunted (that is, their height fell –2 standard deviations below the median height-for-age of the reference population). In that year, more than 40% of stunting was found in the WHO regions of Africa and South-East Asia, around 25% in the Eastern Mediterranean Region and 10–15% in the regions of the Americas and the Western Pacifi c. Of the 39 countries with a prevalence of stunting of 40% and higher, 22 are in the African Region, 7 in South-East Asia, 4 in the Eastern Mediterranean, 4 in the Western Pacifi c, and 1 each in Europe and in the Americas. Of the 35 countries with a stunting prevalence lower than 20%, 13 are in the Region of the Americas, 11 in Europe, 6 in the Eastern Mediterranean, 3 in the Western Pacifi c and 2 in South-East Asia.
Wasting (defi ned as being –2 standard deviations below the median of weight-for-height) is a sign of acute mal-nutrition and is a strong predictor of mortality among children. The global estimate of wasting occurring among children under 5 years of age based on WHO’s new standards is 10% (or 55 million). The highest number of affected children – 29 million – is estimated to live in south–central Asia. The same regional pattern is found for severe wasting (defi ned as being –3 standard deviations below the median), with an estimated total preva-lence of 4% – or 19 million – children affected. Many of these children are likely to die before reaching the age of 5 years. In general, compared with estimates based on the previous international reference, stunting rates are higher for all age groups when the new WHO standards are used. Additionally, the prevalences of wast-ing and severe wasting are higher during the fi rst half of infancy with the new WHO standards; and thereafter severe wasting rates continue to be 1.5 to 2.5 times higher than those of the previous reference.
Geographical pattern of stunting in children under 5 years of age16
5683
583
347-
9473
14
WORLD HEALTH STATISTICS
2007
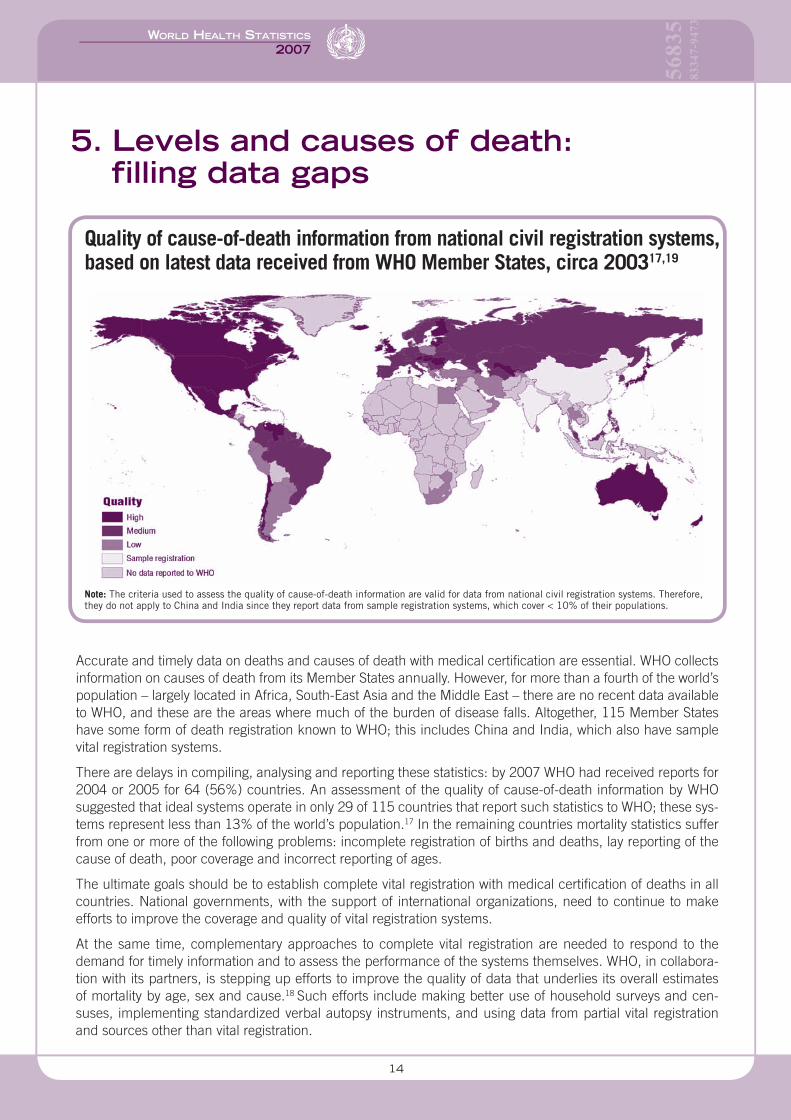
5. Levels and causes of death: fi lling data gaps
Accurate and timely data on deaths and causes of death with medical certifi cation are essential. WHO collects information on causes of death from its Member States annually. However, for more than a fourth of the world’s population – largely located in Africa, South-East Asia and the Middle East – there are no recent data available to WHO, and these are the areas where much of the burden of disease falls. Altogether, 115 Member States have some form of death registration known to WHO; this includes China and India, which also have sample vital registration systems.
There are delays in compiling, analysing and reporting these statistics: by 2007 WHO had received reports for 2004 or 2005 for 64 (56%) countries. An assessment of the quality of cause-of-death information by WHO suggested that ideal systems operate in only 29 of 115 countries that report such statistics to WHO; these sys-tems represent less than 13% of the world’s population.17 In the remaining countries mortality statistics suffer from one or more of the following problems: incomplete registration of births and deaths, lay reporting of the cause of death, poor coverage and incorrect reporting of ages.
The ultimate goals should be to establish complete vital registration with medical certifi cation of deaths in all countries. National governments, with the support of international organizations, need to continue to make efforts to improve the coverage and quality of vital registration systems.
At the same time, complementary approaches to complete vital registration are needed to respond to the demand for timely information and to assess the performance of the systems themselves. WHO, in collabora-tion with its partners, is stepping up efforts to improve the quality of data that underlies its overall estimates of mortality by age, sex and cause.18 Such efforts include making better use of household surveys and cen-suses, implementing standardized verbal autopsy instruments, and using data from partial vital registration and sources other than vital registration.
Quality of cause-of-death information from national civil registration systems, based on latest data received from WHO Member States, circa 200317,19
Note: The criteria used to assess the quality of cause-of-death information are valid for data from national civil registration systems. Therefore, they do not apply to China and India since they report data from sample registration systems, which cover < 10% of their populations.

15
WORLD HEALTH STATISTICS
2007
6. Tobacco use and poverty: high prevalence among the world’s poorest
Health inequalities refer to differences in health status or in the distribution of health determinants between different populations. The burden of disease attributable to tobacco use weighs increasingly heavily on popu-lations in developing economies. According to the latest estimates, more than 80% of the 8.3 million deaths attributed to tobacco and projected to the year 2030 will occur in low-income and middle-income countries.15
Data on the prevalence of smoking among adults in developing countries are limited. WHO’s World Health Sur-vey provides a valuable insight into the comparative prevalence among adults aged 18 and older.20 The results of the 2003–2004 survey indicate that daily tobacco smoking is most prevalent among the lowest-income households in developing economies – that is, among the poorest of the poor. Indeed, prevalence is highest among the poor in all WHO regions except the European Region. The difference in prevalence between the poor and the (relatively) rich is greatest among the group of South-East Asian countries surveyed, where average per capita income is lowest.
The combination of a higher prevalence of tobacco use and more limited access to health resources results in severe health inequalities, and is likely to perpetuate the vicious circle of illness and poverty. Inequalities between and within countries in terms of the risk of infectious diseases now have been extended to inequalities in risk factors for noncommunicable diseases; this has implications for health systems at all levels.
1st quintile (poorest)5th quintile (richest)Per capita GDP
0
10
20
30
40
50
Prev
alen
ce o
f dai
ly to
bacc
o sm
okin
g,
2003
–200
4 (%
)
0
2 000
4 000
6 000
8 000
10 000
12 000
14 000
Per
capi
ta g
ross
dom
estic
pro
duct
, 200
4 (i
nter
natio
nal $
)
SEAR AFR EMR WPR AMR EURWHO region*
SEAR, South-East Asia; AFR, African; EMR, Eastern Mediterranean; WPR, Western Pacific; AMR, Americas; EUR, European.
Daily tobacco smoking among adults aged 18 years and older, by income quintile and WHO region20
* Surveyed countries in each region include: African Region (AFR): Burkina Faso, Chad, Comoros, Congo, Côte d’Ivoire, Ethiopia, Ghana, Kenya, Malawi, Mali, Mauritania, Mauritius, Namibia, Senegal, South Africa, Swaziland, Zambia, Zimbabwe; Region of the Americas (AMR): Brazil, Dominican Republic, Ecuador, Guatemala, Mexico, Paraguay, Uruguay; Eastern Mediterranean Region (EMR): Morocco, Pakistan, Tunisia, United Arab Emirates; European Region (EUR): Bosnia and Herzegovina, Croatia, Czech Republic, Estonia, Georgia, Hungary, Kazakhstan, Latvia, Russian Federation, Slovakia, Slovenia, Spain, Ukraine; South-East Asia Region (SEAR): Bangladesh, India, Sri Lanka, Myanmar, Nepal; Western Pacifi c Region (WPR): China, Laos, Malaysia, Philippines, Viet Nam.
5683
583
347-
9473
16
WORLD HEALTH STATISTICS
2007
7. Mental illness: depression worsens the health of people with chronic illness
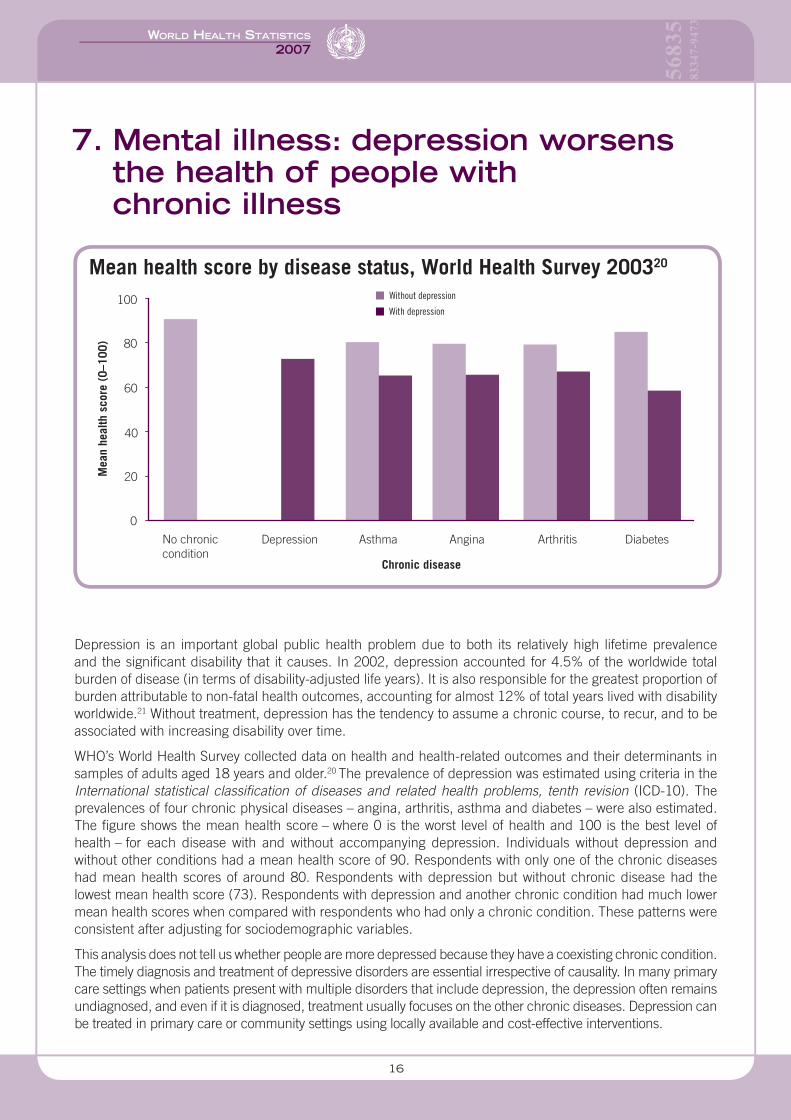
Depression is an important global public health problem due to both its relatively high lifetime prevalence and the signifi cant disability that it causes. In 2002, depression accounted for 4.5% of the worldwide total burden of disease (in terms of disability-adjusted life years). It is also responsible for the greatest proportion of burden attributable to non-fatal health outcomes, accounting for almost 12% of total years lived with disability worldwide.21 Without treatment, depression has the tendency to assume a chronic course, to recur, and to be associated with increasing disability over time.
WHO’s World Health Survey collected data on health and health-related outcomes and their determinants in samples of adults aged 18 years and older.20 The prevalence of depression was estimated using criteria in the International statistical classifi cation of diseases and related health problems, tenth revision (ICD-10). The prevalences of four chronic physical diseases – angina, arthritis, asthma and diabetes – were also estimated. The fi gure shows the mean health score – where 0 is the worst level of health and 100 is the best level of health – for each disease with and without accompanying depression. Individuals without depression and without other conditions had a mean health score of 90. Respondents with only one of the chronic diseases had mean health scores of around 80. Respondents with depression but without chronic disease had the lowest mean health score (73). Respondents with depression and another chronic condition had much lower mean health scores when compared with respondents who had only a chronic condition. These patterns were consistent after adjusting for sociodemographic variables.
This analysis does not tell us whether people are more depressed because they have a coexisting chronic condition. The timely diagnosis and treatment of depressive disorders are essential irrespective of causality. In many primary care settings when patients present with multiple disorders that include depression, the depression often remains undiagnosed, and even if it is diagnosed, treatment usually focuses on the other chronic diseases. Depression can be treated in primary care or community settings using locally available and cost-effective interventions.
Without depression
With depression
0
20
40
60
80
100
Mea
n he
alth
sco
re (
0–10
0)
No chroniccondition
Depression Asthma Angina Arthritis Diabetes
Chronic disease
Mean health score by disease status, World Health Survey 200320

17
WORLD HEALTH STATISTICS
2007
8. Inequalities in health: understanding their determinants
Measuring socioeconomic inequalities in a population’s health is important because national averages often mask differences within and across subgroups. For policy purposes it is especially relevant to understand why unfair and avoidable inequalities (or inequities) exist and what actions may be taken to improve equity. Decom-position analysis is one approach used to quantify the contribution made by different factors to inequities in health; it takes into account the socioeconomic distribution of determinants of health and health indicators.22
Such analysis can serve as one input to aid in the development of evidence-based policies, relevant to a par-ticular context or country, to reduce inequities.
For example, decomposition analysis using data from the 2003 Demographic and Health Survey in Mozambique shows that the four biggest contributors to poor growth in children (defi ned as height-for-age falling 2 standard deviations below the median of the reference population) stratifi ed by household wealth are: source of drinking water (19%), household wealth itself (17%), geographical differences (16%) and mother’s occupation (13%).23 An additional 10 factors identifi ed in the survey together contribute 35%. Using this technique to uncover inequities reveals that strategies to address contributing factors are likely to require collaborative and intersectoral actions that are not limited to health authorities or the health system.
Describing health inequities and understanding their determinants require process and outcome data that can be disaggregated by different socioeconomic or demographic characteristics, as well as the ability to link data from different sectors in a country. WHO is contributing to these efforts by setting norms and standards, and providing technical assistance to Member States.
35%
Other
Stunting among children under 5 years of age, by household wealth quintile,
Mozambique, 1999–200323
What contributes to inequity in childhood stunting?23
Mother’s occupationRegionHousehold wealth Source of drinking water
0
10
20
30
40
50
60
1 2 3 4 5
Perc
enta
ge o
f stu
nted
chi
ldre
n
Household wealth index quintiles 0
10
20
30
40
50
60
70
80
90
100
Note: Household wealth index constructed using durable goods, type of materials used in housing floor and number of rooms divided by the number of household members. Wealth quintile 1 indicates the poorest and wealth quintile 5, the least poor.
Deco
mpo
sing
ineq
uity
in
chi
ldho
od s
tunt
ing
13%
16%
17%
19%

5683
583
347-
9473
18
WORLD HEALTH STATISTICS
2007
9. Tuberculosis control: towards goals and targets
There were an estimated 8.8 million new tuberculosis (TB) cases in 2005, including 7.4 million in Asia and sub-Saharan Africa. A total of 1.6 million people died of TB, including 195 000 patients infected with HIV. Using surveillance data, Global tuberculosis control: surveillance, planning, fi nancing draws four main conclusions about TB control programmes.24
First, although more than 26 million TB patients have been treated under WHO’s DOTS strategy, the world’s TB control programmes narrowly missed their 2005 targets for case detection (reaching 60% compared to the target of 70%) and cure (84% compared to the target of 85%). However, both targets were met in WHO’s Western Pacifi c Region and in 26 countries including China, the Philippines and Viet Nam. Second, while the total number of patients diagnosed and treated in 2005 using DOTS approached the target, the number of patients known to be HIV positive or carrying multidrug-resistant TB (MDR-TB) were far fewer than anticipated by The Global Plan to Stop TB 2006–2015.25 Therefore, major efforts are needed to step up collaborative activities between TB and HIV programmes and to manage MDR-TB and extensively drug-resistant TB. Third, the global TB epidemic ap-pears to be on the threshold of decline. The incidence rate is now stable or falling in all WHO regions, including Africa and Europe.
These fi ndings, if robust, mean that MDG Target 8 (“Have halted by 2015 and begun to reverse the incidence of malaria and other major diseases [including TB]”) will be met before 2015. However, the total number of new cases was still rising slowly in 2005 in WHO’s African, Eastern Mediterranean and South-East Asia regions. For reasons that are not fully understood, in Asian countries that report high rates of case detection and treatment success, the incidence has not been reduced as quickly as expected. This is linked to the fourth conclusion: the global burden of TB is not falling fast enough to satisfy the more demanding targets set by the Stop TB Partnership. At the current pace, 1990’s prevalence and mortality rates will not be halved worldwide by 2015.
0
80
Global case detection 60% in 2005Target reached in Western Pacific Region
Global treatment success 84% in 2004–2005Target reached in South-East Asia and Western Pacific regions
10
20
30
40
50
60
70
50
100
60
70
80
90
Smea
r-po
sitiv
e ca
se d
etec
tion
rate
(%
)
Smea
r-po
sitiv
e tr
eatm
ent s
ucce
ss r
ate
(%)
1995 1997 1999 2001 2003 2005 1994 1996 1998 2000 2002 2004
Year Year
WHO 70% target
WHO 85% target
26 million TB patients treated but global targets narrowly missed in 200524

19
WORLD HEALTH STATISTICS
2007
10. Health expenditure: meeting needs?
In 2004, the world spent a total of US$ 4.1 trillion on health, which is equivalent to 4.9 trillion international dollars. (International dollars are used to account for the purchasing power of different national currencies.) The geographical distribution of fi nancial resources for health is uneven.26 There is a 20/90 syndrome in which 30 member countries of the Organisation for Economic Co-operation and Development (OECD) make up less than 20% of the world’s population but spend 90% of the world’s resources on health.
OECD countries spend a larger share of their gross domestic product on health, spending on average more than 11%, compared with 4.7% for countries in WHO’s African and South-East Asia regions. This translates to per capita spending of about 3080 international dollars (US$ 3170) in OECD countries compared with 102 international dollars (US$ 36) in countries in the African and South-East Asia regions, which are much poorer. Linking this spending to epidemiology, the fi gure shows that although poorer WHO regions, such as Africa and South-East Asia, account for the largest share of the global burden of disease (more than 50% of global dis-ability-adjusted life years lost) and 37% of the world’s population, they spend about 2% of global resources on health. The Western Pacifi c Region, excluding Australia, Japan, New Zealand and the Republic of Korea, accounts for 24% of the world’s population (which is dominated by China), about 18% of the global burden of disease but only 2% of the world’s health resources. The Region of the Americas and the European Region, excluding the OECD countries, account for about 12% of the world’s population, 11% of the global burden of disease and spend slightly less than 5% of health resources.
Richer countries with smaller populations and lower disease burdens use more health resources than poorer countries with larger populations and higher disease burdens. This highlights the absolute need for additional resources for many poor countries and raises questions about the effi ciency of spending on health in richer countries.
0
20
40
60
80
100
AFR AMR EMR EUR SEAR WPR OECD
Region
Population as % of worldNumber of DALYs as % of worldTotal health expenditure as % of world
% o
f wor
ld to
tal
AFR, African; AMR, Americas; EMR, Eastern Mediterranean; EUR, European; SEAR, South-East Asia; WPR, Western Pacific. Note: Totals for the following regions calculated after subtracting the 30 OECD members: Americas, European and Western Pacific. DALYs are from 2002.
Percentage distribution of population, disability-adjusted life years (DALYs) and total health expenditure by WHO region and membership of Organisation for Economic Co-operation and Development (OECD), 200426
5683
583
347-
9473
20
WORLD HEALTH STATISTICS
2007
1. Hill K et al. Trends in child mortality in the developing world: 1990 to 1996. New York, UNICEF, 1998.
2. United Nations Children’s Fund. State of the world’s children 2007. New York, United Nations Children’s Fund, 2006.
3. ORC Macro. Demographic and health survey: Malawi 2007. Calverton, MD, ORC Macro, 2007.
4. Maternal mortality in 2000: estimates developed by WHO, UNICEF and UNFPA. Geneva, World Health Organization, 2004.
5. Murray CJ. Towards good practice for health statistics: lessons from the Millennium Development Goal health indicators. Lancet, 2007, 369:862–873.
6. Advisory Committee on Health Monitoring and Statistics: meeting report. Geneva, World Health Organization, 2006 (http://www.who.int/healthinfo/statistics/healthinfoachmsreport20061214-15.pdf, accessed 4 April 2007).
7. Boerma JT, Stansfi eld SK. Health statistics now: are we making the right investments? Lancet, 2007, 369:779–786.
8. AIDS epidemic update: December 2000. Geneva, Joint United Nations Programme on HIV/AIDS, World Health Organization, 2000 (WHO/CDS/CSR/EDC/2000.9).
9. AIDS epidemic update: December 2001. Geneva, Joint United Nations Programme on HIV/AIDS, World Health Organization, 2001 (WHO/CDS/CSR/NCS/2001.2).
10. AIDS epidemic update: December 2002. Geneva, Joint United Nations Programme on HIV/AIDS, World Health Organization, 2002 (UNAIDS/02.58E).
11. AIDS epidemic update: December 2003. Geneva, Joint United Nations Programme on HIV/AIDS, World Health Organization, 2003 (UNAIDS/03.39E).
12. AIDS epidemic update: December 2004. Geneva, Joint United Nations Programme on HIV/AIDS, World Health Organization, 2004 (UNAIDS/04.16E).
13. AIDS epidemic update: December 2005. Geneva, Joint United Nations Programme on HIV/AIDS, World Health Organization, 2005 (UNAIDS/05.19E).
14. AIDS epidemic update: December 2006. Geneva, Joint United Nations Programme on HIV/AIDS, World Health Organization, 2006 (UNAIDS/06.29E).
15. Mathers CD, Loncar D. Projections of global mortality and burden of disease from 2002 to 2030. PLoS Medicine [online journal], 2006, 3(11):e442 (http://medicine.plosjournals.org/perlserv/?request=get-document&doi=10.1371/journal.pmed.0030442, accessed 4 April 2007).
16. Global database on child growth and malnutrition [online database]. Geneva, World Health Organization, 2007 (http://www.who.int/nutgrowthdb/database/en, accessed 4 April 2007).
17. Mathers CD et al. Counting the dead and what they died from: an assessment of the global status of cause of death data. Bulletin of the World Health Organization, 2005, 83:171–177.
18. Shibuya K. Counting the dead is essential for health. Bulletin of the World Health Organization, 2006, 84:170–171.
19. WHO mortality database: tables [online database]. Geneva, World Health Organization, 2007 (http://www.who.int/healthinfo/morttables/en/index.html, accessed 4 April 2007).
20. WHO survey data centre: World Health Survey. Geneva, World Health Organization, 2007 (http://surveydata.who.int/, accessed 4 April 2007).
21. Revised global burden of disease (GBD) 2002 estimates. Geneva, World Health Organization, 2005 (http://www.who.int/healthinfo/bodgbd2002revised/en/index.html, accessed 4 April 2007).
22. Hosseinpoor AR et al. Decomposing socioeconomic inequality in infant mortality in Iran. International Journal of Epidemiology, 2006, 35:1211–1219.
23. A WHO report on inequities in maternal and child health in Mozambique. Geneva, World Health Organization, 2007.
24. Global tuberculosis control: surveillance, planning, fi nancing. WHO report 2007. Geneva, World Health Organization, 2007 (WHO/HTM/TB/2007.376).
25. The Global Plan to Stop TB 2006–2015. Geneva, Stop TB Partnership, World Health Organization, 2006 (WHO/HTM/STB/2006.35).
26. National health accounts. Geneva, World Health Organization, 2007 (http://www.who.int/nha, accessed 4 April 2007).
References