Statistical Analysis of the "Statistics Marks" of PGDM Students
22
STATISTICAL ANALYSIS OF THE “STATISTICS MARKS” OF PGDM STUDENTS
-
Upload
nivinvinoi -
Category
Business
-
view
9 -
download
1
Transcript of Statistical Analysis of the "Statistics Marks" of PGDM Students
STATISTICAL ANALYSIS OF THE “STATISTICS MARKS” OF PGDM
STUDENTS

Procedure & Objective Collected 30 samples [marks of statistics
bridge course and midterm exam], 10 samples each from PGDM A, B, and C classes.
Converted the marks to their percentages. Calculated the measures of Central
Tendency and measures of Dispersion. Analyse the relation between Bridge course
marks and midterm marks by using scatter diagram and Karl Pearson’s Correlation coefficient.
Hypothesis Testing on the midterm marks.
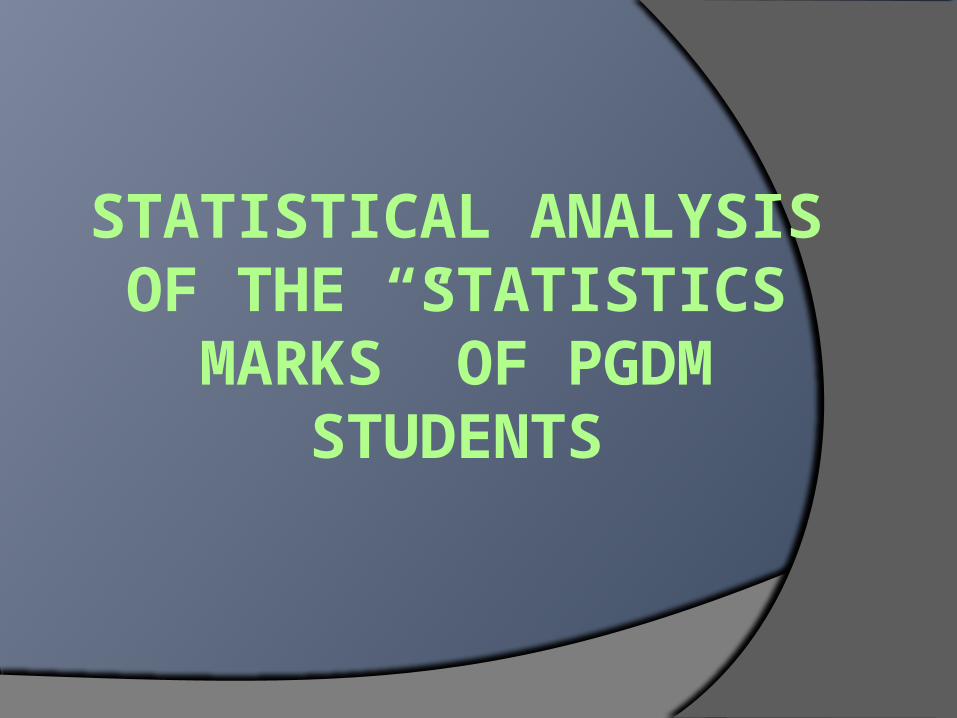
DataSl. No Bridge Midterm
1 70 28
2 50 17
3 40 20
4 43 37
5 77 73
6 57 67
7 83 33
8 80 70
9 73 40
10 60 50
11 60 80
12 83 90
13 47 73
14 70 55
15 63 88
Sl. No Bridge Midterm
16 67 23
17 37 53
18 70 58
19 50 73
20 37 48
21 80 27
22 63 20
23 80 27
24 83 43
25 80 47
26 47 47
27 80 73
28 90 93
29 73 80
30 70 53
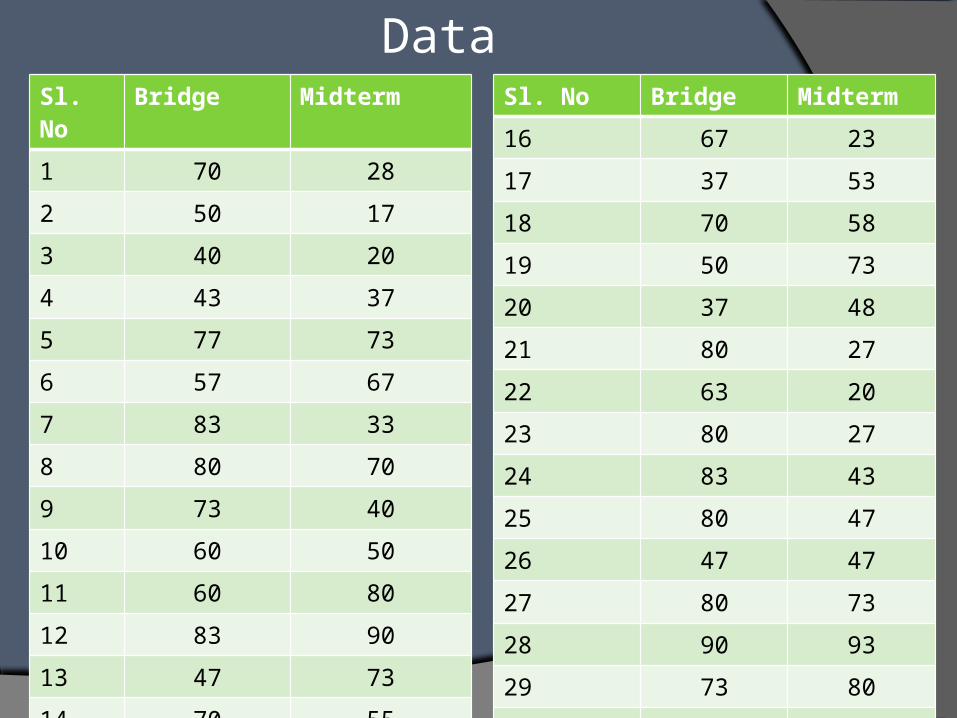
Measures of Central Tendency
MeanThe mean is the same of what is generally referred to as the ‘average’, and it is calculated in the following manner:
MedianThe median is the point corresponding to the score that lies in the middle of the distribution (i.e., there are as many data points above the median as there are below the median).
Mode
The value that is repeated most often in the data set

Measures of Central Tendency of Mid Term & Bridge Course Marks
MEAN MEDIAN MODE
MID TERM 52.866% 51.5% 73%
BRIDGE 65. 433% 65% 80%

Measures of Dispersion
Standard Deviation
The standard deviation measures the amount of variation or dispersion from the average. It is represented by the Greek letter sigma, σ.
Variance
Variance measures how far a set of numbers is spread out. It is denoted by for population and s2 for sample.
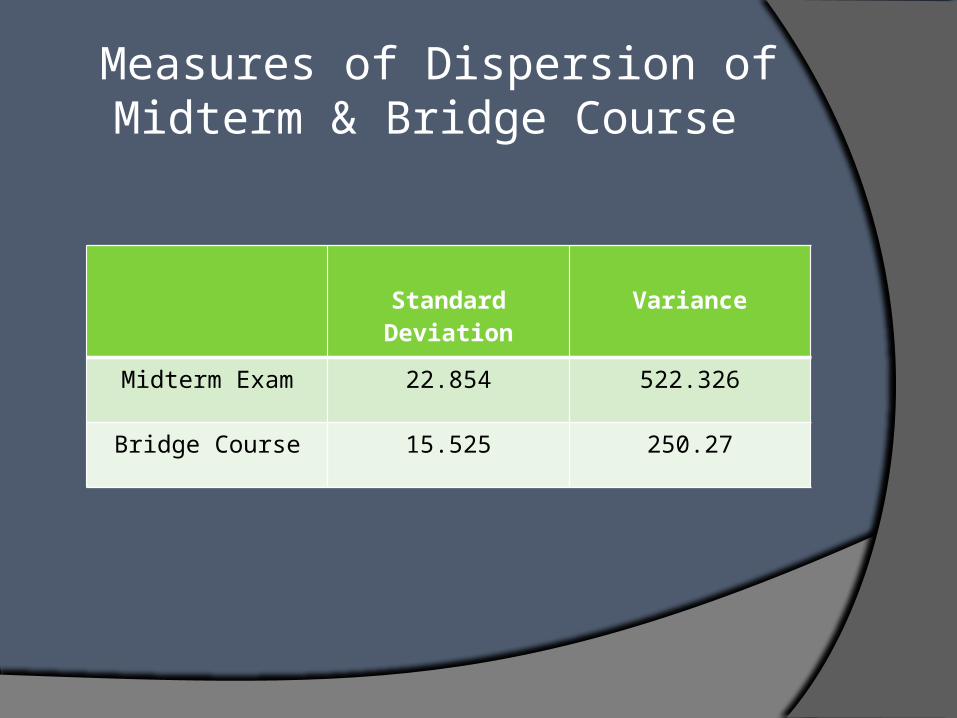
Measures of Dispersion of Midterm & Bridge Course
Standard Deviation Variance
Midterm Exam 22.854 522.326
Bridge Course 15.525 250.27
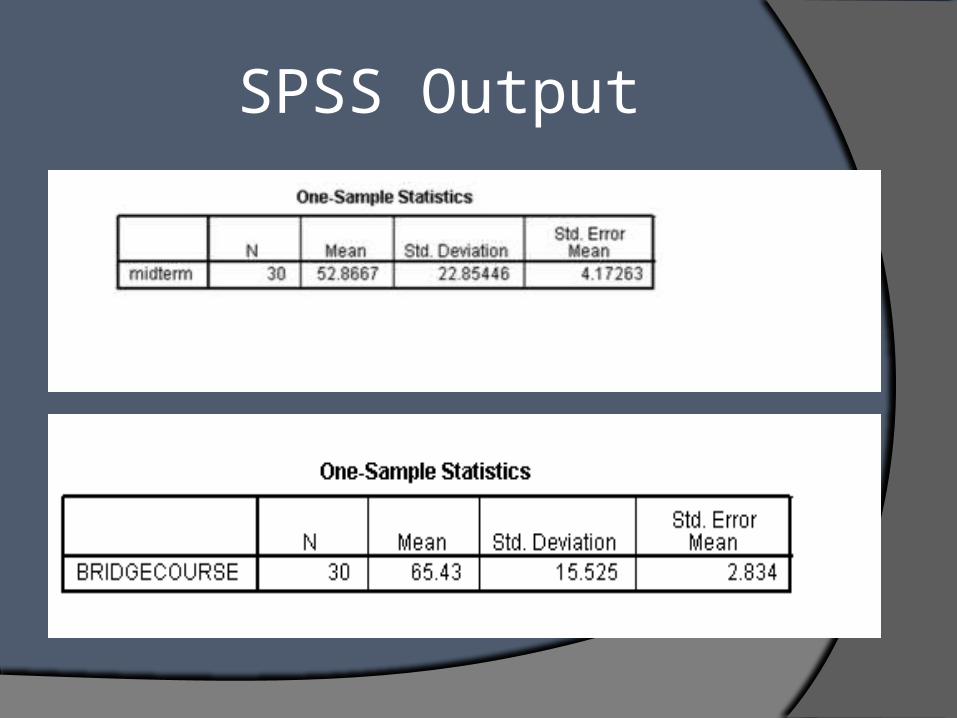
SPSS Output

Correlation Scatter Diagram
A scatter diagram is a graph that shows the relationship between two quantitative variables measured on the same individual. Each individual in the data set is represented by a point in the scatter diagram.
Karl Pearson's Correlation Coefficient
It summarizes the strength of linear relationship between two metric variables i.e. ratio or interval variables.
It ranges from +1 to -1. Correlation of +1: there is perfect positive relation between
variables. Correlation of -1 : there is perfect negative relation between
variables. Correlation is 0 : there is no relationship between variables.
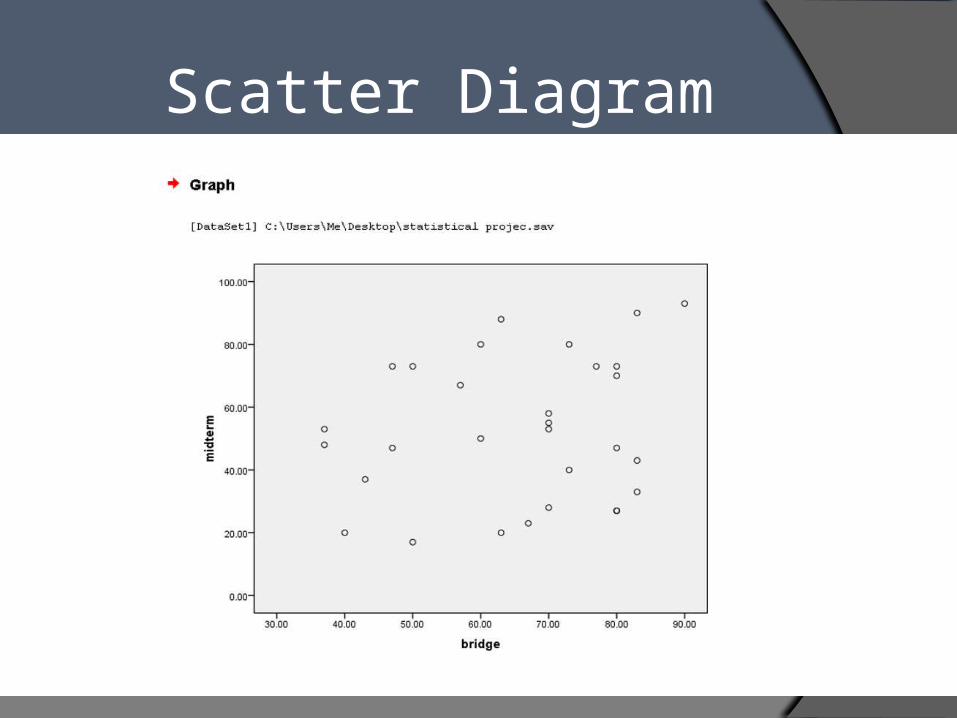
Scatter Diagram

Regression and Co-relation Coefficient

Interpretation From the scatter diagram it is clear that the
relation is positive and it is not a strong relation. From the SPSS output it is clear that correlation
coefficient; r = 0.203, which implies that the relation between Bridge marks and midterm marks are weak & positive.
The value of Coefficient of determination; r² = .0412 means that only 4.12% of the total variation of the midterm marks can be explained by linear relationship between bridge marks.
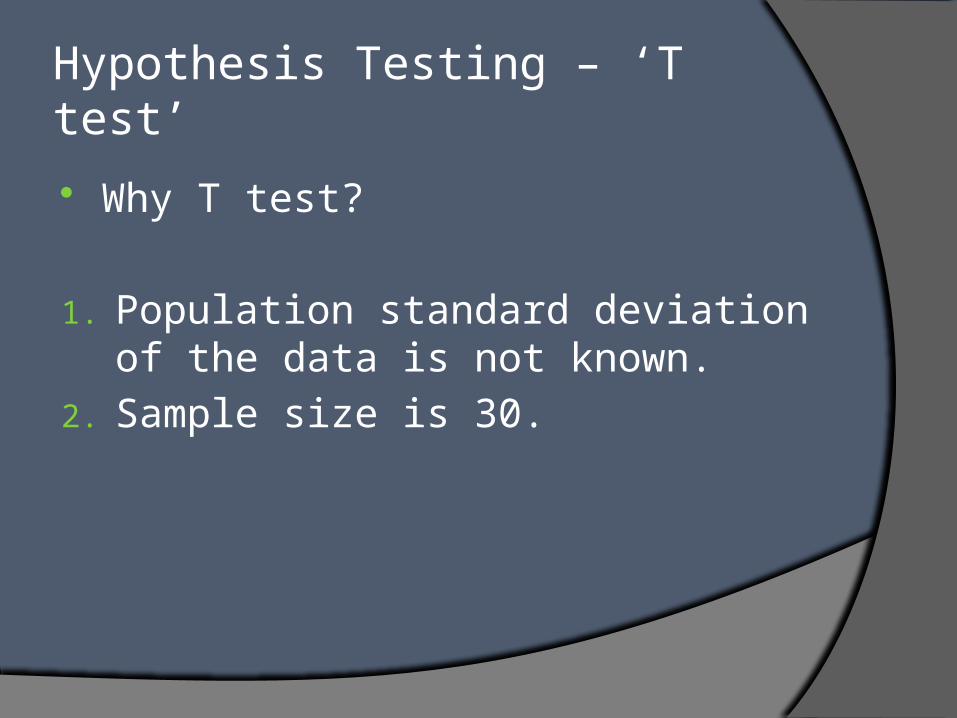
Hypothesis Testing – ‘T test’
Why T test?
1. Population standard deviation of the data is not known.
2. Sample size is 30.
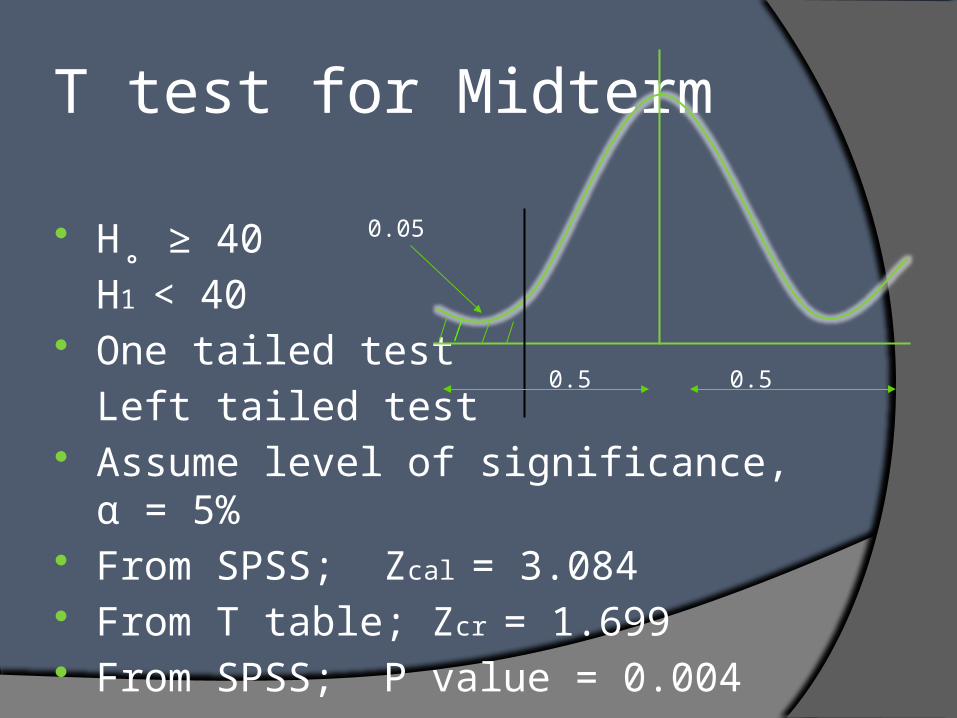
T test for Midterm
H˳ ≥ 40
H1 < 40 One tailed test
Left tailed test Assume level of significance, α = 5% From SPSS; Zcal = 3.084 From T table; Zcr = 1.699 From SPSS; P value = 0.004
0.5 0.5
0.05
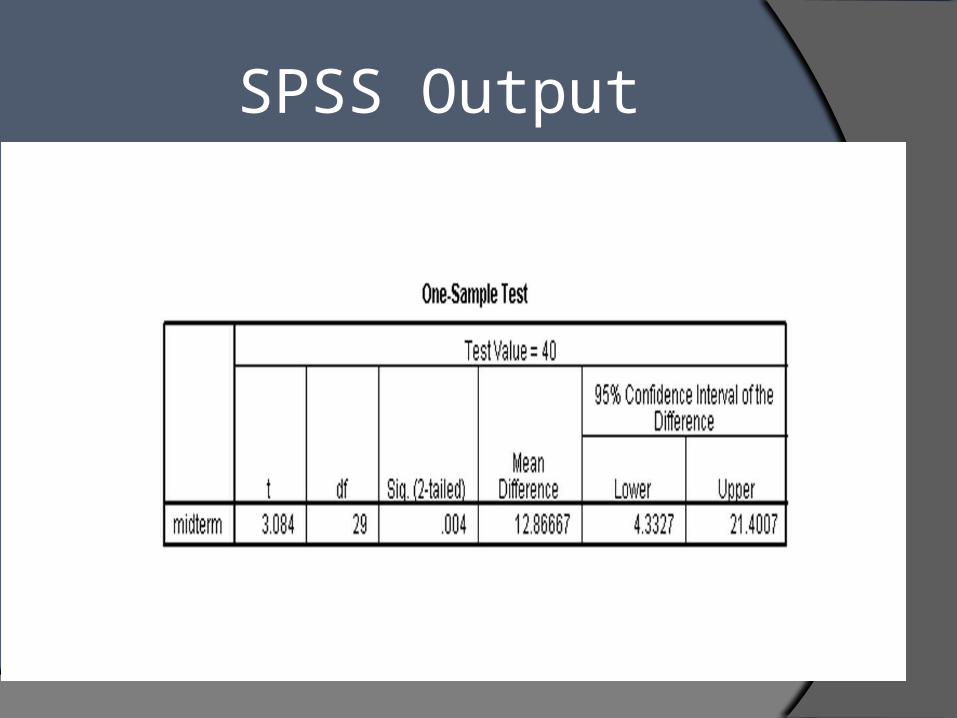
SPSS Output
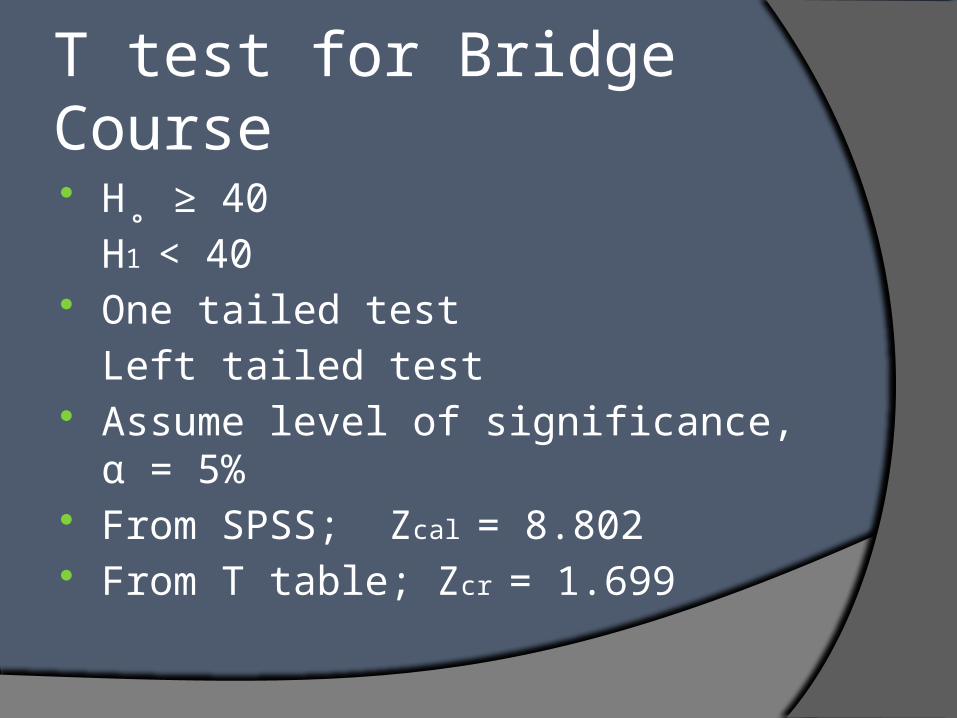
T test for Bridge Course
H˳ ≥ 40
H1 < 40 One tailed test
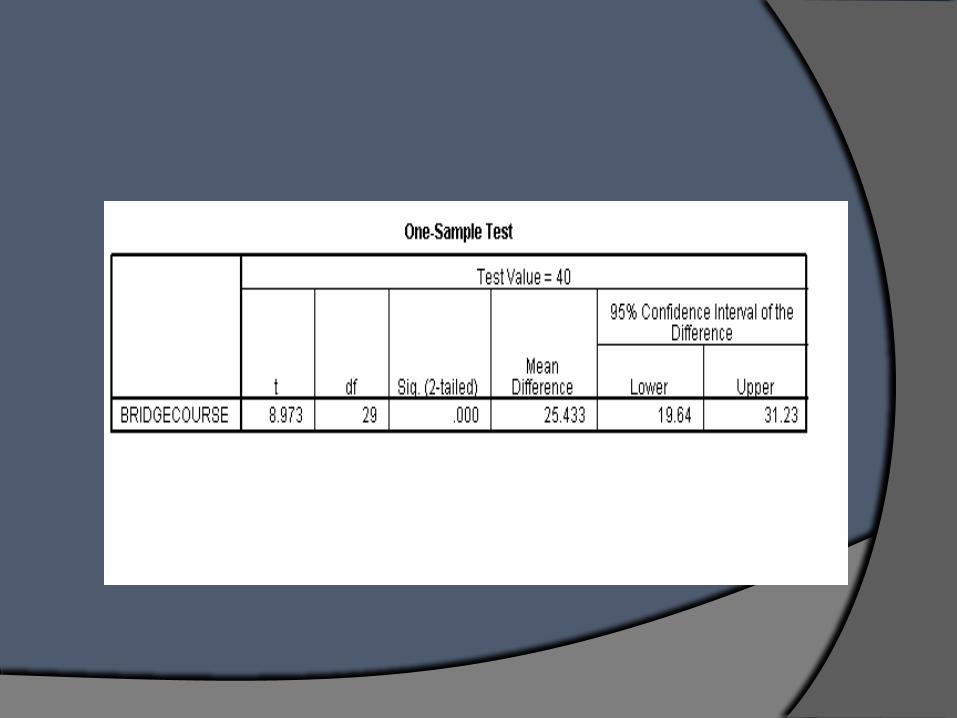
Left tailed test Assume level of significance, α = 5% From SPSS; Zcal = 8.802 From T table; Zcr = 1.699
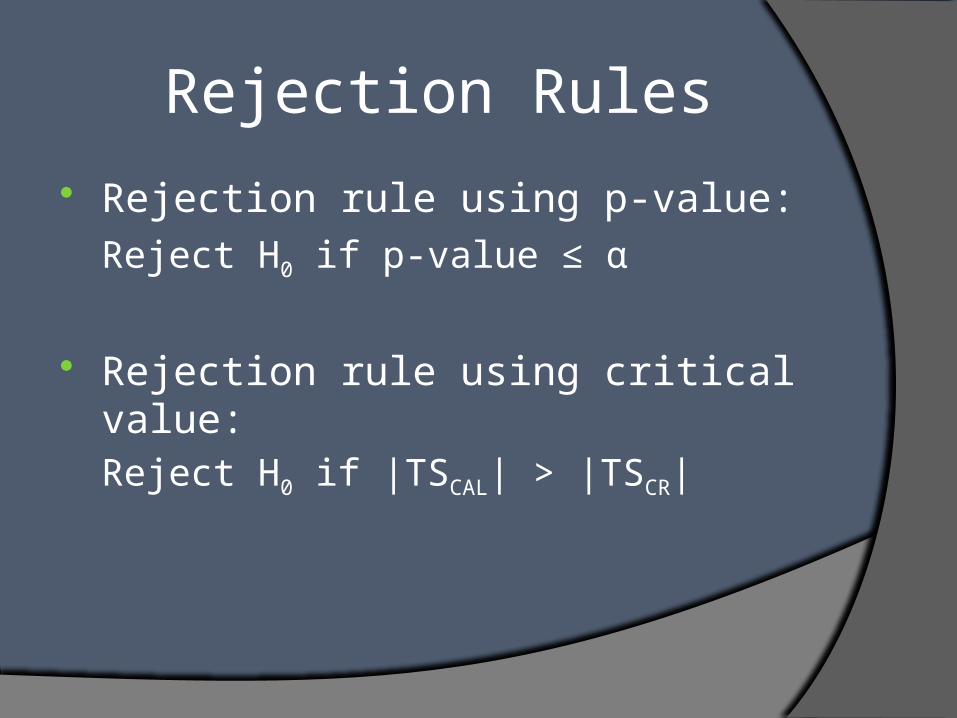
Rejection Rules
Rejection rule using p-value:
Reject H0 if p-value ≤ α
Rejection rule using critical value:Reject H0 if |TSCAL| > |TSCR|

Test Result
Result for Mid Term Exam Critical value approach:
|Zcal| > |Zcr| (3.084>1.699)
Hence the Null Hypothesis H˳ is rejected.
Result for Bridge Course Critical value approach: 8.802 >1.699 Hence the Null Hypothesis H˳ is rejected.
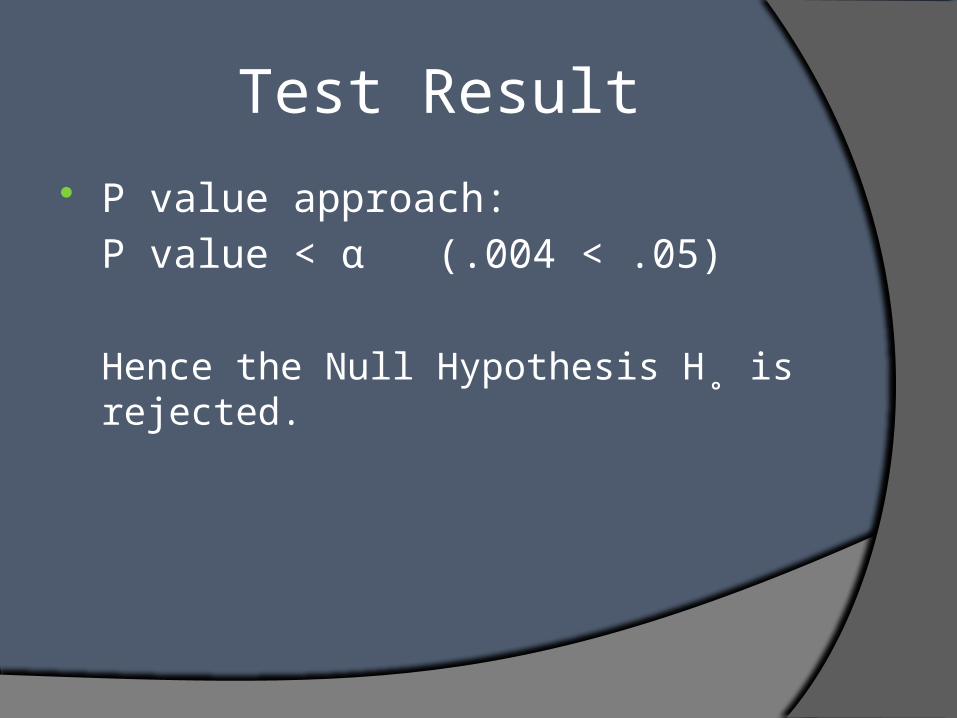
Test Result
P value approach:
P value < α (.004 < .05)
Hence the Null Hypothesis H˳ is rejected.
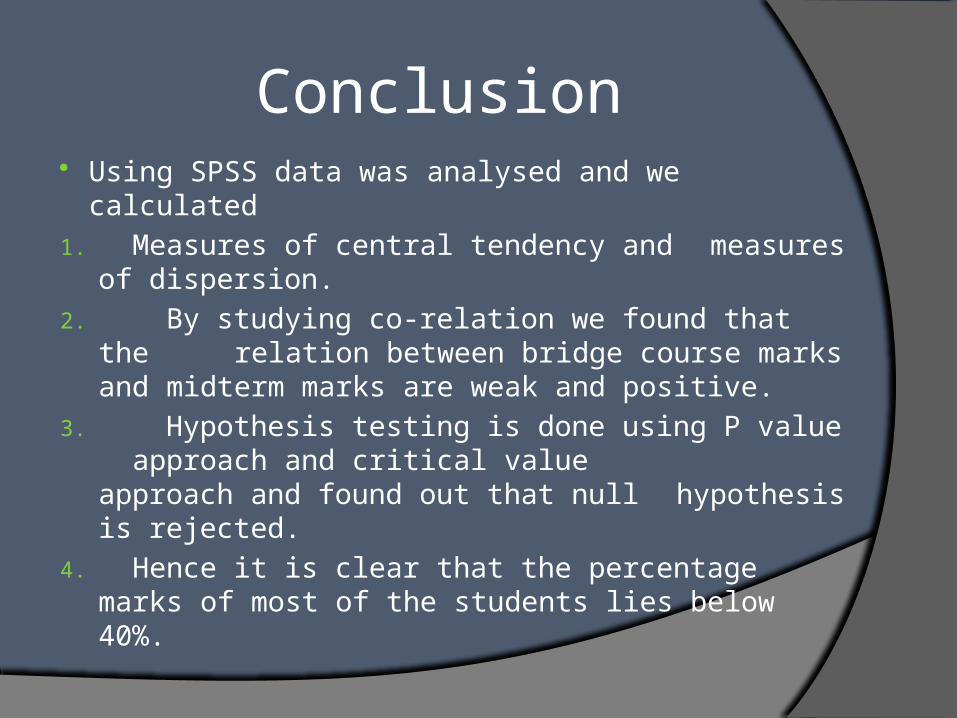
Conclusion Using SPSS data was analysed and we calculated
1. Measures of central tendency and measures of dispersion.
2. By studying co-relation we found that the relation between bridge course marks and midterm marks are weak and positive.
3. Hypothesis testing is done using P value approach and critical value approach and found out that null hypothesis is rejected.
4. Hence it is clear that the percentage marks of most of the students lies below 40%.

THANK YOU