STATISTICAL ANALYSIS - LECTURE 01
55
Transcript of STATISTICAL ANALYSIS - LECTURE 01

STATISTICS
The science that deals with the collection,classification, analysis, interpretation and drawconclusions of numerical facts or data.
STATISTICAL ANALYSIS - LECTURE 01 2

INTRODUCTION
STATISTICAL ANALYSIS - LECTURE 01 3
Statistics make the complex simple.
You can discover what’s going on, then you need a
way of visualizing it and telling everyone else.
Statistics are numbers that summarize raw facts and
figures in some meaningful way.
They present key ideas that may not be immediately
apparent by just looking at the raw data, and by data, we mean facts or figures from which we can draw
conclusions.

4STATISTICAL ANALYSIS - LECTURE 01
INTRODUCTION

STATISTICAL ANALYSIS - LECTURE 01 5
STA
TIST
ICS
DESCRIPTIVE
COLLECTING
ORGANIZING
SUMMARIZNING
PRESENTING
INFERENTIAL
GENERALIZTION FROM SAMPLES TO POPULATION
DETERMINING RELATIONS AMONG VARIABLES
MAKING PREDICTIONS
INTRODUCTION

RELATION WITH PROBABILITY
STATISTICAL ANALYSIS - LECTURE 01 6
Parameter Statistic

STATISTICAL ANALYSIS - LECTURE 01 7
INTRODUCTION
❑Applications:

Statistical Analysis
❑Exploring Data, Review on mean and variance, some graphical
representations, Quartiles, IQR, Z- scores
❑Review on Some Probability Distributions.
❑Correlation and Regression
❑Data Representation and Description
❑Statistical Inference and Confidence Intervals.
❑Test of Hypotheses
STATISTICAL ANALYSIS - LECTURE 01 8
COURSE OUTLINE

STATISTICAL ANALYSIS - LECTURE 01 9
COURSE OUTLINEA- Methods Used 1. Midterm
2. Quizzes3. Project4. Assignments5. Lecture Tasks6. Final Exam
B- Assessment Schedule 1. Midterm week 82. Quizzes week5 ,week103. Project week9-week114. Assignments week4, week95. Lecture Tasks week3 ,week66. Final Exam week 15
C- Weighting of Assessments1. Midterm 15%2. Quizzes 10%3. Project 5% (BONUS)4. Assignments 10% 5. Lecture Tasks 5%6. Final Exam 60%
Total 100%

REFERENCES❑Robert S. Witte, John S. Witte, Statistics, 11th Edition, John Wiley & Sons, Inc., 2017.
❑Ronald E. Walpole et al., Probability and Statistics for Engineers and Scientists. 9th Edition, Pearson Education International.
❑Ye and Meyers, Instructor’s Solution Manual for Probability and Statistics for Engineers and Scientists. 8th Edition.
❑Dawn Griffiths, Head First Statistics. O’Reilly
❑Brian Caffo, Statistical Inference for Data Science, Leanpub.
❑Gareth James, et al., An Introduction to Statistical Learning with Applications in R. Springer.
STATISTICAL ANALYSIS - LECTURE 01 10

STATISTICAL ANALYSIS - LECTURE 01 11

SAMPLING
STATISTICAL ANALYSIS - LECTURE 01 12
STATISTICAL ANALYSIS - LECTURE 01 13
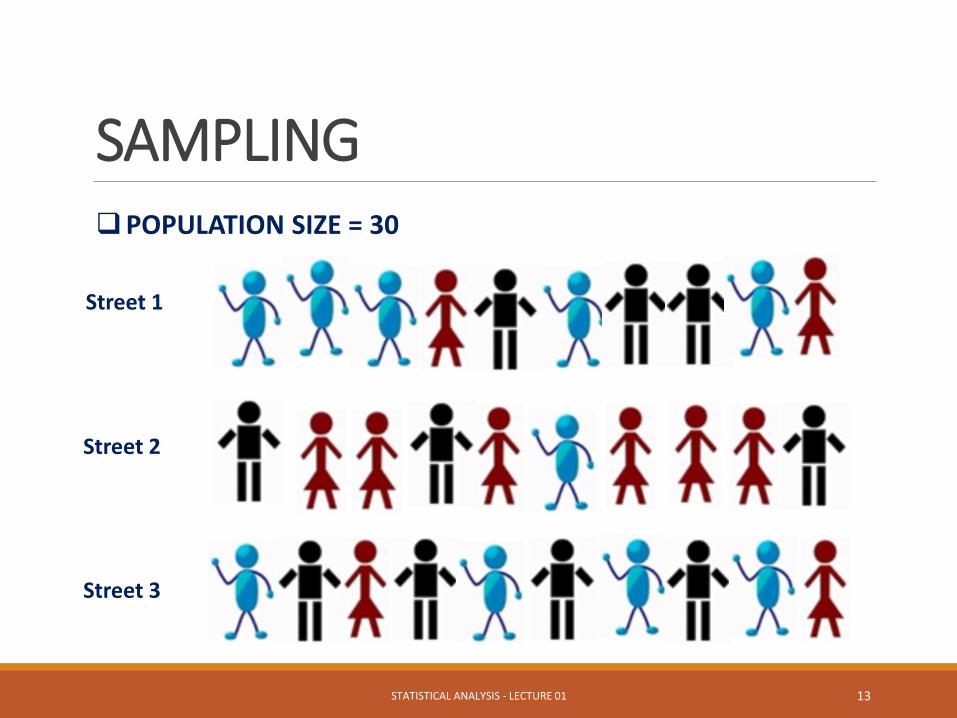
SAMPLING❑POPULATION SIZE = 30
Street 1
Street 2
Street 3

STATISTICAL ANALYSIS - LECTURE 01 14
SAMPLING❑SIMPLE RANDOM SAMPLING (SRS)
➢ Population Size =
30
➢ Sample Size = 10
➢ EXAMPLE
RANDOM NUMBER
GENRATOR

STATISTICAL ANALYSIS - LECTURE 01 15
SAMPLING❑SYSTEMATIC SAMPLING
➢ Population Size =
30
➢ Sample Size = 10
➢ K = 30 / 10 = 3

STATISTICAL ANALYSIS - LECTURE 01 16
SAMPLING❑STARTIFIED SAMPLING
➢ Population Size =
30
➢ Sample Size = 12
Stratum

STATISTICAL ANALYSIS - LECTURE 01 17
SAMPLING❑CLUSTER SAMPLING
Street 1
Street 2
Street 3

EXPLORING DATA
STATISTICAL ANALYSIS - LECTURE 01 18

EXPLORING DATA❑Cases, Variables and Levels of Measurements.
STATISTICAL ANALYSIS - LECTURE 01 19

EXPLORING DATA
STATISTICAL ANALYSIS - LECTURE 01 20
❑Cases, Variables and Levels of Measurements.

EXPLORING DATA
STATISTICAL ANALYSIS - LECTURE 01 21
❑Cases, Variables and Levels of Measurements.

EXPLORING DATA
STATISTICAL ANALYSIS - LECTURE 01 22

EXPLORING DATA
STATISTICAL ANALYSIS - LECTURE 01 23

EXPLORING DATA
STATISTICAL ANALYSIS - LECTURE 01 24

EXPLORING DATA
STATISTICAL ANALYSIS - LECTURE 01 25

LEVELS OF MEASUREMENTS
STATISTICAL ANALYSIS - LECTURE 01 26

LEVELS OF MEASUREMENTS
STATISTICAL ANALYSIS - LECTURE 01 27
VA
RIA
BLE
S
Categorical (Qualitative)
Ordinal Ranking
Flight Classes
Grades
NominalColor
Nationality
Marital Status
Ratio
Interval
QUANTITIVE
DiscreteNo. of Goals
No. of Rooms
No. of Children
ContinuousHeight
Weight
Temperature

LEVELS OF MEASUREMENTS USING STATISTICAL METHODS
STATISTICAL ANALYSIS - LECTURE 01 28

DATA MATRIX AND FREQUENCY TABLE
STATISTICAL ANALYSIS - LECTURE 01 29

STATISTICAL ANALYSIS - LECTURE 01 30
❑DATA MATRIX: It is an overview of the cases and variables
DATA MATRIX AND FREQUENCY TABLE

STATISTICAL ANALYSIS - LECTURE 01 31
❑DATA MATRIX: It is an overview of the cases and variables
DATA MATRIX AND FREQUENCY TABLE
OBSERVATIONS

STATISTICAL ANALYSIS - LECTURE 01 32
DATA MATRIX AND FREQUENCY TABLE

STATISTICAL ANALYSIS - LECTURE 01 33
❑Data Matrices can be summarized using tables and graphs.
DATA MATRIX AND FREQUENCY TABLE

STATISTICAL ANALYSIS - LECTURE 01 34
DATA MATRIX AND FREQUENCY TABLE

STATISTICAL ANALYSIS - LECTURE 01 35
DATA MATRIX AND FREQUENCY TABLE❑CUMMULATIVE FREQUENCY

STATISTICAL ANALYSIS - LECTURE 01 36
DATA MATRIX AND FREQUENCY TABLE

STATISTICAL ANALYSIS - LECTURE 01 37
DATA MATRIX AND FREQUENCY TABLE

STATISTICAL ANALYSIS - LECTURE 01 38
DATA MATRIX AND FREQUENCY TABLE

STATISTICAL ANALYSIS - LECTURE 01 39
DATA MATRIX AND FREQUENCY TABLE

STATISTICAL ANALYSIS - LECTURE 01 40
Categorical Frequency Distribution
A B B AB O O A O O B A B O ABO AB B B A A O B B O O O A O
❑NOMINAL OR ORDINAL DATA❑ Blood types for different persons❑ Sample size (n) = 28
Class / Category
FrequencyRelative
Frequency / Percent
Cumulative Frequency
A 6 21.43 % 21.43 %
B 8 28.57 % 50.00 %
O 11 39.29 % 89.29 %
AB 3 10.71 % 100.00 %
Total 28 100%
Percent = 𝒇
𝒏𝑿 𝟏𝟎𝟎
NOMINAL DATA

DATA MATRIX AND FREQUENCY TABLE
Angle = 𝒇
𝒏𝑿 𝟑𝟔𝟎°
❑ Pie Chart : A circle that is divided into sections according to the percentage of frequencies in each category.
CATEGORICAL NOMINAL DATA
STATISTICAL ANALYSIS - LECTURE 01 41

STATISTICAL ANALYSIS - LECTURE 01 42
DATA MATRIX AND FREQUENCY TABLE❑ Education level for different students.
Education Level
FrequencyRelative
Frequency / Percent
Cumulative Frequency
Level 5 47 47.00 % 47 %
Level 4 15 15.00 % 62.00 %
Level 3 12 12.00 % 74.00 %
Level 2 7 7.00 % 81.00 %
Level 1 19 19.00 % 100.00 %
Total 100 100%
ORDINAL DATA

DATA MATRIX AND FREQUENCY TABLE❑ Bar Chart : Vertical bars of various heights to reflect the frequencies of the categories.
ORDINAL OR
DISCRETE
STATISTICAL ANALYSIS - LECTURE 01 43

STATISTICAL ANALYSIS - LECTURE 01 44
Ungrouped Frequency Distribution❑DISCRETE DATA WITH SMALL RANGE
❑ Sample size (n) = 16
Class / Category
FrequencyRelative
Frequency / Percent
Cumulative Frequency
4 8 50 % 50 %
5 3 18.75 % 68.75 %
8 5 31.25 % 100 %
Total 16 100%
5 4 4 8
8 5 8 4
4 4 8 4
5 8 4 4

GRAPHS AND SHAPES OF DISTRIBUTIONS
STATISTICAL ANALYSIS - LECTURE 01 45

STATISTICAL ANALYSIS - LECTURE 01 46
GRAPHS AND SHAPES OF DISTRIBUTIONS

STATISTICAL ANALYSIS - LECTURE 01 47
GRAPHS AND SHAPES OF DISTRIBUTIONS

STATISTICAL ANALYSIS - LECTURE 01 48
GRAPHS AND SHAPES OF DISTRIBUTIONS

STATISTICAL ANALYSIS - LECTURE 01 49
GRAPHS AND SHAPES OF DISTRIBUTIONS

STATISTICAL ANALYSIS - LECTURE 01 50
GRAPHS AND SHAPES OF DISTRIBUTIONS

STATISTICAL ANALYSIS - LECTURE 01 51
GRAPHS AND SHAPES OF DISTRIBUTIONS

STATISTICAL ANALYSIS - LECTURE 01 52
GRAPHS AND SHAPES OF DISTRIBUTIONS

STATISTICAL ANALYSIS - LECTURE 01 53
GRAPHS AND SHAPES OF DISTRIBUTIONS

STATISTICAL ANALYSIS - LECTURE 01 54
GRAPHS AND SHAPES OF DISTRIBUTIONS

Thank you!Next Lecture:
◦ Measures of Central Tendency
◦ Measures of variability
STATISTICAL ANALYSIS - LECTURE 01 55