Static cold sealing force behaviour of amorphous … · Static cold sealing force behaviour of ......
14
© 2012 Smithers Rapra Technology T/1 Gummi Fasern Kunststoffe, 65, No. 7, 2012, pp. 450–461 Static cold sealing force behaviour of amorphous HNBR materials R. Hornig 1 , J. Sunder 2 , and B. Herr 3* 1 ElringKlinger AG, Dettingen/Erms 2 Göttfert Werkstoff-Prüfmaschinen GmbH, Buchen 3 University of Reutlingen Selected from International Polymer Science and Technology, 39, No. 8, 2012, reference GK 12/07/450; transl. serial no. 16469 Translated by M. Grange The investigation addresses the influence of increasing the compression of an elastomeric sealing profile on the shifting of the zero point of the sealing force and the reduction of the recovery force respectively while lowering the temperature and passing its glass transition point. Different theories are presented to treat the freezing of the macromolecular polymer structure under such conditions from a kinetic as well as a thermodynamic point of view. In addition, a distinction must be made between volume shrinkage during isobaric cooling and isothermal compression. The study is especially focused on the influence of isothermal compression on a subsequent decrease in temperature. The impact of the Gough-Joule effect under compression and the influence of the thermal expansion coefficient will be discussed using the example of an amorphous HNBR elastomer under increasing compression followed by cooling. The remaining compressibility at low temperatures can be demonstrated by PVT diagrams for the uncured polymer melt and the chemically crosslinked elastomeric material. By means of differential scanning calorimetry (DSC), thermomechanical analysis (TMA), dynamic mechanical analysis (DMA) and other static test procedures for measuring non-isothermal relaxation processes, the correlations between experimental results and theoretical models will be shown. INTRODUCTION Cooling an isothermally compressed, elastomeric sealing material towards its glass transition range and lower eventually leads to a complete loss of elastic recovery forces, i.e. the static and dynamic sealing force behaviour. Temperature reduction means increasing restriction of molecular mobility. In some papers [1, 2], it is clearly stated that glass transition is not a thermodynamic effect since no sudden change in thermodynamic values, such as entropy, enthalpy and the specific volume, takes place. This can be seen in particular from a detailed comparison of first order phase transitions (crystallisation processes) and second order phase transitions (conversions to higher amorphous states of order) [2]. In a number of other publications, a kinetic origin is therefore assumed for glass transition [3-5]. Configuration theory, on the other hand, presents a thermodynamic model to describe glass transition. According to this theory, thermodynamic and kinetic processes appear to play a joint role. In other publications [6, 7] the authors derive a mathematical relationship between the kinetics, i.e. relaxation times, and change in entropy DS from the jump in thermal capacity above and below the T g value. This paper is intended to show the means by which marked thermodynamic driving forces, i.e. elastic recovery forces resulting therefrom, are produced down to the low-temperature range, and how the coefficient of thermal expansion and the associated shrinkage processes are positively influenced. It is concerned with the purely static sealing force behaviour of an amorphous HNBR elastomeric material at low temperatures. In relation to the strength of these effects, an increasing static surface pressure plays a crucial role. The paper focuses on the further influence of a temperature reduction through the glass transition range on dynamic relaxation
Transcript of Static cold sealing force behaviour of amorphous … · Static cold sealing force behaviour of ......
© 2012 Smithers Rapra Technology T/1
Gummi Fasern Kunststoffe, 65, No. 7, 2012, pp. 450–461
Static cold sealing force behaviour of amorphous HNBR materials
R. Hornig1, J. Sunder2, and B. Herr3*
1ElringKlinger AG, Dettingen/Erms2Göttfert Werkstoff-Prüfmaschinen GmbH, Buchen3University of Reutlingen
Selected from International Polymer Science and Technology, 39, No. 8, 2012, reference GK 12/07/450; transl. serial no. 16469
Translated by M. Grange
The investigation addresses the influence of increasing the compression of an elastomeric sealing profile on the shifting of the zero point of the sealing force and the reduction of the recovery force respectively while lowering the temperature and passing its glass transition point. Different theories are presented to treat the freezing of the macromolecular polymer structure under such conditions from a kinetic as well as a thermodynamic point of view. In addition, a distinction must be made between volume shrinkage during isobaric cooling and isothermal compression. The study is especially focused on the influence of isothermal compression on a subsequent decrease in temperature. The impact of the Gough-Joule effect under compression and the influence of the thermal expansion coefficient will be discussed using the example of an amorphous HNBR elastomer under increasing compression followed by cooling. The remaining compressibility at low temperatures can be demonstrated by PVT diagrams for the uncured polymer melt and the chemically crosslinked elastomeric material. By means of differential scanning calorimetry (DSC), thermomechanical analysis (TMA), dynamic mechanical analysis (DMA) and other static test procedures for measuring non-isothermal relaxation processes, the correlations between experimental results and theoretical models will be shown.
INtRoductIoN
Cooling an isothermally compressed, elastomeric sealing material towards its glass transition range and lower eventually leads to a complete loss of elastic recovery forces, i.e. the static and dynamic sealing force behaviour.
Temperature reduction means increasing restriction of molecular mobility.
In some papers [1, 2], it is clearly stated that glass transition is not a thermodynamic effect since no sudden change in thermodynamic values, such as entropy, enthalpy and the specific volume, takes place. This can be seen in particular from a detailed comparison of first order phase transitions (crystallisation processes) and second order phase transitions (conversions to higher amorphous states of order) [2].
In a number of other publications, a kinetic origin is therefore assumed for glass transition [3-5].
Configuration theory, on the other hand, presents a thermodynamic model to describe glass transition. According to this theory, thermodynamic and kinetic processes appear to play a joint role.
In other publications [6, 7] the authors derive a mathematical relationship between the kinetics, i.e. relaxation times, and change in entropy DS from the jump in thermal capacity above and below the Tg value.
This paper is intended to show the means by which marked thermodynamic driving forces, i.e. elastic recovery forces resulting therefrom, are produced down to the low-temperature range, and how the coefficient of thermal expansion and the associated shrinkage processes are positively influenced. It is concerned with the purely static sealing force behaviour of an amorphous HNBR elastomeric material at low temperatures. In relation to the strength of these effects, an increasing static surface pressure plays a crucial role. The paper focuses on the further influence of a temperature reduction through the glass transition range on dynamic relaxation

International Polymer Science and Technology, Vol. 39, No. 11, 2012T/2
processes in the material and on the correlation with the decrease in static sealing force.
To begin with, however, theoretical model concepts will be discussed relating to thermodynamic and kinetic processes during cooling of a polymer melt, i.e. the process of freezing in molecular mobility and volume shrinkage.
Model coNsIdeRatIoNs RelatING to dyNaMIc RelaxatIoN IN the Glass tRaNsItIoN RaNGe oF uNFIlled PolyMeR Melts aNd cheMIcally cRosslINKed elastoMeRIc MateRIals
The architecture of the purely amorphous polymer material has a decisive influence on the position of the glass transition temperature [8]. Glass transition is significantly determined by chain mobility. The more inflexible or stiffer the structure of the main polymer chain, the higher the Tg value. Steric effects, such as the restriction of rotational movement of polymer chains caused by bulky molecular segments, increase the Tg value.
In contrast, the free volume increases if there is a rise in the number of loose chain ends not incorporated into the physical or chemical network. This is promoted by increasingly short chain lengths or a fall in the molecular weight of the polymer material. On the one hand, long side chains can favour a physically interlocking network and thus, depending on their structural type and number, can significantly limit the flexibility of the main chains. On the other hand, side chains can also extend the distance between main chains, creating more mobility. However, an increase in density resulting from a chemical crosslinking reaction reduces chain mobility further.
Since the measurements below involve the uncrosslinked polymer melt and the solid-like state of the chemically crosslinked elastomeric material, the influence of crosslinking density on glass transition must be considered when interpreting the results.
Over the past few decades, a number of modelling approaches have been published on the topic of polymer chain mobility. Only those models that are relevant to polymer materials – in relation to this paper’s objectives – and which are useful in the subsequent interpretation of the results will be taken into account here.
The free volume theory
Probably the best known theory, the “free volume theory” [3-5, 9-11] describes the space available to the polymer chains for rotational and translational movements. The total volume (Equation 1) of a polymer melt is made up of two other fractions in addition to the so-called partial volume VM of the molecules. The vibrational volume
VS is based on the thermally induced vibrations of the molecules. The so-called “free volume” VL, also known as “void volume”, represents another fraction. Free volume between the molecules is always necessary for thermodynamic reasons. The fractions VM and VS are also referred to together as “occupied volume”:
Vtotal = VM + VL + VS (1)
The vibrational and free volume fractions decrease constantly as the temperature drops. Rotational and translational movements are increasingly restricted. The reduction in free volume takes place with decreasing temperature above the Tg value by means of voids diffusing out of the setting polymer melt [2], which requires increasingly long periods of time. The rate of cooling plays the decisive role in whether a state of equilibrium can be established for the respective temperature level. Below the glass transition temperature, only the vibrational volume VS can decrease further.
The glass transition temperature is obtained below a critical ratio between the free volume and the total volume. The deviation of the decrease in volume from a linear curve, as shown in Figure 1 with falling temperature, can be taken from Equation 2 [2]:
VL/(VM + VL + VS) ≤ const (2)
With an increasing rate of cooling, more free volume is frozen in because of the decrease in the time remaining for diffusion processes. An increasingly marked thermodynamic imbalance therefore results. The density of the polymer material is therefore initially lower than for slow cooling, which would lead to a state of equilibrium with a lower free volume.
The Tg value is shifted towards higher temperatures since, as the rate of cooling rises, the critical volume ratio from Equation 2 is reached increasingly early. In
Figure 1. Influence of increasing cooling rate on specific volume and glass transition range of a purely amorphous polymer melt

© 2012 Smithers Rapra Technology T/3
addition, a greater frozen-in vibrational volume also necessarily exists because this value is linked to the free volume fraction [12]. Figure 1 shows the influence of rapid and slow cooling on the specific volume of an amorphous polymer melt.
The more a polymer material finds itself in a thermodynamic imbalance caused by rapid cooling in the glass transition range, the more its subsequent efforts to restore the state of equilibrium by means of “volume relaxation” can be observed. When cooled to temperature levels significantly below the glass transition temperature, however, this will not be possible because of the now severely limited intrinsic mobility of the elastomeric material, and the process degenerates. However, the reduction of the frozen-in free volume can trigger physical ageing with an increase in density and embrittlement of the material [13]. It is clear from the above that measurements of low-temperature sealing force behaviour must pay special attention to the rate of cooling and the cooling function.
However, isothermal compression should also be considered in comparison with isobaric cooling. In the case of rapid static compression, only the vibrational volume can spontaneously follow the deformation, i.e. the vibrational amplitude of the polymer chains is reduced. Here again, void diffusion is cited as a time-dependent process [13].
Configuration theory (configurational entropy)
The term “configuration” describes the spatial arrangement of atoms and groups of atoms in a molecule with the same constitution (structural isomerism, tacticity). The degrees of freedom of a molecule are obtained from positional and nuclear spin degrees of freedom of the electrons and atomic nuclei.
The internal energy in the polymer melt is made up of chemical bond energies, kinetic energies for rotations and vibrations and potential energy. Goldstein [14] introduced the concept of energy landscapes, as illustrated graphically in Figure 2. The potential energy of the free molecule, consisting of adiabatic electron energy and nuclear repulsion energy, gives the so-called potential hypersurface. Here, the extremes are of particular importance, with minima describing stationary states and saddle points (maxima) describing transitional states [15].
In principle, as the temperature of the polymer melt drops, its entropy decreases, i.e. the internal order increases. Decreasing entropy also means that the possibilities of movement are reduced over a defined time interval to reach a macroscopically most probable equilibrium state of the entropy via configurational changes. With decreasing temperature, potential barriers (maxima) therefore become increasingly difficult to overcome.
Any disturbance to the system, e.g. by rapid, shock-type cooling of the melt, initially causes an imbalance. This results in an entropy deficit, also referred to as negative excess entropy, which then has to be removed in order to achieve the respective equilibrium entropy [16].
The falling number of possible configurational changes finally leads to molecular segments being trapped in one configuration (minima) more and more frequently. The minima represent glassy states. The configurational state needed for an entropy equilibrium, averaged over time, can no longer be achieved and the ergodicity is said to break down [17] or a transition from an ergodic to a non-ergodic state is said to occur.
During isothermal compression, a spontaneous restriction of the vibrational amplitudes of the polymer chains occurs. However, the potential energy of the molecules is increased, since now, instead of a more energetically favourable conformation, a higher-energy arrangement has to be adopted as a result of the folding and twisting of the bond axes. This means that, despite compression, the kinetic energy remains the same [13]. In contrast, the kinetic energy decreases during isobaric cooling.
The mode coupling theory
The mode coupling theory [18] depicts a molecular kinetic model. It describes the undercooling of a molecular fluid from a microscopic viewpoint. The different relaxation processes occurring with a rising frequency of 10-6 to
Figure 2. Configuration theory – energy landscape

International Polymer Science and Technology, Vol. 39, No. 11, 2012T/4
1015 Hz are referred to as relaxation modes. As the temperature falls, the relaxation time modes initially decline in the same way until a curve separation (= bifurcation) of the different modes takes place in the so-called merging zone. At lower temperatures, therefore, different mathematical, time-dependent memory functions must be called upon for rapid and slow modes.
It is assumed that atoms are confined in a cage of adjacent atoms and, with decreasing temperatures, increasingly strong intermolecular interactions occur between neighbouring macromolecules. Starting from a critical temperature Tcrit, which is higher than the Tg value, jump processes out of this cage are only possible if several particles collaborate together. The increasingly slow atomic transport mechanism through local, individual jumps is accordingly replaced by collective movements of several atoms or groups of atoms which require substantially shorter relaxation times.
The neighbouring atoms involved in the collective jumps are themselves confined in cages, however, as outlined in Figure 3 [19]. This coupling to other neighbouring molecules leads to continuous growth of the cluster size of collective atoms as temperature drops towards the Tg value. The activation energy needed for the collective jumps increases as the temperature decreases. In other words, it becomes increasingly difficult to escape from or overcome potential wells, traps or barriers [20, 21] during the cooling process.
Mode coupling theory can also be interpreted as a dynamic method which describes a drastic slowing of density variations (fluctuations) when temperature is falling above the glass transition temperature. In the material, the electronic and ionic shift polarisation, orientation polarisation, atomic polarisation and dipolar polarisation are detected in an external electrical field. Broadband dielectric spectroscopy (= impedance spectroscopy) represents a suitable method for measuring
relaxation time spectra or coupled relaxation modes over a broad frequency range of up to 20 orders of magnitude [22].
The classical mode coupling theory (MCT) was initially drawn up only for simple fluids. Its applicability is limited to a description of the temperature dependence of relaxation time spectra for temperatures above Tcrit. Mathematical models based on mode coupling theory, i.e. for describing the temperature dependence of relaxation dynamics, can be taken from [22, 23].
Microscopic description of the reptation dynamics of entangled polymer chains should, according to the literature [24, 25], be possible using a modified polymer mode coupling theory (PMCA). An entangled network leads to significantly greater topological constraints and should be taken into account accordingly in motion equations. A critical comparison between the modified PMCA and the reptation model for more highly viscous polymer materials can be found in [26].
The reptation model (tube model)
The reptation model [27-29] describes the motion dynamics of long-chain polymer materials in qualitative form using time-dependent memory functions. The longer the polymer chains become, the more chain overlapping takes place. Because the chains are impenetrable, increased overlapping leads to increasingly restricted mobility of the individual chains. Ultimately, the intensity of the chain entanglements, loops and twists constitutes the reason why an individual polymer chain is confined along its contour. Individual chain segments can only move within an effective amplitude which is predetermined by adjacent entanglement points.
Diffusion processes take place by means of a reptational or snake-like movement of the polymer chain within a hypothetical tube contour, whose diameter corresponds to the effective amplitude of motion of the chain sections (Figure 4). The diffusion of the polymer chains along the tube contour is referred to as a so-called “primitive path”. The relaxation time tR describes these special dynamics of one-dimensional motion.
The fluctuation of the polymer chain segments around the primitive path is described by the relaxation time tseg, also referred to as segmental relaxation. The loosening of chain entanglements by diffusion processes, on the other hand, is characterised by the relaxation time te. Starting from this period, the polymer chain experiences the constraints through interlooping with neighbouring chains.
In a pure polymer melt, the chain ends can move freely and stochastically, resulting in the possibility of translational diffusion into other voids between adjacent chains, i.e. a time-consuming transition takes place into
Figure 3. Mode coupling theory – illustration of the cage principle* [19]. *The grey particle is trapped by adjacent orange particles which in turn are trapped by green particles. Particles jump collectively in unison, e.g. the grey particle together with its orange neighbours

© 2012 Smithers Rapra Technology T/5
a new tube contour. The so-called isotropisation time or disengagement time td denotes the time scale in which the polymer chain can escape from its tube. The reptational movement here changes into isotropic diffusion of the centre of gravity.
Based on the solid-like state which is due to chemical crosslinking bridges between the macromolecules, the polymer chains are no longer able to escape from their tubes. Only freely moving chain ends can dip into adjacent tube contours, for example.
The observations are also based on the assumption that, as well as the actual reptation of the polymer chain that has been the centre of attention up to this point, all of the adjacent chains likewise perform reptational movements. This is referred to as the double reptation concept [30].
Naturally, there is now great interest in the extent to which the individual time scales differ from one another, and in their temperature dependence during cooling towards the glass transition temperature. Relaxation times become longer in the order tseg < te < tR < td. Figure 4 also illustrates the merging zone, as already described by means of MCT in section 2.3. As the temperature drops, the individual relaxation times increase in different ways as a result of the movements being frozen in [31].
A good review of other model theories for describing chain mobility is provided by [32]. Their advantages and disadvantages are also discussed there.
Influence of interfacial interactions on glass transition
Physical interaction forces between polymer chains and active filler surfaces increase as the temperature drops, restricting internal structural mobility to an ever greater extent. A distinction is made between microscopic and
macroscopic interfaces. The glass transition range shifts towards increasingly low temperatures [33] as interfacial energies become lower, in relation to nanodimensions. In [17] too, it is stated that repulsive interactions lower the glass transition temperature while attractive forces or interactions (dipole-dipole forces, London forces, hydrogen bridge bonds) raise it.
Fluorocarbon chains and polymers based on pure hydrocarbon chains with a high occupied density of methyl side groups are said to possess the lowest interfacial energy [34].
low-teMPeRatuRe sealING FoRce behavIouR IN the Glass tRaNsItIoN RaNGe aNd Its INFlueNcING FactoRs
The thermodynamic Gough-Joule effect under compressive load
The thermodynamic effect has already been discussed in detail in the literature for cases of actual installation and for increasing static compression states in elastomeric sealing materials, at 23°C and with heating of the sealing system to higher temperatures, e.g. 100°C [35]. It has been shown that, as compression increases, in addition to the coefficient of thermal expansion, the Gough-Joule effect makes an increasingly significant contribution to the increase in static sealing force and, in the case of highly elastic rubber blends, it even constitutes the dominant factor. With increasing isothermal compression, the state of entropy in the rubber blend decreases and higher-order structures form. In addition, the potential energy of the molecules rises. Whereas in the uncompressed state the polymer chains adopt the most energetically favourable conformation, under increasing compression, higher-energy arrangements are now occupied as a result of contraction and extension.
Increased heating of the elastomeric material now produces internal “driving forces” which are greater the higher the isothermal compression previously chosen. These driving forces are a result of the macromolecules’ efforts to return to a lower-energy state and to achieve the highest possible disorder (entropy elastic behaviour).
Conversely, cooling now takes place from the state as installed at 23°C towards glass transition: cooling means a reduction in entropy and enthalpy.
The rate at which the elastic recovery force or static sealing force is degraded as the temperature falls is therefore dependent on the level of the thermodynamic driving forces, i.e. the extent to which a reduction in entropy and increase in enthalpy was achieved during the previous isothermal compaction.
Figure 4. Reptation model – schematic diagram of reptational movements in the tube contour and temperature dependence of relaxation times [31]
International Polymer Science and Technology, Vol. 39, No. 11, 2012T/6
The coefficient of expansion
The glass transition range is known for the fact that parameters such as the coefficient of expansion a, the specific heat capacity cp and the viscosity h, and mechanical moduli such as the shear modulus G and the dielectric relaxation, display a jump in the curve here. The coefficient of expansion will be considered below, bearing in mind the need to distinguish between the coefficient of volume expansion, which is used for polymer melts, and the coefficient of linear expansion, which relates to the solid state.
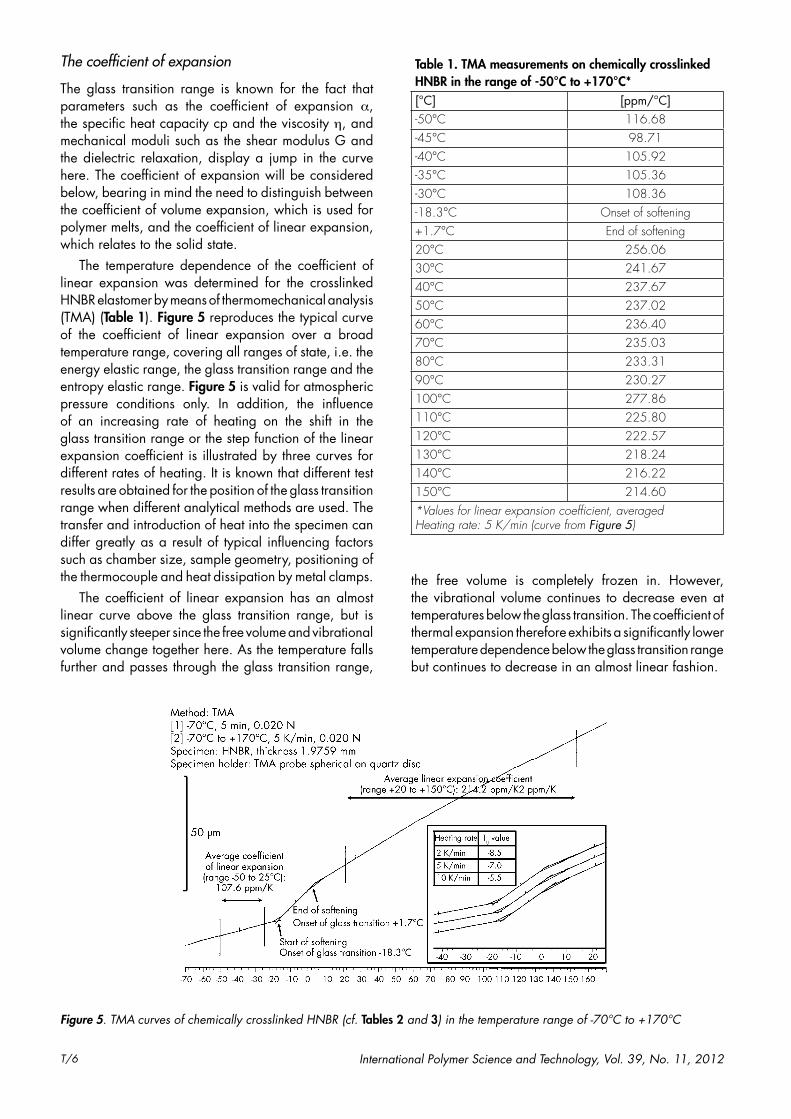
The temperature dependence of the coefficient of linear expansion was determined for the crosslinked HNBR elastomer by means of thermomechanical analysis (TMA) (Table 1). Figure 5 reproduces the typical curve of the coefficient of linear expansion over a broad temperature range, covering all ranges of state, i.e. the energy elastic range, the glass transition range and the entropy elastic range. Figure 5 is valid for atmospheric pressure conditions only. In addition, the influence of an increasing rate of heating on the shift in the glass transition range or the step function of the linear expansion coefficient is illustrated by three curves for different rates of heating. It is known that different test results are obtained for the position of the glass transition range when different analytical methods are used. The transfer and introduction of heat into the specimen can differ greatly as a result of typical influencing factors such as chamber size, sample geometry, positioning of the thermocouple and heat dissipation by metal clamps.
The coefficient of linear expansion has an almost linear curve above the glass transition range, but is significantly steeper since the free volume and vibrational volume change together here. As the temperature falls further and passes through the glass transition range,
the free volume is completely frozen in. However, the vibrational volume continues to decrease even at temperatures below the glass transition. The coefficient of thermal expansion therefore exhibits a significantly lower temperature dependence below the glass transition range but continues to decrease in an almost linear fashion.
Table 1. TMA measurements on chemically crosslinked HNBR in the range of -50°C to +170°C*[°C] [ppm/°C]-50°C 116.68-45°C 98.71-40°C 105.92-35°C 105.36-30°C 108.36-18.3°C Onset of softening+1.7°C End of softening20°C 256.0630°C 241.6740°C 237.6750°C 237.0260°C 236.4070°C 235.0380°C 233.3190°C 230.27100°C 277.86110°C 225.80120°C 222.57130°C 218.24140°C 216.22150°C 214.60*Values for linear expansion coefficient, averagedHeating rate: 5 K/min (curve from Figure 5)
Figure 5. TMA curves of chemically crosslinked HNBR (cf. Tables 2 and 3) in the temperature range of -70°C to +170°C
© 2012 Smithers Rapra Technology T/7
By means of isothermal compression of the elastomeric material at e.g. 23°C, it is possible to achieve a reduction in volume shrinkage during subsequent cooling to low temperatures. Increasing compaction of the volume anticipates what would otherwise occur more markedly during isobaric cooling into the low temperature range with only low compression.
PVT diagrams
PVT diagrams describe the specific volume as a function of pressure and temperature. They are commonly used for simulating filling processes in injection moulding tools or for the general characterisation of shrinkage processes. When designing seals, the description of the volume given by the PVT diagram can provide useful information for the elastomeric material being used, particularly in the critical low-temperature range.
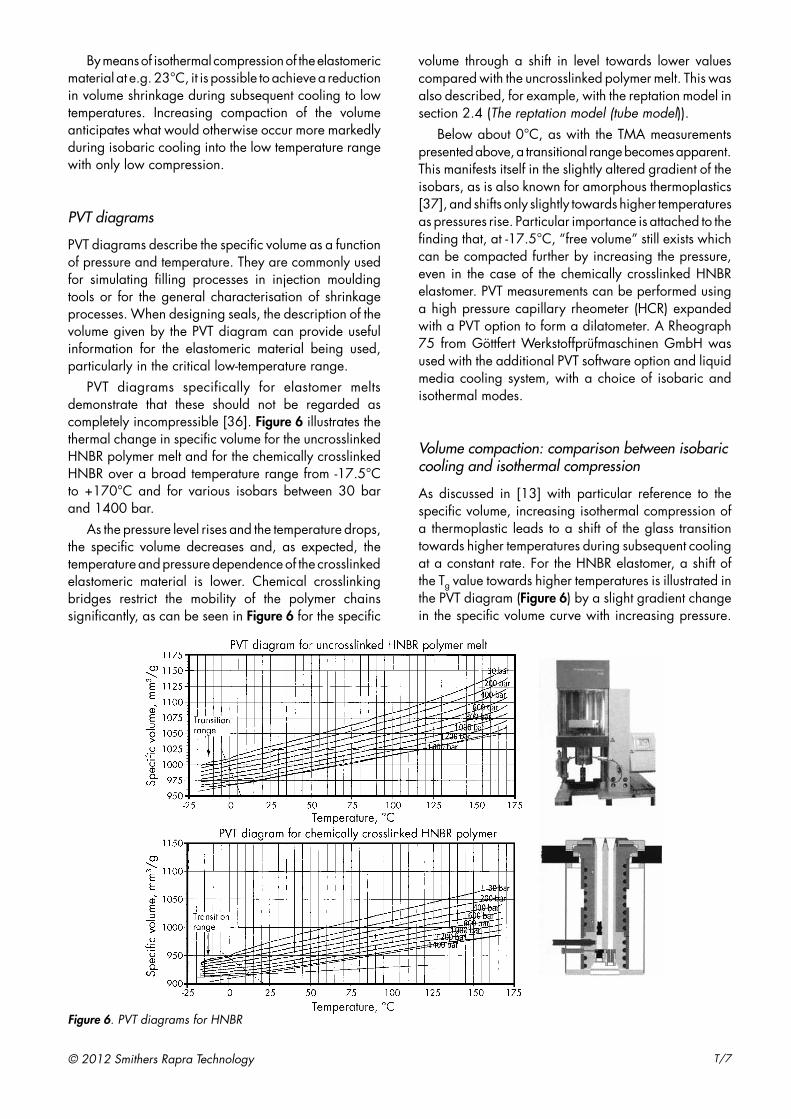
PVT diagrams specifically for elastomer melts demonstrate that these should not be regarded as completely incompressible [36]. Figure 6 illustrates the thermal change in specific volume for the uncrosslinked HNBR polymer melt and for the chemically crosslinked HNBR over a broad temperature range from -17.5°C to +170°C and for various isobars between 30 bar and 1400 bar.
As the pressure level rises and the temperature drops, the specific volume decreases and, as expected, the temperature and pressure dependence of the crosslinked elastomeric material is lower. Chemical crosslinking bridges restrict the mobility of the polymer chains significantly, as can be seen in Figure 6 for the specific
volume through a shift in level towards lower values compared with the uncrosslinked polymer melt. This was also described, for example, with the reptation model in section 2.4 (The reptation model (tube model)).
Below about 0°C, as with the TMA measurements presented above, a transitional range becomes apparent. This manifests itself in the slightly altered gradient of the isobars, as is also known for amorphous thermoplastics [37], and shifts only slightly towards higher temperatures as pressures rise. Particular importance is attached to the finding that, at -17.5°C, “free volume” still exists which can be compacted further by increasing the pressure, even in the case of the chemically crosslinked HNBR elastomer. PVT measurements can be performed using a high pressure capillary rheometer (HCR) expanded with a PVT option to form a dilatometer. A Rheograph 75 from Göttfert Werkstoffprüfmaschinen GmbH was used with the additional PVT software option and liquid media cooling system, with a choice of isobaric and isothermal modes.
Volume compaction: comparison between isobaric cooling and isothermal compression
As discussed in [13] with particular reference to the specific volume, increasing isothermal compression of a thermoplastic leads to a shift of the glass transition towards higher temperatures during subsequent cooling at a constant rate. For the HNBR elastomer, a shift of the Tg value towards higher temperatures is illustrated in the PVT diagram (Figure 6) by a slight gradient change in the specific volume curve with increasing pressure.
Figure 6. PVT diagrams for HNBR

International Polymer Science and Technology, Vol. 39, No. 11, 2012T/8
This can also be observed in this form for amorphous thermoplastics [37].
Isothermal compression and isobaric cooling are fundamentally associated with a reduction in the free and vibrational volume. It is assumed that the vibrational volume can still follow synchronously even with high rates of compression and cooling. However, the free volume is degraded via diffusion processes and therefore needs longer and longer relaxation times as the temperature drops towards glass transition.
The selection of the compression and cooling rate is therefore very important. An increasing rate of compression reduces compaction since less free volume can be lost through relaxation processes, and the width of the glass transition increases [13]. An increasing rate of cooling also inhibits relaxation processes, leading to more free volume being frozen in and the Tg value shifting to higher temperatures.
While the polymer chains move closer together during isobaric cooling as a result of the reduction in kinetic energy, however, during isothermal compression the kinetic energy remains constant despite molecular convergence. The entropy decreases in both processes but the situation is different for the enthalpy.
According to Equation (3), the enthalpy H is made up of the internal energy U and the pressure-volume work pV. In the case of isothermal compression, a temperature increase in the elastomeric material results from the performance of work. In addition, kinetic energy is released by the molecular convergence. By means of contraction and extension, higher-energy arrangements of the polymer chains are obtained which lead to a rise in the potential energy and thus to an increase in enthalpy [38].
H = U + pV (3)
In the case of isobaric cooling, however, the enthalpy decreases [39]. The great difference lies in the fact that, despite spatial constriction, relaxation processes can take place more rapidly during isothermal compression when the same volume compaction is produced as during isobaric cooling [13].
An increasing rate of cooling will necessarily reduce compaction, i.e. the resulting potential energy, more and more significantly. Considered from a different angle, the extent to which high rates of cooling can be compensated depends on the extent of compaction. Only compaction linked with a significant decrease in entropy together with an increase in enthalpy can produce long-lasting effectiveness of elastic sealing and recovery forces during subsequent low-temperature cooling.
Under the above conditions, it should be possible to shift the zero point of the sealing force towards lower temperatures if the state of isothermal compression of the sealing profile is increased. By means of special measurements describing the temperature dependence of the static sealing force at low temperatures, the above observations will be confirmed in the following practical section. However, to put this effect into perspective, the zero point of the sealing force is shifted towards lower temperatures only by a few degrees.
Adhesive tendencies of sealing materials
The tendency of some elastomeric materials to stick to the surface of the substrate to be sealed should not be underestimated. Despite temperatures below the glass transition range and restoring forces which have signalled the leakage point for some time, it is quite possible for the sealing function to be maintained as a result of adhesive bonding of the sealing material.
test Methods aNd test Results FoR the dyNaMIcs oF MotIoN IN the Glass tRaNsItIoN RaNGe
The characteristic data for the HNBR under investigation are compiled in Table 2. Table 3 supplements this with the concentrations of the individual crosslinking chemicals, which were mixed into the HNBR elastomer on an open roll mill. They were selected so that the chemical crosslinking density achieved for the specimens produced gave a technically useful property profile.
Table 2. Characteristics of the HNBR being investigatedNo. HNBR (completely hydrogenated) Measurement/ unit Value1. Acrylonitrile content wt% 34 – 352. Mooney viscosity ML1+4, 100°C 633. Molecular weight (GPC measurements)
number average Mn
weight average Mw
g/molg/mol
75137216442
4. Molecular weight distribution (MWD) non-uniformity or polydispersity Mw/Mn 2.885. 1,4-trans content % 0.26. Hydrogenated butadiene units % 64.87. Residual double bond content % 0.38. Residual 1-butadiene monomer content % 0

© 2012 Smithers Rapra Technology T/9
Table 4 serves as a general overview of test methods for determining the freezing behaviour of elastomeric materials. While this paper is concerned exclusively with the glass transition of a purely amorphous elastomer grade, many of these test methods also provide information on cold crystallisation or on the effect of partially crystalline regions in polymeric material on low-temperature properties. In addition, the characteristic values from the various test methods lead to different results in relation to the position of the glass transition range, which this paper is intended to highlight. Further details can be found in the handbooks cited [40, 41].
DSC measurements as a function of heating rate
DSC measurements of the glass transition range were initially performed for the HNBR elastomer (Table 2) in the uncrosslinked and the chemically crosslinked state (instrument: Mettler Toledo TC15). Examples of DSC curves are given in Figure 7 for different heating rates and a temperature range of -50°C to +15°C. Table 5 illustrates the significant findings from these measurements.
As the heating rate increases, the glass transition point (mean Tg) shifts towards higher and higher temperatures and, in addition, with an increasing heating rate the temperature range of glass transition expands, with
Table 4. Overview of test methods, characteristics and standards for determining the freezing behaviour of polymeric materials [40, 41, 42]No. Measuring
methodDescription of test method Parameter
designationTest standard Comment
1. DSC analysis Differential Scanning Calorimetry Tg value ISO 11357-2,ASTM D3418-99
2. TMA Thermomechanical Analysis Tg value DIN 53752,ASTM E831-
2000
Determination from linear expansion or penetration.
Measurement of linear thermal expansion coefficient
3. DMA (DTA) Dynamic Mechanical Analysis Tg value DIN 535454. Dilatometry Dilatometer or high-pressure
capillary rheometerTg value PVT diagram, measurement of
volume expansion coefficient5. Gehman test Torsion pendulum test TL value ISO 1432*
(DIN 53548)Limit temperature for entropy
elastic behaviour6. Low-temperature
guide valueTorsion pendulum test TR value ISO 4663 (DIN
53445)Temperature dependence of the logarithmic decrement
7. Temperature retraction test
Shrinkage behaviour of a tensile specimen frozen in a stretched state
with a defined thawing process
TR value ISO 2921 e.g. TR10 = temperature at which 10% shrinkage can take
place8. Impact stress Test of failure as a function of
temperature after cold storageTS value ISO 812 Low-temperature brittleness
point9. Brittleness test Test of bending as a function of
temperature after cold storageASTM Testing for cracks when a
frozen sample is bent around a defined mandrel
10. Hardness change Test of hardness as a function of temperature after cold storage
DIN 53541, ISO 3387
Freezing and crystallisation behaviour
11. Crystallisation under pressure
ISO 6471
12. Small angle x-ray scattering (SAXS)
[44]
*ISO 1432 is identical with BS 903 Part A13 and ASTM D1053, and should be regarded as approximately equivalent to DIN 53546, BS 903-A25 and ASTM D736.
Table 3. Blend composition of crosslinked HNBRNo. Formulation component phr CAS no. Product name1. HNBR elastomer (from Table 1) 100 88254-10-82. Triallyl isocyanurate TAIC 2 1025-15-6 TAIC M703. Peroxide DHBP 2,5-dimethyl-2,5-di(tert-butylperoxy)hexane 6 78-63-7 Luperox 101 XL 45
Total weight 108

International Polymer Science and Technology, Vol. 39, No. 11, 2012T/10
the left-hand limit of glass transition for the lower temperatures shifting to a lesser degree than the right-hand limit.
Because of the chemical crosslinking bridges, the mean Tg is shifted towards higher temperatures compared with the uncrosslinked elastomeric material; chemical crosslinking restricts mobility and thus has a negative impact on low-temperature flexibility. The temperature shift of the glass transition range overall is approximately +1 to +2°C for the same rates of heating.
Classic DMA measurements as a function of heating rate
In Figure 8, the curves for the storage part of the modulus of elasticity E’ are plotted over a temperature range of -80 to +80°C. In terms of force, the test
Figure 7. Graph of the shift in glass transition temperature – influence of heating rate on DSC curves using the example of crosslinked HNBR elastomeric material (cf. Tables 2 and 3)
Table 5. Shift of glass transition range of uncrosslinked and chemically crosslinked HNBR with different heating rates (DSC analysis)Heating rate/ °C/min
Left-hand limit/°C
Mean Tg / °C Right-hand limit/°C
Glass transition temperature range
5 HNBR, crude polymer -30.7 -25.1 -18.4 D12.310 HNBR, crude polymer -29.4 -23.5 -16.1 D13.315 HNBR, crude polymer -28.9 -22.8 -14.8 D14.120 HNBR, crude polymer -27.6 -21.5 -12.9 D14.75 HNBR, chemically crosslinked -29.2 -23.5 -18.5 D10.710 HNBR, chemically crosslinked -27.2 -22.4 -15.6 D11.615 HNBR, chemically crosslinked -26.7 -21.0 -13.4 D13.320 HNBR, chemically crosslinked -25.3 -19.5 -11.2 D14.1
Figure 8. DMA measurements – shift of glass transition ranges using the example of storage modulus and loss factor as a function of heating rate and load (“tension” mode)

© 2012 Smithers Rapra Technology T/11
was performed in the “tension” mode on a Netzsch DMA 242. The test frequency was 1 Hz. The heating rate was varied in the range of 1 K/min to 16 K/min. As the heating rate increases, the glass transition point shifts towards higher temperatures. Compared with the previous DSC measurements, the sample was now under load with E’1(-80°C) = 236 MPa, which entails a significant increase in entropy and enthalpy.
Another, lower, tensile stress with E’2(-80°C) = 182 MPa at the same rate of heating (4 K/min) is intended to illustrate the influence of a smaller change in entropy and enthalpy on the position of glass transition, i.e. with a shift to the right. Table 6 gives all of the glass transition temperatures for the two loads. For the inflection point of the E’ curve and from the maximum of the loss factor, very different levels are known to be obtained for the Tg value. For the purpose of comparison with DSC results, the Tg value from the curve of the loss modulus E’’ is recommended [41].
Relaxation tests with cooling ramp (Instron)
Measurements of compressive stress relaxation under non-isothermal conditions were performed using an Instron measuring machine in the temperature range of +23°C to -40°C [42]. The compressing of the 6 mm high cylindrical specimens took place on a 10% and a 40% compressive deformation path at 23°C. The rate of compression was 5 mm/min. This was followed by 30 minutes’ isothermal relaxation. The cooling rate was 0.2°C/min. To avoid friction effects during the measurements, the faces of the specimens were coated with Fomblin grease. Figure 9 shows the curves for the recovery force and surface pressure as well as the leakage points. An increase in static compression from 10% to 40% at 23°C in the chemically crosslinked HNBR elastomeric material (Table 2) leads to an 8.3°C shift of the zero point of the sealing force towards lower temperatures.
Figure 9. Recovery force and surface pressure as a function of static compression state and temperature [40]
Table 6. Glass transition temperatures from traditional DMA measurements for various heating rates and loading states in the "tension" mode
Modulus of elasticity E’1 = 236 MPa* Modulus of elasticity E’2 = 182 MPa**Heating rate/°C/min
Tg value from inflection point of
E' curve/°C
Tg value from E'' curve/°C
Tg value from loss factor
maximum/°C
Tg value from inflection point of E'
curve/°C
Tg value from E'' curve/°C
Tg value from loss factor/°C
1 -36.0 -32.3 -21.8 - - -2 -32.1 -29.6 -17.0 - - -4 -30.3 -26.4 -13.3 -19.7 -18.2 -9.58 -12.4 -11.8 -0.9 - - -16 -4.5 -3.8 +7.8 - - -Crosslinked HNBR tensile specimens, test frequency 1 Hz – amplitude ±20 µm – static preload 7.7(*) or 3.8 N(**) – temperature range -80°C to +80°C

International Polymer Science and Technology, Vol. 39, No. 11, 2012T/12
Relaxation tests with a cooling ramp (Jidoka S101)
The Jidoka S101 measuring instrument [43] also enables measurements of the static recovery or sealing force to be made down to low temperatures of a minimum of -35°C with the aid of a temperature-controlled chamber. Measurements were again performed on cylindrical, chemically crosslinked specimens of the HNBR elastomeric material with a height of 6 mm and a diameter of 10 mm. As a function of the compressive deformation path for installation conditions at 23°C, with variation between 10% and 50%, cooling initially takes place immediately, i.e. without an isothermal relaxation phase, at rates according to the time function as plotted in Figure 10. The isothermal compression rate was previously 2 mm/min. This peculiarity arises from the use of temperature-control equipment which is operated with a special silicone medium and is severely limited in its cooling performance compared with nitrogen cooling. In contrast with the Instron relaxation measurements [42], the result now is a cooling curve such that – partly owing to the increase in viscosity of the temperature-control medium – the rate of cooling approaches zero close to low-temperature settings of -35°C. Thus, the HNBR grade (Table 2) passes through its glass transition range with significantly lower cooling rates, allowing the relaxation processes significantly more time for the thermal degradation of free volume. As compression of the specimens increases, the leakage point again shifts towards lower and lower temperatures (Figure 10), i.e. from -24.5°C for a 10% compression path to -31.5°C for a 50%
compression path. This means a difference of 7°C for the zero point of the sealing force.
In addition, Figure 11 is intended to show a comparison of the curves for static sealing force where a 30-minute isothermal relaxation phase has been added after compression at 23°C (as in [42]). For the examples for 10% and 30% compression paths, the curves with isothermal relaxation during the cooling process join the curves with cooling commencing immediately after isothermal compression.
Figure 10. Static restoring force of chemically crosslinked HNBR (cf. Tables 2 and 3) using Jidoka S101
Figure 11. Crosslinked HNBR elastomer* - influence of different compression states with and without an isothermal relaxation phase on the temperature-dependent curve of sealing force (cf. Tables 2 and 3)
© 2012 Smithers Rapra Technology T/13
coNclusIoNs
The static sealing force behaviour of elastomeric sealing profiles at low temperatures is important in many applications. The free volume theory, the reptation model and configuration theory allow the processes in the polymer structure during temperature reduction into the glass transition range of the amorphous elastomeric material to be described from different points of view.
In contrast to isobaric cooling with negligible compression, in the case of significant isothermal compression, an increase in enthalpy takes place alongside the decrease in entropy. Both allow longer for the sealing material to pursue its efforts to achieve a lower-energy state and higher disorder, even during significant cooling processes. This is expressed at low temperatures by a greater sealing capacity resulting from higher elastic recovery forces.
Ultimately, it is the higher kinetic energy in the elastomeric material that is still available after strong isothermal compression followed by temperature reduction, compared with purely isobaric cooling, which brings about shorter relaxation times. In the glass transition range too, as a result of shorter relaxation times the elastomeric material can therefore maintain its efforts to adopt more favourable molecular arrangements for longer. This makes a substantial contribution to cold sealing behaviour, particularly in dynamic processes.
The PVT diagrams prepared for uncrosslinked polymer melt and crosslinked HNBR elastomeric material also show that compressibility still exists at -20°C, with chemical crosslinking promoting the immobility of the polymer chains. In addition, as isothermal compression increases, the cooling-related shrinkage behaviour is already anticipated, i.e. the compaction achieved reduces further low-temperature shrinkage. This can also be deduced from the PVT diagrams.
The above effects reinforce one another in a positive manner or work in parallel. The greater the extent to which they can be achieved, the further the zero point of the sealing force is shifted towards lower temperatures. As a result of increasing compression, the leakage point of the curve for static sealing force at low temperatures can actually be shifted by several degrees. This has been confirmed with parallel, non-isothermal relaxation measurements by several firms within the rubber industry with the same results.
acKNowledGeMeNts
The team of authors would like to thank Reinhard Emmert and the Mettler Toledo company for the TMA measurements, Raffaella Villa and her team at Solvay Solexis for the non-isothermal Instron relaxation measurements and Kiriaki Athanasopulu and the
University of Reutlingen, Department of Applied Chemistry, for the DMA measurements. Additional thanks go to Göttfert for producing the PVT diagrams and to Beate Buhl (CTA) and ElringKlinger AG for the opportunity to perform DSC measurements.
ReFeReNces
1. M. Erber: Die glasartige Dynamik von Polymeren mit spezieller Architektur in eingeschränkter Geometrie dünner Filme, Ph.D. thesis 2010, Dresden University of Technology.
2. W. Retting in B. Carlowitz: Die Kunststoffe, Chemie, Physik, Technologie (Becker/Braun-Kunststoff-Handbuch 1), Carl Hanser Verlag Munich.
3. S. A. Baeurle, A. Hotta, A. A. Gusev, Polymer, 47, 2006, 6243.
4. S. Torquato, Nature, 2000, 405, 521.5. B. Wunderlich, Thermochimica Acta, 2006,
446, 128.6. J. H. Gibbs, E. A. Di Marzio, J. Ch em. Phys.
28 (1958) 373/807. 7. G. Adam, J. H. Gibbs, J. Chem. Phys. 43
(1965) 1398. Ch. Hoffmann: Charakterisierung des
Glasübergangstemperatur von ultradünnen Langmuir Blodgett Seitenketten Polymere mittels optischer Modenspektroskopie, dissertation 2007, Wiesbaden University of Applied Sciences.
9. A. Serghei, Ph.D. thesis, 2006, University of Leipzig.
10. M. H. Cohen, D. Tumbuli, Journal of Chemical Physics, 1959, 31, 1164.
11. N. Hirai, H. Eyring: Bulk Viscosity of Polymeric Liquids, Journal of Polymer Science, 37 (1959) 51-70.
12. G. Kanig: Kolloid Z. u. Z. f. Polymere, 233 (1969) 829
13. N. Rudolph, Druckverfestigung amorpher Thermoplaste, Ph.D. thesis 2009, University of Erlangen-Nürnberg.
14. M. Goldstein, J. Chem. Phys. 51 [1969) 3728.15. G. Hohlneicher, I. Kautz, J. Wolf: Einführung
in die Infrarotspektroskopie, Physikalisch chemisches Praktikum für Fortgeschrittene, Lehrstuhl für physikalische Chemie, University of Cologne 1993.
16. G. Minnameier: Strukturgenese moralischen Denkens: eine Rekonstruktion der Piagetschen Entwicklungslogik und ihre moraltheoretischen

International Polymer Science and Technology, Vol. 39, No. 11, 2012T/14
Folgen; Münster, New York, Munich, Berlin, Waxmann 2000, Section 2.1.1: Ordnung, Stabilität und Phasenübergänge im Lichte der Thermodynamik.
17. Th. Fuhrmann-Lieker: Physikalische Chemie der Polymere und Flüssig-Kristalle, Script, 2005, University of Kassel.
18. W. Giitze, L Sjiirgen, Rep. Prog. Phys. 55, (1992) 241.
19. W. Giitze, T. Voigtmann: Ideale Glasubergange, Physikalische Blatter, 57, 4, (2001) 41.
20. E. A. DiMarzio, I. C. Sanchez: in "Transport and Relaxation in Random Materials", edited by J. Klafter, R. J. Rubin, M. Sleshinger, World Scientific, London 1986.
21. E. A. DiMarzio, A. J. M. Yang, J. Res. Natl. Inst. Stand. Technol. 102 (1997) 135.
22. M. Ricker: Strukturfaktoren, Modenkopplungsgleichungen und Glasübergang molekularer Kristalle, Ph.D. thesis 2005, University of Mainz.
23. P.H. Rösner: Mechanische Relaxation in komplexen Fluiden, Ph.D. thesis 2004, University of Göttingen.
24. K. S. Schweizer, J. G. Curro, Phys. Rev. Lett. 58 (1987) 246.
25. 1. G. Curro, K. S. Schweizer, Macromolecules 20 (1987) 1928.
26. M. Rehkopf: Dynamik wechselwirkender Polymersysteme, Ph.D. thesis 1999, University of Mainz.
27. M. Doi, S. F. Edwards: Dynamic of concentrated polymer systems,II: Molecular motion under flow, J. Chem. Soc. Faraday Trans. 74/II,3 (1978),1802.
28. M. Doi, S. F. Edwards: Dynamic of concentrated polymer systems, IV: Rheological properties, J. Chem. Soc. Faraday Trans. 75/II, 1(1979), 38.
29. P. G. de Gennes, J. Chem. Phys. 55 (1971) 572.
30. J. des Cloizeaux, Macromolecules 23 (1990) 3992.
31. M. Wind: Festkörper-NMR-Spektroskopie, Anisotrope molekulare Dynamik polymerer Schmelzen und dendritischer Systeme, Ph.D. thesis 2001, University of Mainz.
32. M. Pütz: Dynamik von Polymerschmelzen und Quellverhalten ungeordneter Netzwerke, Ph.D. thesis 1999, University of Mainz.
33. B.-M. Z. Newby, M. K. Chaudhury, Langmuir 13 (1997). 1805.
34. Michael J. O. Wen: Release Agents, Dow Corning Corporation, in: Encyclopedia of Polymer Science and Technology, pp. 115-124.
35. R. Hornig: Warmeausdehnungskoeffizient und Gough-Joule-Effekt, GAK 11/2006, 708 -715.
36. U. Masberg: Thermodynamische Aspekte bei der Vulkanisation von Gummiformteilen; KGK 41,04 (1988), 353-358.
37. P. Zoller, D. 1. Walsh: Data of Standard Pressure -Volume-Temperature Data for Polymers, Technomic Publishing Company, 1995.
38. Y. K. Godovsky: Thermophysical properties of polymers, Springer Verlag, Berlin 1992.
39. w. Knappe, J.-H. Ott: Die spezifische Warme von PMMA und PVC im Einfrierbereich, Colloid & Polymer Science 255 (1977), 837-843.
40. F. Röthmeyer, F. Sommer: Kautschuktechnologie, Carl Hanser Verlag Munich Vienna 2006.
41. G. W. Ehrenstein, G. Riedel, P. Trawiel: Praxis der thermischen Analyse von Kunststoffen, Carl Hanser Verlag Munich 2003.
42. Mirenda, Montalbetti, Sanguineti : Stress Relaxation of HNBR 3406 at non-isothermal conditions, Solvay Specialty Solexis, 16.02.2012, 5 pages.
43. W. Rahm: Kurzzeitprufverfahren fUr Gummi in der Oualitatssicherung, KGK 09/1995.
44. S. Krügel: Modellierung und Charakterisierung starrer knäuelförmiger Makromoleküle; Polynorbornene, Ph.D. thesis 1998, University of Marburg.