STATEMENT OF FINANCIAL POSITIONiba.gov.au/reports/AR1617/assets/2017pdf/financial_statement.pdf ·...
46
as at 30 June 2017 2017 2016 $’000 $’000 Assets Financial assets Cash and cash equivalents 6A 277,758 161,809 Trade, loans and other receivables 6B 722,907 727,275 Investments 6C , 6D, 6E 219,636 188,221 Deferred tax assets 6F 646 822 Total financial assets 1,220,947 1,078,127 Non-financial assets Land and buildings 7A 26,708 29,311 Property, plant and equipment 7A 21,130 21,071 Investment property 7B 99,856 151,069 Intangibles 7A 6,188 7,290 Inventories 2,426 4,447 1,693 2,018 Total non-financial assets 158,001 215,206 Total assets 1,378,948 1,293,333 Liabilities Payables Suppliers 8A 13,329 11,520 Tax liabilities 48 110 Other 8B 11,517 6,315 Total payables 24,893 17,945 Interest bearing liabilities Loans 9 11,500 22,985 Total interest bearing liabilities 11,500 22,985 Provisions Employee provisions 10A 5,628 6,885 Other 10B 2,117 3,070 Total provisions 7,745 9,955 Total liabilities 44,138 50,885 Net assets 1,334,810 1,242,448 Equity Parent entity interest Contributed equity 1,010,243 971,997 Reserves 3,082 8,942 Retained earnings 257,452 216,840 Total parent entity interest 1,270,777 1,197,779 Attributed to non-controlling interests Contributed equity 59,166 40,082 Reserves 2,368 1,440 Retained earnings 2,499 3,147 Total non-controlling interests 64,033 44,669 Total equity 1,334,810 1,242,448 The above statement should be read in conjunction with the accompanying notes. STATEMENT OF FINANCIAL POSITION Consolidated Notes FINANCIAL PERFORMANCE PART 7: ANNUAL REPORT 2016–17 111
Transcript of STATEMENT OF FINANCIAL POSITIONiba.gov.au/reports/AR1617/assets/2017pdf/financial_statement.pdf ·...

as at 30 June 2017
2017 2016$’000 $’000
AssetsFinancial assets
Cash and cash equivalents 6A 277,758 161,809 Trade, loans and other receivables 6B 722,907 727,275 Investments 6C , 6D, 6E 219,636 188,221 Deferred tax assets 6F 646 822
Total financial assets 1,220,947 1,078,127 Non-financial assets
Land and buildings 7A 26,708 29,311 Property, plant and equipment 7A 21,130 21,071 Investment property 7B 99,856 151,069 Intangibles 7A 6,188 7,290 Inventories 2,426 4,447 ����������� ��� �� ����� 1,693 2,018
Total non-financial assets 158,001 215,206 Total assets 1,378,948 1,293,333
LiabilitiesPayables
Suppliers 8A 13,329 11,520 Tax liabilities 48 110 Other 8B 11,517 6,315
Total payables 24,893 17,945 Interest bearing liabilities
Loans 9 11,500 22,985 Total interest bearing liabilities 11,500 22,985 Provisions
Employee provisions 10A 5,628 6,885 Other 10B 2,117 3,070
Total provisions 7,745 9,955 Total liabilities 44,138 50,885 Net assets 1,334,810 1,242,448
EquityParent entity interest
Contributed equity 1,010,243 971,997 Reserves 3,082 8,942 Retained earnings 257,452 216,840
Total parent entity interest 1,270,777 1,197,779 Attributed to non-controlling interests
Contributed equity 59,166 40,082 Reserves 2,368 1,440
Retained earnings 2,499 3,147 Total non-controlling interests 64,033 44,669 Total equity 1,334,810 1,242,448
The above statement should be read in conjunction with the accompanying notes.
STATEMENT OF FINANCIAL POSITION
Consolidated
Notes
FINANCIAL PERFORMANCEPART 7:
ANNUAL REPORT 2016–17 111

for the period ended 30 June 2017
2017 2016 2017 2016 2017 2016 2017 2016$’000 $’000 $’000 $’000 $’000 $’000 $’000 $’000
Opening balanceBalance carried forward from previous period 219,987 209,447 10,382 8,427 1,012,079 967,585 1,242,448 1,185,459
Reclassification 3,705 (1,710) (2,178) 796 185 (173) 1,712 (1,087)Adjusted opening balance 223,692 207,737 8,204 9,223 1,012,264 967,412 1,244,160 1,184,372
Comprehensive income
Other comprehensive�income - asset revaluations
- - 868 - - - 868 -
Other comprehensive income - available for sale financial assets
- - (2,524) (2,161) - - (2,524) (2,161)
Surplus (deficit) 38,440 18,520 - - - - 38,440 18,520 Total comprehensive income 38,440 18,520 (1,656) (2,161) - - 36,784 16,359 of which is:
Attributable to the Australian Government
37,759 13,661 (2,524) (2,161) - - 35,235 11,500
Attributable to non-controlling interests 681 4,859 868 - - - 1,549 4,859
Transactions with ownersDistributions to owners
Return on capital: - - - - - (1,415) - (1,415)Transfer 1,198 (3,320) (1,096) 3,320 (102) - - -
Dividends (3,380) (2,950) - - - - (3,380) (2,950)Other movement: - -
Attributable to the Australian Government
- - - - - - - -
Attributable to non-controlling interests
- - - - - - - -
Contributions by owners - - Equity injection - - - - 38,540 39,460 38,540 39,460 Other (equity contribution from non-controlling interests)
- - - - 18,706 6,622 18,706 6,622
Total transactions with owners (2,182) (6,270) (1,096) 3,320 57,144 44,667 53,866 41,717 Closing balance as at 30 June 259,950 219,987 5,452 10,382 1,069,408 1,012,079 1,334,810 1,242,448
Less: non-controlling interests (2,498) (3,147) (2,369) (1,440) (59,166) (40,082) (64,033) (44,669)
Closing balance attributable to the Australian Government
257,452 216,840 3,083 8,942 1,010,242 971,997 1,270,777 1,197,779
The above statement should be read in conjunction with the accompanying notes.
STATEMENT OF CHANGES IN EQUITY
Consolidated
Retained earnings Reserves Contributed equity/capital Total equity
INDIGENOUS BUSINESS AUSTRALIA112
for the period ended 30 June 2017
Notes 2017 2016$’000 $’000
Operating ActivitiesCash receivedReceipts from Government 10,602 34,258 Goods and services 97,129 91,728 Interest 51,166 51,711 Dividends 850 665 Grants 23,086 -GST received 1,329 1,901 Other 18,975 19,769 Total cash received 203,137 200,032 Cash usedEmployees 51,454 55,007 Suppliers 86,100 91,470 Borrowing costs 807 948 Other 3,189 2,798 Total cash used 141,550 150,223 Net cash from operating activities 11 61,587 49,809
Investing ActivitiesCash received
66,641 14,472 Investments redeemed 46,095 87,357 Other - repayment of loans receivable 154,894 121,463
Total cash received 267,630 223,292
Cash usedPurchase of property, plant and equipment 24,385 30,125
Purchase of other non-financial assets 415 327
Investments purchased 65,905 101,010 Other - loans and advances made 165,148 186,383
Total cash used 255,853 317,845
Net cash used by investing activities 11,777 (94,553)
Financing ActivitiesCash receivedContributed equity 38,246 44,494 New �orrowing 19,084 10,224 Total cash received 57,330 54,718 Cash usedRepayment of borrowings 11,485 -Dividends paid 3,260 4,252 Total cash used 14,745 4,252 Net cash from financing activities 42,585 50,466
Net increase in cash held 115,949 5,721 161,809 156,088
6A 277,758 161,809
The above statement should be read in conjunction with the accompanying notes.
CASH FLOW STATEMENT
Consolidated
Proceeds from sales of property, plant and equipment
Cash and cash equivalents at the beginning of the reporting periodCash and cash equivalents at the end of the reporting period
FINANCIAL PERFORMANCEPART 7:
ANNUAL REPORT 2016–17 113

SCHEDULE OF COMMITMENTSas at 30 June 2017
2017 2016$’000 $’000
By TypeCommitments receivable
Lease rental income1 35,270 70,275Loans2
41,115 25,703Total commitments receivable 76,385 95,978Commitments payable
Operating leases³ 11,447 12,758 Loans2 41,115 25,703 Others4
7,401 9,900 Total commitments payable 59,963 48,361
Net commitments by type 16,422 47,617
By MaturityCommitments receivable
Operating lease incomeOne year or less 11,122 17,565 From one to five years 17,043 45,133 Over five years 7,105 7,577
Total operating lease income 35,270 70,275Loan commitments receivable
One year or less 1,898 564 From one to five years 9,302 3,386
Over five years 29,915 21,753 Total loan commitments receivable 41,115 25,703
Commitments payableOperating lease commitments
One year or less 2,280 2,389 From one to five years 6,444 6,166 Over five years 2,723 4,202
Total operating lease commitments payable 11,447 12,757Loan commitments payable
One year or less 41,115 25,703 Total loan commitments payable 41,115 25,703
Other commitments payableOne year or less 5,325 4,190 From one to five years 1,623 5,304 Over five years 453 407
Total other commitments payable 7,401 9,901
Net commitments by maturity 16,421 47,617
NB: Commitments are GST inclusive where relevant.
Consolidated
Notes
INDIGENOUS BUSINESS AUSTRALIA114
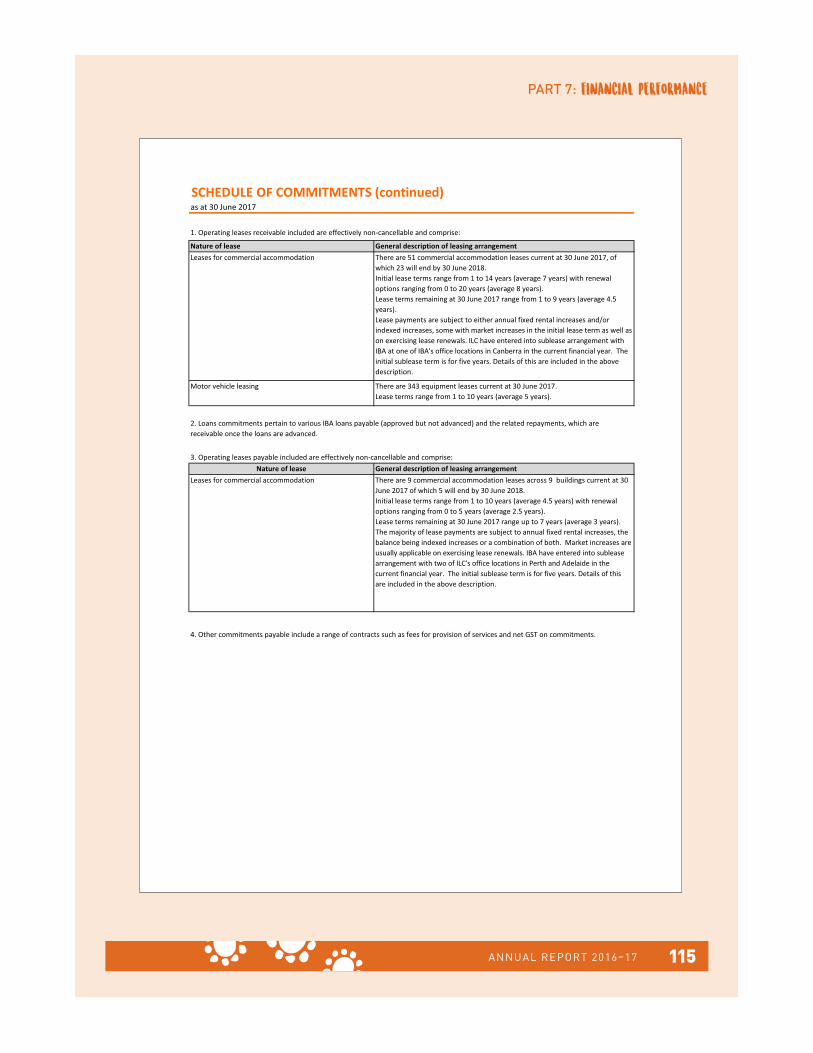
SCHEDULE OF COMMITMENTS (continued)as at 30 June 2017
1. Operating leases receivable included are effectively non-cancellable and comprise:
Leases for commercial accommodation There are 9 commercial accommodation leases across 9 buildings current at 30 June 2017 of which 5 will end by 30 June 2018.Initial lease terms range from 1 to 10 years (average 4.5 years) with renewal options ranging from 0 to 5 years (average 2.5 years).Lease terms remaining at 30 June 2017 range up to 7 years (average 3 years).�The majority of lease payments are subject to annual fixed rental increases, the balance being indexed increases or a combination of both. Market increases are usually applicable on exercising lease renewals. IBA have entered into sublease arrangement with ������������������� ������� Perth and Adelaide in ����current financial year. The initial sublease term is for five years. Details of this �� included in the above description.
4. Other commitments payable include a range of contracts such as fees for provision of services and net GST on commitments.
Motor vehicle leasing There are 343 equipment leases current at 30 June 2017. Lease terms range from 1 to 10 years (average 5 years).
2. Loans commitments pertain to various IBA loans payable (approved but not advanced) and the related repayments, which are receivable once the loans are advanced.
3. Operating leases payable included are effectively non-cancellable and comprise:Nature of lease General description of leasing arrangement
Leases for commercial accommodation There are 51 commercial accommodation leases current at 30 June 2017, of which 23 will end by 30 June 2018.Initial lease terms range from 1 to 14 years (average 7 years) with renewal options ranging from 0 to 20 years (average 8 years).Lease terms remaining at 30 June 2017 range from 1 to 9 years (average 4.5 years).Lease payments are subject to either annual fixed rental increases and/or indexed increases, some with market increases in the initial lease term as well as on exercising lease renewals. ILC have entered into sublease arrangement with IBA at one of IBA�� office locations in Canberra in ����current financial year. The initial sublease term is for five years. Details of this �� included in the above description.
Nature of lease General description of leasing arrangement
FINANCIAL PERFORMANCEPART 7:
ANNUAL REPORT 2016–17 115

Notes to the financial statements
Note 1: Overview 117
Note 2: Expenses 129
Note 3: Income 130
Note 4: Other Comprehensive Income 130
Note 5: Fair Value Measurements 131
Note 6: Financial Assets 132
Note 7: Non-Financial Assets 136
Note 8: Payables 138
Note 9: Interest Bearing Liabilities 138
Note 10: Provisions 139
Note 11: Cash Flow Reconciliation 140
Note 12: Contingent Liabilities and Assets 141
Note 13: Key Management Personnel Remuneration 142
Note 14: Related Party Disclosure 143
Note 15: Financial Instruments 144
Note 16: Assets Held in Trust 150
Note 17: Reporting of Outcomes 151
Note 18: New Housing Fund 152
Note 19: Parent Entity - Indigenous Business Australia 155
INDIGENOUS BUSINESS AUSTRALIA116

1.1 Objectives of Indigenous Business Australia
b) to promote and encourage Aboriginal and Torres Strait Islander self-management and economic self-sufficiencyc) such other functions as are conferred on it by this Act.
the performance of functions that:a) the Minister has authorised IBA to perform as an agent of the Commonwealth; orb) the Minister has delegated to IBA.
apply for the reporting period.
1.2 Basis of preparation of the financial reportThe financial statements are general purpose financial statements and are required by section 42 of the Public Governance, Performance and Accountability Act 2013.
The financial statements have been prepared in accordance with:a) Financial Reporting Rule (FRR) for reporting periods ending on or after 1 July 2016; andb) Australian Accounting Standards and Interpretations issued by the Australian Accounting Standards Board (AASB) that
The financial statements have been prepared on an accrual basis and are in accordance with historical cost convention, except for certain assets and liabilities at fair value. Except where stated, no allowance is made for the effect of changing prices on the results or the financial position.
Note 1: Overview
Indigenous Business Australia (IBA) is an Australian Government controlled entity, which was established on 5 March 1990, when the Aboriginal and Torres Strait Islander Commission Act 1989 came into operation. On 23 March 2005, this Act was repealed and replaced by the Aboriginal and Torres Strait Islander Act 2005 (the Act). IBA’s purpose, set out at section 147 of the Act, is as follows:
1. a) to engage in commercial activities
2. Without limiting by implication the meaning of commercial activities in paragraph 1(a), those activities include
IBA is structured to meet one outcome: improved wealth acquisition to support the economic independence of Aboriginal and Torres Strait Islander peoples through commercial enterprise, asset acquisition, construction, and access to concessional home and business loans.
The continued existence of IBA in its present form and with its present programs is dependent on Government policy and on continuing appropriations by Parliament for IBA’s administration and programs.
The financial statements are presented in Australian dollars and values are rounded to the nearest thousand dollars unless otherwise specified.
Unless an alternative treatment is specifically required by an accounting standard or the FRR, assets and liabilities are recognised in the Statement of Financial Position when and only when it is probable that future economic benefits will flow to the entity or a future sacrifice of economic benefits will be required and the amounts of the assets or liabilities can be reliably measured. However, assets and liabilities arising under executor contracts are not recognised unless required by an accounting standard. Liabilities and assets that are unrecognised are reported in the schedule of commitments or the schedule of contingencies.
Unless alternative treatment is specifically required by an accounting standard, income and expenses are recognised in the statement of comprehensive income when and only when the flow, consumption or loss of economic benefits has occurred and can be reliably measured.
FINANCIAL PERFORMANCEPART 7:
ANNUAL REPORT 2016–17 117

NOTES TO AND FORMING PART OF THE FINANCIAL STATEMENTS
• ����� ���� ����������������� ��� ������������� ������������������������ ��������� �!������������ �!��������������external valuations.
Adoption of new Australian Accounting Standards requirements
• AASB 13 Fair Value Measurement - July 2015 (Compilation)• AASB 124 Related Party Disclosures - July 2015 (Principle)• AASB 128 Investments in Associates and Joint Ventures - December 2015 (Compilation)"
Future Australian Accounting Standards requirements
• AASB 7 Financial Instruments: Disclosures - August 2015 (Principal)• AASB 9 Financial Instruments - December 2014 (Principal)• AASB 10 Consolidated Financial Statements - December 2015 (Compilation)• AASB 13 Fair Value Measurement - August 2015 (Principal)• AASB 15 Revenue from Contracts with Customers - October 2015 (Compilation)• AASB 16 Leases - February 2016 (Principal)• AASB 139 Financial Instruments: Recognition and Measurement - August 2015 (Principal)• AASB 2014-5 Amendments to Australian Accounting Standards arising from AASB 15• AASB 2016-3 Amendments to Australian Accounting Standards - Clarifications to AASB 15"
No accounting assumptions or estimates have been identified that have a significant risk of causing a material adjustment to carrying amounts of assets and liabilities within the next accounting period.
1.4 Changes in Australian Accounting Standards
No accounting standard has been adopted earlier than the application date stated in the standard. The following new standards and amendments to standards were issued prior to the sign-off date and had a financial impact on IBA:
Other standards, amendments to standards or interpretations that were issued prior to the sign-off date and are applicable to the current reporting period did not have a financial impact on IBA.
The following new standards, amendments to standards or interpretations were issued by the AASB prior to the signing of these statements by the Chief Executive Officer and Chief Financial Officer and are expected to have a financial impact on IBA for future periods:
Other new standards that were issued prior to the signing of the statements by the Chief Executive Officer and Chief Financial Officer and are applicable to the future reporting period are not expected to have a future financial impact on IBA.
1.3 Significant accounting judgements and estimatesIn the process of applying the accounting policies listed in this note, IBA has made the following judgements that have the most significant impact on the amounts recorded in the financial statements:
• The fair value of the loans portfolio is based on market-derived inputs.
INDIGENOUS BUSINESS AUSTRALIA118

NOTES TO AND FORMING PART OF THE FINANCIAL STATEMENTS1.5 RevenueRevenue from the sale of goods is recognised when:• the risks and rewards of ownership have been transferred to the buyer• IBA retains no managerial involvement or effective control over the goods• the revenue and transaction costs incurred can be reliably measured• it is probable that the economic benefits associated with the transaction will flow to IBA.
• the amount of revenue, stage of completion and transaction costs incurred can be reliably measured• the probable economic benefits associated with the transaction will flow to IBA.
Revenue from rendering of services is recognised by reference to the stage of completion of contracts at the reporting date. The revenue is recognised when:
The stage of completion of contracts at the reporting date is determined by reference to the proportion of costs incurred to date in relation to the estimated total costs of the transaction.
Receivables for goods and services, which have 30-day terms, are recognised at the nominal amounts due, less any impairment allowance account. Collectability of debts is reviewed at balance date. Allowances are made when collectability of the debt is no longer probable.
Interest revenue is recognised using the effective interest method as set out in AASB 139 Financial Instruments: Recognition and measurement.
Resources received free of chargeResources received free of charge are recognised as revenue or gains when and only when a fair value can be reliably determined, and the services would have been purchased if they had not been donated. Use of those resources is recognised as an expense.
Resources received free of charge are recorded as either revenue or gains, depending on their nature.
Contributions of assets at no cost of acquisition or for nominal consideration are recognised as gains at their fair value when the asset qualifies for recognition, unless received from another non-corporate or corporate Commonwealth entity as a consequence of a restructuring of administrative arrangements (refer to Note 1.7).
Revenue from GovernmentFunding received or receivable from non-corporate Commonwealth entities (appropriated to the non-corporate Commonwealth entity as a corporate Commonwealth entity payment item for payment of this entity) is recognised as �evenue from Government unless ����� in the nature of an equity injection or a loan.
Grant IncomeAmounts received as government grants during the year are recognised as income on a systematic basis over the periods in which the entity recognises as expenses the related costs for which the grants are intended to compensate.
FINANCIAL PERFORMANCEPART 7:
ANNUAL REPORT 2016–17 119

NOTES TO AND FORMING PART OF THE FINANCIAL STATEMENTS1.6 GainsResources received free of chargeResources received free of charge are recognised as gains when and only when a fair value can be reliably determined and the services would have been purchased if they had not been donated. Use of those resources is recognised as an expense.
Resources received free of charge are recorded as either revenue or gains depending on their nature.
Contributions of assets at no cost of acquisition or for nominal consideration are recognised as gains at their fair value when the asset qualifies for recognition, unless received from another Government entity as a consequence of a restructuring of administrative arrangements (refer to Note 1.7).
Sale of assetsGains from disposal of non-current assets are recognised when the control of the asset has passed to the buyer.
1.7 Transactions with the Government as ownerEquity injectionsAmounts appropriated which are designated as 'equity injections' for a year are recognised directly in contributed equity in that year.
Restructuring of administrative arrangementsNet assets received from or relinquished to another Government entity under a restructuring of administrative arrangements are adjusted at their book value directly against contributed equity.
Other Distributions to OwnersThe FRR require that distributions to owners be debited to contributed equity unless it is in the nature of a dividend.
1.8 Employee benefitsLiabilities for short-term employee benefits (as defined in AASB 119 Employee Benefits�) and termination benefits due within 12 months of balance date are measured at their nominal amounts.
The nominal amount is calculated with regard to the rates expected to be paid on settlement of the liability.
Other long-term employee benefits are measured as net total of the present value of the defined benefit obligation at the end of the reporting period, minus the fair value at the end of the reporting period of plan assets (if any) out of which the obligations are to be settled directly.
Leave
The liability for employee benefits includes provision for annual leave and long service leave. No provision has been made for sick leave as all sick leave is non-vesting and the average sick leave taken in future years by employees of IBA is estimated to be less than the annual entitlement for sick leave.
Leave liabilities are calculated on the basis of employee remuneration at the estimated salary rates that applied at the time the leave is taken, including IBA’s employer superannuation contribution rates to the extent that the leave is likely to be taken during service rather than paid out on termination.
Amounts received�����#% under the Parental Leave Payments Scheme not yet paid to employees were presented gross as cash and a liability.
The liability for long service leave has been determined by reference to the Australian Government shorthand method.
INDIGENOUS BUSINESS AUSTRALIA120

NOTES TO AND FORMING PART OF THE FINANCIAL STATEMENTS1.8 Employee benefits cont.Separation and redundancyProvision is made for separation and redundancy benefit payments. IBA recognises a provision for termination when it has developed a detailed formal plan for the terminations and has informed those employees affected that it will carry out the terminations.
SuperannuationStaff of IBA are members of the Commonwealth Superannuation Scheme (CSS), the Public Sector Superannuation Scheme (PSS), the PSS accumulation plan (PSSap) or other scheme they nominate.
The CSS and PSS are defined benefit schemes for the Australian Government. The PSSap is a defined contribution scheme.
The liability for defined benefits is recognised in the financial statements of the Australian Government and is settled by the Australian Government in due course. This liability is reported in the Department of Finance's schedules and notes.
IBA makes employer contributions to the employee superannuation scheme at rates determined by an actuary to be sufficient to meet the current cost to the Government. IBA accounts for the contributions as if they were contributions to defined contribution plans.
The liability for superannuation recognised as at 30 June represents outstanding contributions for the final fortnight of the year.
1.9 LeasesA distinction is made between finance leases and operating leases. Finance leases effectively transfer from the lessor to the lessee substantially all the risks and rewards incidental to ownership of leased non-current assets. An operating lease is a lease that is not a finance lease. In operating leases, the lessor effectively retains substantially all such risks and benefits.
Where an asset is acquired by means of a finance lease, the asset is capitalised at either the fair value of the lease property or, if lower, the present value of minimum lease payments at the inception of the contract; a liability is recognised at the same time and for the same amount.
The discount rate used is the interest rate implicit in the lease. Leased assets are amortised over the period of the lease. Lease payments are allocated between the principal component and the interest expense.
Operating lease payments are expensed on a straight-line basis which is representative of the pattern of benefits derived from the leased assets.
1.10 Borrowing costsAll borrowing costs are expensed as incurred.
1.11 Fair Value MeasurementsIBA did not have any transfers between the fair value hierarchy during 2016-17 or 2015-16.
1.12 CashCash is recognised at its nominal amount. Cash and cash equivalents include:• cash on hand• demand deposits in bank accounts with an original maturity of three months or less that are readily convertible to known amounts of cash
and subject to insignificant risk of changes in value.
FINANCIAL PERFORMANCEPART 7:
ANNUAL REPORT 2016–17 121

NOTES TO AND FORMING PART OF THE FINANCIAL STATEMENTS
• Credit risk: the possibility that a debtor or borrower will not repay or will delay repayment of all or part of a loan, causinga loss to IBA and the consolidated entity.
• Interest rate risk: a risk that the value of a financial asset such as home and business loans would fluctuate in terms of fair value or future cash flows as a result of changes in market interest rates.
• Liquidity risk: a risk that the consolidated entity may not have or may not be able to raise the funds to meet the obligationsassociated with financial liabilities. These risks are regularly monitored through a detailed internal management and Board reporting framework.
These risks are managed in the following ways: • IBA manages credit risk on its loans portfolio by undertaking background and credit checks prior to allowing a debtor
relationship. In addition, IBA has policies and procedures that guide employees' debt-recovery techniques.
• IBA's liquidity risk arises from the borrowings of its subsidiaries and these are monitored regularly to ensure availability of funding resources to meet these obligations.
IBA is not exposed to currency risk or other price risk.
IBA classifies financial assets in the following categories:
IBA's investment in associates and joint venture entities is accounted for as 'Available for Sale' financial instruments under AASB 139 Financial Instruments: Recognition and Measurement . These assets are fair valued as at reporting date and distribution income received from them recognised as dividend. Associates' carrying values and income are detailed in Notes 6C and 6D respectively.
1.14 Financial risk management
The operating, investing and financing activities coupled with the guiding policy framework exposes the consolidated entity to credit, liquidity and interest rate risks. Theses risks are defined as:
• IBA also holds collateral against certain loans to mitigate against credit risk.• IBA's risk management focuses on monitoring, measuring and reporting the impact of interest rate changes.
1.15 Financial assets
1.13 Principles of consolidation
The consolidated financial statements are those of the economic entity, comprising IBA and all the entities it controls from time to time during the year and at balance date. These include trusts, where IBA is a beneficiary, and where IBA controls the trustee. The financial statements of the controlled entities are prepared for the period 1 July 2016 to 30 June 2017 using accounting policies consistent with those of IBA. The effects of transactions and balances between the entities, including any unrealised profits or losses, have been eliminated in full.
• financial assets at fair value through profit � loss• � �� ������ ������ ��� �� �����• held-to-maturity investments• loans and receivables.
The classification depends on the nature and purpose of the financial assets and is determined at the time of initial recognition. Financial assets are recognised and derecognised upon trade date.
INDIGENOUS BUSINESS AUSTRALIA122

NOTES TO AND FORMING PART OF THE FINANCIAL STATEMENTS
Effective interest method
Financial assets at fair value through profit or lossFinancial assets are classified as 'financial assets at fair value through profit or loss' where they:
• are a part of an identified portfolio of financial instruments that IBA manages together and have a recent actual pattern of short-term profit taking
The effective interest method is a method of calculating the amortised cost of a financial asset and of allocating interest income over the relevant period. The effective interest rate is the rate that exactly discounts estimated future cash receipts through the expected life of the financial asset or, where appropriate, a shorter period.
Income is recognised on an effective interest rate basis except for financial assets which are recognised at fair value through profit or loss.
• have been acquired principally for the purpose of being sold in the near future
• are derivatives that are not designated and effective as hedging instruments• include loans that have an embedded derivative and the derivative cannot be separated from the main instrument.
1.15 Financial assets cont.
Assets in this category are classified as current assets.
'Financial assets at fair value through profit or loss' are stated at fair value, with any resulting gain or loss recognised through profit or loss. The net gain or loss recognised in the profit or loss does not incorporate any interest earned on the financial asset.
Available-for-sale financial assets
Available-for-sale financial assets' are non-derivatives that are either designated in this category or not classified in any of the other categories.
Available-for-sale financial assets' are recorded at fair value. Gains and losses arising from changes in fair value are recognised directly in the reserves (equity), with the exception of impairment losses. Interest is calculated using the effective interest method, and foreign exchange gains and losses on monetary assets are recognised directly in profit or loss. Where the asset is disposed of or is determined to be impaired, part of the cumulative gain or loss previously recognised in the reserve is included in ����surplus and deficit for the period.
Where a reliable fair value cannot be established for unlisted investments in equity instruments, these instruments are valued at cost.
Held-to-maturity investments
Non-derivative financial assets with fixed or determinable payments and fixed maturity dates, and which �#%�has the positive intent and ability to hold to maturity are classified as held-to-maturity investments. Held-to-maturity investments are recorded at amortised cost using the effective interest method less impairment, with revenue recognised on an effective yield basis.
Loans and receivables
Trade receivables, loans and other receivables that have fixed or determinable payments that are not quoted in an active market are classified as loans and receivables. Loans and receivables are measured at amortised cost using the effective interest method less impairment. Interest is recognised by applying the effective interest rate.
FINANCIAL PERFORMANCEPART 7:
ANNUAL REPORT 2016–17 123

NOTES TO AND FORMING PART OF THE FINANCIAL STATEMENTS
Categorisation of financial assetsIBA's financial assets have been categorised as follows:
Valuation of financial assets• Business and home loans are measured at 'fair value through profit � loss'. These loans, issued at lower than market rates,
are fair valued against market interest rates benchmarked on commercial bank rates. The quantum of interest rate differential determines the variance of the fair value from the face value of the loans. Business and home loan receivables�which are impaired / inactive are not carried at fair value. They are reclassified and carried at nominal value less�impairment allowance.
• Investments in subsidiaries, associates, joint ventures and other business undertakings are valued based on market inputs. This is done annually through a director's desktop valuation, supported by an external valuation once every three years.�The methodology adopted in relation to valuation by the directors of subsidiaries and associates uses techniques consistent with those of the most recent independent valuation. The fair value of subsidiary business is also used to test the value of assets within for impairment.
• When measuring fair value, IBA is required to maximise the use of observable inputs. IBA has used the Level 2 fair value hierarchy - Inputs other than quoted price that are observable either directly or indirectly.
Impairment of financial assets• Financial assets held at amortised cost: A loan is impaired when there is objective evidence that events occurring since the
loan was recognised have affected expected cash flows from the loan. Impairment is recognised as the difference between�the carrying value of the loan and the discounted value of the management's best estimate of future cash repayments and proceeds from any security held (discounted at the loan's original effective interest rate). This loss is recognised in the statement of comprehensive income.
• Available for sale financial assets: If there is objective evidence that an impairment loss on available-for-sale financial assets has been incurred, the amount of the difference between its cost, less principal repayments and amortisation, and�its current fair value, less any impairment loss previously recognised in expenses, is transferred from equity to the statement of comprehensive income.
• Financial assets held at cost: If there is objective evidence that an impairment loss has been incurred, the amount of the impairment loss is the difference between the carrying amount of the asset and the present value of the estimated future cash flows, discounted at the current market rate for similar assets.
• Cash and cash equivalents include notes and coins held, and any deposits in bank accounts with an original maturity of three months or less that are readily convertible to known amounts of cash and are subject to insignificant risk" �ash and cash equivalents are classified as loans and other receivables.
• Business and home loan receivables have been categorised as 'financial assets at fair value through profit ��loss'.• Investments in subsidiaries, associates, joint ventures and other business undertakings have been categorised as
'available-for-sale assets'.• Deposits with banks with an original maturity greater than three months have been categorised as 'held-to-maturity
investments'.• Trade receivables, other receivables and other financial assets have been categorised under 'loans and receivables'.
1.15 Financial assets cont.
INDIGENOUS BUSINESS AUSTRALIA124

NOTES TO AND FORMING PART OF THE FINANCIAL STATEMENTS1.16 Investments in associatesIBA's investment in associates and joint venture entities is accounted for as 'Available for Sale' financial instruments under AASB 139 ������������� ������������������������� ������" These assets are fair valued as at reporting date and distribution income received from them recognised as dividend.
1.17 Financial liabilitiesFinancial liabilities are classified as either 'financial liabilities at fair value through profit � loss', or other financial liabilities.
Financial liabilities are recognised and derecognised upon trade date.
Financial liabilities at fair value through profit or loss'Financial liabilities at fair value through profit or loss' are initially measured at fair value. Subsequent fair value adjustments are recognised in the profit or loss. The net gain or loss recognised in the profit or loss does not incorporate any interest paid on the financial liability. IBA currently has no financial liabilities classified under this category.
Other financial liabilitiesOther financial liabilities, including borrowings, are initially measured at fair value net of transaction costs. These liabilities are subsequently measured at amortised cost using the effective interest method, with interest expense recognised on an effective yield basis.
The effective interest method is a method of calculating the amortised cost of a financial liability and allocating interest expense over the relevant period. The effective interest rate is the rate that exactly discounts estimated future cash payments through the expected life of the financial liability or, where appropriate, a shorter period.
Supplier and other payables are recognised at amortised cost. Liabilities are recognised to the extent that the goods and services have been received, regardless of whether they have been invoiced.
IBA classifies all its financial liabilities under this category.
Interest bearing loans and borrowings
Loans are classified under other financial liabilities and the carrying value is calculated based on the balance yet to be repaid. Interest is expensed as it accrues.
1.18 Contingent liabilities and contingent assetsContingent liabilities and contingent assets are not recognised in the statement of financial position but are reported in the relevant schedules and notes. They may arise from uncertainty as to the existence of a liability or asset or may represent an asset or liability in respect of which the amount cannot be reliably measured. Contingent assets are disclosed when settlement is probable but not virtually certain; contingent liabilities are disclosed when the likelihood of settlement is better than remote.
1.19 Financial guarantee contracts
Financial guarantee contracts are accounted for in accordance with AASB 139 Financial Instruments: Recognition and Measurement. They are not treated as a contingent liability, as they are regarded as financial instruments outside the scope of AASB 137 Provisions, Contingent Liabilities and Contingent Assets.
FINANCIAL PERFORMANCEPART 7:
ANNUAL REPORT 2016–17 125

Buildings, excluding leasehold improvements Market selling priceLeasehold improvements Depreciated replacement costProperty, plant and equipment Market selling price
NOTES TO AND FORMING PART OF THE FINANCIAL STATEMENTS1.20 Acquisition of assetsAssets are recorded at cost on acquisition except as stated below. The cost of acquisition includes the fair value of assets transferred in exchange, and liabilities undertaken. Financial assets are initially measured at their fair value plus transaction costs where appropriate.
Assets acquired at no cost or for nominal consideration are initially recognised as assets and revenue at their fair value at the date of acquisition, unless acquired as a consequence of restructuring of administrative arrangements. In the latter case, assets are initially recognised as contributions by owners at the amounts at which they were recognised in the transferor's accounts immediately prior to the restructuring.
1.21 Land and building, property, plant and equipment Asset recognition threshold
Purchases of property, plant and equipment are recognised initially at cost in the statement of financial position, except for purchases costing less than $1,000, which are expensed in the year of acquisition (other than where they form part of a group of similar items which are significant in total).
Make good
The initial cost of an asset includes an estimate of the cost of dismantling and removing the item and restoring the site on which it is located. This is particularly relevant to make good provisions in property leases taken up by IBA where there exists an obligation to restore the property to original condition. These costs are included in the value of IBA's leasehold improvements with a corresponding provision for make good recognised.
Revaluations
Following initial recognition at cost, property, plant and equipment are carried at fair value less accumulated depreciation and accumulated impairment losses. Valuations are conducted with sufficient frequency to ensure that the carrying amounts of assets do not differ materially from the assets’ fair values as at the reporting date. The regularity of independent valuations depends on the volatility of movements in market values for the relevant assets.
ValuationsFair value less cost to sell for each class of asset �� tested for impairment as follows:
Asset class Fair value measured at:Land Market selling price
Heritage and cultural Market selling price
Following initial recognition at cost, assets are carried at fair value less accumulated depreciation and accumulated impairment losses. Valuations are conducted with sufficient frequency to ensure that the carrying amounts of assets do not differ materially from the assets' fair values as at the reporting date. Revaluation adjustments are based on an asset class basis. Any revaluation increment is credited to equity under the heading of asset revaluation reserve except to the extent that it reverses a previous revaluation decrement of the same asset class that was previously recognised through Statement of Comprehensive Income. Revaluation decrements for a class of assets are recognised directly through Statement of Comprehensive Income except to the extent that they reverse a previous revaluation increment for that class.
When measuring fair value, IBA is required to maximise the use of observable inputs. IBA has used the Level 2 fair value hierarchy - Inputs other than quoted price that are observable either directly or indirectly. IBA has used a marketbased valuation technique incorporating recently observed market data for similar properties and future earnings discounted at market capitalised rates.
Any accumulated depreciation as at the revaluation date is eliminated against the gross carrying amount of the asset and the asset is restated to the revalued amount.
INDIGENOUS BUSINESS AUSTRALIA126

Asset class 2017 2016Leasehold improvements Lease term Lease termPlant and equipment 3 to 5 years 3 to 5 years
NOTES TO AND FORMING PART OF THE FINANCIAL STATEMENTS1.21 Land and building, property, plant and equipment cont.DepreciationDepreciable property, plant and equipment assets are written off to their estimated residual values over their estimated useful lives to IBA using the straight-line method of depreciation in all cases. Depreciation rates (useful lives), residual values and methods are reviewed at each reporting date and necessary adjustments are recognised in the current or current and future reporting periods, as appropriate.
Depreciation rates applying to each class of depreciable asset are based on the following useful lives:
ImpairmentAll assets were assessed for impairment at 30 June 2017. Where indications of impairment exist, the asset’s recoverable amount is estimated and an impairment adjustment made if the asset’s recoverable amount is less than its carrying amount.
The recoverable amount of an asset is the higher of its fair value less costs to sell and its value in use. Value in use is the present value of the future cash flows expected to be derived from the asset. Where the future economic benefit of an asset is not primarily dependent on the asset’s ability to generate future cash flows, and the asset would be replaced if IBA was deprived of the asset, its value in use is taken to be its depreciated replacement cost.
Derecognition
An item of property, plant and equipment is derecognised upon disposal or when no further future economic benefits are expected from its use or disposal.
Heritage and cultural assetsIBA has a collection of heritage and cultural assets, comprising sculptures, paintings and drawings. IBA have classified these assets as heritage and cultural assets as they are primarily used for purposes that relate to their cultural significance.
Purchases of heritage and cultural assets, are recognised initially at cost in the Statement of Financial Position, except for purchases less than $5,000, for each item, which are expensed in the year of acquisition. Following initial recognition at cost, heritage and cultural assets� �� carried at fair value less any accumulated impairment losses. Valuations are conducted with sufficient frequency to ensure that the carrying amounts do not differ materially from assets' fair values as at the reporting date. The regularity of independent valuations depends upon the volatility of movements in market values.
Given the nature of heritage and cultural assets, they have been deemed not to have limited useful lives, and therefore are not subject to depreciation. However they are subject to impairment testing when there is an indication of impairment. All heritage and cultural assets are assessed for impairment on an annual basis. Where indications of impairment exist, the recoverable amount is estimated and an impairment adjustment made if the asset's recoverable amount is less than its carrying amount.
1.22 Investment properties
Investment properties are measured initially at cost, including transaction costs. Subsequent to initial recognition, investment properties are stated at fair value, which is based on active market prices, adjusted if necessary for any difference in the nature, location or condition of the specific asset at the balance sheet date. Gains or losses arising from changes in the fair values of investment properties are recognised in profit or loss in the year in which they arise.
When measuring fair value, IBA is required to maximise the use of observable inputs. IBA has used the Level 2 fair value hierarchy - Inputs other than quoted price that are observable either directly or indirectly. IBA has used a marketbased valuation technique incorporating recently observed market data for similar properties and future earnings discounted at market capitalisation rates.
Investment properties are tested for impairment based on market selling price.
Where an investment property is acquired at no cost or for nominal cost, its cost is deemed to be its fair value as at the date of acquisition.
Investment properties are derecognised either when they have been disposed of or when the investment property is permanently withdrawn from use and no future economic benefit is expected from its disposal. Any gain or loss on disposal of an investment property is recognised in profit or loss in the year of disposal.
1.23 IntangiblesIBA's intangibles comprise internally developed software for internal use and goodwill. These assets are carried at cost less accumulated amortisation and accumulated impairment losses.
Software is amortised on a straight-line basis over its anticipated useful life. The useful life of IBA’s software is three years.
All software assets and goodwill were assessed for indications of impairment as at 30 June 2017.
FINANCIAL PERFORMANCEPART 7:
ANNUAL REPORT 2016–17 127

NOTES TO AND FORMING PART OF THE FINANCIAL STATEMENTS
Inventories held for sale are valued at the lower of cost and net realisable value.Inventories held for distribution are valued at cost, adjusted for any loss of service potential.
• Finished goods and work in progress: cost of direct materials and labour plus attributable costs that are capable of beingallocated on a reasonable basis.
Revenues, expenses, and assets and liabilities are recognised net of GST except:
Competitive neutralityIBA does not have any competitive neutrality obligations.
1.26 Events After the Reporting PeriodThere are no potential significant events that will affect the ongoing structure and financial activities of IBA after 30 June 2017.
1.24 Inventories
Costs incurred in bringing each item of inventory to its present location and condition are assigned as follows:• Raw materials and stores: purchase cost on a first-in, first-out basis
Current income tax charged to statement of comprehensive income is the tax payable on taxable income. Current tax liabilities (assets) are measured at the amounts expected to be paid to (recovered from) the relevant authority.
Deferred tax is accounted for using the balance sheet liability method in respect of temporary differences arising between the tax bases of assets and liabilities, and their carrying amounts in the financial statements. No deferred income tax will be recognised from the initial recognition of an asset or liability, excluding a business combination, where there is no effect on accounting or taxable profit or loss.
Deferred tax is calculated at the tax rates that are expected to apply to the period when the asset is realised or liability is settled. Deferred tax is credited to the income statement except where it relates to items that may be credited directly to equity, in which case the deferred tax is adjusted directly against equity.
Deferred income tax assets are recognised to the extent that it is probable that future tax profits will be available, against which deductible temporary differences can be utilised.
The amount of benefits brought to account or that may be realised in the future is based on the assumption that no adverse change will occur in income taxation legislation, and the anticipation that the economic entity will derive sufficient future assessable income to enable the benefit to be realised and to comply with the conditions of deductibility imposed by the law.
Inventories acquired at no cost or for a nominal consideration are initially measured at current replacement cost at the date of acquisition.
1.25 Taxation IBA is exempt from all forms of taxation except fringe benefits tax (FBT) and the goods and services tax (GST).
• where the amount of GST incurred is not recoverable from the Australian Taxation Office (ATO)• for receivables and payables.
However, the exemption does not apply to controlled entities and therefore incorporated controlled entities are subject to taxation. For these entities, the economic entity adopts the liability method of tax-effect accounting, whereby the income tax expense is based on the profit from ordinary activities adjusted for any permanent differences.
INDIGENOUS BUSINESS AUSTRALIA128

NOTES TO AND FORMING PART OF THE FINANCIAL STATEMENTS
Note 2: Expenses
2017 2016$'000 $'000
Note 2A: Employee benefitsWages and salaries 40,960 42,626 Superannuation:
Defined contribution plans 4,112 4,358 Defined benefit plans 816 1,180
Leave entitlements 1,910 2,697 Other entitlements 2,399 3,751 Total employee benefits 50,197 54,612
Note 2B: Supplier expensesCost of goods sold 46,270 48,083 Consultants 4,917 5,882 Investment property management expenses 8,240 8,868 IT expenses 3,928 3,951 Legal expenses 1,906 1,689 Office related expenses 3,265 5,342 Travel expenses 3,106 2,550 Other suppliers 7,481 8,270 Total goods and services - supplied or rendered 79,113 84,635
Goods supplied in connection with:Related parties - -External parties 29,138 33,201
Total goods supplied 29,138 33,201 Services rendered in connection with:
Related parties 2,474 2,007 External parties 47,501 49,427
Total services rendered 49,975 51,434 Total goods and services - supplied or rendered 79,113 84,635
Other supplier expensesOperating lease rentals - related entities 252 402 Operating lease rentals - external entities 2,683 3,218 Workers compensation expenses 581 568
Total other supplier expenses 3,516 4,188 Total supplier expenses 82,629 88,823
Note 2C: Depreciation and amortisationDepreciation
Property, plant and equipment 5,247 3,583 Land and buildings 315 656
Total depreciation 5,562 4,239
AmortisationIntangibles 645 1,033
Total amortisation 645 1,033 Total depreciation and amortisation 6,207 5,272
Note 2D: Write-down and impairment of assetsAsset write-down and impairments from
Write-down on non-financial assets 4,822 15,356 Impairment on loans 5,640 5,844 Valuation decrements on financial instruments 15,857 27,446 Other 282 3,333
Total write-down and impairment of assets 26,601 51,979
Consolidated
FINANCIAL PERFORMANCEPART 7:
ANNUAL REPORT 2016–17 129

NOTES TO AND FORMING PART OF THE FINANCIAL STATEMENTS
Note 3: Income
2017 2016$’000 $’000
Own-source revenue
Note 3A: Sale of goods and rendering of servicesSale of goods in connection with:
Related entities - -External parties 85,366 94,387
Total sale of goods 85,366 94,387 Rendering of services in connection with:
Related entitiesExternal parties 2,01�
Total rendering of services 2,016
- �634��������&�833�2,467
Total sale of goods and rendering of services 87,382 96,854
Note 3B: InterestLoans 46,206 47,011 Deposits 5,262 5,266
Total interest 51,468 52,277
Note 3C: Rental income
Operating leaseInvestment properties 13,162 14,588 Other 3,408 2,430
Total rental income 16,570 17,018
Note 3D: Other �ncomeGrant Income 16,395 -Other 2,526 2,379 Total other income 18,921 2,379
Note 3E: Other gainsChange in fair value of non-financial assets 4,170 14,127 Change in fair value of financial assets 10,096 342 Total other gains 14,266 14,469
Note 3F: Revenue from Government
Corporate Commonwealth Entity payment item 14,037 34,258 Total revenue from Government 14,037 34,258
Consolidated
Department of Prime Minister and Cabinet
Note 4: Other Comprehensive Income
2017 2016$’000 $’000
Reclassification Adjustments
Nitmiluk (Cicada Lodge) - 3,320 - 3,320
Consolidated
The following amounts previously recognised in other comprehensive income have been reclassified to profit or loss.
Total reclassification adjustments of other comprehensive income
Note: There were no associate entities divested during 2016-17.
INDIGENOUS BUSINESS AUSTRALIA130

Note 5: Fair Value Measurements
Fair value measurements at the end of the reporting period by hierarchy for assets and liabilities for 2017
2017 2016 Category Valuation Inputs $’000 $’000 Level Technique(s) Used
Financial assets
Designated at fair value through profit �� loss
Loan receivables - Home 679,277 675,820 Level 2
Loan receivables - Business 30,192 33,991 Level 2
Bonds and fund investments 147,928 74,250 Level 1
Available for sale
Associates 18,723 23,654 Level 2
Total financial assets 876,120 807,715 Non-financial assets
Land & Buildings 26,708 29,311 Level 2
Investment Property 99,856 151,069 Level 2
Property, Plant & Equipment 21,130 21,071 Level 2
Total non-financial assets 147,694 201,451
Note 5B: Level 1 and Level 2 Transfers for Recurring Fair Value Measurements
Note 5C: Reconciliation for Recurring Level 3 Fair Value Measurements
NOTES TO AND FORMING PART OF THE FINANCIAL STATEMENTS
Fair value measurements at the end of the reporting period
Cashflows discounted at the risk adjusted market rate of interest
Yield curve, Loan to Value ratio, expected life and benchmark rates
Cashflows discounted at the risk adjusted market rate of interest
Yield curve, Loan to Value ratio, expected life and benchmark rates
There are no Recurring Level 3 assets measured at fair value during the reporting period.
Fund quoted market values Fund quoted market values
Future earnings discounted at risk adjusted market rates
Earnings forecast, rates of return on capital
Market approach using recently observed market data for similar properties and discounted earnings method
Market sales data, future earnings and market capitalisation rate
Market approach using recently observed market data for similar properties and discounted earnings method
Market sales data, future earnings and market capitalisation rate
Market approach using recently observed market data for similar properties and discounted earnings method
Market sales data, future earnings and market capitalisation rate
There are no transfers between Level 1 and Level 2 for assets measured at fair value on a recurring basis during the reporting period.
Note 5A: Fair Value Measurements, Valuation Techniques and Inputs Used
FINANCIAL PERFORMANCEPART 7:
ANNUAL REPORT 2016–17 131

NOTES TO AND FORMING PART OF THE FINANCIAL STATEMENTS
Note 6: Financial Assets
2017 2016$’000 $’000
Note 6A: Cash and cash equivalentsCash on hand or on deposit 206,788 136,267
70,970 25,542277,758 161,809
Note 6B: Trade, loans and other receivablesGoods and services receivables in connection with
Related entities* 3,541 28External entities 9,582 17,090
Total receivables for goods and services 13,123 17,118
Reconciliations of movements of loans receivableLoans - Home Ownership Program
At fair value - opening balance as at 1 July 675,820 634,922Add: net loans movement at cost 16,358 68,000Less: net movement on remeasurement at fair value through profit or loss (7,689) (22,884)Less: impairment movement through profit and loss (5,212) (4,218)
At fair value - closing balance as at 30 June 679,277 675,820
Loans - Business Development and Assistance ProgramAt fair value - opening balance as at 1 July 33,991 38,286Add: net loans movement at cost (4,426) (1,904)
1,055 (778)
Less: impairment movement through profit and loss (428) (1,613)At fair value - closing balance as at 30 June 30,192 33,991 Total home and business loans 709,469 709,811
Other receivablesOther 315 346
Total other receivables 315 346
Total trade, loans and other receivables 722,907 727,275
Trade and other receivables (net) expected to be recoveredNo more than 12 months 50,290 48,612More than 12 months 672,617 678,663
Total trade, loans and other receivables (net) 722,907 727,275
Consolidated
Cash on hand or on deposit - New Housing Fund
* This includes a $3.435 million Corporate Commonwealth Entity receivable from the Department of Prime Minister and Cabinet (2016: nil).
Add/(Less): net movement on remeasurement at fair value through profit or loss
INDIGENOUS BUSINESS AUSTRALIA132
NOTES TO AND FORMING PART OF THE FINANCIAL STATEMENTS
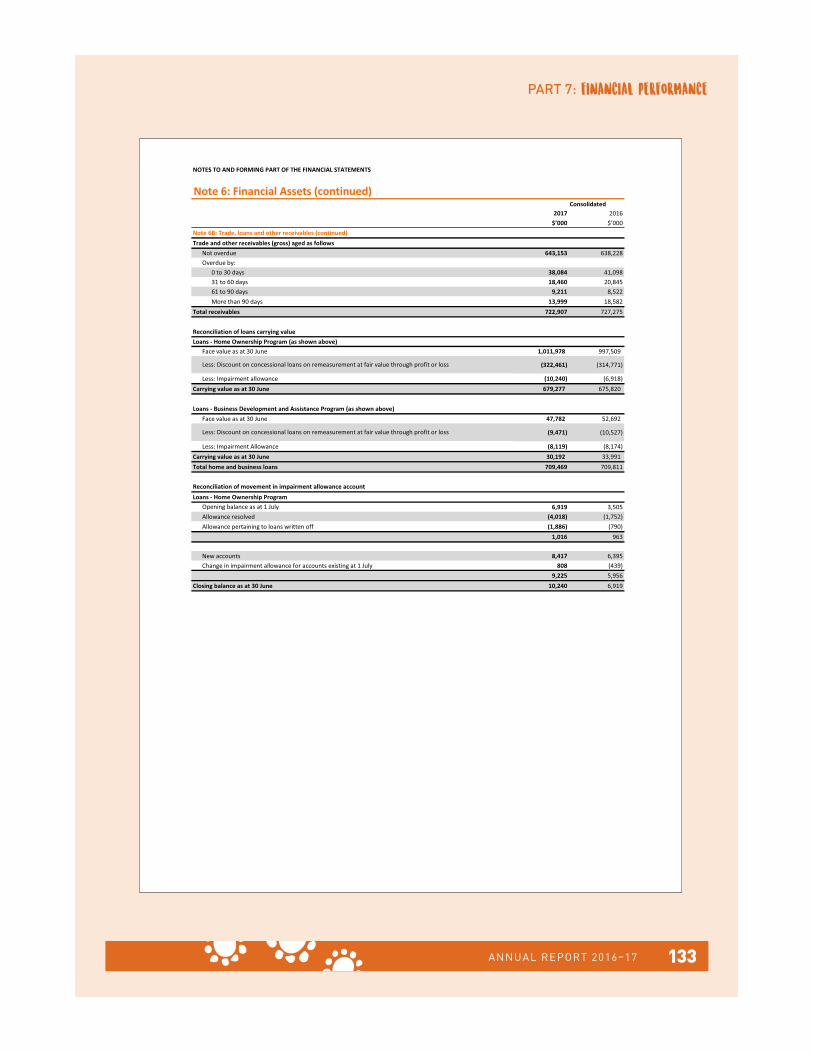
Note 6: Financial Assets (continued)
2017 2016$’000 $’000
Note 6B: Trade, loans and other receivables (continued)Trade and other receivables (gross) aged as follows
Not overdue 643,153 638,228Overdue by:
0 to 30 days 38,084 41,09831 to 60 days 18,460 20,84561 to 90 days 9,211 8,522More than 90 days 13,999 18,582
Total receivables 722,907 727,275
Reconciliation of loans carrying valueLoans - Home Ownership Program (as shown above)
Face value as at 30 June 1,011,978 997,509
(322,461) (314,771)
Less: Impairment allowance (10,240) (6,918)Carrying value as at 30 June 679,277 675,820
Loans - Business Development and Assistance Program (as shown above)Face value as at 30 June 47,782 52,692
(9,471) (10,527)
Less: Impairment Allowance (8,119) (8,174)Carrying value as at 30 June 30,192 33,991 Total home and business loans 709,469 709,811
Loans - Home Ownership Program6,919 3,505
Allowance resolved (4,018) (1,752)Allowance pertaining to loans written off (1,886) (790)
1,016 963
New accounts 8,417 6,395Change in impairment allowance for accounts existing at 1 July 808 (439)
9,225 5,956Closing balance as at 30 June 10,240 6,919
Less: Discount on concessional loans on remeasurement at fair value through profit or loss
Consolidated
Less: Discount on concessional loans on remeasurement at fair value through profit or loss
Reconciliation of movement in impairment allowance account
Opening balance as at 1 July
FINANCIAL PERFORMANCEPART 7:
ANNUAL REPORT 2016–17 133

NOTES TO AND FORMING PART OF THE FINANCIAL STATEMENTS
Note 6: Financial Assets (continued)
2017 2016
$’000 $’000
Note 6B: Trade, loans and other receivables (continued)Loans - Business Development and Assistance Program
8,174 11,741Allowance resolved (785) (1,570)Allowance pertaining to loans written off (318) (4,370)
7,071 5,801
New allowances 850 3,137Change in impairment allowance for accounts existing at 1 July 198 (764)Closing balance as at 30 June 8,119 8,174Total impairment allowance account 18,359 15,093
The impairment allowances are aged as followsNot overdue - -Overdue by:
0 to 30 days 2,825 3,72031 to 60 days 1,036 30261 to 90 days 418 718More than 90 days 14,080 10,353
Total impairment allowance account 18,358 15,093
Note 6C: Investments in associatesInvestments in associates 18,723 23,653 Total investments in associates 18,723 23,653 Investments in associates that are expected to be recovered in:
More than 12 months 18,723 23,653 Total investments in associates 18,723 23,653
Summarised financial information of associatesBalance sheet
Assets 71,458 68,036 Liabilities (31,393) (42,524)
Net assets 40,065 25,512
Statement of comprehensive incomeRevenue 27,746 72,732 Expenses (25,198) (66,572)
Net surplus 2,547 6,160
Consolidated
Opening balance as at 1 July
INDIGENOUS BUSINESS AUSTRALIA134

NOTES TO AND FORMING PART OF THE FINANCIAL STATEMENTS
Note 6: Financial Assets (continued)Note 6D: Interests in associatesTable A: Interests in associatesInterests are held in the following associated companies
Associated company Principal activities
2017 2016 2017 2016 2017 2016% % % % $'000 $'000
Carpentaria Shipping Services Pty Ltd
Transportation 18 18 25 25 810 1,140
Fitzroy River Lodge Partnership
Accommodation provider 26 26 25 25 2,100 1,850
Message Stick Communications Pty Ltd
Communication service provider
31 31 31 31 4,404 7,292
Ngarda Civil & Mining Pty LtdCivil engineering & mining services
25 25 25 25 1,219 2,161
Noongar Property Trust Property 37 37 7 7 8,510 9,250
Port Hedland Investment Trust
Property 70 70 50 50 1,680 1,960
18,723 23,653
2017 2016$’000 $’000
Note 6D: Interests in associates (continued)Movements during the year in associated companies
Opening balance as at 1 July 23,653 28,333 Add:
Additional investments during the year - - Less:
Disposals and redemptions during the year (2,406) (2,519)Fair value decrement (2,524) (2,161)
Closing balance as at 30 June 18,723 23,653
Note 6E: Other investmentsDeposits 47,110 82,369 Other - bonds and interest in business undertakings 153,803 82,199 Total other investments 200,913 164,568 Investments expected to be recovered in:
No more than 12 months 200,913 164,568 More than 12 months - -
Total other investments 200,913 164,568
Total Investments 219,636 188,221
Note 6F: Deferred tax assetsDeferred tax assets 646 822 Total deferred tax assets 646 822 All deferred tax assets are non-current assets.
Consolidated
Ownership interest Carrying amount of investment�������� �
FINANCIAL PERFORMANCEPART 7:
ANNUAL REPORT 2016–17 135

NOTES TO AND FORMING PART OF THE FINANCIAL STATEMENTS
Note 7: Non-Financial AssetsNote 7A: Reconciliation of the opening and closing balances of property, plant and equipment (PP&E) and Intangibles
Land & buildings
Other PP & E
Computer software
Other intangibles Total
Land & buildings
Other PP & E
Computer software
Other intangibles Total
$’000 $’000 $’000 $’000 $’000 $’000 $’000 $’000 $’000 $’000
Opening balanceGross book value 32,372 29,335 3,937 6,880 72,524 50,416 18,943 3,732 7,148 80,239
Accumulated depreciation and impairment
(3,061) (8,264) (3,164) (363) (14,852) (5,739) (5,047) (2,296) (82) (13,164)
Total as at 1 July 29,311 21,071 773 6,517 57,672 44,677 13,896 1,436 7,066 67,075 Additions:
By purchase 839 10,154 303 112 11,408 1,614 13,979 242 85 15,920
Reversal of impairments recognised in net cost of services - cost
75 4,132 - - 4,207 - - - - -
Reversal of impairments recognised in net cost of services - accumulated depreciation
(46) (2,885) - - (2,931) - - - - -
Impairment recognised in the operating result - cost
(3,850) (3,481) - (815) (8,146) (4,226) (1,410) (37) (808) (6,481)
Impairment recognised in the operating result - accumulated depreciation
407 722 - - 1,129 49 (397) 32 2 (314)
Reclassification - at cost - - - - - (3,077) 332 - - (2,745)
Reclassification - accumulated depreciation
- - - - - 3,134 - - - 3,134
Depreciation expense (705) (4,825) (545) (132) (6,207) (656) (3,583) (900) (133) (5,272)Other movements:
Opening balance adjustment - cost
2,277 (2) 446 (446) 2,275 (506) 14 - 455 (37)
Opening balance adjustment - accumulated depreciation
- - - - - 151 (1) - (150) -
Disposals:Other disposals - cost (2,035) (4,938) - (25) (6,998) (11,849) (2,523) - - (14,372)
Other disposals - accumulated depreciation
435 1,182 - - 1,617 - 764 - - 764
Total as at 30 June 26,708 21,130 977 5,211 54,026 29,311 21,071 773 6,517 57,672 Net book value as at 30 June represented by:
Gross book value 29,678 35,200 4,686 5,706 75,270 32,372 29,335 3,937 6,880 72,524
Accumulated depreciation and impairment
(2,970) (14,070) (3,709) (495) (21,244) (3,061) (8,264) (3,164) (363) (14,852)
Total as at 30 June 26,708 21,130 977 5,211 54,026 29,311 21,071 773 6,517 57,672
Consolidated2017 2016
INDIGENOUS BUSINESS AUSTRALIA136

NOTES TO AND FORMING PART OF THE FINANCIAL STATEMENTS
Note 7: Non-Financial Assets (continued)
2017 2016$’000 $’000
Note 7B: Investment propertyOpening balance as at 1 July
Gross book value 151,069 133,512 Opening balance adjustments 93 (6)Disposals (61,917) (3,525)Additions: - -
By acquisition 13,392 14,532 Net gain/(loss) from fair value adjustments (2,781) 6,945 Reclassification - (389)
Total as at 30 June 99,856 151,069
Investment propert��� owned by IBA subsidiaries were revalued during the year in accordance with the revaluation policy stated in Note 1.22. The revaluation resulted in a decrease in value of $1.925 million (2016: Decrement of $4.808 million) for three properties and an increase in value of $4.706 million (2016: Increment of $11.753 million) for two properties �� included in the Statement of Comprehensive Income.
. Consolidated
FINANCIAL PERFORMANCEPART 7:
ANNUAL REPORT 2016–17 137

NOTES TO AND FORMING PART OF THE FINANCIAL STATEMENTS
Note 8: Payables
2017 2016$’000 $’000
Note 8A: SuppliersTrade creditors 13,329 11,520 Total suppliers 13,329 11,520 Supplier payables expected to be settled within 12 months:Suppliers in connection with: Related entities 119 356 External parties 13,210 11,164 Total suppliers 13,329 11,520
Note 8B: Other payablesSalaries and wages 1,202 1,655 Superannuation 112 138 Separations and redundancies - 529Unearned income 9,677 3,702GST payable to ATO 526 291Total other payables 11,517 6,315 Total other payables expected to be settled in:
No more than 12 months 11,517 6,315 Total other payables 11,517 6,315
Consolidated
Settlement is usually made within 30 days.
Note 9: Interest Bearing Liabilities
2017 2016$’000 $’000
Note 9: LoansSecured loan facility 11,500 22,985 Total loans 11,500 22,985 Maturity schedule for loans payable:
Less than one year - 11,485In one to five years 11,500 11,500
Total loans 11,500 22,985
Consolidated
As at 30 June 2017, $11.5 million (30 June 2016: $11.5 million) relates to amounts borrowed against security of land and buildings.
INDIGENOUS BUSINESS AUSTRALIA138

NOTES TO AND FORMING PART OF THE FINANCIAL STATEMENTS
Note 10: Provisions
2017 2016$’000 $’000
Note 10A: Employee provisionsLeave 5,628 6,885 Total employee provisions 5,628 6,885 Employee provisions expected to be settled in:
No more than 12 months 3,731 4,617 More than 12 months 1,897 2,268
Total employee provisions 5,628 6,885
ConsolidatedNote 10B: Other provisions 2017 2016
Restorationobligations
Distribution/other provisions
Total Restorationobligations
Distribution/other provisions
Total
$’000 $’000 $’000 $’000 $’000 $’000
Opening balance as at 1 July 628 2,442 3,070 586 2,027 2,613
Additional provisions made (214) (739) (953) 42 415 457
Amounts used �
Total as at 30 June 414 1,703 2,117 628 2,442 3,070
Consolidated
The classification of current employee provisions includes amounts for which there is not an unconditional right to defer settlement by one year, so in the case of employee provisions the above classification does not represent the amount expected to be settled within one year of the reporting date.
IBA currently has nine agreements for leasing premises with provisions requiring restoration of the premises to their original condition at the conclusion of the lease. IBA has made a provision of $414,499 to reflect the present value of this obligation.
� � � � �
FINANCIAL PERFORMANCEPART 7:
ANNUAL REPORT 2016–17 139

NOTES TO AND FORMING PART OF THE FINANCIAL STATEMENTS
Note 11: Cash Flow Reconciliation
2017 2016$’000 $’000
Reported cash and cash equivalents as perCash Flow Statement 277,758 161,809 Statement of Financial Position 277,758 161,809
Discrepancy - -
Net cost of services 24,547 (15,452)Add: revenue from Government 10,602 34,258 Less: income tax expense (144) (285)
Adjustments for non-cash itemsDepreciation and amortisation 6,207 5,272 Net write down of assets 12,335 38,322 Net loss on disposal of assets (5,033) (2,887)
Changes in assets/liabilities(Increase)/decrease in net receivables 6,718 (9,449)(Increase)/decrease in inventories 2,021 (7)(Increase)/decrease in GST payable 240 756 Increase/(decrease) in employee provisions (1,257) (396)Increase/(decrease) in supplier payables 6,366 (839)Increase/(decrease) in other provisions (953) 457 Increase/(decrease) in tax liabilities (62) 59
Net cash from operating activities 61,587 49,809
Consolidated
Reconciliation of cash and cash equivalents as per financial position to Cash Flow Statement
Reconciliation of net cost of services to net cash from operating activities
INDIGENOUS BUSINESS AUSTRALIA140
NOTES TO AND FORMING PART OF THE FINANCIAL STATEMENTS
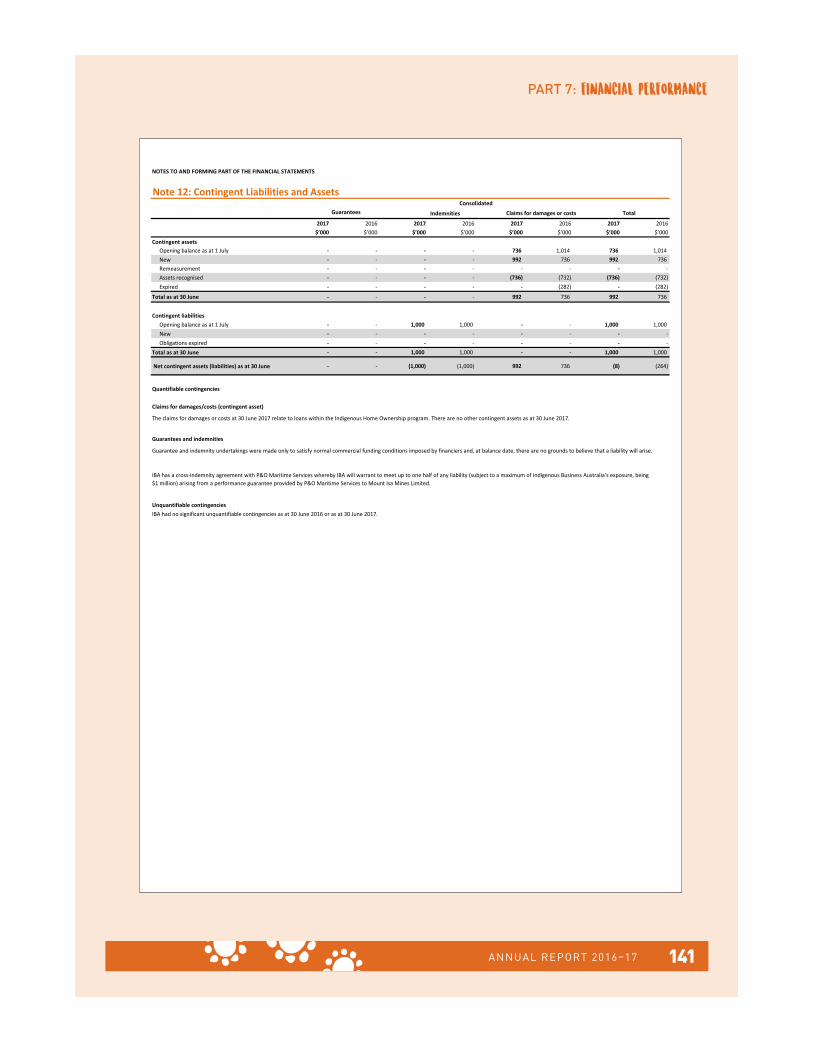
Note 12: Contingent Liabilities and Assets
2017 2016 2017 2016 2017 2016 2017 2016$’000 $’000 $’000 $’000 $’000 $’000 $’000 $’000
Contingent assetsOpening balance as at 1 July - - - - 736 1,014 736 1,014 New - - - - 992 736 992 736 Remeasurement - - - - - - - -Assets recognised - - - - (736) (732) (736) (732)Expired - - - - - (282) - (282)
Total as at 30 June - - - - 992 736 992 736
Contingent liabilitiesOpening balance as at 1 July - - 1,000 1,000 - - 1,000 1,000 New - - - - - - - -Obligations expired - - - - - - - -
Total as at 30 June - - 1,000 1,000 - - 1,000 1,000
Net contingent assets (liabilities) as at 30 June - - (1,000) (1,000) 992 736 (8) (264)
Consolidated
Quantifiable contingencies
Claims for damages/costs (contingent asset)
The claims for damages or costs at 30 June 2017 relate to loans within the Indigenous Home Ownership program. There are no other contingent assets as at 30 June 2017.
Guarantees and indemnities
Guarantee and indemnity undertakings were made only to satisfy normal commercial funding conditions imposed by financiers and, at balance date, there are no grounds to believe that a liability will arise.
IBA has �crossindemnity agreement with P&O Maritime Services whereby IBA will warrant to meet up to one half of any liability (subject to a maximum of Indigenous Business Australia’s exposure, being $1 million) arising from a performance guarantee provided by P&O Maritime Services to Mount Isa Mines Limited.
Unquantifiable �ontingenciesIBA ha� no significant unquantifiable contingencies as at 30 June 2016 or� �� ��=>�?��� 2017.
�!"�"�� # ��* +���� # �;"�+#<��*"+" #����#�# ���";
FINANCIAL PERFORMANCEPART 7:
ANNUAL REPORT 2016–17 141
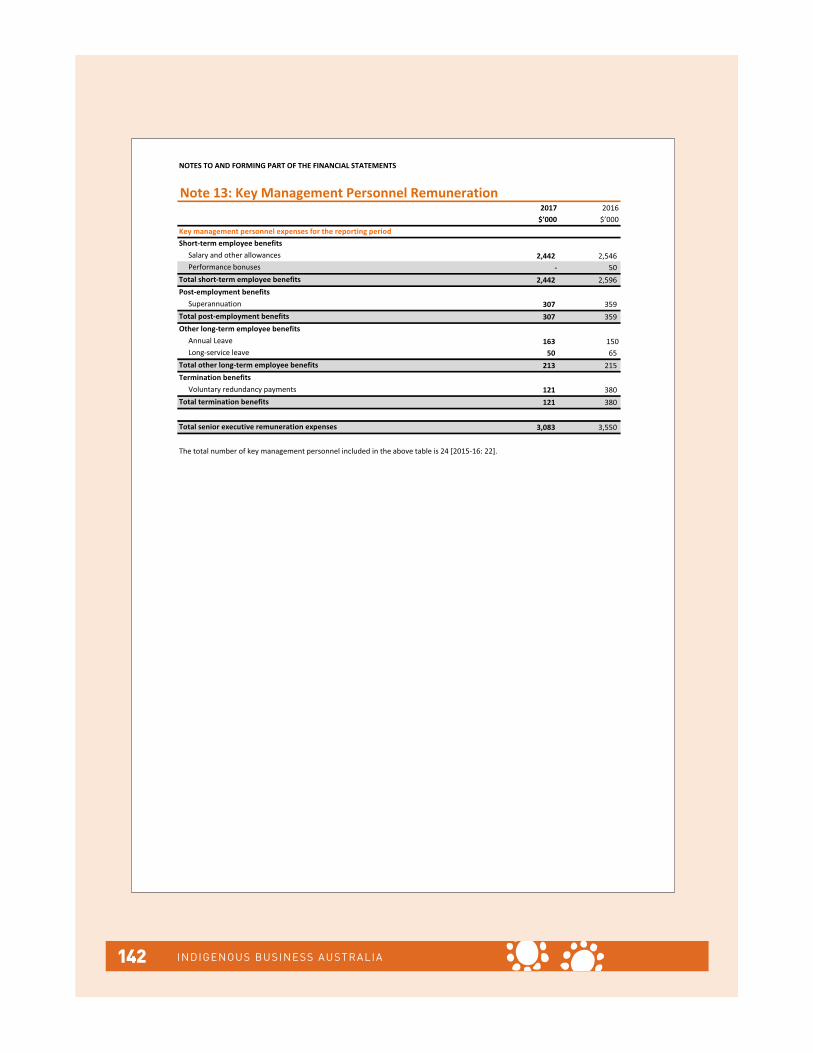
NOTES TO AND FORMING PART OF THE FINANCIAL STATEMENTS
Note 13: Key Management Personnel Remuneration2017 2016
$’000 $’000
Short-term employee benefitsSalary and other allowances 2,442 2,546 Performance bonuses - 50
Total short-term employee benefits 2,442 2,596 Post-employment benefits
Superannuation 307 359 Total post-employment benefits 307 359 Other long-term employee benefits
Annual Leave 163 150Long-service leave 50 65
Total other long-term employee benefits 213 215 Termination benefits
Voluntary redundancy payments 121 380 Total termination benefits 121 380
Total senior executive remuneration expenses 3,083 3,550
The total number of key management personnel included in the above table �� 24 [2015-16: 22]"
Key management personnel expenses for the reporting period
INDIGENOUS BUSINESS AUSTRALIA142

NOTES TO AND FORMING PART OF THE FINANCIAL STATEMENTS
Note 14: Related Party DisclosureRelated Party Relationships
Related Party Transactions with Key Management PersonnelLoans to directors and director-related entities
2017 2016$’000 $’000
- 1,072 - 949
Loan repayments during the year - 210
- 69
Loans were made to the following director-related entities in 2017:- nil
Other transactions with directors or director-related entities
- nil
Related Party Transactions with Government Related Entities
2017 2016Entity $’000 $’000
National Disability Insurance Agency 755 -
Indigenous Land Corporation
62 - - -
Indigenous Land Corporation
131 - 86 -
Indigenous Land Corporation
76 - 49 12
Payments received from ILC
IBA is an Australian Government Controlled Entity. Related parties to this entity are Directors, Key Management Personnel� including the Executive and other Australian Government entities. IBA transacts with other Australian Government controlled entities consistent with normal day to day business operations provided under normal terms and conditions, including the payment of workers compensation, insurance premiums, and legal services.
A number of Directors of IBA hold or have held positions in other companies or governmentrelated entities (personally related entities) where it is considered they control or significantly influence the financial or operational policies of those entities. There were no transactions with those entities and no amounts were owed to IBA to personally related entities at 30 June 2017.
IBA Directors Mr Edward Fry and Mr Anthony Ashby are also Directors of Indigenous Land Corporation (ILC). Transactions with ILC are disclosed in detail below.
Loans to director-related entities outstanding at year-endLoans to director-related entities during the year
Interest revenue included in operating result from loans to directors and director-related entities
Business Support consulting advice was provided to the following director. The value of the services provided was:
Nature of the transactionIBA received a compensation payment from the National Disability Insurance Agency relating to a sublease arrangement between the two entities.
The ILC has engaged IBA to coordinate a baseline review which was fully completed during the reporting period.
Payments made to ILC
Payments made to ILCSubleasing arrangements between IBA and ILC commenced during the financial year in Canberra, Adelaide and Perth. Terms of the agreement ensure costs are covered for space occupied by each party. As at 30 June 2017:
Payments received from ILCPayments made to ILC
IBA and ILC worked together on developing a shared services unit, to encompass key corporate functions. Costs involved in this process have been shared throughout the year. As at 30 June 2017:
Payments received from ILC
FINANCIAL PERFORMANCEPART 7:
ANNUAL REPORT 2016–17 143

NOTES TO AND FORMING PART OF THE FINANCIAL STATEMENTS
Note 15: Financial Instruments
2017 2016$’000 $’000
Note 15A: Categories of financial instrumentsFinancial assetsHeld-to-maturity financial assets
Term deposits & bonds 6E 51,410 88,669 Total held-to-maturity financial assets 51,410 88,669
Loans and receivables financial assets Cash and cash equivalents 6A 277,758 161,809 Goods and services 6B 13,123 17,118 Other receivables 6B 1,889 1,994
Total loans and receivables financial assets 292,770 180,921
Fair value through profit �� loss= designatedInvestments in market funds 6E 147,928 74,252 Business and home loans 6B 709,467 709,811
Total fair value through profit �� loss: designated 857,395 784,063
Available-for-sale financial assetsAssociates 6D 18,723 23,653
Total available-for-sale financial assets 18,723 23,653 Carrying amount of financial assets 1,220,298 1,077,306
Financial liabilitiesOther financial liabilities - at amortised cost
Trade creditors 8A 13,329 11,520 Other payables 8B 1,361 2,322
Total other financial liabilities - at amortised cost 14,690 13,842 Borrowings secured by a floating charge 9 11,500 22,985 Total borrowings secured by a floating charge 11,500 22,985 Carrying amount of financial liabilities 26,190 36,827
. Consolidated
Notes
There is no material difference between the fair value and carrying value of financial assets and liabilities.
INDIGENOUS BUSINESS AUSTRALIA144
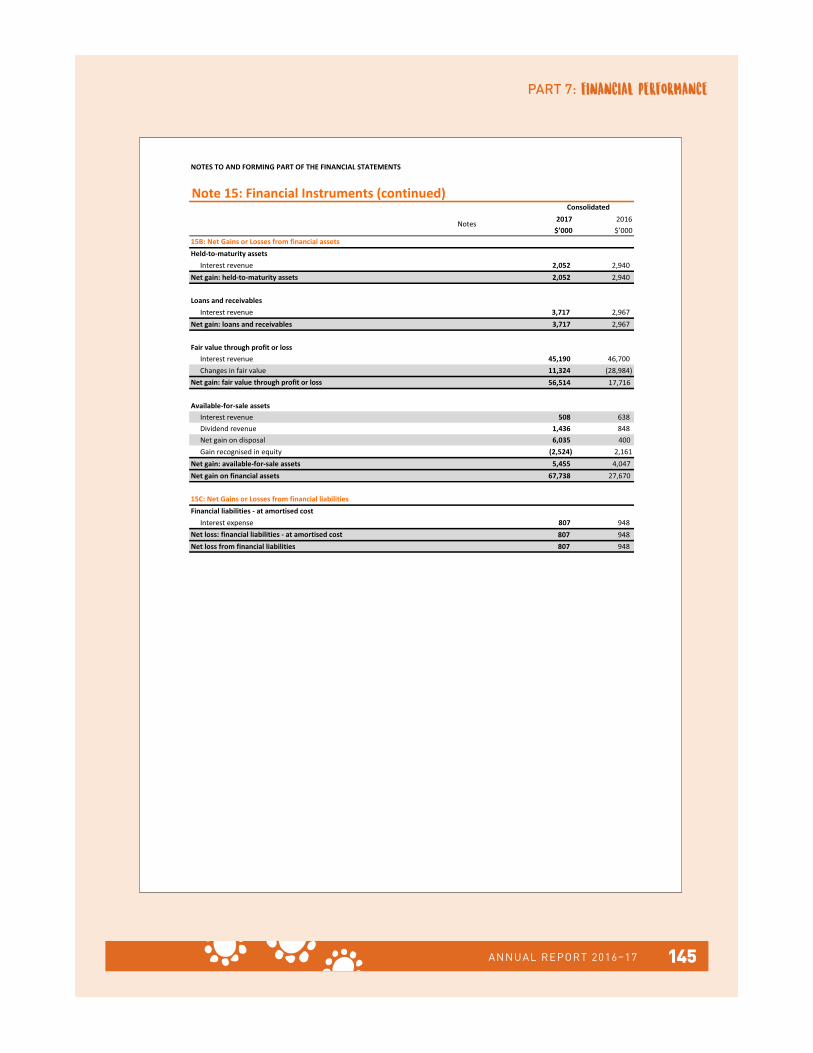
NOTES TO AND FORMING PART OF THE FINANCIAL STATEMENTS
Note 15: Financial Instruments (continued)
2017 2016$’000 $’000
Held-to-maturity assetsInterest revenue 2,052 2,940
Net gain: held-to-maturity assets 2,052 2,940
Loans and receivablesInterest revenue 3,717 2,967
Net gain: loans and receivables 3,717 2,967
Fair value through profit �� lossInterest revenue 45,190 46,700 Changes in fair value 11,324 (28,984)
56,514 17,716
Available-for-sale assetsInterest revenue 508 638 Dividend revenue 1,436 848 Net gain on disposal 6,035 400 Gain recognised in equity (2,524) 2,161
Net gain: available-for-sale assets 5,455 4,047 Net gain on financial assets 67,738 27,670
Financial liabilities - at amortised costInterest expense 807 948
807 948 Net loss from financial liabilities 807 948
15B: Net Gains or Losses from financial assets
. Consolidated
Notes
Net gain: fair value through profit �� loss
15C: Net Gains or Losses from financial liabilities
Net loss: financial liabilities - at amortised cost
FINANCIAL PERFORMANCEPART 7:
ANNUAL REPORT 2016–17 145

NOTES TO AND FORMING PART OF THE FINANCIAL STATEMENTS
Note 15: Financial Instruments (continued)15D: Fair value of financial instruments
2017 2016$’000 $’000
Maximum exposure to credit risk 709,467 709,811 Fair value changes due to credit risk:
During the period (734) 33,847Prior to the period 341,262 307,415
Cumulative change 340,528 341,262
Fair value measurements categorised by fair value hierarchyIBA uses the following techniques for measuring fair value of assets and liabilities:
• Trade receivables are valued at realisable value, which in the absence of impairment is the same ascarrying value.
• Trade and other payables and provisions are valued at their carrying values adjusted for any impairment.• Investments are assessed for fair value against market-related inputs every year and an external valuation
is performed once every three years.• Loans receivables are assessed for fair value against market-related benchmarks on an ongoing basis.
15E: Credit risk - maximum exposure
2017 2016$’000 $’000
Financial assetsTrade, other receivables and other financial assets 15,012 19,112 Loans receivables - Home 679,495 675,820 Loans receivables - Business 29,972 33,991 Investments in market funds 147,928 74,250 Investments in associates treated as available-for-sale 18,723 23,653 Term deposits & bonds 51,410 88,669
Total 942,540 915,495
When measuring fair value , IBA is required to maximise the use of observable inputs. IBA has used the Level 2 fair value hierarchy - Inputs other than quoted price that are observable either directly or indirectly.
IBA manages credit risk on its loans portfolio by undertaking background and credit checks prior to allowing a debtor relationship. In addition, IBA has policies and procedures that guide employees' debt recovery techniques. IBA also holds collateral against certain loans to mitigate against credit risk.
The following table illustrates IBA's gross exposure to credit risk, excluding any collateral or credit enhancements.. Consolidated
Loan receivables designated at fair value through profit ��loss
Changes in the fair value of loans designated at fair value through profit ��loss, that arose due to credit risk (method used either AASB 7 Financial Instruments: Disclosures 9(i) or 9c(ii)).
. Consolidated
• IBA Home and Business loans, issued at lower than market rates, are fair valued against market interest rates benchmarked on commercial bank rates. The interest rate differential against which the discount is� applied, is split into market discount and credit discount differentials. Movement in fair value is dependent on new loans settled, loans repaid and interest rate changes during the period. The credit risk impact measured gives the fair value discount arising on the credit interest differential only.
• IBA has not utilised any instruments such as credit derivatives to mitigate its credit risk.
INDIGENOUS BUSINESS AUSTRALIA146

NOTES TO AND FORMING PART OF THE FINANCIAL STATEMENTS
Note 15: Financial Instruments (continued)15E: Credit risk - maximum exposure (continued)
Impairment and ageing analysis of IBA's Home and Business loan receivables
Not past due norimpaired
Not past due norimpaired
Past due orimpaired
Past due orimpaired
2017 2016 2017 2016$’000 $’000 $’000 $’000
Financial assetsLoans receivables - Home 590,982 582,544 96,042 98,969 Loans receivables - Business 24,404 28,895 11,702 12,940
Total 615,386 611,439 107,744 111,909
Ageing analysis of financial assets and loan receivables that are past due but not impaired
0 to 30 31 to 60 61 to 90 90+days days days days Total
$'000 $'000 $'000 $'000 $'000Financial assets
37,619 16,865 8,653 12,991 76,128 465 1,595 558 1,008 3,626
Total 38,084 18,460 9,211 13,999 79,754
0 to 30 31 to 60 61 to 90 90+days days days days Total
$'000 $'000 $'000 $'000 $'000Financial assets
40,237 19,233 8,522 17,883 85,875 861 1,612 - 699 3,172
Total 41,098 20,845 8,522 18,582 89,047
Loans receivables considered impaired
2017 2016$’000 $’000
Financial assetsLoans receivables - Home 19,914 13,095Loans receivables - Business 7,840 32,067
Total 27,754 45,162
In relation to financial assets, deposits, trade receivables and investments are considered not past due and not impaired. The details of past due and impaired assets pertain to Home and Business loans only.
Consolidated
Consolidated 2017
Loans receivables - HomeLoans receivables - Business
Consolidated 2016
Loans receivables - HomeLoans receivables - Business
Consolidated
FINANCIAL PERFORMANCEPART 7:
ANNUAL REPORT 2016–17 147
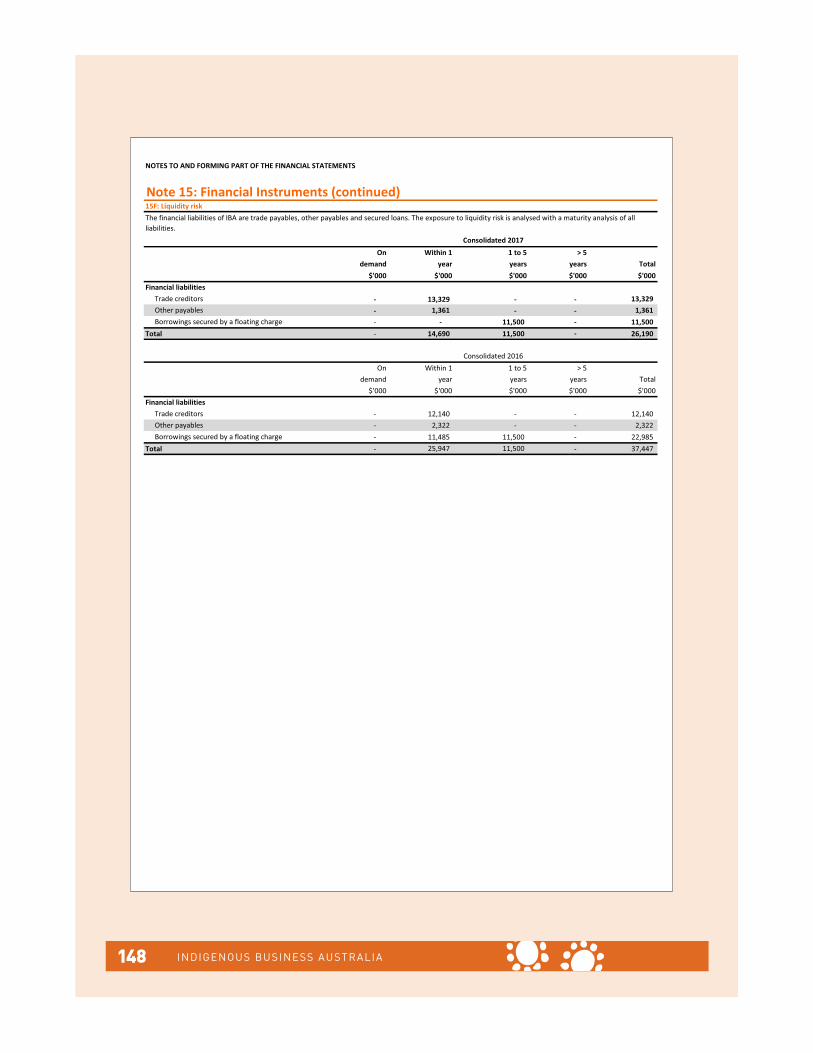
NOTES TO AND FORMING PART OF THE FINANCIAL STATEMENTS
Note 15: Financial Instruments (continued)15F: Liquidity risk
On Within 1 1 to 5 > 5demand year years years Total
$'000 $'000 $'000 $'000 $'000
- 13,329 - - 13,329 - 1,361 - - 1,361 - - 11,500 - 11,500
Total - 14,690 11,500 - 26,190
On Within 1 1 to 5 > 5demand year years years Total
$'000 $'000 $'000 $'000 $'000
- 12,140 - - 12,140 - 2,322 - - 2,322 - 11,485 11,500 - 22,985
Total - 25,947 11,500 - 37,447
Financial liabilities
The financial liabilities of IBA are trade payables, other payables and secured loans. The exposure to liquidity risk is analysed with a maturity analysis of all liabilities.
Consolidated 2017
Trade creditorsOther payablesBorrowings secured by a floating charge
Consolidated 2016
Financial liabilitiesTrade creditorsOther payablesBorrowings secured by a floating charge
INDIGENOUS BUSINESS AUSTRALIA148

NOTES TO AND FORMING PART OF THE FINANCIAL STATEMENTS
Note 15: Financial Instruments (continued)15G: Market risk
Risk Change in Effect on Change in Effect onvariable risk income risk income
variable statement variable statement% $'000 % $'000
Financial assets: loan receivablesInterest rate risk ��� � #��"� +0.3 (2,023) -0.3 (1,273)
Risk Change in Effect on Change in Effect onvariable risk income risk income
variable statement variable statement% $'000 % $'000
Financial assets: loan receivablesInterest rate risk Interest rate +0.6 (1,039) -0.6 (682)
Note 15H: Assets pledged/or held as collateralIn relation to the borrowings by subsidiaries of IBA, the following collateral is pledged.
2017 2016$’000 $’000
Assets pledged as collateralFinancial liabilities: Borrowings secured by floating charge 11,500 21,500
Total assets held as collateral 11,500 21,500
���� ����������� ����� ��� ��������������������XZ
• As at 30 June 2017, $11.5 million (30 June 2016: $21.5 million) relates to the amount borrowed against security of land and buildings.
2017 2016$’000 $’000
Loans receivables - Home 1,367,163 1,356,262 Loans receivables - Business 117,902 134,759
Total assets held as collateral 1,485,065 1,491,021
A positive number indicates an increase in surplus in the Statement of Comprehensive Income and a negative number indicates a decrease in surplus.
Interest rate risk refers to the risk that the fair value of a financial instrument will fluctuate because of changes in market interest rates. IBA is exposed to interest rate risk primarily on its Home and Business Loan receivables.
Consolidated 2017
Consolidated 2016
IBA home and business loans, issued at lower than market rates, are fair valued against market interest rates benchmarked on commercial bank rates. The quantum of interest rate differential determines the variance of the fair value from the face value.
Consolidated
In relation to IBA's gross credit risk, the following collateral is held against Home and Business loans.
Assets held as collateralNon-financial assets:
FINANCIAL PERFORMANCEPART 7:
ANNUAL REPORT 2016–17 149

NOTES TO AND FORMING PART OF THE FINANCIAL STATEMENTS
Note 16: Assets Held in TrustAboriginal and Torres Strait Islander Commission Funds
2017 2016$’000 $’000
Opening balance as at 1 July 2,084 3,381Interest received 30 41Payments - (1,338)Total amount at 30 June 2,114 2,084
Downs Aboriginal and Islander Company Funds
2017 2016$’000 $’000
Opening balance as at 1 July 1 1Interest received - -Payments - -Total amount at 30 June 1 1
IBA established the Aboriginal and Torres Strait Islander Commission Funds held in trust account. Funds held in the trust were received from the Aboriginal and Torres Strait Islander Commission under formal trust arrangements.
Consolidated
IBA is a trustee of Downs Aboriginal and Islander Company Funds, a trust set up exclusively for charitable purposes. Its beneficiaries are the Aboriginal and Torres Strait Islander residents of the Darling Downs District of Queensland.
Consolidated
Moneys received are placed in a separate bank account and are granted to parties in accordance with the Grant Agreement. These mone�s are not available for any other purpose of the Corporation and are not recognised in the financial statements.
INDIGENOUS BUSINESS AUSTRALIA150

NOTES TO AND FORMING PART OF THE FINANCIAL STATEMENTS
Note 17: Reporting of Outcomes
2017 2016$’000 $’000
Expenses @X71,59Z[ (206,621)
Income from non-government sectorCommercial revenue 196,143 190,549
Net cost of outcome delivery \]^_]� (16,072)
Statement of financial positionTotal assets 1,378,948 1,293,333 Total liabilities @44,138[ (50,885)
Net assets 1,``]^ZXz 1,242,448
Statement of equityRetained earnings 259,950 219,987 Asset revaluation reserves 5,452 10,381 Contributed equity/capital 1,069,409 1,012,080
Total equity 1,334,811 1,242,448
IBA's outcome is improved wealth acquisition to support the economic independence of Aboriginal and Torres Strait Islander peoples through commercial enterprise, asset acquisition, construction and access to concessional home and business loans.
As IBA has only one outcome, the above figures correspond to the Statement of Comprehensive Income and ^� ���������_�� ��� ��`�����.
Consolidated
FINANCIAL PERFORMANCEPART 7:
ANNUAL REPORT 2016–17 151

NOTES TO AND FORMING PART OF THE FINANCIAL STATEMENTS
Note 18: New Housing Fund
2017 2016$’000 $’000
ExpensesLoans fair value movements 18A - 9,950 Bad and doubtful debts 4,355 3,975
Total expenses 4,355 13,925
Less: own-source incomeRevenue
Interest 18B 30,206 30,632 Other - -
Total revenue 30,206 30,632
GainsValuation increment 18C 3,251 -
Total gains 3,251 -
Total own-sourced income 33,457 30,632
Net contribution by services 29,102 16,707
New Housing FundStatement of Financial Positionas at 30 June 2017
AssetsFinancial assets
Cash 18D 70,970 25,542 Receivables 18E 470,682 487,272 Other 18E 291 28
Total financial assets 541,943 512,842
Total assets 541,943 512,842
LiabilitiesPayables - -Total liabilities - -
Net assets 541,943 512,842
EquityParent entity interest
Capital 429,396 429,397 Accumulated surplus/(deficit) 112,547 83,445
Total parent entity interest 541,943 512,842 Total equity 541,943 512,842
Notes
As per section 181(3) of the Aboriginal and Torres Strait Islander Act 2005 {%�^��%��| �money held in the New Housing Fund may only be applied to make housing loans. Section 189 (2) of the ATSI Act requires specific information on the New Housing Fund's operations and financial position, as disclosed below. This information������� has been included in the preceding statement and notes�������������� �������:
New Housing FundStatement of Comprehensive Income��������� ��������=>�?����}>&~
INDIGENOUS BUSINESS AUSTRALIA152

NOTES TO AND FORMING PART OF THE FINANCIAL STATEMENTS
Note 18: New Housing Fund (continued)
New Housing FundCash{ flow statement�������������������=>�?����}>&~
2017 2016$’000 $’000
Operating activitiesCash received
Interest 30,206 30,632 Other - -
Total cash received 30,206 30,632 Cash used
Other 263 635 Total cash used 263 635
Net cash from operating activities 18F 29,943 29,997
Investing activitiesCash received
Repayments of loans 98,187 77,565 Total cash received 98,187 77,565 Cash used
Loans made 82,702 107,207 Total cash used 82,702 107,207
Net cash from investing activities 15,485 (29,642)
Net increase or (decrease) in cash held 45,428 355 Cash at beginning of reporting period 25,542 25,187 Cash at the end of the reporting period 70,970 25,542
The above statements should be read with the accompanying notes.
Notes
FINANCIAL PERFORMANCEPART 7:
ANNUAL REPORT 2016–17 153

NOTES TO AND FORMING PART OF THE FINANCIAL STATEMENTS
Note 18: New Housing Fund (continued)2017 2016
$’000 $’000Note 18A: Write-down and impairment of assetsValuation decrementTotal write-down and impairment of assets �9,950
Note 18B: Interest revenueInterest on bank account 892 449 Interest on housing loans 29,314 30,183 Total interest revenue 30,206 30,632
Note 18C: Valuation incrementValuation increments 3,251 Total interest revenue 3,251
Note 18D: CashCash at bank and on hand 66,185 23,931 Cash at agents 4,785 1,611 Total cash 70,970 25,542
Note 18E: ReceivablesOther debtors 291 28 Total other receivables 291 28
New Housing Fund onlyAt fair value - opening balance as at 1 July 487,272 471,555 Add: net loans movement at cost (15,486) 29,642
3,251 (9,950)
(4,355) (3,975) At fair value/cost closing balance 470,682 487,272
New Housing Funds loans (net) expected to be recoveredCurrent loans receivable 10,835 10,919 Non-current loans receivable 459,847 476,353
Total receivables 470,682 487,272
Note 18F: Cash flow reconciliationReconciliation of net surplus to net cash from operating activities
Net contribution by services 29,102 16,707 Loans fair value adjustment 1,104 13,925 (Increase)/Decrease in receivables (263) (28) Increase/(Decrease) in payables (607)
Net cash from operating activities 29,943 29,997
Add/(Less): net gain/(loss) onre-measurement at fair value through profit ��loss
Less: impairment movement through profit and loss
�
�
|^|_z��
�
INDIGENOUS BUSINESS AUSTRALIA154

NOTES TO AND FORMING PART OF THE FINANCIAL STATEMENTS
Note 19: Parent �ntity - Indigenous Business Australia2017 2016
$’000 $’000Note 19A: Statement of Comprehensive Income
Surplus after income tax on continuing operations 45,091 13,743 Total comprehensive income/(loss) 28,625 16,338
Note 19B: Statement of Financial PositionCurrent assets 300,663 345,610 Total assets 1,253,577 1,182,642 Current liabilities 16,561 11,107 Total liabilities 18,488 13,398Net assets 1,235,089 1,169,244
Note 19C: Statement of EquityRetained earnings 327,750 281,922 Reserves (62,405) (45,873)Contributed equity 969,744 933,194 Total equity 1,235,089 1,169,244
FINANCIAL PERFORMANCEPART 7:
ANNUAL REPORT 2016–17 155
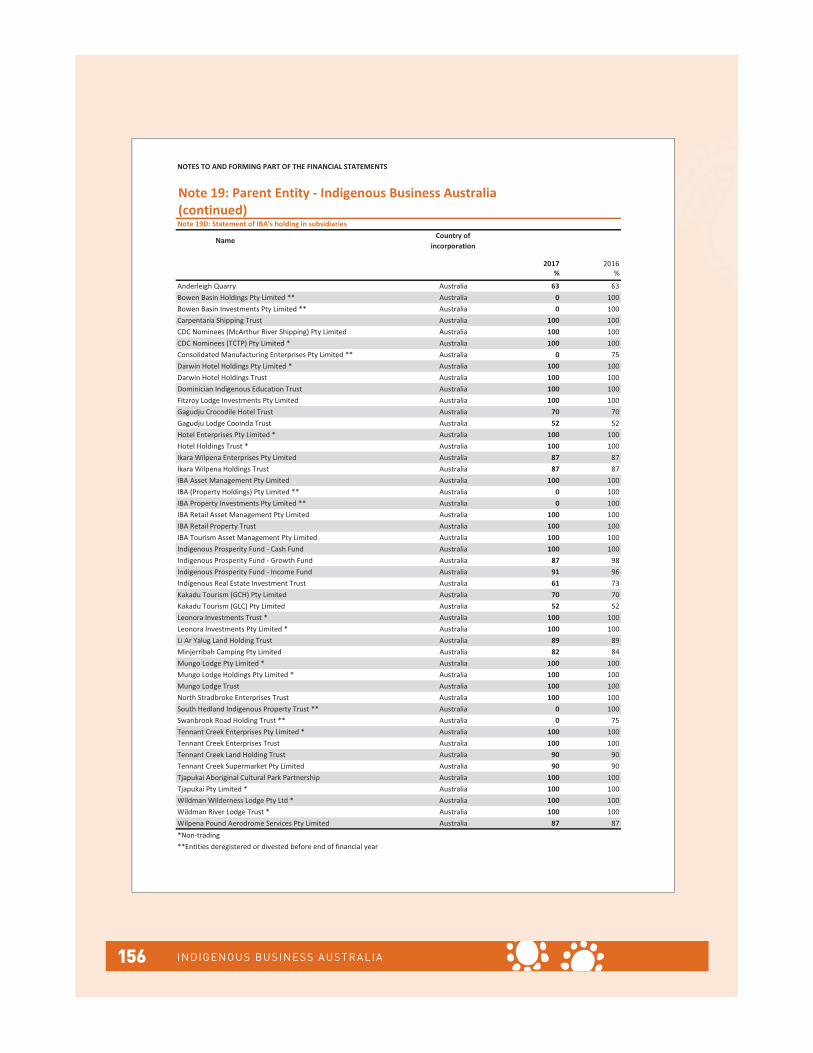
NOTES TO AND FORMING PART OF THE FINANCIAL STATEMENTS
Note 19: Parent Entity - Indigenous Business Australia (continued)Note 19D: Statement of IBA's holding in subsidiaries
Name Country of incorporation
2017 2016 % %
Anderleigh Quarry Australia 63 63Bowen Basin Holdings Pty Limited ** Australia 0 100Bowen Basin Investments Pty Limited ** Australia 0 100Carpentaria Shipping Trust Australia 100 100CDC Nominees (McArthur River Shipping) Pty Limited Australia 100 100CDC Nominees (TCTP) Pty Limited * Australia 100 100Consolidated Manufacturing Enterprises Pty Limited ** Australia 0 75Darwin Hotel Holdings Pty Limited * Australia 100 100Darwin Hotel Holdings Trust Australia 100 100Dominician Indigenous Education Trust Australia 100 100Fitzroy Lodge Investments Pty Limited Australia 100 100Gagudju Crocodile Hotel Trust Australia 70 70Gagudju Lodge Cooinda Trust Australia 52 52Hotel Enterprises Pty Limited * Australia 100 100Hotel Holdings Trust * Australia 100 100Ikara Wilpena Enterprises Pty Limited Australia 87 87Ikara Wilpena Holdings Trust Australia 87 87IBA Asset Management Pty Limited Australia 100 100IBA (Property Holdings) Pty Limited ** Australia 0 100IBA Property Investments Pty Limited ** Australia 0 100IBA Retail Asset Management Pty Limited Australia 100 100IBA Retail Property Trust Australia 100 100IBA Tourism Asset Management Pty Limited Australia 100 100Indigenous Prosperity Fund - Cash Fund Australia 100 100Indigenous Prosperity Fund - Growth Fund Australia 87 98Indigenous Prosperity Fund - Income Fund Australia 91 96Indigenous Real Estate Investment Trust Australia 61 73Kakadu Tourism (GCH) Pty Limited Australia 70 70Kakadu Tourism (GLC) Pty Limited Australia 52 52Leonora Investments Trust * Australia 100 100Leonora Investments Pty Limited * Australia 100 100Li Ar Yalug Land Holding Trust Australia 89 89Minjerribah Camping Pty Limited Australia 82 84Mungo Lodge Pty Limited * Australia 100 100Mungo Lodge Holdings Pty Limited * Australia 100 100Mungo Lodge Trust Australia 100 100North Stradbroke Enterprises Trust Australia 100 100South Hedland Indigenous Property Trust ** Australia 0 100Swanbrook Road Holding Trust ** Australia 0 75Tennant Creek Enterprises Pty Limited * Australia 100 100Tennant Creek Enterprises Trust Australia 100 100Tennant Creek Land Holding Trust Australia 90 90Tennant Creek Supermarket Pty Limited Australia 90 90Tjapukai Aboriginal Cultural Park Partnership Australia 100 100Tjapukai Pty Limited * Australia 100 100Wildman Wilderness Lodge Pty Ltd * Australia 100 100Wildman River Lodge Trust * Australia 100 100Wilpena Pound Aerodrome Services Pty Limited Australia 87 87*Non-trading**Entities deregistered or divested before end of financial year
INDIGENOUS BUSINESS AUSTRALIA156