Statement of Accounts - cbccrmdata.blob.core.windows.net - Ho… · Movement in Reserves Statement...
128
iii Statement of Accounts 2012/13
Transcript of Statement of Accounts - cbccrmdata.blob.core.windows.net - Ho… · Movement in Reserves Statement...

iii
Statement of Accounts
2012/13

ii
Contents Page
Explanatory Foreword
1
Statement of Responsibilities 8 Core Financial Statements
Movement in Reserves Statement 9 Comprehensive Income and Expenditure Statement 10 Balance Sheet 11 Cash Flow Statement 12 Notes to the Core Financial Statements 13
Supplementary Statements
Housing Revenue Account Income and Expenditure Statement 77 Movement on the Housing Revenue Account Statement 78 Notes to the Housing Revenue Account 79 Collection Fund Accounts 84 Notes to the Collection Fund 85 Port Health Authority Accounts 88 Trust Fund Accounts 89
Group Accounts Glossary
95
116
Independent Auditor’s Report 120 Annual Governance Statement 122
If you need any help with reading or understanding this document, please take it to our Customer Service Centre, Angel Court, High Street, Colchester, or � 282389. We will try to provide a reading service, translation or any other format you may need. Textphone: Dial 18001 followed by the full number that you wish to call.

1
EXPLANATORY FOREWORD Summary of the Financial Statements Movement in Reserves Statement (page 9) This statement shows the movement in the year on the different reserves held by the Council, analysed into ‘usable reserves’ (i.e. those that can be applied to fund expenditure or reduce local taxation) and other reserves. The Surplus/(Deficit) on the Provision of Services line shows the true economic cost of providing the Council’s services, more details of which are shown in the Comprehensive Income and Expenditure Statement. These are different from the statutory amounts required to be charged to the General Fund Balance and the Housing Revenue Account for Council Tax setting and dwellings rent setting purposes. The Net Increase/Decrease before Transfers to Earmarked Reserves line shows the statutory General Fund Balance and Housing Revenue Account Balance before any discretionary transfers to or from Earmarked Reserves undertaken by the Council. Comprehensive Income and Expenditure Account Statement (page 10) This statement shows the accounting cost in the year of providing services in accordance with generally accepted accounting practices, rather than the amount to be funded from taxation. Councils raise taxation to cover expenditure in accordance with regulations; this may be different from the accounting cost. The taxation position is shown in the Movement in Reserves Statement. Balance Sheet (page 11) The Balance Sheet shows the value as at the Balance Sheet date of the assets and liabilities recognised by the Council. The net assets of the Council (assets less liabilities) are matched by the reserves held by the Council. Reserves are reported in two categories. The first category of reserves are usable reserves, i.e. those reserves that the Council may use to provide services, subject to the need to maintain a prudent level of reserves and any statutory limitations on their use (for example the Capital Receipts Reserve that may only be used to fund capital expenditure or repay debt). The second category of reserves includes those that the Council is not able to use to provide services. This category of reserves includes reserves that hold unrealised gains and losses (for example the Revaluation Reserve), where amounts would only become available to provide services if the assets are sold; and reserves that hold timing differences shown in the Movement in Reserves Statement line ‘Adjustments between accounting basis and funding basis under regulations’. Cash Flow Statement (page 12) The Cash Flow Statement shows the changes in cash and cash equivalents of the Council during the reporting period. The statement shows how the Council generates and uses cash and cash equivalents by classifying cash flows as operating, investing and financing activities. The amount of net cash flows arising from operating activities is a key indicator of the extent to which the operations of the Council are funded by way of taxation and grant income or from the recipients of services provided by the Council. Investing activities represent the extent to which cash outflows have been made for resources which are intended to contribute to the Council’s future service delivery. Cash flows arising from financing activities are useful in predicting claims on future cash flows by providers of capital (i.e. borrowing) to the Council. Housing Revenue Account Income and Expenditure Statement (page 77) The HRA Income and Expenditure Statement shows the economic cost in the year of providing housing services in accordance with generally accepted accounting practices, rather than the amount to be funded from rents and government grants. Councils charge rents to cover expenditure in accordance with regulations; this may be different from the accounting cost. The increase or decrease in the year, on the basis on which rents are raised, is shown in the Movement on the Housing Revenue Account Statement. Collection Fund Accounts (page 84) The Collection Fund is an agent’s statement that reflects the statutory obligation for billing authorities to maintain a separate Collection Fund. The statement shows the transactions of the billing authority in relation to the collection from taxpayers and distribution to local authorities and the Government of Council Tax and Non-Domestic Rates. Port Health Authority Accounts (page 88) These are the accounts of an independent authority administered by the Council on behalf of itself and Tendring District Council. Trust Fund Accounts (page 89) These are the accounts of various funds for which the Council is a trustee.

2
Group Accounts (page 95) These statements bring together and consolidate the financial position of the Council and its interest in Colchester Borough Homes Limited and Colchester Community Stadium Limited, together with the Port Health Authority and the various Trust Funds for which the Council is trustee.
Results for 2012/13 Revenue spending is generally on items used during the year, and is paid for by Council Tax, National Non-Domestic Rates, Government grants and other income. During this year the net General Fund spending was £21.5 million met by the precept on the Collection Fund and Government grants. Original Estimate Actual
£m £m
Total Net Spending for the Year 22.6 21.5
Met by:
Collection Fund Demand 11.8 11.8
Government Grants 10.7 10.7
Contribution from/(to) Balances 0.1 (1.0)
Total Financing 22.6 21.5
Expenditure on services was £0.6 million less than estimated. The 2012/13 budget included almost £1.7 million of savings or additional income. The outturn position shows these have either been delivered or other compensating savings or additional income has been achieved. The contributions made to reserves and balances include the carry forward of budgets to fund ongoing project work, transitional costs and budget risks. The 2012/13 budget included a risk factor of £0.3 million, which was not used so has also been carried forward and held in balances. The Council’s loans and investment account showed a net gain of over £0.3 million. This is due to new borrowing being avoided through reducing investments in accordance with the ongoing strategy of ‘internal borrowing’. Regular monitoring reports on the revenue position, highlighting the significant risk areas, were submitted to the Finance and Audit Scrutiny Panel throughout the year. General Fund balances now stand at £5.9 million, of which £2.0 million is uncommitted or unallocated. They are used as a working balance and to support future spending plans. Capital spending is on items which have a value to the Council or the community for more than a year and is generally met from loans, revenue or the proceeds of sale of capital assets. Significant items of expenditure during the year included £7.0 million for improvements to Council Housing, £2.4 million for the acquisition of fleet vehicles under finance leases and £1.8 million for regeneration projects. The Council’s capital spending was £15.8 million (compared to £14.3 million in 2011/12), but £2.2 million less than programmed. Of this total, £1.0 million was funded from Council borrowing, £3.8 million was funded from external grants and contributions, £2.4 million from leasing, with the remainder mainly coming from General Fund and HRA revenue funding (including the Major Repairs Reserve), and from the Capital Expenditure Reserve. The Council utilised its powers to undertake borrowing to fund almost £1.0 million of the expenditure, most of this being on the Fundamental Service Review of Sports and Leisure Services.
Capital Receipts continue to provide a significant resource to support capital spending plans, and sums received in 2012/13 were higher than those received in 2011/12. Receipts from sales of Council houses showed a decrease on 2011/12, with £1.1 million received in 2012/13. This was as a result of the increase in discounts applicable introduced by the Government from 1 April 2012. Under the new Capital Receipts Pooling regulations which came into effect from 1 April 2012, local authorities are able to retain a greater proportion of the income they receive from the sale of dwellings. This is dependant on these additional receipts being reinvested in the provision of new affordable housing, along with an allowance for the provision for repayment of HRA debt. In 2012/13, £0.280 million has been reserved for new build and £0.343 million reserved for other purposes and £0.356 million was pooled and paid over to the Government.
3
Other receipts are fully available and £1.5 million was received in 2012/13. The accumulated balance of £5.3 million is already planned to support capital spending from 2013/14 onwards.
Treasury Management The Local Government Act 2003 gave councils the freedom to determine how much they borrow for investment in new capital projects subject to a regulation that such borrowing complies with the “Prudential Code for Capital Finance in Local Authorities”. The Prudential Code looks to ensure affordability, prudence and sustainability in relation to determined borrowing limits. The Council determined the required Prudential Code indicators and Treasury Management Strategy as part of the budget process for 2012/13. The borrowing and investment activities undertaken in the year are in accordance with these determinations. As investment rates were below long-term borrowing rates, value for money considerations indicated that new external borrowing should be avoided and internal cash balances should be used to finance new capital expenditure. This maximised short-term savings and reduced the Council’s exposure to interest rate and credit risk. The total loan debt at the year end was £137.8 million. Funds invested at the year end that were not classed as ‘cash equivalents’ totalled £4.3 million. This includes the carrying value of investments that were impaired as a result of the Icelandic banks’ default in October 2008, which has been reduced as a result of repayments of part of the investment in May and October 2012.
Pension Liability The full reporting arrangements for pension costs are included in the Statement of Accounts. There are extensive notes included with the relevant statements. The overall aim is to give a clearer picture of both the current cost of the pension scheme and the potential long term implications. However the overall amount to be met from Government Grants and local taxation remains unchanged. The Council’s share of the assets and liabilities of the pension fund show an estimated £94.9 million shortfall at 31 March 2013. Whilst this figure is substantial it should be remembered that:
• It is not an immediate deficit that has to be met now. The sum is the current assessment taking a long term view of the future liabilities both for existing pensioners and current employees who are accruing pension entitlement.
• It is not a problem unique to Colchester Borough Council or indeed local authorities generally. There is a national problem for pension funds both private and public sector.
• The Essex pension fund is regularly reviewed and additional contributions have already been initiated to address the problem over a period of years.
Provisions A provision of £0.5 million has been included within the Statement of Accounts to meet the estimated cost to the Council of outstanding insurance claims for which the actual cost of individual claims and the timing of payments are uncertain. Refer to Note 26 for further information regarding this provision.
Contingent liabilities At the year end the Council has identified and disclosed contingent liabilities regarding an alleged breach of contract in relation to the sale of land, a potential conflict regarding the application of charges made by the Council for land searches and a challenge relating to prior years’ income. No provisions have been made in the accounts for these potential liabilities but their position continues to be monitored by the Council. Refer to Note 43 for further information regarding these contingent liabilities.

4
Revaluation losses Revaluations were performed for a selected portfolio of general fund assets as at 1
April 2012 and an economic
impairment review was performed for a sample of general fund assets as at 31 March 2013. These revaluations resulted in total revaluation losses of £3.7 million, of which £0.3 million has been taken to the Revaluation Reserve and £3.4 million has been taken to the Comprehensive Income and Expenditure Statement in 2012/13. The revaluation losses taken to the Comprehensive Income and Expenditure Statement have been transferred from the General Fund to the Capital Adjustment Account in the Movement in Reserves Statement, in accordance with statutory regulations. Other revaluation losses relating to the revaluation of general fund properties at the year end total £0.6 million, of which £0.3 million has been taken to the Revaluation Reserve and £0.3 million has been taken to the Comprehensive Income and Expenditure Statement in 2012/13. The revaluation losses taken to the Comprehensive Income and Expenditure Statement have been transferred from the General Fund to the Capital Adjustment Account in the Movement in Reserves Statement, in accordance with statutory regulations. In 2012/13 the Council incurred expenditure of £7.0 million on its dwelling stock which related to the replacement of existing components of buildings in order to maintain the stock at the decent home standard prescribed by the Government. Under the IFRS Code of Practice the original cost of the components at £0.5 million has been derecognised in the 2012/13 accounts. The remaining balance of the expenditure (£6.5 million) has been treated as a revaluation loss, which has been taken to the HRA Income and Expenditure Statement in 2012/13 and has been transferred to the Capital Adjustment Account in the Movement in Reserves Statement, in accordance with statutory regulations.
Impairment losses During 2012/13 the Council has recognised impairment losses totalling £0.08 million in relation to the significant deterioration of the physical condition over the financial year of the St James House building and Roman House building. Refer to Note 18 for further information regarding these impairment losses.
Material events after the Balance Sheet date With the new arrangements for the retention of business rates from 1 April 2013, local authorities will assume the liability for refunding ratepayers who have successfully appealed against the rateable value of their properties on the rating list. The Council's respective share of the liability as at 31st March 2013 is estimated as £1.545m. The disclosure note relating to capital commitments at 31 March 2013 includes a number of contracts relating to Decent Homes and Upgrades to Council Stock and Specific Adaptations to Housing Stock that have subsequently ended. However, new contractual arrangements will be entered into during 2013/14. These are considered to be a non-adjusting post balance sheet events in the 2012/13 accounts, and as a result no adjustments have been made to the accounts.
Joint Committees The Council is a member of the Colchester and Ipswich Museum Service Joint Committee, which was formed with Ipswich Borough Council on 1 April 2007. The Council is a member of the North Essex Parking Partnership, which was set up on 1 April 2011 for the purposes of civil parking enforcement in the administrative areas of the districts of Braintree, Epping, Harlow, Tendring and Uttlesford and the Borough of Colchester. Off-street services are also provided for all except Tendring. This service is centrally managed from Colchester, with the on-street element being delivered on behalf of Essex County Council. As both Joint Committees were established under Sections 101 and 102 of the Local Government Act 1972, they are required to produce accounts annually and have them subjected to a limited assurance audit. The draft accounts for 2012/13 will be submitted to the Joint Committees for approval by 30 June 2013.

5
Housing Revenue Account The Council is the major provider of rented housing in the Borough and manages 6,230 properties. The Housing Revenue Account Financial Statement for 2012/13 shows a net contribution to balances for the year of £1.3 million. At the 2012/13 year end the Housing Revenue Account balance is £4.8 million, a significant part of which is earmarked to support future capital spending.
Colchester Borough Homes Limited In 2003/04 we set up Colchester Borough Homes Limited as an Arms Length Management Organisation (ALMO). The ALMO is an alternative way of delivering the Council’s housing landlord services, and gives tenants a bigger say in the management of the dwellings. It means that Council housing is still owned by the Council, but managed by a separate organisation. Colchester Borough Homes Limited is the separate organisation, which will not make a profit and has tenants, Councillors and independent people on its management board.
Colchester Community Stadium Limited The stadium is owned by the Council but is managed by a separate organisation, Colchester Community Stadium Limited. Colchester Community Stadium Limited is responsible for the effective running of the entire Community Stadium as a financially viable enterprise delivering the maximum programme of community activities consistent with this objective.
Group Accounts We are required to prepare a series of Group Financial Statements which reflect not only the direct financial activities of the Council but also services provided by those bodies over which we have a formal controlling influence. The principal impact is to bring together in the Group Accounts the activities of the Council, Colchester Borough Homes and Colchester Community Stadium Limited. The opportunity has also been taken to consolidate the activities of the Port Health Authority and the various Trust Funds into these statements. These requirements have no impact on our financial results and standing. The aim is to provide a clearer financial picture of the Council’s control and influence.
Reporting Requirements Reporting requirements under the Accounts and Audit (England) Regulations 2011 required that the accounts for 2012/13 were to be certified by the responsible financial officer that they present a true and fair view by no later than 30 June. In order to achieve this deadline, a number of items, which have been closed on estimated outturn, are included in the accounts. The effect of these on the 2012/13 accounts is not expected to be material and any differences between estimated and actual outturn will be accounted for in the following year.
Revenue Balance During the year the Council undertook a review to determine the appropriate level of balances. Balances are required to cover a number of potential unforeseen eventualities and risks of additional expenditure being required over and above that allowed for within budgets. This review was based on identifying and then evaluating all potential risks. The exercise identified the minimum prudent level of balances required as £1.5 million. It was agreed to set balances at £1.8 million when planning the 2013/14 budget. As at 31 March 2013 the Council’s General Fund balances stood at £5.9 million, of this £2.0 million is uncommitted or unallocated. The balances position will continue to be reviewed as part of our ongoing financial planning and monitoring.

6
Impact of the Current Economic Climate on the Council and the Services it provides Reductions in central Government grants continued to have a significant impact on the 2012/13 budget, which as a result included £1.7 million of savings or additional income. During the year we have seen a further impact on our budget with shortfalls in certain budget areas such as car parking and leisure income. Prompt and effective management action was taken to reduce spending to deal with these issues, such that the final outturn position remained in balance with the original budget. The Council has taken some difficult but necessary decisions during its planning for the 2013/14 Budget. The impact of Fundamental Service Reviews (FSR) especially, where more efficient ways are being found of delivering improved services, has left the Council well placed to meet the continuing financial difficulties being faced nationally and within local government specifically. In particular the wide ranging Universal Customer Contact (UCC) FSR has enabled the Council to consider the future operating model of the Council alongside a number of themes of work. The 2013/14 budget takes account of some major changes to local government finance with the introduction of the local retention of business rates and the replacement of Council Tax Benefits with the Local Council Tax Support scheme. These issues place new risks on the Council’s finances and consideration was given to them when the budget was set and the level of balances was agreed. Whilst future funding levels remain uncertain, the work carried out on the FSR programme means that the Council is able to withstand any foreseeable financial pressures during 2013/14. The 2013/14 Budget was achieved without the necessity of any major cuts in public services. The Council continues to review its asset portfolio and there are a number of planned land and property transactions which will generate sufficient capital receipts to fund the anticipated capital programme. There has been no requirement to enter into sales in anything other than a planned manner and the Council’s asset base is not under financial pressure. With the national economic outlook remaining difficult, financial pressures on demand led services such as supporting housing benefits will continue.
Outlook The Council’s Strategic Plan 2012-2015 clearly identifies priorities for action in these years. The Council continues, through its budgetary process, to ensure that the Council’s limited resources are focussed on these priority areas and an associated Action Plan is monitored throughout the year to ensure delivery of key objectives. The Council prepares a Medium Term Financial Forecast (MTFF) which estimates the Council’s spending needs and likely income for the next three years. The forecast shows that the Council is still facing significant financial pressures and alongside this there are a number of areas of significant change, which means that there is uncertainty over future funding. Funding for all local authorities has changed. In the coming few years we expect that core Government funding from Revenue Support Grant will continue to reduce. This grant which once determined is fixed for a particular year is partly being replaced by the ability to retain a proportion of business rates. This may provide an opportunity for the Council to mitigate the cost pressure of falling grant by achieving greater income. However, the business rates scheme also includes a number of significant risks such as the impact of rating appeals and business failure which in realistic terms are outside the Council’s control. 2011/12 saw the introduction of the New Homes Bonus and in 2013/14 the Council is due to receive £2.616 million, the highest payment in Essex. At this level the New Homes Bonus has to be recognised as a significant part of the Council’s overall budget. However, it is clear that the underlying Government funding is being reduced to compensate on a national scale, so the net impact locally is reduced. The Government’s Welfare Reform Bill received Royal Ascent on 8 March 2012. The Act contained a number of significant changes to the welfare system with an emphasis on creating incentives to work and protecting the most vulnerable. The Council has considered the implications of these changes on residents and how the Council can respond to their needs. One of the changes has seen the introduction of a Localised Council Tax Support (LCTS) Scheme to replace Council Tax Benefit. The Council agreed the LCTS scheme for 2013/14 following consultation with residents and the relevant precepting authorities. This scheme and the other welfare reforms present either new or increased

7
risks to the Council such as the impact of non collection of income from Council Tax or rents and also the impact of increased demand on services such as housing and welfare advice and the specifically the level and cost of LCTS. The LCTS scheme was agreed with regard to the reduced fixed government funding provided and it will be necessary to consider the impact of reducing Government funding has on any possible changes to the scheme. We expect the financial environment to continue be very difficult for the foreseeable future and it is necessary to ensure that the new financial risks are fully considered. Significant efficiency savings have been achieved to date and decisions already taken will continue to deliver an improved financial cost base as changes become embedded. The implementation and delivery of savings set out within the UCC FSR will be vital. However, it will be necessary to identify further opportunities to either reduce costs or increased income to balance future budgets.
Other Information This Statement of Accounts is one of a number of publications giving information on the Council’s finance and other activities. Other publications include The Strategic Plan 2012-2015 – this sets a clear direction for the Council, and a focus for service planning and budget setting. We also produce a wide range of other publications, booklets and leaflets, available free from the Customer Service Centre at Angel Court, from public libraries and the Visitor Information Centre. You can also visit our website at www.colchester.gov.uk. Members of the public are welcome to attend Council, Cabinet and Panel meetings. You may also address meetings under the Have Your Say! scheme. Information about meetings, agendas and copies of Council minutes are available from Council offices or by telephoning Colchester 282207.
Our Fairness Policy We are committed to promoting equity and equal opportunities for access and participation for everyone, whatever their personal circumstances. This includes the use of all the services and facilities which we provide. We are committed to ensuring that everyone is treated with dignity and respect, and to eliminating all forms of harassment. We will allocate and spend money on services as fairly as possible according to the needs of local people.
For more information about these accounts, please contact: Steve Heath, Corporate & Financial Management,
Rowan House, 33 Sheepen Road, Colchester, CO3 3WG Telephone: Colchester (01206) 282389
E-mail: [email protected]

8
STATEMENT OF RESPONSIBILITIES FOR THE STATEMENT OF ACCOUNTS
The Chief Financial Officer’s Responsibilities The Chief Financial Officer is responsible for preparing the Council’s Statement of Accounts under the proper practices set out in the CIPFA/LASAAC Code of Practice on Local Authority Accounting in the United Kingdom (‘the Code of Practice’). In preparing this Statement of Accounts, the Chief Financial Officer has:
• selected suitable accounting policies and then applied them consistently
• made judgements and estimates that were reasonable and prudent
• complied with the Code of Practice The Chief Financial Officer has also:
• kept proper accounting records which were up to date
• taken reasonable steps to prevent and detect fraud and other irregularities Chief Financial Officer’s Certificate I certify that the accounts set out on pages 1 to 119 give a true and fair view of the financial position of the Council as at 31 March 2013 and its income and expenditure for the year then ended.
Sean Plummer Finance Manager
(Section 151 Officer) 24 September 2013
The Council’s Responsibilities The Council must:
• make arrangements for the proper administration of its financial affairs and make one of its officers responsible for the administration of those affairs. In this Council, that officer is the Chief Financial Officer.
• manage its affairs to bring about economic, efficient and effective use of resources and to safeguard its assets.
• approve the Statement of Accounts.
I confirm that these accounts were approved by the Governance Committee at the meeting held on 24 September 2013.
Signed on behalf of Colchester Borough Council Councillor N. Offen
Deputy Chair of meeting approving the accounts: Date: 24 September 2013

9
MOVEMENT IN RESERVES STATEMENT
Reserves held for revenue purposes
Reserves held for capital purposes
Gen
era
l F
un
d
Bala
nce
Ho
usin
g
Reven
ue
Acco
un
t
Earm
ark
ed
R
eserv
es
Cap
ital
Receip
ts
Reserv
e
Majo
r R
ep
air
s
Reserv
e
Cap
ital
Gra
nts
U
nap
plied
To
tal
Usab
le
Reserv
es
Un
usab
le
Reserv
es
To
tal
Reserv
es
£’000 £’000 £’000 £’000 £’000 £’000 £’000 £’000 £’000
Balance at 1 April 2011 3,457 3,919 4,801 2,674 2,258 305 17,414 328,667 346,081
Movement in reserves
Surplus/(Deficit) on provision of services (Page 10)
(13,186) (80,880) - - - - (94,066) - (94,066)
Other Comprehensive Income and Expenditure (Page 10)
- - - - - - - (22,034) (22,034)
Total Comprehensive Income and Expenditure
(13,186) (80,880) - - - - (94,066) (22,034) (116,100)
Adjustments between accounting basis & funding basis under regulations (Note 9)
16,773 80,521 - 1,846 (1,096) (302) 97,742 (97,742) -
Net Increase/(Decrease) before Transfers to Earmarked Reserves
3,587 (359) - 1,846 (1,096) (302) 3,676 (119,776) (116,100)
Transfers to/from Earmarked Reserves (Note 10)
(2,126) (23) 517 - - - (1,632) 1,632 -
Net Increase/(Decrease) in 2011/12
1,461 (382) 517 1,846 (1,096) (302) 2,044 (118,144) (116,100)
Balance at 1 April 2012 (Page 11)
4,918 3,537 5,318 4,520 1,162 3 19,458 210,523 229,981
Movement in reserves
Surplus/(Deficit) on provision of services (Page 10)
(8,415) (3,165) - - - - (11,580) - (11,580)
Other Comprehensive Income and Expenditure (Page 10)
- - - - - - - (8,681) (8,681)
Total Comprehensive Income and Expenditure
(8,415) (3,165) - - - - (11,580) (8,681) (20,261)
Adjustments between accounting basis & funding basis under regulations (Note 9)
9,926 4,472 - 1,397 61 103 15,959 (15,959) -
Net Increase/(Decrease) before Transfers to Earmarked Reserves
1,511 1,307 - 1,397 61 103 4,379 (24,640) (20,261)
Transfers to/from Earmarked Reserves (Note 10)
(536) (57) 400 (623) - - (816) 816 -
Net Increase/(Decrease) in 2012/13
975 1,250 400 774 61 103 3,563 (23,824) (20,261)
Balance at 31 March 2013 (Page 11)
5,893 4,787 5,718 5,294 1,223 106 23,021 186,699 209,720

10
COMPREHENSIVE INCOME AND EXPENDITURE STATEMENT
2012/13 2011/12
Gross
Expenditure Gross
Income Net
Expenditure Gross
Expenditure Gross
Income Net
Expenditure
£’000 £’000 £’000 £’000 £’000 £’000
Central services 14,349 (13,239) 1,110 14,364 (12,891) 1,473
Cultural and related services 14,746 (6,105) 8,641 27,688 (10,672) 17,016
Environmental and regulatory services 12,559 (4,530) 8,029 12,469 (4,172) 8,297
Planning services 7,618 (2,978) 4,640 6,861 (3,072) 3,789
Highways and transport services 7,029 (6,209) 820 7,688 (6,634) 1,054
Local authority housing (HRA) 25,161 (28,077) (2,916) 31,013 (26,176) 4,837
Settlement payment for HRA self-financing (Note 5)
- - - 73,694 - 73,694
Other housing services 61,313 (57,566) 3,747 59,045 (54,635) 4,410
Adult social care 1,274 (841) 433 1,276 (789) 487
Corporate and democratic core 4,240 (258) 3,982 4,345 (340) 4,005
Non distributed costs 686 - 686 176 (34) 142
Exceptional item (Note 5) - - - 3,519 (6,300) (2,781)
Cost of Services 148,975 (119,803) 29,172 242,138 (125,715) 116,423
Other operating expenditure (Note 11) 1,758 1,416
Financing and investment income and expenditure (Note 12)
7,539 4,109
Taxation and non-specific grant income (Note 13)
(26,889) (27,882)
(Surplus)/Deficit on Provision of Services
11,580 94,066
(Surplus)/Deficit on revaluation of non current assets (Note 28)
314 (2,812)
Actuarial (gains)/losses on pension assets/liabilities (Note 42)
8,367 24,846
Other Comprehensive Income and Expenditure
8,681 22,034
Total Comprehensive Income and Expenditure
20,261 116,100

11
BALANCE SHEET
31 March 2013 31 March 2012
Notes £’000 £’000
Long Term Assets
Property, Plant & Equipment 14 394,136 404,068
Heritage Assets 15 1,172 1,172
Investment Properties 16 35,380 35,887
Intangible Assets 17 867 961
Long Term Investments 20 10 10
Long Term Debtors 21 722 743
Total Long Term Assets 432,287 442,841
Current Assets
Short Term Investments 20 4,276 2,936
Assets Held for Sale 22 1,101 2,294
Inventories 144 170
Short Term Debtors 23 10,447 8,796
Cash and Cash Equivalents 24 19,789 19,361
Total Current Assets 35,757 33,557
Current Liabilities
Bank Overdraft (3,184) -
Short Term Borrowing 20 (12,245) (6,076)
Short Term Creditors 25 (9,475) (13,941)
Grants Receipts in Advance – Revenue 39 (1,682) (1,556)
Total Current Liabilities (26,586) (21,573)
Total Long Term Liabilities
Long Term Creditors – Finance Leases 20 & 41 (2,302) (419)
Provisions 26 (501) (401)
Long Term Borrowing 20 (125,594) (131,094)
Pension Scheme Liability 42 (94,912) (84,952)
Grants Receipts in Advance – Capital 39 (8,429) (7,978)
Total Long Term Liabilities (231,738) (224,844)
Total Net Assets 209,720 229,981
Represented by:
Usable Reserves 27 23,021 19,458
Unusable Reserves 28 186,699 210,523
Total Reserves 209,720 229,981
These financial statements replace the unaudited financial statements certified by Sean Plummer, Finance Manager (Section 151 Officer) on 25 June 2013.

12
CASH FLOW STATEMENT
2012/13 2011/12
£’000 £’000
Net Surplus/(Deficit) on the Provision of Services Page 10 (11,580) (94,066)
Adjustments to Net Surplus/Deficit on the Provision of Services for non-cash movements
Note 29 22,116 40,007
Adjustments for items included in the Net Surplus/Deficit on the Provision of Services that are Investing and Financing Activities
Note 29 (4,736) (1,363)
Net Cash Flows from Operating Activities Note 29 5,800 (55,422)
Net Cash Flows from Investing Activities Note 30 (6,048) (5,142)
Net Cash Flows from Financing Activities Note 31 (2,508) 78,985
Net Increase/(Decrease) in Cash and Cash Equivalents (2,756) 18,421
Cash and Cash Equivalents at 1 April Note 32 19,361 940
Cash and Cash Equivalents at 31 March Note 32 16,605 19,361
13
NOTES TO THE CORE FINANCIAL STATEMENTS
INDEX Page
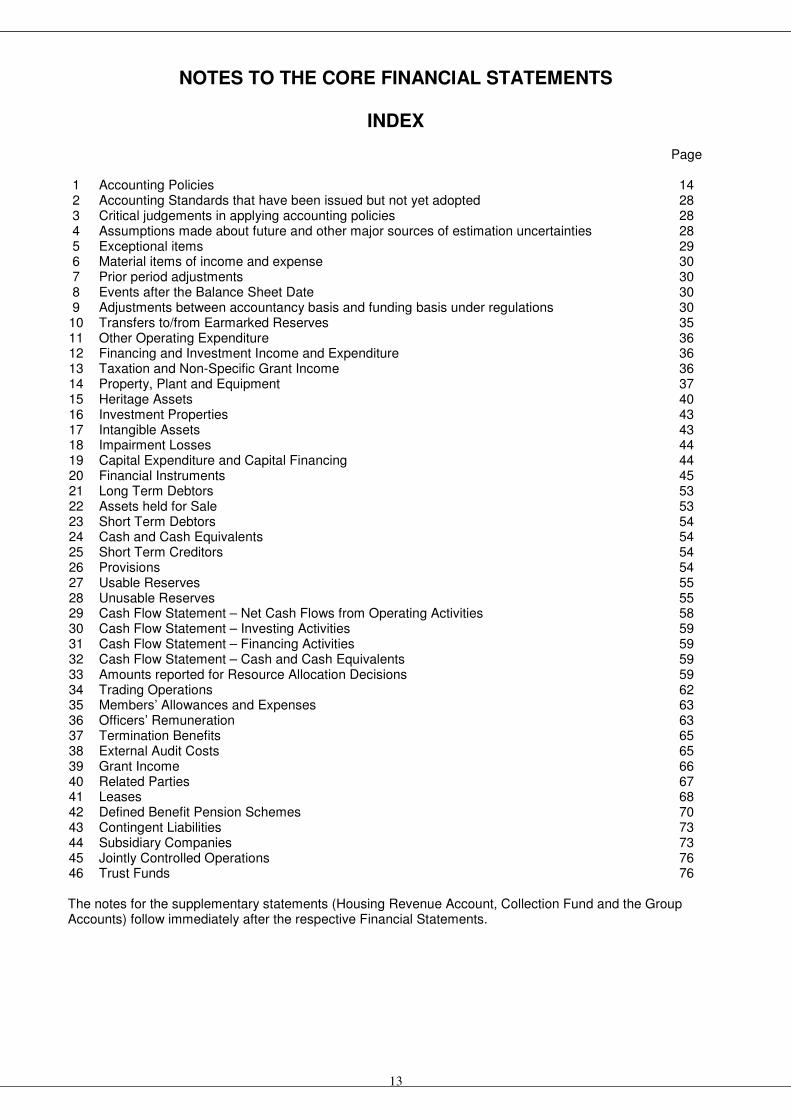
1 Accounting Policies 14 2 Accounting Standards that have been issued but not yet adopted 28 3 Critical judgements in applying accounting policies 28 4 Assumptions made about future and other major sources of estimation uncertainties 28 5 Exceptional items 29 6 Material items of income and expense 30 7 Prior period adjustments 30 8 Events after the Balance Sheet Date 30 9 Adjustments between accountancy basis and funding basis under regulations 30 10 Transfers to/from Earmarked Reserves 35 11 Other Operating Expenditure 36 12 Financing and Investment Income and Expenditure 36 13 Taxation and Non-Specific Grant Income 36 14 Property, Plant and Equipment 37 15 Heritage Assets 40 16 Investment Properties 43 17 Intangible Assets 43 18 Impairment Losses 44 19 Capital Expenditure and Capital Financing 44 20 Financial Instruments 45 21 Long Term Debtors 53 22 Assets held for Sale 53 23 Short Term Debtors 54 24 Cash and Cash Equivalents 54 25 Short Term Creditors 54 26 Provisions 54 27 Usable Reserves 55 28 Unusable Reserves 55 29 Cash Flow Statement – Net Cash Flows from Operating Activities 58 30 Cash Flow Statement – Investing Activities 59 31 Cash Flow Statement – Financing Activities 59 32 Cash Flow Statement – Cash and Cash Equivalents 59 33 Amounts reported for Resource Allocation Decisions 59 34 Trading Operations 62 35 Members’ Allowances and Expenses 63 36 Officers’ Remuneration 63 37 Termination Benefits 65 38 External Audit Costs 65 39 Grant Income 66 40 Related Parties 67 41 Leases 68 42 Defined Benefit Pension Schemes 70 43 Contingent Liabilities 73 44 Subsidiary Companies 73 45 Jointly Controlled Operations 76 46 Trust Funds 76 The notes for the supplementary statements (Housing Revenue Account, Collection Fund and the Group Accounts) follow immediately after the respective Financial Statements.
14
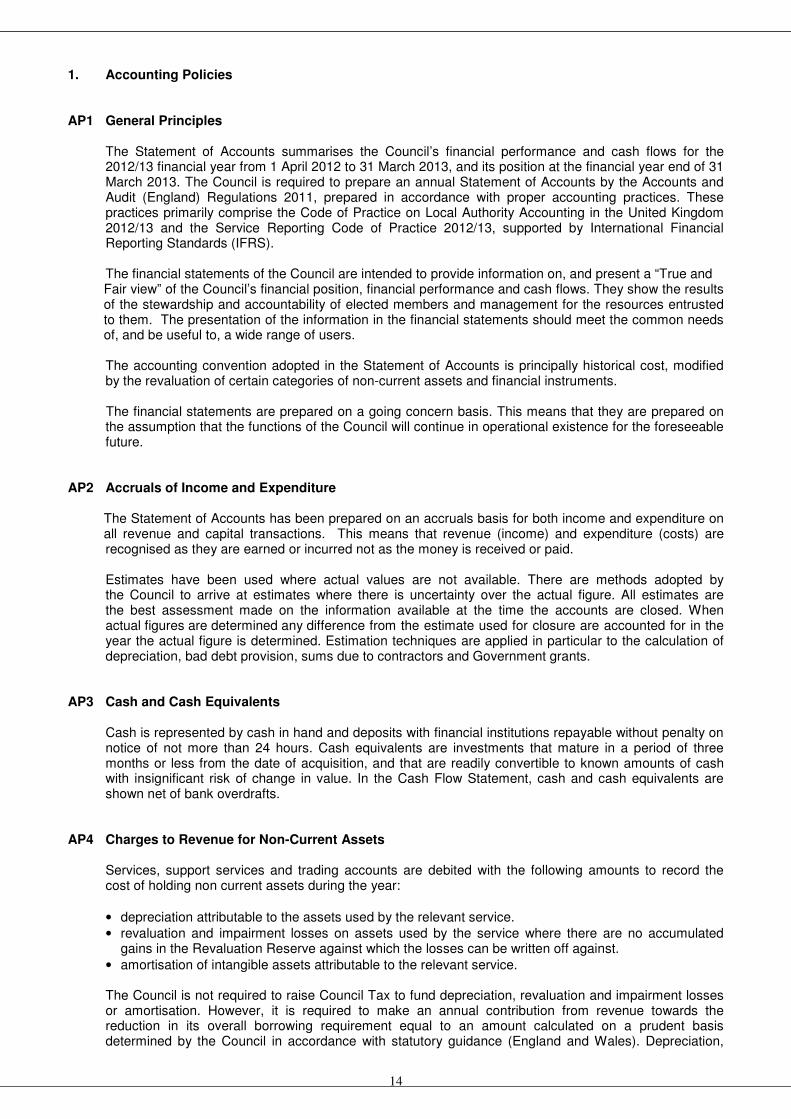
1. Accounting Policies AP1 General Principles The Statement of Accounts summarises the Council’s financial performance and cash flows for the
2012/13 financial year from 1 April 2012 to 31 March 2013, and its position at the financial year end of 31 March 2013. The Council is required to prepare an annual Statement of Accounts by the Accounts and Audit (England) Regulations 2011, prepared in accordance with proper accounting practices. These practices primarily comprise the Code of Practice on Local Authority Accounting in the United Kingdom 2012/13 and the Service Reporting Code of Practice 2012/13, supported by International Financial Reporting Standards (IFRS).
The financial statements of the Council are intended to provide information on, and present a “True and Fair view” of the Council’s financial position, financial performance and cash flows. They show the results
of the stewardship and accountability of elected members and management for the resources entrusted to them. The presentation of the information in the financial statements should meet the common needs of, and be useful to, a wide range of users.
The accounting convention adopted in the Statement of Accounts is principally historical cost, modified by the revaluation of certain categories of non-current assets and financial instruments.
The financial statements are prepared on a going concern basis. This means that they are prepared on the assumption that the functions of the Council will continue in operational existence for the foreseeable future.
AP2 Accruals of Income and Expenditure The Statement of Accounts has been prepared on an accruals basis for both income and expenditure on
all revenue and capital transactions. This means that revenue (income) and expenditure (costs) are recognised as they are earned or incurred not as the money is received or paid.
Estimates have been used where actual values are not available. There are methods adopted by the Council to arrive at estimates where there is uncertainty over the actual figure. All estimates are the best assessment made on the information available at the time the accounts are closed. When actual figures are determined any difference from the estimate used for closure are accounted for in the year the actual figure is determined. Estimation techniques are applied in particular to the calculation of depreciation, bad debt provision, sums due to contractors and Government grants. AP3 Cash and Cash Equivalents
Cash is represented by cash in hand and deposits with financial institutions repayable without penalty on notice of not more than 24 hours. Cash equivalents are investments that mature in a period of three months or less from the date of acquisition, and that are readily convertible to known amounts of cash with insignificant risk of change in value. In the Cash Flow Statement, cash and cash equivalents are shown net of bank overdrafts.
AP4 Charges to Revenue for Non-Current Assets Services, support services and trading accounts are debited with the following amounts to record the
cost of holding non current assets during the year:
• depreciation attributable to the assets used by the relevant service.
• revaluation and impairment losses on assets used by the service where there are no accumulated gains in the Revaluation Reserve against which the losses can be written off against.
• amortisation of intangible assets attributable to the relevant service.
The Council is not required to raise Council Tax to fund depreciation, revaluation and impairment losses or amortisation. However, it is required to make an annual contribution from revenue towards the reduction in its overall borrowing requirement equal to an amount calculated on a prudent basis determined by the Council in accordance with statutory guidance (England and Wales). Depreciation,

15
revaluation and impairment losses and amortisation are replaced by the contribution in the General Fund Balance, by way of an adjusting transaction with the Capital Adjustment Account in the Movement in Reserves Statement.
AP5 Exceptional items When items of income and expense are material, their nature and amount is disclosed separately, either
on the face of the Comprehensive Income and Expenditure Statement or in the notes to the accounts, depending on how significant the items are to an understanding of the Council’s financial performance.
AP6 Prior Period Adjustments, Changes in Accounting Policies and Estimates and Material Errors Prior period adjustments may arise as a result of a change in accounting policies or to correct a material
error. Changes in accounting policies are only made when required by proper accounting practices or the
change provides more reliable or relevant information about the effect of transactions, other events and conditions on the Council’s financial position or financial performance. Where a change is made, it is applied retrospectively (unless stated otherwise) by adjusting opening balances and comparative amounts for the prior period as if the new policy had always been applied.
Changes in accounting estimates are accounted for prospectively, i.e. in the current and future years affected by the change and do not give rise to a prior period adjustment.
Material errors discovered in prior period figures are corrected retrospectively by amending opening
balances and comparative amounts for the prior period.
AP7 Events after the Balance Sheet Date Events after the Balance Sheet date are those events, both favourable and unfavourable, that occur
between the end of the reporting period on 31 March and the date when the Statement of Accounts are authorised for issue. Two types of events can be identified:
• Adjusting events are those that provide evidence of conditions that existed at the Balance Sheet Date. Where material, the Statement of Accounts is adjusted to reflect the impact of such events.
• Non-adjusting events are those that are indicative of conditions that arose after the Balance Sheet Date. The Statement of Accounts is not adjusted to reflect such events, but where a category of events would have a material effect, additional disclosure is made in the notes of the nature of the events and their estimated financial effect.
Events taking place after the date the Statement of Accounts is authorised for issue are not reflected in the Statement of Accounts.
AP8 Employee Benefits Benefits Payable During Employment Short-term employee benefits are those due to be settled within 12 months of the year-end. They include
such benefits as wages and salaries, paid annual leave and paid sick leave and non-monetary benefits for current employees and are recognised as an expense for services in the year in which employees render their services to the Council.
An accrual is made for the cost of holiday entitlements, flexi time and time off in lieu earned by
employees but not taken before the year-end, which employees can carry forward into the next financial year. The accrual is made at the wage and salary rates applicable in the following accounting year, being the period in which the employee takes the benefit. The accrual is charged to Surplus/Deficit on the Provision of Services in the financial year in which the absences are accrued and it is then reversed out through the Movement in Reserves Statement so there is no charge against Council Tax.

16
Termination Benefits Termination benefits are amounts payable as a result of a decision by the Council to terminate an
officer’s employment before the normal retirement date, or an officer’s decision to accept voluntary redundancy. They are charged on an accruals basis to the relevant service line in the Comprehensive Income and Expenditure Statement when the Council is demonstrably committed to the termination of the employment of an officer or group of officers or making an offer to encourage voluntary redundancy.
Where termination benefits involve the enhancement of pensions, statutory provisions require the
General Fund balance to be charged with the amount payable by the Council to the pension fund or pensioner in the year, not the amount calculated according to the relevant accounting standards. In the Movement in Reserves Statement, appropriations are required to and from the Pensions Reserve to remove the notional debits and credits for pension enhancement termination benefits and replace them with debits for the cash paid to the pension fund and pensioners and any such amounts payable but unpaid at the year end. Post Employment Benefits
Employees of the Council are members of the Local Government Pension Scheme, administered by Essex County Council.
The Local Government Pension Scheme is accounted for as a defined benefits scheme:
• The liabilities of the Essex pension fund attributable to the Council are included in the Balance Sheet on an actuarial basis using the projected unit method – i.e. an assessment of the future payments that will be made in relation to retirement benefits earned to date by employees, based on assumptions about mortality rates, employee turnover rates, etc, and projections of projected earnings for current employees.
• Liabilities are discounted to their value at current prices, using the discount rate calculated by the actuary.
• The assets of Essex pension fund attributable to the Council are included in the Balance Sheet at their fair value: - quoted securities – current bid price - unquoted securities – professional estimate. - unitised securities – current bid price. - property – market value.
• The change in the net pensions liability is analysed into seven components: - current service cost – the increase in liabilities as a result of years of service earned this year. The
total cost is allocated in the Comprehensive Income and Expenditure Statement to the services for which the Council employees worked.
- past service costs – the increase in liabilities arising from current year decisions whose effect relates to years of service earned in earlier years. Such costs arise from decisions such as awarding added years and other forms of augmentation of benefits. These costs are debited to the Surplus/Deficit on the Provision of Services in the Comprehensive Income and Expenditure Statement and are included within Non Distributed Costs.
- interest cost – the expected increase in the present value of liabilities during the year as they move one year closer to being paid. This cost is debited to the Financing and Investment Income and Expenditure line in the Comprehensive Income and Expenditure Statement.
- expected return on assets – the annual investment return on the fund assets attributable to the Council, based on the long-term future expected return for each asset class at the beginning of the year (1
st April). This return is credited to the Financing and Investment Income and Expenditure line
in the Comprehensive Income and Expenditure Statement. - gains or losses on settlements and curtailments – the result of actions to relieve the Council of
liabilities or events that reduce the expected future service or accrual of benefits of employees. These are debited/credited to the Surplus/Deficit on the Provision of Services in the Comprehensive Income and Expenditure Statement and are included within Non Distributed Costs.
- actuarial gains and losses – changes in the net pensions liability that arise because events have not coincided with assumptions made at the last actuarial valuation or the assumptions have been updated by the actuary. These gains and losses are credited/debited to the Pensions Reserve.
- contributions paid to the Essex pension fund – cash paid as employer’s contributions to the pension fund in settlement of liabilities; not accounted for as an expense for the Council.
In relation to retirement benefits, statutory provisions require the General Fund balance to be charged with the amount payable by the Council to the pension fund or directly to pensioners in the year, not the

17
amount calculated according to the relevant accounting standards. In the Movement in Reserves Statement, this means that there are appropriations to and from the Pensions Reserve to remove the notional debits and credits for retirement benefits and replace them with debits for the cash paid to the pension fund and pensioners and any such amounts payable but unpaid at the financial year end. The negative balance that arises on the Pensions Reserve thereby measures the beneficial impact to the General Fund of being required to account for retirement benefits on the basis of cash flows rather than as benefits are earned by employees.
Discretionary Benefits The Council also has restricted powers to make discretionary awards of retirement benefits in the event
of early retirements. Any liabilities estimated to arise as a result of an award to any member of staff are accrued in the year of the decision to make the award and accounted for using the same policies as are applied to the Local Government Pension Scheme.
AP9 Financial Instruments Financial Liabilities Financial liabilities are recognised on the Balance Sheet when the Council becomes a party to the
contractual provisions of a financial instrument, and are initially measured at fair value and are carried at their amortised cost. Annual charges to the Financing and Investment Income and Expenditure line in the Comprehensive Income and Expenditure Statement for interest payable are based on the carrying amount of the liability multiplied by the effective rate of interest for the instrument. The effective interest rate is the rate that exactly discounts estimated future cash payments over the life of the instrument to the amount at which it was originally recognised.
For most of the borrowings that the Council has, this means that the amount presented in the Balance
Sheet is the outstanding principal repayable (plus accrued interest); and interest charged to the Comprehensive Income and Expenditure Statement is the amount payable for the year according to the loan agreement.
Gains and losses on the repurchase or early settlement of borrowing are credited and debited to the
Financing and Investment Income and Expenditure line in the Comprehensive Income and Expenditure Statement in the year of repurchase/settlement. However, where repurchase has taken place as part of a restructuring of the loan portfolio that involves the modification or exchange of existing instruments, the premium or discount is respectively deducted from or added to the amortised cost of the new or modified loan and the write-down to the Comprehensive Income and Expenditure Statement is spread over the life of the loan by an adjustment to the effective interest rate.
Where premiums and discounts have been charged to the Comprehensive Income and Expenditure Statement, regulations allow the impact on the General Fund Balance to be spread over future years. The Council has a policy of spreading the gain or loss over the term that was remaining on the loan against which the premium was payable or discount receivable when it was repaid. The reconciliation of amounts charged to the Comprehensive Income and Expenditure Statement to the net charge required against the General Fund Balance is managed by a transfer to or from the Financial Instruments Adjustment Account in the Movement in Reserves Statement. Financial Assets Financial assets are classified into two types:
• loans and receivables – assets that have fixed or determinable payments but are not quoted in an active market
• available-for-sale assets – assets that have a quoted market price and/or do not have a fixed or determinable payments.
Loans and Receivables
Loans and receivables are recognised on the Balance Sheet when the Council becomes a party to the
contractual provisions of a financial instrument and are initially measured at fair value. They are subsequently measured at their amortised cost. Annual credits to the Financing and Investment Income and Expenditure line in the Comprehensive Income and Expenditure Statement for interest receivable
18
are based on the carrying amount of the asset multiplied by the effective rate of interest for the instrument. For most of the loans that the Council has made, this means that the amount presented in the Balance Sheet is the outstanding principal receivable (plus accrued interest) and interest credited to the Comprehensive Income and Expenditure Statement is the amount receivable for the year in the loan agreement.
However, the Council has made a number of loans at less than market rates (soft loans). When soft
loans are made, a loss is recorded in the Comprehensive Income and Expenditure Statement (debited to the appropriate service) for the present value of the interest that will be foregone over the life of the instrument, resulting in a lower amortised cost than the outstanding principal. Interest is credited to the Financing and Investment Income and Expenditure line in the Comprehensive Income and Expenditure Statement at a marginally higher effective rate of interest than the rate receivable from the voluntary organisations, with the difference serving to increase the amortised cost of the loan in the Balance Sheet. Statutory provisions require that the impact of soft loans on the General Fund Balance is the interest receivable for the financial year. The reconciliation of amounts debited and credited to the Comprehensive Income and Expenditure Statement to the net gain required against the General Fund Balance is managed by a transfer to or from the Financial Instruments Adjustment Account in the Movement in Reserves Statement.
Where assets are identified as impaired because of a likelihood arising from a past event that payments
due under the contract will not be made, the asset is written down and a charge made to the relevant service (for receivables specific to that service) or the Financing and Investment Income and Expenditure line in the Comprehensive Income and Expenditure Statement. The impairment loss is measured as the difference between the carrying amount and the present value of the revised future cash flows discounted at the asset’s original effective interest rate.
Any gains and losses that arise on the derecognition of an asset are credited or debited to the Financing
and Investment Income and Expenditure line in the Comprehensive Income and Expenditure Statement. Available-for-Sale Assets Available-for-sale assets are recognised on the Balance Sheet when the Council becomes a party to the
contractual provisions of a financial instrument and are initially measured and carried at fair value. Where the asset has fixed or determinable payments, annual credits to the Financing and Investment Income and Expenditure line in the Comprehensive Income and Expenditure Statement for interest receivable are based on the amortised cost of the asset multiplied by the effective rate of interest for the instrument. Where there are no fixed or determinable payments, income (e.g. dividends) is credited to the Comprehensive Income and Expenditure Statement when it becomes receivable by the Council.
Assets are maintained in the Balance Sheet at fair value. Values are based on the following principles:
• instruments with quoted market prices – the market price
• other instruments with fixed and determinable payments – discounted cash flow analysis
• equity shares with no quoted market prices – independent appraisal of company valuations.
Changes in fair value are balanced by an entry in the Available-for-Sale Reserve and the gain/loss is recognised in the Surplus or Deficit on Revaluation of Available-for Sale Financial Assets. The exception is where impairment losses have been incurred – these are debited to the Financing and Investment Income and Expenditure line in the Comprehensive Income and Expenditure Statement, along with any net gain or loss for the asset accumulated in the Available-for-Sale Reserve.
Where assets are identified as impaired because of a likelihood arising from a past event that payments due under the contract will not be made (fixed or determinable payments) or fair value falls below cost, the asset is written down and a charge made to the Financing and Investment Income and Expenditure line in the Comprehensive Income and Expenditure Statement. If the asset has fixed or determinable payments, the impairment loss is measured as the difference between the carrying amount and the present value of the revised future cash flows discounted at the asset’s original effective interest rate. Otherwise, the impairment loss is measured as any shortfall of fair value against the acquisition cost of the instrument (net of any principal repayment and amortisation). Any gains and losses that arise on the de-recognition of the asset are credited or debited to the Financing and Investment Income and Expenditure line in the Comprehensive Income and Expenditure Statement, along with any accumulated gains or losses previously recognised in the Available-for-Sale Reserve.

19
Where fair value cannot be measured reliably, the instrument is carried at cost (less any impairment losses).
AP10 Foreign Currency Translation Where the Council has entered into a transaction denominated in a foreign currency, the transaction is
converted into sterling at the exchange rate applicable on the date the transaction was effective. Where amounts in foreign currency are outstanding at the financial year end, they are reconverted at the spot exchange rate at 31 March. Resulting gains or losses are recognised in the Financing and Investment Income and Expenditure line in the Comprehensive Income and Expenditure Statement.
AP11 Borrowing Costs
Borrowing costs include interest and other costs that the Council incurs in connection with the borrowing of funds. The Council’s policy is to charge borrowing costs as expenses as they are incurred. These costs are included within the Financing and Investment Income and Expenditure section of the Comprehensive Income and Expenditure Statement.
AP12 Minimum Revenue Provision
The Council is required to pay off an element of the accumulated General Fund capital spend each year (the Capital Financing Requirement - CFR) through a revenue charge (the minimum revenue provision - MRP), although it is also allowed to undertake additional voluntary payments if required. For capital expenditure incurred before 1 April 2008 or which in the future will be Supported Capital Expenditure, the Council’s MRP policy follows the existing practice outlined in former CLG regulations (option 1). This option provides for an approximate 4% reduction in the borrowing need (CFR) each year. From 1 April 2008 for all unsupported borrowing (including finance leases) the MRP policy is the Asset Life Method (option 3) – MRP will be charged over a period which is reasonably commensurate with the estimated useful life of the assets, using the equal annual instalment method. This provides for a reduction in the borrowing need over the asset’s life. Repayments included in finance leases are applied as MRP.
AP13 Government Grants and Contributions Whether paid on account, by instalments or in arrears, government grants and third party contributions
and donations are recognised as due to the Council when there is reasonable assurance that:
• the Council will comply with the conditions attached to the payments, and
• the grants or contributions will be received. Amounts recognised as due to the Council are not credited to the Comprehensive Income and
Expenditure Statement until conditions attached to the grant or contribution have been satisfied. Conditions are stipulations that specify that the future economic benefits or service potential embodied in the asset acquired using the grant or contribution are required to be consumed by the recipient as specified, or future economic benefits or service potential must be returned to the transferor.
Monies advanced as grants and contributions for which conditions have not been satisfied are carried in
the Balance Sheet as creditors. When conditions are satisfied, the grant or contribution is credited to the relevant service line or Taxation and Non-Specific Grant Income in the Comprehensive Income and Expenditure Statement.
Where capital grants are credited to the Comprehensive Income and Expenditure Statement, they are
reversed out of the General Fund Balance in the Movement in Reserves Statement. Where the grant has yet to be used to finance capital expenditure, it is posted to the Capital Grants Unapplied reserve. Where it has been applied, it is posted to the Capital Adjustment Account. Amounts in the Capital Grants Unapplied reserve are transferred to the Capital Adjustment Account when they have been applied to fund capital expenditure.

20
AP14 Leases
Leases are classified as finance leases where the terms of the lease transfer substantially all the risks and rewards incidental to ownership of the property, plant or equipment from the lessor to the lessee. All other leases are classified as operating leases.
Where a lease covers both land and buildings, the land and buildings elements are considered
separately for classification. Arrangements that do not have the legal status of a lease but convey a right to use an asset in return for
payment are accounted for under this policy where fulfilment of the arrangement is dependent on the use of specific assets. Finance Leases - Council as Lessee
Property, Plant and Equipment held under finance leases is recognised on the Balance Sheet at the commencement of the lease at the lower of its fair value measured at the lease’s inception and the present value of the minimum lease payments. The asset recognised is matched by a liability for the obligation to pay the lessor. Initial direct costs of the Council are added to the carrying amount of the asset. Premiums paid on entry into a lease are applied to writing down the lease liability. Contingent rents are charged as expenses in the periods in which they are incurred.
Finance lease payments are apportioned between:
• a charge for the acquisition of the interest in the property, plant or equipment which is applied to write down the lease liability, and
• a finance charge which is debited to the Financing and Investment Income and Expenditure line in the Comprehensive Income and Expenditure Statement.
Property, Plant and Equipment recognised under finance leases is accounted for using the policies applied generally to such assets, subject to depreciation being charged over the lease term if this is shorter than the asset’s estimated useful life and where ownership of the asset does not transfer to the Council at the end of the lease period. The Council is not required to raise Council Tax to cover depreciation or revaluation and impairment losses arising on leased assets. Instead, a prudent annual contribution is made from revenue funds towards the deemed capital investment in accordance with statutory requirements. Depreciation, revaluation and impairment losses are substituted by a revenue contribution in the General Fund Balance, by way of an adjusting transaction with the Capital Adjustment Account in the Movement in Reserves Statement. Operating Leases – Council as Lessee Rentals paid under operating leases are charged to the Comprehensive Income and Expenditure Statement as an expense of the services benefitting from use of the leased property, plant or equipment. Charges are made on a straight-line basis over the life of the lease.
Finance Leases – Council as Lessor Where the Council grants a finance lease over a property or an item of plant or equipment, the relevant asset is written out of the Balance Sheet as a disposal. At the commencement of the lease, the carrying amount of the asset in the Balance Sheet (whether Property, Plant and Equipment or Assets Held for Sale) is written off to the Other Operating Expenditure line in the Comprehensive Income and Expenditure Statement as part of the gain or loss on disposal. The written-off value is not considered to be a charge against Council Tax and as such is appropriated to the Capital Adjustment Account from the General Fund Balance in the Movement in Reserves Statement. A gain on disposal, representing the Council’s net investment in the lease, is credited to the Other Operating Expenditure line in the Comprehensive Income and Expenditure Statement, matched by a long-term debtor asset in the Balance Sheet. The gain is not permitted by statute to increase the General Fund Balance and is required to be treated as a capital receipt. Where a premium has been received, this is posted out of the General Fund Balance to the Capital Receipts Reserve in the Movement in Reserves Statement.

21
Finance lease rentals receivable are apportioned between:
• a charge for the acquisition of the interest in the property which is applied to write down the lease debtor including any premiums received, and
• finance income which is credited to the Financing and Investment Income and Expenditure line in the Comprehensive Income and Expenditure Statement.
Where the amount due in relation to the lease asset is to be settled by the payment of rentals in future financial years, this is posted out of the General Fund Balance to the Deferred Capital Receipts Reserve in the Movement in Reserves Statement. When the future rentals are received, the element for the capital receipt for the disposal of the asset is used to write down the lease debtor. At this point, the deferred capital receipts are transferred to the Usable Capital Receipts Reserve.
Operating Leases – Council as Lessor Where the Council grants an operating lease over a property or an item of plant or equipment, the asset is retained in the Balance Sheet. Rental income is credited to the Comprehensive Income and Expenditure Statement on a straight-line basis over the life of the lease.
AP15 Overheads and Support Services These expenses have been collected and charged to services in accordance with agreements made with the Heads of Services using a number of bases including actual staff time spent, unit costs and fixed retainers. There is a full recharge to service accounts in accordance with the Service Reporting Code of Practice (SeRCOP). The exceptions, provided for in the code, are costs related to Corporate and Democratic Core and
certain Non Distributed Costs. These are shown as specific lines in the Comprehensive Income and Expenditure Statement and are not generally recharged to services. However, recharges are made from these two areas specifically to the Housing Revenue Account in accordance with the principles set out in SeRCOP.
AP16 Property, Plant and Equipment Assets that have physical substance and are held for use in the production or supply of goods or
services, for rental to others, or for administrative purposes and that are expected to be used during more than one financial year are classified as Property, Plant and Equipment.
Recognition Expenditure on the acquisition, creation or enhancement of Property, Plant and Equipment is capitalised
on an accruals basis, provided that it is probable that the future economic benefits or service potential associated with the item will flow to the Council and the cost of the item can be measured reliably. Expenditure that maintains but does not add to an asset’s potential to delivery future economic benefits or service potential (i.e. repairs and maintenance) is charged as an expense when it is incurred. Measurement Assets are initially measured at cost, comprising:
• the purchase price.
• any costs attributable to bringing the asset to the location and condition necessary for it to be capable of operating in the manner intended by management.
• the initial estimate of the costs of dismantling and removing the item and restoring the site on which it is located.
The Council does not capitalise borrowing costs incurred whilst assets are under construction. The cost of assets acquired other than by purchase is deemed to be its fair value, unless the acquisition does not have commercial substance (i.e. it will not lead to a variation in the cash flows of the Council). In the latter case, where an asset is acquired via an exchange, the cost of the acquisition is the carrying amount of the asset given up by the Council.

22
Donated assets are measured initially at fair value. The difference between fair value and any consideration paid is credited to the Taxation and Non-Specific Grant Income line of the Comprehensive Income and Expenditure Statement, unless the donation has been made conditionally. Until conditions are satisfied, the gain is held in the Donated Assets Account. Where gains are credited to the Comprehensive Income and Expenditure Statement, they are reversed out of the General Fund Balance to the Capital Adjustment Account in the Movement in Reserves Statement. Assets are then carried in the Balance Sheet using the following measurement bases:
• Plant, Vehicles, Furniture and Equipment assets, Infrastructure assets, Community assets and Assets under construction – Depreciated Historical Cost.
• Council dwellings – Fair Value which is determined using the basis of Existing Use Value for Social Housing (EUV-SH).
• Other land and buildings and Surplus Assets – Fair Value, determined as the amount that would be paid for the asset in its Existing Use (EUV).
Where there is no market-based evidence of fair value because of the specialist nature of an asset, depreciated replacement cost (DRC) is used as an estimate of Fair Value. Assets included in the Balance Sheet at fair value are revalued sufficiently regularly to ensure that their carrying amount is not materially different from their Fair Value at the financial year end, but as a minimum every five years. Increases in valuations are matched by credits to the Revaluation Reserve to recognise unrealised gains. Exceptionally, gains might be credited to the Comprehensive Income and Expenditure Statement where they arise from the reversal of a loss previously charged to a service. Where decreases in value are identified, they are accounted for as follows:
• where there is a balance of revaluation gains for the asset in the Revaluation Reserve, the carrying amount of the asset is written down against that balance (up to the amount of the accumulated gains).
• where there is no balance in the Revaluation Reserve or an insufficient balance, the carrying amount of the asset is written down against the relevant service line(s) in the Comprehensive Income and Expenditure Statement.
The Revaluation Reserve contains revaluation gains recognised since 1 April 2007 only, the date of its formal implementation. Gains arising before that date have been consolidated into the Capital Adjustment Account. Impairment Assets are assessed at each financial year end as to whether there is any indication that an asset may be impaired. Where indications exist and any possible differences are estimated to be material, the recoverable amount of the asset is estimated and, where this is less than the carrying amount of the asset, an impairment loss is recognised for the shortfall. Where impairment losses are identified, they are accounted for as follows:
• where there is a balance of revaluation gains for the asset in the Revaluation Reserve, the carrying amount of the asset is written down against that balance (up to the amount of the accumulated gains).
• where there is no balance in the Revaluation Reserve or an insufficient balance, the carrying amount of the asset is written down against the relevant service line(s) in the Comprehensive Income and Expenditure Statement.
Where an impairment loss is reversed subsequently, the reversal is credited to the relevant service line(s) in the Comprehensive Income and Expenditure Statement, up to the amount of the original loss, adjusted for depreciation that would have been charged if the loss had not been recognised.
23
Depreciation Depreciation is provided for on all Property, Plant and Equipment assets by the systematic allocation of their depreciable amounts over their useful lives. An exception is made for assets without a determinable finite useful life (i.e. freehold land and certain Community Assets) and assets that are not yet available for use (i.e. assets under construction). Depreciation is calculated on the following bases:
• dwellings and other buildings – straight-line allocation over the useful life of the property as estimated by the valuer.
• vehicles, plant, furniture and equipment – straight-line allocation over 3-10 years.
• infrastructure – straight-line allocation over 20 years.
Where an item of Property, Plant and Equipment asset has major components whose cost is significant in relation to the total cost of the item, the components are depreciated separately. All HRA assets are componentised. The major components identified for HRA building assets are the host structure and mechanical & electrical components. All General Fund building assets with a carrying value of £300,000 are componentised. Significant components are defined as those that represent 10% of the total carrying value of the building asset.
When a component of an asset is replaced or restored (i.e. enhancements), the carrying amount of the old component is derecognised to avoid double counting and the new component reflected in the carrying value of the asset.
Revaluation gains are also depreciated, with an amount equal to the difference between current value depreciation charged on assets and the depreciation that would have been chargeable based on their historical cost being transferred each year from the Revaluation Reserve to the Capital Adjustment Account.
AP17 Heritage Assets
Heritage assets are those assets with historical, artistic, scientific, technological, geophysical or environmental qualities which are held, maintained and preserved principally for their contribution to knowledge and culture. The heritage assets which the Council holds are its collections of civic regalia, works of art, museum exhibits and Colchester Castle. Collection of Civic Regalia
The Council’s civic regalia collection has been recognised on the Balance Sheet from 1 April 2011. The collection is relatively static and acquisitions are rare. Acquisitions are initially recognised at their cost and subsequently revalued at their insurance values. Civic regalia assets are valued as at 1 April and a full revaluation of this collection is carried out every five years to ensure that the asset valuations are kept up to date and remain current. The assets are valued at their insurance valuations. Revaluation gains and losses made on these assets are treated in accordance with the Council’s accounting policy on property, plant and equipment (AP16). Depreciation is not charged on the civic regalia assets as they are considered to have indefinite lives.
At each year end the civic regalia assets are reviewed for any impairment. These impairment reviews are performed to identify any physical damage, deterioration or issues that have arisen which relate to the authenticity of the assets in the collection. Any impairments are recognised and measured in accordance with the Council’s general policy on impairment (refer to AP16).

24
Collection of Museum Exhibits and Works of Art The Council’s collections of museum exhibits and works of art held at 1 April 2011 have not been recognised in the Council’s Balance Sheet. Information on the cost of these assets in this collection is not available, and the Council has concluded that total cost of obtaining valuation information for these assets outweighs the benefits to the users of the financial statements. Disclosures regarding these heritage assets are included in Note 15. Acquisitions made from 1 April 2011 onwards are initially recognised at their cost. The Council’s capitalisation limit of £10,000 is applied to these assets. Assets which cost less than £10,000 are charged through revenue and are not capitalised as assets on the Council’s Balance Sheet.
The assets acquired in these collections from 1 April 2011 are to be valued as at 1 April and a full revaluation of these assets is carried out every five years to ensure the asset valuations are kept up to date and remain current. The assets are valued at their insurance valuations. Revaluation gains and losses made on these assets are treated in accordance with the Council’s accounting policy on property, plant and equipment (AP16).
Depreciation is not charged on these assets as they are considered to have indefinite lives. At each year end the collection items capitalised on the Council’s Balance Sheet are reviewed for any impairment. These impairment reviews are performed to identify any physical damage, deterioration or issues that have arisen which relate to the authenticity of the assets in the collection. Any impairments are recognised and measured in accordance with the Council’s general policy on impairment (refer to AP16). Colchester Castle Colchester Castle is a building held by the Council principally for its contribution to knowledge and culture. The castle has not been recognised in the Council’s Balance Sheet as information on the cost of this building is not available and an appropriate valuation of this heritage asset cannot be obtained due to its unique nature. Disclosures regarding this heritage asset are included in Note 15.
AP18 Investment Properties Investment properties are those that are used solely to earn rentals and/or for capital appreciation. The
definition is not met if the property is used in any way to facilitate the delivery of services or production of goods or if the asset is held for sale.
Investment properties are measured initially at cost and subsequently at fair value, based on the amount
at which the asset could be exchanged between knowledgeable parties at arm’s length. Properties are not depreciated but are revalued annually according to market conditions at the year end. Gains and losses on revaluation are posted to the Financing and Investment Income and Expenditure line in the Comprehensive Income and Expenditure Statement. The same treatment is applied to gains and losses on disposal.
Rentals received in relation to investment properties are credited to and directly operating expenses
related to investment properties are debited to the Financing and Investment Income line in the Comprehensive Income and Expenditure Statement.
Revaluation and disposal gains and losses are not permitted by statutory arrangements to have an impact on the General Fund Balance. These gains and losses are therefore reversed out of the General Fund Balance in the Movement in Reserves Statement and posted to the Capital Adjustment Account and to the Capital Receipts Reserve in respect of the sale proceeds.
AP19 Assets Held for Sale
When it becomes probable that the carrying amount of an asset will be recovered principally through a sale transaction rather than through its continuing use, it is reclassified as an Asset Held for Sale. The asset is revalued immediately before reclassification and then carried at the lower of this amount and fair value less costs to sell. Where there is a subsequent decrease to fair value less costs to sell, the loss is
25
posted to the Other Operating Expenditure line of the Surplus/Deficit on the Provision of Services in the Comprehensive Income and Expenditure Statement. Gains in fair value are recognised only up to the amount of any previous losses recognised in the Surplus/Deficit on Provision of Services. Depreciation is not charged on Assets Held for Sale. If assets no longer meet the criteria to be classified as Assets Held for Sale, they are reclassified back to non-current assets and valued at the lower of their carrying amount before they were classified as held for sale; adjusted for depreciation, amortisation or revaluations that would have been recognised had they not been classified as Held for Sale, and their recoverable amount at the date of the decision not to sell.
Assets that are to be abandoned or scrapped are not reclassified as Assets Held for Sale.
AP20 Disposals of Plant, Property and Equipment, Investment Properties and Assets held for Sale
When an asset is disposed of or decommissioned, the carrying amount of the asset in the Balance Sheet (whether Property, Plant and Equipment, Investment Properties or Assets Held for Sale) is written off to the Other Operating Expenditure line in the Comprehensive Income and Expenditure statement as part of the gain or loss on disposal. Receipts from disposals are credited to the same line in the Comprehensive Income and Expenditure Statement also as part of the gain or loss on disposal (i.e. netted off against the carrying value of the asset at the time of disposal). Any revaluation gains accumulated for the asset in the Revaluation Reserve are transferred to the Capital Adjustment Account. Amounts for a disposal in excess of £10,000 are categorised as capital receipts. A proportion of receipts relating to housing disposals (net of statutory deductions and allowances) are payable to the Government. The balance of receipts is required to be credited to the Capital Receipts Reserve, and can then only be used for new capital investment or set aside to reduce the Council’s underlying need to borrow (the capital financing requirement). Receipts are appropriated to the Reserve from the General Fund Balance in the Movement in Reserves Statement. When mortgage loans are granted to purchasers of Council houses, this creates deferred capital receipts. These are reduced annually by the amount of principal repayments received from the mortgagors and any sums received by way of early repayment. The written-off value of disposals is not a charge against Council Tax, as the cost of fixed assets is fully provided for under separate arrangements for capital financing. Amounts are appropriated to the Capital Adjustment Account from the General Fund Balance in the Movement in Reserves Statement.
AP21 Intangible Assets Expenditure on non-monetary assets that do not have physical substance but are controlled by the
Council as a result of past events (e.g. software licences) is capitalised when it is expected that future economic benefits or service potential will flow from the intangible asset to the Council.
Intangible assets are measured initially at cost. Amounts are only revalued where the fair value of the
assets held by the Council can be determined by reference to an active market. In practice, no intangible assets are held by the Council which meets this criterion, and they are therefore carried at amortised cost.
The depreciable amount of an intangible asset is amortised over its useful life to the relevant service
lines in the Comprehensive Income and Expenditure Statement. An intangible asset is tested for impairment whenever there is an indication that the asset might be
impaired, any losses recognised are posted to the relevant service lines in the Comprehensive Income and Expenditure Statement.
Any gain or loss arising on the disposal or abandonment of an intangible asset is posted to the Other
Operating Expenditure line in the Comprehensive Income and Expenditure Statement.
Where expenditure on intangible assets qualifies as capital expenditure for statutory purposes, amortisation, impairment losses and disposal gains and losses are not permitted to have an impact on the General Fund Balance. The gains and losses are therefore reversed out of the General Fund

26
Balance in the Movement in Reserves Statement and posted to the Capital Adjustment Account and (for any sale proceeds greater than £10,000) the Capital Receipts Reserve.
AP22 Inventories Inventories are included in the Balance Sheet at the lower of cost and net realisable value (e.g. sale
price). The cost of inventories is assigned using the First in First Out costing formula. Inventories that have been acquired through a non-exchange transaction are measured at their fair value as at the date of acquisition. Inventories that are provided at no charge or for a nominal charge are valued at the lower of cost and current replacement cost. Inventories that are purchased on deferred settlement terms the difference between the purchase price
for normal credit terms and the amount paid is recognised as interest over the period of the credit in Surplus/Deficit on the Provision of Services.
AP23 Provisions Provisions are made where an event has taken place that gives the Council a legal or constructive
obligation that probably requires settlement by a transfer of economic benefits or service potential, and a reliable estimate can be made of the amount of the obligation.
Provisions are charged as an expense to the appropriate service line in the Comprehensive Income and
Expenditure Statement in the year that the Council becomes aware of the obligation, and are measured at the best estimate at the Balance Sheet date of the expenditure required to settle the obligation, taking into account relevant risks and uncertainties.
When payments are eventually made, they are charged to the provision carried in the Balance Sheet.
Estimated settlements are reviewed at the end of each financial year, where it becomes less than probable that a transfer of economic benefits will now be required (or a lower settlement than anticipated is made) the provision is reversed and credited back to the relevant service.
Where some or all of the payment required to settle a provision is expected to be recovered from another
party, this is only recognised as income for the relevant service if it is virtually certain that reimbursement will be received if the Council settles the obligation.
AP24 Contingent Liabilities A contingent liability arises where an event has taken place that gives the Council a possible obligation
whose existence will only be confirmed by the occurrence or otherwise of uncertain future events not wholly within the control of the Council. Contingent liabilities also arise in circumstances where a provision would otherwise be made but either it is not probable that an outflow of resources will be required or the amount of the obligation cannot be measured reliably.
Contingent liabilities are not recognised in the Balance Sheet but disclosed in a note to the accounts
(refer to Note 43). AP25 Reserves The Council has the power to keep reserves for certain purposes by setting aside specific amounts as
reserves for future policy purposes or to cover contingencies. Reserves are created by appropriating amounts out of the General Fund Balance in the Movement in Reserves Statement. When expenditure is incurred that is to be financed from a reserve, it is charged to the appropriate service in that year to be included as expenditure in the Surplus/Deficit on the Provision of Services in the Comprehensive Income and Expenditure Statement. The reserve is then appropriated back into the General Fund Balance in the Movement in Reserves Statement so there is no charge against Council Tax for the expenditure incurred.

27
Separate earmarked reserves are held by the Council for Renewal and Repairs, Insurance, Capital Expenditure, Regeneration, Asset Replacement, Heritage and Gosbecks. Details of these are given in Note 10.
Certain reserves are kept by the Council to manage the accounting processes for non-current assets
(e.g. Revaluation Reserve and Capital Adjustment Account), financial instruments (e.g. Financial Instruments Adjustment Account), retirement benefits (e.g. Pensions Reserve) and employee benefits (e.g. Accumulated Absences Account) and do not represent usable resources for the Council. Details of these are given in Note 28.
AP26 Revenue Expenditure Funded from Capital under Statute Expenditure incurred during the year that may be capitalised under statutory provisions but that does not
result in the creation of a non-current asset has been charged as expenditure to the relevant service in the Comprehensive Income and Expenditure Statement in the year. Where the Council has determined to meet the cost of this expenditure from existing capital resources or by borrowing, a transfer in the Movement in Reserves Statement from the General Fund Balance to the Capital Adjustment Account then reverses out the amounts charged so that there is no impact on the level of Council Tax.
AP27 Jointly Controlled Operations Jointly controlled operations are activities undertaken by the Council in conjunction with other venturers
that involve the use of the assets and resources of the venturers rather than the establishment of a separate entity.
The Council recognises on its Balance Sheet the assets that it controls and the liabilities that it incurs
and debits and credits the Comprehensive Income and Expenditure Statement with the expenditure it incurs and the share of income it earns from the activities of these operations.
AP28 Interests in Companies The Council has material interests in companies that have the nature of the subsidiaries and require the
Council to prepare group accounts. Group Accounts are prepared to include the accounts of the wholly owned subsidiaries of the Council
(Colchester Borough Homes Limited and Colchester Community Stadium Limited), the Port Health Authority and several Trust Funds. The Group Accounts are prepared on the basis of implementing the 2012/13 IFRS Code of Practice on Local Authority Accounting.
AP29 Value Added Tax (VAT) VAT payable is included as an expense only to the extent that it is not recoverable from Her Majesty’s
Revenue and Customs. VAT receivable is excluded from income. The Council is allowed to recover VAT incurred on expenses where income from the activity is exempt provided it is ‘insignificant’. The current test for insignificance is that the VAT incurred and recovered on exempt activities is less than 5% of the total VAT that is incurred on all the Council’s activities. If the amount exceeds the limit then none of the tax can normally be recovered.

28
2. Accounting Standards that have been issued but have not yet been adopted The IFRS Code of Practice on Local Authority Accounting in the United Kingdom 2013/14 (the Code) has introduced changes to the accounting requirements relating to the IFRS 7 Financial Instruments Standard and the IAS 19 Employee Benefits Standard, which will need to be adopted fully by the Council in its 2013/14 Statement of Accounts. The changes made to the IFRS 7 Financial Instruments standard relate to the offsetting of financial assets and financial liabilities. The Council does not currently offset any of its financial liabilities against its financial assets. Following a review of the Council’s financial assets and liabilities as at 31
st March 2013 and it planned future
activity, it is considered unlikely that the changes made to the IFRS 7 accounting standard will have a material impact on the Council’s Statement of Accounts. The Council is required to disclose information relating to the impact of the IAS 19 – Employee Benefits amendments on its 2012/13 Statement of Accounts. The actuaries of the Council’s Pension Scheme have provided the following disclosure information which shows the impact of the revised IAS 19 standard if these changes had been applied in the 2012/13 Statement of Accounts:
2012/13
£’000
Amounts recognised in the Comprehensive Income and Expenditure Statement
Current Service Cost 3,896
Net Interest in the Defined Liability 3,808
Administration Expenses 25
Total 7,729
Actual return on Scheme Assets 12,485
The main changes to the IAS 19 standard which will be applied in the Council’s 2013/14 Statement of Accounts are:
• Removal of the value of the expected return on assets. This value will be replaced by a net interest cost comprising of the interest income on the assets and the interest expense on the liabilities, which will be calculated using the discount rate set by the actuary.
• The definition for the current service cost value will be amended to include the following values - the current service cost, past service cost, curtailments and settlements.
• Administration expenses will be included within the Comprehensive Income and Expenditure Statement. Previously these expenses were made as deduction to the actual and expected rate of returns on assets.
3. Critical judgements in applying accounting policies In applying the accounting policies set out in Note 1, the Council has had to make certain judgements about complex transactions or those involving uncertainty about future events. The Council has £4 million deposited with the Icelandic bank Landsbanki, which went into administration in October 2008. Following the Icelandic Supreme Court recognising local authority deposits as priority claims in the winding up of the Icelandic banks, distributions of part of the claims have been made to creditors in February, May and October 2012. The investments are impaired in the accounts in accordance with CIPFA’s latest guidance on the impairment of deposits with Icelandic banks (LAAP Bulletin 82 Update 7). 4. Assumptions made about the future and other major sources of estimation uncertainties The Statement of Accounts contains estimated figures that are based on assumptions made by the Council about the future or events that are otherwise uncertain. Estimates are made taking into account historical experience, current trends and other relevant factors. However, because balances cannot be determined with certainty, actual results could be materially different from the assumptions and estimates. The items in the Council’s Balance Sheet at 31 March 2013 for which there is a significant risk of material adjustment in the forthcoming financial year are as follows:

29
Item and Uncertainties Effect if Actual Results Differ from Assumptions Property, Plant and Equipment Assets are depreciated over useful lives which are dependent on assumptions about the level of planned repairs and maintenance that will be carried out in relation to individual assets. Whilst the Council has made allowances for refurbishment and ongoing maintenance of its assets, the current economic climate and reduced levels of funding could impact on the Council’s spending plans. This could then have an impact on the expected lives of the assets held by the Council.
If the useful life of assets were to reduce, the annual depreciation charges on these assets would increase and the carrying amount of the assets in the Balance Sheet would decrease. It is estimated that the annual depreciation charge would increase by £0.422 million if the useful lives of the Council’s assets were reduced by 1 year. It should be noted that depreciation charges recognised in the Comprehensive Income and Expenditure Account are reversed out through the Movement in Reserves Statement and do not impact on the General Fund and Housing Revenue Account balances.
Net Pension Liability Estimation of the net liability to pay pensions depends on a number of complex judgements relating to the discount rate used, the rate at which salaries are projected to increase, changes in retirement ages, mortality rates and expected returns on pension fund assets. An independent firm of consulting actuaries, Barnett Waddingham, is engaged to provide expert advice regarding the assumptions applied in calculating the net pension liability included in the Statement of Accounts.
The effect on the net pension liability of changes in individual assumptions can be measured. For example - a 0.1% increase in the discount rate assumption would result in a decrease in the net pension liability of £3.9 million.
Arrears on Debtors At 31 March 2013, the Council has included in its accounts a provision for the impairment of doubtful debts of £6.1 million. However, in the current economic climate this allowance may not be sufficient.
If collection rates were to deteriorate, an increase in the impairment for doubtful debts of 10% would require the Council to set aside an additional £0.49 million for the bad debt provision. Other separate bad debt provisions are made by the Council which relate to other specific categories of debtors, such as Council Tax payers, Housing rent payers and Housing benefit overpayments.
5. Exceptional items No exceptional items have been identified for the 2012/13 financial year. In 2011/12 as a result of the abolition of the HRA subsidy system under the National Reform of Council Housing Finance, the Council was required to make a one-off “settlement” payment to the Department for Communities and Local Government. The payment of £73.694 million was made on the 28 March 2012, and was financed by new long-term borrowing from the Public Works Loans Board. This payment is considered to be an exceptional item and has been shown separately on the face of the Comprehensive Income and Expenditure Statement in the 2011/12 comparatives. In 2011/12 the Council reached a confidential agreement in respect of outstanding issues in relation to the Visual Arts Facility, known as firstsite. The accounts reflect this agreement, including arrangements with partner

30
organisations as set out in funding agreements, and associated legal costs within the Comprehensive Income and Expenditure Statement. 6. Material items of income and expense Revaluations were performed for a selected portfolio of the Council’s general fund assets at 1 April 2012. From review of the results of this revaluation exercise it was identified that a material revaluation loss of £1.2 million was incurred against the Medical Reception buildings transferred to the Council from the Ministry of Defence. This revaluation loss has been taken to the ‘Planning services’ line in the Comprehensive Income and Expenditure Statement. This loss has then been transferred from the General Fund to the Capital Adjustment Account in the Movement in Reserves Statement, in accordance with statutory regulations. In 2012/13 the Council incurred expenditure of £7.0 million on its dwelling stock, which related to the replacement of existing components of the buildings. This expenditure was incurred in order to maintain the housing stock at the decent home standard prescribed by the Government. The original cost of the components estimated at £0.5 million has been derecognised in the 2012/13 accounts. The remaining balance of this expenditure (£6.5 million) has been treated as a revaluation loss in the year and has been taken to Housing Revenue Account. This loss has then been reversed out in the Movement in Reserves Statement to the Capital Adjustment Account, in accordance with statutory regulations. 7. Prior period adjustments No prior period adjustments have been made to the 2011/12 comparatives disclosed in the core financial statements. 8. Events after the Balance Sheet Date The Statement of Accounts were authorised for issue by the Chief Financial Officer on 24 September 2013 (refer to page 8). Events taking place after this date are not reflected in the financial statements or notes. When the new arrangements for the retention of business rates comes into effect on 1 April 2013, local authorities will assume the liability for refunding ratepayers who have successfully appealed against the rateable value of their properties on the rating list. This will include amounts that were paid to Central Government in 2012/13 and previous years. When authorities assume these liabilities on 1 April 2013, a provision will need to be recognised. The Council's respective share of the liability as at 31st March 2013 is estimated as £1.545m, which is based on data included within the Council's NNDR1 return. This is considered to be a non-adjusting post balance sheet event in the 2012/13 accounts, and as a result no adjustments have been made to the accounts. The figures quoted in Note 19 concerning capital commitments at 31 March 2013 relate to contracts that were in place at that date. A number of the contracts relating to Decent Homes and Upgrades to Council Stock and Specific Adaptations to Housing Stock have subsequently ended. However, new contractual arrangements will be entered into during 2013/14. This is considered to be a non-adjusting post balance sheet event in the 2012/13 accounts, and as a result no adjustments have been made to the accounts. There are no further items which arose after the year end of 31 March 2013 that would materially affect these accounts and as such no adjustments have been made to the figures in the financial statements or notes. 9. Adjustments between accounting basis and funding basis under regulations This note details the adjustments that are made to the total comprehensive income and expenditure recognised by the Council in the year in accordance with proper accounting practice to the resources that are specified by statutory provisions as being available to the Council to meet future capital and revenue expenditure. The following sets out a description of the reserves that the adjustments are made against:
31
General Fund Balance The General fund is the statutory fund into which all the receipts of the Council are required to be paid and out of which all liabilities of the Council are to be met, except to the extent that statutory rules might provide otherwise. These rules can also specify the financial year in which liabilities and payments should impact on the General Fund Balance, which is not necessarily in accordance with proper accounting practice. The General Fund Balance therefore summarises the resources that the Council is statutorily empowered to spend on its services or on capital investment at the end of the financial year. This balance is not available to be applied to funding HRA services. Housing Revenue Account Balance The Housing Revenue Account Balance reflects the statutory obligation to maintain a revenue account for local authority council housing provision in accordance with Part VI of the Local Government and Housing Act 1989. It contains the balance of income and expenditure in connection with the Council’s landlord function. Capital Receipts Reserve The Capital Receipts Reserve holds the proceeds from the disposal of land and other assets, which are restricted by statute from being used other than to fund new capital expenditure or to be set aside to finance historical capital expenditure. The balance on the reserve shows the resources that have yet to be applied for these purposes at the year end. Major Repairs Reserve The Council is required to maintain the Major Repairs Reserve, which controls the application of the Major Repairs Allowance (MRA). The MRA is restricted to being applied to new capital investment in HRA assets or the financing of historical capital expenditure by the HRA. The balance shows the MRA that has yet to be applied at the year end. Capital Grants Unapplied Account The Capital Grants Unapplied Account holds the grants and contributions received towards capital projects for which the Council has met the conditions that would otherwise require repayment of the monies but which have yet to be applied to meet expenditure. The balance is restricted by grant terms as to the capital expenditure against which it can be applied and /or the financial year in which this can take place.
Usable Reserves 2012/13
Gen
era
l F
un
d
Bala
nce
Ho
usin
g
Reven
ue
Acco
un
t
Cap
ital
Receip
ts
Reserv
e
Majo
r R
ep
air
s
Reserv
e
Cap
ital
Gra
nts
U
nap
plied
A
cco
un
t M
ovem
en
t in
Un
usab
le
Reserv
es
£’000 £’000 £’000 £’000 £’000 £’000 Capital Adjustment Account:
Reversal of items debited or credited to the Comprehensive Income and Expenditure Statement:
Charges for depreciation of non current assets 3,671 - - - - (3,671)
Charges for impairment of non current assets 81 - - - - (81)
Derecognition of non current assets 258 498 - - - (756)
Revaluation losses on Property, Plant and Equipment
3,727 6,514 - - - (10,241)
Revaluation losses on Heritage Assets 82 - - - - (82)
Reversal of previously recognised revaluation losses
(6) (717) - - - 723
Amounts of non current assets written off on disposal or sale as part of the gain/loss on disposal to the Comprehensive Income and Expenditure Statement
156 185 - - - (341)
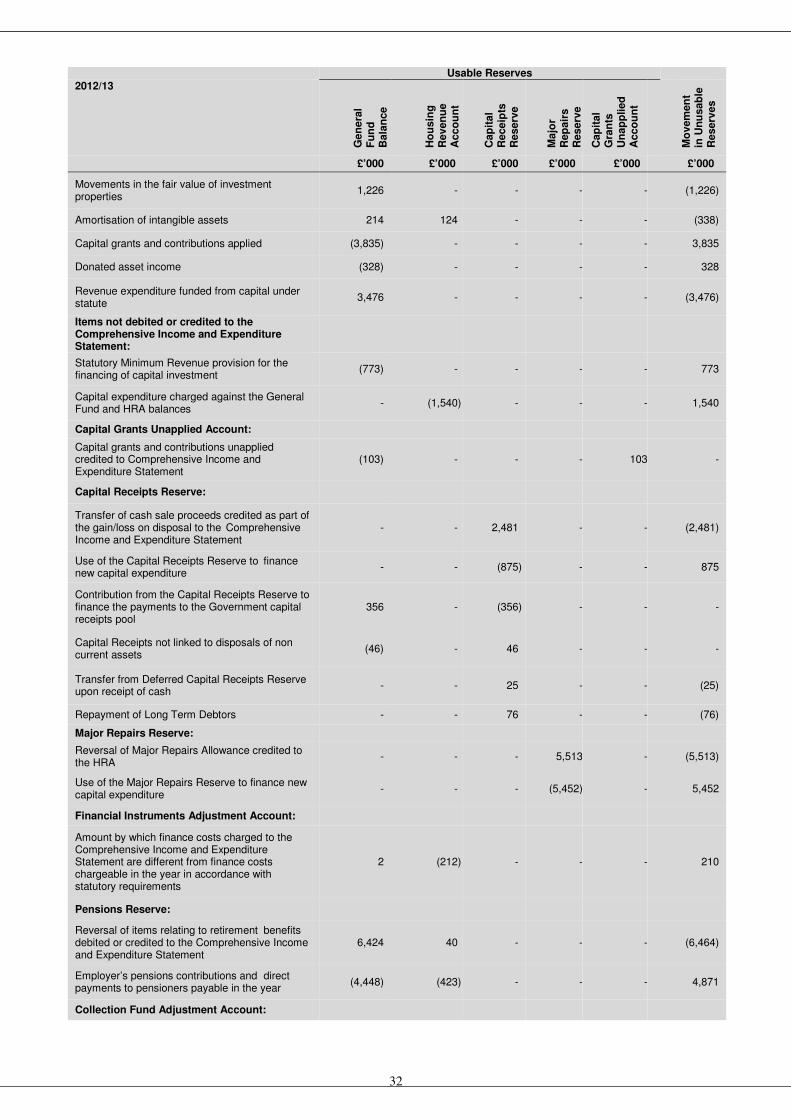
32
Usable Reserves
2012/13
Gen
era
l F
un
d
Bala
nce
Ho
usin
g
Reven
ue
Acco
un
t
Cap
ital
Receip
ts
Reserv
e
Majo
r R
ep
air
s
Reserv
e
Cap
ital
Gra
nts
U
nap
plied
A
cco
un
t M
ovem
en
t in
Un
usab
le
Reserv
es
£’000 £’000 £’000 £’000 £’000 £’000
Movements in the fair value of investment properties
1,226 - - - - (1,226)
Amortisation of intangible assets 214 124 - - - (338)
Capital grants and contributions applied (3,835) - - - - 3,835
Donated asset income (328) - - - - 328
Revenue expenditure funded from capital under statute
3,476 - - - - (3,476)
Items not debited or credited to the Comprehensive Income and Expenditure Statement:
Statutory Minimum Revenue provision for the financing of capital investment
(773) - - - - 773
Capital expenditure charged against the General Fund and HRA balances
- (1,540) - - - 1,540
Capital Grants Unapplied Account:
Capital grants and contributions unapplied credited to Comprehensive Income and Expenditure Statement
(103) - - - 103 -
Capital Receipts Reserve:
Transfer of cash sale proceeds credited as part of the gain/loss on disposal to the Comprehensive Income and Expenditure Statement
- - 2,481 - - (2,481)
Use of the Capital Receipts Reserve to finance new capital expenditure
- - (875) - - 875
Contribution from the Capital Receipts Reserve to finance the payments to the Government capital receipts pool
356 - (356) - - -
Capital Receipts not linked to disposals of non current assets
(46) - 46 - - -
Transfer from Deferred Capital Receipts Reserve upon receipt of cash
- - 25 - - (25)
Repayment of Long Term Debtors - - 76 - - (76)
Major Repairs Reserve:
Reversal of Major Repairs Allowance credited to the HRA
- - - 5,513 - (5,513)
Use of the Major Repairs Reserve to finance new capital expenditure
- - - (5,452) - 5,452
Financial Instruments Adjustment Account:
Amount by which finance costs charged to the Comprehensive Income and Expenditure Statement are different from finance costs chargeable in the year in accordance with statutory requirements
2 (212) - - - 210
Pensions Reserve:
Reversal of items relating to retirement benefits debited or credited to the Comprehensive Income and Expenditure Statement
6,424 40 - - - (6,464)
Employer’s pensions contributions and direct payments to pensioners payable in the year
(4,448) (423) - - - 4,871
Collection Fund Adjustment Account:

33
Usable Reserves
2012/13
Gen
era
l F
un
d
Bala
nce
Ho
usin
g
Reven
ue
Acco
un
t
Cap
ital
Receip
ts
Reserv
e
Majo
r R
ep
air
s
Reserv
e
Cap
ital
Gra
nts
U
nap
plied
A
cco
un
t M
ovem
en
t in
Un
usab
le
Reserv
es
£’000 £’000 £’000 £’000 £’000 £’000
Amount by which Council Tax income credited to the Comprehensive Income and Expenditure Statement is different from Council Tax income calculated for the year in accordance with statutory requirements
(110) - - - - 110
Accumulated Absences Account:
Amount by which officer remuneration charged to the Comprehensive Income and Expenditure Statement on an accruals basis is different from remuneration chargeable in the year in accordance with statutory requirements
(98) 3 - - - 95
Total Adjustments 9,926 4,472 1,397 61 103 (15,959)
Usable Reserves
2011/12
Gen
era
l F
un
d
Bala
nce
Ho
usin
g
Reven
ue
Acco
un
t
Cap
ital
Receip
ts
Reserv
e
Majo
r R
ep
air
s
Reserv
e
Cap
ital
Gra
nts
U
nap
plied
A
cco
un
t M
ovem
en
t in
Un
usab
le
Reserv
es
£’000 £’000 £’000 £’000 £’000 £’000
Capital Adjustment Account:
Reversal of items debited or credited to the Comprehensive Income and Expenditure Statement:
Charges for depreciation of non current assets 3,493 - - - - (3,493)
Charges for impairment of non current assets 125 122 - - - (247)
Derecognition of non current assets 4,816 225 - - - (5,041)
Revaluation losses on Property, Plant and Equipment
11,139 6,294 - - - (17,433)
Revaluation losses on Assets held for Sale 15 - - - - (15)
Reversal of previously recognised revaluation losses
(6) - - - - 6
Amounts of non current assets written off on disposal or sale as part of the gain/loss on disposal to the Comprehensive Income and Expenditure Statement
(34) (599) - - - 633
Movements in the fair value of investment properties
456 - - - - (456)
Amortisation of intangible assets 231 108 - - - (339)
Capital grants and contributions applied (5,721) - - - - 5,721
Donated asset income - - - - - -
Revenue expenditure funded from capital under statute
1,387 - - - - (1,387)
HRA Reform settlement payment to Secretary of State
- 73,694 - - - (73,694)
Items not debited or credited to the Comprehensive Income and Expenditure Statement:
Statutory provision for the financing of capital investment
(693) - - - - 693

34
Usable Reserves
2011/12
Gen
era
l F
un
d
Bala
nce
Ho
usin
g
Reven
ue
Acco
un
t
Cap
ital
Receip
ts
Reserv
e
Majo
r R
ep
air
s
Reserv
e
Cap
ital
Gra
nts
U
nap
plied
A
cco
un
t M
ovem
en
t in
Un
usab
le
Reserv
es
£’000 £’000 £’000 £’000 £’000 £’000
Capital expenditure charged against the General Fund and HRA balances
- (642) - - - 642
Capital Grants Unapplied Account:
Capital grants and contributions unapplied credited to Comprehensive Income and Expenditure Statement
- - - - - -
Application of grants to capital financing transferred to the Capital Adjustment Account
- - - - (302) 302
Capital Receipts Reserve:
Transfer of cash sale proceeds credited as part of the gain/loss on disposal to the Comprehensive Income and Expenditure Statement
- - 2,328 - - (2,328)
Use of the Capital Receipts Reserve to finance new capital expenditure
- - 373 - - (373)
Contribution from the Capital Receipts Reserve to finance the payments to the Government capital receipts pool
871 - (871) - - -
Capital Receipts not linked to disposals of non current assets
(5) - 5 - - -
Transfer from Deferred Capital Receipts Reserve upon receipt of cash
- - 11 - - (11)
Major Repairs Reserve:
Reversal of Major Repairs Allowance credited to the HRA
- 1,892 - 4,608 - (6,500)
Use of the Major Repairs Reserve to finance new capital expenditure
- - - (5,704) - 5,704
Financial Instruments Adjustment Account:
Amount by which finance costs charged to the Comprehensive Income and Expenditure Statement are different from finance costs chargeable in the year in accordance with statutory requirements
54 (199) - - - 145
Pensions Reserve:
Reversal of items relating to retirement benefits debited or credited to the Comprehensive Income and Expenditure Statement
5,029 32 - - - (5,061)
Employer’s pensions contributions and direct payments to pensioners payable in the year
(4,387) (408) - - - 4,795
Collection Fund Adjustment Account:
Amount by which Council Tax income credited to the Comprehensive Income and Expenditure Statement is different from Council Tax income calculated for the year in accordance with statutory requirements
(14) - - - - 14
Accumulated Absences Account:
Amount by which officer remuneration charged to the Comprehensive Income and Expenditure Statement on an accruals basis is different from remuneration chargeable in the year in accordance with statutory requirements
17 2 - - - (19)
Total Adjustments 16,773 80,521 1,846 (1,096) (302) (97,742)

35
10. Transfers to/from Earmarked Reserves This note sets out the amounts set aside from the General Fund and HRA balances in earmarked reserves to provide financing for future expenditure plans and the amounts posted back from earmarked reserves to meet General Fund and HRA expenditure in 2012/13.
Balance at 1 April
2011
Transfers Out
2011/12
Transfers In
2011/12
Balance at 31 March
2012
Transfers Out
2012/13
Transfers In
2012/13
Balance at 31 March
2013 £’000 £’000 £’000 £’000 £’000 £’000 £’000
Renewal & Repairs Fund 1,735 (335) 208 1,608 (319) 401 1,690
Insurance Reserve 517 (263) 60 314 (151) 100 263
Capital Expenditure Reserve 1,361 (2,031) 2,052 1,382 (1,035) 596 943
Regeneration Reserve - - 35 35 - 36 71
Asset Replacement Reserve 10 (2) 4 12 (3) - 9
Heritage Reserve 5 (7) 4 2 (2) 5 5
Gosbecks Reserve 391 (37) 3 357 (17) 2 342
Revenue Grants Unapplied Reserve 269 (128) 571 712 (157) 828 1,383
Building Control Reserve 29 - 12 41 (41) - -
Retained Right to Buy Receipts Reserve
- - - - - 623 623
Other Reserves 484 (147) 518 855 (554) 88 389
Total 4,801 (2,950) 3,467 5,318 (2,279) 2,679 5,718
The Renewal and Repairs Fund is maintained for the replacement of plant and equipment, and the maintenance of premises. Annual contributions are based upon the estimated renewal or repair cost, spread over the anticipated life of the asset. The Insurance Reserve is kept to cover the potential risk of fire and damage to Council houses and other selected properties, as well as certain other risks. The Insurance Fund has been allocated between the provision and reserve elements (See Note 26). The Capital Expenditure Reserve is maintained to provide finance for future capital schemes. The Regeneration Reserve has been created to finance non-recurring expenditure during the key period that the four regeneration areas are being developed. The Asset Replacement Reserve is maintained to provide for the replacement of vehicles, plant and equipment. The Heritage Reserve is maintained to provide funding for the repair, maintenance and continuing development of ancient and historical monuments. The Gosbecks Reserve is maintained to provide for the development of the Archaeological Park. The main source of funding was the ‘dowry’ agreed on the transfer of the land. The Revenue Grants Unapplied Reserve is maintained to hold the revenue grants income which have no conditions attached and are yet to be applied by the Council. The Building Control Reserve is maintained under the requirements set down by the Building Control (Local Authority Charges) Regulations; it holds the surplus/deficit on the chargeable Building Control work performed by Council officers. The Retained Right to Buy Receipts Reserve is maintained as a result of Government changes to the national scheme. It provides finance for HRA debt redemption and the provision of replacement housing. Other Reserves include:
• Sums set aside to support spending on the Mercury Theatre building
• Surplus from the on street parking account to be used to cover future shortfalls or support future transportation expenditure in accordance with the Decriminalisation of Parking agreement.
• Sums set aside to support future Section 106 monitoring activity.

36
11. Other Operating Expenditure
2012/13 2011/12
£’000 £’000
Parish Council precepts 1,101 1,034
Payments to the Government housing capital receipts pool 356 871
(Gains)/Losses on the disposal of non current assets 347 (489)
Capital receipts not linked to disposals (46) -
Total Other Operating Expenditure 1,758 1,416
12. Financing and Investment Income and Expenditure
2012/13 2011/12
£’000 £’000
Interest payable and similar charges 6,415 3,766
Interest receivable and similar income (253) (202)
Investment impairment charge - 3
Reversal of previously recognised investment impairment charges (528) -
Pensions interest cost and expected return on pensions assets 2,568 2,015
Income and expenditure in relation to investment properties (1,889) (1,804)
Changes in the fair value of investment properties 1,226 456
(Gains)/Losses on the disposal of investment properties - (125)
Total Financing and Investment Income and Expenditure 7,539 4,109
13. Taxation and Non–Specific Grant Income
2012/13 2011/12
£’000 £’000
Demand on the Collection Fund – Council Tax income (11,945) (11,670)
Contribution from the Non-Domestic Rate Pool (8,506) (7,105)
Non-ring fenced government grants (2,170) (3,385)
Capital grants and contributions (3,940) (5,722)
Donated asset income (328) -
Total Taxation and Non-Specific Grant Income (26,889) (27,882)

37
14. Property, Plant and Equipment Movements on Balances
2012/13
Co
un
cil
Dw
ell
ing
s
Oth
er
Lan
d a
nd
B
uil
din
gs
Veh
icle
s, P
lan
t,
Fu
rnit
ure
&
Eq
uip
men
t
Infr
astr
uctu
re
Assets
Co
mm
un
ity
Assets
Su
rplu
s
Assets
Assets
un
der
Co
nstr
ucti
on
To
tal P
rop
ert
y,
Pla
nt
an
d
Eq
uip
men
t
£’000 £’000 £’000 £’000 £’000 £’000 £’000 £’000 Cost / Valuation At 1 April 2012 266,327 127,634 13,260 5,889 286 11,193 1,100 425,689 Additions 7,041 1,364 2,959 29 - - 565 11,958 Donations - 328 - - - - - 328 Revaluation increases/(decreases) recognised in the Revaluation Reserve
1 (103) - - - (211) - (313)
Revaluation increases/(decreases) recognised in the Surplus/Deficit on the Provision of Services
(5,798) (3,465) - (4) - (205) (64) (9,536)
Accumulated Depreciation and Impairment written out on revaluation
(12,142) (926) - - - (728) - (13,796)
Derecognition – disposals (875) (397) (1,716) - - - - (2,988) Derecognition – other (498) (226) - - - - (31) (755) Reclassifications within PPE categories - (191) - - - 191 - - Assets reclassified to Investment Properties - (864) - - - 95 - (769) Assets reclassified as Assets held for Sale (390) - - - - - - (390)
At 31 March 2013 253,666 123,154 14,503 5,914 286 10,335 1,570 409,428
Accumulated Depreciation and Impairment At 1 April 2012 (6,903) (5,146) (8,220) (625) - (727) - (21,621) Depreciation charge (5,279) (2,365) (1,174) (294) - (73) - (9,185) Depreciation written out on revaluation to Cost/Valuation
12,142 926 - - - 270 - 13,338
Impairment written out on revaluation to Cost/Valuation
- - - - - 458 - 458
Impairment (Losses)/Reversals recognised in the Surplus/Deficit on the Provision of Services
- - - - - (82) - (82)
Derecognition – disposals 40 - 1,710 - - - - 1,750 Reclassifications within PPE categories - 50 - - - (50) - - Assets reclassified to Investment Properties - 50 - - - - - 50 At 31 March 2013 - (6,485) (7,684) (919) - (204) - (15,292) Net Book Value At 1 April 2012 259,424 122,488 5,040 5,264 286 10,466 1,100 404,068 At 31 March 2013 253,666 116,669 6,819 4,995 286 10,131 1,570 394,136

38
2011/12
Co
un
cil
Dw
ell
ing
s
Oth
er
Lan
d a
nd
B
uil
din
gs
Veh
icle
s, P
lan
t,
Fu
rnit
ure
&
Eq
uip
men
t
Infr
astr
uctu
re
Assets
Co
mm
un
ity
Assets
Su
rplu
s
Assets
Assets
un
der
Co
nstr
ucti
on
To
tal P
rop
ert
y,
Pla
nt
an
d
Eq
uip
men
t
£’000 £’000 £’000 £’000 £’000 £’000 £’000 £’000 Cost / Valuation At 1 April 2011 270,477 110,762 13,796 7,744 306 13,483 28,153 444,721 Additions 6,203 329 607 1,071 - - 4,235 12,445 Revaluation increases/(decreases) recognised in the Revaluation Reserve
- 3,048 42 - - (633) - 2,457
Revaluation increases/(decreases) recognised in the Surplus/Deficit on the Provision of Services
(6,293) (10,732) - (5) - (120) (131) (17,281)
Accumulated Depreciation and Impairment written out on revaluation
(2,725) (2,119) - - - - - (4,844)
Derecognition – disposals (373) - (1,856) - - - - (2,229) Derecognition – other (225) (1,367) (44) (4,024) - - (1,626) (7,286) Reclassifications within PPE categories - 27,713 715 1,103 - - (29,531) - Assets reclassified to Heritage Assets - - - - (20) - - (20) Assets reclassified to Assets Held for Sale (737) - - - - (1,537) - (2,274)
At 31 March 2012 266,327 127,634 13,260 5,889 286 11,193 1,100 425,689
Accumulated Depreciation and Impairment At 1 April 2011 (3,466) (4,073) (8,923) (2,622) - (459) - (19,543) Depreciation charge (6,195) (2,306) (1,164) (186) - (143) - (9,994) Depreciation written out on revaluation to Cost/Valuation
2,725 1,983 - - - - - 4,708
Impairment written out on revaluation to Cost/Valuation
- 136 - - - - - 136
Impairment (Losses)/Reversals recognised in the Revaluation Reserve
- (814) - - - - - (814)
Impairment (Losses)/Reversals recognised in the Surplus/Deficit on the Provision of Services
- (122) - - - (125) - (247)
Derecognition – disposals 12 - 1,854 - - - - 1,866 Derecognition – other - 50 13 2,183 - - - 2,246 Assets reclassified to Assets Held for Sale 21 - - - - - - 21
At 31 March 2012 (6,903) (5,146) (8,220) (625) - (727) - (21,621) Net Book Value At 1 April 2011 267,011 106,689 4,873 5,122 306 13,024 28,153 425,178 At 31 March 2012 259,424 122,488 5,040 5,264 286 10,466 1,100 404,068
Depreciation Assets are depreciated over their useful economic life. Depreciation is charged on all property, plant and equipment assets other than freehold land and specific community assets. Depreciation is calculated using the straight-line method. The following useful lives have been used in the calculation of depreciation:
• Council Dwellings and Homeless Properties – components: Host structure 35 - 50 years
• HRA Non dwellings – components: Host structure 35 - 50 years
• Other Land and Buildings - components: Host structure 10 - 50 years
Mechanical and Electrical 10 - 15 years
• Vehicles, Plant, Furniture & Equipment: 3 – 10 years
• Infrastructure: 20 years

39
Effects of the changes of estimates
Mechanical and Electrical components were recognised separately for HRA building assets in the Council’s 2011/12 accounts. In the current financial year of 2012/13 it was decided to combine the mechanical and electrical components back into the host structures of the HRA assets. These adjustments have been made as there are no material impacts on the total depreciation charge of having these as a separate component of HRA building assets. The 2012/13 depreciation charge has been calculated using the host structure as the main component of HRA building assets. This change has been accounted for on a prospective basis as depreciation charges are considered to be accounting estimates for which no prior period adjustments are required to be made in the accounts. Revaluations The Council carries out a rolling programme that ensures that all property, plant and equipment required to be measured at fair value is revalued at least every five years. Valuations are performed for assets within the Council Dwellings, Other Land and Buildings and Surplus Categories of Property, Plant and Equipment. The revaluations performed in 2012/13 were:
• the revaluation of a portfolio of General Fund properties as at 1 April 2012
• the indexation of Council dwellings and Homeless properties to their fair value as at 31 March 2013
• the ad-hoc revaluations of other land and buildings through out the financial year The Council dwellings and other HRA properties were revalued at 1
April 2010 at a gross value of £296 million.
Council dwellings were revalued in line with the requirements of Resource Accounting for the Housing Revenue Account. Guidance on the valuation approach was provided by the Department for Communities and Local Government. The dwellings were valued on the basis of Existing Use Value – Social Housing (EUV-SH). The stock was broken down into archetype groups and an average based on beacon values applied to each group. The figure applied per unit is based upon tenanted individual properties. The valuation for Council dwellings and Homeless Properties has been adjusted to their values at 31 March 2013 using property price indices and this resulted in a revaluation gain of £0.72 million. Expenditure of £7.0 million was incurred in 2012/13 to maintain the Council’s housing stock at the decent homes standard prescribed by the Government. This expenditure does not add additional value as it primarily relates to the replacement of existing components to keep the Council’s housing at a decent level. The original cost of the components that were replaced has been estimated at £0.50 million and derecognised in the accounts. The remaining expenditure balance (£6.5 million) has been treated as a revaluation loss relating to Council Dwellings at 31 March 2013. The valuations were carried out by independent external valuers from NPS Property Consultants Limited, who are members of the Royal Institution of Chartered Surveyors. The valuations were made in accordance with the RICS Valuation – Professional Standards 2012 (issued by the Royal Institution of Chartered Surveyors). The valuations assume that the land and properties are unaffected by contamination. Specific inspections and structural or soil surveys have not been carried out and services installations have not been tested. Plant and machinery which would normally be regarded as an integral part of the buildings on letting or sale has been included in the valuation of the building but all items of loose furnishings and fittings are excluded. Where the DRC basis of valuation has been adopted, external works are deemed to include below ground drainage, hardstandings, formal landscaping, site fencing and walls, all services on site, distribution and incoming supplies, and minor buildings as appropriate. Exclusions from the valuations performers by the surveyors:
• Building and soil surveys have not been carried out, nor have mining subsidence reports been commissioned.
• Parts of the beacon properties which are covered, unexposed or inaccessible have not been inspected.
• Service installations have not been tested.
• No investigation has been carried out to determine the presence of contamination, deleterious or hazardous materials at any of the properties.
• No access audit has been undertaken
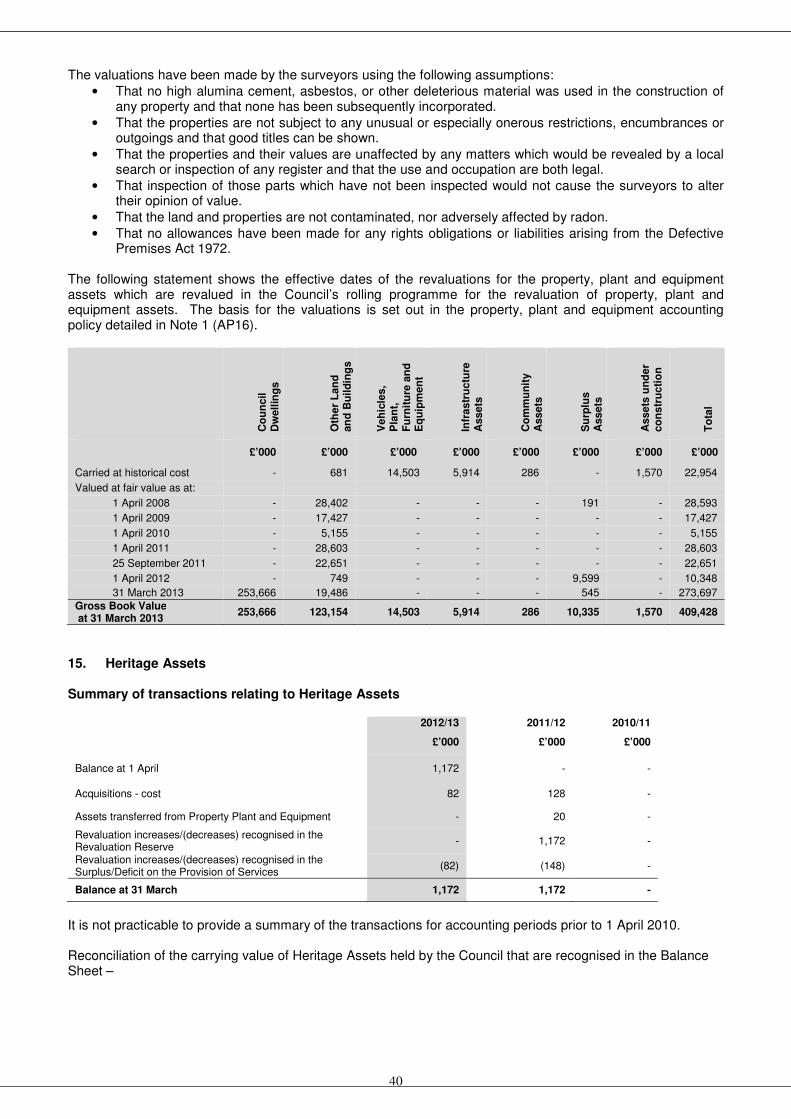
40
The valuations have been made by the surveyors using the following assumptions:
• That no high alumina cement, asbestos, or other deleterious material was used in the construction of any property and that none has been subsequently incorporated.
• That the properties are not subject to any unusual or especially onerous restrictions, encumbrances or outgoings and that good titles can be shown.
• That the properties and their values are unaffected by any matters which would be revealed by a local search or inspection of any register and that the use and occupation are both legal.
• That inspection of those parts which have not been inspected would not cause the surveyors to alter their opinion of value.
• That the land and properties are not contaminated, nor adversely affected by radon.
• That no allowances have been made for any rights obligations or liabilities arising from the Defective Premises Act 1972.
The following statement shows the effective dates of the revaluations for the property, plant and equipment assets which are revalued in the Council’s rolling programme for the revaluation of property, plant and equipment assets. The basis for the valuations is set out in the property, plant and equipment accounting policy detailed in Note 1 (AP16).
Co
un
cil
Dw
ell
ing
s
Oth
er
Lan
d
an
d B
uil
din
gs
Veh
icle
s,
Pla
nt,
F
urn
itu
re a
nd
E
qu
ipm
en
t
Infr
astr
uctu
re
Assets
Co
mm
un
ity
Assets
Su
rplu
s
Assets
Assets
un
der
co
nstr
ucti
on
To
tal
£’000 £’000 £’000 £’000 £’000 £’000 £’000 £’000
Carried at historical cost - 681 14,503 5,914 286 - 1,570 22,954
Valued at fair value as at:
1 April 2008 - 28,402 - - - 191 - 28,593
1 April 2009 - 17,427 - - - - - 17,427
1 April 2010 - 5,155 - - - - - 5,155
1 April 2011 - 28,603 - - - - - 28,603
25 September 2011 - 22,651 - - - - - 22,651
1 April 2012 - 749 - - - 9,599 - 10,348
31 March 2013 253,666 19,486 - - - 545 - 273,697
Gross Book Value at 31 March 2013
253,666 123,154 14,503 5,914 286 10,335 1,570 409,428
15. Heritage Assets Summary of transactions relating to Heritage Assets
2012/13 2011/12 2010/11
£’000 £’000 £’000
Balance at 1 April 1,172 - -
Acquisitions - cost 82 128 -
Assets transferred from Property Plant and Equipment - 20 -
Revaluation increases/(decreases) recognised in the Revaluation Reserve
- 1,172 -
Revaluation increases/(decreases) recognised in the Surplus/Deficit on the Provision of Services
(82) (148) -
Balance at 31 March 1,172 1,172 -
It is not practicable to provide a summary of the transactions for accounting periods prior to 1 April 2010. Reconciliation of the carrying value of Heritage Assets held by the Council that are recognised in the Balance Sheet –

41
2012/13 Civic regalia Museum Exhibits
and Art Collection Buildings Total
£’000 £’000 £’000 £’000
Valuation
Balance at 1 April 2012 1,172 - - 1,172
Acquisitions - cost - - 82 82
Revaluation increases/(decreases) recognised in the Surplus/Deficit on the Provision of Services
- - (82) (82)
Balance at 31 March 2013 1,172 - - 1,172
2011/12 Civic regalia Museum Exhibits and Art Collection
Buildings Total
£’000 £’000 £’000 £’000
Valuation
Balance at 1 April 2011 - - - -
Acquisitions - cost - - 128 128
Assets transferred from Property Plant and Equipment - 20 - 20
Revaluation increases/(decreases) recognised in the Revaluation Reserve
1,172 - - 1,172
Revaluation increases/(decreases) recognised in the Surplus/Deficit on the Provision of Services
- (20) (128) (148)
Balance at 31 March 2012 1,172 - - 1,172
Civic Regalia Collection The Council’s civic regalia collection includes fine examples of silver gilt and civic gifts and donations. There are 85 individual assets in the collection. Of special interest is a silver model of a sixteenth century warship, designed for use as a vessel for table wine. The oldest item of insignia is the silver borough seal, which dates from about 1413. In the collection is one of the largest maces in the country, which is used as a symbol of authority from the sovereign. The civic regalia collection is managed by the Council’s Town Serjeant, who holds a civic regalia book listing all of the assets held within the Council’s collection. An annual audit of the collection is made by the Town Serjeant to confirm that all of the assets are in the possession of the Council and to review their physical condition. At its completion, an internal register is signed off by the Town Serjeant with the out-going and in coming mayors to evidence the review. The collection is held securely in the Town Hall and is only able to be viewed by the public when on organised tours. Specific items of this collection are only taken out of the Town Hall on certain civic and remembrance occasions. Acquisitions into this collection are very rare and none have been made in the last 20 years. The Council does not dispose of any of civic regalia items as it has a policy of maintaining and retaining all of the assets within its collection. The Council’s collection of civic regalia items is reported in the Balance Sheet at insurance valuation which is based on replacing the items on an indemnity basis whereby the items would be replaced in the normal second hand art retail markets with items of comparable age, quality and condition. The civic regalia items were valued as at 1
April 2011 by the external valuers, Reeman Dansie, who are members of the Royal Institution of
Chartered Surveyors. It has not been practicable to split the carrying value of the civic regalia collection between those purchased by the Council and those acquired by donation due to the age of the collection and the lack of original records.

42
Collections of museum exhibits and works of art The collections at Colchester originated with the foundation of the museum in 1847. From the start archaeology, art, local history and natural history objects have been collected. The Council holds an archaeology collection which is designated in recognition of its international significance. It is arguably the finest and most extensive collection in the world representative of Late Iron Age and Roman Britain. It holds a collection of early manuscripts and printed books which includes the earliest surviving manuscript of Machiavelli’s play, La Clizia, dated to 1525. The Council’s Mason clock collection is of special significance, as it is one of the largest collections of horological items from any provincial town making it an important study collection. The Council’s natural history collection is of regional importance. The Council’s art collection, although of mostly local interest, does contain significant items including rare early works by John Constable and work by Richard Stone and David Vinckeboons. The collections of museum exhibits and works of art are managed centrally by the collection management team within the museum service. All items are entered into an accession register when they are received. Further details regarding each item are then added into and held on the museum service’s computerised record system. The conservation team is responsible for the preservation of the collections. Environmental conditions are set in the Council’s museums and storage facilities. Condition surveys are performed frequently to monitor and identify any issues arising relating to the items held in the collections. The museum service has a formal acquisition and disposal policy relating to the collections it holds. Acquisitions are made for items which are significant to Colchester and its district. These arise from a number of sources such as outright purchases (some supported by grant funding), donations, gifts and transfers from other museums and similar organisations. Items held within the collections are not expected to be disposed of. Disposals are rare and require Portfolio Holder approval before any item leaves the Council’s collections. The main reason for disposals is where the items have been identified to be better suited to be held by another museum or related organisation. The Council displays some of its collections in its museums and in the Town Hall. These sites are open to the public subject to opening and organised tour times. Certain items are taken out offsite to be shown to the public at external organisations such as local schools and temporary exhibitions. The Council has a reserve collection which is held in storage, access to these items is restricted and prior appointments are required to be made to view these items. The original cost information is not available for these collections. The insurance valuation for these collections cannot be utilised as the total insurance value represents only a proportion of the items of the collections and is not analysed down individually across the collections which contain over 500,000 individual items. The Council has applied the exemption allowed within ‘Financing Reporting Standards 30 Heritage Assets’ to its collections of museum exhibits and works of art. FRS 30 states that ‘Where the cost information is not available, and cannot be obtained at a cost which is commensurate with the benefits to users of the financial statements, the assets will not be recognised in the balance sheet and the disclosures required by this standard
should be made’. As such the Council has not recognised any of the items in these collections held at 1 April
2011 within its Balance Sheet. Acquisitions made from 1 April 2011 onwards are initially recognised at their cost. The Council’s capitalisation limit of £10,000 is to be applied to these assets and as such any assets costing less than £10,000 are charged through revenue and are not capitalised as assets on the Council’s Balance Sheet. Buildings
Colchester Castle is an example of a largely complete Norman Castle and is a Grade I listed building and Scheduled Ancient Monument. Colchester's keep is the largest ever built in Britain and the largest surviving example of its kind in Europe. Building of the castle began between 1069 and 1076 and was completed by around 1100. The castle is built of stone and is built on top of the foundations of the Roman Temple of Claudius. The building has operated as the main museum in the town since 1860.
The castle building is managed by the Colchester and Ipswich Museum Service. The building is preserved through the maintenance performed under the Council’s building management and maintenance plan which is led by the Building Services and Facilities Manager. Representatives from the museum service meet frequently with representatives from English Heritage to discuss and review preservation issues linked to the castle due its important status as a scheduled ancient monument.

43
The Council has not recognised the castle as a heritage asset on its Balance Sheet as there are no records detailing the original cost of this asset. It has not been possible to obtain an appropriate valuation for the castle from a review of insurance records or from liaison with external valuers. In 2012/13 capital expenditure totalling £128,000 was incurred relating to works performed on the castle and town walls. This expenditure has been written off in the year via a revaluation loss as it relates to underlying assets (castle and town walls) which are not capitalised as Heritage assets on the Council’s Balance Sheet. 16. Investment Properties The following items of income and expense have been accounted for in the Financing and Investment Income and Expenditure line in the Comprehensive Income and Expenditure Statement:
2012/13 2011/12
£’000 £’000
Rental income from investment properties (1,965) (2,093)
Direct operating expenses arising from investment properties 76 289
Net (gain)/loss on Investment Properties (1,889) (1,804)
There are no restrictions on the Council’s ability to realise the value inherent in its investment properties or on the Council’s right to the remittance of income and the proceeds of disposal. The Council has no contractual obligations to purchase, construct, enhance or develop its investment properties. The Council holds leases on its investment properties which are either ‘Full Repairing and Insuring’ leases or ‘Internal Repairing’ leases on its investment properties. ‘Full Repairing and Insuring’ leases are those where the tenant is responsible for performing all the repairs and maintenance on the internal and external structure of the leased properties. The Council has an obligation to perform ad-hoc repairs and maintenance on the external structure of its investment properties held under ‘Internal Repairing’ leases. The following table summarises the movement in the fair value of investment properties over the financial year:
2012/13 2011/12
£’000 £’000
Balance at 1 April 35,887 37,259
Disposals - (916)
Net gains/(losses) from fair value adjustments (1,226) (456)
Transfers from Property, Plant and Equipment 719 -
Balance at 31 March – Investment Properties 35,380 35,887
17. Intangible Assets The Council accounts for its software as intangible assets, to the extent that the software is not an integral part of a particular IT system and accounted for as part of the hardware item of property, plant and equipment. The intangible assets are comprised of purchased software licenses. All software is given a finite useful life, based on assessments of the period that the software is expected to be of use to the Council. The useful lives assigned to the major software suites used by the Council range between 3 and 10 years. The carrying amount of intangible assets is amortised on a straight-line basis. In 2012/13 amortisation of £0.338 million (2011/12: £0.339 million) was charged to IT holding accounts and then recharged to individual service headings in the Net Cost of Services. It is not possible to quantify exactly how much of the amortisation is attributable to each service heading in the Net Cost of Services section of the Comprehensive Income and Expenditure Statement. There are no items of capitalised software that are individually material to the financial statements. The movement on intangible asset balances during the financial year is as follows:

44
Software 2012/13 2011/12 £’000 £’000 Balance at 1 April
Gross carrying amount 8,730 8,613
Accumulated amortisation (7,769) (7,430)
Net carrying amount at 1 April 961 1,183
Additions: Purchases 244 117
Amortisation for the year (338) (339)
Net carrying amount at 31 March 867 961
Comprising of:
Gross carrying amount 8,974 8,730
Accumulated amortisation (8,107) (7,769)
Balance at 31 March – Intangible Assets 867 961
18. Impairment Losses During 2012/13 the Council has recognised impairment losses totalling £81,000 (2011/12: £125,000) in relation to the significant deterioration of the physical condition of the St James House building (£48,000) and Roman House building (£33,000). These impairment losses were identified from the valuations provided for the Council’s external valuers dated 31 March 2013. The recoverable amount of these buildings has been reduced and the impairment losses have been charged to the ‘Planning services’ line of the Comprehensive Income and Expenditure Statement and then reversed out in the Movement in Reserves Statement to the Capital Adjustment Account. 19. Capital Expenditure and Capital Financing The total amount of capital expenditure incurred in the year is shown in the table below (including the value of assets acquired under finance leases), together with the resources that have been used to finance it. Where capital expenditure is to be financed in future years by charges to revenue as assets are used by the Council, the expenditure results in an increase in the Capital Financing Requirement (CFR), a measure of the capital expenditure incurred historically by the Council that has yet to be financed. The CFR is analysed in the second part of this note.
2012/13 2011/12
£’000 £’000
Opening Capital Financing Requirement at 1 April 148,713 75,084
Capital Expenditure
Property, Plant and Equipment 11,958 12,445
Heritage Assets 82 128
Intangible Assets 244 117
Revenue Expenditure Funded from Capital under Statute 3,476 1,387
HRA Reform Payment - 73,694
Long Term Debtors 87 179
15,847 87,950
Sources of Finance
Capital Receipts 875 (373)
Government Grants and Other Contributions 3,835 6,023
Major Repairs Reserve 5,452 5,704
Capital Expenditure Reserve 816 1,632
Direct Revenue Contributions 1,540 642
Minimum Revenue Provision 773 693
13,291 14,321
Closing Capital Financing Requirement at 31 March 151,269 148,713

45
2012/13 2011/12
£’000 £’000
Explanation of the movements in the year:
Increase in underlying need to borrowing (unsupported by government financial assistance) 969 74,104
Assets acquired under finance leases 2,360 218
Minimum Revenue Provision (773) (693)
Increase/(Decrease) in the Capital Financing Requirement 2,556 73,629
Capital Commitments At 31 March 2013, the Council has entered into a number of major contracts for the construction or enhancement of Property, Plant and Equipment in 2013/14 and future years. The significant commitments are:
Total Current Contract Value
Outstanding at 31 March
2013
Outstanding at 31 March
2012
Scheme £’000 £’000 £’000
Decent Homes and upgrades to Council Stock 15,292 6,288 10,058
Firstsite facility - completion and fitting out (a range of contracts) 6,583 - 271
Specific Adaptations to Housing Stock 1,125 742 968
Redevelopment of Castle Museum 1,176 1,159 -
20. Financial Instruments Categories of Financial Instruments The borrowings and investments disclosed in the Balance Sheet are made up of the following categories of financial instrument: Long Term Current
31 March 2013
31 March 2012
31 March 2013
31 March 2012
£’000 £’000 £’000 £’000
Restated
Investments
Loans and receivables (Principal) - - 2,500 1,000
Accrued Interest (S/T) - - 42 2
Loans and receivables at amortised cost (1) - - 2,542 1,002
Available-for-sale financial assets 10 10 - -
Financial assets at fair value through profit or loss (2) - - 1,734 1,934
Total Investments 10 10 4,276 2,936
Debtors Financial assets carried at contract amount (excludes Statutory Council Tax, NNDR and Housing Benefit balances)
722 743 9,571 7,893
Total Debtors 722 743 9,571 7,893
Borrowings
Financial liabilities (Principal)
Public Works Loan Board (PWLB) (101,594) (101,594) - -
Money Market (24,000) (29,500) (10,500) (5,000)
Accrued Interest (S/T) - - (1,745) (1,076)
Total borrowings at amortised cost (1) (125,594) (131,094) (12,245) (6,076)
Creditors
Financial liabilities carried at contract amount (excludes Statutory Council Tax, NNDR and Housing Benefit balances)
- - (8,031) (10,197)
Total Creditors - - (8,031) (10,197)
Other Liabilities
Finance lease liabilities (2,302) (419) (413) (58)
Total Other Liabilities (2,302) (419) (413) (58)
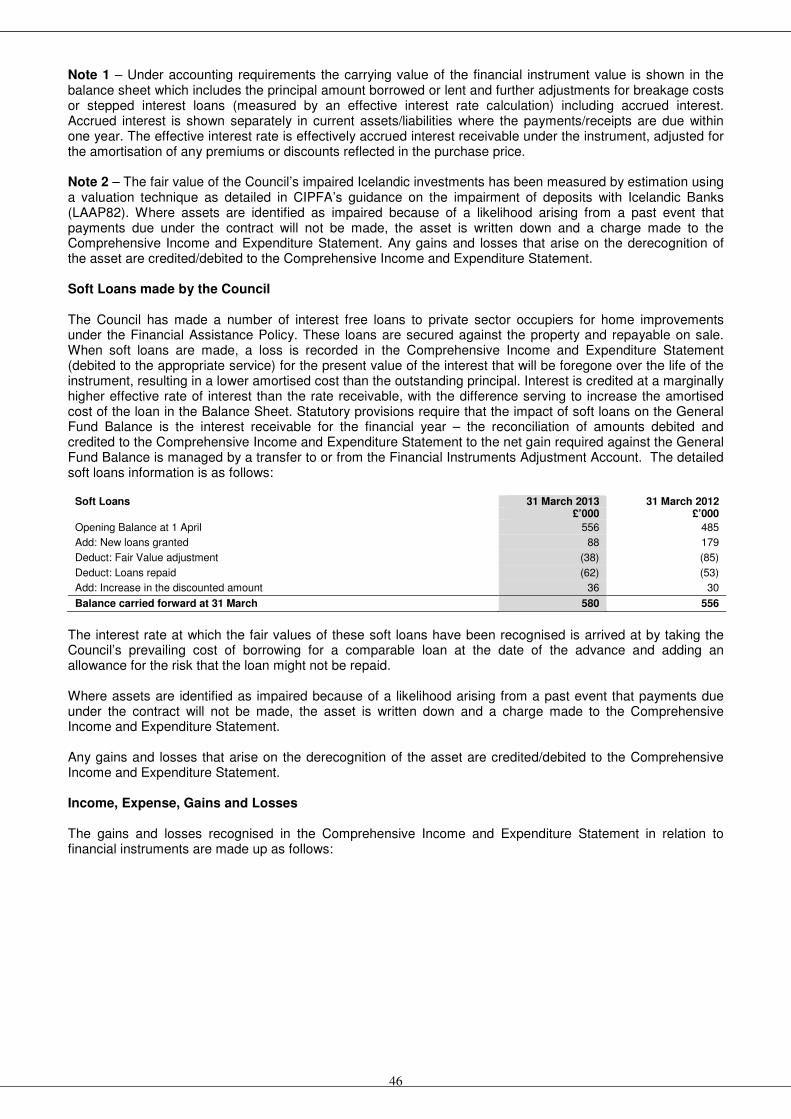
46
Note 1 – Under accounting requirements the carrying value of the financial instrument value is shown in the balance sheet which includes the principal amount borrowed or lent and further adjustments for breakage costs or stepped interest loans (measured by an effective interest rate calculation) including accrued interest. Accrued interest is shown separately in current assets/liabilities where the payments/receipts are due within one year. The effective interest rate is effectively accrued interest receivable under the instrument, adjusted for the amortisation of any premiums or discounts reflected in the purchase price. Note 2 – The fair value of the Council’s impaired Icelandic investments has been measured by estimation using a valuation technique as detailed in CIPFA’s guidance on the impairment of deposits with Icelandic Banks (LAAP82). Where assets are identified as impaired because of a likelihood arising from a past event that payments due under the contract will not be made, the asset is written down and a charge made to the Comprehensive Income and Expenditure Statement. Any gains and losses that arise on the derecognition of the asset are credited/debited to the Comprehensive Income and Expenditure Statement. Soft Loans made by the Council The Council has made a number of interest free loans to private sector occupiers for home improvements under the Financial Assistance Policy. These loans are secured against the property and repayable on sale. When soft loans are made, a loss is recorded in the Comprehensive Income and Expenditure Statement (debited to the appropriate service) for the present value of the interest that will be foregone over the life of the instrument, resulting in a lower amortised cost than the outstanding principal. Interest is credited at a marginally higher effective rate of interest than the rate receivable, with the difference serving to increase the amortised cost of the loan in the Balance Sheet. Statutory provisions require that the impact of soft loans on the General Fund Balance is the interest receivable for the financial year – the reconciliation of amounts debited and credited to the Comprehensive Income and Expenditure Statement to the net gain required against the General Fund Balance is managed by a transfer to or from the Financial Instruments Adjustment Account. The detailed soft loans information is as follows:
Soft Loans 31 March 2013 31 March 2012 £’000 £’000 Opening Balance at 1 April 556 485
Add: New loans granted 88 179
Deduct: Fair Value adjustment (38) (85)
Deduct: Loans repaid (62) (53)
Add: Increase in the discounted amount 36 30
Balance carried forward at 31 March 580 556
The interest rate at which the fair values of these soft loans have been recognised is arrived at by taking the Council’s prevailing cost of borrowing for a comparable loan at the date of the advance and adding an allowance for the risk that the loan might not be repaid. Where assets are identified as impaired because of a likelihood arising from a past event that payments due under the contract will not be made, the asset is written down and a charge made to the Comprehensive Income and Expenditure Statement. Any gains and losses that arise on the derecognition of the asset are credited/debited to the Comprehensive Income and Expenditure Statement. Income, Expense, Gains and Losses The gains and losses recognised in the Comprehensive Income and Expenditure Statement in relation to financial instruments are made up as follows:

47
2012/13 2011/12
Fin
an
cia
l L
iab
ilit
ies
measu
red
at
am
ort
ised
co
st
Fin
an
cia
l A
ssets
: L
oan
s a
nd
R
eceiv
ab
les
Assets
an
d
Lia
bilit
ies a
t F
air
V
alu
e t
hro
ug
h
Pro
fit
an
d L
oss
To
tal
Fin
an
cia
l L
iab
ilit
ies
measu
red
at
am
ort
ised
co
st
Fin
an
cia
l A
ssets
: L
oan
s a
nd
R
eceiv
ab
les
Assets
an
d
Lia
bilit
ies a
t F
air
V
alu
e t
hro
ug
h
Pro
fit
an
d L
oss
To
tal
£’000 £’000 £’000 £’000 £’000 £’000 £’000 £’000 Interest expense 6,415 - - 6,415 3,766 - - 3,766
Impairment losses - - (528) (528) - - 3 3
Total expense in Surplus or Deficit on Provision of Services
6,415 - (528) 5,887 3,766 - 3 3,769
Interest income - (256) - (256) - (209) - (209)
Total income in Surplus or Deficit on Provision of Services
- (256) - (256) - (209) - (209)
Adjusted via Movement in Reserves Statement – premiums/discounts
212 - - 212 198 - - 198
Net gain/(loss) for the year 6,627 (256) (528) 5,843 3,964 (209) 3 3,758
The average interest rate on all financial liabilities – borrowings for 2012/13 was 4.56% (2011/12 Restated: 5.77%). All investments were managed internally and the main losses/(gains) were therefore shown under “Loans and Receivables”. The above figures include the impact of investments that have been impaired due to the financial difficulties faced by Icelandic banks, as well as the impact of currency fluctuations relating to an element of the settlement from Landsbanki being held in an escrow account in Icelandic Kroner. Fair Values of Assets and Liabilities carried at Amortised Cost Financial liabilities and financial assets represented by loans and receivables are carried on the balance sheet at amortised cost (in long term assets/liabilities, with accrued interest in current assets/liabilities). Their fair value can be assessed by calculating the present value of the cash flows that take place over the remaining life of the instruments, using the following assumptions:
• For loans from the PWLB and other loans payable, new borrowing rates from the PWLB have been applied to provide the fair value under PWLB debt redemption procedures;
• For loans receivable prevailing benchmark market rates have been used to provide the fair value;
• No early repayment or impairment is recognised;
• Where an instrument has a maturity of less than 12 months or is a trade or other receivable, the fair value is taken to be the carrying amount or the billed amount;
• The fair value of trade and other receivables is taken to be the invoiced or billed amount. The fair values calculated are as follows:
31 March 2013 31 March 2012
Carrying Amount Fair Value Carrying Amount Fair Value
£’000 £’000 £’000 £’000 Restated Restated
PWLB debt (102,564) (98,962) (101,893) (91,433)
Market debt (35,275) (44,024) (35,277) (43,506)
Long Term Creditors – Finance Leases (2,302) (2,302) (419) (419)
Short Term Creditors (excluding NNDR, Council Tax and Housing Benefit creditors)
(8,031) (8,031) (10,197) (10,197)
Total Financial Liabilities (148,172) (153,319) (147,786) (145,555)
Where the fair value of the liabilities is lower than the carrying amount it is due to the Council’s portfolio of loans including a number of fixed rate loans where the interest rate payable is lower than the rates available for similar loans in the market at the Balance Sheet date. This shows a notional future gain (based on economic conditions at 31 March 2013) arising from a commitment to pay interest to lenders below current rates. The
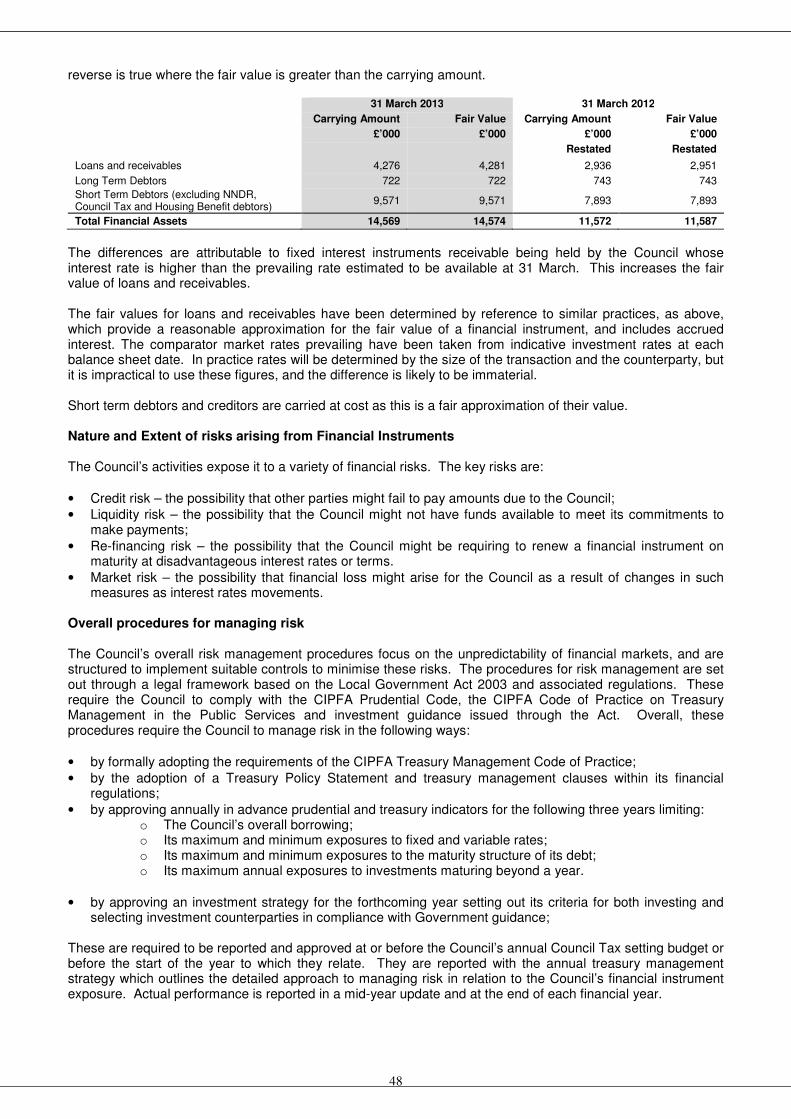
48
reverse is true where the fair value is greater than the carrying amount.
31 March 2013 31 March 2012
Carrying Amount Fair Value Carrying Amount Fair Value
£’000 £’000 £’000 £’000 Restated Restated
Loans and receivables 4,276 4,281 2,936 2,951
Long Term Debtors 722 722 743 743
Short Term Debtors (excluding NNDR, Council Tax and Housing Benefit debtors)
9,571 9,571 7,893 7,893
Total Financial Assets 14,569 14,574 11,572 11,587
The differences are attributable to fixed interest instruments receivable being held by the Council whose interest rate is higher than the prevailing rate estimated to be available at 31 March. This increases the fair value of loans and receivables. The fair values for loans and receivables have been determined by reference to similar practices, as above, which provide a reasonable approximation for the fair value of a financial instrument, and includes accrued interest. The comparator market rates prevailing have been taken from indicative investment rates at each balance sheet date. In practice rates will be determined by the size of the transaction and the counterparty, but it is impractical to use these figures, and the difference is likely to be immaterial. Short term debtors and creditors are carried at cost as this is a fair approximation of their value. Nature and Extent of risks arising from Financial Instruments The Council’s activities expose it to a variety of financial risks. The key risks are:
• Credit risk – the possibility that other parties might fail to pay amounts due to the Council;
• Liquidity risk – the possibility that the Council might not have funds available to meet its commitments to make payments;
• Re-financing risk – the possibility that the Council might be requiring to renew a financial instrument on maturity at disadvantageous interest rates or terms.
• Market risk – the possibility that financial loss might arise for the Council as a result of changes in such measures as interest rates movements.
Overall procedures for managing risk The Council’s overall risk management procedures focus on the unpredictability of financial markets, and are structured to implement suitable controls to minimise these risks. The procedures for risk management are set out through a legal framework based on the Local Government Act 2003 and associated regulations. These require the Council to comply with the CIPFA Prudential Code, the CIPFA Code of Practice on Treasury Management in the Public Services and investment guidance issued through the Act. Overall, these procedures require the Council to manage risk in the following ways:
• by formally adopting the requirements of the CIPFA Treasury Management Code of Practice;
• by the adoption of a Treasury Policy Statement and treasury management clauses within its financial regulations;
• by approving annually in advance prudential and treasury indicators for the following three years limiting: o The Council’s overall borrowing; o Its maximum and minimum exposures to fixed and variable rates; o Its maximum and minimum exposures to the maturity structure of its debt; o Its maximum annual exposures to investments maturing beyond a year.
• by approving an investment strategy for the forthcoming year setting out its criteria for both investing and selecting investment counterparties in compliance with Government guidance;
These are required to be reported and approved at or before the Council’s annual Council Tax setting budget or before the start of the year to which they relate. They are reported with the annual treasury management strategy which outlines the detailed approach to managing risk in relation to the Council’s financial instrument exposure. Actual performance is reported in a mid-year update and at the end of each financial year.

49
The annual treasury management strategy which incorporates the prudential indicators was approved by Council on 22 February 2012 and is available on the Council’s website. The key issues within the strategy were:
• The Authorised Limit for 2012/13 was set at £169 million. This is the maximum limit of external borrowings or other long term liabilities.
• The Operational Boundary was expected to be £141 million. This is the expected level of debt and other long term liabilities during the year.
• The maximum amounts of fixed and variable interest rate exposure were set at 100% and 50% based on the Council’s net debt.
• The maximum and minimum exposures to the maturity structure of debt are shown under the section on refinancing and maturity risk.
These policies are implemented by the Financial Accounting team. The Council maintains written principles for overall risk management, as well as written policies (Treasury Management Practices – TMPs) covering specific areas, such as interest rate risk, credit risk, and the investment of surplus cash. These TMPs are a requirement of the Code of Practice and are reviewed periodically. Credit Risk Credit risk arises from deposits with banks and financial institutions, as well as credit exposures to the Council’s customers. This risk is minimised through the Annual Investment Strategy, which requires that deposits are not made with financial institutions unless they meet identified minimum credit criteria, in accordance with the Fitch, Moody’s and Standard & Poors Credit Ratings Services. The Annual Investment Strategy also considers maximum amounts and time limits in respect of each financial institution. Deposits are not made with banks and financial institutions unless they meet the minimum requirements of the investment criteria. Additional selection criteria are also applied after these initial criteria are applied. The Investment Strategy reflects the Council’s low appetite for risk, emphasising the priorities of security and liquidity over that of yield. The main features were as follows:
• The Council will only invest with institutions with the highest credit ratings, taking into account the views of all credit rating agencies and other market data when making investment decisions. The Council will continue to follow the approach suggested by CIPFA of using the lowest rating from all the agencies (i.e. the lowest common denominator).
• The Council will use the creditworthiness service provided by Sector Treasury. This service uses a sophisticated modelling approach with credit ratings from all three rating agencies forming the core element. However, it does not rely solely on the current credit ratings of counterparties but also uses the following as overlays:
o credit watches and credit outlooks from credit rating agencies o CDS spreads to give early warning of likely changes in credit ratings o sovereign ratings to select counterparties from only the most creditworthy countries
• The Council will only use approved counterparties from countries with the highest credit rating of ‘AAA’, together with those from the UK.
• The Council will continue to invest with UK institutions that have been nationalised or part-nationalised, or those that are covered by the UK Government’s support package.
• The Council will continue to avoid longer term deals while investment rates are at such low levels. The full Investment Strategy for 2012/13 was approved by Full Council on 22 February 2012 and is available on the Council’s website. The Council’s maximum exposure to credit risk in relation to its investments in banks and building societies of £21.71 million cannot be assessed generally as the risk of any institution failing to make interest payments or repay the principal sum will be specific to each individual institution. Recent experience has shown that it is rare for such entities to be unable to meet their commitments. A risk of irrecoverability applies to all of the Council’s deposits, but there was no evidence at the 31 March 2013 that this was likely to crystallise. Over the last five years, the only experience of default by local authorities was the Icelandic Banks default in October 2008. Deposits totalling £1.70 million have therefore been excluded from the above figure as they have already suffered a default due to the issuing bank being in administration.
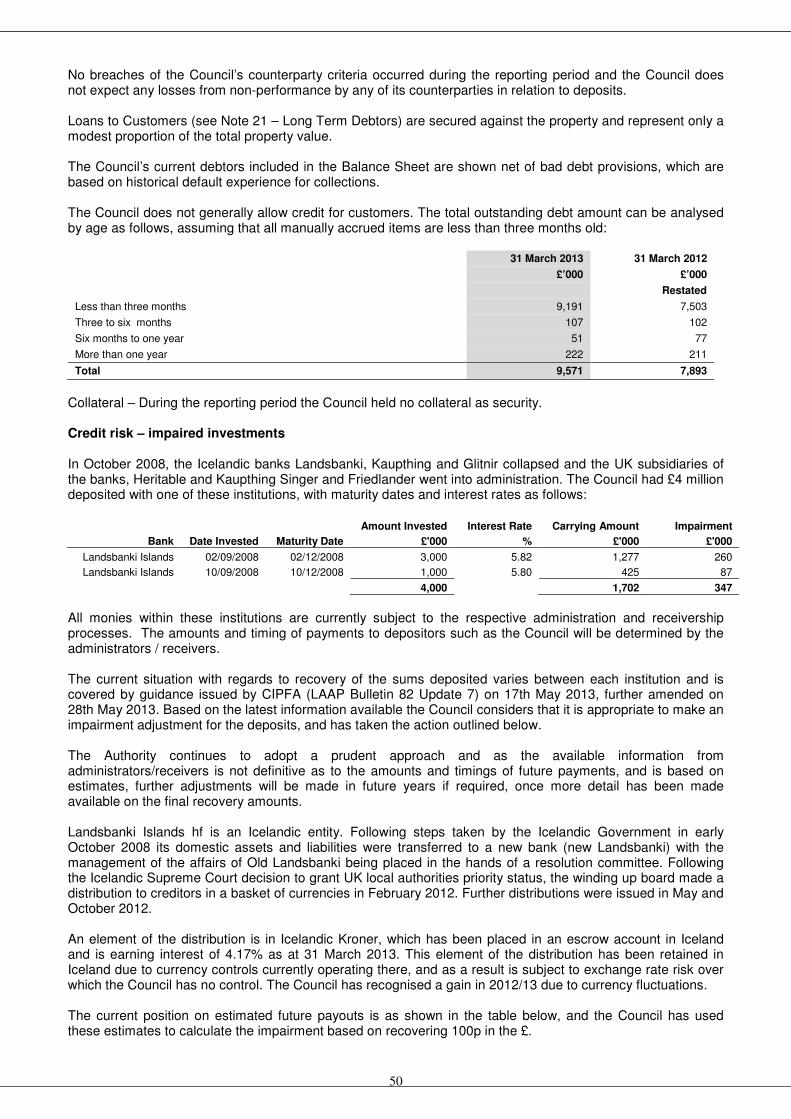
50
No breaches of the Council’s counterparty criteria occurred during the reporting period and the Council does not expect any losses from non-performance by any of its counterparties in relation to deposits. Loans to Customers (see Note 21 – Long Term Debtors) are secured against the property and represent only a modest proportion of the total property value. The Council’s current debtors included in the Balance Sheet are shown net of bad debt provisions, which are based on historical default experience for collections. The Council does not generally allow credit for customers. The total outstanding debt amount can be analysed by age as follows, assuming that all manually accrued items are less than three months old:
31 March 2013 31 March 2012
£’000 £’000
Restated
Less than three months 9,191 7,503
Three to six months 107 102
Six months to one year 51 77
More than one year 222 211
Total 9,571 7,893
Collateral – During the reporting period the Council held no collateral as security. Credit risk – impaired investments In October 2008, the Icelandic banks Landsbanki, Kaupthing and Glitnir collapsed and the UK subsidiaries of the banks, Heritable and Kaupthing Singer and Friedlander went into administration. The Council had £4 million deposited with one of these institutions, with maturity dates and interest rates as follows:
Amount Invested Interest Rate Carrying Amount Impairment
Bank Date Invested Maturity Date £'000 % £'000 £'000
Landsbanki Islands 02/09/2008 02/12/2008 3,000 5.82 1,277 260
Landsbanki Islands 10/09/2008 10/12/2008 1,000 5.80 425 87
4,000 1,702 347
All monies within these institutions are currently subject to the respective administration and receivership processes. The amounts and timing of payments to depositors such as the Council will be determined by the administrators / receivers. The current situation with regards to recovery of the sums deposited varies between each institution and is covered by guidance issued by CIPFA (LAAP Bulletin 82 Update 7) on 17th May 2013, further amended on 28th May 2013. Based on the latest information available the Council considers that it is appropriate to make an impairment adjustment for the deposits, and has taken the action outlined below. The Authority continues to adopt a prudent approach and as the available information from administrators/receivers is not definitive as to the amounts and timings of future payments, and is based on estimates, further adjustments will be made in future years if required, once more detail has been made available on the final recovery amounts. Landsbanki Islands hf is an Icelandic entity. Following steps taken by the Icelandic Government in early October 2008 its domestic assets and liabilities were transferred to a new bank (new Landsbanki) with the management of the affairs of Old Landsbanki being placed in the hands of a resolution committee. Following the Icelandic Supreme Court decision to grant UK local authorities priority status, the winding up board made a distribution to creditors in a basket of currencies in February 2012. Further distributions were issued in May and October 2012. An element of the distribution is in Icelandic Kroner, which has been placed in an escrow account in Iceland and is earning interest of 4.17% as at 31 March 2013. This element of the distribution has been retained in Iceland due to currency controls currently operating there, and as a result is subject to exchange rate risk over which the Council has no control. The Council has recognised a gain in 2012/13 due to currency fluctuations. The current position on estimated future payouts is as shown in the table below, and the Council has used these estimates to calculate the impairment based on recovering 100p in the £.

51
Date Repayment
Received to 31 Mar 2012 49.65%
December 2013 7.5%
December 2014 7.5%
December 2015 7.5%
December 2016 7.5%
December 2017 7.5%
December 2018 7.5%
December 2019 5.35%
Recovery is subject to the impact of exchange rate fluctuations on the value of assets recovered by the resolution committee and on the settlement of the Council’s claim, which may be denominated wholly or partly in currencies other than sterling.
Recoveries are expressed as a percentage of the Council’s claim in the administration, which it is expected may validly include interest accrued up to the original expected maturity date of the investments. The expiry of the Capital Finance Regulations issued in May 2009 deferring the impact of the impairment, required the Council to charge an impairment of £872,000 to the General Fund in 2010/11. This figure was the cumulative effect of impairment loss calculations and interest receivable. It was calculated by discounting the assumed cash flows at the effective interest rate of the original deposits in order to recognise the anticipated loss of interest to the Council until monies are recovered. A reduction to the original impairment of £526,000 has been recognised in the Income and Expenditure Account in 2012/13. This reflects the latest guidance in the revised LAAP Bulletin, which takes into account the Council’s preferred creditor status, and the distributions received. Any significant adjustments to the assumptions will be made in future accounts as more information becomes available. Liquidity risk The Council manages its liquidity position through the risk management procedures above (the setting and approval of prudential indicators and the approval of the treasury and investment strategy reports), as well as through a comprehensive cash flow management system, as required by the CIPFA Code of Practice. This seeks to ensure that cash is available when needed. The Council has ready access to borrowings from the money markets to cover any day to day cash flow need, and the PWLB and money markets for access to longer term funds. The Council is also required to provide a balanced budget through the Local Government Finance Act 1992, which ensures sufficient monies are raised to cover annual expenditure. There is therefore no significant risk that it will be unable to raise finance to meet its commitments under financial instruments. All sums owing are due to be paid in less than one year. Refinancing and Maturity risk The Council maintains a significant debt and investment portfolio. Whilst the cash flow procedures above are considered against the refinancing risk procedures, longer-term risk to the Council relates to managing the exposure to replacing financial instruments as they mature. This risk relates to both the maturing of longer term financial liabilities and longer term financial assets. The approved treasury indicator limits for the maturity structure of debt and the limits placed on investments placed for greater than one year in duration are the key parameters used to address this risk. The Council approved treasury and investment strategies address the main risks, and the Financial Accounting team address the operational risks within the approved parameters. This includes:
• monitoring the maturity profile of financial liabilities and amending the profile through either new borrowing or the rescheduling of the existing debt; and
• monitoring the maturity profile of investments to ensure sufficient liquidity is available for the Council’s day to day cash flow needs, and the spread of longer term investments provide stability of maturities and returns in relation to the longer term cash flow needs.
The maturity analysis of financial liabilities showing the maximum and minimum limits for fixed interest rates maturing in each period (as approved by Council as part of the treasury Management Strategy) is as follows:

52
Approved
minimum %
Approved maximum
%
Actual 31 March
2013 £’000
Actual 31 March
2013 %
Actual 31 March
2012 £’000
Actual 31 March
2012 %
Less than 1 year 0.0 10.0 12,245 7.7 6,076 3.7
Between 1 and 2 years 0.0 50.0 - - 5,500 4.0
Between 2 and 5 years 0.0 50.0 4,000 2.9 4,000 2.9
Between 5 and 10 years 0.0 70.0 20,000 14.7 20,000 14.7
More than 10 years 0.0 100.0 101,594 74.7 101,594 74.7
Total 137,839 100.0 137,170 100.0
Market risk Interest rate risk The Council is exposed to interest rate movements on its borrowings and investments. Movements in interest rates have a complex impact on the Council, depending on how variable and fixed interest rates move across differing financial instrument periods. For instance, a rise in variable and fixed interest rates would have the following effects:
• Borrowings at variable rates – the interest expense charged to the Comprehensive Income and Expenditure Statement will rise;
• Borrowings at fixed rates – the fair value of the borrowing will fall (no impact on revenue balances);
• Investments at variable rates – the interest income credited to the Comprehensive Income and Expenditure Statement will rise; and
• Investments at fixed rates – the fair value of the assets will fall (no impact on revenue balances). Borrowings are not carried at fair value on the balance sheet, so nominal gains and losses on fixed rate borrowings would not impact on the Surplus or Deficit on the Provision of Services or Other Comprehensive Income and Expenditure. However, changes in interest payable and receivable on variable rate borrowings and investments will be posted to the Surplus or Deficit on the Provision of Services and affect the General Fund Balance, subject to influences from Government grants (i.e. HRA). Movements in the fair value of fixed rate investments that have a quoted market price will be reflected in the Other Comprehensive Income and Expenditure Statement. The Council has a number of strategies for managing interest rate risk. The Annual Treasury Management Strategy draws together Council’s prudential and treasury indicators and its expected treasury operations, including an expectation of interest rate movements. From this Strategy a treasury indicator is set which provides maximum limits for fixed and variable interest rate exposure. Our policy is to aim to keep a maximum of 50% of our borrowings in variable rate loans although currently all the Council’s debt is on fixed rates. The Financial Accounting team will monitor market and forecast interest rates within the year to adjust exposures appropriately. For instance during periods of falling interest rates, and where economic circumstances make it favourable, fixed rate investments may be taken for longer periods to secure better long term returns, similarly the drawing of longer term fixed rate borrowing would be postponed. If all interest rates had been 1% higher (with all other variables held constant) the financial effect would be:
31 March 2013 31 March 2012
£’000 £’000
Increase in interest payable on new fixed rate borrowings - 8
Increase in interest receivable on short term investments made in year (351) (246)
Impact on Surplus or Deficit on the Provision of Services (351) (238)
Share of overall impact credited to the HRA (net) (53) (30)
Decrease in fair value of fixed rate borrowings liabilities (no impact on the Surplus or Deficit on the Provision of Services or Other Comprehensive Income and Expenditure)
19,975 18,645
Decrease in fair value of investments (loans and receivables) (no impact on the Surplus or Deficit on the Provision of Services or Other Comprehensive Income and Expenditure)
16 16
The approximate impact of a 1% fall in interest rates would be as above but with the movements being reversed. These assumptions are based on the same methodology as used in the disclosures on the Fair Value of Assets and Liabilities carried at Amortised Cost.

53
Price risk The Council, excluding the pension fund, does not generally invest in equity shares or marketable bonds so has no significant exposure to losses arising from movements in the prices of shares. Foreign exchange risk The Council has foreign exchange exposure resulting from an element of the settlement received from Landsbanki. This is being held in Icelandic Kroner in an escrow account due to the current imposition of currency controls. The Council has no other financial assets (investments) or liabilities (borrowings) denominated in foreign currencies and thus has no further exposure to loss arising from movements in exchange rates. 21. Long Term Debtors These are debtors which fall due over a period of at least one year. They comprise mortgages held by the Council, sums repayable on sale of the property and finance lease debtors. Category Balance at
1 April 2012
Interest adjustment
Advances in the Year
Repayments In the Year
Balance at 31 March
2013
£’000 £’000 £’000 £’000 £’000
Sale of Council Houses 52 - - (25) 27
Purchase/Improvement of Private Sector Houses 20 - - (13) 7
Improvement of Private Sector Houses -interest free
557 (2) 87 (62) 580
Finance lease debtor 114 - - (6) 108
Total 743 (2) 87 (106) 722
Interest free advances have been made under the Financial Assistance Policy for Private Sector Housing. These are secured against the property and repayable on sale. The “loss” for interest foregone is calculated based on the current market rate, at the end of the year in which the advance is recognised, for an equivalent loan and using an assumed average life for the loans. The reduced loans balance thus created will be written back up to full value over the life of the loans (see Note 28). The interest adjustment for the year reflects:-
• “loss” of interest foregone on advances made in the year – (£38,000)
• one year write back of value of loans outstanding at beginning of year– £36,000 22. Assets Held for Sale
31 March 2013 31 March 2012
£’000 £’000
Balance at 1 April 2,294 398
Assets reclassified as held for sale from Property, Plant & Equipment 390 2,253
Revaluation losses - (15)
Disposals (1,583) (342)
Balance at 31 March – Assets Held for Sale 1,101 2,294

54
23. Short Term Debtors
31 March 2013 31 March 2012
£’000 £’000
Central Government bodies 2,652 3,275
Other local authorities 3,177 1,675
Other entities and individuals 4,618 3,846
Total Short Term Debtors 10,447 8,796
The above short term debtor values are presented net of impairments (allowances for non-collection). 24. Cash and Cash Equivalents
31 March 2013 31 March 2012
£’000 £’000
Cash held by the Council 35 36
Bank current accounts 616 1,277
Short term deposits 19,138 18,048
Total Cash and Cash Equivalents 19,789 19,361
25. Short Term Creditors
31 March 2013 31 March 2012
£’000 £’000
Central Government bodies (1,540) (5,742)
Other local authorities (1,579) (2,961)
NHS bodies (7) -
Public corporations and trading funds - (38)
Other entities and individuals (6,349) (5,200)
Total Short Term Creditors (9,475) (13,941)
26. Provisions
Balance at 1 April
2011
Additional provisions
Amounts used
Balance at 31 March
2012
Additional provisions
Amounts used
Balance at 31 March
2013
£’000 £’000 £’000 £’000 £’000 £’000 £’000
Insurance Provision (384) (40) 23 (401) (125) 25 (501)
The Insurance Provision has been set aside to meet the estimated cost to the Council of outstanding insurance claims. However the actual cost of individual claims and the timing of payments are uncertain. The Insurance Fund has been allocated between the provision and reserve elements (refer to Note 10). The major risks covered at present are: (1) Housing Stock – Property damage up to external insurance excess of £25,000 per claim but with an
overall aggregate with general properties, for any one period of insurance, of £100,000. Subsidence between October 1998 and July 2008 with an excess of £1,500. Subsidence is now covered by the Council’s external building insurance policy up to external insurance excess of £25,000 per claim but with an overall aggregate with general properties, for any one period of insurance, of £100,000.
(2) General Properties – Property damage up to external insurance excess of £25,000 per claim but with
an overall aggregate with Housing stock, for any one period of insurance, of £100,000. (3) All Risk Items – Accidental damage or any loss associated with theft which is excluded from our
external theft policy but qualifies under the provision policy.

55
27. Usable Reserves The movements in the Council’s usable reserves are detailed in the Movement in Reserves Statement on page 9. 28. Unusable Reserves
31 March 2013 31 March 2012
£’000 £’000
Revaluation Reserve 24,056 25,583
Capital Adjustment Account 258,407 271,134
Financial Instruments Adjustment Account (511) (721)
Pensions Reserve (94,912) (84,952)
Deferred Capital Receipts Reserve 27 52
Collection Fund Adjustment Account 116 6
Accumulated Absences Account (484) (579)
Total – Unusable Reserves 186,699 210,523
Revaluation Reserve The Revaluation Reserve contains the gains made by the Council arising from increases in the value of its Property, Plant and Equipment. The balance is reduced when assets with accumulated gains are:
• revalued downwards or impaired and the gains are lost
• used in the provision of services and the gains are consumed through depreciation, or
• disposed of and the gains are realised. This reserve contains only revaluation gains accumulated since 1 April 2007, the date that the reserve was created. Accumulated gains arising before that date are consolidated into the balance on the Capital Adjustment Account.
2012/13 2011/12
£’000 £’000
Balance at 1 April 25,583 23,349
Upward revaluation of assets
311 4,492
Downward revaluation of assets not charged to the Surplus/Deficit on the Provision of Services
(625) (865)
Impairment losses not charged to the Surplus/Deficit on the Provision of Services
- (815)
Surplus/Deficit on revaluation of non-current assets not posted to the Surplus/Deficit on the Provision of Services
(314) 2,812
Difference between fair value depreciation and historical cost depreciation (301) (307)
Accumulated gains on assets sold/scrapped (912) -
Accumulated gains on assets written out - (271)
Amount written off to the Capital Adjustment Account (1,213) (578)
Balance at 31 March 24,056 25,583
Capital Adjustment Account The Capital Adjustment Account absorbs the timing differences arising from the different arrangements for accounting for the consumption of non-current assets and for financing the acquisition, construction or enhancement of those assets under statutory provisions. This account is debited with the cost of acquisition, construction or enhancement as depreciation; impairment losses and amortisation are charged to the Comprehensive Income and Expenditure Statement (with reconciling postings from the Revaluation Reserve to convert fair value figures to a historical cost basis). This account is credited with the amounts set aside by the Council as finance for the costs of acquisition, construction and enhancement. This account contains accumulated gains and losses on Investment Properties and gains recognised on donated assets that have yet to be consumed by the Council.

56
This account also contains revaluation gains accumulated on Property, Plant and Equipment before 1 April 2007, the date that the Revaluation Reserve was created to hold such gains. Note 9 details the adjustments between accounting basis and funding basis under regulations and provides details of the source of all the transactions posted to this account, apart from those involving the Revaluation Reserve.
2012/13 2011/12
£’000 £’000
Balance at 1 April 271,134 366,529
Reversal of items relating to capital expenditure debited or credited to the Comprehensive Income and Expenditure Statement:
Charges for depreciation of non current assets (9,184) (9,993)
Charges for impairment of non current assets (81) (247)
Derecognition of components of non current assets (756) (5,041)
Revaluation losses on Property, Plant and Equipment (10,241) (17,285)
Revaluation losses on Heritage Assets (82) (148)
Revaluation losses on Assets Held for Sale - (15)
Reversal of previously recognised revaluation losses 723 6
Amounts of non current assets written off on disposal or sale as part of the gain/loss on disposal to the Comprehensive Income and Expenditure Statement
(2,823) (1,622)
Amortisation of Intangible Assets (338) (339)
Revenue expenditure funded from capital under statute (3,476) (1,387)
Long Term Debtors (75) (73)
Adjusting amounts written out of the Revaluation Reserve 1,213 578
Net written out amount of the cost of non-current assets consumed in the year (25,120) (35,566)
Capital financing applied in the year:
Use of the Capital Receipts Reserve to finance new capital expenditure 875 (373)
Use of the Major Repairs Reserve to finance new capital expenditure 5,452 5,704
Use of the Earmarked Reserves to finance new capital expenditure 816 1,632
Capital grants and contributions credited to the Comprehensive Income and Expenditure Statement that have been applied to capital financing
3,835 5,721
Application of grants to capital financing from the Capital Grants Unapplied Account
- 302
Statutory provision for the financing of capital investment charged against the General Fund and HRA balances
773 693
Capital expenditure charged against the General Fund and HRA balances
1,540 642
Settlement payment to Government for HRA self-financing - (73,694)
13,291 (59,373)
Movements in the fair value of Investment Properties (1,226) (456)
Donated asset income 328 -
Balance at 31 March 258,407 271,134
Financial Instruments Adjustment Account The Financial Instruments Adjustment Account absorbs the timing differences arising from the different arrangements for accounting for income and expenses relating to certain financial instruments and for bearing losses or benefiting from gains per statutory provisions. The Council uses the Account to manage premiums paid on the early redemption of loans. Premiums are debited to the Comprehensive Income and Expenditure Statement when they are incurred, but reversed out of the General Fund Balance to the Account in the Movement in Reserves Statement. Over time, the expense is posted back to the General Fund Balance in accordance with statutory arrangements for spreading the burden on Council Tax.
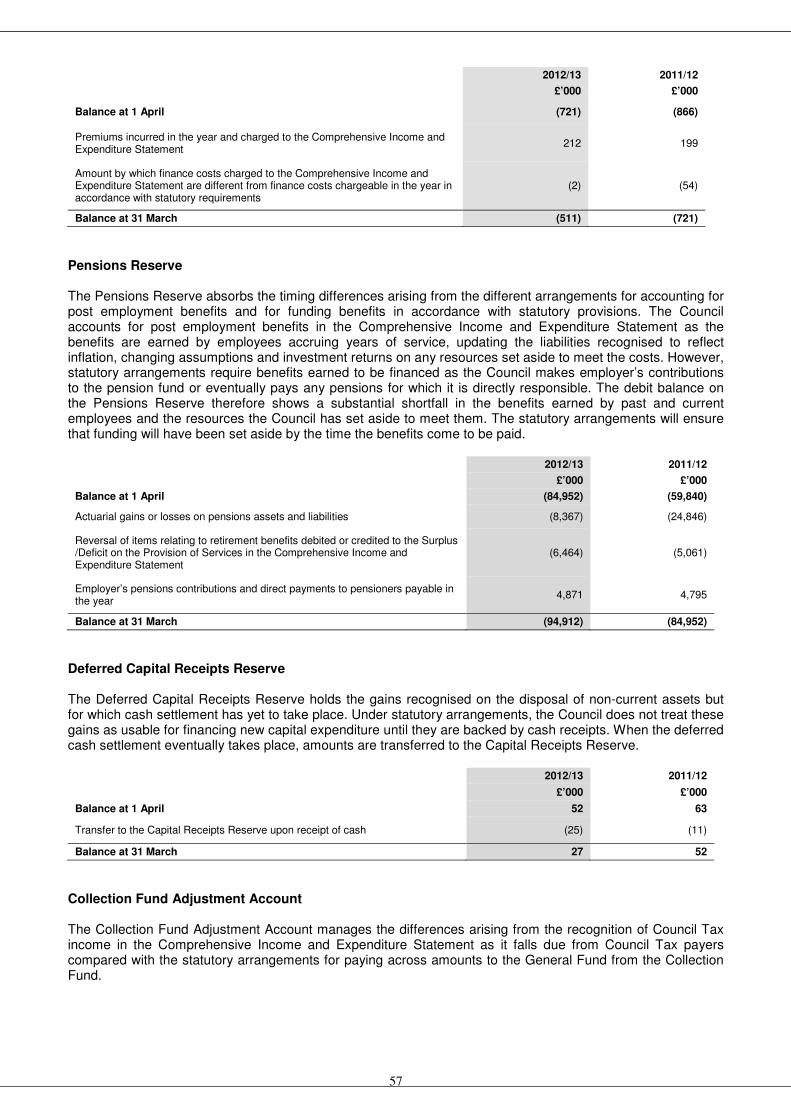
57
2012/13 2011/12
£’000 £’000
Balance at 1 April (721) (866)
Premiums incurred in the year and charged to the Comprehensive Income and Expenditure Statement
212 199
Amount by which finance costs charged to the Comprehensive Income and Expenditure Statement are different from finance costs chargeable in the year in accordance with statutory requirements
(2) (54)
Balance at 31 March (511) (721)
Pensions Reserve The Pensions Reserve absorbs the timing differences arising from the different arrangements for accounting for post employment benefits and for funding benefits in accordance with statutory provisions. The Council accounts for post employment benefits in the Comprehensive Income and Expenditure Statement as the benefits are earned by employees accruing years of service, updating the liabilities recognised to reflect inflation, changing assumptions and investment returns on any resources set aside to meet the costs. However, statutory arrangements require benefits earned to be financed as the Council makes employer’s contributions to the pension fund or eventually pays any pensions for which it is directly responsible. The debit balance on the Pensions Reserve therefore shows a substantial shortfall in the benefits earned by past and current employees and the resources the Council has set aside to meet them. The statutory arrangements will ensure that funding will have been set aside by the time the benefits come to be paid.
2012/13 2011/12
£’000 £’000
Balance at 1 April (84,952) (59,840)
Actuarial gains or losses on pensions assets and liabilities (8,367) (24,846)
Reversal of items relating to retirement benefits debited or credited to the Surplus /Deficit on the Provision of Services in the Comprehensive Income and Expenditure Statement
(6,464) (5,061)
Employer’s pensions contributions and direct payments to pensioners payable in the year
4,871 4,795
Balance at 31 March (94,912) (84,952)
Deferred Capital Receipts Reserve The Deferred Capital Receipts Reserve holds the gains recognised on the disposal of non-current assets but for which cash settlement has yet to take place. Under statutory arrangements, the Council does not treat these gains as usable for financing new capital expenditure until they are backed by cash receipts. When the deferred cash settlement eventually takes place, amounts are transferred to the Capital Receipts Reserve.
2012/13 2011/12
£’000 £’000
Balance at 1 April 52 63
Transfer to the Capital Receipts Reserve upon receipt of cash (25) (11)
Balance at 31 March 27 52
Collection Fund Adjustment Account The Collection Fund Adjustment Account manages the differences arising from the recognition of Council Tax income in the Comprehensive Income and Expenditure Statement as it falls due from Council Tax payers compared with the statutory arrangements for paying across amounts to the General Fund from the Collection Fund.

58
2012/13 2011/12
£’000 £’000
Balance at 1 April 6 (8)
Amount by which Council Tax income credited to the Comprehensive Income and Expenditure Statement is different from Council Tax income calculated for the year in accordance with statutory requirements
110 14
Balance at 31 March 116 6
Accumulated Absences Account The Accumulated Absences Account absorbs the differences that would otherwise arise on the General Fund Balance from accruing for compensated absences earned but not taken in the year, e.g. annual leave entitlement carried forward at 31 March. Statutory arrangements require that the impact on the General Fund Balance is neutralised by transfers to or from the Account.
2012/13 2011/12
£’000 £’000
Balance at 1 April (579) (560)
Settlement or cancellation of accrual made at the end of the preceding year 579 560
Amounts accrued at the end of the current year (484) (579)
Amount by which officer remuneration charged to the Comprehensive Income and Expenditure Statement on an accruals basis is different from remuneration chargeable in the year in accordance with statutory requirements
95 (19)
Balance at 31 March (484) (579)
29. Cash Flow Statement – Net Cash Flows from Operating Activities
2012/13 2011/12
£’000 £’000
Net Surplus/(Deficit) on the Provision of Services (11,580) (94,066)
Adjustments for non cash movements:
Depreciation 9,184 9,993
Impairment and downward revaluations 10,404 17,695
Reversal of previous revaluation losses (723) (6)
Carrying value of non current assets sold 2,822 1,622
De-recognition of non current assets 756 5,041
Movement in Investment Property Values 1,226 456
Donated asset income (328) -
Amortisation 338 339
Impairment losses on Investments - 3
Reversal of previously recognised impairment losses on Investments (528) -
Increase/(Decrease) in Interest Creditors 764 16
Increase/(Decrease) in Creditors (3,247) 4,447
(Increase)/Decrease in Interest Debtors (42) 6
(Increase)/Decrease in Debtors (249) 23
(Increase)/Decrease in Inventories 26 35
Contributions to/(from) Provisions 100 17
Movement in pension liability 1,593 266
Other non cash movements 20 54
22,116 40,007
Adjustments for items that are investing or financing activities:
Capital grants credited to the Surplus/Deficit on the Provision of Services (3,939) (5,721)
Proceeds from the sale of short and long term investments 1,730 6,691
Proceeds from the sale of non current assets (2,527) (2,333)
(4,736) (1,363)
Net Cash Flows from Operating Activities 5,800 (55,422)

59
The cash flows for operating activities within the Cash Flow Statement include the following items:
2012/13 2011/12
£’000 £’000
Interest Received 175 177
Interest Paid (5,651) (3,750)
30. Cash Flow Statement – Net Cash Flows from Investing Activities
2012/13 2011/12
£’000 £’000
Purchase of non current assets (9,081) (14,410)
Purchase of short-term and long-term investments (2,500) (1,000)
Other payments for investing activities (88) (193)
Proceeds from the sale of non current assets 2,506 2,266
Other receipts from investing activities 3,115 8,195
Net Cash Flows from Investing Activities (6,048) (5,142)
31. Cash Flow Statement – Net Cash Flows from Financing Activities
2012/13 2011/12
£’000 £’000
Cash receipts of short and long-term borrowing - 73,694
Cash payments for the reduction of the outstanding finance lease liabilities (217) (30)
Other receipts/payments for financing activities (2,291) 5,321
Net Cash Flows from Financing Activities (2,508) 78,985
32. Cash Flow Statement – Cash and Cash Equivalents
2012/13 2011/12
£’000 £’000
Cash held by the Council 35 36
Bank current accounts 616 1,277
Short term deposits 19,138 18,048
Bank overdraft (3,184) -
Cash Flow Statement - Total Cash and Cash Equivalents 16,605 19,361
33. Amounts reported for Resource Allocation Decisions The analysis of income and expenditure by service on the face of the Comprehensive Income and Expenditure Statement is that specified by the Service Reporting Code of Practice. However, decisions about resource allocation are taken by the Council on the basis of budget reports analysed across services. These reports are prepared on a different basis from the accounting policies used in the financial statements. In particular:
• no charges are made in relation to capital expenditure (whereas depreciation, revaluation and impairment losses in excess of the balance on the Revaluation Reserve and amortisation are all charged to services in the Comprehensive Income and Expenditure Statement)
• the cost of retirement benefits is based on cash flows (payment of employer’s pensions contributions) rather than current service cost of benefits accrued in the year
• expenditure on some support services is budgeted for centrally and not charged to services.

60
The income and expenditure of the Council’s services recorded in the budget reports for the year is as follows:
Service Income and Expenditure 2012/13
Co
rpo
rate
an
d
Dem
ocra
tic
Co
re
Execu
tive
Man
ag
em
en
t T
eam
Co
rpo
rate
M
an
ag
em
en
t
Cu
sto
mer
Serv
ice C
en
tre
En
vir
on
men
tal
an
d P
rote
cti
ve
Serv
ices
Lif
e
Op
po
rtu
nit
ies
Reso
urc
e
Man
ag
em
en
t
Str
ate
gic
Po
licy
an
d
Reg
en
era
tio
n
Str
eet
Serv
ices
Ho
usin
g
Reven
ue
Acco
un
t
To
tal
£’000 £’000 £’000 £’000 £’000 £’000 £’000 £’000 £’000 £’000 £’000 Fees, charges & other service income
- (283) (1,021) (106) (4,523) (5,726) (540) (3,164) (9,665) (34,539) (59,567)
Government grants - (18) - - (545) (69) (361) (9) (541) - (1,543)
Total Income - (301) (1,021) (106) (5,068) (5,795) (901) (3,173) (10,206) (34,539) (61,110)
Employee expenses - 851 2,708 1,040 5,042 5,054 2,479 1,540 7,412 218 26,344
Other service expenses 284 187 4,457 11 2,184 5,634 1,865 1,443 5,088 29,738 50,891
Support service recharges - - - - - - - - - 3,333 3,333
Total Expenditure 284 1,038 7,165 1,051 7,226 10,688 4,344 2,983 12,500 33,289 80,568
Net Expenditure 284 737 6,144 945 2,158 4,893 3,443 (190) 2,294 (1,250) 19,458
Service Income and Expenditure 2011/12
Co
rpo
rate
an
d
Dem
ocra
tic
Co
re
Execu
tive
Man
ag
em
en
t T
eam
Co
rpo
rate
M
an
ag
em
en
t
Cu
sto
mer
Serv
ice C
en
tre
En
vir
on
men
tal
an
d P
rote
cti
ve
Serv
ices
Lif
e
Op
po
rtu
nit
ies
Reso
urc
e
Man
ag
em
en
t
Str
ate
gic
Po
licy
an
d
Reg
en
era
tio
n
Str
eet
Serv
ices
Ho
usin
g
Reven
ue
Acco
un
t
To
tal
£’000 £’000 £’000 £’000 £’000 £’000 £’000 £’000 £’000 £’000 £’000 Fees, charges & other service income
- (182) (1,030) (111) (4,501) (5,944) (3,650) (4,181) (9,896) (109,221) (138,716)
Government grants - - - - (1,033) (99) (241) (538) - - (1,911)
Total Income - (182) (1,030) (111) (5,534) (6,043) (3,891) (4,719) (9,896) (109,221) (140,627)
Employee expenses - 781 2,763 1,089 5,663 4,975 2,961 1,473 7,113 272 27,090
Other service expenses 311 128 4,645 59 2,001 5,754 2,168 5,518 5,097 106,229 131,910
Support service recharges - - - - - - - - - 3,102 3,102
Total Expenditure 311 909 7,408 1,148 7,664 10,729 5,129 6,991 12,210 109,603 162,102
Net Expenditure 311 727 6,378 1,037 2,130 4,686 1,238 2,272 2,314 382 21,475
Reconciliation of Service Income and Expenditure to Cost of Services in the Comprehensive Income and Expenditure Statement This reconciliation shows how the figures in the analysis of service income and expenditure relate to the amounts included in the Comprehensive Income and Expenditure Statement.
31 March 2013 31 March 2012
£’000 £’000
Net expenditure in the Services Analysis 19,458 21,475
Net expenditure of services and support services not included in the Analysis (30,078) (28,248)
Amounts in the Comprehensive Income and Expenditure Statement not reported to management in the Analysis
77,666 62,027
Amounts included in the Analysis not included in the Comprehensive Income and Expenditure Statement
(37,874) 61,169
Cost of Services in Comprehensive Income and Expenditure Statement 29,172 116,423

61
Reconciliation to Subjective Analysis This reconciliation shows how the figures in the analysis of service income and expenditure relate to a subjective analysis of the Surplus/Deficit on the Provision of Services included in the Comprehensive Income and Expenditure Statement.
2012/13
Serv
ice
An
aly
sis
Serv
ices a
nd
S
up
po
rt
Serv
ices n
ot
in
An
aly
sis
Am
ou
nts
no
t re
po
rted
to
m
an
ag
em
en
t fo
r d
ecis
ion
makin
g
Am
ou
nts
no
t in
clu
ded
in
I&
E
Co
st
of
Serv
ices
Co
rpo
rate
A
mo
un
ts
To
tal
£’000 £’000 £’000 £’000 £’000 £’000 £’000 Fees, charges & other service income (59,567) (907) (269) 9,761 (50,982) - (50,982)
Interest and Investment income - - (6,560) 6,560 - (253) (253)
Income in relation to investment properties - - - - - (1,965) (1,965)
Income from Council Tax - - - - - (11,945) (11,945)
Movement in fair value of investment properties
- - - - - (46) (46)
Government grants and contributions (1,543) (67,451) - 173 (68,821) (14,944) (83,765)
Total Income (61,110) (68,358) (6,829) 16,494 (119,803) (29,153) (148,956)
Employee expenses 26,344 (95) 319 (1,120) 25,448 - 25,448
Other service expenses 50,891 - 84,176 (6,411) 128,656 - 128,656
Support Service recharges 3,333 38,375 - (41,083) 625 - 625
Depreciation, amortisation and impairment - - - (5,754) (5,754) - (5,754)
Interest Payments - - - - - 5,887 5,887
Precepts and Levies - - - - - 1,101 1,101
Payments to Housing Capital Receipts Pool
- - - - - 356 356 Expenditure in relation to investment properties
- - - - - 76 76
Movement in the fair value of investment properties
- - - - - 1,226 1,226
Pension interest cost and expected return on investments
- - - - - 2,568 2,568
Gain/Loss on Disposal of Non Current Assets
- - - - 347 347
Total Expenditure 80,568 38,280 84,495 (54,368) 148,975 11,561 160,536
Surplus/Deficit on the Provision of Services
19,458 (30,078) 77,666 (37,874) 29,172 (17,592) 11,580
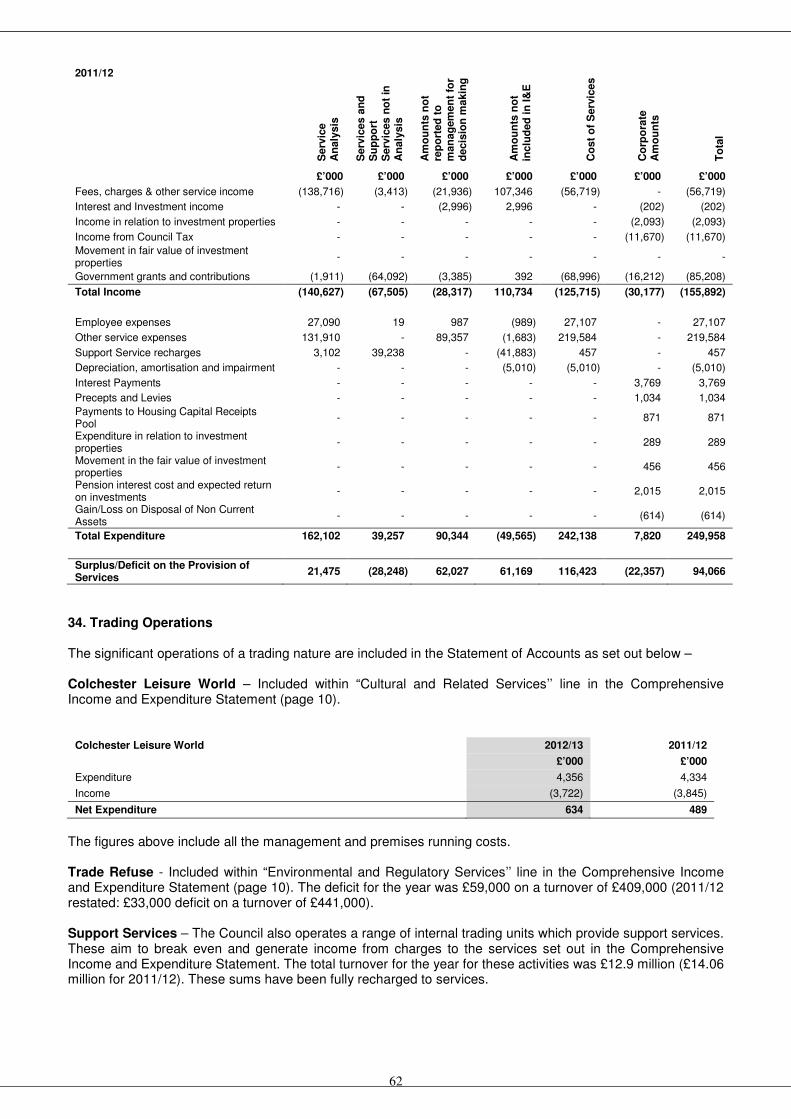
62
2011/12
Serv
ice
An
aly
sis
Serv
ices a
nd
S
up
po
rt
Serv
ices n
ot
in
An
aly
sis
Am
ou
nts
no
t re
po
rted
to
m
an
ag
em
en
t fo
r d
ecis
ion
makin
g
Am
ou
nts
no
t in
clu
ded
in
I&
E
Co
st
of
Serv
ices
Co
rpo
rate
A
mo
un
ts
To
tal
£’000 £’000 £’000 £’000 £’000 £’000 £’000 Fees, charges & other service income (138,716) (3,413) (21,936) 107,346 (56,719) - (56,719)
Interest and Investment income - - (2,996) 2,996 - (202) (202)
Income in relation to investment properties - - - - - (2,093) (2,093)
Income from Council Tax - - - - - (11,670) (11,670)
Movement in fair value of investment properties
- - - - - - -
Government grants and contributions (1,911) (64,092) (3,385) 392 (68,996) (16,212) (85,208)
Total Income (140,627) (67,505) (28,317) 110,734 (125,715) (30,177) (155,892)
Employee expenses 27,090 19 987 (989) 27,107 - 27,107
Other service expenses 131,910 - 89,357 (1,683) 219,584 - 219,584
Support Service recharges 3,102 39,238 - (41,883) 457 - 457
Depreciation, amortisation and impairment - - - (5,010) (5,010) - (5,010)
Interest Payments - - - - - 3,769 3,769
Precepts and Levies - - - - - 1,034 1,034
Payments to Housing Capital Receipts Pool
- - - - - 871 871
Expenditure in relation to investment properties
- - - - - 289 289
Movement in the fair value of investment properties
- - - - - 456 456
Pension interest cost and expected return on investments
- - - - - 2,015 2,015
Gain/Loss on Disposal of Non Current Assets
- - - - - (614) (614)
Total Expenditure 162,102 39,257 90,344 (49,565) 242,138 7,820 249,958
Surplus/Deficit on the Provision of Services
21,475 (28,248) 62,027 61,169 116,423 (22,357) 94,066
34. Trading Operations The significant operations of a trading nature are included in the Statement of Accounts as set out below – Colchester Leisure World – Included within “Cultural and Related Services’’ line in the Comprehensive Income and Expenditure Statement (page 10).
Colchester Leisure World 2012/13 2011/12
£’000 £’000
Expenditure 4,356 4,334
Income (3,722) (3,845)
Net Expenditure 634 489
The figures above include all the management and premises running costs. Trade Refuse - Included within “Environmental and Regulatory Services’’ line in the Comprehensive Income and Expenditure Statement (page 10). The deficit for the year was £59,000 on a turnover of £409,000 (2011/12 restated: £33,000 deficit on a turnover of £441,000). Support Services – The Council also operates a range of internal trading units which provide support services. These aim to break even and generate income from charges to the services set out in the Comprehensive Income and Expenditure Statement. The total turnover for the year for these activities was £12.9 million (£14.06 million for 2011/12). These sums have been fully recharged to services.
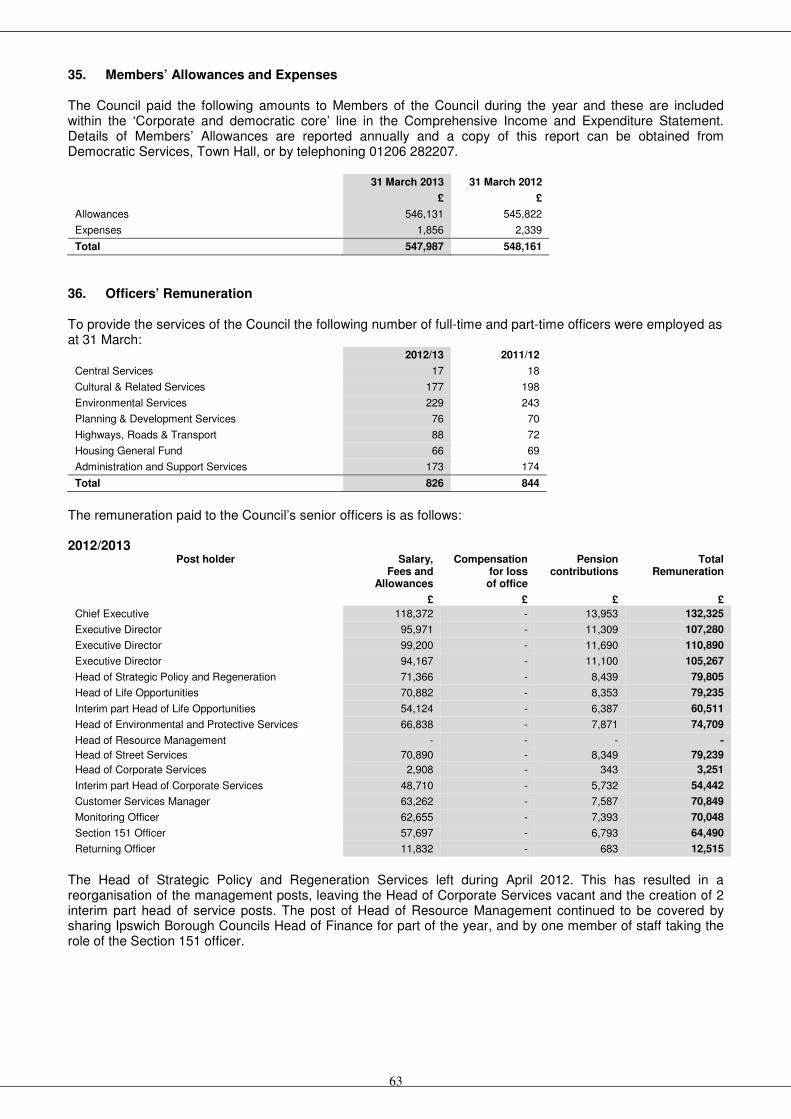
63
35. Members’ Allowances and Expenses The Council paid the following amounts to Members of the Council during the year and these are included within the ‘Corporate and democratic core’ line in the Comprehensive Income and Expenditure Statement. Details of Members’ Allowances are reported annually and a copy of this report can be obtained from Democratic Services, Town Hall, or by telephoning 01206 282207.
31 March 2013 31 March 2012
£ £
Allowances 546,131 545,822
Expenses 1,856 2,339
Total 547,987 548,161
36. Officers’ Remuneration To provide the services of the Council the following number of full-time and part-time officers were employed as at 31 March:
2012/13 2011/12
Central Services 17 18
Cultural & Related Services 177 198
Environmental Services 229 243
Planning & Development Services 76 70
Highways, Roads & Transport 88 72
Housing General Fund 66 69
Administration and Support Services 173 174
Total 826 844
The remuneration paid to the Council’s senior officers is as follows: 2012/2013
Post holder
Salary, Fees and
Allowances
Compensation for loss of office
Pension contributions
Total Remuneration
£ £ £ £
Chief Executive 118,372 - 13,953 132,325
Executive Director 95,971 - 11,309 107,280
Executive Director 99,200 - 11,690 110,890
Executive Director 94,167 - 11,100 105,267
Head of Strategic Policy and Regeneration 71,366 - 8,439 79,805
Head of Life Opportunities 70,882 - 8,353 79,235
Interim part Head of Life Opportunities 54,124 - 6,387 60,511
Head of Environmental and Protective Services 66,838 - 7,871 74,709
Head of Resource Management - - - -
Head of Street Services 70,890 - 8,349 79,239
Head of Corporate Services 2,908 - 343 3,251
Interim part Head of Corporate Services 48,710 - 5,732 54,442
Customer Services Manager 63,262 - 7,587 70,849
Monitoring Officer 62,655 - 7,393 70,048
Section 151 Officer 57,697 - 6,793 64,490
Returning Officer 11,832 - 683 12,515
The Head of Strategic Policy and Regeneration Services left during April 2012. This has resulted in a reorganisation of the management posts, leaving the Head of Corporate Services vacant and the creation of 2 interim part head of service posts. The post of Head of Resource Management continued to be covered by sharing Ipswich Borough Councils Head of Finance for part of the year, and by one member of staff taking the role of the Section 151 officer.
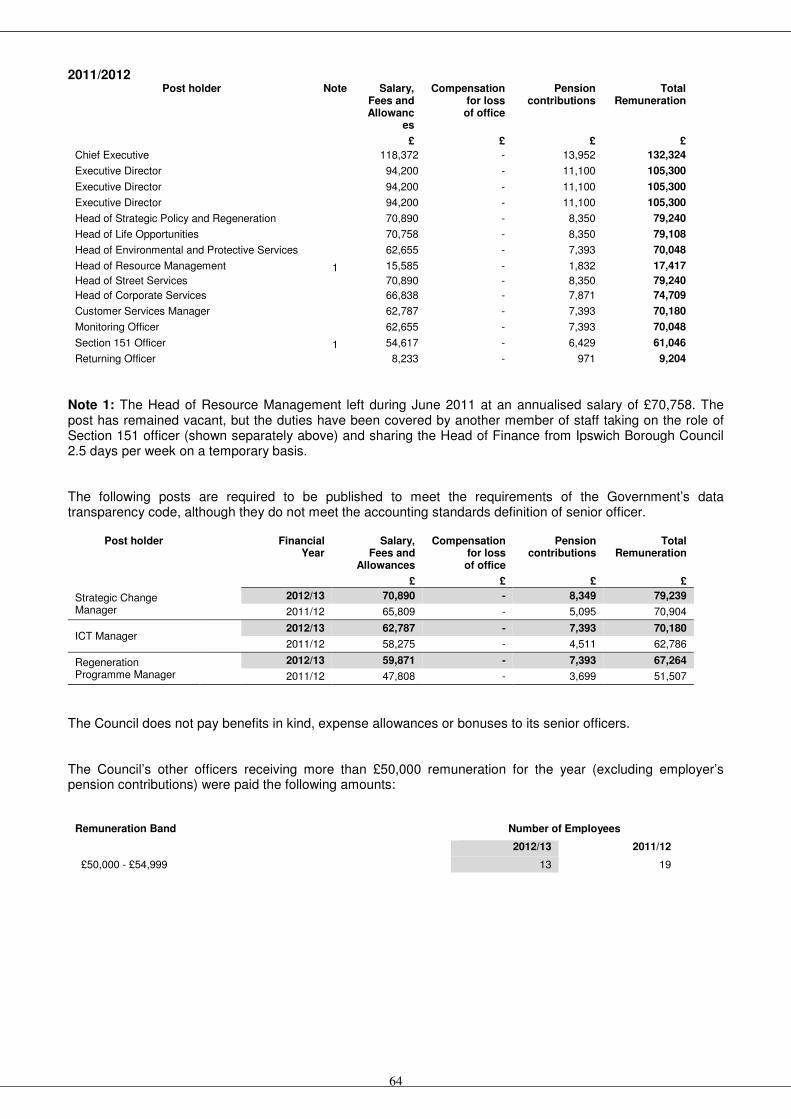
64
2011/2012 Post holder
Note
Salary,
Fees and Allowanc
es
Compensation for loss of office
Pension contributions
Total Remuneration
£ £ £ £
Chief Executive 118,372 - 13,952 132,324
Executive Director 94,200 - 11,100 105,300
Executive Director 94,200 - 11,100 105,300
Executive Director 94,200 - 11,100 105,300
Head of Strategic Policy and Regeneration 70,890 - 8,350 79,240
Head of Life Opportunities 70,758 - 8,350 79,108
Head of Environmental and Protective Services 62,655 - 7,393 70,048
Head of Resource Management 1 15,585 - 1,832 17,417
Head of Street Services 70,890 - 8,350 79,240
Head of Corporate Services 66,838 - 7,871 74,709
Customer Services Manager 62,787 - 7,393 70,180
Monitoring Officer 62,655 - 7,393 70,048
Section 151 Officer 1 54,617 - 6,429 61,046
Returning Officer 8,233 - 971 9,204
Note 1: The Head of Resource Management left during June 2011 at an annualised salary of £70,758. The post has remained vacant, but the duties have been covered by another member of staff taking on the role of Section 151 officer (shown separately above) and sharing the Head of Finance from Ipswich Borough Council 2.5 days per week on a temporary basis. The following posts are required to be published to meet the requirements of the Government’s data transparency code, although they do not meet the accounting standards definition of senior officer.
Post holder
Financial Year
Salary, Fees and
Allowances
Compensation for loss of office
Pension contributions
Total Remuneration
£ £ £ £
Strategic Change Manager
2012/13 70,890 - 8,349 79,239
2011/12 65,809 - 5,095 70,904
ICT Manager 2012/13 62,787 - 7,393 70,180
2011/12 58,275 - 4,511 62,786
Regeneration Programme Manager
2012/13 59,871 - 7,393 67,264
2011/12 47,808 - 3,699 51,507
The Council does not pay benefits in kind, expense allowances or bonuses to its senior officers. The Council’s other officers receiving more than £50,000 remuneration for the year (excluding employer’s pension contributions) were paid the following amounts:
Remuneration Band Number of Employees
2012/13 2011/12
£50,000 - £54,999 13 19
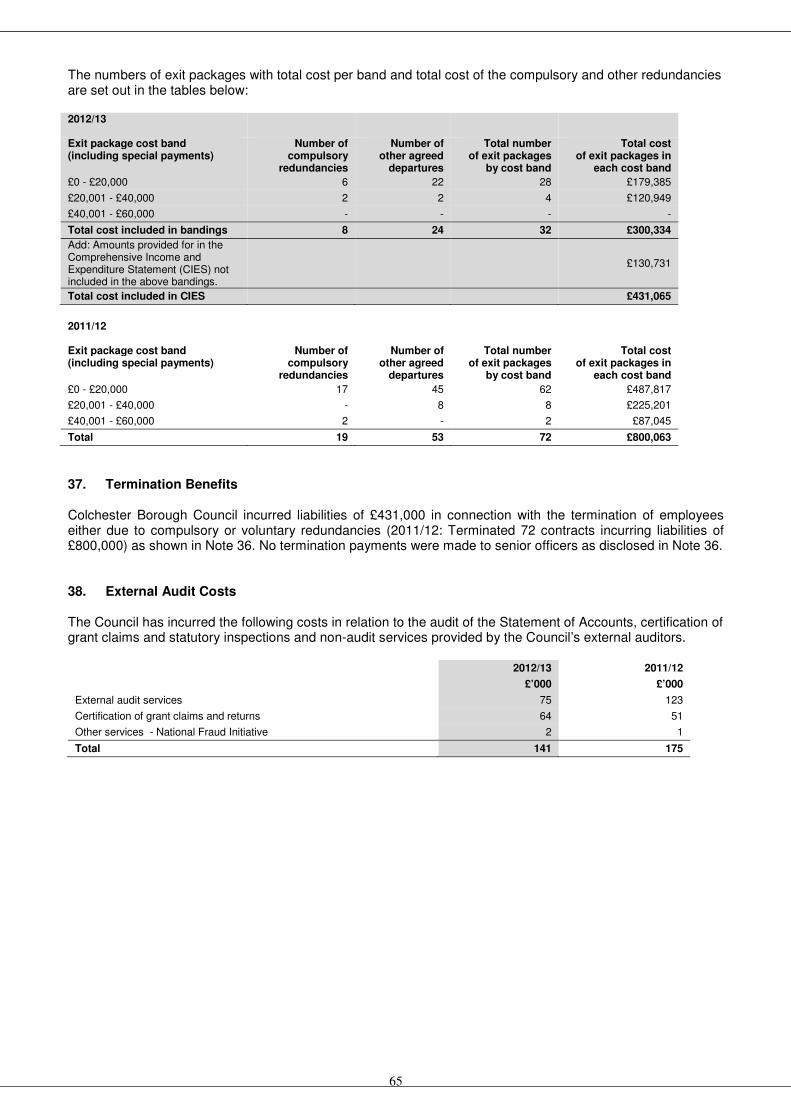
65
The numbers of exit packages with total cost per band and total cost of the compulsory and other redundancies are set out in the tables below: 2012/13
Exit package cost band (including special payments)
Number of compulsory
redundancies
Number of other agreed
departures
Total number of exit packages
by cost band
Total cost of exit packages in
each cost band
£0 - £20,000 6 22 28 £179,385
£20,001 - £40,000 2 2 4 £120,949
£40,001 - £60,000 - - - -
Total cost included in bandings 8 24 32 £300,334
Add: Amounts provided for in the Comprehensive Income and Expenditure Statement (CIES) not included in the above bandings.
£130,731
Total cost included in CIES £431,065
2011/12
Exit package cost band (including special payments)
Number of compulsory
redundancies
Number of other agreed
departures
Total number of exit packages
by cost band
Total cost of exit packages in
each cost band
£0 - £20,000 17 45 62 £487,817
£20,001 - £40,000 - 8 8 £225,201
£40,001 - £60,000 2 - 2 £87,045
Total 19 53 72 £800,063
37. Termination Benefits Colchester Borough Council incurred liabilities of £431,000 in connection with the termination of employees either due to compulsory or voluntary redundancies (2011/12: Terminated 72 contracts incurring liabilities of £800,000) as shown in Note 36. No termination payments were made to senior officers as disclosed in Note 36. 38. External Audit Costs The Council has incurred the following costs in relation to the audit of the Statement of Accounts, certification of grant claims and statutory inspections and non-audit services provided by the Council’s external auditors.
2012/13 2011/12
£’000 £’000
External audit services 75 123
Certification of grant claims and returns 64 51
Other services - National Fraud Initiative 2 1
Total 141 175

66
39. Grant Income The Council credited the following grants, contributions and donations to the Comprehensive Income and Expenditure Statement -
2012/13 2011/12
£’000 £’000
Restated
Credited to Taxation and Non Specific Grant Income
Revenue Support Grant 165 2,196
Council Tax Freeze Grant 269 267
Local Services Support Grant 197 197
New Homes Bonus 1,525 724
Community Right to Challenge 9 -
Assets of Community Value 5 -
Capital Grants received from:
Department of Communities and Local Government 514 892
English Heritage 35 -
East of England Development Agency - 198
Arts Council England - 2,254
Section 106 Developer Contributions 1,479 531
Essex County Council 1,489 1,712
Heritage Lottery Fund 180 62
Haven Gateway 52 -
European Union 88 -
Mercury Theatre Trust 88 -
Other 15 73
Donated Asset Income 328 -
Total – Credited to Taxation and Non Specific Grant Income 6,438 9,106
Credited to Services
DWP Grants for Benefits
Rent Allowances 37,715 35,923
Rent Rebates 16,912 15,566
Local Taxation 11,602 11,449
Administration 1,106 1,154
Other 116 -
CLG NNDR Admin 244 241
Homelessness 31 50
Heritage Lottery Fund 79 289
Museums, Libraries and Archives 451 767
CLG Food Waste 518 -
CLG Preventing Homelessness - 362
CLG Other 10 31
DEFRA Other 41 2
DWP Other 33 153
English Heritage 15 21
Home Office – Crime Reduction 5 41
Governmental Agencies 65 50
Non-Governmental Agencies 21 43
Joint Finance Contributions 389 351
Essex County Council 178 190
Colchester Primary Care Trust 85 65
Other Miscellaneous Grants 89 78
Total – Credited to Services 69,705 66,826
The Council has received a number of grants, contributions and donations that have yet to be recognised as income as they have conditions attached to them that will require the monies or property to be returned to the giver. The balances at the year end are as follows:

67
Current Liabilities
Grants Receipts in Advance - Revenue
2012/13 2011/12
£’000 £’000
Commuted sums received from developers (1,539) (1,352)
Other grants (143) (204)
Total (1,682) (1,556)
Long Term Liabilities
Grants Receipts in Advance - Capital
2012/13 2011/12
£’000 £’000
Section 106 Developer Contributions (8,132) (7,756)
Other grants (297) (222)
Total (8,429) (7,978)
40. Related Parties
The Council is required to disclose material transactions with related parties – bodies or individuals that have the potential to control or influence the Council or to be controlled or influenced by the Council. The UK Central Government has significant influence over the general operations of the Council. It is responsible for providing the statutory framework within which the Council operates, provides the majority of its funding in the form of grants and prescribes the terms of many of the transactions that the Council has with other parties (e.g. Council Tax bills, housing benefits). Grants received from Government Departments are disclosed in Note 39. The Members of the Council have direct control over the Council’s financial and operating policies. Total Members’ allowances and expenses are disclosed in Note 35. No Members disclosed any material direct related party transactions with the Council during the year. The senior officers at the Council are able to influence the Council’s policies, within the provisions of the Council’s regulations and schemes of delegation. Remuneration of the Council’s senior officers is disclosed in Note 36. No senior officers disclosed any material direct related party transactions with the Council during the year. During the year material transactions with related parties, which are not fully disclosed elsewhere in the Statement of Accounts, arose as follows: 2012/13 2011/12
Income Expenditure Income Expenditure
£’000 £’000 £’000 £’000
Restated Restated
Essex County Council
Supporting People 335 417
Countywide Concessionary Travel Scheme - 3
Trade Waste Disposal 110 104
Recycling Credits 1,043 1,037
On Street Parking (Decriminalisation) 372 817
Second Homes Grant 147 149
Other 187 324
Colchester Borough Homes Limited 531 3,330 493 3,429
We have received income, mainly for the provision of support services. This has been paid out of the management fee Colchester Borough Homes Limited received from the Housing Revenue Account.
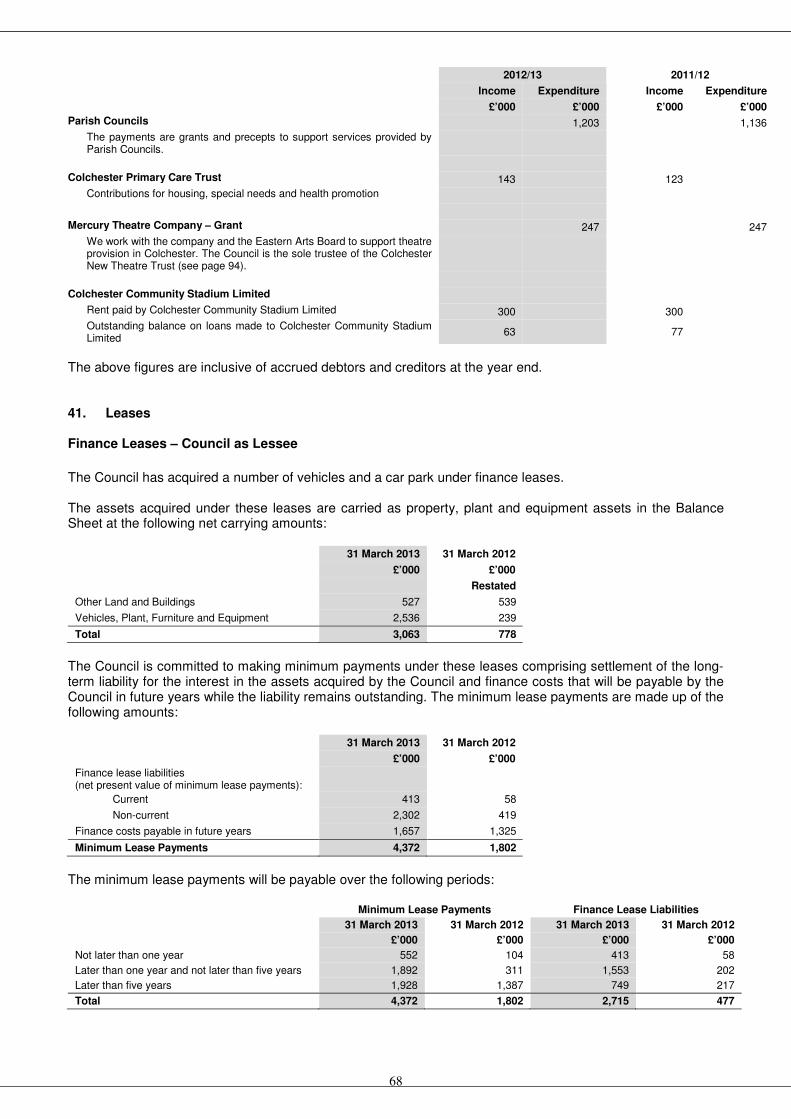
68
2012/13 2011/12
Income Expenditure Income Expenditure
£’000 £’000 £’000 £’000
Parish Councils 1,203 1,136
The payments are grants and precepts to support services provided by Parish Councils.
Colchester Primary Care Trust 143 123
Contributions for housing, special needs and health promotion
Mercury Theatre Company – Grant 247 247
We work with the company and the Eastern Arts Board to support theatre provision in Colchester. The Council is the sole trustee of the Colchester New Theatre Trust (see page 94).
Colchester Community Stadium Limited
Rent paid by Colchester Community Stadium Limited 300 300
Outstanding balance on loans made to Colchester Community Stadium Limited
63 77
The above figures are inclusive of accrued debtors and creditors at the year end. 41. Leases Finance Leases – Council as Lessee
The Council has acquired a number of vehicles and a car park under finance leases. The assets acquired under these leases are carried as property, plant and equipment assets in the Balance Sheet at the following net carrying amounts:
31 March 2013 31 March 2012
£’000 £’000
Restated
Other Land and Buildings 527 539
Vehicles, Plant, Furniture and Equipment 2,536 239
Total 3,063 778
The Council is committed to making minimum payments under these leases comprising settlement of the long-term liability for the interest in the assets acquired by the Council and finance costs that will be payable by the Council in future years while the liability remains outstanding. The minimum lease payments are made up of the following amounts:
31 March 2013 31 March 2012
£’000 £’000
Finance lease liabilities (net present value of minimum lease payments):
Current 413 58
Non-current 2,302 419
Finance costs payable in future years 1,657 1,325
Minimum Lease Payments 4,372 1,802
The minimum lease payments will be payable over the following periods:
Minimum Lease Payments Finance Lease Liabilities
31 March 2013 31 March 2012 31 March 2013 31 March 2012
£’000 £’000 £’000 £’000 Not later than one year 552 104 413 58
Later than one year and not later than five years 1,892 311 1,553 202
Later than five years 1,928 1,387 749 217
Total 4,372 1,802 2,715 477

69
Operating Leases – Council as Lessee The Council has acquired various assets (land and buildings assets, equipment and vehicles) under operating leases which are used to provide Council services. The future minimum lease payments due under non-cancellable leases in future years are:
31 March 2013 31 March 2012
£’000 £’000
Not later than one year 461 439
Later than one year and not later than five years 1,762 1,695
Later than five years 2,166 2,366
Total 4,389 4,500
The future minimum sub-lease payments from third parties due under non-cancellable leases in future years are:
31 March 2013 31 March 2012
£’000 £’000
Not later than one year 115 100
Later than one year and not later than five years 455 384
Later than five years 465 524
Total 1,035 1,008
The items charged the Comprehensive Income and Expenditure Statement during the year in relation to these leases are:
2012/13 2011/12
£’000 £’000
Minimum lease payments 515 541
Contingent rent payments 23 21
Sub lease minimum lease payments received (258) (178)
Sub lease contingent rent payments received (2) (1)
Finance Leases – Council as Lessor The Council has leased out a theatre to a third party since 1999 on a finance lease with a lease term of 25 years. The Council has a gross investment in the lease, made up of the minimum lease payments to be expected to be received over the remaining term and the residual value anticipated for the property when the lease comes to an end. The minimum lease payments comprise settlement of the long term debtor for the interest in the property acquired by the lessee and finance income that will be earned by the Council in future years whilst the debtor remains outstanding. The gross investment is made up of the following amounts:
31 March 2013 31 March 2012
£’000 £’000
Finance lease debtor (net present value of minimum lease payments):
Current 7 6
Non-current 108 114
Unearned finance income 53 62
Unguaranteed residual value of property 17 17
Gross investment in the lease 185 199
The gross investment in the lease and the minimum lease payments will be received over the following periods:
Gross Investment Minimum Lease Payments 31 March 2013 31 March 2012 31 March 2013 31 March 2012
£’000 £’000 £’000 £’000 Not later than one year 15 15 15 15
Later than one year and not later than five years 61 61 61 61
Later than five years 109 123 91 106
Total 185 199 167 182
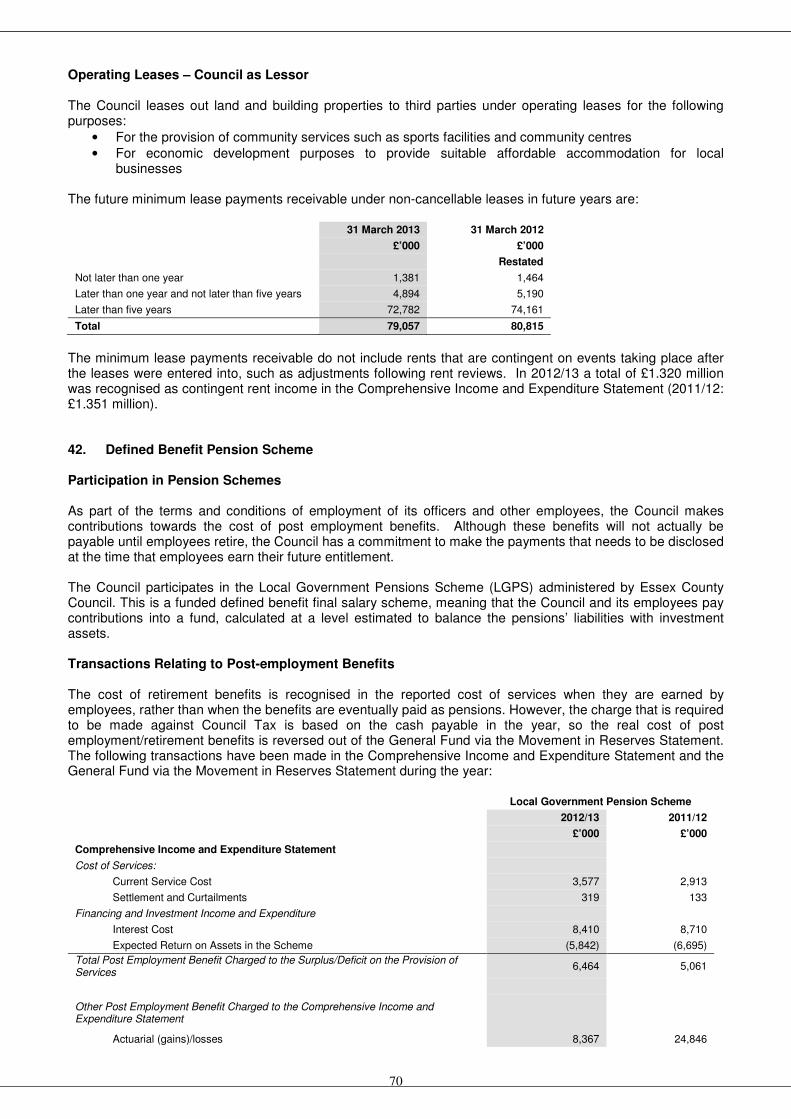
70
Operating Leases – Council as Lessor The Council leases out land and building properties to third parties under operating leases for the following purposes:
• For the provision of community services such as sports facilities and community centres
• For economic development purposes to provide suitable affordable accommodation for local businesses
The future minimum lease payments receivable under non-cancellable leases in future years are:
31 March 2013 31 March 2012
£’000 £’000
Restated
Not later than one year 1,381 1,464
Later than one year and not later than five years 4,894 5,190
Later than five years 72,782 74,161
Total 79,057 80,815
The minimum lease payments receivable do not include rents that are contingent on events taking place after the leases were entered into, such as adjustments following rent reviews. In 2012/13 a total of £1.320 million was recognised as contingent rent income in the Comprehensive Income and Expenditure Statement (2011/12: £1.351 million). 42. Defined Benefit Pension Scheme Participation in Pension Schemes As part of the terms and conditions of employment of its officers and other employees, the Council makes contributions towards the cost of post employment benefits. Although these benefits will not actually be payable until employees retire, the Council has a commitment to make the payments that needs to be disclosed at the time that employees earn their future entitlement. The Council participates in the Local Government Pensions Scheme (LGPS) administered by Essex County Council. This is a funded defined benefit final salary scheme, meaning that the Council and its employees pay contributions into a fund, calculated at a level estimated to balance the pensions’ liabilities with investment assets. Transactions Relating to Post-employment Benefits The cost of retirement benefits is recognised in the reported cost of services when they are earned by employees, rather than when the benefits are eventually paid as pensions. However, the charge that is required to be made against Council Tax is based on the cash payable in the year, so the real cost of post employment/retirement benefits is reversed out of the General Fund via the Movement in Reserves Statement. The following transactions have been made in the Comprehensive Income and Expenditure Statement and the General Fund via the Movement in Reserves Statement during the year:
Local Government Pension Scheme
2012/13 2011/12
£’000 £’000
Comprehensive Income and Expenditure Statement
Cost of Services:
Current Service Cost 3,577 2,913
Settlement and Curtailments 319 133
Financing and Investment Income and Expenditure
Interest Cost 8,410 8,710
Expected Return on Assets in the Scheme (5,842) (6,695)
Total Post Employment Benefit Charged to the Surplus/Deficit on the Provision of Services
6,464 5,061
Other Post Employment Benefit Charged to the Comprehensive Income and Expenditure Statement
Actuarial (gains)/losses 8,367 24,846

71
Total Post Employment Benefit Charged to the Comprehensive Income and Expenditure Statement
14,831 29,907
Movement in Reserves Statement
Reversal of net charges made to the Surplus/Deficit for the Provision of Services for post employment benefits in accordance with the Code
(6,464) (5,061)
Actual amount charged against the General Fund Balance for pensions in the year
Employers’ contributions payable to the scheme 4,871 4,795
The cumulative amount of actuarial gains and losses recognised in the Other Comprehensive Income and Expenditure to the 31 March 2013 is a net loss of £58.468 million (31 March 2012: net actuarial loss of £50.101 million). Assets and Liabilities in Relation to Post-employment Benefits Reconciliation of fair value of the scheme assets: 2012/13
£’000 2011/12
£’000
Balance at 1 April 100,744 99,163
Expected rate of return 5,842 6,695
Actuarial gains/(losses) 6,618 (5,586)
Employer contributions 4,871 4,795
Contributions by scheme participants 1,118 1,171
Benefits paid (7,191) (5,494)
Payment of bulk transfer value (91) -
Balance at 31 March 111,911 100,744
Reconciliation of present value of the scheme liabilities (defined benefit obligation): 2012/13
£’000 2011/12
£’000
Balance at 1 April (185,696) (159,003)
Current Service Cost (3,577) (2,913)
Interest Cost (8,410) (8,710)
Contributions by scheme participants (1,118) (1,171)
Actuarial (gains)/losses (14,985) (19,260)
Benefits paid net of transfers in 6,770 5,086
Unfunded pension payments 421 408
Gains on Curtailments (346) (133)
Liabilities extinguished on Settlements 118 -
Balance at 31 March (206,823) (185,696)
The expected rate of return on scheme assets is based on the long-term future expected investment return for each asset class at the beginning of the period at 1 April. The returns on gilts and other bonds are assumed to be the annualised gilt yield and corporate bond yield respectively at the relevant date. The returns on equities and property are gilt yields plus expected out performance premium. The actual return on scheme assets in the year was a positive return of £12.460 million (2011/12: A positive return of £1.11 million). Scheme History 2012/13 2011/12 2010/11 2009/10 2008/09
£’000 £’000 £’000 £’000 £’000
Present value of liabilities (206,823) (185,696) (159,003) (166,927) (122,952)
Fair value of assets 111,911 100,744 99,163 95,899 71,013
Deficit in the scheme (94,912) (84,952) (59,840) (71,028) (51,939)
The liabilities show the underlying commitments that the Council has in the long run to pay post employment (retirement) benefits. The total liability of £94.912 million has a significant impact on the net worth of the Council as recorded in the Balance Sheet. However, statutory arrangements for funding the deficit mean that the financial position of the Council remains healthy. The deficit on the scheme will be made good by increased contributions over the remaining working life of employees, as assessed by the scheme actuary. We are

72
making an annual back-funding contribution designed to clear the liability over time. The position is reviewed annually and the contribution required is reassessed at each triennial valuation. The total contributions expected to be made by the Council to the pension scheme for the year to 31 March 2014 is £4.355 million. Basis for Estimating Assets and Liabilities Liabilities have been assessed on an actuarial basis using the projected unit credit method, an estimate of the pensions that will be payable in future years dependent on assumptions about mortality rates, salary levels, etc. The liabilities have been assessed by Barnett Waddingham, an independent firm of actuaries, estimates being based on the latest full valuation of the scheme as at 31 March 2010. The principal assumptions used by the actuary were:
31 March 2013
% 31 March 2012
%
Long-term expected rate of return on assets in the scheme:
Equity Investments 6.1 6.4
Government Bonds 3.0 3.3
Other Bonds 4.1 4.6
Property 5.1 5.4
Cash 0.5 0.5
Alternative Assets 6.1 n/a
Mortality assumptions:
Longevity at 65 for current pensioners:
Men 22.7 22.7
Women 25.3 25.3
Longevity at 65 for future pensioners (retiring in 20 years):
Men 24.2 24.1
Women 26.9 26.8
Rate of RPI inflation 3.3 3.3
Rate of CPI inflation 2.5 2.5
Rate of increase in salaries 4.3 4.3
Rate of increase in pensions 2.5 2.5
Rate for discounting scheme liabilities 4.2 4.6
Take up of option to convert annual pension into retirement lump sum 50.0 50.0
The County Council Pension Fund’s assets consist of the following categories, by proportion of the total assets held: 31 March 2012 31 March 2012
Proportion of total assets held: £’000 % £’000 %
Equity Investments 71,623 64 70,521 70
Gilts 7,834 7 4,030 4
Other Bonds 8,953 8 10,074 10
Property 13,429 12 14,104 14
Cash 4,476 4 2,015 2
Alternative Assets 5,596 5 - -
Total 111,911 100 100,744 100
History of Experience Gains and Losses The actuarial gains identified as movements on the Pensions Reserve in 2012/13 can be analysed into the following categories, measured as a percentage of assets or liabilities as at 31 March 2013:
73
2012/13 2011/12 2010/11 2009/10 2008/09
% % % % %
Experience adjustments arising on scheme assets, expressed as a percentage of scheme assets at 31 March
5.9 (5.5) (3.6) 21.2 (35.4)
Experience adjustments arising on scheme liabilities, expressed as a percentage of scheme liabilities at 31 March
- (0.4) 3.5 - -
43. Contingent Liabilities At 31 March 2013, the Council had the following contingent liabilities: The Council has received correspondence from a third party, which was under contract to purchase land from the Council that alleges the Council has breached the terms of the contract. Accordingly, there is the potential for the third party to seek to claim damages from the Council as a result of the alleged breach. However, no claim has yet been received. The Council’s position remains that there has been no breach of the contract by the Council and it is not appropriate to disclose further information at this time because the dispute could be the subject of legal proceedings. No provision has been made in the accounts but the position continues to be monitored. There is a potential conflict between the Environmental Information Regulations and the Local Land Charge Fee Regulations over the application of charges for some information provided as part of the land search. Whilst proceedings have been issued against the Council, it is not known whether any charges previously levied are required to be refunded and therefore it is not possible to quantify the costs which may arise. The Council is aware of a challenge in respect of some income relating mainly to prior years. Counsel’s opinion has been sought in order to understand the Council’s potential liability. The accounts include some payments made in respect of this issue although the extent and timing of any further claims is uncertain. No further provision has been made in the accounts; however consideration to this issue has been made within the assessment of General Fund balances. 44. Subsidiary Companies Colchester Borough Homes Limited, the Council’s Arms Length Management Organisation, is a limited company wholly owned by the Council. It was established with no share capital and is limited by guarantee. The Council is liable to contribute to the debts and liabilities of the organisation if it was wound up to the value of £1. The Council has delegated responsibility for overseeing the management and maintenance of its housing stock to Colchester Borough Homes Limited in accordance with the management agreement effective from 1 August 2003. The Council pay for these services through the management fee and this is agreed annually under the review process provided for under the management agreement. Colchester Borough Homes aim to breakeven overall. Colchester Borough Homes Limited was incorporated on 24 July 2003 and has prepared its accounts for the year to 31 March 2013. The accounts were prepared in accordance with the Companies Act 2006 and will be submitted for approval to the Board of Colchester Borough Homes on 10 September 2013. . The following summarised accounts are based on the draft accounts to be submitted for approval in September 2013 and cover the financial year from 1 April 2012 to 31 March 2013.

74
Income and Expenditure Account 2012/13 2011/12
£’000 £’000
Turnover 10,082 10,416
Operating costs (10,314) (10,598)
Operating Surplus/(Deficit) (232) (182)
Interest receivable 12 10
FRS17 interest adjustment (73) 39
Surplus/(Deficit) on ordinary activities before taxation (293) (133)
Tax charge on Surplus/(Deficit) on ordinary activities 1 (2)
Surplus/(Deficit) for the year (292) (135)
Balance Sheet 31 March 2013 31 March 2012
£’000 £’000
Current Assets
Debtors 46 815
Cash at bank and in hand 1,826 420
Current Liabilities
Creditors: Amounts falling due within one year (1,302) (686)
Other Liabilities
Provisions (9) (8)
Pension Fund Liability (5,894) (5,530)
Total Net Liabilities (5,333) (4,989)
Total Reserves (5,333) (4,989)
The following balances with the Council are included above: 31 March 2013 31 March 2012
£’000 £’000
Debtors - 573
Creditors (164) -
Colchester Borough Homes has agreed to invest any surplus funds through the Council with interest payable at the market rate. At 31 March 2013 the cash at bank of £1.824 million (31 March 2012: £0.419 million) was consolidated with the Council’s funds for investment purposes. Further information is provided within the Group Accounts (Pages 95-115).
Net Pensions Liability
Colchester Borough Homes participates in the Local Government Pension Scheme administered by Essex County Council. The fund actuary, Barnett Waddingham, produced an assessment of the pension liability position which was included in the accounts as set out above. The position may be summarised as follows: 31 March 2013 31 March 2012
£’000 £’000
Estimated Liabilities in Scheme (21,596) (19,269)
Estimated Assets in Scheme 15,702 13,739
Net Liability (5,894) (5,530)
The position is reviewed annually and contributions are reassessed at each triennial revaluation. The latest revaluation was at 31 March 2010 which was implemented with effect from 1 April 2011. These figures have been provided by the actuary to the Essex Pension Scheme using information provided by the scheme and assumptions determined by Colchester Borough Homes in conjunction with the actuary.

75
Actuarial calculations involve estimates based on assumptions about events and circumstances in the future, which may mean that the result of actuarial calculations may be affected by uncertainties within a range of possible values. Colchester Community Stadium Limited, is an arms length company created by the Council to manage the Community Stadium, it is a limited company wholly owned by the Council (limited by shares). The Council is liable to contribute to the debts and liabilities of the organisation if it was wound up to the value of £1. The subsidiary company, Colchester Community Stadium Limited (limited by shares) was incorporated on 2 April 2009, started trading on 1 July 2009 and has prepared its accounts for the year to 31 March 2013 in accordance with International Financial Reporting Standards. These accounts were approved by the Board of Colchester Community Stadium Limited on 9 May 2013. The following summarised accounts are based on the accounts that were approved and cover the year from 1 April 2012 to 31 March 2013. Income and Expenditure Account 2012/13 2011/12
£’000 £’000
Turnover 362 364
Operating costs (343) (341)
Operating Profit 19 23
Interest payable (5) (5)
(Deficit)/Surplus on ordinary activities before taxation 14 18
Tax charge on (deficit)/surplus on ordinary activities (5) (6)
(Deficit)/Surplus for the Financial Period 9 12
Balance Sheet 31 March 2013 31 March 2012
£’000 £’000
Non-Current Assets
Property, Plant and Equipment 98 110
Current Assets
Debtors 179 176
Cash and Cash Equivalents 53 53
232 229
Current Liabilities
Creditors (180) (179)
Short Term Borrowings (18) (18)
Tax Payable (5) (6)
(203) (203)
Net Current Assets 29 26
Non-Current Liabilities
Long Term Borrowings (97) (115)
Total Net Assets 30 21
Total Reserves 30 21
The following balances with the Council are included above: 31 March 2013 31 March 2012
£’000 £’000
Debtors 70 70
Creditors (90) (90)
Short Term Borrowings (13) (13)
Long Term Borrowings (50) (64)
The accounts were audited by Baker Chapman & Bussey and an unqualified opinion was given. The accounts are published electronically on the Council’s website – www.colchester.gov.uk.

76
45. Jointly Controlled Operations The Council is a member of the Colchester and Ipswich Museum Service Joint Committee, which was formed with Ipswich Borough Council on 1 April 2007. The Council is a member of the North Essex Parking Partnership, which was set up on 1 April 2011 for the purposes of civil parking enforcement in the administrative areas of the districts of Braintree, Epping, Harlow, Tendring and Uttlesford and the Borough of Colchester. For accounting purposes, these Joint Committees are considered to be Jointly Controlled Operations undertaken by the Council in conjunction with other Councils that involve the use of assets and resources of the participating Councils rather than the establishment of separate entities to run the operations. 46. Trust Funds The Council acts as a trustee for several trust funds. The funds are not considered to be assets of the Council and so they have not been included within the Council’s Balance Sheet on page 11. Refer to pages 89-94 for details of the nature and amount of these Trust Funds.

77
HRA INCOME AND EXPENDITURE STATEMENT
Notes 2012/13 2011/12
£’000 £’000
Income
Dwelling Rents H1 & H2 (24,732) (22,983)
Non-Dwelling Rents H3 (795) (736)
Charges for Services and Facilities H4 (2,294) (2,175)
Contributions towards Expenditure (256) (282)
Total Income (28,077) (26,176)
Expenditure
Repairs and Maintenance 4,634 4,717
Supervision and Management 8,237 8,028
Rents, Rates, Taxes and Other Charges 116 109
Negative HRA Subsidy Payable (including MRA) H12 (40) 4,655
HRA Self-Financing Settlement payment to Secretary of State - 73,694
Depreciation and Impairments of Non Current Assets H9 & H10 5,513 6,622
Revaluation Losses 6,532 6,294
Derecognition of Non Current Assets 498 225
Amortisation H11 124 108
Debt Management Costs 98 121
Movement in the provision for Bad Debts 166 134
Reversal of previously recognised revaluation losses (717) -
Total Expenditure 25,161 104,707
Net Expenditure of HRA Services as included in the whole authority Comprehensive Income and Expenditure Statement
(2,916) 78,531
HRA services share of Corporate and Democratic Core 372 385
Net Expenditure for HRA Services (2,544) 78,916
HRA share of the Other Operating Expenditure included in the Comprehensive Income and Expenditure Statement
(Gain)/Loss on sale of HRA Non Current Assets 185 (599)
HRA share of the Financing and Investment Income and Expenditure included in the Comprehensive Income and Expenditure Statement
Interest Payable and Similar Charges H8 5,567 2,598
Interest and Investment Income (28) (22)
Income and Expenditure in relation to Investment Properties (15) (13)
(Surplus)/Deficit for the year on HRA services 3,165 80,880
The balance on this account is not in accordance with the statutory provisions that specify the net expenditure that councils need to take into the Housing Revenue Account Income and Expenditure Statement. In order to give a full presentation of the financial performance of the Council during the year and the actual spending power carried forward, the balance on this account needs to be reconciled in the Movement on the Housing Revenue Account Statement to the amount established by the relevant statutory provision (see following statement, Page 78).

78
MOVEMENT ON THE HOUSING REVENUE ACCOUNT STATEMENT
The HRA income and Expenditure Statement shows the Council’s actual financial performance for the Housing Revenue Account over the last twelve months. However, the Council is required to maintain the Housing Revenue Account on a different accounting basis, the main differences being:
• Capital investment is accounted for as it is financed, rather than when the fixed assets are consumed.
• Retirement benefits are charged as amounts become payable to pension fund pensioners, rather than as future benefits earned.
This reconciliation statement summarises the differences between the outturn on the HRA Income and Expenditure Statement and the Housing Revenue Account Balance.
Notes 2012/13 £’000
2011/12 £’000
Balance on the HRA at 1 April 3,537 3,919 Surplus/(Deficit) for the year on the HRA Income and Expenditure Statement Page 77 (3,165) (80,880) Adjustments between accounting basis and funding basis under statute Note 9 4,472 80,521
Net Increase/(Decrease) before transfers to/from Earmarked Reserves 1,307 (359) Transfers (to)/from Earmarked Reserves (57) (23)
Increase/Decrease in the year on the HRA Balance 1,250 (382)
Balance on the HRA at 31 March 4,787 3,537
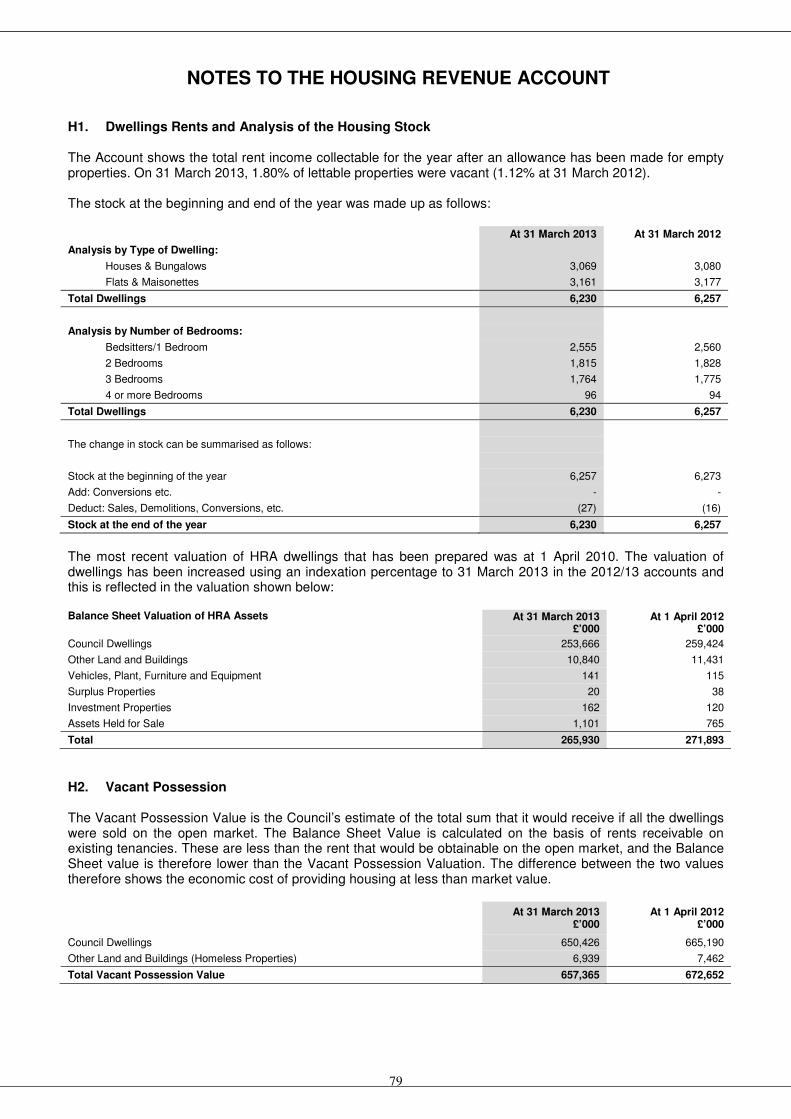
79
NOTES TO THE HOUSING REVENUE ACCOUNT H1. Dwellings Rents and Analysis of the Housing Stock The Account shows the total rent income collectable for the year after an allowance has been made for empty properties. On 31 March 2013, 1.80% of lettable properties were vacant (1.12% at 31 March 2012). The stock at the beginning and end of the year was made up as follows: At 31 March 2013 At 31 March 2012
Analysis by Type of Dwelling:
Houses & Bungalows 3,069 3,080
Flats & Maisonettes 3,161 3,177
Total Dwellings 6,230 6,257
Analysis by Number of Bedrooms:
Bedsitters/1 Bedroom 2,555 2,560
2 Bedrooms 1,815 1,828
3 Bedrooms 1,764 1,775
4 or more Bedrooms 96 94
Total Dwellings 6,230 6,257
The change in stock can be summarised as follows:
Stock at the beginning of the year 6,257 6,273
Add: Conversions etc. - -
Deduct: Sales, Demolitions, Conversions, etc. (27) (16)
Stock at the end of the year 6,230 6,257
The most recent valuation of HRA dwellings that has been prepared was at 1 April 2010. The valuation of dwellings has been increased using an indexation percentage to 31 March 2013 in the 2012/13 accounts and this is reflected in the valuation shown below: Balance Sheet Valuation of HRA Assets At 31 March 2013
£’000 At 1 April 2012
£’000
Council Dwellings 253,666 259,424
Other Land and Buildings 10,840 11,431
Vehicles, Plant, Furniture and Equipment 141 115
Surplus Properties 20 38
Investment Properties 162 120
Assets Held for Sale 1,101 765
Total 265,930 271,893
H2. Vacant Possession The Vacant Possession Value is the Council’s estimate of the total sum that it would receive if all the dwellings were sold on the open market. The Balance Sheet Value is calculated on the basis of rents receivable on existing tenancies. These are less than the rent that would be obtainable on the open market, and the Balance Sheet value is therefore lower than the Vacant Possession Valuation. The difference between the two values therefore shows the economic cost of providing housing at less than market value.
At 31 March 2013
£’000 At 1 April 2012
£’000
Council Dwellings 650,426 665,190
Other Land and Buildings (Homeless Properties) 6,939 7,462
Total Vacant Possession Value 657,365 672,652

80
H3. Non Dwelling Rents
Non Dwelling Rents 2012/13
£’000 2011/12
£’000
Garages and Other Charges (704) (674)
Land and Other Buildings (91) (62)
Total (795) (736)
H4. Charges for Services and Facilities From 2003/04 the Government’s Supporting People Programme was introduced. The effect of this is the support element of the rentals that are charged for Council houses are now shown separately in the accounts. Income totalling £0.265 million from Supporting People charges in 2012/13 (2011/12: £0.386 million) is shown under Charges for Services and Facilities. H5. Major Repairs Reserve 2012/13
£’000 2011/12
£’000
Balance as at 1 April 1,162 2,258
Transfers in – depreciation (Note H9) 5,513 6,500
Transfers out to the HRA - (1,892)
Capital Spending on Dwelling Stock met from Reserve (5,452) (5,704)
Balance as at 31 March 1,223 1,162
H6. Pension Reserve Under the full implementation of IAS 19 (see Note 42) expenditure reflects the current service cost of retirement benefits. The overall amount to be met from rent and Government subsidy remains unchanged. H7. HRA Capital Financing
Capital Financing 2012/13
£’000 2011/12
£’000
HRA Capital Expenditure
Dwelling Stock 7,012 6,126
Non Dwelling Works 29 92
Investment in Information Technology 71 128
Total 7,112 6,346
Financed by:
Capital Grants 120 -
Revenue Contributions 1,540 642
Major Repairs Reserve 5,452 5,704
Total 7,112 6,346
Summary of HRA Capital Receipts 2012/13
£’000 2011/12
£’000
Sale of Council Houses – Direct 1,103 1,162
Sale of Council Houses – Deferred 25 11
Other (including shared ownership) 40 124
Total 1,168 1,297
Receipts from the sale of Council houses have decreased under the Right to Buy Scheme/Rent to Mortgage Scheme compared to 2011/12, as a result of the increase in discounts applicable introduced by the Government from 1
st April 2012.
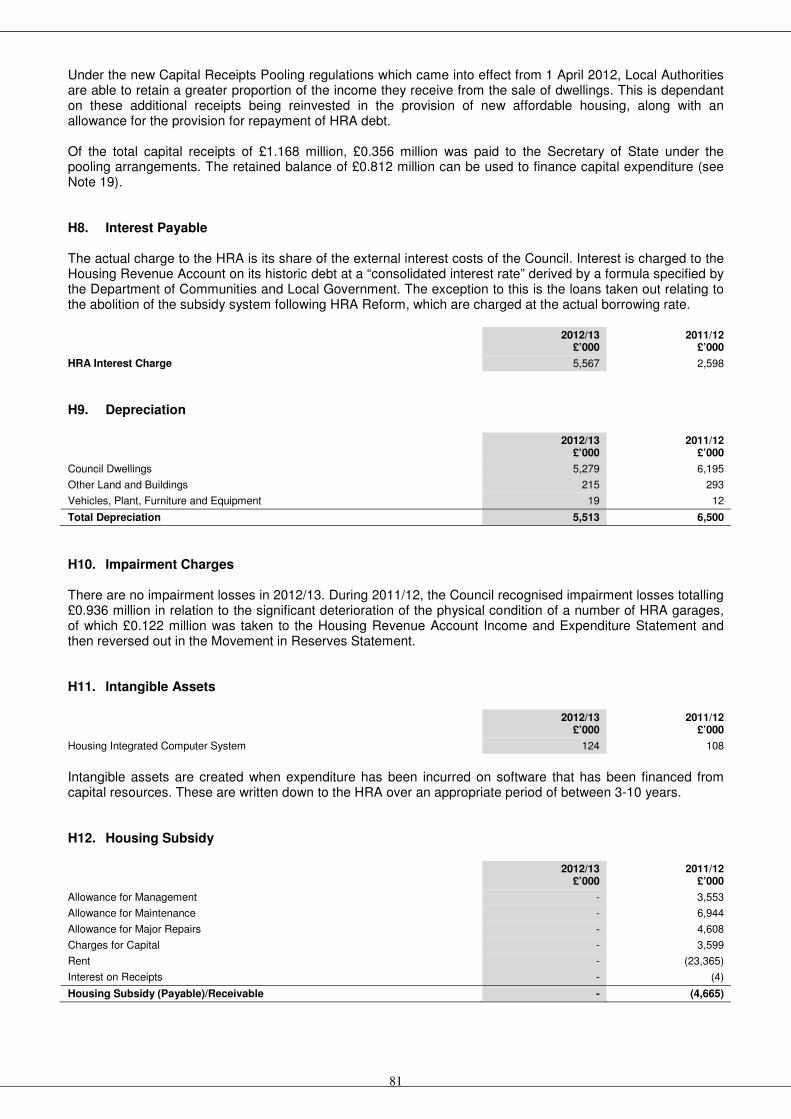
81
Under the new Capital Receipts Pooling regulations which came into effect from 1 April 2012, Local Authorities are able to retain a greater proportion of the income they receive from the sale of dwellings. This is dependant on these additional receipts being reinvested in the provision of new affordable housing, along with an allowance for the provision for repayment of HRA debt. Of the total capital receipts of £1.168 million, £0.356 million was paid to the Secretary of State under the pooling arrangements. The retained balance of £0.812 million can be used to finance capital expenditure (see Note 19). H8. Interest Payable The actual charge to the HRA is its share of the external interest costs of the Council. Interest is charged to the Housing Revenue Account on its historic debt at a “consolidated interest rate” derived by a formula specified by the Department of Communities and Local Government. The exception to this is the loans taken out relating to the abolition of the subsidy system following HRA Reform, which are charged at the actual borrowing rate. 2012/13
£’000 2011/12
£’000
HRA Interest Charge 5,567 2,598
H9. Depreciation 2012/13
£’000 2011/12
£’000
Council Dwellings 5,279 6,195
Other Land and Buildings 215 293
Vehicles, Plant, Furniture and Equipment 19 12
Total Depreciation 5,513 6,500
H10. Impairment Charges There are no impairment losses in 2012/13. During 2011/12, the Council recognised impairment losses totalling £0.936 million in relation to the significant deterioration of the physical condition of a number of HRA garages, of which £0.122 million was taken to the Housing Revenue Account Income and Expenditure Statement and then reversed out in the Movement in Reserves Statement. H11. Intangible Assets 2012/13
£’000 2011/12
£’000
Housing Integrated Computer System 124 108
Intangible assets are created when expenditure has been incurred on software that has been financed from capital resources. These are written down to the HRA over an appropriate period of between 3-10 years. H12. Housing Subsidy 2012/13
£’000 2011/12
£’000
Allowance for Management - 3,553
Allowance for Maintenance - 6,944
Allowance for Major Repairs - 4,608
Charges for Capital - 3,599
Rent - (23,365)
Interest on Receipts - (4)
Housing Subsidy (Payable)/Receivable - (4,665)

82
The HRA subsidy system ended on 1st April 2012, as a result of the Government’s National Reform of Council
Housing Finance. Therefore there is no subsidy payable for 2012/13. The subsidy payable/receivable in any year can vary because of adjustments to previous years’ claims. H13. Rent Arrears The arrears at 31 March 2013 totalled £1.019 million. This excludes prepayments of £0.499 million, and may be analysed as follows: 2012/13 2011/12
£’000 £’000 £’000 £’000
Due from Current Tenants 408 400
Due from Former Tenants 611 596
1,019 996
Prepayments (499) (494)
Net Rent Arrears 520 502
These arrears include all charges due from tenants i.e. rent, rates, heating and other charges. The HRA has been setting aside funds to meet irrecoverable debts in respect of such arrears. At 31 March 2013 the provision totalled £0.779 million (2011/12: £0.754 million). H14. Exceptional items and Prior period adjustments No exceptional or extraordinary events have occurred in 2012/13. No prior period adjustments have been made to the 2011/12 comparatives for the Housing Revenue Account Income and Expenditure Account and the notes associated to this supplementary statement. In 2011/12 the Council was required to make a one-off ‘’settlement’’ payment of £73.694 million to the Department for Communities and Local Government as part of the abolition of the HRA subsidy system. This payment was considered to be an exceptional item in the Council’s 2011/12 accounts and has been shown separately on the face of the Comprehensive income and Expenditure Statement in the 2011/12 comparatives. H15. Revenue Balances Out of the revenue balance of £4.8 million a sum of £1.0 million has already been committed for future use. 2012/13 2011/12
£’000 £’000
Revenue Balance at 1 April 3,537 3,919
Add: Housing Revenue Account surplus 1,250 -
Less: Housing Revenue Account statutory deficit - (290)
Less: Use of Accumulated Balance for capital spending - (92)
Revenue Balance at 31 March 4,787 3,537
Less: Committed Sum
Investment in Housing Stock 2012/13 and Future Years (626) (493)
Estimate Balance Carried Forward (374) (80)
Uncommitted Balance 3,787 2,964

83
H16. Capital Expenditure Charged to Revenue This represents the cost of capital works spent on Council housing which have been funded from revenue. The Council has decided to further supplement the resources available for capital by using part of the accumulated revenue balance to support the Housing Investment Programme. Therefore the revenue balances carried forward above (£0.626 million) will be used to support spending in future years. Further Information Arms Length Management Organisation (ALMO) - see Note 44. The Council is required to provide tenants with information on its effectiveness in housing management services.

84
COLLECTION FUND ACCOUNTS
COLLECTION FUND INCOME AND EXPENDITURE STATEMENT Notes 2012/13 2011/12
£’000 £’000
Income
Council Tax C1 (92,040) (90,362)
Non-Domestic Rates C4 (58,874) (57,031)
Total Income (150,914) (147,393)
Expenditure
Precepts C5 91,071 90,058
National Non-Domestic Rates:
Payment to National Pool C4 58,633 56,790
Cost of Collection Allowance C4 241 241
Bad and Doubtful Debts:
Provision for Council Tax Bad Debts C6 326 647
Total Expenditure 150,271 147,736
(Surplus)/Deficit for the Year – Council Tax (643) 343
Distribution/(Collection) of Previous Estimated Surplus/Deficit C7 (197) (451)
(Surplus)/Deficit for the year (840) (108)
Collection Fund Balance:
Balance at 1 April (43) 65
(Surplus)/Deficit for the year (840) (108)
Balance at 31 March C7 (883) (43)

85
NOTES TO THE COLLECTION FUND ACCOUNTS C1. Council Tax Income The Council set an average Band D Council Tax, including parishes, of £1,447.18 with an estimated tax base of 61,409 Band D equivalent properties. The Council Tax income can be analysed as follows: 2012/13 2011/12
£’000 £’000
Council Tax Income
Tax Payers (80,485) (79,026)
Council Tax Benefits transferred from General Fund (11,555) (11,336)
Total (92,040) (90,362)
C2. Council Tax Base The Council’s Tax Base is the number of chargeable dwellings in each valuation band converted to an equivalent number of Band D dwellings.
Band Chargeable Dwellings
Estimated Properties After Discounts – Exemptions etc.
Ratio to Band D
Band D Equivalent Dwellings
A 8,070 6,764 6/9 4,509
B 19,176 17,158 7/9 13,345
C 18,000 16,562 8/9 14,722
D 12,535 11,618 9/9 11,618
E 7,359 6,958 11/9 8,504
F 3,562 3,408 13/9 4,923
G 2,146 2,041 15/9 3,401
H 131 112 18/9 223
Contributions in lieu for Ministry of Defence Properties 784
Total Band D 62,029
Less: Adjustment for collection rate and for anticipated changes during the year for successful appeals against banding, new properties, demolitions, disabled relief and exempt properties
(620)
Council Tax Base 61,409
C3. Band D Council Tax The basic Band D Council Tax, excluding parishes, for this Council and each of the other Essex districts is as follows: Authority Population Band D
Council Tax
Colchester 181,000 175.23
Basildon 175,200 252.81
Chelmsford 169,500 163.29
Tendring 148,500 149.88
Braintree 144,000 162.81
Epping Forest 124,700 148.77
Castle Point 89,400 229.59
Rochford 83,400 201.15
Harlow 81,700 251.55
Uttlesford 77,500 147.42
Brentwood 74,800 174.37
Maldon 63,200 169.66

86
C4. National Non-Domestic Rate (NNDR) Income Non-Domestic Rates are organised on a national basis. The Government specifies an amount (45p in 2012/13, 42.6p in 2011/12) and subject to the effects of transitionary arrangements, local businesses pay rates calculated by multiplying the rateable value assigned to the property that they occupy by that amount. The Council is responsible for collecting rates due from business ratepayers in its area but pays the proceeds into a National pool administered by the Government. The Government redistributes the sums paid into the pool back to Local Authorities on the basis of a fixed amount per head of population. 2012/13 2011/12
£’000 £’000
NNDR Income
Bills Issued (64,924) (62,380)
Mandatory Reliefs 5,678 5,162
Discretionary Reliefs 203 170
Provision for Bad Debts 298 121
Net Income (58,745) (56,927)
General Fund contribution to Discretionary Reliefs (129) (104)
NNDR Income to Income & Expenditure Account (58,874) (57,031)
Cost of Collection Allowance 241 241
Amount Payable to NNDR Pool (58,633) (56,790)
The total Non-Domestic Rateable value at 31 March 2013 was £153,724,203; the multiplier for the year was 45p. The product of this is £69,175,900. This represents potential income at a point in time, the year end, and thus differs from bills issued during the year due to relief for empty properties, transitional relief, mandatory relief, partial relief, small business rate reliefs, changes in rateable value and movements in the property base. C5. Precepts These are cash sums demanded from the Collection Fund by the Authorities named below in order to finance their activities. 2012/13 2011/12
£’000 £’000
Essex County Council 66,736 66,241
Colchester Borough Council 11,861 11,715
Essex Police Authority 8,395 8,053
Essex Fire Authority 4,079 4,049
Total Precepts 91,071 90,058
C6. Provision for Council Tax Bad Debts Contributions of £326,000 were made to a provision for bad debts in 2012/13 (2011/12: £647,000). During 2012/13 £389,000 of irrecoverable debts were written off (2011/12: £239,000) against this provision, this does not appear in the revenue account. C7. Council Tax Surplus/Deficit Any surplus or deficit on the Fund is shared between the Authorities in proportion to their precept on the Fund and will impact directly on the Council Tax of following years. Any previous year’s cumulative surplus on Council Tax is distributed to Essex County Council, Essex Police Authority, Essex Fire Authority and this Council in proportion to the value of the respective precepts made by the four Councils on the Collection Fund in the related year. The anticipated deficit of £0.197 million was shared as follows -

87
2012/13 2011/12
£’000 £’000
Essex County Council (145) (332)
Colchester Borough Council (26) (58)
Essex Police Authority (17) (41)
Essex Fire Authority (9) (20)
Total Surplus/(Deficit) (197) (451)
The cumulative surplus at the end of March 2013 is not required to be distributed until the following financial years. The surplus will be distributed in proportion to the value of the respective precepts as shown below. 2012/13 2011/12
£’000 £’000
Essex County Council (645) (31)
Colchester Borough Council (116) (6)
Essex Police Authority (83) (4)
Essex Fire Authority (39) (2)
Total (Surplus)/Deficit (883) (43)
This future distribution is anticipated in the presentation in the Balance Sheet (page 11). C8. Community Charge Community Charge was replaced by the Council Tax from 1 April 1993. However, the Council continues to collect and account for Community Charges raised in earlier years. C9. Contribution from Colchester Borough Council No contribution was required from the Council to cover historical adjustments to Community Charge Income (Note C8).

88
PORT HEALTH AUTHORITY ACCOUNTS 2012/13 These are the accounts of the Port Health Authority which is an independent Authority administered by Colchester Borough Council on behalf of itself and Tendring District Council.
INCOME AND EXPENDITURE STATEMENT 2012/13 2011/12
£ £
Income:
Bank Interest (1) (1)
Total Income (1) (1)
Expenditure:
Other Expenditure - -
Total Expenditure - -
Net (Income)/Expenditure (1) (1)
BALANCE SHEET 31 March 2013 31 March 2012
£ £
Current Assets:
Cash at Bank 2,548 2,547
2,548 2,547
Current Liabilities:
Colchester Borough Council (1,875) (1,874)
Tendring District Council (673) (673)
(2,548) (2,547)
Net Current Assets - -

89
TRUST FUND ACCOUNTS The Council acts as trustee for a number of funds. These accounts are detailed below. 1. The Resident Freeburgesses’s Fund This fund is administered by the Council on behalf of the Freeburgesses of the Borough.
INCOME AND EXPENDITURE STATEMENT
2011/12 2010/11
£ £
Income
Interest on Investments (288) (288)
Registration Fees (110) -
Other Income (31) (30)
Expenditure
Administration and Distribution Expenses 20 20
Subscription 30 30
Distribution to Freeburgesses 190 240
Net (Income)/Expenditure (189) (28)
BALANCE SHEET 30 September
2012 30 September
2011 £ £
Assets:
Investments 7,830 7,246
Debtors 250 30
Cash at Bank 458 749
Liabilities:
Creditors (30) (290)
Represented by Accumulated Fund 8,508 7,735
Please note: Investments are stated at market value as at 30 September 2012. These investments are Bank of England 2½% Consolidated Stock with a nominal value of £11,511.46 (2010/11: £11,511.46).
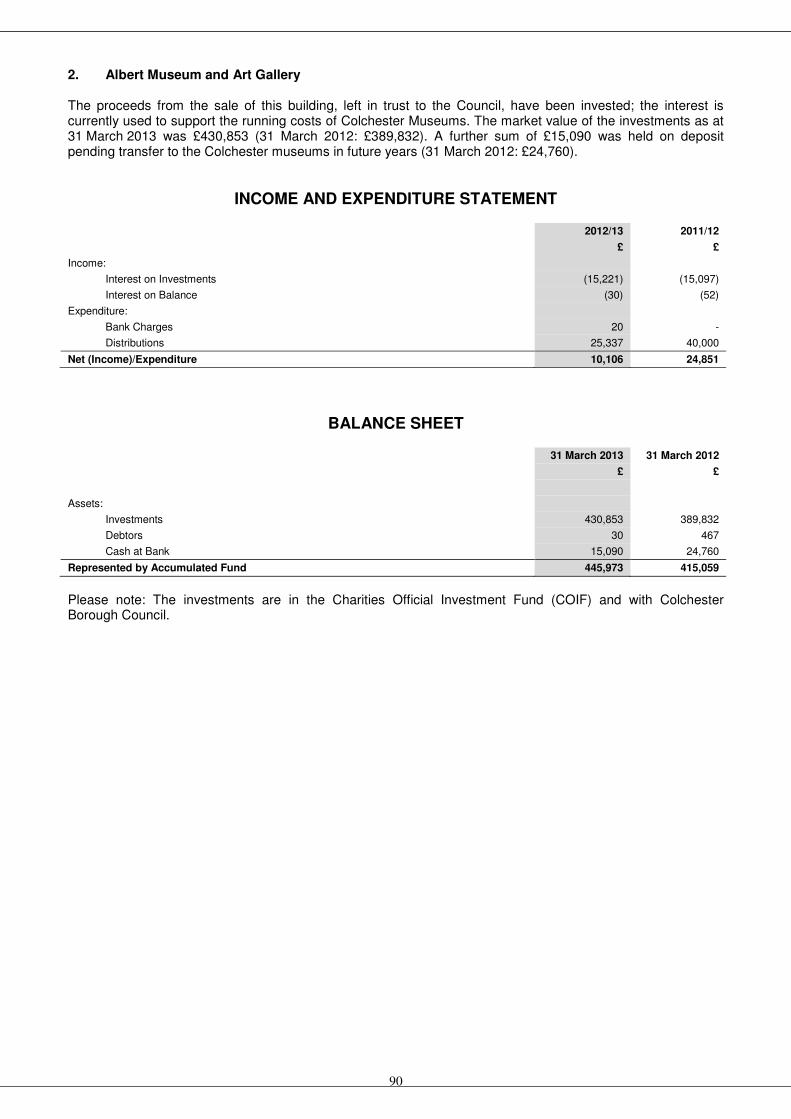
90
2. Albert Museum and Art Gallery The proceeds from the sale of this building, left in trust to the Council, have been invested; the interest is currently used to support the running costs of Colchester Museums. The market value of the investments as at 31 March 2013 was £430,853 (31 March 2012: £389,832). A further sum of £15,090 was held on deposit pending transfer to the Colchester museums in future years (31 March 2012: £24,760).
INCOME AND EXPENDITURE STATEMENT 2012/13 2011/12
£ £
Income:
Interest on Investments (15,221) (15,097)
Interest on Balance (30) (52)
Expenditure:
Bank Charges 20 -
Distributions 25,337 40,000
Net (Income)/Expenditure 10,106 24,851
BALANCE SHEET 31 March 2013 31 March 2012
£ £
Assets:
Investments 430,853 389,832
Debtors 30 467
Cash at Bank 15,090 24,760
Represented by Accumulated Fund 445,973 415,059
Please note: The investments are in the Charities Official Investment Fund (COIF) and with Colchester Borough Council.
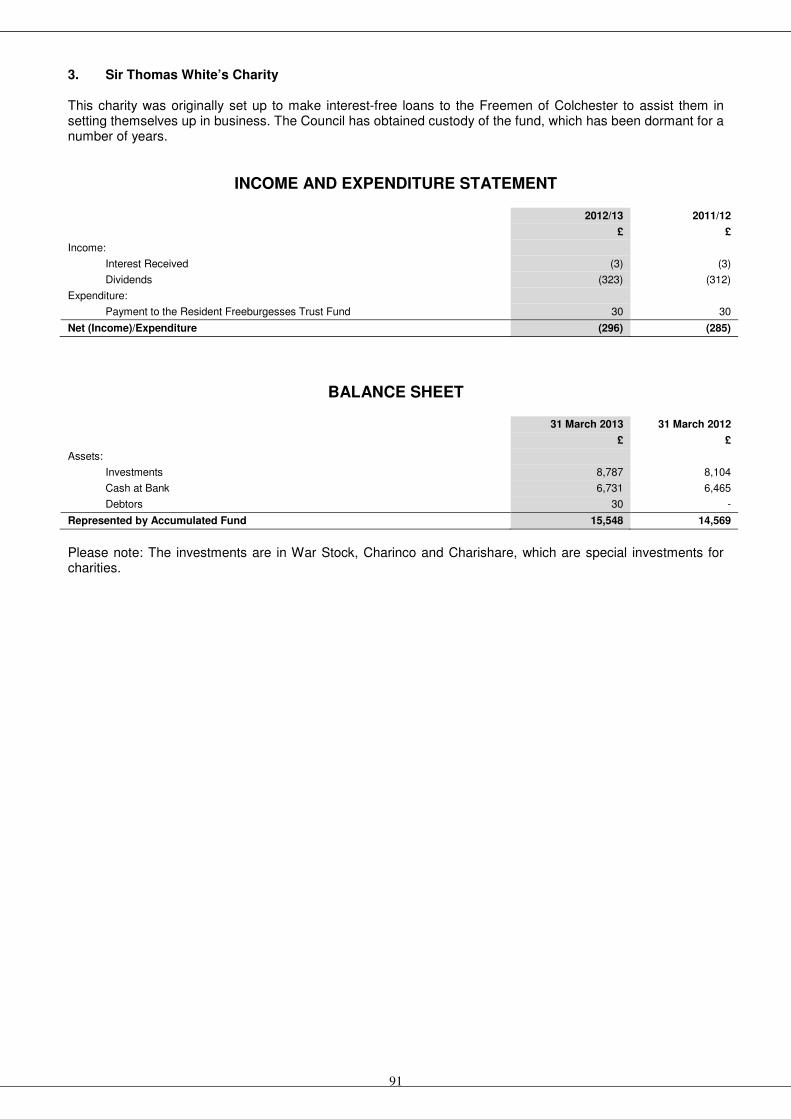
91
3. Sir Thomas White’s Charity This charity was originally set up to make interest-free loans to the Freemen of Colchester to assist them in setting themselves up in business. The Council has obtained custody of the fund, which has been dormant for a number of years.
INCOME AND EXPENDITURE STATEMENT 2012/13 2011/12
£ £
Income:
Interest Received (3) (3)
Dividends (323) (312)
Expenditure:
Payment to the Resident Freeburgesses Trust Fund 30 30
Net (Income)/Expenditure (296) (285)
BALANCE SHEET 31 March 2013 31 March 2012
£ £
Assets:
Investments 8,787 8,104
Cash at Bank 6,731 6,465
Debtors 30 -
Represented by Accumulated Fund 15,548 14,569
Please note: The investments are in War Stock, Charinco and Charishare, which are special investments for charities.
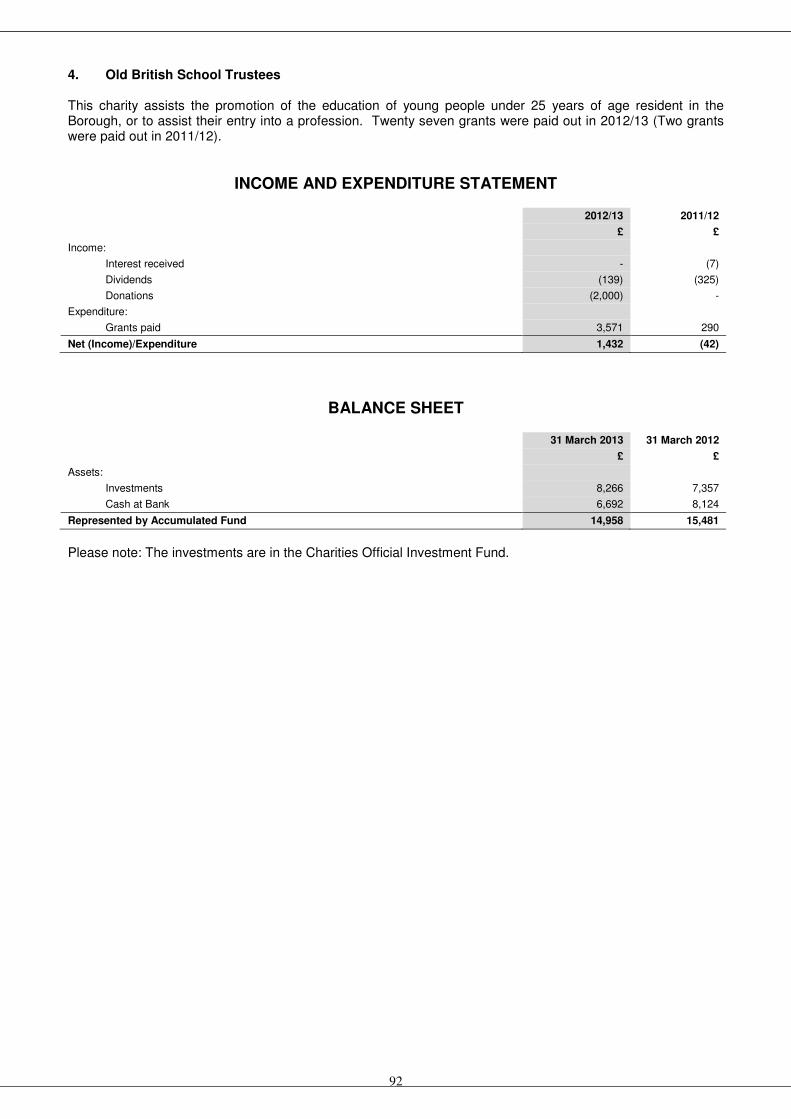
92
4. Old British School Trustees This charity assists the promotion of the education of young people under 25 years of age resident in the Borough, or to assist their entry into a profession. Twenty seven grants were paid out in 2012/13 (Two grants were paid out in 2011/12).
INCOME AND EXPENDITURE STATEMENT 2012/13 2011/12
£ £
Income:
Interest received - (7)
Dividends (139) (325)
Donations (2,000) -
Expenditure:
Grants paid 3,571 290
Net (Income)/Expenditure 1,432 (42)
BALANCE SHEET 31 March 2013 31 March 2012
£ £
Assets:
Investments 8,266 7,357
Cash at Bank 6,692 8,124
Represented by Accumulated Fund 14,958 15,481
Please note: The investments are in the Charities Official Investment Fund.

93
5. Colchester Lying-in-Charity This charity enables one-off grants to be paid to unmarried mothers for such items as prams, cots, etc. Individual payments do not exceed £250 and 14 grants were paid in 2012/13 (19 grants paid in 2011/12).
INCOME AND EXPENDITURE STATEMENT 2012/13 2011/12
£ £
Income:
Interest received - (1)
Dividends (595) (718)
Profit on disposal (3,177) (1,502)
Expenditure:
Grants Paid 2,068 2,774
Net (Income)/Expenditure (1,704) 553
BALANCE SHEET
31 March 2013 31 March 2012
£ £
Assets:
Investments 14,307 15,768
Cash at Bank 2,437 733
Represented by Accumulated Fund 16,744 16,501
Please note: The investments are in the Charities Official Investment Fund.
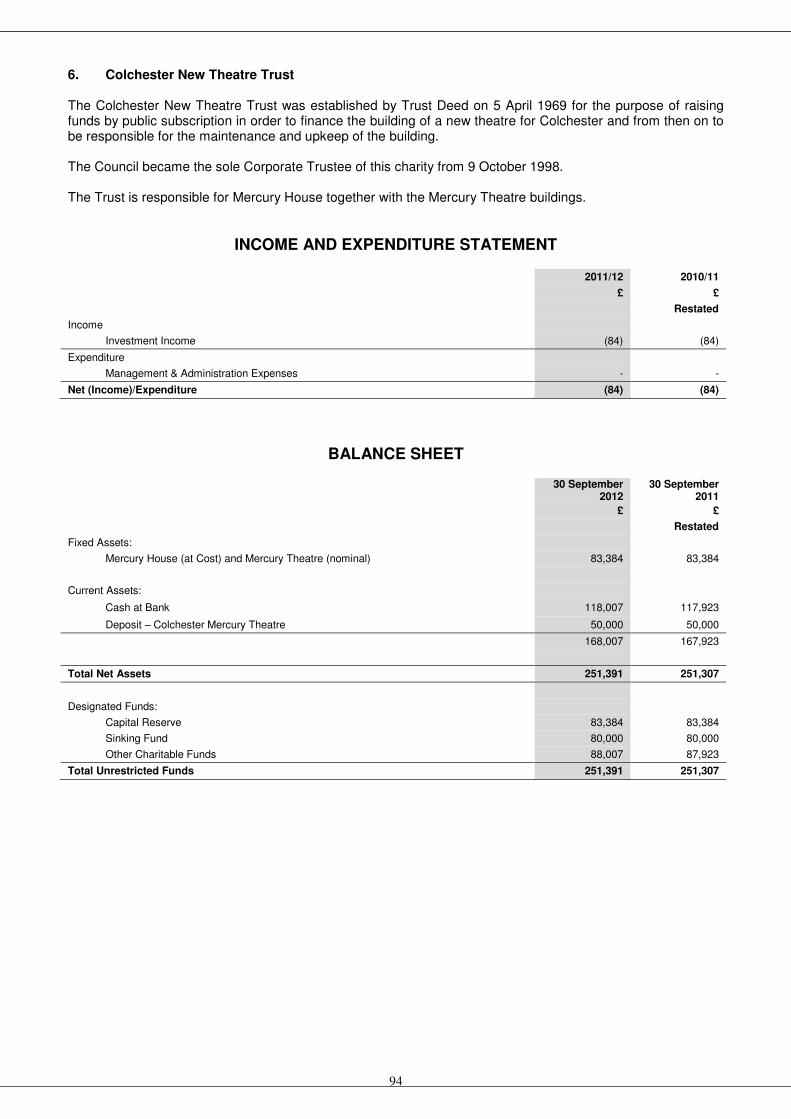
94
6. Colchester New Theatre Trust The Colchester New Theatre Trust was established by Trust Deed on 5 April 1969 for the purpose of raising funds by public subscription in order to finance the building of a new theatre for Colchester and from then on to be responsible for the maintenance and upkeep of the building. The Council became the sole Corporate Trustee of this charity from 9 October 1998. The Trust is responsible for Mercury House together with the Mercury Theatre buildings.
INCOME AND EXPENDITURE STATEMENT 2011/12 2010/11
£ £
Restated
Income
Investment Income (84) (84)
Expenditure
Management & Administration Expenses - -
Net (Income)/Expenditure (84) (84)
BALANCE SHEET 30 September
2012 30 September
2011 £ £
Restated
Fixed Assets:
Mercury House (at Cost) and Mercury Theatre (nominal) 83,384 83,384
Current Assets:
Cash at Bank 118,007 117,923
Deposit – Colchester Mercury Theatre 50,000 50,000
168,007 167,923
Total Net Assets 251,391 251,307
Designated Funds:
Capital Reserve 83,384 83,384
Sinking Fund 80,000 80,000
Other Charitable Funds 88,007 87,923
Total Unrestricted Funds 251,391 251,307

95
GROUP ACCOUNTS 1. Introduction The group accounts have been prepared under the International Financial Reporting Standards (IFRS) using the IFRS Based Code of Practice on Local Authority Accounting. The IFRS based Code of Practice on Local Authority Accounting sets out comprehensive requirements for Group Accounts. These require local authorities to consider all their interests and to prepare a full set of group financial statements when they have material interests in subsidiaries, associates or joint ventures. A review has been undertaken of the Council’s relationship with other bodies and it is clear that the Council should account for its interests in Colchester Borough Homes Limited and Colchester Community Stadium Limited (see Note 44) as wholly owned subsidiaries and prepare Group Accounts. For completeness the opportunity has been taken to include the Port Health organisation and the Trust Funds (see pages 89-94) in the Group statements that follow. The statements are intended to present financial information about the parent (the Council) and the subsidiaries (Colchester Borough Homes Limited and Colchester Community Stadium Limited) by bringing together their results in a unified set of accounts. The accounts have been brought together on a line by line basis incorporating income and expenditure fully in the relevant service revenue account and combining assets and liabilities in the Balance Sheet. Inter group balances and transactions have been eliminated during the consolidation of the Group Accounts. Where group entities have a different year end to the Council they have been brought into the Group Accounts as at 31 March 2013 on the basis of interim financial statements at this date. During 2012/13 Colchester Borough Homes Limited worked substantially all for the Council so the bringing together of income and expenditure has had only a limited effect on the service revenue account. Other works performed by CBH included the management of two housing properties on behalf of an external private company. On the Group Balance Sheet the most significant impacts have been:
• The increase in investments from the introduction of the Trust funds
• The bringing together of the overall pension scheme liability
• The additional reserves 2. Accounting Policies G1 The accounting policies for the Council are set out on in Note 1 and these have been followed in preparing the group statements except for the variations noted below. G2 Fixed Assets The fixed assets for the Colchester New Theatre Trust are included at cost for Mercury House and at a nominal value for the Mercury Theatre. G3 Investments The investments for Trust Funds are shown at valuation.

96
GROUP MOVEMENT IN RESERVES STATEMENT
Reserves held for Revenue Purposes
Reserves held for Capital Purposes
Gen
era
l F
un
d
Bala
nce
Ho
usin
g
Reven
ue
Acco
un
t
Earm
ark
ed
R
eserv
es
Cap
ital
Receip
ts
Reserv
e
Majo
r R
ep
air
s
Reserv
e
Cap
ital
Gra
nts
U
nap
plied
Su
bsid
iary
&
Tru
st
Fu
nd
R
eserv
es
To
tal
Usab
le
Reserv
es
Un
usab
le
Reserv
es
To
tal
Reserv
es
£’000 £’000 £’000 £’000 £’000 £’000 £’000 £’000 £’000 £’000
Balance at 1 April 2011 3,457 3,919 4,801 2,674 2,258 305 1,162 18,576 326,563 345,139
Movement in reserves
Surplus/(Deficit) on provision of services (Page 97)
(13,186) (80,880) - - - - (132) (94,198) - (94,198)
Other Comprehensive Income and Expenditure (Page 97)
- - - - - - (2) (2) (25,298) (25,300)
Total Comprehensive Income and Expenditure
(13,186) (80,880) - - - - (134) (94,200) (25,298) (119,498)
Adjustments between accounting basis & funding basis under regulations (Note G5)
16,773 80,521 - 1,846 (1,096) (302) 78 97,820 (97,820) -
Net Increase/(Decrease) before transfers to Earmarked Reserves
3,587 (359) - 1,846 (1,096) (302) (56) 3,620 (123,118) (119,498)
Transfers to/from Earmarked Reserves (Note 10)
(2,126) (23) 517 - - - - (1,632) 1,632 -
Increase/(Decrease) in Year 1,461 (382) 517 1,846 (1,096) (302) (56) 1,988 (121,486) (119,498)
Balance at 1 April 2011 (Page 98)
4,918 3,537 5,318 4,520 1,162 3 1,106 20,564 205,077 225,641
Movement in reserves
Surplus/(Deficit) on provision of services (Page 97)
(8,415) (3,165) - - - - (276) (11,856) - (11,856)
Other Comprehensive Income and Expenditure (Page 97)
- - - - - - 48 48 (8,733) (8,685)
Total Comprehensive Income and Expenditure
(8,415) (3,165) - - - - (228) (11,808) (8,733) (20,541)
Adjustments between accounting basis & funding basis under regulations (Note G5)
9,926 4,472 - 1,397 61 103 312 16,271 (16,271) -
Net Increase/(Decrease) before transfers to Earmarked Reserves
1,511 1,307 - 1,397 61 103 84 4,463 (25,004) (20,541)
Transfers to/from Earmarked Reserves (Note 10)
(536) (57) 400 (623) - - - (816) 816 -
Increase/(Decrease) in Year 975 1,250 400 774 61 103 84 3,647 (24,188) (20,541)
Balance at 31 March 2012 (Page 98)
5,893 4,787 5,718 5,294 1,223 106 1,190 24,211 180,889 205,100

97
GROUP COMPREHENSIVE INCOME AND EXPENDITURE STATEMENT
2012/13 2011/12
Gross Expenditure
Gross Income
Net Expenditure
Gross Expenditure
Gross Income
Net Expenditure
£’000 £’000 £’000 £’000 £’000 £’000
Central services to the public 14,354 (13,244) 1,110 14,367 (12,891) 1,476
Cultural and related services 14,788 (6,166) 8,622 27,730 (10,735) 16,995
Environmental and regulatory services
12,514 (4,485) 8,029 12,469 (4,172) 8,297
Planning services 7,550 (2,910) 4,640 6,861 (3,072) 3,789
Highways, roads and transport services
7,029 (6,209) 820 7,688 (6,634) 1,054
Local Authority Housing (HRA) 25,384 (28,085) (2,701) 31,185 (26,186) 4,999
Local Authority Housing (HRA) – Settlement payment to Government for HRA self-financing (Note 5)
- - - 73,694 - 73,694
Other housing services 61,218 (57,471) 3,747 59,045 (54,635) 4,410
Adult social care 1,257 (824) 433 1,259 (772) 487
Corporate and democratic core 4,226 (219) 4,007 4,344 (298) 4,046
Non distributed costs 686 - 686 176 (34) 142
Exceptional item (Note 5) - - - 3,519 (6,300) (2,781)
Cost of Services 149,006 (119,613) 29,393 242,337 (125,729) 116,608
Other operating expenditure (Note G6)
1,758 1,416
Financing and investment income and expenditure (Note G7)
7,590 4,048
Taxation and non-specific grant income (Note G8)
(26,885) (27,874)
(Surplus)/Deficit on Provision of Services
11,856 94,198
(Surplus)/Deficit on revaluation of non current assets (Note 28)
314 (2,812)
Actuarial (gains)/losses on pension assets and liabilities (Note G21)
8,419 28,110
Surplus/Deficit on the revaluation of Trust Fund investments (Note G13)
(48) 2
Other Comprehensive Income and Expenditure
8,685 25,300
Total Comprehensive Income and Expenditure
20,541 119,498
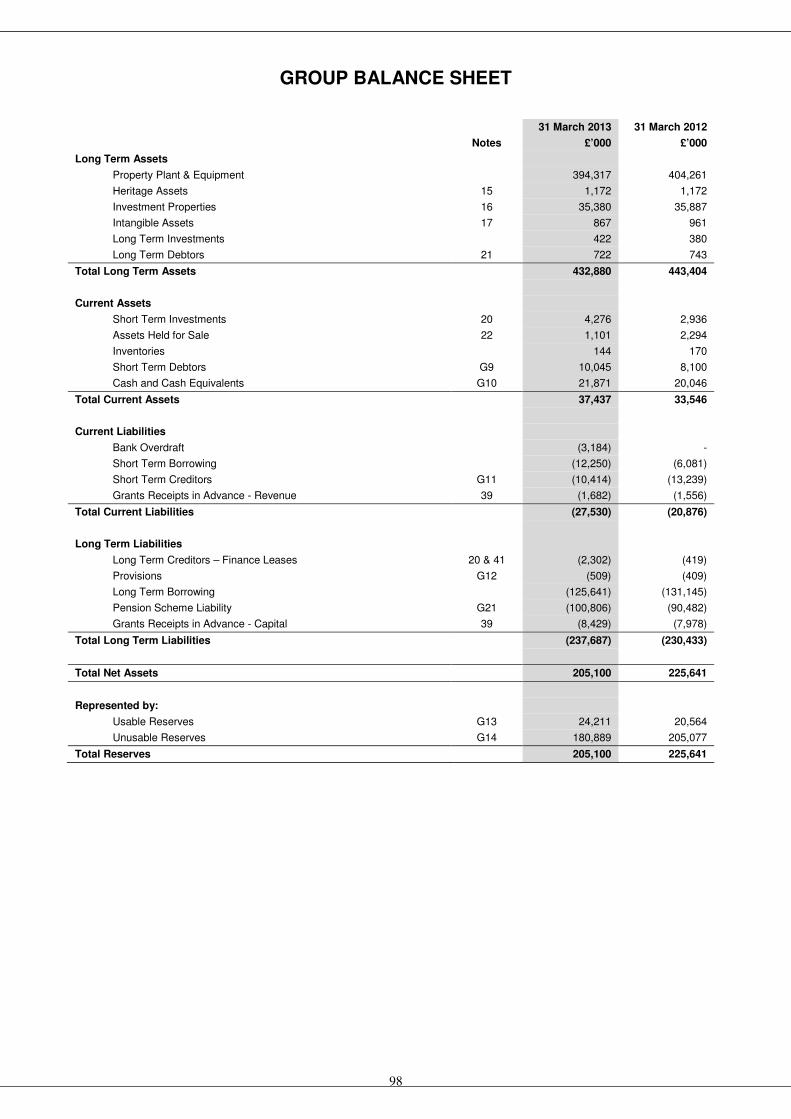
98
GROUP BALANCE SHEET
31 March 2013 31 March 2012
Notes £’000 £’000
Long Term Assets
Property Plant & Equipment 394,317 404,261
Heritage Assets 15 1,172 1,172
Investment Properties 16 35,380 35,887
Intangible Assets 17 867 961
Long Term Investments 422 380
Long Term Debtors 21 722 743
Total Long Term Assets 432,880 443,404
Current Assets
Short Term Investments 20 4,276 2,936
Assets Held for Sale 22 1,101 2,294
Inventories 144 170
Short Term Debtors G9 10,045 8,100
Cash and Cash Equivalents G10 21,871 20,046
Total Current Assets 37,437 33,546
Current Liabilities
Bank Overdraft (3,184) -
Short Term Borrowing (12,250) (6,081)
Short Term Creditors G11 (10,414) (13,239)
Grants Receipts in Advance - Revenue 39 (1,682) (1,556)
Total Current Liabilities (27,530) (20,876)
Long Term Liabilities
Long Term Creditors – Finance Leases 20 & 41 (2,302) (419)
Provisions G12 (509) (409)
Long Term Borrowing (125,641) (131,145)
Pension Scheme Liability G21 (100,806) (90,482)
Grants Receipts in Advance - Capital 39 (8,429) (7,978)
Total Long Term Liabilities (237,687) (230,433)
Total Net Assets 205,100 225,641
Represented by:
Usable Reserves G13 24,211 20,564
Unusable Reserves G14 180,889 205,077
Total Reserves 205,100 225,641

99
GROUP CASH FLOW STATEMENT
2012/13 2011/12
£’000 £’000
Net Surplus/(Deficit) on the Provision of Services Page 97 (11,856) (94,198)
Adjustments to the Net Surplus/Deficit on the Provision of Services for non-cash movements
Note G15 23,789 39,366
Adjustments for items included in the Net Surplus/Deficit on the Provision of Services that are investing and financing activities
Note G15 (4,736) (1,363)
Net cash flows from Operating Activities Note G15 7,197 (56,195)
Investing Activities (6,048) (5,146)
Financing Activities Note 31 (2,508) 78,985
Net increase/(decrease) in cash and cash equivalents (1,359) 17,644
Cash and cash equivalents at the beginning of the reporting period Note G16 20,046 2,402
Cash and cash equivalents at the end of the reporting period Note G16 18,687 20,046
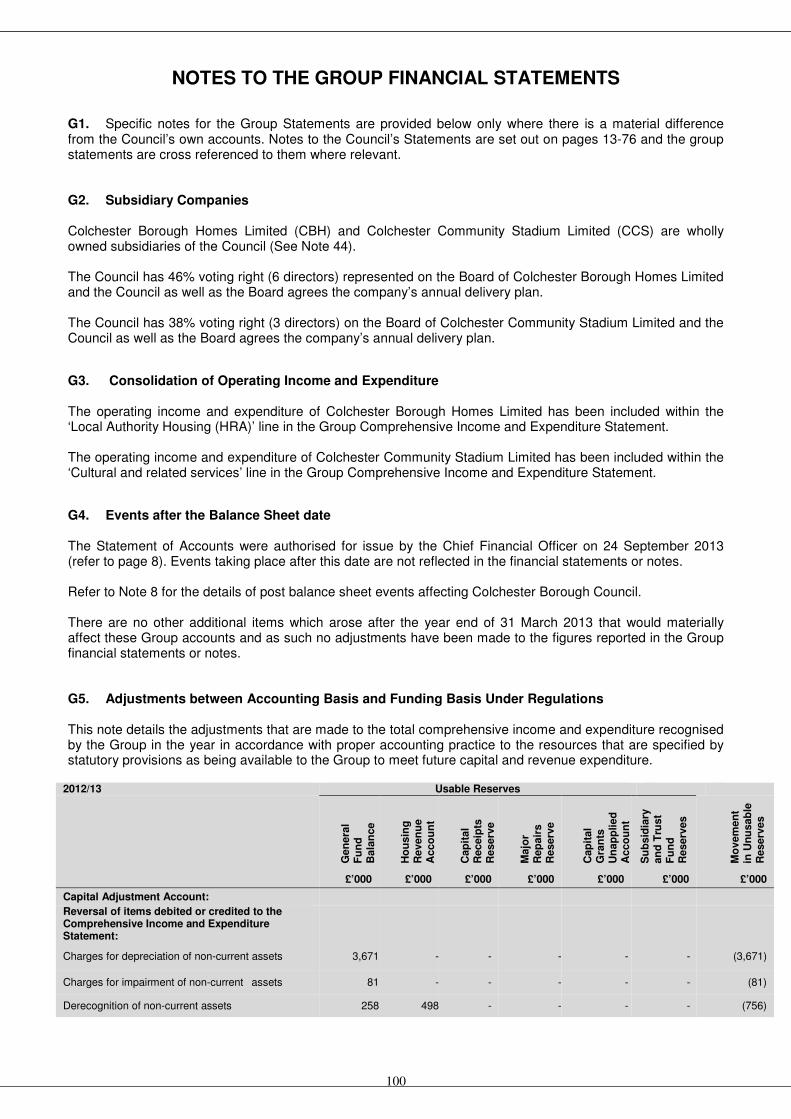
100
NOTES TO THE GROUP FINANCIAL STATEMENTS
G1. Specific notes for the Group Statements are provided below only where there is a material difference from the Council’s own accounts. Notes to the Council’s Statements are set out on pages 13-76 and the group statements are cross referenced to them where relevant. G2. Subsidiary Companies Colchester Borough Homes Limited (CBH) and Colchester Community Stadium Limited (CCS) are wholly owned subsidiaries of the Council (See Note 44). The Council has 46% voting right (6 directors) represented on the Board of Colchester Borough Homes Limited and the Council as well as the Board agrees the company’s annual delivery plan. The Council has 38% voting right (3 directors) on the Board of Colchester Community Stadium Limited and the Council as well as the Board agrees the company’s annual delivery plan.
G3. Consolidation of Operating Income and Expenditure The operating income and expenditure of Colchester Borough Homes Limited has been included within the ‘Local Authority Housing (HRA)’ line in the Group Comprehensive Income and Expenditure Statement. The operating income and expenditure of Colchester Community Stadium Limited has been included within the ‘Cultural and related services’ line in the Group Comprehensive Income and Expenditure Statement.
G4. Events after the Balance Sheet date The Statement of Accounts were authorised for issue by the Chief Financial Officer on 24 September 2013 (refer to page 8). Events taking place after this date are not reflected in the financial statements or notes. Refer to Note 8 for the details of post balance sheet events affecting Colchester Borough Council. There are no other additional items which arose after the year end of 31 March 2013 that would materially affect these Group accounts and as such no adjustments have been made to the figures reported in the Group financial statements or notes. G5. Adjustments between Accounting Basis and Funding Basis Under Regulations This note details the adjustments that are made to the total comprehensive income and expenditure recognised by the Group in the year in accordance with proper accounting practice to the resources that are specified by statutory provisions as being available to the Group to meet future capital and revenue expenditure.
2012/13 Usable Reserves
Gen
era
l F
un
d
Bala
nce
Ho
usin
g
Reven
ue
Acco
un
t
Cap
ital
Receip
ts
Reserv
e
Majo
r R
ep
air
s
Reserv
e
Cap
ital
Gra
nts
U
nap
plied
A
cco
un
t
Su
bsid
iary
an
d T
rust
Fu
nd
R
eserv
es
M
ovem
en
t in
Un
usab
le
Reserv
es
£’000 £’000 £’000 £’000 £’000 £’000 £’000 Capital Adjustment Account:
Reversal of items debited or credited to the Comprehensive Income and Expenditure Statement:
Charges for depreciation of non-current assets 3,671 - - - - - (3,671)
Charges for impairment of non-current assets 81 - - - - - (81)
Derecognition of non-current assets 258 498 - - - - (756)

101
2012/13 Usable Reserves
Gen
era
l F
un
d
Bala
nce
Ho
usin
g
Reven
ue
Acco
un
t
Cap
ital
Receip
ts
Reserv
e
Majo
r R
ep
air
s
Reserv
e
Cap
ital
Gra
nts
U
nap
plied
A
cco
un
t
Su
bsid
iary
an
d T
rust
Fu
nd
R
eserv
es
M
ovem
en
t in
Un
usab
le
Reserv
es
£’000 £’000 £’000 £’000 £’000 £’000 £’000
Revaluation losses on Property, Plant and Equipment
3,727 6,514 - - - - (10,241)
Revaluation losses on Heritage Assets 82 - - - - - (82)
Reversal of previously recognised revaluation losses (6) (717) - - - - 723
Amounts of non-current assets written off on disposal or sale as part of the gain/loss on disposal to the Comprehensive Income and Expenditure Statement
156 185 - - - - (341)
Movements in the fair value of investment properties 1,226 - - - - - (1,226)
Amortisation of intangible assets 214 124 - - - - (338)
Capital grants and contributions applied (3,835) - - - - - 3,835
Donated asset income (328) - - - - - 328
Revenue expenditure funded from capital under statute
3,476 - - - - - (3,476)
Items not debited or credited to the Comprehensive Income and Expenditure Statement:
Statutory provision for the financing of capital investment
(773) - - - - - 773
Capital expenditure charged against the General Fund and HRA balances
- (1,540) - - - - 1,540
Capital Grants Unapplied Account:
Capital grants and contributions unapplied credited to Comprehensive Income and Expenditure Statement
(103) - - - 103 - -
Capital Receipts Reserve:
Transfer of cash sale proceeds credited as part of the gain/loss on disposal to the Comprehensive Income and Expenditure Statement
- - 2,481 - - - (2,481)
Use of the Capital Receipts Reserve to finance new capital expenditure
- - (875) - - - 875
Contribution from the Capital Receipts Reserve to finance the payments to the Government capital receipts pool
356 - (356) - - - -
Capital receipts not linked to disposal of non current assets
(46) - 46 - - - -
Transfer from Deferred Capital Receipts Reserve upon receipt of cash
- - 25 - - - (25)
Repayment of Long Term Debtors - - 76 - - - (76)
Major Repairs Reserve:
Reversal of Major Repairs Allowance credited to the HRA
- - - 5,513 - - (5,513)
Use of the Major Repairs Reserve to finance new capital expenditure
- - - (5,452) - - 5,452
Financial Instruments Adjustment Account:
Amount by which finance costs charged to the Comprehensive Income and Expenditure Statement are different from finance costs chargeable in the year in accordance with statutory requirements
2 (212) - - - - 210
Pensions Reserve:
Reversal of items relating to retirement benefits debited or credited to the Comprehensive Income and Expenditure Statement
6,424 40 - - - 762 (7,226)

102
2012/13 Usable Reserves
Gen
era
l F
un
d
Bala
nce
Ho
usin
g
Reven
ue
Acco
un
t
Cap
ital
Receip
ts
Reserv
e
Majo
r R
ep
air
s
Reserv
e
Cap
ital
Gra
nts
U
nap
plied
A
cco
un
t
Su
bsid
iary
an
d T
rust
Fu
nd
R
eserv
es
M
ovem
en
t in
Un
usab
le
Reserv
es
£’000 £’000 £’000 £’000 £’000 £’000 £’000
Employer’s pensions contributions and direct payments to pensioners payable in the year
(4,448) (423) - - - (450) 5,321
Collection Fund Adjustment Account:
Amount by which Council Tax income credited to the Comprehensive Income and Expenditure Statement is different from Council Tax income calculated for the year in accordance with statutory requirements
(110) - - - - - 110
Accumulated Absences Account:
Amount by which officer remuneration charged to the Comprehensive Income and Expenditure Statement on an accruals basis is different from remuneration chargeable in the year in accordance with statutory requirements
(98) 3 - - - - 95
Total Adjustments 9,926 4,472 1,397 61 103 312 (16,271)
2011/12 Usable Reserves
Gen
era
l F
un
d
Bala
nce
Ho
usin
g
Reven
ue
Acco
un
t
Cap
ital
Receip
ts
Reserv
e
Majo
r R
ep
air
s
Reserv
e
Cap
ital
Gra
nts
U
nap
plied
A
cco
un
t
Su
bsid
iary
an
d T
rust
Fu
nd
R
eserv
es
M
ovem
en
t in
Un
usab
le
Reserv
es
£’000 £’000 £’000 £’000 £’000 £’000 £’000 Capital Adjustment Account:
Reversal of items debited or credited to the Comprehensive Income and Expenditure Statement:
Charges for depreciation of non-current assets 3,493 - - - - - (3,493)
Charges for impairment of non-current assets 125 122 - - - - (247)
Derecognition of components of non-current assets 4,816 225 - - - - (5,041)
Revaluation losses on Property, Plant and Equipment
11,139 6,294 - - - - (17,433)
Revaluation losses on Assets held for Sale 15 - - - - - (15)
Reversal of previously recognised revaluation losses (6) - - - - - 6
Amounts of non-current assets written off on disposal or sale as part of the gain/loss on disposal to the Comprehensive Income and Expenditure Statement
(34) (599) - - - - 633
Movements in the fair value of investment properties 456 - - - - - (456)
Amortisation of intangible assets 231 108 - - - - (339)
Capital grants and contributions applied (5,721) - - - - - 5,721
Revenue expenditure funded from capital under statute
1,387 - - - - - (1,387)
HRA Reform settlement payment to Secretary of State
- 73,694 - - - - (73,694)
Items not debited or credited to the Comprehensive Income and Expenditure Statement:
Statutory provision for the financing of capital investment
(693) - - - - - 693
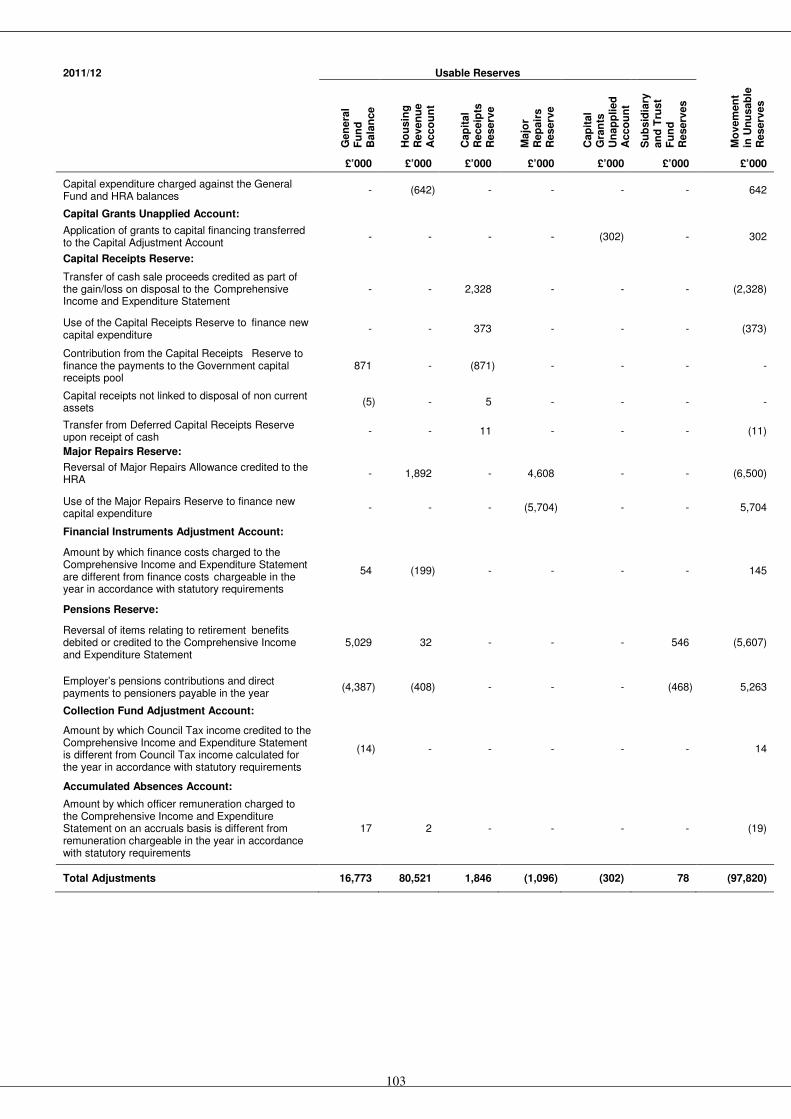
103
2011/12 Usable Reserves
Gen
era
l F
un
d
Bala
nce
Ho
usin
g
Reven
ue
Acco
un
t
Cap
ital
Receip
ts
Reserv
e
Majo
r R
ep
air
s
Reserv
e
Cap
ital
Gra
nts
U
nap
plied
A
cco
un
t
Su
bsid
iary
an
d T
rust
Fu
nd
R
eserv
es
M
ovem
en
t in
Un
usab
le
Reserv
es
£’000 £’000 £’000 £’000 £’000 £’000 £’000
Capital expenditure charged against the General Fund and HRA balances
- (642) - - - - 642
Capital Grants Unapplied Account:
Application of grants to capital financing transferred to the Capital Adjustment Account
- - - - (302) - 302
Capital Receipts Reserve:
Transfer of cash sale proceeds credited as part of the gain/loss on disposal to the Comprehensive Income and Expenditure Statement
- - 2,328 - - - (2,328)
Use of the Capital Receipts Reserve to finance new capital expenditure
- - 373 - - - (373)
Contribution from the Capital Receipts Reserve to finance the payments to the Government capital receipts pool
871 - (871) - - - -
Capital receipts not linked to disposal of non current assets
(5) - 5 - - - -
Transfer from Deferred Capital Receipts Reserve upon receipt of cash
- - 11 - - - (11)
Major Repairs Reserve:
Reversal of Major Repairs Allowance credited to the HRA
- 1,892 - 4,608 - - (6,500)
Use of the Major Repairs Reserve to finance new capital expenditure
- - - (5,704) - - 5,704
Financial Instruments Adjustment Account:
Amount by which finance costs charged to the Comprehensive Income and Expenditure Statement are different from finance costs chargeable in the year in accordance with statutory requirements
54 (199) - - - - 145
Pensions Reserve:
Reversal of items relating to retirement benefits debited or credited to the Comprehensive Income and Expenditure Statement
5,029 32 - - - 546 (5,607)
Employer’s pensions contributions and direct payments to pensioners payable in the year
(4,387) (408) - - - (468) 5,263
Collection Fund Adjustment Account:
Amount by which Council Tax income credited to the Comprehensive Income and Expenditure Statement is different from Council Tax income calculated for the year in accordance with statutory requirements
(14) - - - - - 14
Accumulated Absences Account:
Amount by which officer remuneration charged to the Comprehensive Income and Expenditure Statement on an accruals basis is different from remuneration chargeable in the year in accordance with statutory requirements
17 2 - - - - (19)
Total Adjustments 16,773 80,521 1,846 (1,096) (302) 78 (97,820)
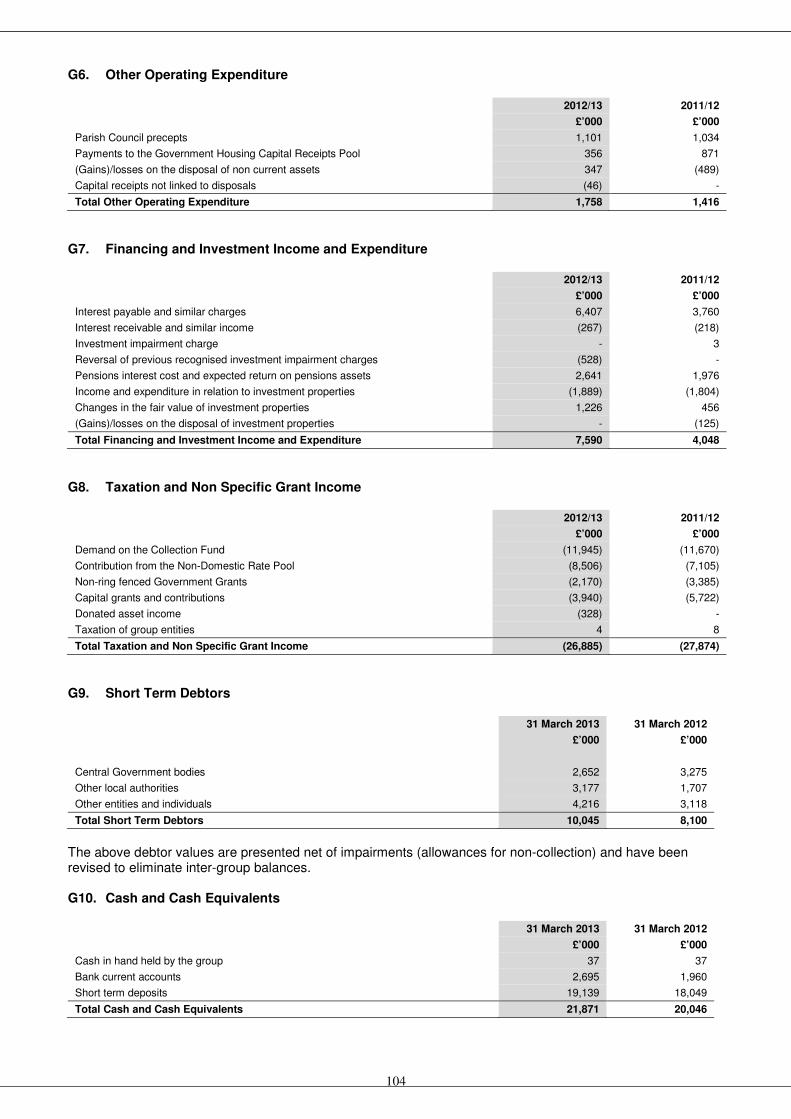
104
G6. Other Operating Expenditure
2012/13 2011/12
£’000 £’000
Parish Council precepts 1,101 1,034
Payments to the Government Housing Capital Receipts Pool 356 871
(Gains)/losses on the disposal of non current assets 347 (489)
Capital receipts not linked to disposals (46) -
Total Other Operating Expenditure 1,758 1,416
G7. Financing and Investment Income and Expenditure
2012/13 2011/12
£’000 £’000
Interest payable and similar charges 6,407 3,760
Interest receivable and similar income (267) (218)
Investment impairment charge - 3
Reversal of previous recognised investment impairment charges (528) -
Pensions interest cost and expected return on pensions assets 2,641 1,976
Income and expenditure in relation to investment properties (1,889) (1,804)
Changes in the fair value of investment properties 1,226 456
(Gains)/losses on the disposal of investment properties - (125)
Total Financing and Investment Income and Expenditure 7,590 4,048
G8. Taxation and Non Specific Grant Income
2012/13 2011/12
£’000 £’000
Demand on the Collection Fund (11,945) (11,670)
Contribution from the Non-Domestic Rate Pool (8,506) (7,105)
Non-ring fenced Government Grants (2,170) (3,385)
Capital grants and contributions (3,940) (5,722)
Donated asset income (328) -
Taxation of group entities 4 8
Total Taxation and Non Specific Grant Income (26,885) (27,874)
G9. Short Term Debtors
31 March 2013 31 March 2012
£’000 £’000
Central Government bodies 2,652 3,275
Other local authorities 3,177 1,707
Other entities and individuals 4,216 3,118
Total Short Term Debtors 10,045 8,100
The above debtor values are presented net of impairments (allowances for non-collection) and have been revised to eliminate inter-group balances. G10. Cash and Cash Equivalents
31 March 2013 31 March 2012
£’000 £’000
Cash in hand held by the group 37 37
Bank current accounts 2,695 1,960
Short term deposits 19,139 18,049
Total Cash and Cash Equivalents 21,871 20,046
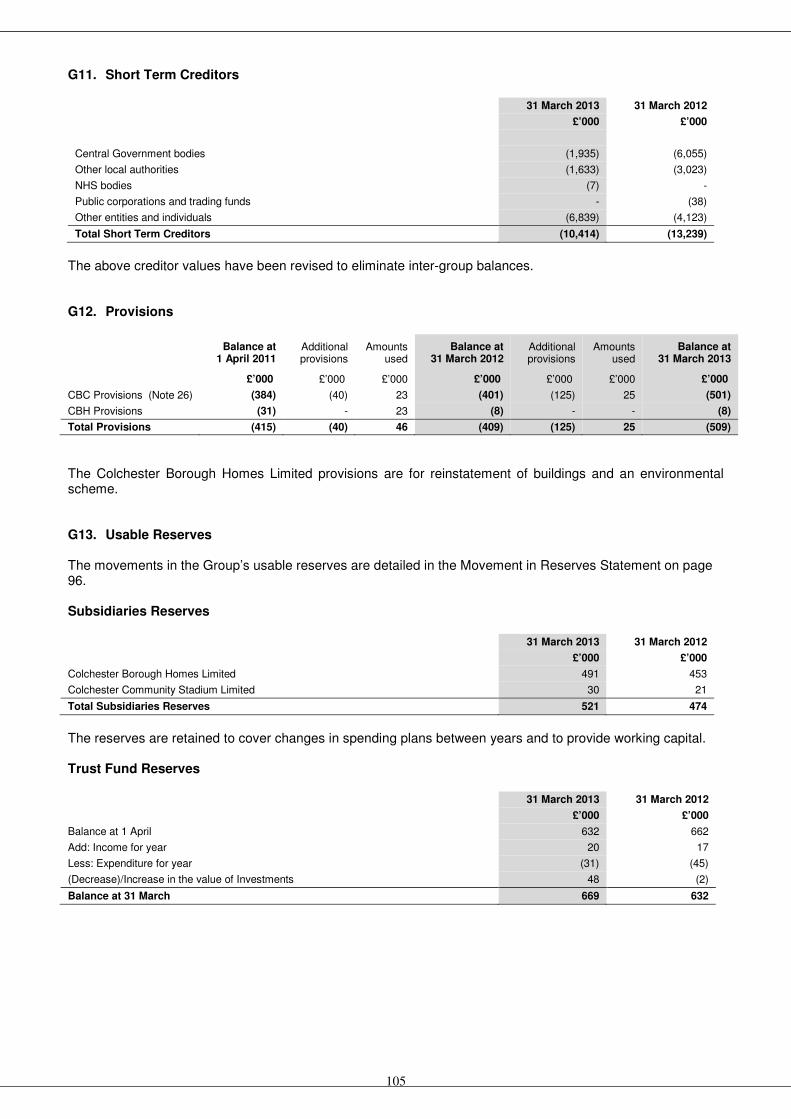
105
G11. Short Term Creditors
31 March 2013 31 March 2012
£’000 £’000
Central Government bodies (1,935) (6,055)
Other local authorities (1,633) (3,023)
NHS bodies (7) -
Public corporations and trading funds - (38)
Other entities and individuals (6,839) (4,123)
Total Short Term Creditors (10,414) (13,239)
The above creditor values have been revised to eliminate inter-group balances. G12. Provisions
Balance at 1 April 2011
Additional provisions
Amounts used
Balance at 31 March 2012
Additional provisions
Amounts used
Balance at 31 March 2013
£’000 £’000 £’000 £’000 £’000 £’000 £’000
CBC Provisions (Note 26) (384) (40) 23 (401) (125) 25 (501)
CBH Provisions (31) - 23 (8) - - (8)
Total Provisions (415) (40) 46 (409) (125) 25 (509)
The Colchester Borough Homes Limited provisions are for reinstatement of buildings and an environmental scheme. G13. Usable Reserves The movements in the Group’s usable reserves are detailed in the Movement in Reserves Statement on page 96. Subsidiaries Reserves
31 March 2013 31 March 2012
£’000 £’000
Colchester Borough Homes Limited 491 453
Colchester Community Stadium Limited 30 21
Total Subsidiaries Reserves 521 474
The reserves are retained to cover changes in spending plans between years and to provide working capital. Trust Fund Reserves
31 March 2013 31 March 2012
£’000 £’000
Balance at 1 April 632 662
Add: Income for year 20 17
Less: Expenditure for year (31) (45)
(Decrease)/Increase in the value of Investments 48 (2)
Balance at 31 March 669 632

106
The total value of the assets and liabilities for the Trust Funds are as follows:-
31 March 2013 31 March 2012
£’000 £’000
Assets 752 720
Liabilities - (5)
Total Net Assets 752 715
Represented by:-
Capital Adjustment Account 83 83
Trust Funds Reserves 669 632
Balance at 31 March 752 715
The assets are not the property of the Council and are subject to charitable trusts. Further details of the nature of the assets and liabilities are provided in the Trust Fund statements (pages 89-94). G14. Unusable Reserves
Note 31 March 2013 31 March 2012
£’000 £’000
Revaluation Reserve 28 24,056 25,583
Capital Adjustment Account See below 258,491 271,218
Financial Instruments Adjustment Account 28 (511) (721)
Pensions Reserve G21 (100,806) (90,482)
Deferred Capital Receipts Reserve 28 27 52
Collection Fund Adjustment Account 28 116 6
Accumulated Absences Account 28 (484) (579)
Total Unusable Reserves 180,889 205,077
Capital Adjustment Account
31 March 2013 31 March 2012
£’000 £’000
Colchester Borough Council 258,408 271,135
Trust Funds 83 83
Balance at 31 March 258,491 271,218

107
G15. Cash Flow Statement – Net Cash Flows from Operating Activities
2012/13 2011/12
£’000 £’000
Net Surplus/(Deficit) on the Provision of Services (11,856) (94,198)
Adjustments for non cash movements:
Depreciation 9,196 9,993
Impairments and downward revaluations 10,404 17,695
Reversal of previous revaluation losses (723) (6)
Carrying value of non current assets sold 2,822 1,622
Derecognition of non current assets 756 5,041
Movement in fair value of investment properties 1,226 456
Donated asset income (328) -
Amortisation 338 339
Impairment losses on investments - 3
Reversal of previously recognised impairment losses on investments (528) -
Carrying amount of short term and long term investments sold - 2
Increase/(Decrease) in interest creditors 764 16
Increase/(Decrease) in creditors (2,650) 4,183
(Increase)/Decrease in interest debtors (42) 6
(Increase)/Decrease in debtors 518 (392)
(Increase)/Decrease in inventories 26 35
Contributions to/(from) provisions 100 (6)
Movement in pension liability 1,832 383
Other non cash movements 78 (4)
23,789 39,366
Adjustments for items that are investing or financing activities:
Capital grants credited to the Surplus/Deficit on the Provision of Services (3,939) (5,721)
Proceeds from the sale of short and long term investments 1,730 6,691
Proceeds from the sale of non current assets (2,527) (2,333)
(4,736) (1,363)
Net Cash Flows from Operating Activities 7,197 (56,195)
Operating activities within the Cash Flow Statement include the following cash flows relating to interest and taxation:
2012/13 2011/12
£’000 £’000
Interest received 160 162
Interest paid (5,659) (3,756)
Taxation (4) (4)
G16. Cash Flow Statement – Cash and Cash Equivalents
2012/13 2011/12
£’000 £’000
Cash in hand held by the Council 37 37
Bank current accounts 2,695 1,960
Short term deposits 19,139 18,049
Bank overdraft (3,184) -
Cash Flow Statement - Total Cash and Cash Equivalents 18,687 20,046

108
G17. Amounts reported for Resource Allocation Decisions The analysis of income and expenditure by service on the face of the Comprehensive Income and Expenditure Statement is that specified by the Service Reporting Code of Practice. However, decisions about resource allocation are taken by the Council on the basis of budget reports analysed across services. These reports are prepared on a different basis from the accounting policies used in the financial statements. In particular:
• no charges are made in relation to capital expenditure (whereas depreciation, revaluation and impairment losses in excess of the balance on the Revaluation Reserve and amortisation are all charged to services in the Comprehensive Income and Expenditure Statement)
• the cost of retirement benefits is based on cash flows (payment of employer’s pensions contributions) rather than current service cost of benefits accrued in the year
• expenditure on some support services is budgeted for centrally and not charged to services. The income and expenditure of the Council’s services recorded in the budget reports for the year is detailed in Note 33. Reconciliation of Service Income and Expenditure to Cost of Services in the Group Comprehensive Income and Expenditure Statement This reconciliation shows how the figures in the analysis of service income and expenditure relate to the amounts included in the Group Comprehensive Income and Expenditure Statement.
31 March 2013 31 March 2012
£’000 £’000
Net expenditure in the Services Analysis (Note 33) 19,458 21,475
Net expenditure of services and support services not included in the Analysis (30,078) (28,248)
Amounts in the Comprehensive Income and Expenditure Statement not reported to management in the Analysis
77,887 62,212
Amounts included in the Analysis not included in the Comprehensive Income and Expenditure Statement
(37,874) 61,169
Cost of Services in Comprehensive Income and Expenditure Statement (Page 97) 29,393 116,608

109
Reconciliation to Subjective Analysis This reconciliation shows how the figures in the analysis of service income and expenditure (refer to Note 33) relate to a subjective analysis of the Surplus/Deficit on the Provision of Services included in the Group Comprehensive Income and Expenditure Statement. Adjustments have been made to the values reported for the Council and the Group entities to eliminate intergroup transactions.
2012/13
Serv
ice
An
aly
sis
Serv
ices a
nd
S
up
po
rt
Serv
ices n
ot
in
An
aly
sis
Am
ou
nts
no
t re
po
rted
to
m
an
ag
em
en
t fo
r d
ecis
ion
makin
g
Am
ou
nts
no
t in
clu
ded
in
I&
E
To
tal
Co
st
of
Serv
ices
Co
rpo
rate
A
mo
un
ts
To
tal
£’000 £’000 £’000 £’000 £’000 £’000 £’000 Fees, charges & other service income (59,567) (907) (79) 9,761 (50,792) - (50,792)
Interest and Investment income - - (6,560) 6,560 - (267) (267)
Income in relation to investment properties
- - - - - (1,965) (1,965)
Income from Council Tax - - - - - (11,945) (11,945)
Movement in the fair value of investment Properties
- - - - - (46) (46)
Government grants and contributions (1,543) (67,451) - 173 (68,821) (14,944) (83,765)
Total Income (61,110) (68,358) (6,639) 16,494 (119,613) (29,167) (148,780)
Employee expenses 26,344 (95) 319 (1,120) 25,448 - 25,448
Other service expenses 50,891 - 84,207 (6,411) 128,687 - 128,687
Support Service recharges 3,333 38,375 - (41,083) 625 - 625
Depreciation, amortisation and impairment
- - - (5,754) (5,754) - (5,754)
Interest Payments and similar charges - - - - - 5,879 5,879
Taxation - - - - - 4 4
Precepts and Levies - - - - - 1,101 1,101
Payments to Housing Capital Receipts Pool
- - - - - 356 356
Expenditure in relation to investment properties
- - - - - 76 76
Movement in the fair value of investment Properties
- - - - - 1,226 1,226
Pensions interest cost and expected return on investments
- - - - - 2,641 2,641
Gain/Loss on Disposal of Non Current Assets
- - - - - 347 347
Total Expenditure 80,568 38,280 84,526 (54,368) 149,006 11,630 160,636
Surplus/Deficit on the provision of services
19,458 (30,078) 77,887 (37,874) 29,393 (17,537) 11,856

110
2011/12
Serv
ice
An
aly
sis
Serv
ices a
nd
S
up
po
rt
Serv
ices n
ot
in
An
aly
sis
Am
ou
nts
no
t re
po
rted
to
m
an
ag
em
en
t fo
r d
ecis
ion
makin
g
Am
ou
nts
no
t in
clu
ded
in
I&
E
To
tal
Co
st
of
Serv
ices
Co
rpo
rate
A
mo
un
ts
To
tal
£’000 £’000 £’000 £’000 £’000 £’000 £’000 Fees, charges & other service income (138,716) (3,413) (21,950) 107,346 (56,733) - (56,733)
Interest and Investment income - - (2,996) 2,996 - (218) (218)
Income in relation to investment properties
- - - - - (2,093) (2,093)
Income from Council Tax - - - - - (11,670) (11,670)
Government grants and contributions (1,911) (64,092) (3,385) 392 (68,996) (16,212) (85,208)
Total Income (140,627) (67,505) (28,331) 110,734 (125,729) (30,193) (155,922)
Employee expenses 27,090 19 987 (989) 27,107 - 27,107
Other service expenses 131,910 - 89,556 (1,683) 219,783 - 219,783
Support Service recharges 3,102 39,238 - (41,883) 457 - 457
Depreciation, amortisation and impairment
- - - (5,010) (5,010) - (5,010)
Interest Payments and similar charges - - - - - 3,763 3,763
Taxation - - - - - 8 8
Precepts and Levies - - - - - 1,034 1,034
Payments to Housing Capital Receipts Pool
- - - - - 871 871
Expenditure in relation to investment properties
- - - - - 289 289
Movement in the fair value of investment Properties
- - - - - 456 456
Pensions interest cost and expected return on investments
- - - - - 1,976 1,976
Gain/Loss on Disposal of Non Current Assets
- - - - - (614) (614)
Total Expenditure 162,102 39,257 90,543 (49,565) 242,337 7,783 250,120
Surplus/Deficit on the provision of services
21,475 (28,248) 62,212 61,169 116,608 (22,410) 94,198
G18. Officers’ Remuneration The remuneration paid to the Group’s senior officers is as follows: 2012/13
Post holder
Salary, Fees and
Allowances
Compensation for loss of office
Pension contributions
Total Remuneration
£ £ £ £
Chief Executive 118,372 - 13,953 132,325
Executive Director 95,971 - 11,309 107,280
Executive Director 99,200 - 11,690 110,890
Executive Director 94,167 - 11,100 105,267
Head of Strategic Policy and Regeneration 71,366 - 8,439 79,805
Head of Life Opportunities 70,882 - 8,353 79,235
Interim part Head of Life Opportunities 54,124 - 6,387 60,511
Head of Environmental and Protective Services 66,838 - 7,871 74,709
Head of Resource Management - - - -
Head of Street Services 70,890 - 8,349 79,239
Head of Corporate Services 2,908 - 343 3,251
Interim part Head of Corporate Services 48,710 - 5,732 54,442
Customer Services Manager 63,262 - 7,587 70,849
Monitoring Officer 62,655 - 7,393 70,048
Section 151 Officer 57,697 - 6,793 64,490
Returning Officer 11,832 - 683 12,515

111
Salary, Fees and
Allowances
Compensation for loss of office
Pension contributions
Total Remuneration
£ £ £ £
Colchester Borough Homes Limited:
Chief Executive 94,068 - 11,100 105,168
Director of Finance and Corporate Services 1 - - - -
Director of Housing 70,758 - 8,349 79,107
Director of Property Services 70,758 - 8,349 79,107
2011/12
Post holder
Notes Salary, Fees and
Allowances
Compensation for loss of office
Pension contributions
Total Remuneration
£ £ £ £
Colchester Borough Council:
Chief Executive 118,372 - 13,952 132,324
Executive Director 94,200 - 11,100 105,300
Executive Director 94,200 - 11,100 105,300
Executive Director 94,200 - 11,100 105,300
Head of Strategic Policy and Regeneration 70,890 - 8,350 79,240
Head of Life Opportunities
70,758 - 8,350 79,108
Head of Environmental and Protective Services
62,655 - 7,393 70,048
Head of Resource Management 2
15,585 - 1,832 17,417
Head of Street Services 70,890 - 8,350 79,240
Head of Corporate Services
66,838 - 7,871 74,709
Customer Services Manager
62,787 - 7,393 70,180
Monitoring Officer 62,655 - 7,393 70,048
Section 151 Officer 2 54,617 - 6,429 61,046
Returning Officer 8,233 - 971 9,204
Colchester Borough Homes Limited:
Chief Executive 94,075 - 11,100 105,175
Director of Finance and Corporate Services 1 - - - -
Director of Housing 72,259 - 8,526 80,785
Director of Property Services 72,259 - 8,526 80,785
Note 1: The former Director of Finance and Corporate Services left Colchester Borough Homes on 24 November 2010. In order to fulfil this role, Colchester Borough Homes took on a consultant to fill this role. Note 2: The Head of Resource Management left during June 2011 at an annualised salary of £70,758. The post has remained vacant, but the duties have been covered by another member of staff taking on the role of Section 151 officer (shown separately above) and sharing the Head of Finance from Ipswich Borough Council 2.5 days per week on a temporary basis. The Group does not pay benefits in kind, expense allowances or bonuses to its senior officers. The Group’s other officers receiving more than £50,000 remuneration for the year (excluding employer’s pension contributions) were paid the following amounts:
Remuneration Band Number of Employees
2012/13 2011/12
£50,000 - £54,999 16 22
£55,000 - £59,999 - -
£60,000 - £64,999 - -
The numbers of exit packages with total cost per band and total cost of the compulsory and other redundancies are set out in the tables below:
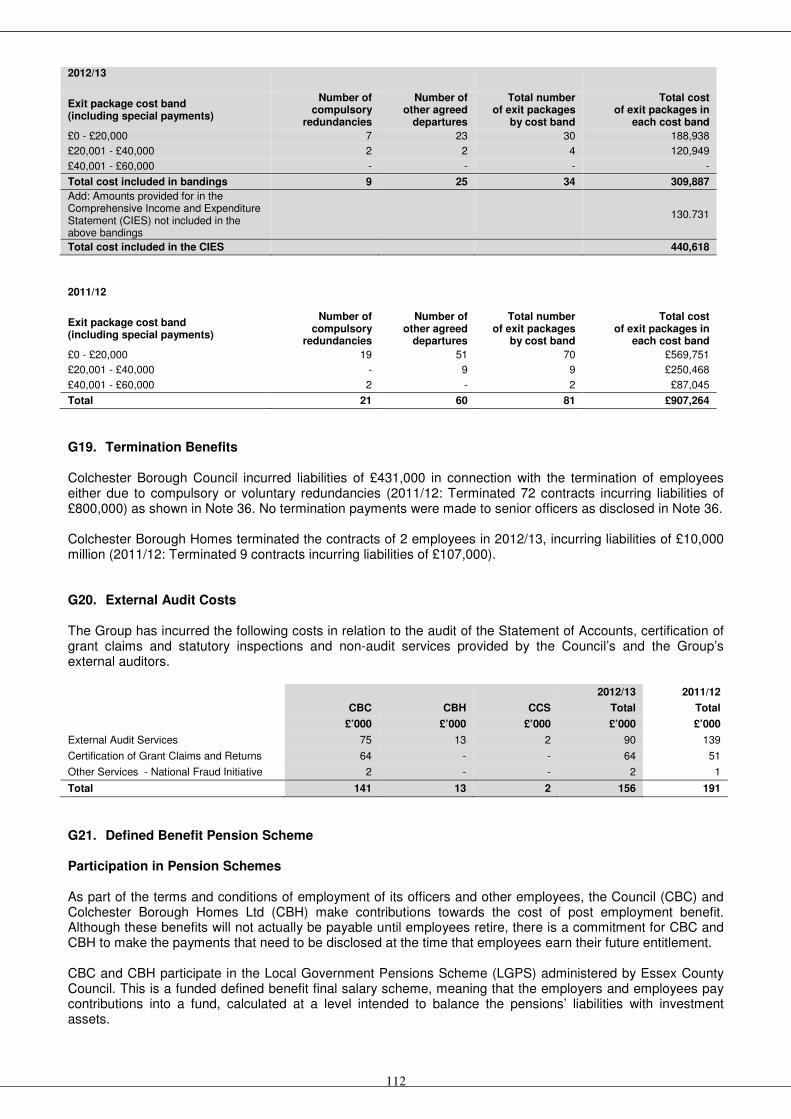
112
2012/13
Exit package cost band (including special payments)
Number of compulsory
redundancies
Number of other agreed
departures
Total number of exit packages
by cost band
Total cost of exit packages in
each cost band
£0 - £20,000 7 23 30 188,938
£20,001 - £40,000 2 2 4 120,949
£40,001 - £60,000 - - - -
Total cost included in bandings 9 25 34 309,887
Add: Amounts provided for in the Comprehensive Income and Expenditure Statement (CIES) not included in the above bandings
130.731
Total cost included in the CIES 440,618
2011/12
Exit package cost band (including special payments)
Number of compulsory
redundancies
Number of other agreed
departures
Total number of exit packages
by cost band
Total cost of exit packages in
each cost band
£0 - £20,000 19 51 70 £569,751
£20,001 - £40,000 - 9 9 £250,468
£40,001 - £60,000 2 - 2 £87,045
Total 21 60 81 £907,264
G19. Termination Benefits Colchester Borough Council incurred liabilities of £431,000 in connection with the termination of employees either due to compulsory or voluntary redundancies (2011/12: Terminated 72 contracts incurring liabilities of £800,000) as shown in Note 36. No termination payments were made to senior officers as disclosed in Note 36. Colchester Borough Homes terminated the contracts of 2 employees in 2012/13, incurring liabilities of £10,000 million (2011/12: Terminated 9 contracts incurring liabilities of £107,000). G20. External Audit Costs The Group has incurred the following costs in relation to the audit of the Statement of Accounts, certification of grant claims and statutory inspections and non-audit services provided by the Council’s and the Group’s external auditors. 2012/13 2011/12
CBC CBH CCS Total Total
£’000 £’000 £’000 £’000 £’000
External Audit Services 75 13 2 90 139
Certification of Grant Claims and Returns 64 - - 64 51
Other Services - National Fraud Initiative 2 - - 2 1
Total 141 13 2 156 191
G21. Defined Benefit Pension Scheme Participation in Pension Schemes As part of the terms and conditions of employment of its officers and other employees, the Council (CBC) and Colchester Borough Homes Ltd (CBH) make contributions towards the cost of post employment benefit. Although these benefits will not actually be payable until employees retire, there is a commitment for CBC and CBH to make the payments that need to be disclosed at the time that employees earn their future entitlement. CBC and CBH participate in the Local Government Pensions Scheme (LGPS) administered by Essex County Council. This is a funded defined benefit final salary scheme, meaning that the employers and employees pay contributions into a fund, calculated at a level intended to balance the pensions’ liabilities with investment assets.

113
Transactions Relating to Retirement Benefits The cost of retirement benefits is recognised in the reported cost of services when they are earned by employees, rather than when the benefits are eventually paid as pensions. However, the charge that is required to be made against Council Tax is based on the cash payable in the year, so the real cost of post employment/retirement benefits is reversed out of the General Fund via the Movement in Reserves Statement. The following transactions have been made in the Group Comprehensive Income and Expenditure Statement and the General Fund Balance via the Movement in Reserves Statement during the year:
Local Government Pension Scheme
2012/13 2011/12
CBC CBH Total Total
£’000 £’000 £’000 £’000
Comprehensive Income and Expenditure Statement
Cost of Services:
Current Service Cost 3,577 689 4,266 3,463
Settlement and Curtailments 319 - 319 168
Financing and Investment Income and Expenditure
Interest Cost 8,410 882 9,292 9,558
Expected Return on Assets in the Scheme (5,842) (809) (6,651) (7,582)
Total Post Employment Benefit Charged to the Surplus/Deficit on the Provision of Services
6,464 762 7,226 5,607
Other Post Employment Benefit Charged to the Comprehensive Income and Expenditure Statement
Actuarial (gains) and losses 8,367 52 8,419 28,110
Total Post Employment Benefit Charged to the Comprehensive Income and Expenditure Statement
14,831 814 15,645 33,717
Movement in Reserves Statement
Reversal of net charges made to the Surplus/Deficit for the Provision of Services for post employment benefits in accordance with the Code
(6,464) (762) (7,226) (5,607)
Actual amount charged against the General Fund Balance for pensions in the year.
Employers’ contributions payable to the scheme 4,871 450 5,321 5,263
The cumulative amount of actuarial gains and losses recognised in the Group Other Comprehensive Income and Expenditure to the 31 March 2013 is a net actuarial loss of £62.7 million (31 March 2012: net actuarial loss of £54.2 million). Assets and Liabilities in Relation to Retirement Benefits Reconciliation of fair value of the scheme assets:
CBC £’000
CBH £’000
2012/13 Total £’000
2011/12 Total £’000
Balance at 1 April 100,744 13,739 114,483 111,912
Expected rate of return 5,842 809 6,651 7,582
Actuarial gains/(losses) 6,618 915 7,533 (6,325)
Employer contributions 4,871 450 5,321 5,263
Contributions by scheme participants 1,118 204 1,322 1,381
Benefits paid (7,191) (415) (7,606) (5,330)
Payment of bulk transfer value (91) - (91) -
Balance at 31 March 111,911 15,702 127,613 114.483

114
Reconciliation of present value of the scheme liabilities (defined benefit obligation):
CBC £’000
CBH £’000
2012/13 Total £’000
2011/12 Total £’000
Balance at 1 April (185,696) (19,269) (204,965) (173,940)
Current service cost (3,577) (689) (4,266) (3,463)
Interest cost (8,410) (882) (9,292) (9,558)
Contributions by scheme participants (1,118) (204) (1,322) (1,381)
Actuarial (gains)/losses (14,985) (967) (15,952) (21,785)
Benefits paid net of transfers in 6,770 415 7,185 4,922
Unfunded pension payments 421 - 421 408
(Losses)/Gains on curtailments (346) - (346) (168)
Liabilities extinguished on settlements 118 - 118 -
Balance at 31 March (206,823) (21,596) (228,419) (204,965)
The expected rate of return on scheme assets is based on the long-term future expected investment return for each asset class at the beginning of the period at 1 April. The returns on gilts and other bonds are assumed to be the annualised gilt yield and corporate bond yield respectively at the relevant date. The returns on equities and property are gilt yields plus expected out performance premium. The actual return on scheme assets in the year was a positive return of £14.2 million (2011/12: A positive return of £1.3 million). Scheme History 2012/13 2011/12 2010/11 2009/10 2008/09
CBC CBH Total Total Total Total Total
£’000 £’000 £’000 £’000 £’000 £’000 £’000
Present value of liabilities (206,823) (21,596) (228,419) (204,965) (173,940) (181,775) (133,101)
Fair value of assets 111,911 15,702 127,613 114,483 111,912 107,170 78,978
Deficit in the scheme (94,912) (5,894) (100,806) (90,482) (62,028) (74,605) (54,123)
The liabilities show the underlying commitments that the Group has in the long run to pay retirement benefits. The total liability of £100.8 million has a significant impact on the net worth of the Group as recorded in the Balance Sheet. However, statutory arrangements for funding the deficit mean that the financial position of the Group remains healthy. The deficit on the scheme will be made good by increased contributions over the remaining working life of employees, as assessed by the scheme actuary. We are making an annual back-funding contribution designed to clear the liability over time. The position is reviewed annually and the contribution required is reassessed at each triennial valuation. The total contributions expected to be made by the Group to the pension scheme for the year to 31 March 2014 is £4.8 million. Basis for Estimating Assets and Liabilities Liabilities have been assessed on an actuarial basis using the projected unit credit method, an estimate of the pensions that will be payable in future years dependent on assumptions about mortality rates, salary levels, etc. The liabilities have been assessed by Barnett Waddingham, an independent firm of actuaries, estimates being based on the latest full valuation of the scheme as at 31 March 2010. The principal assumptions used by the actuary were:
31 March 2013
% 31 March 2012
%
Long-term expected rate of return on assets in the scheme:
Equity Investments 6.1 6.4
Government Bonds 3.0 3.3
Other Bonds 4.1 4.6
Property 5.1 5.4
Cash 0.5 0.5
Alternative Assets 6.1 n/a
Mortality assumptions:
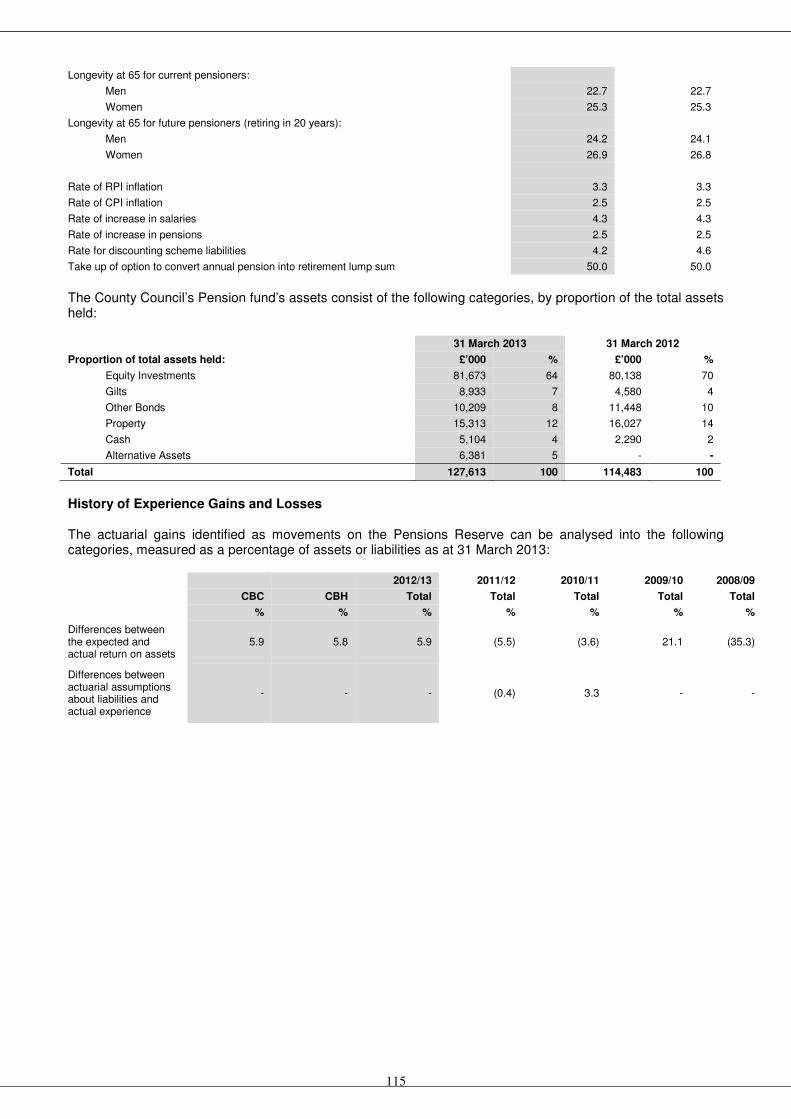
115
Longevity at 65 for current pensioners:
Men 22.7 22.7
Women 25.3 25.3
Longevity at 65 for future pensioners (retiring in 20 years):
Men 24.2 24.1
Women 26.9 26.8
Rate of RPI inflation 3.3 3.3
Rate of CPI inflation 2.5 2.5
Rate of increase in salaries 4.3 4.3
Rate of increase in pensions 2.5 2.5
Rate for discounting scheme liabilities 4.2 4.6
Take up of option to convert annual pension into retirement lump sum 50.0 50.0
The County Council’s Pension fund’s assets consist of the following categories, by proportion of the total assets held: 31 March 2013 31 March 2012
Proportion of total assets held: £’000 % £’000 %
Equity Investments 81,673 64 80,138 70
Gilts 8,933 7 4,580 4
Other Bonds 10,209 8 11,448 10
Property 15,313 12 16,027 14
Cash 5,104 4 2,290 2
Alternative Assets 6,381 5 - -
Total 127,613 100 114,483 100
History of Experience Gains and Losses The actuarial gains identified as movements on the Pensions Reserve can be analysed into the following categories, measured as a percentage of assets or liabilities as at 31 March 2013: 2012/13 2011/12 2010/11 2009/10 2008/09
CBC CBH Total Total Total Total Total
% % % % % % %
Differences between the expected and actual return on assets
5.9 5.8 5.9 (5.5) (3.6) 21.1 (35.3)
Differences between actuarial assumptions about liabilities and actual experience
- - - (0.4) 3.3 - -

116
GLOSSARY Accruals Concept Income and expenditure is recognised where it is earned or incurred, not when the money is received or paid. Actuarial Gains and Losses For a defined benefit pension scheme, actuarial gains and losses are the changes in the actuarial surplus and deficits which arise because either events have not coincided with previous actuarial assumptions or where actuarial assumptions have changed. Appropriations The transfer of resources between revenue/capital accounts and the reserves held by the Council. Billing Authority This refers to Colchester Borough Council as the authority responsible for invoicing and collecting the Council Tax form all residential properties within the borough. This is undertaken on behalf of Colchester Borough Council, Essex County Council, Essex Fire Authority, Essex Police Authority and Parish and Town Councils. Colchester Borough Council is also the authority responsible for invoicing and collecting the National Non-Domestic Rates on behalf of Central Government. Budget Requirement This represents net budgeted expenditure for the year adjusted for transfers to and from reserves, but allowing for sums required by Parish and Town Councils. It is used to determine the amount of Council Tax to be precepted on the Collection Fund after allowing for income from Revenue Support Grant, redistribution of National Non-Domestic Rates and any surplus/deficit on the Collection Fund. Capital Expenditure Expenditure incurred relating to the acquisition or enhancements of Property, Plant & Equipment assets, Heritage assets and Investment properties. Capital Financing Requirement The statutory measure of a local authority’s underlying need to borrow for capital purposes. Capital Programme The Council’s budget for capital expenditure and resources over the current and future years. Capital Receipts Income generated from the sale of capital assets and the repayment of grants/loans given for capital purposes. The government prescribes the amount of the receipt which must be set aside to repay debt and the usable amount which may be used for finance capital expenditure. Carry Forwards Budget provision for specific items that are committed or planned for a year where the specific goods or services are not received by 31 March and for which there is no provision in the following year. Such budgets may be formally ‘carried forward’ to the following year to match the committed or planned expenditure. Chartered Institute of Public Finance and Accountancy (CIPFA) The Chartered Institute of Public Finance and Accountancy is the professional body for public services. CIPFA issues the Code of Practice on Local Authority Accounting (the Code), which sets down in detail how the accounting standards are to be applied to the preparation of statement of accounts for local authorities. Collection Fund All receipts of Council Tax and Non-Domestic Rates are paid into this Fund. The Council uses this to pay its precepts to Essex County Council, Essex Fire authority and Essex Police Authority and the demand by the Council’s General Fund, which finance the Council’s day to day expenditure. Any surplus or deficit is shared between the various authorities (excluding Parish and Town Councils) in proportion to the precepted amounts. Contingent Liabilities A contingent liability arises where an event has taken place that gives the Council a possible obligation whose existence will only be confirmed by the occurrence or otherwise of uncertain future events not wholly within the control of the authority. Contingent liabilities also arise in circumstances where a provision would otherwise be made but either it is not probable that an outflow of resources will be required or the amount of the obligation

117
cannot be measured reliably. Contingent liabilities are not recognised in the Balance Sheet but are disclosed in a note to the accounts. Corporate and Democratic Core (CDC) This incorporates the following subdivisions, the activities of which cannot be recharged to service under the Service Reporting Code of Practice (SeRCOP):
• Democratic Representation and Management Costs – these include all aspects of the activities of Council members, such as policy making and general governance.
• Corporate Management Costs – these relate to activities which provide the infrastructure of the Council which allows services to be provided.
Council Tax A local tax charged to the occupiers of residential properties used to finance the budget requirement of the Council for the year. Creditors Amounts owed by the Council for goods, services and works that have been received by the Council for which no payments have not been made by the Council at the Balance Sheet date. Current Asset Asset held which will be realised, sold or consumed within the next financial year. Current Liability Amount which will be settled or could be called in within the next financial year. Debtors Amounts owed to the Council for goods, services and works that have been provided by the Council for which payments have not been received by the Council at the Balance Sheet date. Depreciation The measure of the loss in the value of an asset during the period due to age, wear and tear, deterioration or obsolescence. This charge is spread over the useful life of the asset. Earmarked Reserves Amounts set aside for future commitments or potential liabilities. Fair Value The amount for which an asset could be exchanged or a liability settled, between knowledgeable, willing parties in an arm’s length transaction. Financial Instruments These are contracts that give rise to a financial asset of one entity and a financial liability or equity instrument of another entity. The financial instruments held by the Council include borrowings, investments, creditors and debtors. Financial Year The period of twelve months covered by the accounts, which commences on 1st April. General Fund The main revenue fund of the Council, which summarises the cost of all services (except those relating to Council Housing) provided by the Council. Gross Book Value This represents the original price paid for an asset adjusted for subsequent revaluations, acquisitions, enhancements and disposals. Housing Revenue Account (HRA) This statutory account records the revenue expenditure and income relating to the provision of Council housing. It shows the major elements of the housing revenue expenditure and how this is met through the receipt of rents, subsidy and other income. IFRS (International Financial Reporting Standards) The collective name for the set of accounting standards which define the accounting treatments used by Central and Local Government in the UK, listed companies in the UK and the European Union.

118
Impairment A reduction in the value of a non current asset caused by a specific event occurring to the asset. Intangible Assets Assets which do not have a physical substance but are identifiable and are controlled by the Council through custody or legal rights. Examples of such asset are software licences. Investment Properties Property (land or a building, or part of a building, or both) held solely to earn rentals or for capital appreciation or both, rather than for use in the production or supply of goods or services or for administrative purposes, or sale in the ordinary course of operations. Leases A lease is an agreement whereby the lessor conveys to the lessee in return for a payment or series of payments the right to use an asset for an agreed period of time. A finance lease is a lease that transfers substantially all the risks and rewards incidental to ownership of an asset. Title may or may not eventually be transferred. Major Repairs Reserve (MRR) A capital reserve held for investment in the replacement of structures and components of the Council’s Housing stock. This reserve is funded from the HRA by transferring in the total depreciation charge for the year. Sums are transferred out to meet the cost of capital expenditure. Any balance on the reserve is carried forward to be utilised in future years. Interest earned on the MRR balance is credited directly to the HRA. Minimum Revenue Provision (MRP) Local authorities must make prudent provision for the repayment of its debt. MRP is the minimum amount which must be charged to the revenue account each year in order to provide for the repayment of loans and other amounts borrowed by the Council. There is no MRP for HRA debt. Authorities are free to make additional voluntary provisions from the General Fund, HRA or from capital resources. Non Distributed Costs These are overhead costs which provide no benefits to services and are therefore not distributed to services. These include pensions arising from discretionary added years service. National Non-Domestic Rates (NNDR) This is a levy paid by the occupiers of non residential properties within the Council’s borough. This levy contributes to the cost of provide local authority services. It is charged on the rateable value of the each non residential property multiplied by a uniform amount set annually by central government. NNDR income collected by the Council is paid into a national pool, which is then divided by central government between authorities in proportion to their population. Net Book Value (NBV) The Net Book Value of an asset is equivalent to its gross book value, less cumulative depreciation and impairment charges. Assets are included in the Balance Sheet at their net book value. Precept This is the amount that local authorities providing services within the Colchester borough require to be paid from the Collection fund to meet the net cost of their services. The Council Tax requirement is made up of the sum of all the precepts levied on the Billing Authority. For the Colchester borough – precepts are raised by Colchester Borough Council, Essex County Council, Essex Police Authority, Essex Fire Authority and Town and Parish Councils. Principal Amount The original amount of debt or investment on which interest is calculated. Property, Plant and Equipment (PPE) Assets held by the Council, which are directly used or occupied by the Council in the delivery of the Council’s services. These are tangible assets (e.g. land, buildings, vehicles etc.) which yield benefit to the Council for a period of more than a year. Provisions Amounts set aside where an event has taken place that gives the Council a legal or constructive obligation that probably requires settlement by a transfer of economic benefits or service potential, and a reliable estimate can be made of the amount of the obligation.

119
Prudential Code This Code is developed by CIPFA and sets out the system of capital financing and capital controls for local authorities. Prudential limits apply to all borrowing, qualifying credit arrangements and other long-term liabilities – whether supported by government or entirely self-financed. The system is designed to encourage authorities that need, and can afford, to borrow for capital investment to do so. The Code seeks to ensure that local authorities’ capital investment plans are affordable, prudent and sustainable; that treasury management decisions are taken in accordance with good professional practice; and that local strategic planning, asset management planning and proper option appraisal are supported. Public Works Loan Board (PWLB) A central government agency that offers long term loans to local authorities at interest rates marginally above the government’s own cost of borrowing. Revaluation Revaluation is a technique used to adjust the value of certain classes of non current assets to their fair value. Revenue Expenditure Funded from Capital under Statute (REFCUS) Expenditure incurred during the year that may be capitalised under statutory provisions but that does not result in the creation of a non-current asset. Revenue Support Grant (RSG) Central government provides financial support towards the general expenditure of local authorities. The entitlement of each local authority is determined by a prescribed methodology. Service Reporting Code of Practice (SeRCOP) This guidance is produced by CIPFA and sets out the proper accounting practices for local authorities in respect of the content and presentation of the costs and income of services. Useful Life The period over which benefits will be derived by the Council from the use of a non current asset.

120
INDEPENDENT AUDITOR’S REPORT TO THE MEMBERS OF COLCHESTER BOROUGH COUNCIL
Opinion on the Authority’s financial statements We have audited the financial statements of Colchester Borough Council for the year ended 31 March 2013 under the Audit Commission Act 1998. The financial statements comprise the Authority and Group Movement in Reserves Statement, the Authority and Group Comprehensive Income and Expenditure Statement, the Authority and Group Balance Sheet, the Authority and Group Cash Flow Statement, the Housing Revenue Account Income and Expenditure Statement, the Movement on the Housing Revenue Account Statement and Collection Fund and the related notes 1 to 46, H1 to H16, C1 to C9 and G1 to G21. The financial reporting framework that has been applied in their preparation is applicable law and the CIPFA/LASAAC Code of Practice on Local Authority Accounting in the United Kingdom 2012/13. This report is made solely to the members of Colchester Borough Council as a body, in accordance with Part II of the Audit Commission Act 1998 and for no other purpose, as set out in paragraph 48 of the Statement of Responsibilities of Auditors and Audited Bodies published by the Audit Commission in March 2010. To the fullest extent permitted by law, we do not accept or assume responsibility to anyone other than the authority and the authority’s members as a body, for our audit work, for this report, or for the opinions we have formed. Respective responsibilities of the Chief Financial Officer and auditor As explained more fully in the Statement of the Chief Financial Officer’s Responsibilities set out on page 8, the Chief Financial Officer is responsible for the preparation of the Statement of Accounts, which includes the financial statements, in accordance with proper practices as set out in the CIPFA/LASAAC Code of Practice on Local Authority Accounting in the United Kingdom 2012/13, and for being satisfied that they give a true and fair view. Our responsibility is to audit and express an opinion on the financial statements in accordance with applicable law and International Standards on Auditing (UK and Ireland). Those standards require us to comply with the Auditing Practices Board’s Ethical Standards for Auditors. Scope of the audit of the financial statements An audit involves obtaining evidence about the amounts and disclosures in the financial statements sufficient to give reasonable assurance that the financial statements are free from material misstatement, whether caused by fraud or error. This includes an assessment of: whether the accounting policies are appropriate to the Authority and Group’s circumstances and have been consistently applied and adequately disclosed; the reasonableness of significant accounting estimates made by the Chief Financial Officer; and the overall presentation of the financial statements. In addition, we read all the financial and non-financial information in the explanatory foreword to identify material inconsistencies with the audited financial statements. If we become aware of any apparent material misstatements or inconsistencies we consider the implications for our report. Opinion on financial statements In our opinion the financial statements:
• give a true and fair view of the financial position of Colchester Borough Council as at 31 March 2013 and of its expenditure and income for the year then ended;
• give a true and fair view of the financial position of the Group as at 31 March 2013 and of its expenditure and income for the year then ended; and
• have been prepared properly in accordance with the CIPFA/LASAAC Code of Practice on Local Authority Accounting in the United Kingdom 2012/13.
Opinion on other matters In our opinion, the information given in the Statement of Accounts 2012-13 for the financial year for which the financial statements are prepared is consistent with the financial statements. Matters on which we report by exception We report to you if:
• in our opinion the annual governance statement does not reflect compliance with ‘Delivering Good Governance in Local Government: a Framework’ published by CIPFA/SOLACE in June 2007;
• we issue a report in the public interest under section 8 of the Audit Commission Act 1998;
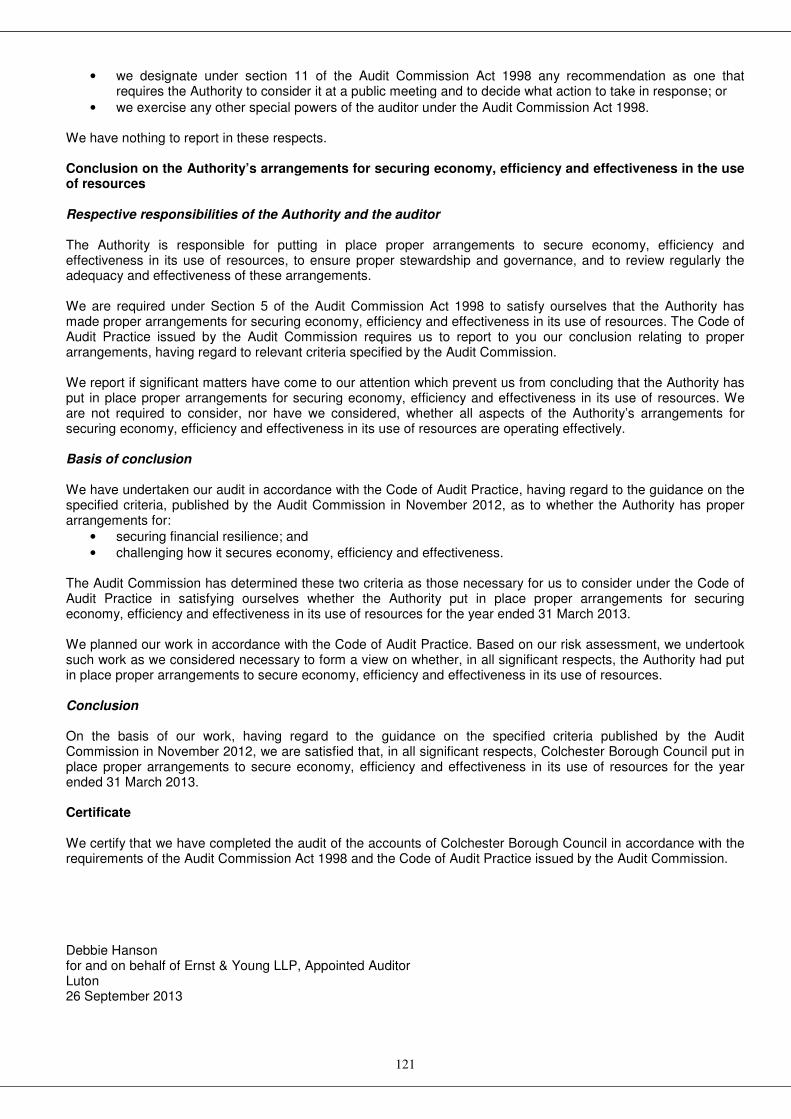
121
• we designate under section 11 of the Audit Commission Act 1998 any recommendation as one that requires the Authority to consider it at a public meeting and to decide what action to take in response; or
• we exercise any other special powers of the auditor under the Audit Commission Act 1998.
We have nothing to report in these respects. Conclusion on the Authority’s arrangements for securing economy, efficiency and effectiveness in the use of resources Respective responsibilities of the Authority and the auditor The Authority is responsible for putting in place proper arrangements to secure economy, efficiency and effectiveness in its use of resources, to ensure proper stewardship and governance, and to review regularly the adequacy and effectiveness of these arrangements. We are required under Section 5 of the Audit Commission Act 1998 to satisfy ourselves that the Authority has made proper arrangements for securing economy, efficiency and effectiveness in its use of resources. The Code of Audit Practice issued by the Audit Commission requires us to report to you our conclusion relating to proper arrangements, having regard to relevant criteria specified by the Audit Commission. We report if significant matters have come to our attention which prevent us from concluding that the Authority has put in place proper arrangements for securing economy, efficiency and effectiveness in its use of resources. We are not required to consider, nor have we considered, whether all aspects of the Authority’s arrangements for securing economy, efficiency and effectiveness in its use of resources are operating effectively. Basis of conclusion We have undertaken our audit in accordance with the Code of Audit Practice, having regard to the guidance on the specified criteria, published by the Audit Commission in November 2012, as to whether the Authority has proper arrangements for:
• securing financial resilience; and
• challenging how it secures economy, efficiency and effectiveness. The Audit Commission has determined these two criteria as those necessary for us to consider under the Code of Audit Practice in satisfying ourselves whether the Authority put in place proper arrangements for securing economy, efficiency and effectiveness in its use of resources for the year ended 31 March 2013. We planned our work in accordance with the Code of Audit Practice. Based on our risk assessment, we undertook such work as we considered necessary to form a view on whether, in all significant respects, the Authority had put in place proper arrangements to secure economy, efficiency and effectiveness in its use of resources. Conclusion On the basis of our work, having regard to the guidance on the specified criteria published by the Audit Commission in November 2012, we are satisfied that, in all significant respects, Colchester Borough Council put in place proper arrangements to secure economy, efficiency and effectiveness in its use of resources for the year ended 31 March 2013. Certificate We certify that we have completed the audit of the accounts of Colchester Borough Council in accordance with the requirements of the Audit Commission Act 1998 and the Code of Audit Practice issued by the Audit Commission. Debbie Hanson for and on behalf of Ernst & Young LLP, Appointed Auditor Luton 26 September 2013
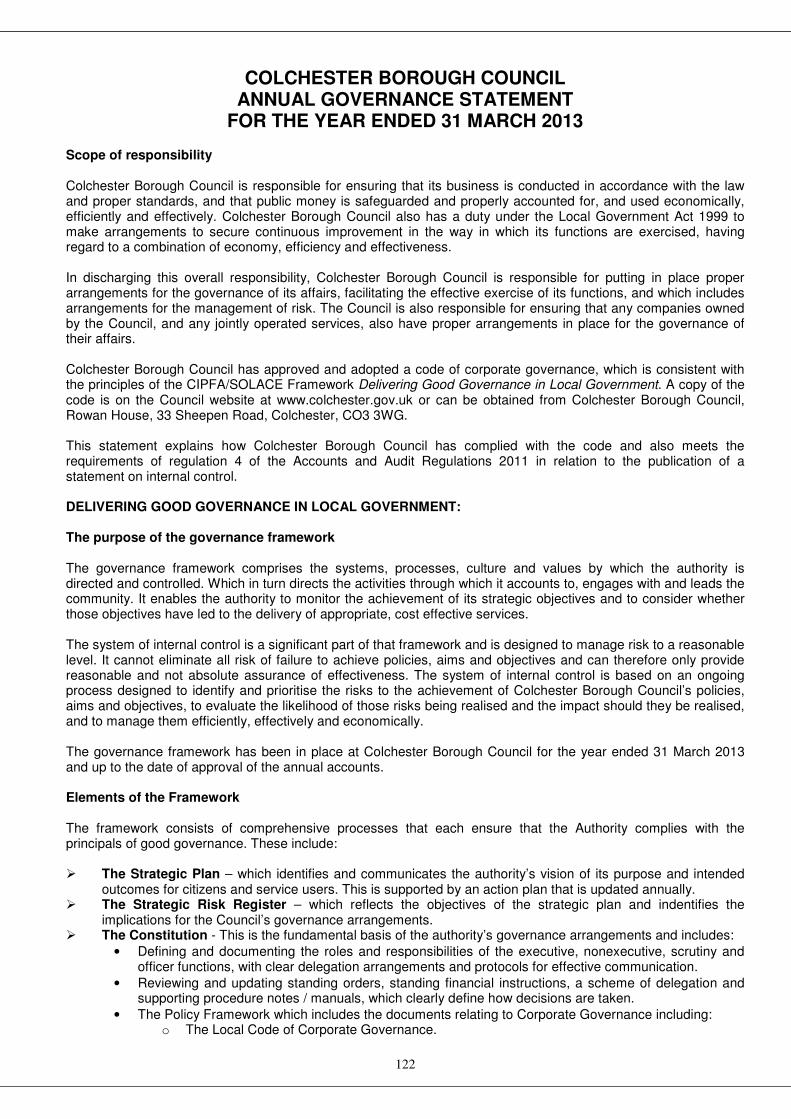
122
COLCHESTER BOROUGH COUNCIL ANNUAL GOVERNANCE STATEMENT
FOR THE YEAR ENDED 31 MARCH 2013 Scope of responsibility Colchester Borough Council is responsible for ensuring that its business is conducted in accordance with the law and proper standards, and that public money is safeguarded and properly accounted for, and used economically, efficiently and effectively. Colchester Borough Council also has a duty under the Local Government Act 1999 to make arrangements to secure continuous improvement in the way in which its functions are exercised, having regard to a combination of economy, efficiency and effectiveness. In discharging this overall responsibility, Colchester Borough Council is responsible for putting in place proper arrangements for the governance of its affairs, facilitating the effective exercise of its functions, and which includes arrangements for the management of risk. The Council is also responsible for ensuring that any companies owned by the Council, and any jointly operated services, also have proper arrangements in place for the governance of their affairs. Colchester Borough Council has approved and adopted a code of corporate governance, which is consistent with the principles of the CIPFA/SOLACE Framework Delivering Good Governance in Local Government. A copy of the code is on the Council website at www.colchester.gov.uk or can be obtained from Colchester Borough Council, Rowan House, 33 Sheepen Road, Colchester, CO3 3WG. This statement explains how Colchester Borough Council has complied with the code and also meets the requirements of regulation 4 of the Accounts and Audit Regulations 2011 in relation to the publication of a statement on internal control. DELIVERING GOOD GOVERNANCE IN LOCAL GOVERNMENT: The purpose of the governance framework The governance framework comprises the systems, processes, culture and values by which the authority is directed and controlled. Which in turn directs the activities through which it accounts to, engages with and leads the community. It enables the authority to monitor the achievement of its strategic objectives and to consider whether those objectives have led to the delivery of appropriate, cost effective services. The system of internal control is a significant part of that framework and is designed to manage risk to a reasonable level. It cannot eliminate all risk of failure to achieve policies, aims and objectives and can therefore only provide reasonable and not absolute assurance of effectiveness. The system of internal control is based on an ongoing process designed to identify and prioritise the risks to the achievement of Colchester Borough Council’s policies, aims and objectives, to evaluate the likelihood of those risks being realised and the impact should they be realised, and to manage them efficiently, effectively and economically. The governance framework has been in place at Colchester Borough Council for the year ended 31 March 2013 and up to the date of approval of the annual accounts. Elements of the Framework The framework consists of comprehensive processes that each ensure that the Authority complies with the principals of good governance. These include: � The Strategic Plan – which identifies and communicates the authority’s vision of its purpose and intended
outcomes for citizens and service users. This is supported by an action plan that is updated annually. � The Strategic Risk Register – which reflects the objectives of the strategic plan and indentifies the
implications for the Council’s governance arrangements. � The Constitution - This is the fundamental basis of the authority’s governance arrangements and includes:
• Defining and documenting the roles and responsibilities of the executive, nonexecutive, scrutiny and officer functions, with clear delegation arrangements and protocols for effective communication.
• Reviewing and updating standing orders, standing financial instructions, a scheme of delegation and supporting procedure notes / manuals, which clearly define how decisions are taken.
• The Policy Framework which includes the documents relating to Corporate Governance including: o The Local Code of Corporate Governance.
123
o A risk management strategy detailing processes and controls required to manage risks. o The Anti-Fraud and Corruption Policy
• The Ethical Framework which includes documents relating to standards of conduct and good practice which include:
o A code of conduct which defines the standards of behaviour for all members. o Planning procedures Code of Practice o Protocol on Members/officer Relations o Media Protocol o Operational Protocol relating to Administration Arrangements o Monitoring Officer Protocol o Chief Finance Officer Protocol o Resources Protocol o A whistle blowing policy for receiving and investigating complaints from the public and staff. o Gifts and Hospitality Guidance
� The Chief Finance Officer Protocol sets out the responsibilities to conform with the governance requirements of the CIPFA statement on the Role of the Chief Financial Officer in Local Government (2010)
� The operation of the Finance and Audit Scrutiny Panel* which undertakes the core functions of an audit committee, as identified in CIPFA’s document ‘Audit Committees – Practical Guidance for Local Authorities’.
� The operation of the Strategic Overview and Scrutiny Panel* to ensure that the actions of the Cabinet accord with the policies and budget of the Council, monitor the financial performance of the Council, link spending proposals to the Council’s policy priorities and review progress and to review decisions of the Cabinet via the call-in procedure.
� The operation of a Standards Committee*, that enforces the code of conduct for members. � A performance management system for all officers that identifies key objectives and development needs. � A members training programme. � A communications strategy which establishes clear channels of communication with all sections of the
community and other stakeholders, ensuring accountability and encouraging open consultation. � A partnership strategy that ensures that the quality of the Council’s partnerships are improved and that all
partnerships, both current and proposed, add value. � Treasury management practices and policies *These committees operated during 2012/13 but have been replaced under the new committee arrangements implemented in April 2013. Until October 2012 there was an interim Head of Resource Management which was a shared post with a neighbouring authority. From November 2012 until the end of the financial year the Executive Director (People and Performance) took on the role of Head of Resource Management. However the Finance Manager (Management Accounting) has continued to hold the post of the Section 151 Officer for Colchester Borough Council during the entire year. The arrangements in place ensured that Colchester Borough Council’s financial management arrangements conformed with the governance requirements of the CIPFA statement on the Role of the Chief Financial Officer in Local Government (2010). DELIVERING GOOD GOVERNANCE IN LOCAL GOVERNMENT: Review of effectiveness Colchester Borough Council has responsibility for conducting, at least annually, a review of the effectiveness of its governance framework including the system of internal control. The review of effectiveness is informed by the work of the senior managers within the authority who have responsibility for the development and maintenance of the governance environment, the Internal Audit annual report, and also by comments made by the external auditors and other review agencies and inspectorates including the Benefits Fraud Inspectorate, Equal Opportunities Commission, Lexcel, Investors In People, the Vehicle Inspectorate, DEFRA, East England Tourist Board, the Office of Surveillance Commissioners and the Local Government Ombudsman. As well as the annual review, the governance and control frameworks are maintained and reviewed by a series of comprehensive processes throughout the year. These include:
� A robust Internal Audit function where the planned work is based on identified key systems and risk areas
� An embedded reporting system for both internal and external audit issues that ensures that senior managers and members are fully briefed on key issues, which includes regular reporting to the Finance and Audit Scrutiny Panel.
� A comprehensive risk management process that ensures the key risks across the authority, both operational and strategic, are captured and reported to senior officers and members.
� The reports of the Chief Financial Officer to members and the senior management team including financial assessments of key projects and decisions.

124
� The operation of an independent Standards Committee that is fully briefed to review the conduct of members.
� Reporting of key performance issues to the Strategic Overview and Scrutiny Panel. � A comprehensive budget monitoring process that is reported monthly to senior managers. � A partnership register that records the details of all of the partnerships that the Council is involved in.
The significant control issues found during the course of the review are highlighted in the table at the end of the statement. Effectiveness of Other Organisations The Council owns two companies, Colchester Borough Homes (CBH) which was created in 2003 and Colchester Community Stadium Limited (CCSL) that was created in 2007. As these are limited companies there is no requirement for them to produce Governance Statements in this format. However it is recognised by the Council that it is essential for these companies to operate effective governance procedures to ensure appropriate and cost effective service provision and protection of Council assets. Whilst CBH is an ‘arms length’ company it is still necessary for the Council to ensure that it operates effectively to ensure that it provides an effective and economical service to housing tenants and that the Council’s asset, the housing stock, is adequately protected.. CBH have produced their own Annual Governance Statement that has been shared with the Council. However there have been no significant control weaknesses identified during the year, either through this review process or through the audit programme, that are required to be included in this statement. A review of the management arrangements for CCSL was carried out as part of the preparation of this statement. Whilst CCSL is an ‘arms length’ company it is still necessary for the Council to ensure that it operates effectively to ensure that it can make the necessary loan repayments to the Council and that the Council’s asset, the stadium, is adequately protected. Previous governance reviews had highlighted some weaknesses in control arrangements of the stadium which have been resolved. The Council is the lead partner in a joint museum service with Ipswich Borough Council. Due to the nature of the arrangement, the joint museum service is required to produce its own annual return which includes an assessment of internal control. Therefore it is not intended to include any details relating to this service within this statement. The North Essex Parking Partnership was created on 1 April 2011 with Colchester Borough Council as the lead partner. The partnership is required to produce its own annual return which includes an assessment of internal control. Therefore it is not intended to include any details relating to the service within this statement. The Council has a comprehensive partnership strategy and maintains a detailed register of the partnerships that it participates in. The strategy defines what a partnership is and details the governance arrangements that should be in place for all partnerships, both present and new. It also provides a mechanism for improving the effectiveness of the partnerships. Internal Audit Opinion From the work undertaken in 2012/13, Internal Audit has provided satisfactory assurance that the system of internal control that has been in place at the Council for the year ended 31 March 2013 accords with proper practice. This is excepting any details of significant internal control issues as documented hereafter. It is also the opinion of Internal Audit that the Council’s corporate governance framework complies with the best practice guidance on corporate governance issued by CIPFA/SOLACE. Significant Governance Issues The review of the effectiveness of the governance and internal control arrangements has identified some areas where actions are required to ensure that the authority continues to provide appropriate and cost effective services. The issues and action plans are shown in the table below. These will be monitored and reviewed via the Internal Audit reporting process.

125
No. Issue Action
1.
Leisure World During the year the accountancy business partner highlighted an anomaly with some income for the Events service at Leisure World. This lead to further investigation which uncovered the loss of a significant sum of money over a period of time. A member of staff was dismissed as a result. During February 2013 an internal audit of Leisure World was carried out. 12 level 2, and 1 level 3, recommendations were made. This resulted in a limited assurance being given. Several of the recommendations related to the policies and procedures relating to cash handling and income processes.
Management have agreed the recommendations in the report and many are already implemented. These include: • Reviewing policies and procedures • Record control • Updating information • Invoice monitoring • Monitoring hire income • Monitoring refunds • Stock control • Evidencing qualifications
2.
Fuel Usage and Control
The internal audit of fuel usage and control
resulted in 7 level 1, and 6 level 2,
recommendations. The issues highlighted
covered areas including policies and
procedures, receipting fuel, monitoring usage,
dispensing fuel, use of fobs and use of fuel
cards.
Management have agreed the recommendations in the report and these include: • Revising policies and procedures • Recording of information • Inventory management • Reconciling fuel usage • Monitoring of fob usage • Monitoring of fuel cards • Management reporting
3.
Joint Museum Service An internal audit of the joint museum service was carried out in March 2013. This is currently in the draft report stage but has highlighted several medium priority issues relating to procedures, records, cash handling and stock control.
The recommendations in the report, that are agreed, will be implemented.
4.
Creditors This is one of the Council’s key financial systems and received a limited assurance opinion when the internal audit was carried out in October 2012. The audit was limited due to changes in the external risk of fraud. The system has not changed but the risk of fraudulent creation of, or changes to, supplier details has become greater and the system has not been adapted to safeguard against this.
Management have agreed to introduce an independent check of new supplier details or requests to change bank account details.
5.
Contract Management The internal audit, carried out in August 2012, highlighted two level 1, and nine level 2, recommendations. The issues mainly relate to the actions of service areas failing to ensure that correct processes are followed.
It has been agreed that the following will be implemented: • Training sessions to be provided • Amended guidance on procurement • Completion of the procurement toolkit • Monitoring of usage • Review of contract lettings • Completion and maintenance of records.

126
We have been advised on the implications of the result of the review of the effectiveness of the governance framework by the Governance Committee and we propose over the coming year to take steps to address the above matters to further enhance our governance arrangements. We are satisfied that these steps will address the need for improvements that were identified in our review of effectiveness and will monitor their implementation and operation as part of our next annual review. Signed: ……………..................…………………… ……………………………………………… Councillor Anne Turrell Adrian Pritchard Leader of the Council Chief Executive
on behalf of Colchester Borough Council