
StateFarmMutualFundTrust ANNUAL REPORT · StateFarmMutualFundTrust ANNUAL REPORT ClassAShares...
236
December 31, 2017 State Farm Mutual Fund Trust ANNUAL REPORT Class A Shares Class B Shares Premier Shares Legacy Class B Shares Institutional Shares Class R-1, R-2 and R-3 Shares State Farm Equity Fund State Farm Small/Mid Cap Equity Fund State Farm International Equity Fund State Farm S&P 500 Index Fund State Farm Small Cap Index Fund State Farm International Index Fund State Farm Equity and Bond Fund State Farm Bond Fund State Farm Tax Advantaged Bond Fund State Farm Money Market Fund State Farm LifePath ® Retirement Fund State Farm LifePath 2020 Fund State Farm LifePath 2030 Fund State Farm LifePath 2040 Fund State Farm LifePath 2050 Fund
Transcript of StateFarmMutualFundTrust ANNUAL REPORT · StateFarmMutualFundTrust ANNUAL REPORT ClassAShares...

December 31, 2017
State Farm Mutual Fund Trust
A N N U A L R E P O R TClass A Shares
Class B Shares
Premier Shares
Legacy Class B Shares
Institutional Shares
Class R-1, R-2 and R-3 Shares
State Farm Equity Fund
State Farm Small/Mid Cap Equity Fund
State Farm International Equity Fund
State Farm S&P 500 Index Fund
State Farm Small Cap Index Fund
State Farm International Index Fund
State Farm Equity and Bond Fund
State Farm Bond Fund
State Farm Tax Advantaged Bond Fund
State Farm Money Market Fund
State Farm LifePath® Retirement Fund
State Farm LifePath 2020 Fund
State Farm LifePath 2030 Fund
State Farm LifePath 2040 Fund
State Farm LifePath 2050 Fund


Message to Shareholders. . . . . . . . . . . . . . . . . . . . . . . 1
Management’s Discussions (unaudited)State Farm Equity Fund . . . . . . . . . . . . . . . . . . . . . 4State Farm Small/Mid Cap Equity Fund . . . . . . . . . . 9State Farm International Equity Fund . . . . . . . . . . . 15State Farm S&P 500 Index Fund. . . . . . . . . . . . . . . 20State Farm Small Cap Index Fund. . . . . . . . . . . . . . 24State Farm International Index Fund . . . . . . . . . . . . 28State Farm Equity and Bond Fund. . . . . . . . . . . . . . 32State Farm Bond Fund . . . . . . . . . . . . . . . . . . . . . . 39State Farm Tax Advantaged Bond Fund . . . . . . . . . . 43State Farm Money Market Fund . . . . . . . . . . . . . . . 48State Farm LifePath Funds . . . . . . . . . . . . . . . . . . . 49
Expense Example (unaudited) . . . . . . . . . . . . . . . . . . 69Schedule of Investments
State Farm Equity Fund . . . . . . . . . . . . . . . . . . . . . 78State Farm Small/Mid Cap Equity Fund . . . . . . . . . . 80State Farm International Equity Fund . . . . . . . . . . . 82State Farm S&P 500 Index Fund. . . . . . . . . . . . . . . 85State Farm Small Cap Index Fund. . . . . . . . . . . . . . 91State Farm International Index Fund . . . . . . . . . . . . 110State Farm Equity and Bond Fund. . . . . . . . . . . . . . 121State Farm Bond Fund . . . . . . . . . . . . . . . . . . . . . . 122State Farm Tax Advantaged Bond Fund . . . . . . . . . . 134State Farm Money Market Fund . . . . . . . . . . . . . . . 147State Farm LifePath Retirement Fund . . . . . . . . . . . 148State Farm LifePath 2020 Fund . . . . . . . . . . . . . . . 149State Farm LifePath 2030 Fund . . . . . . . . . . . . . . . 150State Farm LifePath 2040 Fund . . . . . . . . . . . . . . . 151State Farm LifePath 2050 Fund . . . . . . . . . . . . . . . 152
Financial StatementsStatements of Assets and Liabilities . . . . . . . . . . . . 154Statements of Operations . . . . . . . . . . . . . . . . . . . 158Statements of Changes in Net Assets . . . . . . . . . . . 160Notes to Financial Statements . . . . . . . . . . . . . . . . 166
Financial Highlights . . . . . . . . . . . . . . . . . . . . . . . . . . 194Report of Independent Registered Public
Accounting Firm . . . . . . . . . . . . . . . . . . . . . . . . 224Federal Income Tax Information (unaudited) . . . . . . . 225Management Information (unaudited) . . . . . . . . . . . . 226
Investment return and principal value will fluctuate and Fund shares, when redeemed, may be worth more or less than theiroriginal cost. Recent performance may be less than the figures shown in this report. Obtain total returns for the Funds currentto the most recent month-end at statefarm.com in the Mutual Funds section under Finances or by calling 1-800-447-4930.
Before investing, consider the Funds’ investment objectives, risks, charges and expenses. Contact State Farm VPManagement Corp. (1-800-447-4930) for a prospectus or summary prospectus containing this and other information. Read itcarefully.Investing involves risk, including potential for loss.
A description of the policies and procedures that the Funds use to determine how to vote proxies relating to portfolio securities, andinformation regarding how the Funds voted proxies relating to portfolio securities during the most recent 12 month period ended June30, are available without charge upon request at 1-800-447-4930 and at sec.gov.
The Funds file complete schedules of portfolio holdings for each Fund with the Securities and Exchange Commission (the“Commission”) for the first and third quarters of each fiscal year on Form N-Q. The Funds’ Forms N-Q are available on theCommission’s website at sec.gov. The Funds’ Forms N-Q may be reviewed and copied at the Commission’s Public Reference Room inWashington, D.C., and information on the operation of the Public Reference Room may be obtained by calling 1-800-SEC-0330. TheFunds make the information on Form N-Q available to shareholders upon request without charge at 1-800-447-4930.
Any website referenced in this report is an inactive textual reference only, and information contained in or otherwise accessible throughthat website does not form a part of, and is not incorporated by reference into, this report.
Table of Contents

The Funds may send one copy of each annual report, semi-annual report, prospectus, and proxy statement to an address shared bymore than one shareholder, a practice commonly referred to as “householding” delivery of these documents. If the Fund documentsyou receive are being householded but you would like to receive individual copies of these documents, contact us to request individualdelivery by writing to State Farm Investment Management Corp., P.O. Box 219548, Kansas City, Missouri 64121-9548 or by calling usat 1-800-447-4930. We will begin sending individual copies within 30 days after we receive notice that you have revoked yourconsent.
State Farm LifePath Funds are target-date portfolios that provide a diversified exposure to equities, fixed income, and/or cash for thoseinvestors who have a specific date in mind (in this case years 2020, 2030, 2040, or 2050) for retirement or another goal. The targetdate is the approximate date when investors plan to start withdrawing assets. The investment objectives of each LifePath Fund areadjusted over time to become more conservative as the target date approaches. The principal value of the LifePath Fund(s) is notguaranteed at any time, including at the target date.
Automatic Investment Plan (AIP)1
State Farm Mutual Funds allow you to make regular investments in a Fund with an Automatic Investment Plan through an electronictransfer of funds from your bank/credit union account. If you wish to begin an Automatic Investment Plan, the minimum amountrequired for initial investment is $1,000 per Fund and subsequent investments is $50. Please consider signing up today for AIP bycalling 1-800-447-4930 for assistance.
Electronic DeliveryAs a State Farm Mutual Funds shareholder, we wish to remind you that you can elect to have future Annual Reports, Semi-AnnualReports, Prospectuses, statements, and tax forms delivered electronically rather than receiving large, bulky paper reports through themail. This is a great way to help reduce internal fund costs related to printing and mailing these materials as well as a way to beenvironmentally friendly. Please consider signing up for electronic delivery today by going on statefarm.com or by calling 1-800-447-4930 for assistance.
Service is only a phone call away
Fund prices are available to you 24 hours a day, 7 days a week.
Representatives are available 8 a.m.–6 p.m. Central Time Monday through Friday (except holidays)
1-800-447-4930Visit our website at statefarm.com
State Farm VP Management Corp.(Underwriter and Distributor of Securities Products)One State Farm PlazaBloomington, Illinois 61710-00011-800-447-4930
1 Automatic investment plans do not assure a profit or protect against loss.

Message to Shareholders of State Farm Mutual Fund TrustDear Shareholders,
Thank you for investing with State Farm Mutual Funds®. Enclosed is the Annual Report for the 12-month period ended December 31,2017, for the State Farm Mutual Fund Trust (“the Trust”). We encourage your review and consideration of this entire report.
State Farm Investment Management Corp. has consistently maintained a long-term, disciplined approach to managing investment riskand providing competitive investment products that can help you, our valued shareholder, with your investment goals.1 We believeindividuals increase their chance for investment success by remaining focused on their long-term goals and maintaining an appropriateasset allocation mix.2
Market ReviewDuring 2017, U.S. equity and fixed income markets generated positive total returns, while international equities produced even strongerresults that were helped, in part, by a weakened U.S. dollar.
Large cap U.S. stocks (as represented by the S&P 500® Index3)achieved a 21.83% total return for the period, as a 2.41% dividendyield added to a price gain of 19.42%. Mid-cap stocks (asrepresented by the Russell Midcap Index4) and small cap stocks(as represented by the Russell 2000® Index5) delivered totalreturns of 18.52% and 14.65%, respectively.
Synchronized growth across many of the world’s economieshelped drive a resurgence in earnings for multinationalcompanies, lifting business and investor confidence levels duringthe year. Other factors lending support to U.S. equity markets
Major Market Indices1-year Total Returnas of 12/31/2017
S&P 500 Index 21.83%
Russell MidCap Index 18.52%
Russell 2000 Index 14.65%
MSCI EAFE Free Index 25.03%
MSCI All Country World Index ex-U.S. Index 27.19%
MSCI Emerging Markets Index 37.28%
Bloomberg Barclays U.S. Aggregate Bond Index 3.54%
Bloomberg Barclays Municipal Bond Index 5.45%
included continuing trends of generally subdued inflation, accommodative global central bank policy, positive employment data, andincreases in U.S. Gross Domestic Product, including more than 3% growth in both the second (April – June) and third (July – September)quarters. In addition, early in 2017, the potential pro-growth policy impacts anticipated from the Trump administration helped supportequity gains, while expected changes to U.S. tax law helped stocks rally toward period end. As the U.S. Congress worked on reforming theindividual and corporate tax codes – eventually passing a bill in late December – investors considered the possible effects to companies’earnings as a result of lower tax rates.
The period was not without its challenges, though, as U.S. political and economic concerns, geopolitical tensions, and natural disastersarose as market headwinds during the year. In March and again in September, Congress failed to pass a health care plan to replace theAffordable Care Act, raising questions with respect to the new administration’s ability to achieve its other pro-growth policy goals. Pockets
1 Investing involves risk, including potential for loss.2 Asset allocation cannot guarantee a profit or protect against a loss in a declining market.3 Source: Standard & Poor’s. The S&P 500 Index is a capitalization-weighted measure of common stocks of 500 large U.S. companies. It is not possible to invest
directly in an index. Past performance does not guarantee future results.4 Source: Bloomberg. The Russell Midcap Index measures the performance of the mid-cap segment of the U.S. equity universe. The Russell Midcap is a subset of the
Russell 1000 Index. It includes approximately 800 of the smallest securities of the Russell 1000 Index based on a combination of their market cap and current indexmembership. The Russell Midcap represents approximately 31% of the total market capitalization of the Russell 1000 companies. It is not possible to invest directly inan index. Past performance does not guarantee future results.
5 Source: Bloomberg. The Russell 2000 Index measures the performance of the small-cap segment of the U.S. equity universe. The Russell 2000 is a subset of theRussell 3000 Index representing approximately 8% of the total market capitalization of that index. It includes approximately 2000 of the smallest securities of theRussell 3000 Index based on a combination of their market cap and current index membership. The stocks of small companies are more volatile than the stocks oflarger, more established companies. It is not possible to invest directly in an index. Past performance does not guarantee future results.
1

of anxiety regarding the health of the U.S. economy also briefly appeared, as did a sense of increased geopolitical uncertainty that wasdue, in part, to an escalation in provocative rhetoric and actions involving the North Korean government. In addition, in August andSeptember, two hurricanes – Harvey and Irma – made landfall in the U.S., temporarily disrupting activity throughout the economy. Despitethese events, however, market volatility stayed relatively low for most of the period, with market price declines, in particular, being lesssustained and severe than in recent years’ past, as investors remained focused on news conveying strong economic and business growthboth in the U.S. and abroad.
Starting the year at a period low of 2,238, the S&P 500 Index staged a series of uneven climbs through the first seven months of the yearbefore achieving more consistent gains starting in late summer. During the period, U.S. equities entered the ninth year of their current bullmarket run, while the S&P 500 Index set over 60 closing price highs – including a new record of 2,690 on December 18th – beforefinishing the year at 2,673. In addition, the S&P 500 Index marked another record in 2017, for the first time in its history notching gains ineach of the year’s 12 months. Within the broad U.S. equities market rally, growth generally outperformed value. The S&P 500 Growth Indexreturned 27.44% versus 15.36% from the S&P 500 Value Index due, in part, to the market’s view that growth-oriented companies weregenerally better positioned to benefit from the expanding economy relative to their value-oriented peers.6
International equity markets, as represented by the MSCI All Country World Index (ACWI) ex-U.S. Index, the MSCI EAFE Free® Index, andMSCI Emerging Markets Index, returned 27.19%, 25.03% and 37.28%, respectively, as a weakened U.S. dollar helped increase already-strong foreign market returns.7 Developed market country Austria paced international growth in 2017, rising 58.31%, while Poland ledemerging market countries with a 54.72% return. Among developed nations, Israel lagged for the second consecutive year as the weakestperforming market, ending with a 2.06% return, while Pakistan posted a –24.44% return to finish as the worst-performing emergingmarket in 2017.8
Within bond markets, price increases added to coupon income to help generate positive fixed income returns. Among major indices, theBloomberg Barclays U.S. Aggregate Bond Index recorded a total return of 3.54%, while the Bloomberg Barclays Municipal Bond Indexexperienced a 5.45% gain for the 1-year period.9 Meanwhile, the U.S. Treasury yield curve flattened over the course of the year asshorter-term (3-month and 2-year) yields rose considerably and long-term (10-year) yields ended lower. As shown in the chart below,beginning the period at 0.51%, 3-month U.S. Treasury yields remained relatively stable through February, ranging between 0.50% and0.55%. Those yields increased almost 0.20% within the first week of March alone, however, when better-than-expected economic newsraised investors’ expectations for more Federal Reserve (the “Fed”) rate hikes in 2017. As the Fed further tightened its monetary policy –-executing its first (March) and second (June) rate increases during the period, beginning to normalize its balance sheet in October, andimplementing its third rate increase in December — yields on 3-month Treasuries navigated a gradual ascent through year end. Three-month yields reached a period high of 1.47% in late December before finishing December at 1.39%. Following a somewhat similar pathduring 2017, 2-year Treasury yields began January at 1.20%, increased in early March, and subsequently traded between 1.18% - 1.40%through late summer. Two-year yields then steadily rose through year end, reaching a period high of 1.92% in late December beforeeventually settling at 1.89%.
While positive economic news and the Fed’s activities helped drive the increase in 3-month Treasury yields, a continuation of soft inflationand robust market demand weighed on long-term yields. Beginning January 2017 at 2.45%, 10-year Treasury yields reached a periodhigh of 2.62% in early March before subsequently tracking generally downward through early September, reaching a low of 2.05% beforerebounding through year end to close at 2.40%. While most economic data promoted higher long-term yields — and the Fed’s effort to
6 The S&P 500 Growth Index is a capitalization-weighted measure of growth-oriented stocks within the S&P 500 Index. It includes those S&P 500 Index companies withhigher price-to-book ratios and higher expected growth values. The S&P 500 Value Index is a capitalization-weighted measure of value-oriented stocks within the S&P500 Index. It includes those S&P 500 Index companies with lower price-to-book ratios and lower expected growth values. It is not possible to invest directly in anindex. Past performance does not guarantee future results.
7 Source: Bloomberg. The MSCI Europe, Australasia and Far East Free (EAFE Free) Index currently measures the performance of stock markets of Europe, Australia,New Zealand, and the Far East. The MSCI All Country World Index (ex-U.S.) (MSCI ACWI ex-U.S. Index) is a free float adjusted market capitalization index that isdesigned to measure equity market performance in global developed and emerging markets, excluding the United States. As of December 31, 2017, the MSCI ACWIex-U.S. Index consisted of 46 developed and emerging market country indices. The MSCI Emerging Markets Index is a float-adjusted market capitalization indexdesigned to measure equity market performance in global emerging markets. Foreign securities involve risks not normally associated with investing in the U.S.including, but not limited to, higher trading and custody costs, less stringent accounting, legal and reporting practices, potential for political and economic instability, andthe fluctuation and potential regulation of currency exchange and exchange rates, all of which are magnified in emerging markets. It is not possible to invest directly inan index. Past performance does not guarantee future results.
8 Returns are reported in U.S. dollar terms for the MSCI EAFE Free Index, MSCI ACWI ex-US Index, and MSCI Emerging Markets Index.9 Source: Bloomberg. The Bloomberg Barclays U.S. Aggregate Bond Index represents debt securities in the U.S. investment grade fixed rate taxable bond market,
including government and corporate debt securities, mortgage pass-through debt securities and asset-backed debt securities with maturities greater than one year. TheBloomberg Barclays Municipal Bond Index is representative of the tax-exempt bond market and is made up of investment grade municipal bonds issued after 12/31/90having a remaining maturity of at least one year. Bonds have historically been less volatile than stocks, but are sensitive to changes in interest rates. It is not possibleto invest directly in an index. Past performance does not guarantee future results.
Message to Shareholders of State Farm Mutual Fund Trust (continued)
2

normalize its balance sheet provided similar support — that upward pressure was moderated by a low inflationary environment thatpersisted throughout the period. In addition, long-term yields were weakened by investors’ continued strong demand. While someunwinding of quantitative easing measures began during the year, foreign central banks generally continued to maintain their respectivemonetary stimulus programs. As a result, global bond yields remained low, compelling fixed income investors to seek out the relativelyhigher returns found in U.S. Treasuries, thereby exerting downward pressure on their yields.10
Legend and Yield as of December 31, 2017
10-year U.S. Treasury Yield 2.40%
3-month U.S. Treasury Yield 1.39%
2-year U.S. Treasury Yield 1.89%
0.00%
0.50%
1.00%
1.50%
2.00%
2.50%
3.00%
12/3
1/20
16
1/31
/201
7
5/31
/201
7
3/31
/201
7
9/30
/201
7
7/31
/201
7
12/3
1/20
17
11/3
0/20
17
4/30
/201
7
2/28
/201
7
8/31
/201
7
6/30
/201
7
10/3
1/20
17
Source: The U.S. Department of the Treasury (treasury.gov)
Despite the positive total returns for most bond-oriented indices, it is important to remember the risk that is present when investing, evenin bond funds. Investing involves risk, including a potential for loss.
On behalf of the entire State Farm Mutual Funds team, thank you for your continued business and allowing us to serve your investmentneeds.
Sincerely,
Joe R. Monk Jr.Senior Vice PresidentState Farm Investment Management Corp.
10 Source: The U.S. Department of the Treasury. A 3-month U.S. Treasury Bill is a debt obligation issued by the U.S. Treasury that has a term of 92 days or less. A2-year U.S. Treasury Note and a 10-year U.S. Treasury Note are debt obligations issued by the U.S. Treasury with maturities of 2 and 10 years, respectively, and thatpay interest every six months. U.S. Treasury securities are backed by the full faith and credit of the U.S. government and are guaranteed only as to the promptpayment of principal and interest, and are subject to market risks if sold prior to maturity. Bonds have historically been less volatile than stocks, but are sensitive tochanges in interest rates. Past performance does not guarantee future results.
Message to Shareholders of State Farm Mutual Fund Trust (continued)
3

State Farm Equity Fund Management’s Discussion of Fund Performance (unaudited)
OverviewDescribe the Fund’s investment objective and philosophy.
The State Farm Equity Fund (the “Fund”) is sub-advised by Bridgeway Capital Management, Inc. (“Bridgeway”) and WestwoodManagement Corp. (“Westwood”). Bridgeway and Westwood each manage approximately one-half of the Fund’s assets. StateFarm Investment Management Corp. monitors the performance of the sub-advisers and the split of the Fund’s portfolio betweenthe sub-advisers. The benchmark for the Fund is the S&P 500 Index (the “Index”).
The Fund seeks long-term growth of capital. In doing so, the Fund invests primarily in stocks of U.S. companies with largecapitalizations. Bridgeway defines “large stocks” as the largest 1,000 U.S. companies as measured by market capitalization (stockmarket worth). Westwood defines large capitalization companies as those companies with market capitalizations generally greaterthan $5 billion at the time of purchase.
Bridgeway selects stocks using its proprietary, quantitative investment models to identify stocks within the large-cap growthcategory for the Fund. Growth stocks are those that Bridgeway believes have above average prospects for economic growth.Westwood invests in a portfolio of seasoned companies utilizing a value style of investing in which it chooses those stocks thatWestwood believes have earnings prospects that are currently undervalued by the market relative to some financial measure ofworth such as the ratio of price to earnings, price to sales or price to cash flow. Westwood defines seasoned companies as thosethat generally have been operating for at least three years.
Describe the relevant market environment as it related to the Fund for the reporting period.Synchronized growth across many of the world’s economies helped drive a resurgence in earnings for multinational companies,lifting business and investor confidence levels during the year. Other factors lending support to U.S. equity markets includedcontinuing trends of generally subdued inflation, accommodative global central bank policy, positive employment data, andincreases in U.S. Gross Domestic Product, including more than 3% growth in both the second (April – June) and third (July –September) quarters. In addition, early in 2017, the potential pro-growth policy impacts anticipated from the Trump administrationhelped support equity gains, while expected changes to U.S. tax law helped stocks rally toward period end. As the U.S. Congressworked on reforming the individual and corporate tax codes – eventually passing a bill in late December – investors considered thepossible effects to companies’ earnings as a result of lower tax rates.
The period was not without its challenges, though, as U.S. political and economic concerns, geopolitical tensions, and naturaldisasters arose as market headwinds during the year. In March and again in September, Congress failed to pass a health care planto replace the Affordable Care Act, raising questions with respect to the new administration’s ability to achieve its other pro-growthpolicy goals. Pockets of anxiety regarding the health of the U.S. economy also briefly appeared, as did a sense of increasedgeopolitical uncertainty that was due, in part, to an escalation in provocative rhetoric and actions involving the North Koreangovernment. In addition, in August and September, two hurricanes – Harvey and Irma – made landfall in the U.S., temporarilydisrupting activity throughout the economy. Despite these events, however, market volatility stayed relatively low for most of theperiod, with market price declines, in particular, being less sustained and severe than in recent years’ past, as investors remainedfocused on news conveying strong economic and business growth both in the U.S. and abroad.
Starting the year at a period low of 2,238, the S&P 500 Index staged a series of uneven climbs through the first seven months ofthe year before achieving more consistent gains starting in late summer. During the period, U.S. equities entered the ninth year oftheir current bull market run, while the Index set over 60 closing price highs – including a new record of 2,690 on December 18th– before finishing the year at 2,673. In addition, the Index marked another record in 2017, for the first time in its history notchinggains in each of the year’s 12 months.
The 12-month total return for the Index was 21.83%. The total return for the period reflected an increase in corporate earnings pershare for the S&P 500 Index companies of approximately 17.0%, an expansion of the price/earnings valuation of the Index ofapproximately 3.0%, and a dividend return of approximately 1.8%. Within the broad U.S. equities market rally, growth generallyoutperformed value. The S&P 500 Growth Index returned 27.44% versus 15.36% from the S&P 500 Value Index due, in part, to themarket’s view that growth-oriented companies were generally better positioned to benefit from the expanding economy relative totheir value-oriented peers.
In currency markets, the U.S. dollar decreased by approximately 12%, 9% and 4% versus the euro, British pound and Japaneseyen, respectively, as the period’s global economic growth helped bolster foreign currencies relative to the dollar. Meanwhile, thatweaker dollar and synchronized global growth supported a general increase in commodity prices. Oil began 2017 at around $54per barrel and ranged between approximately $42 to $60/barrel, where it settled at year end for a period increase of approximately12%. Beginning the year at $1,150 per troy ounce, gold traded between approximately $1,147 and $1,356/oz. before endingDecember 2017 at around $1,306/oz., an increase of approximately 14%.
4
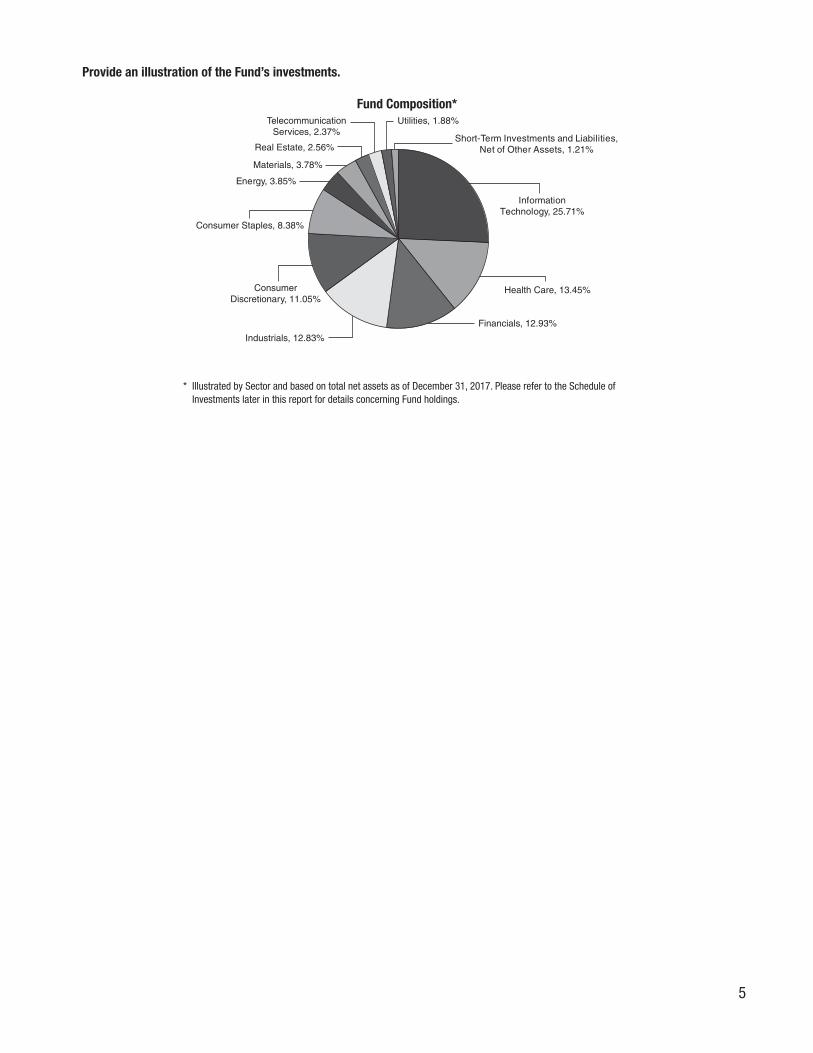
Provide an illustration of the Fund’s investments.
Fund Composition*
Health Care, 13.45%
Utilities, 1.88%
InformationTechnology, 25.71%
Financials, 12.93%
Industrials, 12.83%
ConsumerDiscretionary, 11.05%
Consumer Staples, 8.38%
Energy, 3.85%
Real Estate, 2.56%
Materials, 3.78%
TelecommunicationServices, 2.37%
Short-Term Investments and Liabilities,Net of Other Assets, 1.21%
* Illustrated by Sector and based on total net assets as of December 31, 2017. Please refer to the Schedule ofInvestments later in this report for details concerning Fund holdings.
5

How did the Fund perform during the reporting period?For the year, Class A shares of the State Farm Equity Fund recorded a total return of 23.88% without sales charges, compared to a21.83% total return for the S&P 500 Index. The line graph and table below provide additional perspective on the Fund’s long termresults.
Comparison of change in value of $10,000 investmentfor the years ended December 31, including applicable sales charges
THOUSANDS
$0
$5
2007 2008 2009 2010 2011 2012 2013 2014 2015 20172016
$10
$25
$20
$15
Legend and Value as of December 31, 2017
Equity Fund – Class A $17,870 S&P 500 Index1 $22,603
Fund’s Average Annual Total Return and Value as of December 31, 2017
1 YEAR 5 YEAR 10 YEAR
Ending Value ofa $10,000
Investment**
Class A 17.67% 14.29% 5.98% $17,870
Class B - conversion to Class A* 18.72% 14.52% 6.02% $17,940
Class B - conversion to Premier* 18.72% 14.52% 6.03% $17,957
Premier (previously Legacy Class A) 17.78% 14.28% 5.99% $17,895
Legacy Class B - conversion to Class A* 20.74% 14.80% 6.22% $18,287
Legacy Class B - conversion to Premier* 20.74% 14.80% 6.23% $10,306
Institutional 23.94% 15.66% 6.77% $19,251
Class R-1 23.77% 15.11% 6.21% $18,260
Class R-2 23.75% 15.30% 6.39% $18,578
Class R-3 23.92% 15.58% 6.69% $19,113
* Class B and Legacy Class B shares convert to Class A shares after 8 full years, unless the total value of a shareholder’s account(s) is$100,000 or more, then these shares convert to Premier shares. 10 YEAR returns and values reflect the applicable conversion.
** For a 10 YEAR period.
The performance data quoted represents past performance and does not guarantee future results. Class A and Premiershares values and Class A shares performance on the line graph reflect a maximum sales charge of 5% at initial investment.Performance for the Fund’s other classes may be greater than or less than the line shown for Class A shares because ofdiffering loads and expenses between the share classes. Returns in the table above reflect maximum sales charges of: 5% forall Class A and Premier shares and for Class B shares at one year; 3% for Legacy Class B shares at one year; and 2% forClass B and Legacy Class B shares at five years. These figures do not reflect the deduction of taxes that a shareholder wouldpay on Fund distributions or the redemption of Fund shares.
1 The S&P 500 Index represents an unmanaged group of stocks, tracking the common stock performance of 500 large U.S. companies in the manufacturing, utilities,transportation, and financial industries. Unlike an investment in the Equity Fund, a theoretical investment in the Index does not reflect any expenses. It is notpossible to invest directly in an index.
6

Performance AnalysisWhat factors helped and hindered performance during the reporting period?
During the 1-year period ended December 31, 2017, for their respective portions of the Fund, Bridgeway and Westwood generatedtotal returns of 28.19% and 21.84%, respectively. Below are discussions concerning the individual investments made byBridgeway and Westwood during the course of the reporting period.
Bridgeway Capital Management, Inc. (51.23% of the Fund’s total investments)The tables below show the securities that were the leading contributors and detractors to Bridgeway’s performance during theyear, as well as a recap of the top 10 holdings within Bridgeway’s portion of the Fund.
The following five holdings represented the largest contributors to Bridgeway’s performance during the year, with Align Technologyposting a triple-digit return while the remaining holdings generated double-digit gains.
Bridgeway - Top 5 Contributors
Security Sector
% of Bridgeway’sTotal Investmentsas of 12/31/2017
NVIDIA Corp. Information Technology 2.2%
Align Technology Inc. Health Care 2.3%
Amazon.com Inc. Consumer Discretionary 1.6%
Lam Research Corp. Information Technology 2.1%
United Rentals Inc. Industrials 1.9%
The largest detractors to Bridgeway’s performance were the following five holdings, with each returning a double-digit loss duringthe period.
Bridgeway - Top 5 Detractors
Security Sector
% of Bridgeway’sTotal Investmentsas of 12/31/2017
AutoZone Inc.* Consumer Discretionary sold
Viacom Inc. Class B Consumer Discretionary 0.6%
Akamai Technologies Inc.* Information Technology sold
Ulta Beauty Inc. Consumer Discretionary 1.5%
QUALCOMM Inc.* Information Technology sold
*Sold prior to 12/31/2017. Total return loss referenced is from 1/1/2017 to date sold.
Align Technology, the largest holding within Bridgeway’s portion of the Fund, posted a triple-digit total return for the period. Amongthe remaining top 10 holdings, all nine delivered double-digit gains.
Bridgeway - Top 10 Holdings
Security Sector
% of Bridgeway’sTotal Investmentsas of 12/31/2017
Align Technology Inc. Health Care 2.3%
NVIDIA Corp. Information Technology 2.2%
Lam Research Corp. Information Technology 2.1%
Micron Technology Inc. Information Technology 2.0%
United Rentals Inc. Industrials 1.9%
Applied Materials Inc. Information Technology 1.9%
Cadence Design Systems Inc. Information Technology 1.8%
Apple Inc. Information Technology 1.8%
Boeing Co., The Industrials 1.8%
Texas Instruments Inc. Information Technology 1.7%
7

Westwood Management Corp. (48.77% of the Fund’s total investments)The tables below show the securities that were the leading contributors and detractors to Westwood’s performance during theyear, as well as a recap of the top 10 holdings within Westwood’s portion of the Fund.
The largest contributors to Westwood’s performance during the year were the following five holdings, with each posting double-digit gains during the period.
Westwood - Top 5 Contributors
Security Sector
% of Westwood’sTotal Investmentsas of 12/31/2017
Boeing Co., The Industrials 2.0%
Bank of America Corp. Financials 3.9%
Abbott Laboratories Health Care 2.2%
Cigna Corp. Health Care 1.9%
Sherwin-Williams Co., The Materials 1.8%
The following five holdings represented the largest detractors to Westwood’s performance during the year, with Halliburton postinga double-digit loss and the remaining holdings delivering single-digit losses.
Westwood - Top 5 Detractors
Security Sector
% of Westwood’sTotal Investmentsas of 12/31/2017
Halliburton Co. Energy 1.5%
AT&T Inc. Telecommunication Services 3.3%
Exxon Mobil Corp.* Energy sold
CVS Health Corp. Consumer Staples 1.5%
American International Group Inc.* Financials sold
*Sold prior to 12/31/2017. Total return loss referenced is from 1/1/2017 to date sold.
Eight of the top 10 largest holdings within Westwood’s portion of the Fund recorded double-digit gains for the period, while EOGResources posted a single-digit return and AT&T delivered a single-digit loss.
Westwood - Top 10 Holdings
Security Sector
% of Westwood’sTotal Investmentsas of 12/31/2017
Bank of America Corp. Financials 3.9%
JPMorgan Chase & Co. Financials 3.7%
Johnson & Johnson Health Care 3.5%
AT&T Inc. Telecommunication Services 3.3%
Becton, Dickinson and Co. Health Care 3.2%
Union Pacific Corp. Industrials 2.4%
Home Depot Inc., The Consumer Discretionary 2.3%
EOG Resources Inc. Energy 2.2%
Chevron Corp. Energy 2.2%
Abbott Laboratories Health Care 2.2%
Financial highlights for this Fund can be found on pages 194-195.
8

State Farm Small/Mid Cap Equity Fund Management’s Discussion of Fund Performance (unaudited)
OverviewDescribe the Fund’s investment objective and philosophy.
From the beginning of the period (January 1, 2017) through April 30, 2017, the State Farm Small/Mid Cap Equity Fund (the “Fund”)was sub-advised by Bridgeway Capital Management, Inc. (“Bridgeway”) and Rainier Investment Management, LLC (“Rainier”).During that period, Bridgeway and Rainier each managed approximately one-half of the Fund’s assets, and State Farm InvestmentManagement Corp. (“SFIMC”) monitored the performance of the sub-advisers and the split of the Fund’s portfolio between thesub-advisers.
As discussed in the Semi-Annual Report dated June 30, 2017, during the period SFIMC terminated Rainier as a sub-adviser to theFund. That termination became effective May 1, 2017, at which point Rainier ceased sub-advising on its one-half of the Fund’sassets and SFIMC began investing that one-half of the Fund’s portfolio in shares of the iShares Core S&P Mid-Cap ETF, anexchange traded fund advised by BlackRock Fund Advisors. The iShares Core S&P Mid-Cap EFT seeks to track the investmentresults of the S&P Mid-Cap 400 Index. The S&P Mid-Cap 400 Index measures the performance of the mid-capitalization sector ofthe U.S. equity market. From May 1, 2017, and through period end, SFIMC invested approximately one-half of the Fund’s assets inthe iShares Core S&P Mid-Cap ETF, while Bridgeway continued to manage approximately one-half of the Fund’s assets. SFIMCmonitors the performance of the iShares Core S&P Mid-Cap ETF and Bridgeway, as well as the split of the Fund’s portfolio betweenthe two.
The Fund seeks long-term growth of capital. In doing so, the Fund invests primarily in small- and mid-capitalization stocks issuedby U.S. companies. An allocation to small- and mid-cap stocks allows for investment exposure to some companies in the earlierstages of development relative to more mature, larger capitalization companies. Bridgeway primarily invests in stocks whosemarket capitalization (stock market value) falls within the range of the Russell 2000 Index, an unmanaged, market value weightedindex, which measures performance of the 2,000 companies that are between the 1,000th and 3,000th largest in the market withdividends reinvested. Bridgeway selects stocks using its proprietary, quantitative investment models to identify small- and mid-cap“value” stocks. Bridgeway defines a “value” stock as one that it believes is priced cheaply relative to some financial measures ofworth, such as the ratio of price to earnings, price to sales, or price to cash flow.
From the beginning of the period through April 30, 2017, Rainier primarily invested in U.S. companies with market capitalizationswithin the range of companies included in the Russell Midcap Index, a subset of approximately 800 of the smallest companiesincluded in the Russell 1000 Index, which measures the performance of the largest 1,000 companies in the market. In selectingcommon stock for purchase by the Fund, Rainier emphasized companies that it believed were likely to demonstrate superiorbusiness growth relative to their peers and whose equities were selling at attractive relative valuations.
The benchmark for the Fund is the Russell 2500 Index (the “Index”).
Describe the relevant market environment as it related to the Fund for the reporting period.Synchronized growth across many of the world’s economies helped drive a resurgence in earnings for multinational companies,lifting business and investor confidence levels during the year. Other factors lending support to U.S. equity markets includedcontinuing trends of generally subdued inflation, accommodative global central bank policy, positive employment data, andincreases in U.S. Gross Domestic Product, including more than 3% growth in both the second (April – June) and third (July –September) quarters. In addition, early in 2017, the potential pro-growth policy impacts anticipated from the Trump administrationhelped support equity gains — in particular lifting prices on small- and mid-cap stocks early in 2017 — while expected changesto U.S. tax law helped stocks rally toward period end. As the U.S. Congress worked on reforming the individual and corporate taxcodes – eventually passing a bill in late December – investors considered the possible effects to companies’ earnings as a resultof lower tax rates.
The period was not without its challenges, though, as U.S. political and economic concerns, geopolitical tensions, and naturaldisasters arose as market headwinds during the year. In March and again in September, Congress failed to pass a health care planto replace the Affordable Care Act, raising questions with respect to the new administration’s ability to achieve its other pro-growthpolicy goals. Pockets of anxiety regarding the health of the U.S. economy also briefly appeared, as did a sense of increasedgeopolitical uncertainty that was due, in part, to an escalation in provocative rhetoric and actions involving the North Koreangovernment. In addition, in August and September, two hurricanes – Harvey and Irma – made landfall in the U.S., temporarilydisrupting activity throughout the economy. Despite these events, however, market volatility stayed relatively low for most of theperiod, with market price declines, in particular, being less sustained and severe than in recent years’ past, as investors remainedfocused on news conveying strong economic and business growth both in the U.S. and abroad.
9

Within the broad U.S. equities market rally, growth generally outperformed value, while large-cap company returns generallybettered those provided by small- and mid-cap businesses. For the year ended December 31, 2017, the Russell 2500 GrowthIndex returned 24.46% versus 10.36% from the Russell 2500 Value Index due, in part, to the market’s view that growth-orientedcompanies were generally better positioned to benefit from the expanding economy relative to their value-oriented peers.1Similarly, supported by their greater exposure to the economic growth experienced around the world in 2017, large cap stocks (asrepresented by the Russell 1000 Index) generated a 21.69% total return, bettering the 16.81% return provided by the Index.Elsewhere, while the market rewarded the financial sector in general during the year, larger bank stocks generally performedbetter than those of their smaller peers. With Federal Reserve’s three interest rate hikes and the potential regulatory changesproposed by the Trump administration, investors forecasted more possible upside for larger financial institutions. In addition, withinthe energy sector, the stock performance of small-cap companies was especially challenged, as investors weighed multiple factorsincluding if the year’s rise in oil prices could be sustained.
In currency markets, the U.S. dollar decreased by approximately 12%, 9% and 4% versus the euro, British pound and Japaneseyen, respectively, as the period’s global economic growth helped bolster foreign currencies relative to the dollar. Meanwhile, thatweaker dollar and synchronized global growth supported a general increase in commodity prices. Oil began 2017 at around $54per barrel and ranged between approximately $42 to $60/barrel, where it settled at year end for a period increase of approximately12%. Beginning the year at $1,150 per troy ounce, gold traded between approximately $1,147 and $1,356/oz. before endingDecember 2017 at around $1,306/oz., an increase of approximately 14%.
Provide an illustration of the Fund’s investments.
Fund Composition*
Industrials, 7.69%
Information Technology, 5.42%
Financials, 12.23%
Energy, 3.49%
Consumer Discretionary, 8.03%
Health Care, 2.90%Real Estate, 2.82%
Materials, 1.60%Utilities, 1.55%
Telecommunication Services, 0.43%Short-Term Investments and Liabilities,Net of Other Assets, 0.63%
Mid-Cap Equity Exchange-Traded Fund, 51.88%
Consumer Staples, 1.33%
* Illustrated by Sector and Security Type and based on total net assets as of December 31, 2017. Please refer tothe Schedule of Investments later in this report for details concerning Fund holdings.
1 The Russell 2500 Growth Index measures the performance of the small to mid-cap growth segment of the U.S. equity universe. It includes those Russell 2500companies with higher price-to-book ratios and higher forecasted growth values. The Russell 2500 Value Index measures the performance of the small to mid-capvalue segment of the U.S. equity universe. It includes those Russell 2500 companies with lower price-to-book ratios and lower forecasted growth values.
10

How did the Fund perform during the reporting period?Class A shares of the State Farm Small/Mid Cap Equity Fund had a total return of 11.66% without sales charges for the 1-yearperiod ended December 31, 2017, compared to a total return of 16.81% for the Russell 2500 Index. The line graph and table belowprovide additional perspective on the Fund’s long term results.
Comparison of change in value of $10,000 investmentfor the years ended December 31, including applicable sales charges
THOUSANDS
$0
$5
2007 2008 2009 2010 2011 2012 2013 2014 2015 20172016
$10
$30
$25
$20
$15
Legend and Value as of December 31, 2017
Small/Mid Cap Equity Fund – Class A $15,369 Russell 2500 Index1 $24,164
Fund’s Average Annual Total Return and Value as of December 31, 2017
1 YEAR 5 YEAR 10 YEAR
Ending Value ofa $10,000
Investment**
Class A 6.11% 9.64% 4.39% $15,369
Class B - conversion to Class A* 6.45% 9.92% 4.47% $15,486
Class B - conversion to Premier* 6.45% 9.92% 4.49% $15,509
Premier (previously Legacy Class A) 6.11% 9.66% 4.41% $15,403
Legacy Class B - conversion to Class A* 8.45% 10.11% 4.63% $15,723
Legacy Class B - conversion to Premier* 8.45% 10.11% 4.64% $15,746
Institutional 11.71% 11.02% 5.18% $16,571
Class R-1 11.46% 10.46% 4.62% $15,702
Class R-2 11.54% 10.63% 4.80% $15,986
Class R-3 11.57% 10.93% 5.10% $16,442
* Class B and Legacy Class B shares convert to Class A shares after 8 full years, unless the total value of a shareholder’s account(s) is$100,000 or more, then these shares convert to Premier shares. 10 YEAR returns and values reflect the applicable conversion.
** For a 10 YEAR period.The performance data quoted represents past performance and does not guarantee future results. Class A and Premiershares values and Class A shares performance on the line graph reflect a maximum sales charge of 5% at initial investment.Performance for the Fund’s other classes may be greater than or less than the line shown for Class A shares because ofdiffering loads and expenses between the share classes. Returns in the table above reflect maximum sales charges of: 5% forall Class A and Premier shares and for Class B shares at one year; 3% for Legacy Class B shares at one year; and 2% forClass B and Legacy Class B shares at five years. These figures do not reflect the deduction of taxes that a shareholder wouldpay on Fund distributions or the redemption of Fund shares.
1 The Russell 2500 Index measures the performance of the 2,500 smallest securities in the Russell 3000 Index, which represents approximately 20% of the totalmarket capitalization of the Russell 3000 Index. Unlike an investment in the Small/Mid Cap Equity Fund, a theoretical investment in the Index does not reflect anyexpenses. It is not possible to invest directly in an index.
11
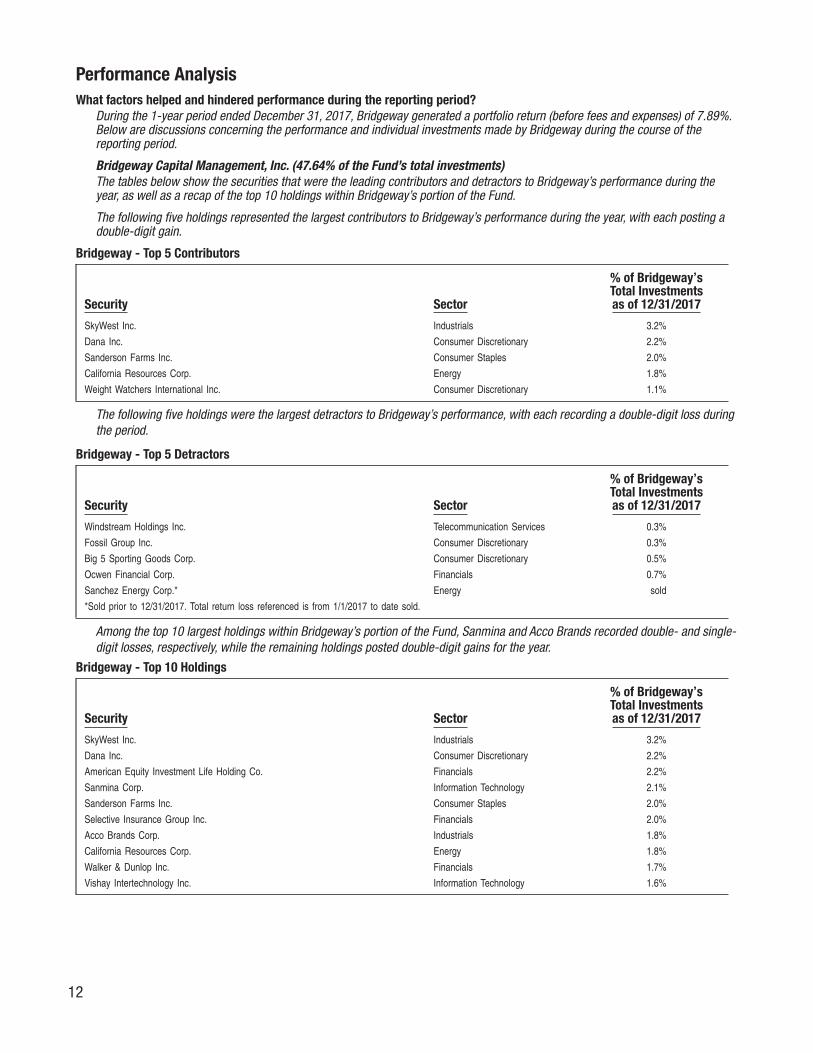
Performance AnalysisWhat factors helped and hindered performance during the reporting period?
During the 1-year period ended December 31, 2017, Bridgeway generated a portfolio return (before fees and expenses) of 7.89%.Below are discussions concerning the performance and individual investments made by Bridgeway during the course of thereporting period.
Bridgeway Capital Management, Inc. (47.64% of the Fund’s total investments)The tables below show the securities that were the leading contributors and detractors to Bridgeway’s performance during theyear, as well as a recap of the top 10 holdings within Bridgeway’s portion of the Fund.
The following five holdings represented the largest contributors to Bridgeway’s performance during the year, with each posting adouble-digit gain.
Bridgeway - Top 5 Contributors
Security Sector
% of Bridgeway’sTotal Investmentsas of 12/31/2017
SkyWest Inc. Industrials 3.2%
Dana Inc. Consumer Discretionary 2.2%
Sanderson Farms Inc. Consumer Staples 2.0%
California Resources Corp. Energy 1.8%
Weight Watchers International Inc. Consumer Discretionary 1.1%
The following five holdings were the largest detractors to Bridgeway’s performance, with each recording a double-digit loss duringthe period.
Bridgeway - Top 5 Detractors
Security Sector
% of Bridgeway’sTotal Investmentsas of 12/31/2017
Windstream Holdings Inc. Telecommunication Services 0.3%
Fossil Group Inc. Consumer Discretionary 0.3%
Big 5 Sporting Goods Corp. Consumer Discretionary 0.5%
Ocwen Financial Corp. Financials 0.7%
Sanchez Energy Corp.* Energy sold
*Sold prior to 12/31/2017. Total return loss referenced is from 1/1/2017 to date sold.
Among the top 10 largest holdings within Bridgeway’s portion of the Fund, Sanmina and Acco Brands recorded double- and single-digit losses, respectively, while the remaining holdings posted double-digit gains for the year.
Bridgeway - Top 10 Holdings
Security Sector
% of Bridgeway’sTotal Investmentsas of 12/31/2017
SkyWest Inc. Industrials 3.2%
Dana Inc. Consumer Discretionary 2.2%
American Equity Investment Life Holding Co. Financials 2.2%
Sanmina Corp. Information Technology 2.1%
Sanderson Farms Inc. Consumer Staples 2.0%
Selective Insurance Group Inc. Financials 2.0%
Acco Brands Corp. Industrials 1.8%
California Resources Corp. Energy 1.8%
Walker & Dunlop Inc. Financials 1.7%
Vishay Intertechnology Inc. Information Technology 1.6%
12

From the beginning of the period through April 30, 2017, Rainier generated a portfolio return (before fees and expenses) of 6.90%.Below are discussions concerning the performance and individual investments made by Rainier during the course of that 4-monthperiod.
Rainier Investment Management, LLC (49.71% of the Fund’s total investments as of April 30, 2017)The tables below show the securities that were the leading contributors and detractors to Rainier’s performance from thebeginning of the period through April 30, 2017, as well as a recap of the top 10 holdings within Rainier’s portion of the Fund.
The following five holdings represented the largest contributors to Rainier’s performance, with each posting double-digit gainsfrom the beginning of the period through April 30, 2017.
Rainier - Top 5 Contributors
Security Sector
% of Rainier’sTotal Investmentsas of 04/30/2017
CoStar Group Inc. Information Technology 2.1%
Teleflex Inc. Health Care 2.0%
Equinix Inc. Real Estate 2.5%
Sherwin-Williams Co., The Materials 1.6%
Lam Research Corp. Information Technology 1.4%
The following five holdings were the largest detractors to Rainier’s performance, with each providing double-digit losses from thebeginning of the period through April 30, 2017.
Rainier - Top 5 Detractors
Security Sector
% of Rainier’sTotal Investmentsas of 04/30/2017
Brixmor Property Group Inc. Real Estate 1.4%
Acuity Brands Inc. Industrials 0.5%
Devon Energy Corp. Energy 1.2%
Newfield Exploration Co. Energy 1.0%
Perrigo Co. PLC Health Care 1.4%
Among the top 10 largest holdings within Rainier’s portion of the Fund, from the beginning of the period through April 30, 2017,Equinix, CoStar, Teleflex and Mohawk Industries recorded double-digit total returns, Western Alliance posted a single-digit loss, andthe remaining holdings generated single-digit gains.
Rainier - Top 10 Holdings
Security Sector
% of Rainier’sTotal Investmentsas of 04/30/2017
Equinix Inc. Real Estate 2.5%
A.O. Smith Corp. Industrials 2.3%
CoStar Group Inc. Information Technology 2.1%
Middleby Corp., The Industrials 2.0%
Teleflex Inc. Health Care 2.0%
Western Alliance Bancorp Financials 1.9%
Oshkosh Truck Corp. Industrials 1.8%
NuVasive Inc. Health Care 1.8%
Pinnacle Foods Inc. Consumer Staples 1.7%
Mohawk Industries Inc. Consumer Discretionary 1.7%
13

The Fund’s investment in iShares Core S&P Mid-Cap ETF (52.36% of the Fund’s total investments as of December 31, 2017)Beginning May 1, 2017, and continuing through period end, the Fund’s investment in the iShares Core S&P Mid-Cap ETF generated aportfolio return of 10.62%.
Beginning May 1, 2017, and continuing through period end, within the S&P Mid-Cap 400 Index all sector performance was positiveexcept for Telecommunication Services and Energy, as illustrated below.
S&P Mid-Cap 400 Index Sector Performance
Security
S&P Mid-Cap 400Weighting
as of 12/31/2017
5/1/2017 -12/31/2017Gain/Loss
Information Technology 17.4% 16%
Financials 17.1% 12%
Industries 15.8% 18%
Consumer Discretionay 12.2% 14%
Real Estate 9.2% 1%
Health Care 7.6% 9%
Materials 7.2% 13%
Utilities 5.3% 5%
Energy 4.3% -5%
Consumer Staples 3.8% 1%
Telecommunication Services 0.1% -23%
For the top 10 holdings within the iShares Core S&P Mid-Cap ETF (“ETF”), performance was positive for the period beginning May 1,2017, through year end, with each of the holdings recording a double-digit gain.
ETF - Top 10 Holdings
Security Sector% of ETF Net Assets
as of 12/31/2017
Take-Two Interactive Software Inc. Information Technology 0.7%
SVB Financial Group Financials 0.7%
NVR Inc. Consumer Discretionary 0.7%
MSCI Inc. Financials 0.6%
Teleflex Inc. Health Care 0.6%
Huntington Ingalls Industries Inc. Industrials 0.6%
Cognex Corp. Information Technology 0.6%
Broadrige Financial Solutions Inc. Information Technology 0.6%
Trimble Inc. Information Technology 0.6%
Steele Dynamics Inc. Materials 0.6%
Financial highlights for this Fund can be found on pages 196-197.
14

State Farm International Equity Fund Management’s Discussion of Fund Performance (unaudited)
OverviewDescribe the Fund’s investment objective and philosophy.
The State Farm International Equity Fund (the “Fund”) is sub-advised by Marsico Capital Management, LLC (“Marsico”) andNorthern Cross, LLC (“Northern Cross”). Marsico and Northern Cross each manage approximately one-half of the Fund’s assets.State Farm Investment Management Corp. monitors the performance of the sub-advisers and the split of the Fund’s portfoliobetween the sub-advisers. The benchmark for the Fund is the MSCI All Country World Index (ACWI) ex-U.S. (the “Index”).
The Fund seeks long-term growth of capital and invests primarily in large cap stocks in developed international markets. Marsicoinvests its portion of the Fund primarily in foreign equity securities issued by companies that it selects for their long-term growthpotential. Northern Cross invests its portion of the Fund primarily in foreign equity securities issued by companies that it believeshave the potential for long-term margin expansion.
Marsico may invest its portion of the Fund in an unlimited number of companies of any size throughout the world, and normallyinvests in the securities of issuers that are economically tied to at least four different foreign countries. In selecting investments forthe Fund, Marsico uses an approach that combines ‘top-down’ macroeconomic analysis with ‘bottom-up’ stock selection. NorthernCross focuses on equities priced cheaply relative to some financial measure of worth, such as ratios of price to earnings, price tosales or price to cash flow. Under normal market conditions Northern Cross will invest its portion of the Fund in 60-80 companieswith a diversified representation of sectors. In selecting securities for the Fund, Northern Cross gives careful consideration tocurrency, political stability and other effects of international investing.
The Fund allows investments in emerging or developing markets. As of December 31, 2017, the Fund had 9.79% of total netassets invested in emerging markets.
Describe the relevant market environment as it relates to the Fund for the reporting period.After recording a 4.50% total return in 2016, international equity markets (as represented by the Index) returned 27.19% for theperiod ended December 31, 2017. A weakened U.S. dollar helped increase already-strong market results, as international equitiesoutperformed the 21.83% return provided by U.S. stocks (as represented by the S&P 500 Index). Within the Index, developedmarket country Austria paced international growth, rising 58.31%. Among developed nations, Israel lagged for the secondconsecutive year as the weakest performing market, ending with a 2.06% return, while emerging market country Pakistan posteda –24.44% return to finish as the worst performing market in 2017. Poland’s 54.72% return made it the top performing emergingmarket in 2017.1
Reflationary expectations greeted international markets to start the period, spurred in part by signs of an accelerating U.S.economy as well as the potential pro-growth impacts anticipated from Trump policies. As the year progressed, synchronizedgrowth across many of the world’s economies materialized. This trend included stronger-than-expected results in the Eurozoneand Japan, as well as a 3% increase in U.S. Gross Domestic Product in both the second (April – June) and third (July – September)quarters. This environment helped to drive a resurgence in earnings for multinational companies, lifting business and investorconfidence levels. Other factors lending support to international equity markets included a strengthening of commodity prices andan increase in trade levels between countries, as well as continuing trends of generally subdued inflation and accommodativemonetary policies. While the Federal Reserve and central banks in England, China, the Eurozone, and elsewhere either continued orbegan to cautiously pull-back their stimulus measures, the environment still promoted liquidity and remained supportive of globalequities. In addition, the strengthening of international economies had some market participants anticipating brighter growthprospects outside the U.S., helping to attract investors’ attention and money.
The period was not without its challenges, though, as political and economic concerns, as well as geopolitical tensions, arose asmarket headwinds during the year. In March and again in September, Congress failed to pass a health care plan to replace theAffordable Care Act. This raised questions with respect to the new administration’s ability to achieve its other pro-growth policygoals and, in turn, how that potential policy failure may impact other economies. Pockets of anxiety regarding the health of the U.S.and global economies also appeared during the year, including a slowdown in China’s growth after a strong first-half performance.A sense of increased geopolitical uncertainty developed during the year as well due, in part, to an escalation in provocative rhetoricand actions involving the North Korean government. In addition, market uncertainty heightened ahead of key elections within theEurozone, while also being impacted by the tense 6-month discussion between the United Kingdom (U.K.) and European Unionregarding the U.K.’s “Brexit” terms. Despite these events, however, market volatility stayed relatively low for most of the period asinvestors remained focused on news conveying strong global economic and business growth.
1 All performance information included in this discussion is reported in U.S. dollar terms.
15

Finally, expected changes to U.S. tax law helped stocks rally toward period end. As the U.S. Congress worked on reforming theindividual and corporate tax codes – eventually passing a bill in late December – investors considered the possible effects tocompanies’ U.S.-based earnings as a result of lower tax rates.
In currency markets, the U.S. dollar decreased by approximately 12%, 9% and 4% versus the euro, British pound and Japaneseyen, respectively, as the period’s global economic growth helped bolster foreign currencies relative to the dollar. Meanwhile, thatweaker dollar and synchronized global growth supported a general increase in commodity prices. Oil began 2017 at around $54per barrel and ranged between approximately $42 to $60/barrel, where it settled at year end for a period increase of approximately12%. Beginning the year at $1,150 per troy ounce, gold traded between approximately $1,147 and $1,356/oz. before endingDecember 2017 at around $1,306/oz., an increase of approximately 14%.
Provide an illustration of the Fund’s investments.
Fund Composition*Short-Term Investments and Cash and Other Assets,
Net of Liabilities, 1.74%
United Kingdom, 13.12%All Other Countries**, 14.34%
Germany, 12.89%
France, 11.98%
Japan, 10.25%
Netherlands, 9.56%
United States, 7.51%
Switzerland, 5.68%
China, 4.92%
Hong Kong, 3.45%
Belgium, 2.25%Canada, 2.31%
* Illustrated by Country and based on total net assets as of December 31, 2017. Please refer to the Schedule ofInvestments later in this report for details concerning Fund holdings.
** Represents 14 other countries, each of which represents less than 2% of net assets.
16

How did the Fund perform during the reporting period?For the 1-year period ended December 31, 2017, Class A shares of the State Farm International Equity Fund recorded a total returnof 33.67% without sales charges, compared to a total return of 27.19% for the MSCI ACWI ex-U.S. Index. The line graph and tablebelow provide additional perspective on the Fund’s long term results.
Comparison of change in value of $10,000 investmentfor the years ended December 31, including applicable sales charges
THOUSANDS
$0
$5
$10
$15
Legend and Value as of December 31, 2017
International Equity Fund – Class A $10,792 MSCI ACWI ex-U.S. Index1 $11,999
2007 2008 2009 2010 2011 2012 2013 2014 2015 20172016
Fund’s Average Annual Total Return and Value as of December 31, 2017
1 YEAR 5 YEAR 10 YEAR
Ending Value ofa $10,000
Investment**
Class A 27.05% 5.62% 0.76% $10,792
Class B - conversion to Class A* 28.46% 5.86% 0.80% $10,825
Class B - conversion to Premier* 28.46% 5.86% 0.82% $10,848
Premier (previously Legacy Class A) 27.06% 5.65% 0.79% $10,814
Legacy Class B - conversion to Class A* 30.59% 6.03% 0.96% $10,998
Legacy Class B - conversion to Premier* 30.59% 6.03% 0.98% $11,021
Institutional 33.79% 6.93% 1.53% $11,636
Class R-1 33.53% 6.41% 0.98% $11,027
Class R-2 33.56% 6.59% 1.17% $11,228
Class R-3 33.70% 6.85% 1.44% $11,541
* Class B and Legacy Class B shares convert to Class A shares after 8 full years, unless the total value of a shareholder’s account(s) is$100,000 or more, then these shares convert to Premier shares. 10 YEAR returns and values reflect the applicable conversion.
** For a 10 YEAR period.The performance data quoted represents past performance and does not guarantee future results. Class A and Premiershares values and Class A shares performance on the line graph reflect a maximum sales charge of 5% at initial investment.Performance for the Fund’s other classes may be greater than or less than the line shown for Class A shares because ofdiffering loads and expenses between the share classes. Returns in the table above reflect maximum sales charges of: 5% forall Class A and Premier shares and for Class B shares at one year; 3% for Legacy Class B shares at one year; and 2% forClass B and Legacy Class B shares at five years. These figures do not reflect the deduction of taxes that a shareholder wouldpay on Fund distributions or the redemption of Fund shares.
1 The MSCI All Country World Index (ex-U.S.) (MSCI ACWI ex-U.S. Index) is a free float adjusted market capitalization index that is designed to measure equitymarket performance in global developed and emerging markets, excluding the United States. As of December 31, 2017, the MSCI AWCI ex-U.S. Index consisted of46 developed and emerging market country indices. Unlike an investment in the International Equity Fund, a theoretical investment in the Index does not reflectany expenses. It is not possible to invest directly in an index.
17

Performance AnalysisWhat factors helped and hindered performance during the reporting period?
During the 1-year period ended December 31, 2017, Marsico and Northern Cross each individually generated double-digit totalreturns, with Marsico’s portion of the Fund outperforming Northern Cross’ portion of the Fund. Below are discussions concerningindividual investments made by Marsico and Northern Cross during the course of the year.
Marsico Capital Management, LLC (52.10% of the Fund’s total investments)The tables below show the securities that were the leading contributors and detractors to Marsico’s performance during the year,as well as a recap of the top 10 holdings within Marsico’s portion of the Fund.
The largest contributors to Marsico’s performance were the following five holdings, with Wirecard and Tencent posting triple-digitreturns and the remaining holdings recording double-digit gains during the period.
Marsico - Top 5 Contributors
Security Sector
% of Marsico’sTotal Investmentsas of 12/31/2017
Wirecard AG Information Technology 2.9%
Tencent Holdings Ltd. Information Technology 4.1%
Alibaba Group Holding Ltd. Sponsored ADR Information Technology 3.8%
InterXion Holding NV Information Technology 5.2%
ASML Holding NV Information Technology 4.6%
The largest detractors to Marsico’s performance were the following five holdings, with each posting double-digit losses during theperiod.
Marsico - Top 5 Detractors
Security Sector
% of Marsico’sTotal Investmentsas of 12/31/2017
Domino’s Pizza Enterprises Ltd. Consumer Discretionary 2.4%
Element Fleet Management Corp.* Financials sold
Yoox Net-A-Porter Group SpA* Consumer Discretionary sold
Genmab A/S Health Care 0.9%
UniCredit SpA Financials 1.5%
*Sold prior to 12/31/2017. Total return loss referenced is from 1/1/2017 to date sold.
Among the top 10 largest holdings within Marsico’s portion of the Fund, Tencent and Wirecard posted triple-digit gains for theperiod and the remaining eight holdings delivered double-digit returns.
Marsico - Top 10 Holdings
Security Sector
% of Marsico’sTotal Investmentsas of 12/31/2017
InterXion Holding NV Information Technology 5.2%
ASML Holding NV Information Technology 4.6%
Tencent Holdings Ltd. Information Technology 4.1%
Alibaba Group Holding Ltd. Sponsored ADR Information Technology 3.8%
Julius Baer Group Ltd. Financials 3.7%
Bayer AG Reg. Health Care 3.4%
Fanuc Corp. Industrials 3.2%
Ryanair Holdings PLC SP ADR Industrials 2.9%
Wirecard AG Information Technology 2.9%
MISUMI Group Inc. Industrials 2.9%
18

Northern Cross, LLC (47.90% of the Fund’s total investments)The tables below show the securities that were the leading contributors and detractors to Northern Cross’ performance during theyear, as well as a recap of the top ten holdings within Northern Cross’ portion of the Fund.
The largest contributors to Northern Cross’ performance during the year were the following five holdings, with each postingdouble-digit gains during the period.
Northern Cross - Top 5 Contributors
Security Sector
% of Northern Cross’Total Investmentsas of 12/31/2017
Wynn Resorts Ltd. Consumer Discretionary 3.7%
Alibaba Group Holding Ltd. Sponsored ADR Information Technology 3.1%
Las Vegas Sands Corp. Consumer Discretionary 5.7%
Pernod Ricard SA Consumer Staples 2.4%
Heineken NV Consumer Staples 2.5%
Among the largest detractors to Northern Cross’ performance during the year were the following five holdings. Schlumberger, TevaPharmaceutical, and ConvaTec posted double-digit losses, while the remaining two holdings experienced single-digit losses duringthe period.
Northern Cross - Top 5 Detractors
Security Sector
% of Northern Cross’Total Investmentsas of 12/31/2017
Schlumberger Ltd. Energy 3.8%
Teva Pharmaceutical Industries Ltd. Sponsored ADR Health Care 1.1%
Shire PLC Health Care 2.2%
Dentsu Inc. Consumer Discretionary 0.8%
ConvaTec Group PLC Health Care 0.5%
Among the top 10 largest holdings within Northern Cross’ portion of the Fund, Schlumberger produced a double-digit loss whilethe remaining holdings posted double-digit gains for the period.
Northern Cross - Top 10 Holdings
Security Sector
% of Northern Cross’Total Investmentsas of 12/31/2017
Las Vegas Sands Corp. Consumer Discretionary 5.7%
Schlumberger Ltd. Energy 3.8%
Wynn Resorts Ltd. Consumer Discretionary 3.7%
Alibaba Group Holding Ltd. Sponsored ADR Information Technology 3.1%
Atlas Copco AB Class A Industrials 2.7%
Vivendi Consumer Discretionary 2.6%
Fanuc Corp. Industrials 2.5%
Heineken NV Consumer Staples 2.5%
Linde AG Tender Shares Materials 2.4%
Reckitt Benckiser Group PLC Consumer Staples 2.4%
Financial highlights for this Fund can be found on pages 198-199.
19

State Farm S&P 500 Index Fund Management’s Discussion of Fund Performance (unaudited)
OverviewDescribe the Fund’s investment objective and philosophy.
The State Farm S&P 500 Index Fund (the “Fund”) seeks to provide investment results that correspond to the total return of publiclytraded common stocks in the aggregate, as represented by the S&P 500 Index1 (the “Index”). The Index tracks the common stockperformance of 500 selected large U.S. companies in leading industries, and most of the common stocks in the Index are listed onthe New York Stock Exchange. The weightings of stocks in the Index are based on each stock’s relative total float-adjusted marketcapitalization (stock price multiplied by the number of investable shares outstanding). The percentage of the Fund’s assetsinvested in a given stock is approximately the same as the percentage such stock represents in the Index.
BlackRock Fund Advisors (“BlackRock”) serves as the investment sub-adviser to the Fund. State Farm Investment ManagementCorp. monitors the performance of BlackRock in sub-advising the Fund.
Describe the relevant market environment as it related to the Fund for the reporting period.Synchronized growth across many of the world’s economies helped drive a resurgence in earnings for multinational companies,lifting business and investor confidence levels during the year. Other factors lending support to U.S. equity markets includedcontinuing trends of generally subdued inflation, accommodative global central bank policy, positive employment data, andincreases in U.S. Gross Domestic Product, including more than 3% growth in both the second (April – June) and third (July –September) quarters. In addition, early in 2017, the potential pro-growth policy impacts anticipated from the Trump administrationhelped support equity gains, while expected changes to U.S. tax law helped stocks rally toward period end. As the U.S. Congressworked on reforming the individual and corporate tax codes – eventually passing a bill in late December – investors considered thepossible effects to companies’ earnings as a result of lower tax rates.
The period was not without its challenges, though, as U.S. political and economic concerns, geopolitical tensions, and naturaldisasters arose as market headwinds during the year. In March and later again in September, Congress failed to pass a health careplan to replace the Affordable Care Act, raising questions with respect to the new administration’s ability to achieve its other pro-growth policy goals. Pockets of anxiety regarding the health of the U.S. economy also briefly appeared, as did a sense of increasedgeopolitical uncertainty that was due, in part, to an escalation in provocative rhetoric and actions involving the North Koreangovernment. In addition, in August and September, two hurricanes – Harvey and Irma – made landfall in the U.S., temporarilydisrupting activity throughout the economy. Despite these events, however, market volatility stayed relatively low for most of theperiod, with market price declines, in particular, being less sustained and severe than in recent years’ past, as investors remainedfocused on news conveying strong economic and business growth both in the U.S. and abroad.
Starting the year at a period low of 2,238, the S&P 500 Index staged a series of uneven climbs through the first seven months ofthe year before achieving more consistent gains starting in late summer. During the period, U.S. equities entered the ninth year oftheir current bull market run, while the S&P 500 Index set over 60 closing price highs – including a new record of 2,690 onDecember 18th – before finishing the year at 2,673. In addition, the S&P 500 Index marked another record in 2017, for the firsttime in its history notching gains in each of the year’s 12 months.
The 12-month total return for the Index was 21.83%. The total return for the period reflected an increase in corporate earnings pershare for the S&P 500 Index companies of approximately 17.0%, an expansion of the price/earnings valuation of the Index ofapproximately 3.0%, and a dividend return of approximately 1.8%. Within the broad U.S. equities market rally, growth generallyoutperformed value. The S&P 500 Growth Index returned 27.44% versus 15.36% from the S&P 500 Value Index due, in part, to themarket’s view that growth-oriented companies were generally better positioned to benefit from the expanding economy relative totheir value-oriented peers.
In currency markets, the U.S. dollar decreased by approximately 12%, 9% and 4% versus the euro, British pound and Japaneseyen, respectively, as the period’s global economic growth helped bolster foreign currencies relative to the dollar. Meanwhile, thatweaker dollar and synchronized global growth supported a general increase in commodity prices. Oil began 2017 at around $54per barrel and ranged between approximately $42 to $60/barrel, where it settled at year end for a period increase of approximately12%. Beginning the year at $1,150 per troy ounce, gold traded between approximately $1,147 and $1,356/oz. before endingDecember 2017 at around $1,306/oz., an increase of approximately 14%.
1 The S&P 500 Index is a product of S&P Dow Jones Indices LLC (“SPDJI”), and has been licensed for use by State Farm Mutual Fund Trust (“Licensee”).Standard & Poor’s®, S&P® and S&P 500® are registered trademarks of Standard & Poor’s Financial Services LLC (“S&P”); Dow Jones® is a registered trademarkof Dow Jones Trademark Holdings LLC (“Dow Jones”); and these trademarks have been licensed for use by SPDJI and sublicensed for certain purposes byLicensee. Licensee’s products are not sponsored, endorsed, sold or promoted by SPDJI, Dow Jones, S&P, their respective affiliates, and none of such partiesmake any representation regarding the advisability of investing in such product(s) nor do they have any liability for any errors, omissions, or interruptions of theS&P 500 Index.
20

Provide an illustration of the Fund’s investments.
Fund Composition*
Financials, 14.46%
Consumer Staples, 8.01%
Information Technology, 23.23%
Energy, 5.94%
Health Care, 13.46%Consumer Discretionary, 11.93%
Materials, 2.94%
Short-Term Investments and Cash andOther Assets, Net of Liabilities, 2.27%
Industrials, 10.05%
Utilities, 2.87%
Real Estate, 2.82%
Telecommunication Services, 2.02%
* Illustrated by Sector and based on total net assets as of December 31, 2017. Please refer to the Schedule ofInvestments later in this report for details concerning Fund holdings.
21

How did the Fund perform during the reporting period?For the 1-year period ended December 31, 2017, Class A shares of the State Farm S&P 500 Index Fund had a total return of21.21% without sales charges compared to a 21.83% total return for the S&P 500 Index. The line graph and table below provideadditional perspective on the Fund’s long term results.
Comparison of change in value of $10,000 investmentfor the years ended December 31, including applicable sales charges
THOUSANDS
$0
$5
$10
$25
$20
$15
Legend and Value as of December 31, 2017
S&P 500 Index Fund – Class A $20,023 S&P 500 Index1 $22,603
2007 2008 2009 2010 2011 2012 2013 2014 2015 20172016
Fund’s Average Annual Total Return and Value as of December 31, 2017
1 YEAR 5 YEAR 10 YEAR
Ending Value ofa $10,000
Investment**
Class A 15.14% 13.84% 7.19% $20,023
Class B - conversion to Class A* 16.02% 14.07% 7.16% $19,968
Class B - conversion to Premier* 16.02% 14.07% 7.18% $20,009
Premier (previously Legacy Class A) 15.35% 13.86% 7.21% $20,057
Legacy Class B - conversion to Class A* 18.15% 14.38% 7.40% $20,421
Legacy Class B - conversion to Premier* 18.15% 14.38% 7.42% $20,462
Institutional 21.34% 15.25% 8.00% $21,581
Class R-1 21.14% 14.68% 7.41% $20,444
Class R-2 21.15% 14.88% 7.62% $20,837
Class R-3 21.31% 15.16% 7.92% $21,422
* Class B and Legacy Class B shares convert to Class A shares after 8 full years, unless the total value of a shareholder’s account(s) is$100,000 or more, then these shares convert to Premier shares. 10 YEAR returns and values reflect the applicable conversion.
** For a 10 YEAR period.The performance data quoted represents past performance and does not guarantee future results. Class A and Premiershares values and Class A shares performance on the line graph reflect a maximum sales charge of 5% at initial investment.Performance for the Fund’s other classes may be greater than or less than the line shown for Class A shares because ofdiffering loads and expenses between the share classes. Returns in the table above reflect maximum sales charges of: 5% forall Class A and Premier shares and for Class B shares at one year; 3% for Legacy Class B shares at one year; and 2% forClass B and Legacy Class B shares at five years. These figures do not reflect the deduction of taxes that a shareholder wouldpay on Fund distributions or the redemption of Fund shares.
1 The S&P 500 Index represents an unmanaged group of stocks, tracking the common stock performance of 500 large U.S. companies in the manufacturing, utilities,transportation, and financial industries. Unlike an investment in the S&P 500 Index Fund, a theoretical investment in the Index does not reflect any expenses. It isnot possible to invest directly in an index.
22

Performance AnalysisWhat factors helped and hindered performance during the reporting period?
The Fund satisfactorily tracked the total return of the Index in 2017, before fees and expenses that are not found within the Index.With the exception of Energy and Telecommunication Services, all of the Index’s sectors posted positive returns for the year.
Index Sector Performance
SectorIndex Weightingas of 12/31/2017 2017 Gain/Loss
Information Technology 23.8% 39%
Financials 14.8% 22%
Health Care 13.8% 22%
Consumer Discretionary 12.2% 23%
Industrials 10.3% 21%
Consumer Staples 8.2% 13%
Energy 6.1% -1%
Materials 3.0% 24%
Utilities 2.9% 12%
Real Estate 2.9% 11%
Telecommunication Services 2.1% -1%
Nine of the Fund’s top 10 holdings recorded positive results for the period. Exxon Mobil generated a single-digit loss while theother nine holdings produced double-digit gains.
Top 10 Holdings
Security Sector% of Net Assetsas of 12/31/2017
Apple Inc. Information Technology 3.7%
Microsoft Corp. Information Technology 2.8%
Amazon.com Inc. Consumer Discretionary 2.0%
Facebook Inc. Class A Information Technology 1.8%
Berkshire Hathaway Inc. Class B Financials 1.6%
Johnson & Johnson Health Care 1.6%
JPMorgan Chase & Co. Financials 1.6%
Exxon Mobil Corp Energy 1.5%
Alphabet Inc. Class C Information Technology 1.4%
Alphabet Inc. Class A Information Technology 1.3%
Financial highlights for this Fund can be found on pages 200-201.
23
State Farm Small Cap Index Fund Management’s Discussion of Fund Performance (unaudited)
OverviewDescribe the Fund’s investment objective and philosophy.
The Small Cap Index Fund (the “Fund”) seeks to match as closely as practicable, before fees and expenses, the performance of theRussell 2000 Index1 (the “Index”). The Index measures the performance of the small-capitalization sector of the U.S. equity marketand consists of the smallest 2,000 companies in the Russell 3000 Index.2The weightings of stocks in the Index are based on eachstock’s relative total market capitalization (stock price multiplied by the number of shares outstanding).
BlackRock Fund Advisers (“BlackRock”) serves as the investment sub-adviser to the Fund. State Farm Investment ManagementCorp. monitors the investment performance of BlackRock in sub-advising the Fund.
Describe the relevant market environment as it related to the Fund for the reporting period.Synchronized growth across many of the world’s economies helped drive a resurgence in earnings for multinational companies,lifting business and investor confidence levels during the year. Other factors lending support to U.S. equity markets includedcontinuing trends of generally subdued inflation, accommodative global central bank policy, positive employment data, andincreases in U.S. Gross Domestic Product, including more than 3% growth in both the second (April – June) and third (July –September) quarters. In addition, the potential pro-growth policy impacts anticipated from the Trump administration helped supportequity gains — in particular lifting prices on small-cap stocks early in 2017 — while expected changes to U.S. tax law helpedstocks rally toward period end. As the U.S. Congress worked on reforming the individual and corporate tax codes – eventuallypassing a bill in late December – investors considered the possible effects to companies’ earnings as a result of lower tax rates.
The period was not without its challenges, though, as U.S. political and economic concerns, geopolitical tensions, and naturaldisasters arose as market headwinds during the year. In March and again in September, Congress failed to pass a health care planto replace the Affordable Care Act. This helped to raise questions with respect to the new administration’s ability to achieve itsother pro-growth policy goals, and as a result, negatively impacted small-cap equities in particular as investors reconsidered theirearlier support for that asset class. Pockets of anxiety regarding the health of the U.S. economy also briefly appeared, as did asense of increased geopolitical uncertainty that was due, in part, to an escalation in provocative rhetoric and actions involving theNorth Korean government. In addition, in August and September, two hurricanes – Harvey and Irma – made landfall in the U.S.,temporarily disrupting activity throughout the economy. Despite these events, however, market volatility stayed relatively low formost of the period, with market price declines, in particular, being less sustained and severe than in recent years’ past, asinvestors remained focused on news conveying strong economic and business growth both in the U.S. and abroad.
Within the broad U.S. equities market rally, large-cap company returns generally outperformed those provided by small-capbusinesses. For the year ended December 31, 2017, large-cap stocks (as represented by the Russell 1000 Index3) generated a21.69% total return, while the Index provided a 14.65% gain. This performance difference was due, in part, to the market’s viewthat given their greater exposure to global economies, larger organizations were better positioned to benefit from the expansion ofinternational economic growth. Similarly, while the market rewarded the financial sector in general during the year, larger bankstocks generally performed better than those of their smaller peers. With the Federal Reserve’s three interest rate hikes and thepotential regulatory changes proposed by the Trump administration, investors forecasted more possible upside for larger financialinstitutions. In addition, within the energy sector, the stock performance of smaller companies was especially challenged, asinvestors weighed multiple factors including whether the year’s rise in oil prices could be sustained.
In currency markets, the U.S. dollar decreased by approximately 12%, 9% and 4% versus the euro, British pound and Japaneseyen, respectively, as the period’s global economic growth helped bolster foreign currencies relative to the dollar. Meanwhile, thatweaker dollar and synchronized global growth supported a general increase in commodity prices. Oil began 2017 at around $54per barrel and ranged between approximately $42 to $60/barrel, where it settled at year end for a period increase of approximately12%. Beginning the year at $1,150 per troy ounce, gold traded between approximately $1,147 and $1,356/oz. before endingDecember 2017 at around $1,306/oz., an increase of approximately 14%.
1 Russell Investment Group (“Russell”) is the source and owner of the trademarks, service marks and copyrights related to the Russell 2000® Index. Russell® is atrademark of Russell. The State Farm Small Cap Index Fund (the “Fund”) is not sponsored, endorsed, sold or promoted by, nor in any way affiliated with Russell.Russell is not responsible for and has not reviewed the Fund nor any associated literature or publications and Russell makes no representation or warranty,express or implied, as to their accuracy, or completeness, or otherwise.
2 The Russell 3000 Index is composed of 3000 large U.S. Companies, as determined by market capitalization. The Russell 3000 Index represents approximately98% of the investable U.S. equity market. The Russell 3000 Index is comprised of stocks within the Russell 1000 and the Russell 2000 Indices.
3 The Russell 1000 Index measures the performance of the large-cap segment of the U.S. equity universe. It is a subset of the Russell 3000 Index and includesapproximately 1000 of the largest securities based on a combination of their market cap and current index membership. The Russell 1000 representsapproximately 92% of the U.S. market.
24

Provide an illustration of the Fund’s investments.
Fund Composition*
Consumer Discretionary, 12.33%
Materials, 4.49%
Health Care, 15.15%
Financials, 17.52%
Information Technology, 16.42%
Short-Term Investments and Cash andOther Assets, Net of Liabilities, 1.41%
Utilities, 3.50%
Energy, 3.94%
Real Estate, 6.61%
Industrials, 15.15%
Consumer Staples, 2.73%
Telecommunication Services, 0.75%
* Illustrated by Sector and based on total net assets as of December 31, 2017. Please refer to the Schedule ofInvestments later in this report for details concerning Fund holdings.
25

How did the Fund perform during the reporting period?For the 1-year period ended December 31, 2017, Class A shares of the State Farm Small Cap Index Fund generated a total returnof 14.09% without sales charges, compared to a 14.65% total return for the Russell 2000 Index. The line graph and table belowprovide additional perspective on the Fund’s long term results.
Comparison of change in value of $10,000 investmentfor the years ended December 31, including applicable sales charges
THOUSANDS
$0
$5
$10
$25
$20
$15
Legend and Value as of December 31, 2017
Small Cap Index Fund – Class A $20,067 Russell 2000 Index1 $23,054
2007 2008 2009 2010 2011 2012 2013 2014 2015 20172016
Fund’s Average Annual Total Return and Value as of December 31, 2017
1 YEAR 5 YEAR 10 YEAR
Ending Value ofa $10,000
Investment**
Class A 8.36% 12.06% 7.21% $20,067
Class B - conversion to Class A* 9.00% 12.42% 7.26% $20,158
Class B - conversion to Premier* 9.00% 12.42% 7.28% $20,199
Premier (previously Legacy Class A) 8.51% 12.11% 7.24% $20,112
Legacy Class B - conversion to Class A* 11.01% 12.59% 7.46% $20,526
Legacy Class B - conversion to Premier* 11.01% 12.59% 7.48% $20,567
Institutional 14.18% 13.45% 8.03% $21,640
Class R-1 14.00% 12.91% 7.46% $20,533
Class R-2 14.02% 13.10% 7.64% $20,884
Class R-3 14.10% 13.38% 7.96% $21,503
* Class B and Legacy Class B shares convert to Class A shares after 8 full years, unless the total value of a shareholder’s account(s) is$100,000 or more, then these shares convert to Premier shares. 10 YEAR returns and values reflect the applicable conversion.
** For a 10 YEAR period.The performance data quoted represents past performance and does not guarantee future results. Class A and Premiershares values and Class A shares performance on the line graph reflect a maximum sales charge of 5% at initial investment.Performance for the Fund’s other classes may be greater than or less than the line shown for Class A shares because ofdiffering loads and expenses between the share classes. Returns in the table above reflect maximum sales charges of: 5% forall Class A and Premier shares and for Class B shares at one year; 3% for Legacy Class B shares at one year; and 2% forClass B and Legacy Class B shares at five years. These figures do not reflect the deduction of taxes that a shareholder wouldpay on Fund distributions or the redemption of Fund shares.
1 The Russell 2000 Index tracks the common stock performance of the 2,000 smallest U.S. companies in the Russell 3000 Index, and represents approximately 8%of the total capitalization of the Russell 3000 Index. Unlike an investment in the Small Cap Index Fund, a theoretical investment in the Index does not reflect anyexpenses. It is not possible to invest directly in an index.
26
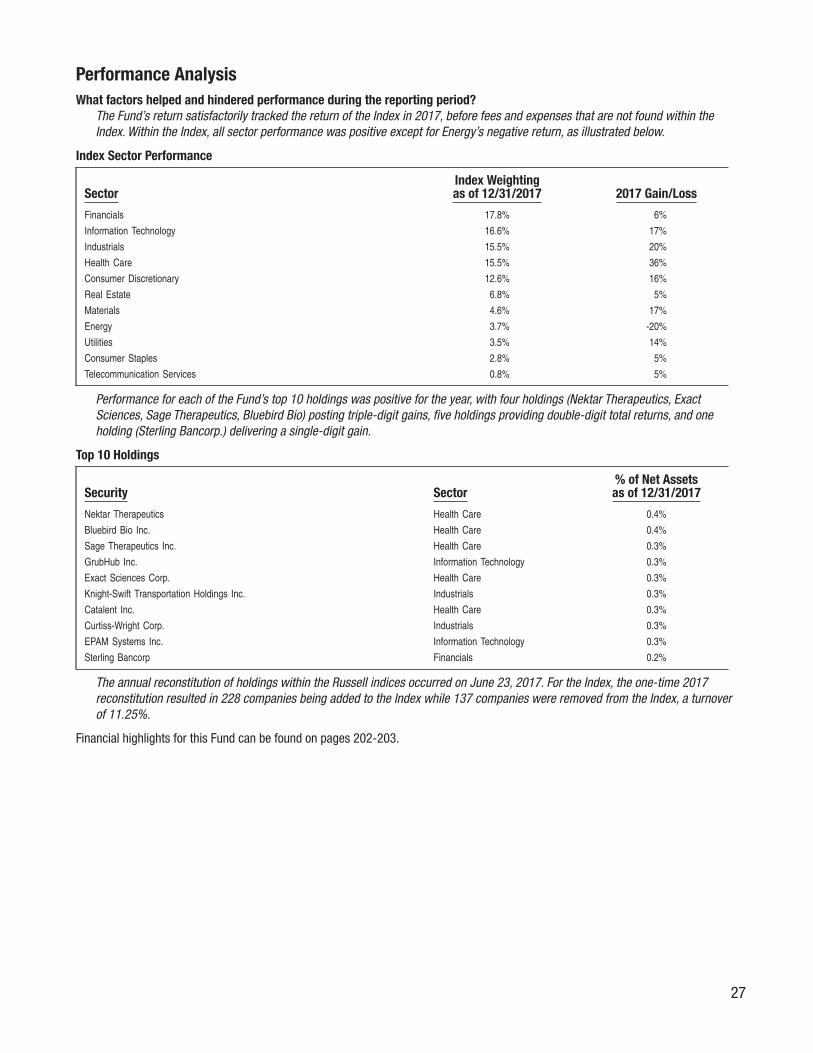
Performance AnalysisWhat factors helped and hindered performance during the reporting period?
The Fund’s return satisfactorily tracked the return of the Index in 2017, before fees and expenses that are not found within theIndex. Within the Index, all sector performance was positive except for Energy’s negative return, as illustrated below.
Index Sector Performance
SectorIndex Weightingas of 12/31/2017 2017 Gain/Loss
Financials 17.8% 6%
Information Technology 16.6% 17%
Industrials 15.5% 20%
Health Care 15.5% 36%
Consumer Discretionary 12.6% 16%
Real Estate 6.8% 5%
Materials 4.6% 17%
Energy 3.7% -20%
Utilities 3.5% 14%
Consumer Staples 2.8% 5%
Telecommunication Services 0.8% 5%
Performance for each of the Fund’s top 10 holdings was positive for the year, with four holdings (Nektar Therapeutics, ExactSciences, Sage Therapeutics, Bluebird Bio) posting triple-digit gains, five holdings providing double-digit total returns, and oneholding (Sterling Bancorp.) delivering a single-digit gain.
Top 10 Holdings
Security Sector% of Net Assetsas of 12/31/2017
Nektar Therapeutics Health Care 0.4%
Bluebird Bio Inc. Health Care 0.4%
Sage Therapeutics Inc. Health Care 0.3%
GrubHub Inc. Information Technology 0.3%
Exact Sciences Corp. Health Care 0.3%
Knight-Swift Transportation Holdings Inc. Industrials 0.3%
Catalent Inc. Health Care 0.3%
Curtiss-Wright Corp. Industrials 0.3%
EPAM Systems Inc. Information Technology 0.3%
Sterling Bancorp Financials 0.2%
The annual reconstitution of holdings within the Russell indices occurred on June 23, 2017. For the Index, the one-time 2017reconstitution resulted in 228 companies being added to the Index while 137 companies were removed from the Index, a turnoverof 11.25%.
Financial highlights for this Fund can be found on pages 202-203.
27
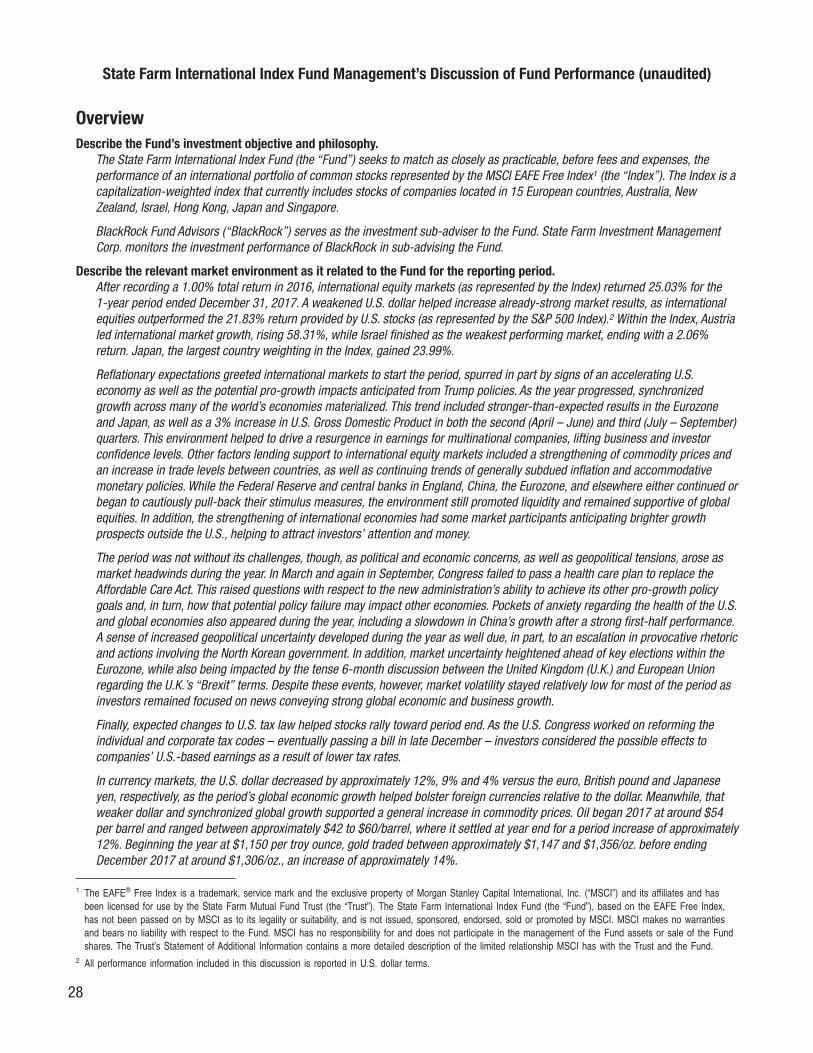
State Farm International Index Fund Management’s Discussion of Fund Performance (unaudited)
OverviewDescribe the Fund’s investment objective and philosophy.
The State Farm International Index Fund (the “Fund”) seeks to match as closely as practicable, before fees and expenses, theperformance of an international portfolio of common stocks represented by the MSCI EAFE Free Index1 (the “Index”). The Index is acapitalization-weighted index that currently includes stocks of companies located in 15 European countries, Australia, NewZealand, Israel, Hong Kong, Japan and Singapore.
BlackRock Fund Advisors (“BlackRock”) serves as the investment sub-adviser to the Fund. State Farm Investment ManagementCorp. monitors the investment performance of BlackRock in sub-advising the Fund.
Describe the relevant market environment as it related to the Fund for the reporting period.After recording a 1.00% total return in 2016, international equity markets (as represented by the Index) returned 25.03% for the1-year period ended December 31, 2017. A weakened U.S. dollar helped increase already-strong market results, as internationalequities outperformed the 21.83% return provided by U.S. stocks (as represented by the S&P 500 Index).2 Within the Index, Austrialed international market growth, rising 58.31%, while Israel finished as the weakest performing market, ending with a 2.06%return. Japan, the largest country weighting in the Index, gained 23.99%.
Reflationary expectations greeted international markets to start the period, spurred in part by signs of an accelerating U.S.economy as well as the potential pro-growth impacts anticipated from Trump policies. As the year progressed, synchronizedgrowth across many of the world’s economies materialized. This trend included stronger-than-expected results in the Eurozoneand Japan, as well as a 3% increase in U.S. Gross Domestic Product in both the second (April – June) and third (July – September)quarters. This environment helped to drive a resurgence in earnings for multinational companies, lifting business and investorconfidence levels. Other factors lending support to international equity markets included a strengthening of commodity prices andan increase in trade levels between countries, as well as continuing trends of generally subdued inflation and accommodativemonetary policies. While the Federal Reserve and central banks in England, China, the Eurozone, and elsewhere either continued orbegan to cautiously pull-back their stimulus measures, the environment still promoted liquidity and remained supportive of globalequities. In addition, the strengthening of international economies had some market participants anticipating brighter growthprospects outside the U.S., helping to attract investors’ attention and money.
The period was not without its challenges, though, as political and economic concerns, as well as geopolitical tensions, arose asmarket headwinds during the year. In March and again in September, Congress failed to pass a health care plan to replace theAffordable Care Act. This raised questions with respect to the new administration’s ability to achieve its other pro-growth policygoals and, in turn, how that potential policy failure may impact other economies. Pockets of anxiety regarding the health of the U.S.and global economies also appeared during the year, including a slowdown in China’s growth after a strong first-half performance.A sense of increased geopolitical uncertainty developed during the year as well due, in part, to an escalation in provocative rhetoricand actions involving the North Korean government. In addition, market uncertainty heightened ahead of key elections within theEurozone, while also being impacted by the tense 6-month discussion between the United Kingdom (U.K.) and European Unionregarding the U.K.’s “Brexit” terms. Despite these events, however, market volatility stayed relatively low for most of the period asinvestors remained focused on news conveying strong global economic and business growth.
Finally, expected changes to U.S. tax law helped stocks rally toward period end. As the U.S. Congress worked on reforming theindividual and corporate tax codes – eventually passing a bill in late December – investors considered the possible effects tocompanies’ U.S.-based earnings as a result of lower tax rates.
In currency markets, the U.S. dollar decreased by approximately 12%, 9% and 4% versus the euro, British pound and Japaneseyen, respectively, as the period’s global economic growth helped bolster foreign currencies relative to the dollar. Meanwhile, thatweaker dollar and synchronized global growth supported a general increase in commodity prices. Oil began 2017 at around $54per barrel and ranged between approximately $42 to $60/barrel, where it settled at year end for a period increase of approximately12%. Beginning the year at $1,150 per troy ounce, gold traded between approximately $1,147 and $1,356/oz. before endingDecember 2017 at around $1,306/oz., an increase of approximately 14%.
1 The EAFE® Free Index is a trademark, service mark and the exclusive property of Morgan Stanley Capital International, Inc. (“MSCI”) and its affiliates and hasbeen licensed for use by the State Farm Mutual Fund Trust (the “Trust”). The State Farm International Index Fund (the “Fund”), based on the EAFE Free Index,has not been passed on by MSCI as to its legality or suitability, and is not issued, sponsored, endorsed, sold or promoted by MSCI. MSCI makes no warrantiesand bears no liability with respect to the Fund. MSCI has no responsibility for and does not participate in the management of the Fund assets or sale of the Fundshares. The Trust’s Statement of Additional Information contains a more detailed description of the limited relationship MSCI has with the Trust and the Fund.
2 All performance information included in this discussion is reported in U.S. dollar terms.
28

Provide an illustration of the Fund’s investments.
Fund Composition*
Germany, 9.77%
Switzerland, 7.99%
Australia, 6.89%
Sweden, 2.67%Spain, 3.19%
Netherlands, 3.50%
Italy, 2.34%
All Other Countries**, 7.33%
Hong Kong, 3.57%
Cash and Other Assets, Net of Liabilities, 0.33%
Japan, 23.97%
United Kingdom, 17.81%
France, 10.64%
* Illustrated by Country and based on total net assets as of December 31, 2017. Please refer to the Schedule ofInvestments later in this report for details concerning Fund holdings.
** Represents 10 other countries, each of which represents less than 2% of net assets.
29

How did the Fund perform during the reporting period?For the 1-year period ended December 31, 2017, Class A shares of the State Farm International Index Fund generated a totalreturn of 24.99% without sales charges, compared to a 25.03% total return for the MSCI EAFE Free Index. The line graph and tablebelow provide additional perspective on the Fund’s long term results.
Comparison of change in value of $10,000 investmentfor the years ended December 31, including applicable sales charges
THOUSANDS
$0
$5
$10
$15
Legend and Value as of December 31, 2017
International Index Fund – Class A $10,593 EAFE Free Index1 $12,119
2007 2008 2009 2010 2011 2012 2013 2014 2015 20172016
Fund’s Average Annual Total Return and Value as of December 31, 2017
1 YEAR 5 YEAR 10 YEAR
Ending Value ofa $10,000
Investment**
Class A 18.72% 5.70% 0.58% $10,593
Class B - conversion to Class A* 19.77% 5.89% 0.57% $10,589
Class B - conversion to Premier* 19.77% 5.89% 0.59% $10,602
Premier (previously Legacy Class A) 18.79% 5.74% 0.57% $10,580
Legacy Class B - conversion to Class A* 21.87% 6.11% 0.77% $10,797
Legacy Class B - conversion to Premier* 21.87% 6.11% 0.78% $10,809
Institutional 25.04% 7.00% 1.31% $11,387
Class R-1 24.80% 6.47% 0.77% $10,798
Class R-2 24.87% 6.67% 0.96% $10,998
Class R-3 24.98% 6.93% 1.24% $11,313
* Class B and Legacy Class B shares convert to Class A shares after 8 full years, unless the total value of a shareholder’s account(s) is$100,000 or more, then these shares convert to Premier shares. 10 YEAR returns and values reflect the applicable conversion.
** For a 10 YEAR period.The performance data quoted represents past performance and does not guarantee future results. Class A and Premiershares values and Class A shares performance on the line graph reflect a maximum sales charge of 5% at initial investment.Performance for the Fund’s other classes may be greater than or less than the line shown for Class A shares because ofdiffering loads and expenses between the share classes. Returns in the table above reflect maximum sales charges of: 5% forall Class A and Premier shares and for Class B shares at one year; 3% for Legacy Class B shares at one year; and 2% forClass B and Legacy Class B shares at five years. These figures do not reflect the deduction of taxes that a shareholder wouldpay on Fund distributions or the redemption of Fund shares.
1 The MSCI Europe, Australasia and Far East Free (EAFE Free) Index currently measures the performance of stock markets of Europe, Australia, New Zealand,Israel, and the Far East. Historically, the EAFE Free took into account local market restrictions on share ownership by foreigners. Unlike an investment in theInternational Index Fund, a theoretical investment in the Index does not reflect any expenses. It is not possible to invest directly in an index.
30

Performance AnalysisWhat factors helped and hindered performance during the reporting period?
The Fund’s return satisfactorily tracked the return of the Index in 2017, before fees and expenses that are not found within the Index. Within theIndex, all of the industry sectors produced gains as illustrated below.
Index Sector Performance
SectorIndex Weightingas of 12/31/2017 2017 Gain/Loss
Financials 21.2% 25%Industrials 14.6% 30%Consumer Discretionary 12.3% 25%Consumer Staples 11.2% 24%Health Care 10.1% 17%Materials 8.2% 34%Information Technology 6.4% 39%Energy 5.3% 22%Telecommunication Services 3.9% 13%Real Estate 3.6% 22%Utilities 3.2% 19%
Of the top 10 countries (by weight) within the Index, all posted gains in 2017 as illustrated below.
Top 10 Countries
CountryIndex Weightingas of 12/31/2017 2017 Gain/Loss
Japan 24.0% 24%United Kingdom 17.8% 22%France 10.7% 29%Germany 9.8% 28%Switzerland 8.0% 23%Australia 6.9% 20%Hong Kong 3.6% 36%Netherlands 3.6% 32%Spain 3.2% 27%Sweden 2.7% 21%
Among the Fund’s 10 largest holdings as of December 31, 2017, performance was positive for the reporting period. All 10 holdingsposted double-digit returns.
Top 10 Holdings
Security Sector% of Net Assetsas of 12/31/2017
Nestle SA Reg. Consumer Staples 1.8%HSBC Holdings PLC Financials 1.4%Novartis AG Reg. Health Care 1.3%Roche Holding AG Health Care 1.2%Toyota Motor Corp. Consumer Discretionary 1.1%British American Tobacco PLC Consumer Staples 1.0%Royal Dutch Shell PLC Class A Energy 1.0%BP PLC Energy 0.9%Total SA Energy 0.9%Royal Dutch Shell PLC Class B Energy 0.8%
Financial highlights for this Fund can be found on pages 204-205.
31

State Farm Equity and Bond Fund Management’s Discussion of Fund Performance (unaudited)
OverviewDescribe the Fund’s investment objective and philosophy.
The State Farm Equity and Bond Fund (the “Fund”) is managed with a combination of stocks and bonds in the pursuit of long-termgrowth of principal while providing some current income.
The Fund invests all of its assets in shares of the State Farm Equity Fund (the “Equity Fund”) and the State Farm Bond Fund (the“Bond Fund”, and together with the Equity Fund, an “Underlying Fund”). Effort is made to maintain an investment mix ofapproximately 60% of assets in the Equity Fund and 40% of assets in the Bond Fund. The Fund never invests more than 75% of itsnet assets in either Underlying Fund.
Describe the relevant market environment as it related to the Fund for the reporting period.Because the Fund does not invest directly in individual stocks and bonds, the merits of the individual investments are evaluatedseparately by each Underlying Fund’s managers. You may wish to refer to the Management’s Discussion of Fund Performance forthe Equity Fund and the Bond Fund in addition to the commentary provided here.
Synchronized growth across many of the world’s economies helped drive a resurgence in earnings for multinational companies,lifting business and investor confidence levels during the year. Other factors lending support to U.S. equity markets includedcontinuing trends of generally subdued inflation, accommodative global central bank policy, positive employment data, andincreases in U.S. Gross Domestic Product, including more than 3% growth in both the second (April – June) and third (July –September) quarters. In addition, early in 2017, the potential pro-growth policy impacts anticipated from the Trump administrationhelped support equity gains, while expected changes to U.S. tax law helped stocks rally toward period end. As the U.S. Congressworked on reforming the individual and corporate tax codes – eventually passing a bill in late December – investors considered thepossible effects to companies’ earnings as a result of lower tax rates.
The period was not without its challenges, though, as U.S. political and economic concerns, geopolitical tensions, and naturaldisasters arose as market headwinds during the year. In March and again in September, Congress failed to pass a health care planto replace the Affordable Care Act, raising questions with respect to the new administration’s ability to achieve its other pro-growthpolicy goals. Pockets of anxiety regarding the health of the U.S. economy also briefly appeared, as did a sense of increasedgeopolitical uncertainty that was due, in part, to an escalation in provocative rhetoric and actions involving the North Koreangovernment. In addition, in August and September, two hurricanes – Harvey and Irma – made landfall in the U.S., temporarilydisrupting activity throughout the economy. Despite these events, however, market volatility stayed relatively low for most of theperiod, with market price declines, in particular, being less sustained and severe than in recent years’ past, as investors remainedfocused on news conveying strong economic and business growth both in the U.S. and abroad.
Starting the year at a period low of 2,238, the S&P 500 Index staged a series of uneven climbs through the first seven months ofthe year before achieving more consistent gains starting in late summer. During the period, U.S. equities entered the ninth year oftheir current bull market run, while the S&P 500 Index set over 60 closing price highs – including a new record of 2,690 onDecember 18th – before finishing the year at 2,673. In addition, the S&P 500 Index marked another record in 2017, for the firsttime in its history notching gains in each of the year’s 12 months.
The 12-month total return for the Index was 21.83%. The total return for the period reflected an increase in corporate earnings pershare for the S&P 500 Index companies of approximately 17.0%, an expansion of the price/earnings valuation of the S&P 500Index of approximately 3.0%, and a dividend return of approximately 1.8%. Within the broad U.S. equities market rally, growthgenerally outperformed value. The S&P 500 Growth Index returned 27.44% versus 15.36% from the S&P 500 Value Index due, inpart, to the market’s view that growth-oriented companies were generally better positioned to benefit from the expanding economyrelative to their value-oriented peers.
In currency markets, the U.S. dollar decreased by approximately 12%, 9% and 4% versus the euro, British pound and Japaneseyen, respectively, as the period’s global economic growth helped bolster foreign currencies relative to the dollar. Meanwhile, thatweaker dollar and synchronized global growth supported a general increase in commodity prices. Oil began 2017 at around $54per barrel and ranged between approximately $42 to $60/barrel, where it settled at year end for a period increase of approximately12%. Beginning the year at $1,150 per troy ounce, gold traded between approximately $1,147 and $1,356/oz. before endingDecember 2017 at around $1,306/oz., an increase of approximately 14%.
Among major indices, the Bloomberg Barclays U.S. Aggregate Bond Index (the “Aggregate Bond Index”) recorded a total return of3.54%. For the year ended December 31, 2017, the major components of the Aggregate Bond Index all experienced positivereturns, led by the 6.42% gain from corporate bonds and followed by the 4.18%, 2.51%, and 2.31% total returns provided by
32

government-related issuances, securitized credit, and U.S. Treasuries, respectively. Within corporate bonds, utility securitiesfinished ahead of industrial and financial institution bonds, returning 7.59%, 6.71% and 5.60%, respectively.
From a maturity perspective, longer-term corporate bonds generally outperformed all other corporate maturities in the AggregateBond Index. The total return on 20+ year corporate bonds finished the year at 12.75%, compared to 6.07% for 7-10 yearissuances, 3.28% for 3-5 year bonds, and 1.85% on 1-3 year maturities. The results were similar for U.S. Treasuries within theAggregate Bond Index. While 20+ year U.S. Treasuries led with a return of 8.98%, 7-10 year U.S. Treasuries gained 2.55%, 3-5year issuances returned 0.99%, and 1-3 year U.S. Treasuries delivered a 0.42% total return. From a credit standpoint, within theAggregate Bond Index lower quality generally outperformed higher quality for the 12-month period. Baa-rated bonds posted a7.45% gain while A-, Aa- and Aaa-rated issuances finished with 5.98%, 4.23% and 2.41% total returns, respectively. Results weresomewhat different among corporate bonds within the Aggregate Bond Index. While Aaa-rated bonds returned 8.03%, Baa-, A- andAa-rated bonds finished with 7.09%, 5.95% and 4.63% total returns, respectively.
Meanwhile, the U.S. Treasury yield curve flattened over the course of the year as shorter-term (3-month and 2-year) yields roseconsiderably and long-term (10-year) yields ended lower. Beginning the period at 0.51%, 3-month U.S. Treasury yields remainedrelatively stable through February, ranging between 0.50% and 0.55%. Those yields increased almost 0.20% within the first weekof March alone, however, when better-than-expected economic news raised investors’ expectations for more Federal Reserve(“Fed”) rate hikes in 2017. As the Fed further tightened its monetary policy – executing its first (March) and second (June) rateincreases during the period, beginning to normalize its balance sheet in October, and implementing its third rate increase inDecember – yields on 3-month Treasuries navigated a gradual ascent through year end. Three-month yields reached a period highof 1.47% in late December before finishing December at 1.39%. Following a somewhat similar path during 2017, 2-year Treasuryyields began January at 1.20%, increased in early March, and subsequently traded between 1.18% - 1.40% through late summer.Two-year yields then steadily rose through year end, reaching a period high of 1.92% in late December before eventually settlingat 1.89%.
While positive economic news and the Fed’s activities helped drive the increase in shorter-maturity Treasury yields, a continuationof soft inflation and robust market demand weighed on long-term yields. Beginning January 2017 at 2.45%, 10-year Treasuryyields reached a period high of 2.62% in early March before subsequently tracking generally downward through early September,reaching a low of 2.05% before rebounding through year end to close at 2.40%. While most economic data promoted higher long-term yields–and the Fed’s effort to normalize its balance sheet provided similar support–that upward pressure was moderated by alow inflationary environment that persisted throughout the period. In addition, long-term yields were weakened by investors’continued strong demand. While some unwinding of quantitative easing measures began during the year, foreign central banksgenerally continued to maintain their respective monetary stimulus programs. As a result, global bond yields remained low,compelling fixed income investors to seek out the relatively higher returns found in U.S. Treasuries, thereby exerting downwardpressure on their yields.1
1 Source: Barclays Live.
33

Provide an illustration of the Fund’s investments.
Fund Composition*
State Farm Mutual Fund TrustBond Fund, 40.33%
Cash and Other Assets, Net of Liabilities, 1.28%
State Farm Mutual Fund TrustEquity Fund, 58.39%
* Illustrated by Type of Security and based on total net assets as of December 31, 2017. Please refer to theSchedule of Investments later in this report for details concerning Fund holdings.
34
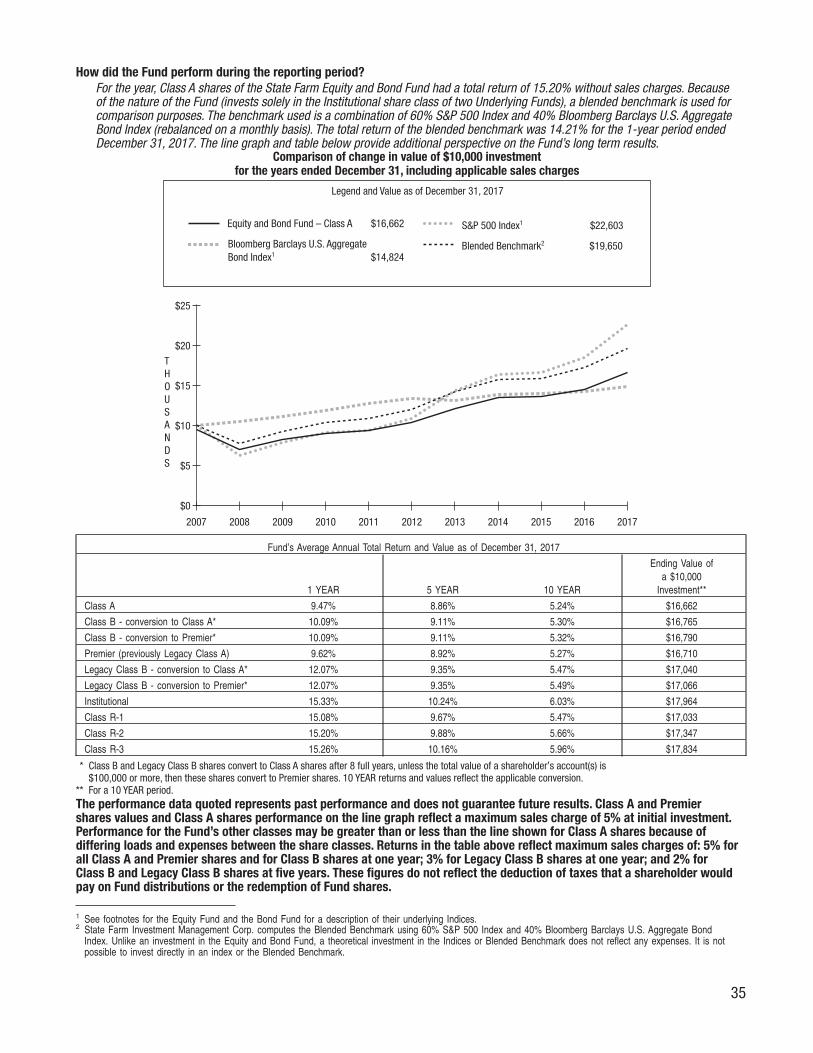
How did the Fund perform during the reporting period?For the year, Class A shares of the State Farm Equity and Bond Fund had a total return of 15.20% without sales charges. Becauseof the nature of the Fund (invests solely in the Institutional share class of two Underlying Funds), a blended benchmark is used forcomparison purposes. The benchmark used is a combination of 60% S&P 500 Index and 40% Bloomberg Barclays U.S. AggregateBond Index (rebalanced on a monthly basis). The total return of the blended benchmark was 14.21% for the 1-year period endedDecember 31, 2017. The line graph and table below provide additional perspective on the Fund’s long term results.
Comparison of change in value of $10,000 investmentfor the years ended December 31, including applicable sales charges
THOUSANDS
$0
$5
$10
$25
$20
$15
Legend and Value as of December 31, 2017
Bloomberg Barclays U.S. Aggregate Bond Index1 $14,824
S&P 500 Index1 $22,603Equity and Bond Fund – Class A $16,662
Blended Benchmark2 $19,650
2007 2008 2009 2010 2011 2012 2013 2014 2015 20172016
Fund’s Average Annual Total Return and Value as of December 31, 2017
1 YEAR 5 YEAR 10 YEAR
Ending Value ofa $10,000
Investment**
Class A 9.47% 8.86% 5.24% $16,662
Class B - conversion to Class A* 10.09% 9.11% 5.30% $16,765
Class B - conversion to Premier* 10.09% 9.11% 5.32% $16,790
Premier (previously Legacy Class A) 9.62% 8.92% 5.27% $16,710
Legacy Class B - conversion to Class A* 12.07% 9.35% 5.47% $17,040
Legacy Class B - conversion to Premier* 12.07% 9.35% 5.49% $17,066
Institutional 15.33% 10.24% 6.03% $17,964
Class R-1 15.08% 9.67% 5.47% $17,033
Class R-2 15.20% 9.88% 5.66% $17,347
Class R-3 15.26% 10.16% 5.96% $17,834
* Class B and Legacy Class B shares convert to Class A shares after 8 full years, unless the total value of a shareholder’s account(s) is$100,000 or more, then these shares convert to Premier shares. 10 YEAR returns and values reflect the applicable conversion.
** For a 10 YEAR period.The performance data quoted represents past performance and does not guarantee future results. Class A and Premiershares values and Class A shares performance on the line graph reflect a maximum sales charge of 5% at initial investment.Performance for the Fund’s other classes may be greater than or less than the line shown for Class A shares because ofdiffering loads and expenses between the share classes. Returns in the table above reflect maximum sales charges of: 5% forall Class A and Premier shares and for Class B shares at one year; 3% for Legacy Class B shares at one year; and 2% forClass B and Legacy Class B shares at five years. These figures do not reflect the deduction of taxes that a shareholder wouldpay on Fund distributions or the redemption of Fund shares.
1 See footnotes for the Equity Fund and the Bond Fund for a description of their underlying Indices.2 State Farm Investment Management Corp. computes the Blended Benchmark using 60% S&P 500 Index and 40% Bloomberg Barclays U.S. Aggregate Bond
Index. Unlike an investment in the Equity and Bond Fund, a theoretical investment in the Indices or Blended Benchmark does not reflect any expenses. It is notpossible to invest directly in an index or the Blended Benchmark.
35

Performance AnalysisWhat factors helped and hindered performance during the reporting period?
As discussed above, the Equity and Bond Fund invests solely in the Institutional share class of the Underlying Funds – the EquityFund and the Bond Fund. Generally, the Equity and Bond Fund attempts to maintain approximately 60% of its net assets in sharesof the Equity Fund and approximately 40% of its net assets in shares of the Bond Fund. For the year, Institutional shares of theEquity Fund and the Bond Fund returned 23.94% and 2.92% after expenses, respectively.
Equity portion of the Fund (approximately 60% throughout the period)The Equity Fund is sub-advised by Bridgeway Capital Management, Inc. (“Bridgeway”) and Westwood Management Corp.(“Westwood”). Bridgeway and Westwood each manage approximately one-half of the Equity Fund’s assets. State Farm InvestmentManagement Corp. monitors the performance of the sub-advisers and the split of the Equity Fund’s portfolio between the sub-advisers. The benchmark for the Equity Fund is the S&P 500 Index.
The Equity Fund seeks long-term growth of capital. In doing so, the Equity Fund invests primarily in large capitalization stockissued by U.S. companies. Bridgeway defines “large stocks” as the largest 1,000 U.S. companies as measured by marketcapitalization (stock market worth). Westwood defines large capitalization companies as those companies with marketcapitalizations generally greater than $5 billion at the time of purchase. Bridgeway selects stocks using its proprietary, quantitativeinvestment models to identify stocks within the large-cap growth category for the Equity Fund. Growth stocks are those thatBridgeway believes have above average prospects for economic growth. Westwood invests in a portfolio of seasoned companiesutilizing a value style of investing in which it chooses those stocks that Westwood believes have earnings prospects that arecurrently undervalued by the market relative to some financial measure of worth, such as the ratio of price to earnings, price tosales or price to cash flow. Westwood defines seasoned companies as those that generally have been operating for at least threeyears.
During the year, Bridgeway and Westwood generated portfolio returns (before fees and expenses) of 28.19% and 21.84,respectively, compared to a 21.83% return for the S&P 500 Index. Below are discussions concerning the individual investmentsmade by Bridgeway and Westwood during the course of the reporting period.
Bridgeway Capital Management, Inc. (51.23% of the Equity Fund’s total investments)The tables below show the securities that were the leading contributors and detractors to Bridgeway’s performance during theyear, as well as a recap of the top 10 holdings within Bridgeway’s portion of the Equity Fund.
The following five holdings represented the largest contributors to Bridgeway’s performance during the year, during which timeAlign Technology posted a triple-digit return while the remaining holdings generated double-digit gains.
Bridgeway - Top 5 Contributiors
Security Sector
% of Bridgeway’sTotal Investmentsas of 12/31/2017
NVIDIA Corp. Information Technology 2.2%
Align Technology Inc. Health Care 2.3%
Amazon.com Inc. Consumer Discretionary 1.6%
Lam Research Corp. Information Technology 2.1%
United Rentals Inc. Industrials 1.9%
The largest detractors to Bridgeway’s performance were the following five holdings, with each returning a double-digit loss duringthe period.
Bridgeway - Top 5 Detractors
Security Sector
% of Bridgeway’sTotal Investmentsas of 12/31/2017
AutoZone Inc.* Consumer Discretionary sold
Viacom Inc. Class B Consumer Discretionary 0.6%
Akamai Technologies Inc.* Information Technology sold
Ulta Beauty Inc. Consumer Discretionary 1.5%
QUALCOMM Inc.* Information Technology sold
*Sold prior to 12/31/2017. Total return loss referenced is from 1/1/2017 to date sold.
36

Align Technology Inc., the largest holding within Bridgeway’s portion of the Equity Fund, posted a triple-digit total return for theperiod. Among the remaining top ten holdings, all nine delivered double-digit gains.
Bridgeway - Top 10 Holdings
Security Sector
% of Bridgeway’sTotal Investmentsas of 12/31/2017
Align Technology Inc. Health Care 2.3%
NVIDIA Corp. Information Technology 2.2%
Lam Research Corp. Information Technology 2.1%
Micron Technology Inc. Information Technology 2.0%
United Rentals Inc. Industrials 1.9%
Applied Materials Inc. Information Technology 1.9%
Cadence Design Systems Inc. Information Technology 1.8%
Apple Inc. Information Technology 1.8%
Boeing Co., The Industrials 1.8%
Texas Instruments Inc. Information Technology 1.7%
Westwood Management Corp. (48.77% of the Equity Fund’s total investments)The tables below show the securities that were the leading contributors and detractors to Westwood’s performance during theyear, as well as a recap of the top 10 holdings within Westwood’s portion of the Equity Fund.
The largest contributors to Westwood’s performance during the year were the following five holdings, with each posting double-digit gains during the period.
Westwood - Top 5 Contributors
Security Sector
% of Westwood’sTotal Investmentsas of 12/31/2017
Boeing Co., The Industrials 2.0%
Bank of America Corp. Financials 3.9%
Abbott Laboratories Health Care 2.2%
Cigna Corp. Health Care 1.9%
Sherwin-Williams Co., The Materials 1.8%
The following five holdings represented the largest detractors to Westwood’s performance during the year, with HalliburtonCompany posting a double-digit loss and the remaining holdings delivering single-digit losses.
Westwood - Top 5 Detractors
Security Sector
% of Westwood’sTotal Investmentsas of 12/31/2017
Halliburton Co. Energy 1.5%
AT&T Inc. Telecommunication Services 3.3%
Exxon Mobil Corp.* Energy sold
CVS Health Corp. Consumer Staples 1.5%
American International Group Inc.* Financials sold
*Sold prior to 12/31/2017. Total return loss referenced is from 1/1/2017 to date sold.
37

Eight of the top 10 largest holdings within Westwood’s portion of the Equity Fund recorded double-digit gains for the period, whileEOG Resources posted a single-digit return and AT&T delivered a single-digit loss.
Westwood - Top 10 Holdings
Security Sector
% of Westwood’sTotal Investmentsas of 12/31/2017
Bank of America Corp. Financials 3.9%
JPMorgan Chase & Co. Financials 3.7%
Johnson & Johnson Health Care 3.5%
AT&T Inc. Telecommunication Services 3.3%
Becton, Dickinson and Co. Health Care 3.2%
Union Pacific Corp. Industrials 2.4%
Home Depot Inc., The Consumer Discretionary 2.3%
EOG Resources Inc. Energy 2.2%
Chevron Corp. Energy 2.2%
Abbott Laboratories Health Care 2.2%
Fixed Income portion of the Fund (approximately 40% throughout the period)State Farm Investment Management Corp. manages the Bond Fund in a manner that seeks to realize over a period of years thehighest yield consistent with investing in investment grade bonds. In managing the Bond Fund, we generally are buy-and-holdinvestors who focus primarily on U.S. Government obligations, government agency securities, and high quality corporate bonds.
The Bond Fund produced a positive total return for the 1-year period ended December 31, 2017, as all security types within itsportfolio generated gains. The greatest contribution to the Bond Fund’s performance during the year came from its corporate bondscomponent. This was a result of a positive mid-single digit total return and corporate bonds accounting for the largest security typeweighting within the Bond Fund. However, the impact of fund expenses, as well as differences in maturity structure between theBond Fund and its benchmark, the Aggregate Bond Index, resulted in the Bond Fund underperforming the index.
During the period, the Bond Fund held a higher allocation of intermediate maturities relative to its benchmark, while the AggregateBond Index had a greater weight in longer maturities than the Bond Fund. Longer maturities generally outperformed intermediatematurities during the year, helping lead to the Bond Fund’s underperformance relative to the Aggregate Bond Index.
The option-adjusted duration of the Bond Fund stood at approximately 5.06 years at the end of 2017, down from 5.09 years at thebeginning of the year. The Bond Fund’s duration was lower than the 5.98 duration of its benchmark (the Aggregate Bond Index) atthe end of the period. Duration is a statistical calculation that measures a bond’s (or in this case, a bond fund’s) price sensitivityrelative to general movements in interest rates. Option-adjusted duration attempts to incorporate prepayment possibilities into theduration statistic. As interest rates rise, prepayments typically decrease as borrowers typically do not refinance their bonds athigher rates.
Financial highlights for this Fund can be found on pages 206-207.
38

State Farm Bond Fund Management’s Discussion of Fund Performance (unaudited)
OverviewDescribe the Fund’s investment objective and philosophy.
State Farm Investment Management Corp. manages the State Farm Bond Fund (the “Fund”) in a manner that seeks to realize overa period of years the highest yield consistent with investing in investment grade bonds. In managing the Fund, we generally arebuy-and-hold investors who focus primarily on U.S. Government obligations, government agency securities, and high qualitycorporate bonds.
Describe the relevant market environment as it related to the Fund for the reporting period.Signs of an accelerating U.S. economy, as well as investor optimism over potential pro-growth Trump policies, greeted U.S. fixedincome markets at the beginning of the fiscal year. Toward period end, investors were considering the possible effects on the fixedincome markets from U.S. tax law changes that were ultimately enacted in late December. In-between, markets were influencedby continuing trends of generally subdued inflation, positive employment data, and accommodative global central bank policy. Inaddition, during the fiscal year the world’s economies entered a period of synchronized growth, which included U.S. GrossDomestic Product rising more than 3% in both the second (April – June) and third (July – September) quarters.
Pockets of anxiety regarding the health of the U.S. economy briefly appeared, however, as did a sense of increased geopoliticaluncertainty that was due, in part, to an escalation in provocative rhetoric and actions involving the North Korean government. InAugust and September, two hurricanes – Harvey and Irma – made landfall in the U.S., temporarily disrupting activity throughoutthe economy. In addition, Congress’ failure to pass a health care plan to replace the Affordable Care Act – first in March and thenagain in September – raised questions with respect to the new administration’s ability to achieve its other pro-growth policy goals.Despite these events, investors mostly remained focused on news conveying strong economic and business growth both in theU.S. and abroad.
As the Federal Reserve (“Fed”) further tightened its monetary policy during the year – executing its first (March) and second (June)rate increases during the period, beginning to normalize its balance sheet in October, and implementing its third rate increase inDecember to a target range of 1.25% – 1.50%, yields on shorter-maturity bonds generally rose. While positive economic news andthe Fed’s activities helped drive this increase, a continuation of soft inflation and robust market demand weighed on long-termyields. While most economic data promoted higher long-term yields — and the Fed’s effort to normalize its balance sheet providedsimilar support — that upward pressure was moderated by a low inflationary environment that persisted throughout the period. Inaddition, long-term yields were weakened by investors’ continued strong demand. While some unwinding of quantitative easingmeasures began during the year, foreign central banks generally continued to maintain their respective monetary stimulusprograms. As a result, global bond yields remained low, compelling fixed income investors to seek out the relatively higher returnsfound in U.S. fixed income markets, thereby exerting downward pressure on their yields.
Among major indices, the Bloomberg Barclays U.S. Aggregate Bond Index (the “Index”) recorded a total return of 3.54%. For theyear ended December 31, 2017, the major components of the Index all experienced positive returns, led by the 6.42% gain fromcorporate bonds and followed by the 4.18%, 2.51%, and 2.31% total returns provided by government-related issuances,securitized credit, and U.S. Treasuries, respectively. Within corporate bonds, utility securities finished ahead of industrial andfinancial institution bonds, returning 7.59%, 6.71% and 5.60%, respectively.
From a maturity perspective, longer-term corporate bonds generally outperformed all other corporate maturities in the Index. Thetotal return on 20+ year corporate bonds finished the year at 12.75%, compared to 6.07% for 7-10 year issuances, 3.28% for 3-5year bonds, and 1.85% on 1-3 year maturities. The results were similar for U.S. Treasuries within the Index. While 20+ year U.S.Treasuries led with a return of 8.98%, 7-10 year U.S. Treasuries gained 2.55%, 3-5 year issuances returned 0.99%, and 1-3 yearU.S. Treasuries delivered a 0.42% total return. From a credit standpoint, within the Index lower quality generally outperformedhigher quality for the 12-month period. Baa-rated bonds posted a 7.45% gain while A-, Aa- and Aaa-rated issuances finished with5.98%, 4.23% and 2.41% total returns, respectively. Results were somewhat different among corporate bonds within the Index.While Aaa-rated bonds returned 8.03%, Baa-, A- and Aa-rated bonds finished with 7.09%, 5.95%, and 4.63% total returns,respectively.
39
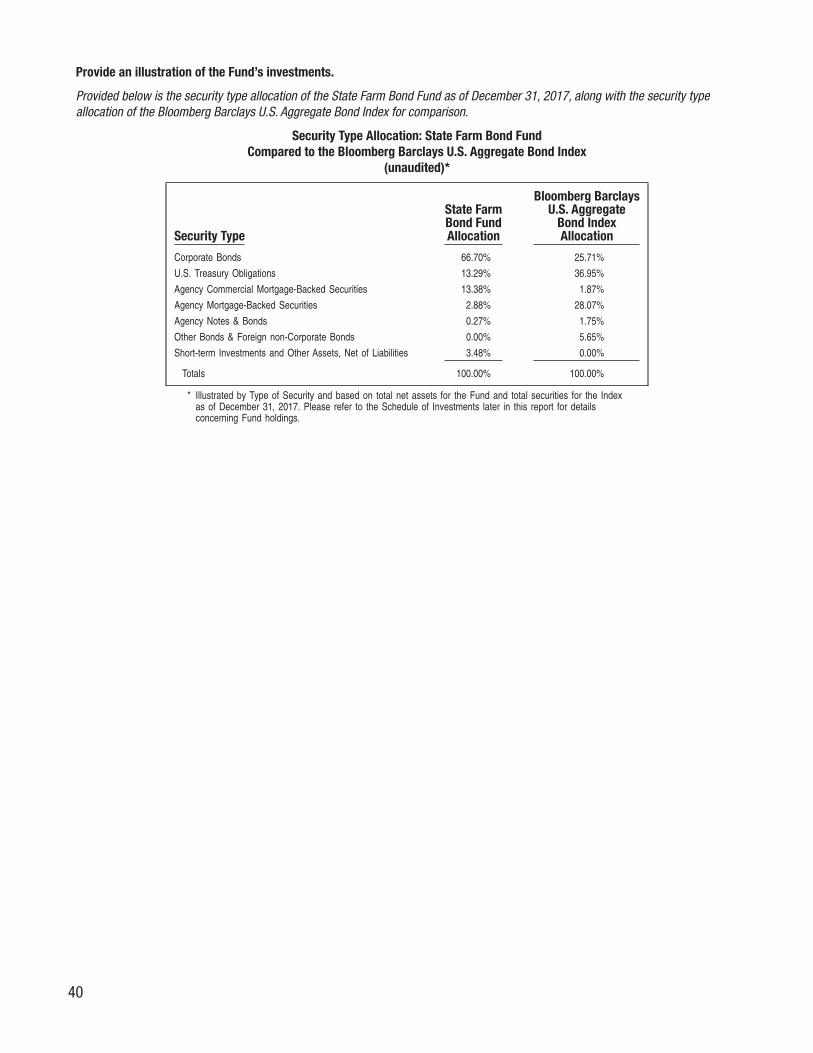
Provide an illustration of the Fund’s investments.
Provided below is the security type allocation of the State Farm Bond Fund as of December 31, 2017, along with the security typeallocation of the Bloomberg Barclays U.S. Aggregate Bond Index for comparison.
Security Type Allocation: State Farm Bond FundCompared to the Bloomberg Barclays U.S. Aggregate Bond Index
(unaudited)*
Security Type
State FarmBond FundAllocation
Bloomberg BarclaysU.S. Aggregate
Bond IndexAllocation
Corporate Bonds 66.70% 25.71%
U.S. Treasury Obligations 13.29% 36.95%
Agency Commercial Mortgage-Backed Securities 13.38% 1.87%
Agency Mortgage-Backed Securities 2.88% 28.07%
Agency Notes & Bonds 0.27% 1.75%
Other Bonds & Foreign non-Corporate Bonds 0.00% 5.65%
Short-term Investments and Other Assets, Net of Liabilities 3.48% 0.00%
Totals 100.00% 100.00%
* Illustrated by Type of Security and based on total net assets for the Fund and total securities for the Indexas of December 31, 2017. Please refer to the Schedule of Investments later in this report for detailsconcerning Fund holdings.
40

How did the Fund perform during the reporting period?For the 1-year period ended December 31, 2017, Class A shares of the State Farm Bond Fund had a total return of 2.86% withoutsales charges, compared to a total return of 3.54% for the Bloomberg Barclays U.S. Aggregate Bond Index. The line graph andtable below provide additional perspective on the Fund’s long term results.
Comparison of change in value of $10,000 investmentfor the years ended December 31, including applicable sales charges
THOUSANDS
$0
$5
$10
$15
$20
Legend and Value as of December 31, 2017
Bloomberg Barclays U.S. Aggregate Bond Index1 $14,824
Bond Fund – Class A $14,022
2007 2008 2009 2010 2011 2012 2013 2014 2015 20172016
Fund’s Average Annual Total Return and Value as of December 31, 2017
1 YEAR 5 YEAR 10 YEAR
Ending Value ofa $10,000
Investment**
Class A -0.26% 1.05% 3.44% $14,022
Class B - conversion to Class A* -0.24% 0.91% 3.44% $14,031
Class B - conversion to Premier* -0.24% 0.91% 3.45% $14,041
Premier (previously Legacy Class A) -0.25% 1.06% 3.45% $14,032
Legacy Class B - conversion to Class A* -0.24% 0.91% 3.45% $14,042
Legacy Class B - conversion to Premier* -0.24% 0.91% 3.46% $14,052
Institutional 2.92% 1.85% 4.00% $14,799
Class R-1 2.72% 1.37% 3.45% $14,035
Class R-2 2.68% 1.52% 3.63% $14,285
Class R-3 2.85% 1.78% 3.93% $14,697
* Class B and Legacy Class B shares convert to Class A shares after 8 full years, unless the total value of a shareholder’s account(s) is$100,000 or more, then these shares convert to Premier shares. 10 YEAR returns and values reflect the applicable conversion.
** For a 10 YEAR period.The performance data quoted represents past performance and does not guarantee future results. Class A and Premiershares values and Class A shares performance on the line graph reflect a maximum sales charge of 3% at initial investment.Performance for the Fund’s other classes may be greater than or less than the line shown for Class A shares because ofdiffering loads and expenses between the share classes. Returns in the table above reflect maximum sales charges of: 3% forall Class A and Premier shares and for Class B and Legacy Class B shares at one year; and 2% for Class B and Legacy Class Bshares at five years. These figures do not reflect the deduction of taxes that a shareholder would pay on Fund distributions orthe redemption of Fund shares.
1 The Bloomberg Barclays U.S. Aggregate Bond Index represents debt securities in the U.S. investment grade fixed rate taxable bond market, including governmentand corporate debt securities, mortgage pass-through debt securities and asset-backed debt securities with maturities greater than one year. Unlike an investmentin the Bond Fund, a theoretical investment in the Index does not reflect any expenses. It is not possible to invest directly in an index.
41

Performance AnalysisWhat factors helped and hindered performance during the reporting period?
The Fund produced a positive total return for the 1-year period ended December 31, 2017, as all security types within the Fundgenerated gains. The greatest contribution to Fund performance during the year came from the Fund’s corporate bondscomponent, and was the result of a positive mid-single digit total return and corporate bonds accounting for the largest securitytype weighting within the Fund. However, the impact of fund expenses, as well as differences in maturity structure between theFund and its benchmark, the Bloomberg Barclays U.S. Aggregate Bond Index, resulted in the Fund underperforming the Index.
During the period, the Fund held a higher allocation of intermediate maturities relative to the Index, while the Index had a greaterweight in longer maturities than the Fund. Longer maturities generally outperformed intermediate maturities during the year,helping lead to the Fund’s underperformance relative to the Index.
The option-adjusted duration of the Fund stood at approximately 5.06 years at the end of 2017, down from 5.09 years at thebeginning of the year. The Fund’s duration was lower than the 5.98 duration of its benchmark (the Bloomberg Barclays U.S.Aggregate Bond Index) at the end of the period. Duration is a statistical calculation that measures a bond’s (or in this case, a bondfund’s) price sensitivity relative to general movements in interest rates. Option-adjusted duration attempts to incorporateprepayment possibilities into the duration statistic. As interest rates rise, prepayments typically decrease as borrowers typically donot refinance their bonds at higher rates.
Financial highlights for this Fund can be found on pages 208-209.
42

State Farm Tax Advantaged Bond Fund Management’s Discussion of Fund Performance (unaudited)
OverviewDescribe the Fund’s investment objective and philosophy.
The State Farm Tax Advantaged Bond Fund (the “Fund”) seeks as high a rate of income exempt from federal income taxes as isconsistent with prudent investment management. Income may be subject to state and local taxes and, if applicable, the AlternativeMinimum Tax. In managing the Fund, we focus on high credit quality bonds with an investment philosophy that seeks to providecompetitive total returns, while managing for federal income tax efficiency within the municipal bond asset class over the long run.
The municipal bond market, while relatively small in total assets compared to the taxable bond market, is very broad by number ofissuers. As a result, we believe that fundamental research and professional management is critical to success in this asset class.While we diversify the maturity spectrum of the bonds within the portfolio, we tend to favor the intermediate maturity range(currently maturities of 10-17 years) for the bulk of the Fund’s assets. The Fund also seeks to remain invested mainly in assets ofhigh credit quality in an attempt to reduce the risk of loss to investment principal as a result of credit losses.
While we are conscious of how the Fund’s portfolio differs from its broad-based benchmark, the Bloomberg Barclays MunicipalBond Index (the “Index”), we do not make decisions based upon the Index.
Describe the relevant market environment as it related to the Fund for the reporting period.Signs of an accelerating U.S. economy, as well as investor optimism over potential pro-growth Trump policies, greeted U.S. fixedincome markets at the beginning of the fiscal year. Subsequently, throughout the 1-year period, the markets were influenced bycontinuing trends of generally subdued inflation, positive employment data, and accommodative global central bank policy. Inaddition, during the fiscal year the world’s economies entered a period of synchronized growth, which included U.S. GrossDomestic Product rising more than 3% in both the second (April – June) and third (July – September) quarters.
Pockets of anxiety regarding the health of the U.S. economy briefly appeared, however, as did a sense of increased geopoliticaluncertainty that was due, in part, to an escalation in provocative rhetoric and actions involving the North Korean government. InAugust and September, two hurricanes – Harvey and Irma – made landfall in the U.S., temporarily disrupting activity throughoutthe economy. In addition, Congress’ failure to pass a health care plan to replace the Affordable Care Act – first in March and thenagain in September – raised questions with respect to the new administration’s ability to achieve its other pro-growth policy goals.Despite these events, investors mostly remained focused on news conveying strong economic and business growth both in theU.S. and abroad.
As the Federal Reserve (“Fed”) further tightened its monetary policy during the year – executing its first (March) and second (June)rate increases during the period, beginning to normalize its balance sheet in October, and implementing its third rate increase inDecember to a target range of 1.25% – 1.50%, yields on shorter-maturity bonds generally rose. While positive economic news andthe Fed’s activities helped drive this increase, a continuation of soft inflation and robust market demand weighed on long-termyields. While most economic data promoted higher long-term yields — and the Fed’s effort to normalize its balance sheet providedsimilar support — that upward pressure was moderated by a low inflationary environment that persisted throughout the period. Inaddition, long-term yields were weakened by investors’ continued strong demand. While some unwinding of quantitative easingmeasures began during the year, foreign central banks generally continued to maintain their respective monetary stimulusprograms. As a result, global bond yields remained low, compelling fixed income investors to seek out the relatively higher returnsfound in U.S. fixed income markets, thereby exerting downward pressure on their yields.
Finally, with the period winding down, potential changes to U.S. tax law weighed on municipal bond markets. As the U.S. Congressworked on reforming the individual and corporate tax codes – eventually passing a bill in late December – investors and issuersalike considered the possible impacts that lower tax rates may have on markets.
43

As illustrated in Table 1 below, the municipal bond yield curve flattened as short-maturity yields increased while intermediate- andlonger-maturity yields decreased over the 1-year period ended December 31, 2017.
Table 1: Municipal Market Data (MMD) Yields (%) – AAA-Rated General Obligation Municipal Bonds1
Date 1-Year 5-Year 10-Year 20-Year
January 1, 2017 0.97% 1.79% 2.31% 2.90%
December 31, 2017 1.41% 1.68% 1.98% 2.43%
Increase (Decrease) in Yield 0.44% (0.11%) (0.33%) (0.47%)
1 The Municipal Market Data AAA yield curve is indicative of AAA tax-exempt offered-side, institutional yield levels and may vary from actual yields attained.Source: © 2017 Lipper, a Thomson Reuters Company. Information provided by Lipper is not intended for trading purposes, nor do they provide any form ofadvice (investment, tax, legal) amounting to investment advice, or make any recommendations regarding particular financial instruments, investments orproducts. Neither Lipper nor its third party content providers shall be liable for any errors, inaccuracies, or for any actions taken in reliance thereon. LIPPEREXPRESSLY DISCLAIMS ALL WARRANTIES, EXPRESSED OR IMPLIED, AS TO THE ACCURACY OF THE INFORMATION, OR AS TO THE FITNESS OFTHE INFORMATION FOR ANY PURPOSE.
The Bloomberg Barclays Municipal Bond Index had a total return of 5.45% for the 1-year period ended December 31, 2017. Asillustrated in Table 2 below, annual total returns were positive across all segments of the Index, with higher returns coming alongthe longer-end of the maturity yield curve.
Table 2: Bloomberg Barclays Municipal Bond Index – Component Returns by Maturity2
MaturityAnnual Total Return
(as of December 31, 2017)
1-Year Municipal Bonds 0.92%
3-Year Municipal Bonds 1.56%
5-Year Municipal Bonds 3.14%
7-Year Municipal Bonds 4.49%
10-Year Municipal Bonds 5.83%
15-Year Municipal Bonds 6.94%
20-Year Municipal Bonds 7.47%
Long-Bond (22+ Year) Municipal Bonds 8.19%
2 Source: Barclays Live. Past performance does not guarantee future results. The data illustrated provides component annual total returns by municipal bondmaturities of the Bloomberg Barclays Municipal Bond Index.
From a total return standpoint over the reporting period, as illustrated in Table 3 below, the lower end of investment-grade qualitymunicipal bonds (Baa and A rated bonds) generally outperformed relative to higher investment-grade quality municipal bonds (Aaand Aaa rated bonds) within the Index.
Table 3: Bloomberg Barclays Municipal Bond Index - Annual Total Returns by Credit Quality Ratings3
Credit QualityAnnual Total Return
(as of December 31, 2017)
Aaa Rated Bonds 4.45%
Aa Rated Bonds 4.96%
A Rated Bonds 6.16%
Baa Rated Bonds 8.74%
3 Source: Barclays Live. Past performance does not guarantee future results. The data illustrated provides component annual total returns by credit qualityratings of the Bloomberg Barclays Municipal Bond Index.
At year’s end, the 2.43% yield on 20-year Aaa-rated municipal bonds was lower than the 2.58% yield offered on comparable 20-year taxable U.S. Treasuries, which is slightly above the historical norm for that yield spread relationship. Historically, long-termmunicipal bonds have offered approximately 75% to 90% of the yields available on comparable U.S. Treasuries because of theincome tax benefits associated with municipal bonds. However, that dynamic has shifted in recent years due, in part, to the Fed’smonetary stimulus programs.
This yield comparison has been typically used as a general gauge within the industry to determine the relative attractiveness ofmunicipal securities.
44

Provide an illustration of the Fund’s investments.
Provided below is the maturity allocation of the Tax Advantaged Bond Fund as of December 31, 2017, along with the maturityallocation of the Bloomberg Barclays Municipal Bond Index for comparison.
Maturity Allocation: State Farm Tax Advantaged Bond Fundcompared to the Bloomberg Barclays Municipal Bond Index (unaudited)*
Maturity Range
State FarmTax Advantaged Bond Fund
Allocation
Bloomberg BarclaysMunicipal Bond Index
Allocation
0-6 Years 25.66%** 27.70%
6-12 Years 39.46% 24.03%
12-22 Years 34.88% 29.26%
22+ Years 0.00% 19.01%
Totals 100.00% 100.00%
*Illustrated by Maturity and based on total investments for the Fund and total securities for the Index as ofDecember 31, 2017. Please refer to the Schedule of Investments later in this report for details concerningFund holdings.
**Includes a 0.39% allocation to the JPMorgan U.S. Government Money Market Fund Capital Shares.
45

How did the Fund perform during the reporting period?For the year, Class A shares for the State Farm Tax Advantaged Bond Fund had a total return of 3.69% without sales charges. Thisis compared to a 5.45% return for the Bloomberg Barclays Municipal Bond Index over the same timeframe. The line graph andtable below provide additional perspective on the Fund’s long term results.
Comparison of change in value of $10,000 investmentfor the years ended December 31, including applicable sales charges
THOUSANDS
$0
$5
$10
$15
$20
Legend and Value as of December 31, 2017
Bloomberg Barclays Municipal Bond Index1 $15,458
Tax Advantaged BondFund – Class A $14,415
2007 2008 2009 2010 2011 2012 2013 2014 2015 20172016
Fund’s Average Annual Total Return and Value as of December 31, 2017
1 YEAR 5 YEAR 10 YEAR
Ending Value ofa $10,000
Investment**
Class A 0.59% 1.73% 3.72% $14,415
Class B - conversion to Class A* 0.58% 1.62% 3.72% $14,413
Class B - conversion to Premier* 0.58% 1.62% 3.75% $14,451
Premier (previously Legacy Class A) 0.72% 1.78% 3.75% $14,456
Legacy Class B - conversion to Class A* 0.58% 1.65% 3.72% $14,415
Legacy Class B - conversion to Premier* 0.58% 1.65% 3.75% $14,452
* Class B and Legacy Class B shares convert to Class A shares after 8 full years, unless the total value of a shareholder’s account(s) is$100,000 or more, then these shares convert to Premier shares. 10 YEAR returns and values reflect the applicable conversion.
** For a 10 YEAR period.The performance data quoted represents past performance and does not guarantee future results. Class A and Premiershares values and Class A shares performance on the line graph reflect a maximum sales charge of 3% at initial investment.Performance for the Fund’s other classes may be greater than or less than the line shown for Class A shares because ofdiffering loads and expenses between the share classes. Returns in the table above reflect maximum sales charges of: 3% forall Class A and Premier shares and for Class B and Legacy Class B shares at one year; and 2% for Class B and Legacy Class Bshares at five years. These figures do not reflect the deduction of taxes that a shareholder would pay on Fund distributions orthe redemption of Fund shares.
1 The Bloomberg Barclays Municipal Bond Index is an unmanaged index representative of the tax-exempt bond market and is made up of investment grademunicipal bonds issued after 12/31/90 having a remaining maturity of at least one year. Unlike an investment in the Tax Advantaged Bond Fund, a theoreticalinvestment in the Index does not reflect any expenses. It is not possible to invest directly in an index.
46

Performance AnalysisWhat factors helped and hindered performance during the reporting period?
The Fund produced a positive total return for the 1-year period. However, the impact of fund expenses, as well as the difference inmaturity structure and credit quality between the Fund and its benchmark, the Bloomberg Barclays Municipal Bond Index, played arole in the Fund underperforming the Index.
During the period, longer-maturity bonds generally outperformed relative to bonds having shorter maturities. The Fund’s greaterexposure than its benchmark to those bonds having maturities between 6-22 years supported the Fund’s relative performance.However, while the Index contained bonds with maturities over 22 years, the Fund did not have any such allocation, hindering itsrelative performance.
With respect to credit risk, as previously illustrated in Table 3 above, lower quality bonds (Baa and A) generally outperformedrelative to higher quality bonds (Aa and Aaa) during the period. Table 4 below shows the Fund’s credit quality orientation comparedto the Bloomberg Barclays Municipal Bond Index as of December 31, 2017. As illustrated in that table, the Fund held a smallerallocation than the Index in lower quality bonds, hindering the Fund’s relative performance. Throughout the reporting period, theFund maintained a high quality credit orientation consistent with the Fund’s historical investment philosophy.
Table 4: Credit Ratings Comparison (as of December 31, 2017)4
Credit Ratings
State FarmTax Advantaged Bond Fund
Allocation
Bloomberg BarclaysMunicipal Bond Index
Allocation
Aaa/AAA 16.10% 14.17%
Aa/AA 62.42% 53.55%
A 18.56% 24.66%
Baa/BBB or Lower 0.44% 7.62%
NR (Not Rated) 2.48%* 0.00%
Totals 100.00% 100.00%
4 Illustrated by Credit Quality and based on total investments for the Fund and total securities for the Index as of December 31, 2017. Reflects the lower ofMoody’s or Standard and Poor’s issuer specific ratings. The issuer specific ratings do not reflect any bond insurer ratings.
* Includes a 0.39% allocation to the JPMorgan U.S. Government Money Market Fund Capital Shares.
Throughout the reporting period, the Fund’s duration decreased from 4.55 years as of January 1, 2017, to 4.14 years as ofDecember 31, 2017. The Fund’s duration was lower than the 5.12 duration of its benchmark (the Bloomberg Barclays MunicipalBond Index) at the end of the period. Duration is a statistical calculation that measures a bond’s (or in this case, a bond fund’s)price sensitivity relative to general movements in interest rates. The objective of the Fund is to seek as high a rate of incomeexempt from income taxes as is consistent with prudent investment management. We seek to maintain the risk profile of the Fundwith respect to duration, interest rate risk, and credit risk. The Fund has been invested with a bias towards high credit quality,intermediate maturity bonds. Adopting additional risk by increasing duration significantly and/or increasing the weighting in lowercredit quality bonds would not have been consistent with the Fund’s historical investment philosophy.
The number of individual bonds held in the portfolio decreased over the reporting period from 349 to 304. Turnover for thereporting period was 0.80%. Investments within the State of Arizona represented the largest single allocation in any state,representing 8.40% of total net assets, which marked an increase from 8.23% at the beginning of the reporting period. The onlyaddition to the portfolio was an acquisition of a general obligation bond from Indiana. That bond’s rating quality was A1/A+. Thelargest net reduction of holdings occurred through sales of bonds in Kansas, Arizona, Ohio and Washington.
Financial highlights for this Fund can be found on pages 210-211.
47

State Farm Money Market Fund Management’s Discussion (unaudited)
OverviewDescribe the Fund’s investment objective and philosophy.The State Farm Money Market Fund (the “Fund”) seeks to maximize current income to the extent consistent with the preservation ofcapital and maintenance of liquidity. The Fund pursues this objective primarily by investing in:
• Debt securities issued or guaranteed by the U.S. government, or by U.S. government agencies or instrumentalities,• Cash, and• Repurchase agreements fully collateralized by U.S. Treasury and U.S. government securities.
It is managed by State Farm Investment Management Corp. (SFIMC).An investment in the Fund is not insured or guaranteed by theFederal Deposit Insurance Corporation or any other government agency. Although the Fund seeks to preserve the value ofyour investment at $1.00 per share, it is possible to lose money by investing in the Fund.
Provide an illustration of the Fund’s investments.
Fund Composition*
U.S. Government Obligations, 41.36%
Government Agency Securities, 58.26%
Registered Investment Companies andOther Assets, Net of Liabilities, 0.38%
* Illustrated by Type of Security and based on total net assets as of December 31, 2017. Please refer to theSchedule of Investments later in this report for details concerning Fund holdings.
Financial highlights for this Fund can be found on pages 212-213.
48

State Farm LifePath Funds Management’s Discussion of Fund Performance (unaudited)
OverviewDescribe the State Farm LifePath Funds investment objective and philosophy.
The State Farm LifePath Funds (“the LifePath Funds”) are organized under a “fund-of-funds” structure in which the LifePath Fundsinvest directly in equity (including real estate investment trusts) and bond exchange traded funds and a money market fund (the“LifePath Underlying Funds”) in proportion to each State Farm LifePath Funds’ own comprehensive investment strategy.References to the LifePath Funds are to the fund-of-funds structure, as the context requires, unless otherwise stated. BlackRockFund Advisors (“BlackRock”) is the investment sub-adviser for the LifePath Funds.
Each LifePath Fund seeks to provide for retirement outcomes based on quantitatively measured risk that investors on average maybe willing to accept given a particular investment time horizon. A LifePath Fund’s time horizon marks the point when the investorsplan to start making net withdrawals. Each LifePath Fund has its own time horizon, which affects the acceptable risk level of theLifePath Fund and, in turn, its asset allocation.
With the exception of the State Farm LifePath 2050 Fund not containing an allocation to the iShares TIPS Bond ETF, each LifePathFund invested in the same LifePath Underlying Funds but in differing proportions depending upon the time horizon and acceptablerisk level of the LifePath Fund.
Describe the relevant market environment as it related to the Fund for the reporting period.During 2017, U.S. equity and fixed income markets generated positive total returns, while international equities produced evenstronger results that were helped, in part, by a weakened U.S. dollar.
Synchronized growth across many of the world’s economies helped drive a resurgence in earnings for multinational companies,lifting business and investor confidence levels during the year. Other factors lending support to U.S. equity markets includedcontinuing trends of generally subdued inflation, accommodative global central bank policy, positive employment data, andincreases in U.S. Gross Domestic Product, including more than 3% growth in both the second (April – June) and third (July –September) quarters. In addition, early in 2017, the potential pro-growth policy impacts anticipated from the Trump administrationhelped support equity gains, while expected changes to U.S. tax law helped stocks rally toward period end. As the U.S. Congressworked on reforming the individual and corporate tax codes – eventually passing a bill in late December – investors considered thepossible effects to companies’ earnings as a result of lower tax rates.
The period was not without its challenges, though, as U.S. political and economic concerns, geopolitical tensions, and naturaldisasters arose as market headwinds during the year. In March and again in September, Congress failed to pass a health care planto replace the Affordable Care Act, raising questions with respect to the new administration’s ability to achieve its other pro-growthpolicy goals. Pockets of anxiety regarding the health of the U.S. economy also briefly appeared, as did a sense of increasedgeopolitical uncertainty that was due, in part, to an escalation in provocative rhetoric and actions involving the North Koreangovernment. In addition, in August and September, two hurricanes – Harvey and Irma – made landfall in the U.S., temporarilydisrupting activity throughout the economy. Despite these events, however, market volatility stayed relatively low for most of theperiod, with market price declines, in particular, being less sustained and severe than in recent years’ past, as investors remainedfocused on news conveying strong economic and business growth both in the U.S. and abroad.
Starting the year at a period low of 2,238, the S&P 500 Index staged a series of uneven climbs through the first seven months ofthe year before achieving more consistent gains starting in late summer. During the period, U.S. equities entered the ninth year oftheir current bull market run, while the S&P 500 Index set over 60 closing price highs – including a new record of 2,690 onDecember 18th – before finishing the year at 2,673. In addition, the S&P 500 Index marked another record in 2017, for the firsttime in its history notching gains in each of the year’s 12 months. The 12-month total return for the S&P 500 Index was 21.83%,reflecting an increase of approximately 17.0% in corporate earnings per share for the index companies, an expansion of theindex’s price/earnings valuation of approximately 3.0%, and a dividend return of approximately 1.8%.
LifePath is a registered trademark of BlackRock Institutional Trust Company, N.A.
49

Within the broad U.S. equities market rally, growth generally outperformed value, while large-cap company returns generallybettered those provided by small- and mid-cap businesses. The Russell 1000 Growth Index returned 30.21% versus 13.67% fromthe Russell 1000 Value Index due, in part, to the market’s view that growth-oriented companies were generally better positioned tobenefit from the expanding economy relative to their value-oriented peers. Similarly, supported by their greater exposure to theeconomic growth experienced around the world in 2017, large cap stocks (as represented by the Russell 1000 Index) generated a21.69% total return to lead both mid cap stocks (as represented by the Russell Midcap Index) and small cap stocks (asrepresented by the Russell 2000 Index), which posted gains of 18.52% and 14.65%, respectively.
International equity markets, as represented by the MSCI All Country World Index (ACWI) ex-U.S. IMI Index, the MSCI EAFE Free IMIIndex, and MSCI Emerging Markets IMI Index, returned 27.81%, 26.16% and 36.83%, respectively, as a weakened U.S. dollarhelped increase already-strong foreign market returns.1 Developed market country Austria paced international growth in 2017,rising 51.39%, while Poland led emerging market countries with a 53.56% return. Among developed nations, Israel lagged for thesecond consecutive year as the weakest performing market, ending with a 10.36% return, while Pakistan posted a –24.75%return to finish as the worst-performing emerging market in 2017. Japan, the largest country weighting in the MSCI EAFE Free IMIIndex, rose 25.25%.
In currency markets, the U.S. dollar decreased by approximately 12%, 9% and 4% versus the euro, British pound and Japaneseyen, respectively, as the period’s global economic growth helped bolster foreign currencies relative to the dollar. Meanwhile, thatweaker dollar and synchronized global growth supported a general increase in commodity prices and a 1.70% gain by theBloomberg Commodity Index.2Oil began 2017 at around $54 per barrel and ranged between approximately $42 to $60/barrel,where it settled at year end for a period increase of approximately 12%. Beginning the year at $1,150 per troy ounce, gold tradedbetween approximately $1,147 and $1,356/oz. before ending December 2017 at around $1,306/oz., an increase of approximately14%.
Among major indices, the Bloomberg Barclays U.S. Aggregate Bond Index (“Aggregate Bond Index”) recorded a total return of3.54%. For the year ended December 31, 2017, the major components of the Index all experienced positive returns, led by the6.42% gain from corporate bonds and followed by the 4.18%, 2.51%, and 2.31% total returns provided by government-relatedissuances, securitized credit, and U.S. Treasuries, respectively. Within corporate bonds, utility securities finished ahead of industrialand financial institution bonds, returning 7.59%, 6.71% and 5.60%, respectively.
From a maturity perspective, longer-term corporate bonds generally outperformed all other corporate maturities in the Index. Thetotal return on 20+ year corporate bonds finished the year at 12.75%, compared to 6.07% for 7-10 year issuances, 3.28% for 3-5year bonds, and 1.85% on 1-3 year maturities. The results were similar for U.S. Treasuries within the Index. While 20+ year U.S.Treasuries led with a return of 8.98%, 7-10 year U.S. Treasuries gained 2.55%, 3-5 year issuances returned 0.99%, and 1-3 yearU.S. Treasuries delivered a 0.42% total return. From a credit standpoint, within the Index lower quality generally outperformedhigher quality for the 12-month period. Baa-rated bonds posted a 7.45% gain while A-, Aa- and Aaa-rated issuances finished with5.98%, 4.23% and 2.41% total returns, respectively. Results were somewhat different among corporate bonds within the Index.While Aaa-rated bonds returned 8.03%, Baa-, A- and Aa-rated bonds finished with 7.09%, 5.95% and 4.63% total returns,respectively.3
1 The MSCI All Country World Index ex-U.S. Investable Market Index (ACWI ex-U.S. IMI Index) is a free float adjusted market capitalization index that is designed tomeasure equity market performance of small, mid and large cap companies in global developed and emerging markets, excluding the United States. As ofDecember 31, 2017, the MSCI ACWI ex-U.S. IMI Index consisted of 46 developed and emerging market country indices. The MSCI Europe, Australasia and FarEast Free (EAFE Free) IMI Index is a free float adjusted market capitalization index that is designed to measure equity market performance of small, mid andlarge cap companies in global developed markets within Europe, Australia, New Zealand, and the Far East. The MSCI Emerging Markets IMI Index is a float-adjusted market capitalization index designed to measure equity market performance of small, mid and large cap companies in global emerging markets. Returnsare reported in U.S. dollar terms for the MSCI EAFE Free IMI Index, MSCI ACWI ex-US IMI Index, and MSCI Emerging Markets IMI Index.
2 The Bloomberg Commodity Index is a broadly diversified index that allows investors to track commodity futures through a single, simple measure. The indexcurrently represents 20 commodities, which are weighted to account for economic significance and market liquidity.
3 Source: Barclays Live.
50

Meanwhile, the U.S. Treasury yield curve flattened over the course of the year as shorter-term (3-month and 2-year) yields roseconsiderably and long-term (10-year) yields ended lower. Beginning the period at 0.51%, 3-month U.S. Treasury yields remainedrelatively stable through February, ranging between 0.50% and 0.55%. Those yields increased almost 0.20% within the first weekof March alone, however, when better-than-expected economic news raised investors’ expectations for more Federal Reserve (the“Fed”) rate hikes in 2017. As the Fed further tightened its monetary policy –- executing its first (March) and second (June) rateincreases during the period, beginning to normalize its balance sheet in October, and implementing its third rate increase inDecember — yields on 3-month Treasuries navigated a gradual ascent through year end. Three-month yields reached a periodhigh of 1.47% in late December before finishing December at 1.39%. Following a somewhat similar path during 2017, 2-yearTreasury yields began January at 1.20%, increased in early March, and subsequently traded between 1.18% - 1.40% through latesummer. Two-year yields then steadily rose through year end, reaching a period high of 1.92% in late December before eventuallysettling at 1.89%.
While positive economic news and the Fed’s activities helped drive the increase in 3-month Treasury yields, a continuation of softinflation and robust market demand weighed on long-term yields. Beginning January 2017 at 2.45%, 10-year Treasury yieldsreached a period high of 2.62% in early March before subsequently tracking generally downward through early September,reaching a low of 2.05% before rebounding through year end to close at 2.40%. While most economic data promoted higher long-term yields — and the Fed’s effort to normalize its balance sheet provided similar support — that upward pressure was moderatedby a low inflationary environment that persisted throughout the period. In addition, long-term yields were weakened by investors’continued strong demand. While some unwinding of quantitative easing measures began during the year, foreign central banksgenerally continued to maintain their respective monetary stimulus programs. As a result, global bond yields remained low,compelling fixed income investors to seek out the relatively higher returns found in U.S. Treasuries, thereby exerting downwardpressure on their yields.
With inflation mostly subdued through the year and interest rates increasing during the period’s second half, the BloombergBarclays U.S. TIPS Index posted a 3.01% gain.4 Meanwhile, with 3-month U.S. Treasury yields increasing 88 basis points from0.51% at the beginning of the period to 1.39% at year end, cash holdings, as represented by the Citigroup 3-month U.S. TreasuryBill Index, returned 0.84%, highlighting the rising short-term interest rate environment.5
Supported by signs of economic growth in the U.S. and abroad, high-yield bonds outperformed investment grade bonds for theyear, as represented by the 7.51% total return posted by the Bloomberg Barclays High-Yield Bond Index versus the 3.54% gain ofthe Aggregate Bond Index.6 Continued strength in the U.S. economy — as well as a relatively low interest rate environment —also benefitted the U.S. real estate market, as the Cohen & Steers Realty Majors Index increased 5.32%.7 Consistent with theperformance of the international equity markets, foreign real estate produced relatively higher returns as the FTSE EPRA/NAREITDeveloped Real Estate ex-U.S. Index posted a 20.03% gain for the 1-year period ended December 31, 2017.8
4 The Bloomberg Barclays U.S. TIPS Index is an unmanaged index composed of inflation protected securities issued by the U.S. Treasury.5 The Citigroup 3-Month Treasury Bill Index is an unmanaged index of three-month Treasury bills.6 The Bloomberg Barclays High-Yield Bond Index covers the U.S. dollar-denominated, non-investment grade, fixed-rate, taxable corporate bond market.7 The Cohen & Steers Realty Majors Index is a modified capitalization weighted total return index of selected United States Equity Real Estate Investment Trusts
(REITs).8 The FTSE EPRA/NAREIT Developed Real Estate ex-U.S. Index is designed to measure the stock performance of companies engaged in specific real estate
activities of the real estate markets outside of the United States. Relevant real estate activities are defined as the ownership, trading and development of incomeproducing real estate.
51

Relevant Market Indices1-year Total Returnas of 12/31/2017
U.S. Equity:S&P 500 Index 21.83%Russell 1000 Index 21.69%Russell MidCap Index 18.52%Russell 2000 Index 14.65%
Non-U.S. Equity:MSCI ACWI ex-U.S. IMI Index 27.81%MSCI EAFE Free IMI Index 26.16%MCSI Emerging Markets IMI Index 36.83%
Fixed Income:Bloomberg Barclays U.S. Aggregate Bond Index 3.54%Bloomberg Barclays High-Yield Bond Index 7.51%Bloomberg Barclays U.S. TIPS Index 3.01%Citigroup 3-Month Treasury Bill Index 0.84%
Specialty:Cohen & Steers Realty Majors Index 5.32%FTSE EPRA/NAREIT Developed Real Estate ex-U.S. Index 20.03%Bloomberg Commodity Index 1.70%
It is not possible to invest directly in an index.Past performance does not guarantee future results.
What factors helped and hindered performance of the LifePath Funds during the reporting period?
With the exception of the State Farm LifePath 2050 Fund not containing an allocation to the iShares TIPS Bond ETF, each LifePathFund invested in the same eight LifePath Underlying Funds but in differing proportions, depending upon the time horizon andacceptable risk level of the LifePath Fund: the iShares Russell 1000 ETF, the iShares Russell 2000 ETF, the iShares Core MSCI EAFEETF, the iShares Core MSCI Emerging Markets ETF, the iShares MSCI Canada ETF, the iShares Cohen & Steers REIT ETF, the iSharesCore U.S. Aggregate Bond ETF, and the iShares TIPS Bond ETF.
The LifePath Funds with longer time horizons, such as the LifePath 2050 Fund, invested a greater share of their assets in equity-oriented LifePath Underlying Funds, such as the iShares Russell 1000 ETF and the iShares Core MSCI EAFE ETF. The moreconservative LifePath Funds, such as the LifePath Retirement Fund, allocated more of their assets to fixed income-orientedinvestments, such as the iShares Core U.S. Aggregate Bond ETF and the iShares TIPS Bond ETF.
Ultimately the performance of any given LifePath Fund is a reflection of its asset allocation.
The returns of the LifePath Underlying Funds contributed to the overall returns of the LifePath Funds as shown below.
LifePath Underlying Funds1-Year Total Return
as of 12/31/2017
iShares Russell 1000 ETF 21.52%iShares Russell 2000 ETF 14.55%iShares Core MSCI Emerging Markets ETF 37.35%iShares Core MSCI EAFE ETF 27.05%iShares MSCI Canada ETF 15.80%iShares Cohen & Steers REIT ETF 5.09%iShares Core U.S. Aggregate Bond ETF 3.55%iShares TIPS Bond ETF 2.90%
The LifePath Funds invested a significant amount of their assets in the iShares Russell 1000 ETF and iShares Core U.S. AggregateBond ETF. Both of these ETFs seek to track their respective benchmark indices while maintaining similar risk profiles as thosebenchmarks. The performance of the iShares Russell 1000 ETF was in line with its benchmark, the Russell 1000 Index (21.52% vs.21.69%, respectively). As of December 31, 2017, the iShares Russell 1000 ETF was invested in 983 stocks, and during the yearthe iShares Russell 1000 ETF generally maintained sector weights and a risk profile that was similar to its benchmark. For the1-year period, U.S. large cap stocks (as represented by the Russell 1000 Index) generally lagged behind both developedinternational equity markets (as represented by the MSCI EAFE Free Index) and emerging markets (as represented by the MSCIEmerging Markets Index), while generally outperforming U.S. small cap equities (as represented by the Russell 2000 Index).
The performance of the iShares Core U.S. Aggregate Bond ETF was also in line with its benchmark, the Aggregate Bond Index(3.55% vs. 3.54%, respectively). As of December 31, 2017, there were 1,159 issuers and 6,492 securities comprising the iSharesCore U.S. Aggregate Bond ETF. Within fixed income markets during 2017, high-yield bonds generally outperformed investment
52

grade bonds, as represented by the 7.51% return of the Bloomberg Barclays High-Yield Bond Index versus the 3.54% return of theAggregate Bond Index. In addition, lower credit quality generally performed better than higher quality in the Aggregate Bond Index.
53

State Farm LifePath Retirement FundProvide an illustration of the Fund’s investments.
Fund Composition*
Equity Exchange-Traded Funds, 40.47%
Fixed Income Exchange-Traded Funds, 59.50%
Short-Term Investments and Cash and Liabilities,Net of Other Assets, 0.03%
* Illustrated by Type of Security and based on total net assets as of December 31, 2017. Please refer to theSchedule of Investments later in this report for details concerning Fund holdings.
How did the State Farm LifePath Retirement Fund perform during the reporting period?For the 1-year period ended December 31, 2017, Class A shares of the State Farm LifePath Retirement Fund had a total returnwithout sales charges of 9.95%. The total returns for comparative indices of the LifePath Funds during the same time period wereas follows: 21.83% for the S&P 500 Index and 3.54% for the Bloomberg Barclays U.S. Aggregate Bond Index.
Because of the multi-asset structure of the LifePath Retirement Fund, a blended benchmark is also used for comparison purposesin the line graph below. The blended benchmark is comprised of the indices shown below with weightings adjusted at thebeginning of each quarter to approximately correspond with the LifePath Retirement Fund’s investments for the upcoming quarter.The 1-year total return was 10.54% for the LifePath Retirement Fund’s blended benchmark, which had the following compositionas of December 31, 2017:
IndexLifePath Retirement Fund’s
Blended Benchmark Weighting
Bloomberg Barclays U.S. Aggregate Bond Index 51.23%Russell 1000 Index 22.16%MSCI ACWI ex-U.S. IMI Index 11.57%Bloomberg Barclays U.S. TIPS Index 8.77%Russell 2000 Index 4.77%Cohen & Steers Realty Majors Index 1.50%
54

The line graph and table below provide additional perspective for the State Farm LifePath Retirement Fund’s long term results.
Comparison of change in value of $10,000 investment for the years ended December 31, including applicable sales charges
THOUSANDS
$0
$5
$10
$15
$25
$20
Legend and Value as of December 31, 2017
Bloomberg Barclays U.S. AggregateBond Index1
S&P 500 Index1 $22,603LifePath Retirement Fund – Class A
Blended Benchmark2 $16,385
$14,532
$14,824
2007 2008 2009 2010 2011 2012 2013 2014 2015 20172016
Fund’s Average Annual Total Return and Value as of December 31, 2017
1 YEAR 5 YEAR 10 YEAR
Ending Value ofa $10,000
Investment**
Class A 4.47% 3.62% 3.81% $14,532
Class B - conversion to Class A* 4.72% 3.82% 2.45% $12,737
Class B - conversion to Premier* 4.72% 3.82% 2.45% $12,738
Premier (previously Legacy Class A) 4.53% 3.63% 3.82% $14,542
Legacy Class B - conversion to Class A* 6.93% 3.99% 2.61% $12,933
Legacy Class B - conversion to Premier* 6.93% 3.99% 2.61% $12,934
Institutional 10.03% 4.92% 4.58% $15,650
Class R-1 9.84% 4.39% 4.03% $14,841
Class R-2 9.93% 4.56% 4.22% $15,115
Class R-3 9.96% 4.84% 4.50% $15,535
* Class B and Legacy Class B shares convert to Class A shares after 8 full years, unless the total value of a shareholder’s account(s) is$100,000 or more, then these shares convert to Premier shares. 10 YEAR returns and values reflect the applicable conversion.
** For a 10 YEAR period.
The performance data quoted represents past performance and does not guarantee future results. Class A and Premiershares values and Class A shares performance on the line graph reflect a maximum sales charge of 5% at initial investment.Performance for the Fund’s other classes may be greater than or less than the line shown for Class A shares because ofdiffering loads and expenses between the share classes. Returns in the table above reflect maximum sales charges of: 5% forall Class A and Premier shares and for Class B shares at one year; 3% for Legacy Class B shares at one year; and 2% forClass B and Legacy Class B shares at five years. These figures do not reflect the deduction of taxes that a shareholder wouldpay on Fund distributions or the redemption of Fund shares.
1 See footnotes for LifePath 2050 Fund on page 67 for a description of the Indices.2 On December 31, 2017, the Blended Benchmark computed by State Farm Investment Management Corp. consisted of 51.23% Bloomberg Barclays U.S. Aggregate
Bond Index, 22.16% Russell 1000 Index, 11.57% MSCI ACWI ex-U.S. IMI Index, 8.77% Bloomberg Barclays U.S. TIPS Index, 4.77% Russell 2000 Index, and1.50% Cohen & Steers Realty Majors Index. Unlike an investment in the LifePath Retirement Fund, a theoretical investment in any of the Indices and the BlendedBenchmark does not reflect any expenses. It is not possible to invest directly in an index or the Blended Benchmark.
55

Performance AnalysisWhat factors helped and hindered performance of the LifePath Retirement Fund during the reporting period?
As of December 31, 2017, the LifePath Underlying Funds within the LifePath Retirement Fund had the following composition:
LifePath Underlying Fund% of LifePath Retirement Fund’s
Net Assets*
iShares Core U.S. Aggregate Bond ETF 50.94%iShares Russell 1000 ETF 22.31%iShares TIPS Bond ETF 8.55%iShares Core MSCI EAFE ETF 8.06%iShares Russell 2000 ETF 4.96%iShares Core MSCI Emerging Markets ETF 2.90%iShares Cohen & Steers REIT ETF 1.42%iShares MSCI Canada ETF 0.83%
*Table does not include 0.12% for short-term investments and -0.09% for cash and liabilities, net of other assets. Due to rounding, total may not add to 100%.
The main driver to performance for the LifePath Retirement Fund was its exposure to equities. At the end of December 2017, theLifePath Retirement Fund’s equity allocation was approximately 40% of total net assets. Within the equity allocation, the iSharesRussell 1000 ETF was the largest contributor to the LifePath Retirement Fund’s return for the 1-year period ended December 31,2017. Representative of large-cap U.S. stocks, the iShares Russell 1000 ETF posted a similar total return as its benchmark theRussell 1000 Index (21.52% vs. 21.69%, respectively), and as of year end accounted for approximately 55% of the equityallocation. As of December 31, 2017, the iShares Russell 1000 ETF consisted of 983 holdings, down from 999 at period start.
Support also came from U.S. small-cap stocks and foreign equities within the LifePath Retirement Fund’s equity allocation. For the1-year period, the iShares Russell 2000 ETF, representing U.S. small-cap stocks, generated a 14.55% return, while the iSharesCore MSCI Emerging Markets ETF and iShares Core MSCI EAFE ETF, representing foreign equities, generated total returns of37.35% and 27.05%, respectively.
From a fixed-income perspective, the LifePath Retirement Fund included an investment in the iShares Core U.S. Aggregate BondETF and the iShares TIPS Bond ETF. At approximately 51% of the LifePath Retirement Fund’s total net assets as of year end, theiShares Core U.S. Aggregate Bond ETF represented the largest LifePath Underlying Fund allocation within the Fund and finished asthe third largest contributor to the Fund’s return. The iShares Core U.S. Aggregate Bond ETF produced relatively the same return asits benchmark, the Bloomberg Barclays U.S. Aggregate Bond Index (3.55% vs. 3.54%, respectively), and as of year end, included6,492 holdings, up from 5,869 to start the period. The iShares TIPS Bond ETF trailed the total return of its benchmark, theBloomberg Barclays TIPS Index (2.90% vs. 3.01%, respectively) for the year.
Within fixed-income markets, during the year investment grade bonds generally underperformed high-yield bonds, as representedby the 3.54% return of the Bloomberg Barclays U.S. Aggregate Bond Index versus the 7.51% gain from the Bloomberg BarclaysHigh-Yield Bond Index. In addition, shorter-term bonds generally underperformed relative to intermediate- and longer-maturitybonds. Within the Bloomberg Barclays U.S. Aggregate Bond Index, 1-3 year maturities yielded 0.86% while 5-7 year maturities and10+ year maturities returned 2.59% and 10.47%, respectively.
Among the smallest contributors to the LifePath Retirement Fund’s return were the iShares MSCI Canada ETF and the iSharesCohen & Steers REIT ETF. Representing the Canadian equity market, the MSCI Canada ETF generated a 15.80% total return for the1-year period, while the iShares Cohen & Steers REIT ETF, representing the U.S. real estate market, provided a 5.09% gain.
Over the course of the year, the asset allocation adjustments within the LifePath Retirement Fund resulted in an approximate 0.1%and 0.3% increase to domestic equity and international equity, while real estate securities decreased 0.1%, respectively. The fixedincome allocation decreased approximately 0.2%.
Financial highlights for this Fund can be found on pages 214-215.
56

State Farm LifePath 2020 FundProvide an illustration of the Fund’s investments.
Fund Composition*
Equity Exchange-Traded Funds, 47.57%Fixed Income Exchange-Traded Funds, 52.36%
Short-Term Investments and Cash and Liabilities,Net of Other Assets, 0.07%
* Illustrated by Type of Security and based on total net assets as of December 31, 2017. Please refer to theSchedule of Investments later in this report for details concerning Fund holdings.
How did the State Farm LifePath 2020 Fund perform during the reporting period?For the 1-year period ended December 31, 2017, Class A shares of the State Farm LifePath 2020 Fund had a total return withoutsales charges of 11.42%. The total returns for comparative indices of the LifePath Funds during the same time period were asfollows: 21.83% for the S&P 500 Index and 3.54% for the Bloomberg Barclays U.S. Aggregate Bond Index.
Because of the multi-asset structure of the LifePath 2020 Fund, a blended benchmark is also used for comparison purposes in theline graph below. The blended benchmark is comprised of the indices shown below with weightings adjusted at the beginning ofeach quarter to approximately correspond with the LifePath 2020 Fund’s investments for the upcoming quarter. The 1-year totalreturn was 12.04% for the LifePath 2020 Fund’s blended benchmark, which had the following composition as of December 31,2017:
IndexLifePath 2020 Fund’s
Blended Benchmark Weighting
Bloomberg Barclays U.S. Aggregate Bond Index 44.89%Russell 1000 Index 25.98%MSCI ACWI ex-U.S. IMI Index 14.46%Bloomberg Barclays U.S. TIPS Index 7.47%Russell 2000 Index 4.12%Cohen & Steers Realty Majors Index 3.08%
57

The line graph and table below provide additional perspective for the State Farm LifePath 2020 Fund’s long term results.
Comparison of change in value of $10,000 investment for the years ended December 31, including applicable sales charges
THOUSANDS
$0
$5
$10
$25
$20
$15
$14,082LifePath 2020 Fund – Class A
$14,824Bloomberg Barclays U.S.Aggregate Bond Index1
Legend and Value as of December 31, 2017
S&P 500 Index1 $22,603
Blended Benchmark2 $16,102
2007 2008 2009 2010 2011 2012 2013 2014 2015 20172016
Fund’s Average Annual Total Return and Value as of December 31, 2017
1 YEAR 5 YEAR 10 YEAR
Ending Value ofa $10,000
Investment**
Class A 5.82% 4.68% 3.48% $14,082
Class B - conversion to Class A* 6.22% 4.81% 3.47% $14,061
Class B - conversion to Premier* 6.22% 4.81% 3.49% $14,093
Premier (previously Legacy Class A) 5.98% 4.72% 3.51% $14,120
Legacy Class B - conversion to Class A* 8.38% 5.08% 3.70% $14,387
Legacy Class B - conversion to Premier* 8.38% 5.08% 3.73% $14,418
Institutional 11.48% 5.99% 4.25% $15,163
Class R-1 11.29% 5.46% 3.70% $14,388
Class R-2 11.32% 5.64% 3.90% $14,664
Class R-3 11.43% 5.91% 4.19% $15,072
* Class B and Legacy Class B shares convert to Class A shares after 8 full years, unless the total value of a shareholder’s account(s) is$100,000 or more, then these shares convert to Premier shares. 10 YEAR returns and values reflect the applicable conversion.
** For a 10 YEAR period.
The performance data quoted represents past performance and does not guarantee future results. Class A and Premiershares values and Class A shares performance on the line graph reflect a maximum sales charge of 5% at initial investment.Performance for the Fund’s other classes may be greater than or less than the line shown for Class A shares because ofdiffering loads and expenses between the share classes. Returns in the table above reflect maximum sales charges of: 5% forall Class A and Premier shares and for Class B shares at one year; 3% for Legacy Class B shares at one year; and 2% forClass B and Legacy Class B shares at five years. These figures do not reflect the deduction of taxes that a shareholder wouldpay on Fund distributions or the redemption of Fund shares.
1 See footnotes for LifePath 2050 Fund on page 67 for a description of the Indices.2 On December 31, 2017, the Blended Benchmark computed by State Farm Investment Management Corp. consisted of 44.89% Bloomberg Barclays U.S. Aggregate
Bond Index, 25.98% Russell 1000 Index, 14.46% MSCI ACWI ex-U.S. IMI Index, 7.47% Bloomberg Barclays U.S. TIPS Index, 4.12% Russell 2000 Index, and3.08% Cohen & Steers Realty Majors Index. Unlike an investment in the LifePath 2020 Fund, a theoretical investment in any of the Indices and the BlendedBenchmark does not reflect any expenses. It is not possible to invest directly in an index or the Blended Benchmark.
58

Performance AnalysisWhat factors helped and hindered performance of the LifePath 2020 Fund during the reporting period?
As of December 31, 2017, the LifePath Underlying Funds within the LifePath 2020 Fund had the following composition:
LifePath Underlying Fund% of LifePath 2020 Fund’s
Net Assets*
iShares Core U.S. Aggregate Bond ETF 45.18%iShares Russell 1000 ETF 25.71%iShares Core MSCI EAFE ETF 9.89%iShares TIPS Bond ETF 7.18%iShares Russell 2000 ETF 4.24%iShares Core MSCI Emerging Markets ETF 3.56%iShares Cohen & Steers REIT ETF 3.16%iShares MSCI Canada ETF 1.00%
*Table does not include 0.13% for short-term investments and -0.06% for cash and liabilities, net of other assets. Due to rounding, table may not add to 100%.
The main driver to performance for the LifePath 2020 Fund was its exposure to equities. At the end of December 2017, theLifePath 2020 Fund’s equity allocation was approximately 48% of total net assets. Within the equity allocation, the iShares Russell1000 ETF was the largest contributor to the LifePath 2020 Fund’s return for the 1-year period ended December 31, 2017.Representative of large-cap U.S. stocks, the iShares Russell 1000 ETF posted a similar total return as its benchmark the Russell1000 Index (21.52% vs. 21.69%, respectively) and as of year end accounted for approximately 54% of the equity allocation. Atyear end, the iShares Russell 1000 ETF consisted of 983 holdings, down from 999 at period start.
Support also came from U.S. small-cap stocks and foreign equities within the LifePath 2020 Fund’s equity allocation. For the year,the iShares Russell 2000 ETF, representing U.S. small-cap stocks, generated a 14.55% return, while the iShares Core MSCIEmerging Markets ETF and iShares Core MSCI EAFE ETF, representing foreign equities, generated total returns of 37.35% and27.05%, respectively.
From a fixed-income perspective, the LifePath 2020 Fund included an investment in the iShares Core U.S. Aggregate Bond ETF andthe iShares TIPS Bond ETF. At approximately 45% of the LifePath 2020 Fund’s total net assets as of year end, the iShares Core U.S.Aggregate Bond ETF represented the largest LifePath Underlying Fund allocation within the Fund and finished as the third largestcontributor to the Fund’s return. The iShares Core U.S. Aggregate Bond ETF produced relatively the same return as its benchmark,the Bloomberg Barclays U.S. Aggregate Bond Index (3.55% vs. 3.54%, respectively), and as of year end, included 6,492 holdings,up from 5,869 to start the period. The iShares TIPS Bond ETF trailed the total return of its benchmark, the Bloomberg Barclays TIPSIndex (2.90% vs. 3.01%, respectively), for the year.
Within fixed-income markets, during the year investment grade bonds generally underperformed high-yield bonds, as representedby the 3.54% return of the Bloomberg Barclays U.S. Aggregate Bond Index versus the 7.51% gain from the Bloomberg BarclaysHigh-Yield Bond Index. In addition, shorter-term bonds generally underperformed relative to intermediate- and longer-maturitybonds. Within the Bloomberg Barclays U.S. Aggregate Bond Index, 1-3 year maturities yielded 0.86% while 5-7 year maturities and10+ year maturities returned 2.59% and 10.47%, respectively.
Among the smallest contributors to the LifePath 2020 Fund’s return were the iShares MSCI Canada ETF and the iShares Cohen &Steers REIT ETF. Representing the Canadian equity market, the MSCI Canada ETF generated a 15.80% total return for the 1-yearperiod, while, the iShares Cohen & Steers REIT ETF, representing the U.S. real estate market, provided a 5.09% return.
Over the course of the year, the asset allocation adjustments within the LifePath 2020 Fund resulted in an approximate 1.4%, 0.6%and 0.4% decrease to domestic equity, international equity and real estate securities, respectively. The fixed income allocationincreased approximately 2.3%.
Financial highlights for this Fund can be found on pages 216-217.
59

State Farm LifePath 2030 FundProvide an illustration of the Fund’s investments.
Fund Composition*
Fixed Income Exchange-Traded Funds, 29.47%
Equity Exchange-Traded Funds, 70.48%
Short-Term Investments and Cash and Liabilities,Net of Other Assets, 0.05%
* Illustrated by Type of Security and based on total net assets as of December 31, 2017. Please refer to theSchedule of Investments later in this report for details concerning Fund holdings.
How did the State Farm LifePath 2030 Fund perform during the reporting period?For the 1-year period ended December 31, 2017, Class A shares of the State Farm LifePath 2030 Fund had a total return withoutsales charges of 15.47%. The total returns for comparative indices of the LifePath Funds during the same time period were asfollows: 21.83% for the S&P 500 Index and 3.54% for the Bloomberg Barclays U.S. Aggregate Bond Index.
Because of the multi-asset structure of the LifePath 2030 Fund, a blended benchmark is also used for comparison purposes in theline graph below. The blended benchmark is comprised of the indices shown below with weightings adjusted at the beginning ofeach quarter to approximately correspond with the LifePath 2030 Fund’s investments for the upcoming quarter. The 1-year totalreturn was 16.08% for the LifePath 2030 Fund’s blended benchmark, which had the following composition as of December 31,2017:
IndexLifePath 2030 Fund’s
Blended Benchmark Weighting
Russell 1000 Index 37.47%Bloomberg Barclays U.S. Aggregate Bond Index 25.41%MSCI ACWI ex-U.S. IMI Index 23.18%Cohen & Steers Realty Majors Index 7.83%Bloomberg Barclays U.S. TIPS Index 3.95%Russell 2000 Index 2.16%
60

The line graph and table below provide additional perspective for the State Farm LifePath 2030 Fund’s long term results.
Comparison of change in value of $10,000 investment for the years ended December 31, including applicable sales charges
THOUSANDS
$0
$5
$10
$25
$20
$15
$14,565LifePath 2030 Fund – Class A
$16,820Blended Benchmark2
Legend and Value as of December 31, 2017
$14,824Bloomberg Barclays U.S.Aggregate Bond Index1
$22,603S&P 500 Index1
2007 2008 2009 2010 2011 2012 2013 2014 2015 20172016
Fund’s Average Annual Total Return and Value as of December 31, 2017
1 YEAR 5 YEAR 10 YEAR
Ending Value ofa $10,000
Investment**
Class A 9.67% 6.40% 3.83% $14,565
Class B - conversion to Class A* 10.43% 6.72% 3.83% $14,566
Class B - conversion to Premier* 10.43% 6.72% 3.86% $14,598
Premier (previously Legacy Class A) 9.79% 6.44% 3.85% $14,595
Legacy Class B - conversion to Class A* 12.36% 6.83% 4.05% $14,874
Legacy Class B - conversion to Premier* 12.36% 6.83% 4.07% $14,906
Institutional 15.51% 7.73% 4.61% $15,688
Class R-1 15.32% 7.19% 4.06% $14,883
Class R-2 15.37% 7.37% 4.24% $15,152
Class R-3 15.44% 7.65% 4.56% $15,622
* Class B and Legacy Class B shares convert to Class A shares after 8 full years, unless the total value of a shareholder’s account(s) is$100,000 or more, then these shares convert to Premier shares. 10 YEAR returns and values reflect the applicable conversion.
** For a 10 YEAR period.
The performance data quoted represents past performance and does not guarantee future results. Class A and Premiershares values and Class A shares performance on the line graph reflect a maximum sales charge of 5% at initial investment.Performance for the Fund’s other classes may be greater than or less than the line shown for Class A shares because ofdiffering loads and expenses between the share classes. Returns in the table above reflect maximum sales charges of: 5% forall Class A and Premier shares and for Class B shares at one year; 3% for Legacy Class B shares at one year; and 2% forClass B and Legacy Class B shares at five years. These figures do not reflect the deduction of taxes that a shareholder wouldpay on Fund distributions or the redemption of Fund shares.
1 See footnotes for LifePath 2050 Fund on page 67 for a description of the Indices.2 On December 31, 2017, the Blended Benchmark computed by State Farm Investment Management Corp. consisted of 37.47% Russell 1000 Index, 25.41%
Bloomberg Barclays U.S. Aggregate Bond Index, 23.18% MSCI ACWI ex-U.S. IMI Index, 7.83% Cohen & Steers Realty Majors Index, 3.95% Bloomberg BarclaysU.S. TIPS Index, and 2.16% Russell 2000 Index. Unlike an investment in the LifePath 2030 Fund, a theoretical investment in any of the Indices and the BlendedBenchmark does not reflect any expenses. It is not possible to invest directly in an index or the Blended Benchmark.
61

Performance AnalysisWhat factors helped and hindered performance of the LifePath 2030 Fund during the reporting period?
As of December 31, 2017, the LifePath Underlying Funds within the LifePath 2030 Fund had the following composition:
LifePath Underlying Fund% of LifePath 2030 Fund’s
Net Assets*
iShares Russell 1000 ETF 37.24%iShares Core U.S. Aggregate Bond ETF 25.63%iShares Core MSCI EAFE ETF 16.02%iShares Cohen & Steers REIT ETF 7.58%iShares Core MSCI Emerging Markets ETF 5.67%iShares TIPS Bond ETF 3.84%iShares Russell 2000 ETF 2.37%iShares MSCI Canada ETF 1.61%
*Table does not include 0.09% for short-term investments and -0.04% for cash and liabilities, net of other assets. Due to rounding, total may not add to 100%.
The main driver to performance for the LifePath 2030 Fund was its exposure to equities. At the end of December 2017, theLifePath 2030 Fund’s equity allocation was approximately 70% of total net assets. Within the equity allocation, the iShares Russell1000 ETF was the largest contributor to the LifePath 2030 Fund’s return for the 1-year period ended December 31, 2017.Representative of large-cap U.S. stocks, the iShares Russell 1000 ETF posted a similar total return as its benchmark, the Russell1000 Index (21.52% vs. 21.69%, respectively), and as of year end accounted for approximately 53% of the equity allocation. Atyear end, the iShares Russell 1000 ETF consisted of 983 holdings, down from 999 at period start.
Support also came from U.S. small-cap stocks and foreign equities within the LifePath 2030 Fund’s equity allocation. For the year,the iShares Russell 2000 ETF, representing U.S. small-cap stocks, generated a 14.55% return, while the iShares Core MSCIEmerging Markets ETF and iShares Core MSCI EAFE ETF, representing foreign equities, generated total returns of 37.35% and27.05%, respectively.
From a fixed-income perspective, the LifePath 2030 Fund included an investment in the iShares Core U.S. Aggregate Bond ETF. Atapproximately 26% of the LifePath 2030 Fund’s total net assets as of year end, the iShares Core U.S. Aggregate Bond ETFcomprised the second largest LifePath Underlying Fund allocation within the Fund, and finished as the fourth largest contributor tothe Fund’s return. The iShares Core U.S. Aggregate Bond ETF produced relatively the same return as its benchmark, the BloombergBarclays U.S. Aggregate Bond Index (3.55% vs. 3.54%, respectively), and as of year end, included 6,492 holdings, up from 5,869 tostart the period. The iShares TIPS Bond ETF trailed the total return of its benchmark, the Bloomberg Barclays TIPS Index (2.90% vs.3.01%, respectively), for the year.
Within fixed-income markets, during the year investment grade bonds generally underperformed high-yield bonds, as representedby the 3.54% return of the Bloomberg Barclays U.S. Aggregate Bond Index versus the 7.51% gain from the Bloomberg BarclaysHigh-Yield Bond Index. In addition, shorter-term bonds generally underperformed relative to intermediate- and longer-maturitybonds. Within the Bloomberg Barclays U.S. Aggregate Bond Index, 1-3 year maturities yielded 0.86% while 5-7 year maturities and10+ year maturities returned 2.59% and 10.47%, respectively.
Among the smallest contributors to the LifePath 2030 Fund’s return were the iShares MSCI Canada and the iShares TIPS Bond ETF.Representing Canadian equity markets, the iShares MSCI Canada ETF generated a 15.80% total return for the one-year period,while the iShares TIPS Bond ETF, representing inflation-protected Treasuries, provided a 2.90% return.
Over the course of the year, the asset allocation adjustments within the LifePath 2030 Fund resulted in approximate 1.4% and0.3% decreases to domestic equity and real estate securities, respectively, while international equity remained unchanged. Thefixed income allocation increased approximately 1.7%.
Financial highlights for this Fund can be found on pages 218-219.
62

State Farm LifePath 2040 FundProvide an illustration of the Fund’s investments.
Fund Composition*
Equity Exchange-Traded Funds, 89.55%
Fixed Income Exchange-Traded Funds, 10.29%
Short-Term Investments and Cash and Liabilities,Net of Other Assets, 0.16%
* Illustrated by Type of Security and based on total net assets as of December 31, 2017. Please refer to theSchedule of Investments later in this report for details concerning Fund holdings.
How did the State Farm LifePath 2040 Fund perform during the reporting period?For the 1-year period ended December 31, 2017, Class A shares of the State Farm LifePath 2040 Fund had a total return withoutsales charges of 18.92%. The total returns for comparative indices of the LifePath Funds during the same time period were asfollows: 21.83% for the S&P 500 Index and 3.54% for the Bloomberg Barclays U.S. Aggregate Bond Index.
Because of the multi-asset structure of the LifePath 2040 Fund, a blended benchmark is also used for comparison purposes in theline graph below. The blended benchmark is comprised of the indices shown below with weightings adjusted at the beginning ofeach quarter to approximately correspond with the LifePath 2040 Fund’s investments for the upcoming quarter. The 1-year totalreturn was 19.62% for the LifePath 2040 Fund’s blended benchmark, which had the following composition as of December 31,2017:
IndexLifePath 2040 Fund’s
Blended Benchmark Weighting
Russell 1000 Index 47.03%MSCI ACWI ex-U.S. IMI Index 30.60%Cohen & Steers Realty Majors Index 11.85%Bloomberg Barclays U.S. Aggregate Bond Index 8.82%Bloomberg Barclays U.S. TIPS Index 1.16%Russell 2000 Index 0.54%
63
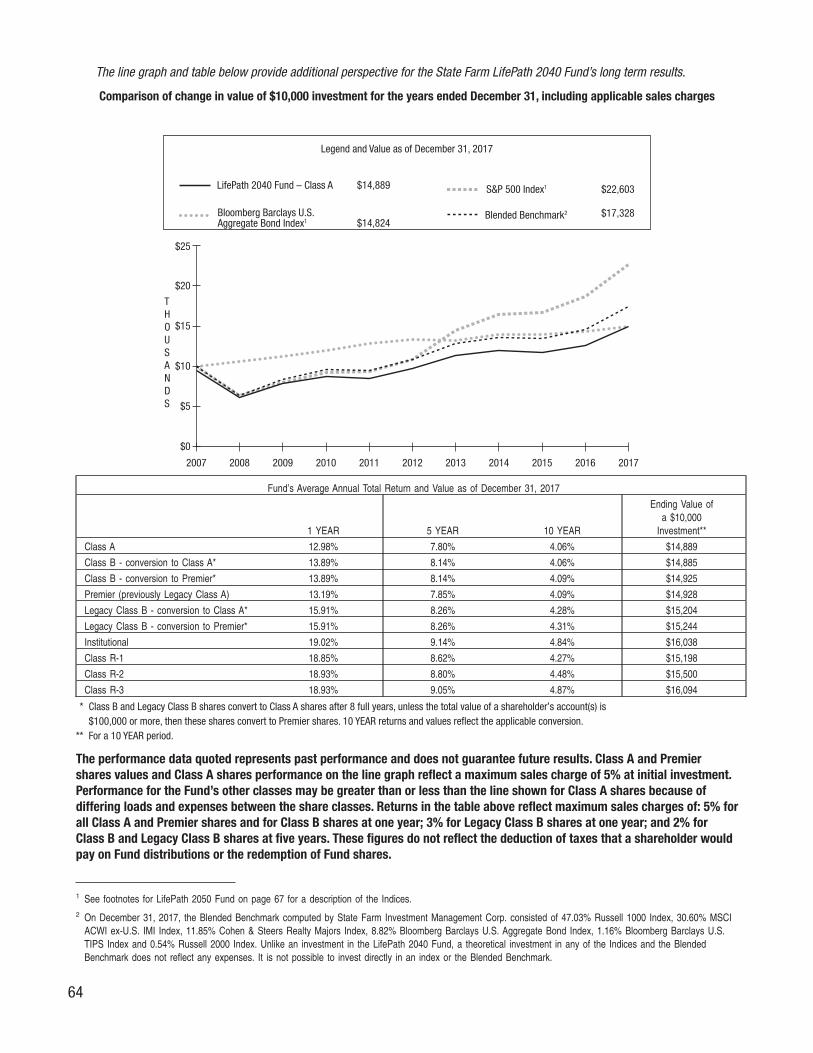
The line graph and table below provide additional perspective for the State Farm LifePath 2040 Fund’s long term results.
Comparison of change in value of $10,000 investment for the years ended December 31, including applicable sales charges
THOUSANDS
$0
$5
$10
$25
$15
$20
$14,889LifePath 2040 Fund – Class A
$17,328Blended Benchmark2
Legend and Value as of December 31, 2017
$14,824Bloomberg Barclays U.S.Aggregate Bond Index1
$22,603S&P 500 Index1
2007 2008 2009 2010 2011 2012 2013 2014 2015 20172016
Fund’s Average Annual Total Return and Value as of December 31, 2017
1 YEAR 5 YEAR 10 YEAR
Ending Value ofa $10,000
Investment**
Class A 12.98% 7.80% 4.06% $14,889
Class B - conversion to Class A* 13.89% 8.14% 4.06% $14,885
Class B - conversion to Premier* 13.89% 8.14% 4.09% $14,925
Premier (previously Legacy Class A) 13.19% 7.85% 4.09% $14,928
Legacy Class B - conversion to Class A* 15.91% 8.26% 4.28% $15,204
Legacy Class B - conversion to Premier* 15.91% 8.26% 4.31% $15,244
Institutional 19.02% 9.14% 4.84% $16,038
Class R-1 18.85% 8.62% 4.27% $15,198
Class R-2 18.93% 8.80% 4.48% $15,500
Class R-3 18.93% 9.05% 4.87% $16,094
* Class B and Legacy Class B shares convert to Class A shares after 8 full years, unless the total value of a shareholder’s account(s) is$100,000 or more, then these shares convert to Premier shares. 10 YEAR returns and values reflect the applicable conversion.
** For a 10 YEAR period.
The performance data quoted represents past performance and does not guarantee future results. Class A and Premiershares values and Class A shares performance on the line graph reflect a maximum sales charge of 5% at initial investment.Performance for the Fund’s other classes may be greater than or less than the line shown for Class A shares because ofdiffering loads and expenses between the share classes. Returns in the table above reflect maximum sales charges of: 5% forall Class A and Premier shares and for Class B shares at one year; 3% for Legacy Class B shares at one year; and 2% forClass B and Legacy Class B shares at five years. These figures do not reflect the deduction of taxes that a shareholder wouldpay on Fund distributions or the redemption of Fund shares.
1 See footnotes for LifePath 2050 Fund on page 67 for a description of the Indices.2 On December 31, 2017, the Blended Benchmark computed by State Farm Investment Management Corp. consisted of 47.03% Russell 1000 Index, 30.60% MSCI
ACWI ex-U.S. IMI Index, 11.85% Cohen & Steers Realty Majors Index, 8.82% Bloomberg Barclays U.S. Aggregate Bond Index, 1.16% Bloomberg Barclays U.S.TIPS Index and 0.54% Russell 2000 Index. Unlike an investment in the LifePath 2040 Fund, a theoretical investment in any of the Indices and the BlendedBenchmark does not reflect any expenses. It is not possible to invest directly in an index or the Blended Benchmark.
64

Performance AnalysisWhat factors helped and hindered performance of the LifePath 2040 Fund during the reporting period?
As of December 31, 2017, the LifePath Underlying Funds within the LifePath 2040 Fund had the following composition:
LifePath Underlying Fund% of LifePath 2040 Fund’s
Net Assets*
iShares Russell 1000 ETF 46.75%iShares Core MSCI EAFE ETF 21.02%iShares Cohen & Steers REIT ETF 11.57%iShares Core U.S. Aggregate Bond ETF 9.13%iShares Core MSCI Emerging Markets ETF 7.47%iShares MSCI Canada ETF 2.07%iShares TIPS Bond ETF 1.16%iShares Russell 2000 ETF 0.66%
*Table does not include 0.21% for short-term investments and -0.05% for cash and liabilities, net of other assets. Due to rounding, total may not add to 100%.
The main driver to performance for the LifePath 2040 Fund was its exposure to equities. At the end of December 2017, theLifePath 2040 Fund’s equity allocation was approximately 90% of total net assets. Within the equity allocation, the iShares Russell1000 ETF was the largest contributor to the LifePath 2040 Fund’s return for the 1-year period. Representative of large-cap U.S.stocks, the iShares Russell 1000 ETF posted a similar total return as its benchmark, the Russell 1000 Index (21.52% vs. 21.69%,respectively), and as of year end accounted for approximately 52% of the equity allocation. At year end, the iShares Russell 1000ETF consisted of 983 holdings, down from 999 at period start.
Support also came from U.S. small-cap stocks and foreign equities within the LifePath 2040 Fund’s equity allocation. For the year,the iShares Russell 2000 ETF, representing U.S. small-cap stocks, generated a 14.55% return, while the iShares Core MSCIEmerging Markets ETF and iShares Core MSCI EAFE ETF, representing foreign equities, generated total returns of 37.35% and27.05%, respectively.
Meanwhile, due in part to their relatively small weighting within the LifePath 2040 Fund, the fixed income components wereresponsible for the smallest contributions to the Fund’s return. The iShares Core U.S. Aggregate Bond ETF and the iShares TIPSBond ETF produced returns of 3.55% and 2.90%, respectively. Within fixed-income markets, during the year investment gradebonds generally underperformed high-yield bonds, as represented by the 3.54% return of the Bloomberg Barclays U.S. AggregateBond Index versus the 7.51% gain from the Bloomberg Barclays High-Yield Bond Index. In addition, shorter-term bonds generallyunderperformed relative to intermediate- and longer-maturity bonds. Within the Bloomberg Barclays U.S. Aggregate Bond Index,1-3 year maturities yielded 0.86% while 5-7 year maturities and 10+ year maturities returned 2.59% and 10.47%, respectively.
Over the course of the year, the asset allocation adjustments within the LifePath 2040 Fund resulted in an approximate 1.5% and0.4% decrease domestic equity and real estate, while international equity remained unchanged. The fixed income allocationincreased approximately 1.7%.
Financial highlights for this Fund can be found on pages 220-221.
65

State Farm LifePath 2050 FundProvide an illustration of the Fund’s investments.
Fund Composition*
Equity Exchange-Traded Funds, 99.00%
Fixed Income Exchange-Traded Funds, 0.84%
Short-Term Investments and Cash and Liabilities,Net of Other Assets, 0.16%
* Illustrated by Type of Security and based on total net assets as of December 31, 2017. Please refer to theSchedule of Investments later in this report for details concerning Fund holdings.
How did the State Farm LifePath 2050 Fund perform during the reporting period?For the 1-year period ended December 31, 2017, Class A shares of the State Farm LifePath 2050 Fund had a total return withoutsales charges of 20.39%. The total returns for comparative indices of the LifePath Funds during the same time period were asfollows: 21.83% for the S&P 500 Index and 3.54% for the Bloomberg Barclays U.S. Aggregate Bond Index.
Because of the multi-asset structure of the LifePath 2050 Fund, a blended benchmark is also used for comparison purposes in theline graph below. The blended benchmark is comprised of the indices shown below with weightings adjusted at the beginning ofeach quarter to approximately correspond with the LifePath 2050 Fund’s investments for the upcoming quarter. The total returnwas 21.16% for the LifePath 2050 Fund’s blended benchmark, which had the following composition as of December 31, 2017:
IndexLifePath 2050 Fund’s
Blended Benchmark Weighting
Russell 1000 Index 49.97%MSCI ACWI ex-U.S. IMI Index 34.84%Cohen & Steers Realty Majors Index 13.91%Bloomberg Barclays U.S. Aggregate Bond Index 1.00%Russell 2000 Index 0.28%Bloomberg Barclays U.S. TIPS Index 0.00%
66

The line graph and table below provide additional perspective for the State Farm LifePath 2050 Fund’s long term results.
Comparison of change in value of $10,000 investment for the periods ended December 31, including applicable sales charges
THOUSANDS
$0
$5
$10
$30
$25
$20
$15
$17,441LifePath 2050 Fund – Class A
$19,703Blended Benchmark3
Legend and Value as of December 31, 2017
$14,659Bloomberg Barclays U.S.Aggregate Bond Index2
$26,717S&P 500 Index1
07/1
4/20
08
12/3
1/20
08
12/3
1/20
09
12/3
1/20
10
12/3
1/20
11
12/3
1/20
17
12/3
1/20
16
12/3
1/20
15
12/3
1/20
14
12/3
1/20
13
12/3
1/20
12
Fund’s Average Annual Total Return and Value as of December 31, 2017
1 YEAR 5 YEAR Life of Class
Ending Value ofa $10,000
Investment***
Class A 14.40% 8.65% 6.05%* $17,441
Premier 14.56% Not Applicable 23.26%** $12,326
Class R-1 20.21% 9.46% 6.33%* $17,872
Class R-2 20.24% 9.63% 6.51%* $18,167
* From 07/14/2008.
** From 05/23/2016.
*** For a Life of Class period.
The performance data quoted represents past performance and does not guarantee future results. Class A and Premiershares values and Class A shares performance on the line graph reflect a maximum sales charge of 5% at initial investment.Performance for the Fund’s other classes may be greater than or less than the line shown for Class A shares because ofdiffering loads and expenses between the share classes. Returns in the table above reflect a maximum sales charge of 5%for all Class A and Premier shares. These figures do not reflect the deduction of taxes that a shareholder would pay on Funddistributions or the redemption of Fund shares.
1 The S&P 500 Index represents an unmanaged group of stocks, tracking the common stock performance of 500 large U.S. companies in the manufacturing, utilities,transportation and financial industries.
2 The Bloomberg Barclays U.S. Aggregate Bond Index represents debt securities in the U.S. investment grade fixed rate taxable bond market, including governmentand corporate debt securities, mortgage pass-through debt securities and asset-backed debt securities with maturities greater than one year.
The Indices represent unmanaged groups of securities that differ from the composition of the LifePath Funds. Unlike an investment in the LifePath Funds, atheoretical investment in any of the Indices does not reflect any expenses. It is not possible to invest directly in an index.
3 On December 31, 2017, the Blended Benchmark computed by State Farm Investment Management Corp. consisted of 49.97% Russell 1000 Index, 34.84% MSCIACWI ex-U.S. IMI Index, 13.91% Cohen & Steers Realty Majors Index, 1.00% Bloomberg Barclays U.S. Aggregate Bond Index, and 0.28% Russell 2000 Index.Unlike an investment in the LifePath 2050 Fund, a theoretical investment in any of the Indices and the Blended Benchmark does not reflect any expenses. It is notpossible to invest directly in an index or the Blended Benchmark.
67

Performance AnalysisWhat factors helped and hindered performance of the LifePath 2050 Fund during the reporting period?
As of December 31, 2017, the LifePath Underlying Funds within the LifePath 2050 Fund had the following composition:
LifePath Underlying Fund% of LifePath 2050 Fund’s
Net Assets*
iShares Russell 1000 ETF 50.04%iShares Core MSCI EAFE ETF 24.25%iShares Cohen & Steers REIT ETF 13.52%iShares Core MSCI Emerging Markets ETF 8.48%iShares MSCI Canada ETF 2.31%iShares Core U.S. Aggregate Bond ETF 0.84%iShares Russell 2000 ETF 0.40%iShares TIPS Bond ETF 0.00%
*Table does not include 0.21% for short-term investments and -0.05% for cash and liabilities, net of other assets. Due to rounding, total may not add to 100%.
The main driver to performance for the LifePath 2050 Fund was its exposure to equities. At the end of December 2017, theLifePath 2050 Fund’s equity allocation was approximately 99% of total net assets. Within the equity allocation, the iShares Russell1000 ETF was the largest contributor to the LifePath 2050 Fund’s return for the year. Representative of large-cap U.S. stocks, theiShares Russell 1000 ETF posted a similar total return as its benchmark the Russell 1000 Index (21.52% vs. 21.69%, respectively)and as of year end accounted for approximately 51% of the equity allocation. At year end, the iShares Russell 1000 ETF consistedof 983 holdings, down from 999 at period start.
Support also came from U.S. small-cap stocks and foreign equities within the LifePath 2050 Fund’s equity allocation. For the year,the iShares Russell 2000 ETF, representing U.S. small-cap stocks, generated a 14.55% return, while the iShares Core MSCIEmerging Markets ETF and iShares Core MSCI EAFE ETF, representing foreign equities, generated total returns of 37.35% and27.05%, respectively.
Meanwhile, due in part to its relatively small weighting within the LifePath 2050 Fund, the iShares Core U.S. Aggregate BondETF — which comprised the entire fixed income portion of the Fund — was responsible for the smallest contribution to the Fund’sreturn. For the period, the iShares Core U.S. Aggregate Bond ETF gained 3.55%. Within fixed-income markets, during the yearinvestment grade bonds generally underperformed high-yield bonds, as represented by the 3.54% return of the BloombergBarclays U.S. Aggregate Bond Index versus the 7.51% gain from the Bloomberg Barclays High-Yield Bond Index. In addition,shorter-term bonds generally underperformed relative to intermediate- and longer-maturity bonds. Within the Bloomberg BarclaysU.S. Aggregate Bond Index, 1-3 year maturities yielded 0.86% while 5-7 year maturities and 10+ year maturities returned 2.59%and 10.47%, respectively.
Over the course of the year, the asset allocation adjustments within the LifePath 2050 Fund resulted in an approximate 1.1% and0.1% decrease to domestic equity and real estate securities, while the allocation to international equity increased 0.8%. The fixedincome allocation decreased approximately 0.1%.
Financial highlights for this Fund can be found on pages 222-223.
68

Expense Example (unaudited)As a shareholder of a Fund, you incur two types of costs: (1) transaction costs, including sales charges (loads) on purchase paymentsand certain redemptions; and (2) ongoing costs, including management fees; distribution and service (12b-1) fees; shareholderservicing fees; and other Fund expenses. The Example in the following table for each Fund below is intended to help you understandyour ongoing costs (in dollars) of investing in a Fund and to compare these costs with the ongoing costs of investing in other mutualfunds.
The Example is based on an investment of $1,000 invested at the beginning of the period and held for the entire period as stated in thetable for each Fund.
Actual ExpensesThe Actual information in the table under each Fund name below provides information about actual account values and actualexpenses for each Class of shares. You may use the information in this line, together with the amount you invested, to estimate theexpenses that you paid over the period. Simply divide your account value for a Fund Class by $1,000 (for example, an $8,600 accountvalue divided by $1,000 = 8.6), then multiply the result by the number in the Actual information line under the heading entitled“Expenses Paid During Period” for the applicable Fund Class to estimate the expenses you paid on your account for that Fund Classduring the period. If your account has multiple Fund positions, add up the results calculated for each Fund position by Class within youraccount to estimate the expenses you paid on your total account value. A potential account fee of $10 per calendar quarter is notincluded in the expenses shown in the table. This fee will be charged to an account holding Class A, Class B, Premier, Legacy Class Bor Institutional shares (other than a SEP IRA, SIMPLE IRA, Archer Medical Savings Account, Tax Sheltered Account under §403(b)(7) ofthe Internal Revenue Code or an account held under other employer-sponsored qualified retirement plans) if the balance in the accountfalls below $5,000 at the close of business on the second business day of the last month of the calendar quarter, unless the accounthas been open for less than a year as of the second business day of the last month of the calendar quarter. You should consider anyaccount fee you incurred when estimating the total ongoing expenses paid over the period and the impact of this fee on your endingaccount value. This additional fee has the effect of reducing investment returns.
Hypothetical Example for Comparison PurposesThe Hypothetical information in the table under each Fund name below provides information about hypothetical account values andhypothetical expenses based on the Fund’s actual expense ratio by Class and an assumed rate of return of 5% per year beforeexpenses, which is not the actual return of the Class indicated. The hypothetical account values and expenses may not be used toestimate the actual ending account balance or expenses you paid for the period. You may use this information to compare the ongoingcosts of investing in the Fund and other funds. To do so, compare this 5% hypothetical example with the 5% hypothetical examplesthat appear in the shareholder reports of the other funds. A potential account fee of $10 per calendar quarter is not included in theexpenses shown in the table. This fee will be charged to an account holding Class A, Class B, Premier, Legacy Class B or Institutionalshares (other than a SEP IRA, SIMPLE IRA, Archer Medical Savings Account, Tax Sheltered Account under §403(b)(7) of the InternalRevenue Code or an account held under other employer-sponsored qualified retirement plans) if the balance in the account falls below$5,000 at the close of business on the second business day of the last month of the calendar quarter, unless the account has beenopen for less than a year as of the second business day of the last month of the calendar quarter. You should consider any account feethat you incurred when estimating the total ongoing expenses paid over the period and the impact of this fee on your ending accountvalue. This additional fee has the effect of increasing the costs of investing.
Please note that the expenses shown in the tables are meant to highlight your ongoing costs only and do not reflect any transactionalcosts, such as sales charges (loads) applicable to Class A, Class B, Premier, and Legacy Class B shares. Therefore, the Hypotheticalinformation in the table under each Fund name is useful in comparing ongoing costs only, and will not help you determine the relativetotal costs of owning different funds. In addition, if these transactional costs were included, your costs would have been higher.
69

State Farm Equity Fund
BeginningAccount Value
July 1, 2017
EndingAccount Value
December 31, 2017
Annualized ExpenseRatio Based
on the PeriodJuly 1, 2017 to
December 31, 2017
Expenses PaidDuring PeriodJuly 1, 2017 to
December 31, 20171
Actual
Class A Shares $1,000.00 $1,133.77 0.89% $4.79
Class B Shares $1,000.00 $1,134.70 0.89% $4.79
Premier Shares $1,000.00 $1,134.52 0.79% $4.25
Legacy Class B Shares $1,000.00 $1,134.52 0.89% $4.79
Institutional Shares $1,000.00 $1,133.72 0.89% $4.79
Class R-1 Shares $1,000.00 $1,133.83 0.96% $5.16
Class R-2 Shares $1,000.00 $1,133.50 0.96% $5.16
Class R-3 Shares $1,000.00 $1,133.58 0.96% $5.16
Hypothetical (5% return before expenses)
Class A Shares $1,000.00 $1,020.72 0.89% $4.53
Class B Shares $1,000.00 $1,020.72 0.89% $4.53
Premier Shares $1,000.00 $1,021.22 0.79% $4.02
Legacy Class B Shares $1,000.00 $1,020.72 0.89% $4.53
Institutional Shares $1,000.00 $1,020.72 0.89% $4.53
Class R-1 Shares $1,000.00 $1,020.37 0.96% $4.89
Class R-2 Shares $1,000.00 $1,020.37 0.96% $4.89
Class R-3 Shares $1,000.00 $1,020.37 0.96% $4.89
State Farm Small/Mid Cap Equity Fund
BeginningAccount Value
July 1, 2017
EndingAccount Value
December 31, 2017
Annualized ExpenseRatio Based
on the PeriodJuly 1, 2017 to
December 31, 2017
Expenses PaidDuring PeriodJuly 1, 2017 to
December 31, 20171
Actual
Class A Shares $1,000.00 $1,088.58 0.84% $4.42
Class B Shares $1,000.00 $1,088.94 0.84% $4.42
Premier Shares $1,000.00 $1,088.36 0.74% $3.90
Legacy Class B Shares $1,000.00 $1,088.24 0.84% $4.42
Institutional Shares $1,000.00 $1,088.98 0.84% $4.42
Class R-1 Shares $1,000.00 $1,087.78 0.91% $4.79
Class R-2 Shares $1,000.00 $1,087.53 0.91% $4.79
Class R-3 Shares $1,000.00 $1,088.10 0.91% $4.79
Hypothetical (5% return before expenses)
Class A Shares $1,000.00 $1,020.97 0.84% $4.28
Class B Shares $1,000.00 $1,020.97 0.84% $4.28
Premier Shares $1,000.00 $1,021.48 0.74% $3.77
Legacy Class B Shares $1,000.00 $1,020.97 0.84% $4.28
Institutional Shares $1,000.00 $1,020.97 0.84% $4.28
Class R-1 Shares $1,000.00 $1,020.62 0.91% $4.63
Class R-2 Shares $1,000.00 $1,020.62 0.91% $4.63
Class R-3 Shares $1,000.00 $1,020.62 0.91% $4.63
70

State Farm International Equity Fund
BeginningAccount Value
July 1, 2017
EndingAccount Value
December 31, 2017
Annualized ExpenseRatio Based
on the PeriodJuly 1, 2017 to
December 31, 2017
Expenses PaidDuring PeriodJuly 1, 2017 to
December 31, 20171
Actual
Class A Shares $1,000.00 $1,109.69 1.23% $6.54
Class B Shares $1,000.00 $1,109.65 1.23% $6.54
Premier Shares $1,000.00 $1,110.49 1.13% $6.01
Legacy Class B Shares $1,000.00 $1,110.06 1.23% $6.54
Institutional Shares $1,000.00 $1,109.94 1.23% $6.54
Class R-1 Shares $1,000.00 $1,109.56 1.30% $6.91
Class R-2 Shares $1,000.00 $1,109.27 1.30% $6.91
Class R-3 Shares $1,000.00 $1,109.01 1.30% $6.91
Hypothetical (5% return before expenses)
Class A Shares $1,000.00 $1,019.00 1.23% $6.26
Class B Shares $1,000.00 $1,019.00 1.23% $6.26
Premier Shares $1,000.00 $1,019.51 1.13% $5.75
Legacy Class B Shares $1,000.00 $1,019.00 1.23% $6.26
Institutional Shares $1,000.00 $1,019.00 1.23% $6.26
Class R-1 Shares $1,000.00 $1,018.65 1.30% $6.61
Class R-2 Shares $1,000.00 $1,018.65 1.30% $6.61
Class R-3 Shares $1,000.00 $1,018.65 1.30% $6.61
State Farm S&P 500 Index Fund
BeginningAccount Value
July 1, 2017
EndingAccount Value
December 31, 2017
Annualized ExpenseRatio Based
on the PeriodJuly 1, 2017 to
December 31, 2017
Expenses PaidDuring PeriodJuly 1, 2017 to
December 31, 20171
Actual
Class A Shares $1,000.00 $1,111.63 0.39% $2.08
Class B Shares $1,000.00 $1,111.82 0.39% $2.08
Premier Shares $1,000.00 $1,112.61 0.29% $1.54
Legacy Class B Shares $1,000.00 $1,111.97 0.39% $2.08
Institutional Shares $1,000.00 $1,111.81 0.39% $2.08
Class R-1 Shares $1,000.00 $1,111.93 0.46% $2.45
Class R-2 Shares $1,000.00 $1,111.59 0.46% $2.45
Class R-3 Shares $1,000.00 $1,111.99 0.46% $2.45
Hypothetical (5% return before expenses)
Class A Shares $1,000.00 $1,023.24 0.39% $1.99
Class B Shares $1,000.00 $1,023.24 0.39% $1.99
Premier Shares $1,000.00 $1,023.74 0.29% $1.48
Legacy Class B Shares $1,000.00 $1,023.24 0.39% $1.99
Institutional Shares $1,000.00 $1,023.24 0.39% $1.99
Class R-1 Shares $1,000.00 $1,022.89 0.46% $2.35
Class R-2 Shares $1,000.00 $1,022.89 0.46% $2.35
Class R-3 Shares $1,000.00 $1,022.89 0.46% $2.35
71

State Farm Small Cap Index Fund
BeginningAccount Value
July 1, 2017
EndingAccount Value
December 31, 2017
Annualized ExpenseRatio Based
on the PeriodJuly 1, 2017 to
December 31, 2017
Expenses PaidDuring PeriodJuly 1, 2017 to
December 31, 20171
Actual
Class A Shares $1,000.00 $1,089.76 0.46% $2.42
Class B Shares $1,000.00 $1,089.38 0.46% $2.42
Premier Shares $1,000.00 $1,090.09 0.36% $1.90
Legacy Class B Shares $1,000.00 $1,089.13 0.46% $2.42
Institutional Shares $1,000.00 $1,089.16 0.46% $2.42
Class R-1 Shares $1,000.00 $1,089.33 0.53% $2.79
Class R-2 Shares $1,000.00 $1,089.01 0.53% $2.79
Class R-3 Shares $1,000.00 $1,088.98 0.53% $2.79
Hypothetical (5% return before expenses)
Class A Shares $1,000.00 $1,022.89 0.46% $2.35
Class B Shares $1,000.00 $1,022.89 0.46% $2.35
Premier Shares $1,000.00 $1,023.39 0.36% $1.84
Legacy Class B Shares $1,000.00 $1,022.89 0.46% $2.35
Institutional Shares $1,000.00 $1,022.89 0.46% $2.35
Class R-1 Shares $1,000.00 $1,022.53 0.53% $2.70
Class R-2 Shares $1,000.00 $1,022.53 0.53% $2.70
Class R-3 Shares $1,000.00 $1,022.53 0.53% $2.70
State Farm International Index Fund
BeginningAccount Value
July 1, 2017
EndingAccount Value
December 31, 2017
Annualized ExpenseRatio Based
on the PeriodJuly 1, 2017 to
December 31, 2017
Expenses PaidDuring PeriodJuly 1, 2017 to
December 31, 20171
Actual
Class A Shares $1,000.00 $1,093.78 0.57% $3.01
Class B Shares $1,000.00 $1,093.93 0.57% $3.01
Premier Shares $1,000.00 $1,094.33 0.47% $2.48
Legacy Class B Shares $1,000.00 $1,093.40 0.57% $3.01
Institutional Shares $1,000.00 $1,093.56 0.57% $3.01
Class R-1 Shares $1,000.00 $1,093.28 0.64% $3.38
Class R-2 Shares $1,000.00 $1,093.35 0.64% $3.38
Class R-3 Shares $1,000.00 $1,093.23 0.64% $3.38
Hypothetical (5% return before expenses)
Class A Shares $1,000.00 $1,022.33 0.57% $2.91
Class B Shares $1,000.00 $1,022.33 0.57% $2.91
Premier Shares $1,000.00 $1,022.84 0.47% $2.40
Legacy Class B Shares $1,000.00 $1,022.33 0.57% $2.91
Institutional Shares $1,000.00 $1,022.33 0.57% $2.91
Class R-1 Shares $1,000.00 $1,021.98 0.64% $3.26
Class R-2 Shares $1,000.00 $1,021.98 0.64% $3.26
Class R-3 Shares $1,000.00 $1,021.98 0.64% $3.26
72

State Farm Equity and Bond Fund 2
BeginningAccount Value
July 1, 2017
EndingAccount Value
December 31, 2017
Annualized ExpenseRatio Based
on the PeriodJuly 1, 2017 to
December 31, 2017
Expenses PaidDuring PeriodJuly 1, 2017 to
December 31, 20171
Actual
Class A Shares $1,000.00 $1,088.12 0.00% $0.00
Class B Shares $1,000.00 $1,087.15 0.00% $0.00
Premier Shares $1,000.00 $1,088.77 -0.10% -$0.53
Legacy Class B Shares $1,000.00 $1,086.78 0.00% $0.00
Institutional Shares $1,000.00 $1,089.47 0.00% $0.00
Class R-1 Shares $1,000.00 $1,087.08 0.07% $0.37
Class R-2 Shares $1,000.00 $1,088.35 0.07% $0.37
Class R-3 Shares $1,000.00 $1,088.09 0.07% $0.37
Hypothetical (5% return before expenses)
Class A Shares $1,000.00 $1,025.21 0.00% $0.00
Class B Shares $1,000.00 $1,025.21 0.00% $0.00
Premier Shares $1,000.00 $1,025.71 -0.10% -$0.51
Legacy Class B Shares $1,000.00 $1,025.21 0.00% $0.00
Institutional Shares $1,000.00 $1,025.21 0.00% $0.00
Class R-1 Shares $1,000.00 $1,024.85 0.07% $0.36
Class R-2 Shares $1,000.00 $1,024.85 0.07% $0.36
Class R-3 Shares $1,000.00 $1,024.85 0.07% $0.36
State Farm Bond Fund
BeginningAccount Value
July 1, 2017
EndingAccount Value
December 31, 2017
Annualized ExpenseRatio Based
on the PeriodJuly 1, 2017 to
December 31, 2017
Expenses PaidDuring PeriodJuly 1, 2017 to
December 31, 20171
Actual
Class A Shares $1,000.00 $1,021.27 0.40% $2.04
Class B Shares $1,000.00 $1,020.26 0.40% $2.04
Premier Shares $1,000.00 $1,021.38 0.30% $1.53
Legacy Class B Shares $1,000.00 $1,019.36 0.40% $2.04
Institutional Shares $1,000.00 $1,020.97 0.40% $2.04
Class R-1 Shares $1,000.00 $1,019.93 0.47% $2.39
Class R-2 Shares $1,000.00 $1,019.52 0.47% $2.39
Class R-3 Shares $1,000.00 $1,020.27 0.47% $2.39
Hypothetical (5% return before expenses)
Class A Shares $1,000.00 $1,023.19 0.40% $2.04
Class B Shares $1,000.00 $1,023.19 0.40% $2.04
Premier Shares $1,000.00 $1,023.69 0.30% $1.53
Legacy Class B Shares $1,000.00 $1,023.19 0.40% $2.04
Institutional Shares $1,000.00 $1,023.19 0.40% $2.04
Class R-1 Shares $1,000.00 $1,022.84 0.47% $2.40
Class R-2 Shares $1,000.00 $1,022.84 0.47% $2.40
Class R-3 Shares $1,000.00 $1,022.84 0.47% $2.40
73

State Farm Tax Advantaged Bond Fund
BeginningAccount Value
July 1, 2017
EndingAccount Value
December 31, 2017
Annualized ExpenseRatio Based
on the PeriodJuly 1, 2017 to
December 31, 2017
Expenses PaidDuring PeriodJuly 1, 2017 to
December 31, 20171
Actual
Class A Shares $1,000.00 $ 993.52 0.41% $2.06
Class B Shares $1,000.00 $ 992.53 0.41% $2.06
Premier Shares $1,000.00 $ 994.82 0.31% $1.56
Legacy Class B Shares $1,000.00 $ 992.52 0.41% $2.06
Hypothetical (5% return before expenses)
Class A Shares $1,000.00 $1,023.14 0.41% $2.09
Class B Shares $1,000.00 $1,023.14 0.41% $2.09
Premier Shares $1,000.00 $1,023.64 0.31% $1.58
Legacy Class B Shares $1,000.00 $1,023.14 0.41% $2.09
State Farm Money Market Fund
BeginningAccount Value
July 1, 2017
EndingAccount Value
December 31, 2017
Annualized ExpenseRatio Based
on the PeriodJuly 1, 2017 to
December 31, 2017
Expenses PaidDuring PeriodJuly 1, 2017 to
December 31, 20171
Actual
Class A Shares $1,000.00 $1,003.73 0.42% $2.12
Class B Shares $1,000.00 $1,002.67 0.61% $3.08
Premier Shares $1,000.00 $1,004.74 0.32% $1.62
Legacy Class B Shares $1,000.00 $1,002.45 0.66% $3.33
Institutional Shares $1,000.00 $1,004.12 0.42% $2.12
Class R-1 Shares $1,000.00 $1,002.41 0.64% $3.23
Class R-2 Shares $1,000.00 $1,002.88 0.54% $2.73
Class R-3 Shares $1,000.00 $1,003.42 0.49% $2.47
Hypothetical (5% return before expenses)
Class A Shares $1,000.00 $1,023.09 0.42% $2.14
Class B Shares $1,000.00 $1,022.13 0.61% $3.11
Premier Shares $1,000.00 $1,023.59 0.32% $1.63
Legacy Class B Shares $1,000.00 $1,021.88 0.66% $3.36
Institutional Shares $1,000.00 $1,023.09 0.42% $2.14
Class R-1 Shares $1,000.00 $1,021.98 0.64% $3.26
Class R-2 Shares $1,000.00 $1,022.48 0.54% $2.75
Class R-3 Shares $1,000.00 $1,022.74 0.49% $2.50
74

State Farm LifePath Retirement Fund 2
BeginningAccount Value
July 1, 2017
EndingAccount Value
December 31, 2017
Annualized ExpenseRatio Based
on the PeriodJuly 1, 2017 to
December 31, 2017
Expenses PaidDuring PeriodJuly 1, 2017 to
December 31, 20171
Actual
Class A Shares $1,000.00 $1,053.69 0.54% $2.80
Class B Shares $1,000.00 $1,051.73 0.54% $2.79
Premier Shares $1,000.00 $1,054.16 0.44% $2.28
Legacy Class B Shares $1,000.00 $1,052.31 0.54% $2.79
Institutional Shares $1,000.00 $1,053.78 0.54% $2.80
Class R-1 Shares $1,000.00 $1,051.99 0.61% $3.16
Class R-2 Shares $1,000.00 $1,052.14 0.61% $3.16
Class R-3 Shares $1,000.00 $1,053.12 0.61% $3.16
Hypothetical (5% return before expenses)
Class A Shares $1,000.00 $1,022.48 0.54% $2.75
Class B Shares $1,000.00 $1,022.48 0.54% $2.75
Premier Shares $1,000.00 $1,022.99 0.44% $2.24
Legacy Class B Shares $1,000.00 $1,022.48 0.54% $2.75
Institutional Shares $1,000.00 $1,022.48 0.54% $2.75
Class R-1 Shares $1,000.00 $1,022.13 0.61% $3.11
Class R-2 Shares $1,000.00 $1,022.13 0.61% $3.11
Class R-3 Shares $1,000.00 $1,022.13 0.61% $3.11
State Farm LifePath 2020 Fund 2
BeginningAccount Value
July 1, 2017
EndingAccount Value
December 31, 2017
Annualized ExpenseRatio Based
on the PeriodJuly 1, 2017 to
December 31, 2017
Expenses PaidDuring PeriodJuly 1, 2017 to
December 31, 20171
Actual
Class A Shares $1,000.00 $1,053.86 0.54% $2.80
Class B Shares $1,000.00 $1,053.79 0.54% $2.80
Premier Shares $1,000.00 $1,054.64 0.44% $2.28
Legacy Class B Shares $1,000.00 $1,053.72 0.54% $2.80
Institutional Shares $1,000.00 $1,053.76 0.54% $2.80
Class R-1 Shares $1,000.00 $1,052.95 0.61% $3.16
Class R-2 Shares $1,000.00 $1,053.33 0.61% $3.16
Class R-3 Shares $1,000.00 $1,053.18 0.61% $3.16
Hypothetical (5% return before expenses)
Class A Shares $1,000.00 $1,022.48 0.54% $2.75
Class B Shares $1,000.00 $1,022.48 0.54% $2.75
Premier Shares $1,000.00 $1,022.99 0.44% $2.24
Legacy Class B Shares $1,000.00 $1,022.48 0.54% $2.75
Institutional Shares $1,000.00 $1,022.48 0.54% $2.75
Class R-1 Shares $1,000.00 $1,022.13 0.61% $3.11
Class R-2 Shares $1,000.00 $1,022.13 0.61% $3.11
Class R-3 Shares $1,000.00 $1,022.13 0.61% $3.11
75

State Farm LifePath 2030 Fund 2
BeginningAccount Value
July 1, 2017
EndingAccount Value
December 31, 2017
Annualized ExpenseRatio Based
on the PeriodJuly 1, 2017 to
December 31, 2017
Expenses PaidDuring PeriodJuly 1, 2017 to
December 31, 20171
Actual
Class A Shares $1,000.00 $1,072.95 0.55% $2.87
Class B Shares $1,000.00 $1,072.97 0.55% $2.87
Premier Shares $1,000.00 $1,073.44 0.45% $2.35
Legacy Class B Shares $1,000.00 $1,073.10 0.55% $2.87
Institutional Shares $1,000.00 $1,072.53 0.55% $2.87
Class R-1 Shares $1,000.00 $1,072.44 0.62% $3.24
Class R-2 Shares $1,000.00 $1,071.83 0.62% $3.24
Class R-3 Shares $1,000.00 $1,072.53 0.62% $3.24
Hypothetical (5% return before expenses)
Class A Shares $1,000.00 $1,022.43 0.55% $2.80
Class B Shares $1,000.00 $1,022.43 0.55% $2.80
Premier Shares $1,000.00 $1,022.94 0.45% $2.29
Legacy Class B Shares $1,000.00 $1,022.43 0.55% $2.80
Institutional Shares $1,000.00 $1,022.43 0.55% $2.80
Class R-1 Shares $1,000.00 $1,022.08 0.62% $3.16
Class R-2 Shares $1,000.00 $1,022.08 0.62% $3.16
Class R-3 Shares $1,000.00 $1,022.08 0.62% $3.16
State Farm LifePath 2040 Fund 2
BeginningAccount Value
July 1, 2017
EndingAccount Value
December 31, 2017
Annualized ExpenseRatio Based
on the PeriodJuly 1, 2017 to
December 31, 2017
Expenses PaidDuring PeriodJuly 1, 2017 to
December 31, 20171
Actual
Class A Shares $1,000.00 $1,089.00 0.54% $2.84
Class B Shares $1,000.00 $1,089.02 0.54% $2.84
Premier Shares $1,000.00 $1,089.82 0.44% $2.32
Legacy Class B Shares $1,000.00 $1,089.09 0.54% $2.84
Institutional Shares $1,000.00 $1,088.81 0.54% $2.84
Class R-1 Shares $1,000.00 $1,088.57 0.61% $3.21
Class R-2 Shares $1,000.00 $1,088.96 0.61% $3.21
Class R-3 Shares $1,000.00 $1,088.30 0.61% $3.21
Hypothetical (5% return before expenses)
Class A Shares $1,000.00 $1,022.48 0.54% $2.75
Class B Shares $1,000.00 $1,022.48 0.54% $2.75
Premier Shares $1,000.00 $1,022.99 0.44% $2.24
Legacy Class B Shares $1,000.00 $1,022.48 0.54% $2.75
Institutional Shares $1,000.00 $1,022.48 0.54% $2.75
Class R-1 Shares $1,000.00 $1,022.13 0.61% $3.11
Class R-2 Shares $1,000.00 $1,022.13 0.61% $3.11
Class R-3 Shares $1,000.00 $1,022.13 0.61% $3.11
76

State Farm LifePath 2050 Fund 2
BeginningAccount Value
July 1, 2017
EndingAccount Value
December 31, 2017
Annualized ExpenseRatio Based
on the PeriodJuly 1, 2017 to
December 31, 2017
Expenses PaidDuring PeriodJuly 1, 2017 to
December 31, 20171
Actual
Class A Shares $1,000.00 $1,096.30 0.58% $3.06
Premier Shares $1,000.00 $1,096.80 0.48% $2.54
Class R-1 Shares $1,000.00 $1,094.84 0.65% $3.43
Class R-2 Shares $1,000.00 $1,095.19 0.65% $3.43
Hypothetical (5% return before expenses)
Class A Shares $1,000.00 $1,022.28 0.58% $2.96
Premier Shares $1,000.00 $1,022.79 0.48% $2.45
Class R-1 Shares $1,000.00 $1,021.93 0.65% $3.31
Class R-2 Shares $1,000.00 $1,021.93 0.65% $3.31
1 Expenses are equal to the applicable Fund’s annualized expense ratio (provided in the table), multiplied by the average account value over the period, multipliedby 184/365 (to reflect the one-half year period).
2 The expense examples do not reflect acquired fund fees and expenses.
77
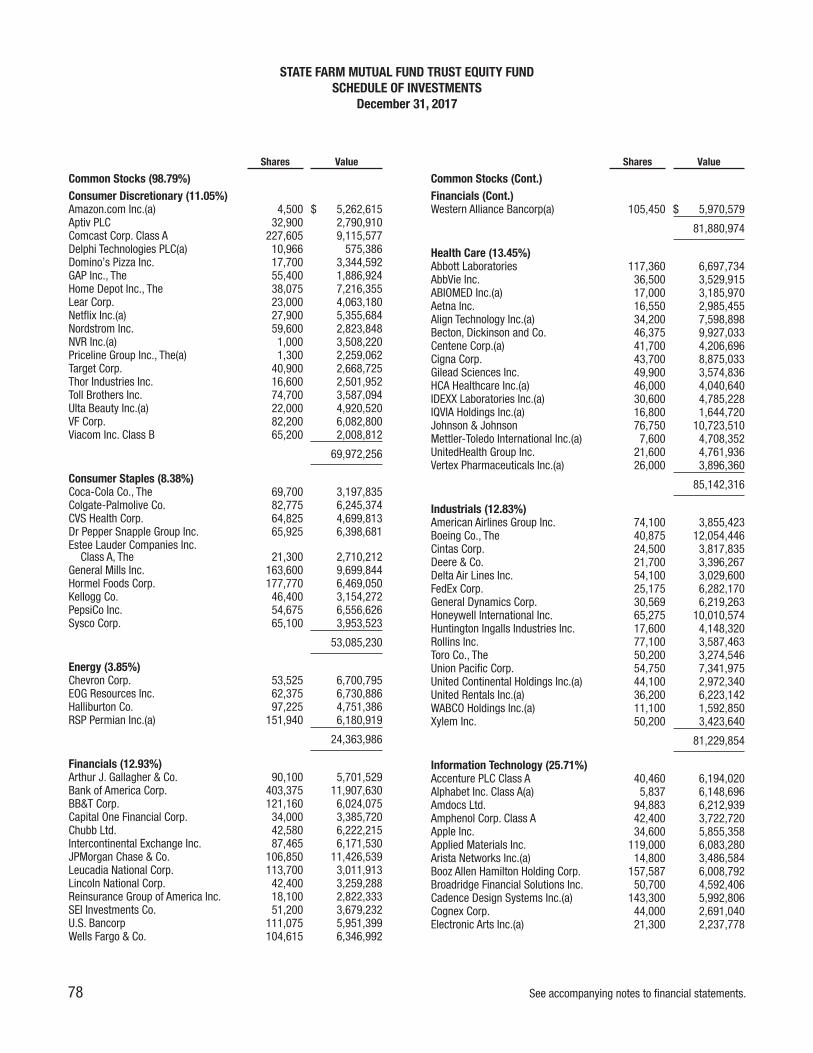
Shares Value
Common Stocks (98.79%)Consumer Discretionary (11.05%)Amazon.com Inc.(a) 4,500 $ 5,262,615Aptiv PLC 32,900 2,790,910Comcast Corp. Class A 227,605 9,115,577Delphi Technologies PLC(a) 10,966 575,386Domino’s Pizza Inc. 17,700 3,344,592GAP Inc., The 55,400 1,886,924Home Depot Inc., The 38,075 7,216,355Lear Corp. 23,000 4,063,180Netflix Inc.(a) 27,900 5,355,684Nordstrom Inc. 59,600 2,823,848NVR Inc.(a) 1,000 3,508,220Priceline Group Inc., The(a) 1,300 2,259,062Target Corp. 40,900 2,668,725Thor Industries Inc. 16,600 2,501,952Toll Brothers Inc. 74,700 3,587,094Ulta Beauty Inc.(a) 22,000 4,920,520VF Corp. 82,200 6,082,800Viacom Inc. Class B 65,200 2,008,812
69,972,256
Consumer Staples (8.38%)Coca-Cola Co., The 69,700 3,197,835Colgate-Palmolive Co. 82,775 6,245,374CVS Health Corp. 64,825 4,699,813Dr Pepper Snapple Group Inc. 65,925 6,398,681Estee Lauder Companies Inc.
Class A, The 21,300 2,710,212General Mills Inc. 163,600 9,699,844Hormel Foods Corp. 177,770 6,469,050Kellogg Co. 46,400 3,154,272PepsiCo Inc. 54,675 6,556,626Sysco Corp. 65,100 3,953,523
53,085,230
Energy (3.85%)Chevron Corp. 53,525 6,700,795EOG Resources Inc. 62,375 6,730,886Halliburton Co. 97,225 4,751,386RSP Permian Inc.(a) 151,940 6,180,919
24,363,986
Financials (12.93%)Arthur J. Gallagher & Co. 90,100 5,701,529Bank of America Corp. 403,375 11,907,630BB&T Corp. 121,160 6,024,075Capital One Financial Corp. 34,000 3,385,720Chubb Ltd. 42,580 6,222,215Intercontinental Exchange Inc. 87,465 6,171,530JPMorgan Chase & Co. 106,850 11,426,539Leucadia National Corp. 113,700 3,011,913Lincoln National Corp. 42,400 3,259,288Reinsurance Group of America Inc. 18,100 2,822,333SEI Investments Co. 51,200 3,679,232U.S. Bancorp 111,075 5,951,399Wells Fargo & Co. 104,615 6,346,992
Shares Value
Common Stocks (Cont.)Financials (Cont.)Western Alliance Bancorp(a) 105,450 $ 5,970,579
81,880,974
Health Care (13.45%)Abbott Laboratories 117,360 6,697,734AbbVie Inc. 36,500 3,529,915ABIOMED Inc.(a) 17,000 3,185,970Aetna Inc. 16,550 2,985,455Align Technology Inc.(a) 34,200 7,598,898Becton, Dickinson and Co. 46,375 9,927,033Centene Corp.(a) 41,700 4,206,696Cigna Corp. 43,700 8,875,033Gilead Sciences Inc. 49,900 3,574,836HCA Healthcare Inc.(a) 46,000 4,040,640IDEXX Laboratories Inc.(a) 30,600 4,785,228IQVIA Holdings Inc.(a) 16,800 1,644,720Johnson & Johnson 76,750 10,723,510Mettler-Toledo International Inc.(a) 7,600 4,708,352UnitedHealth Group Inc. 21,600 4,761,936Vertex Pharmaceuticals Inc.(a) 26,000 3,896,360
85,142,316
Industrials (12.83%)American Airlines Group Inc. 74,100 3,855,423Boeing Co., The 40,875 12,054,446Cintas Corp. 24,500 3,817,835Deere & Co. 21,700 3,396,267Delta Air Lines Inc. 54,100 3,029,600FedEx Corp. 25,175 6,282,170General Dynamics Corp. 30,569 6,219,263Honeywell International Inc. 65,275 10,010,574Huntington Ingalls Industries Inc. 17,600 4,148,320Rollins Inc. 77,100 3,587,463Toro Co., The 50,200 3,274,546Union Pacific Corp. 54,750 7,341,975United Continental Holdings Inc.(a) 44,100 2,972,340United Rentals Inc.(a) 36,200 6,223,142WABCO Holdings Inc.(a) 11,100 1,592,850Xylem Inc. 50,200 3,423,640
81,229,854
Information Technology (25.71%)Accenture PLC Class A 40,460 6,194,020Alphabet Inc. Class A(a) 5,837 6,148,696Amdocs Ltd. 94,883 6,212,939Amphenol Corp. Class A 42,400 3,722,720Apple Inc. 34,600 5,855,358Applied Materials Inc. 119,000 6,083,280Arista Networks Inc.(a) 14,800 3,486,584Booz Allen Hamilton Holding Corp. 157,587 6,008,792Broadridge Financial Solutions Inc. 50,700 4,592,406Cadence Design Systems Inc.(a) 143,300 5,992,806Cognex Corp. 44,000 2,691,040Electronic Arts Inc.(a) 21,300 2,237,778
STATE FARM MUTUAL FUND TRUST EQUITY FUNDSCHEDULE OF INVESTMENTS
December 31, 2017
78 See accompanying notes to financial statements.

Shares Value
Common Stocks (Cont.)Information Technology (Cont.)F5 Networks Inc.(a) 23,300 $ 3,057,426GoDaddy Inc. Class A(a) 43,300 2,177,124Intel Corp. 74,700 3,448,152Intuit Inc. 34,600 5,459,188IPG Photonics Corp.(a) 12,000 2,569,560KLA-Tencor Corp. 32,400 3,404,268Lam Research Corp. 55,825 10,275,708Mastercard Inc. Class A 24,400 3,693,184Microchip Technology Inc. 28,900 2,539,732Micron Technology Inc.(a) 156,700 6,443,504Microsoft Corp. 88,005 7,527,948Motorola Solutions Inc. 65,875 5,951,148NVIDIA Corp. 37,700 7,294,950ON Semiconductor Corp.(a) 193,700 4,056,078Oracle Corp. 122,425 5,788,254PayPal Holdings Inc.(a) 55,300 4,071,186Red Hat Inc.(a) 20,100 2,414,010ServiceNow Inc.(a) 36,100 4,707,079Take-Two Interactive Software Inc.(a) 31,700 3,480,026Teradyne Inc. 75,200 3,148,624Texas Instruments Inc. 87,920 9,182,365Western Digital Corp. 35,700 2,839,221
162,755,154
Materials (3.78%)Avery Dennison Corp. 27,200 3,124,192Crown Holdings Inc.(a) 52,700 2,964,375Ecolab Inc. 24,300 3,260,574LyondellBasell Industries NV
Class A 33,100 3,651,592Sherwin-Williams Co., The 13,805 5,660,602Southern Copper Corp. 111,500 5,290,675
23,952,010
Real Estate (2.56%)CBRE Group Inc. Class A(a) 86,600 3,750,646Public Storage 28,850 6,029,649Simon Property Group Inc. 37,525 6,444,544
16,224,839
Telecommunication Services (2.37%)AT&T Inc. 263,650 10,250,712T-Mobile US Inc.(a) 74,400 4,725,144
14,975,856
Shares Value
Common Stocks (Cont.)Utilities (1.88%)NextEra Energy Inc. 38,250 $ 5,974,268WEC Energy Group Inc. 89,500 5,945,485
11,919,753Total Common Stocks(cost $461,580,845) 625,502,228
Short-term Investments (1.27%)JPMorgan U.S. Government Money
Market Fund Capital Shares,1.17%(b) 8,008,549 8,008,549
Total Short-term Investments(cost $8,008,549) 8,008,549
TOTAL INVESTMENTS (100.06%)(cost $469,589,394) 633,510,777
LIABILITIES, NET OF OTHER ASSETS (-0.06%) (354,281)
NET ASSETS (100.00%) $ 633,156,496
(a) Non-income producing security.(b) Rate shown is the 7-day yield as of December 31, 2017.
STATE FARM MUTUAL FUND TRUST EQUITY FUNDSCHEDULE OF INVESTMENTS (continued)
December 31, 2017
See accompanying notes to financial statements. 79

Shares Value
Common Stocks (47.49%)Consumer Discretionary (8.03%)American Axle & Manufacturing
Holdings Inc.(a) 84,000 $ 1,430,520Big 5 Sporting Goods Corp. 92,300 701,480Caleres Inc. 27,600 924,048Conn’s Inc.(a) 49,000 1,741,950Container Store Group Inc., The(a) 156,600 742,284Crocs Inc.(a) 150,300 1,899,792Dana Inc. 98,000 3,136,980Del Taco Restaurants Inc.(a) 89,100 1,079,892Fossil Group Inc.(a) 51,000 396,270KB Home 61,900 1,977,705LGI Homes Inc.(a) 29,600 2,220,888M.D.C. Holdings Inc. 44,496 1,418,533Office Depot Inc. 366,500 1,297,410Tailored Brands Inc. 84,100 1,835,903Tower International Inc. 56,300 1,719,965Weight Watchers International Inc.(a) 36,900 1,633,932
24,157,552
Consumer Staples (1.33%)Sanderson Farms Inc. 21,100 2,928,258SUPERVALU Inc.(a) 49,442 1,067,947
3,996,205
Energy (3.49%)Arch Coal Inc. Class A 18,800 1,751,408California Resources Corp.(a) 131,725 2,560,734Cloud Peak Energy Inc.(a) 238,700 1,062,215Denbury Resources Inc.(a) 267,100 590,291Rowan Companies PLC Class A(a) 142,600 2,233,116Ship Finance International Ltd. 97,400 1,509,700W&T Offshore Inc.(a) 234,600 776,526
10,483,990
Financials (12.23%)American Equity Investment Life
Holding Co. 101,300 3,112,949Banco Latinoamericano de Comercio
Exterior SA 64,700 1,740,430Banner Corp. 26,300 1,449,656Capitol Federal Financial Inc. 123,200 1,652,112Employers Holdings Inc. 43,600 1,935,840Enstar Group Ltd.(a) 7,700 1,545,775FBL Financial Group Inc. Class A 11,900 828,835First BanCorp(a) 237,000 1,208,700Flagstar Bancorp Inc.(a) 24,200 905,564Heartland Financial USA Inc. 29,200 1,566,580Investors Bancorp Inc. 148,600 2,062,568Kearny Financial Corp. 129,500 1,871,275National Western Life Group Inc.
Class A 6,700 2,217,834Nationstar Mortgage Holdings Inc.(a) 101,500 1,877,750Ocwen Financial Corp.(a) 313,100 980,003PHH Corp.(a) 81,600 840,480Safety Insurance Group Inc. 22,600 1,817,040Selective Insurance Group Inc. 49,200 2,888,040
Shares Value
Common Stocks (Cont.)Financials (Cont.)Stifel Financial Corp. 21,800 $ 1,298,408Tristate Capital Holdings Inc.(a) 81,700 1,879,100Walker & Dunlop Inc.(a) 50,300 2,389,250Washington Trust Bancorp Inc. 13,800 734,850
36,803,039
Health Care (2.90%)Community Health Systems Inc.(a) 72,100 307,146Enanta Pharmaceuticals Inc.(a) 13,900 815,652Kindred Healthcare Inc. 209,600 2,033,120LHC Group Inc.(a) 30,800 1,886,500Magellan Health Inc.(a) 22,700 2,191,685Triple-S Management Corp. Class B(a) 60,100 1,493,485
8,727,588
Industrials (7.69%)ABM Industries Inc. 19,600 739,312Acco Brands Corp.(a) 213,000 2,598,600Aircastle Ltd. 56,600 1,323,874Albany International Corp. Class A 27,100 1,665,295Casella Waste Systems Inc. Class A(a) 44,700 1,028,994EMCOR Group Inc. 11,500 940,125Federal Signal Corp. 18,800 377,692GATX Corp. 34,200 2,125,872Greenbrier Companies Inc., The 41,800 2,227,940MasTec Inc.(a) 17,200 841,940Meritor Inc.(a) 95,900 2,249,814SkyWest Inc. 86,400 4,587,840Spartan Motors Inc. 20,000 315,000Sterling Construction Company Inc.(a) 129,700 2,111,516
23,133,814
Information Technology (5.42%)AVX Corp. 96,600 1,671,180Benchmark Electronics Inc.(a) 25,400 739,140ePlus inc.(a) 23,800 1,789,760Rosetta Stone Inc.(a) 60,900 759,423Sanmina Corp.(a) 89,400 2,950,200Sykes Enterprises Inc.(a) 35,600 1,119,620Systemax Inc. 51,700 1,720,059Tech Data Corp.(a) 17,500 1,714,475TTM Technologies Inc.(a) 60,000 940,200Unisys Corp.(a) 68,000 554,200Vishay Intertechnology Inc. 113,400 2,353,050
16,311,307
Materials (1.60%)Materion Corp. 23,100 1,122,660Ryerson Holding Corp.(a) 152,000 1,580,800SunCoke Energy Inc.(a) 174,800 2,095,852
4,799,312
Real Estate (2.82%)Bluerock Residential Growth REIT Inc. 24,100 243,651CBL & Associates Properties Inc. 197,900 1,120,114
STATE FARM MUTUAL FUND TRUST SMALL/MID CAP EQUITY FUNDSCHEDULE OF INVESTMENTS
December 31, 2017
80 See accompanying notes to financial statements.
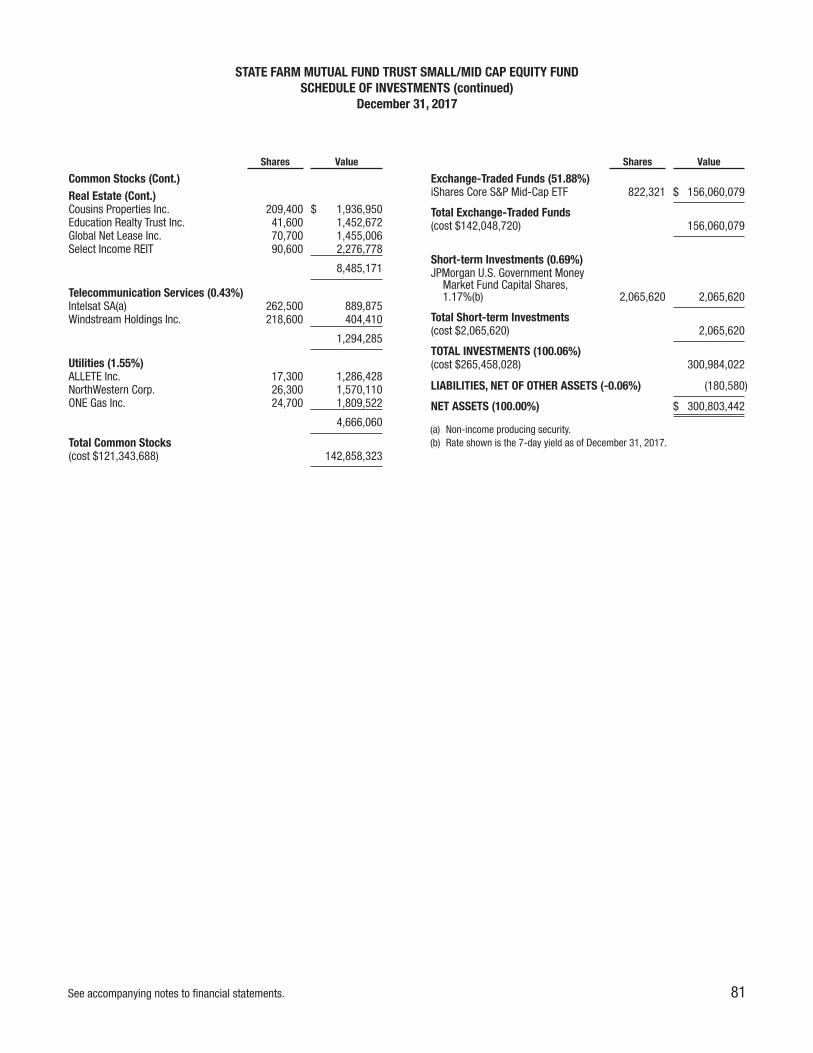
Shares Value
Common Stocks (Cont.)Real Estate (Cont.)Cousins Properties Inc. 209,400 $ 1,936,950Education Realty Trust Inc. 41,600 1,452,672Global Net Lease Inc. 70,700 1,455,006Select Income REIT 90,600 2,276,778
8,485,171
Telecommunication Services (0.43%)Intelsat SA(a) 262,500 889,875Windstream Holdings Inc. 218,600 404,410
1,294,285
Utilities (1.55%)ALLETE Inc. 17,300 1,286,428NorthWestern Corp. 26,300 1,570,110ONE Gas Inc. 24,700 1,809,522
4,666,060
Total Common Stocks(cost $121,343,688) 142,858,323
Shares Value
Exchange-Traded Funds (51.88%)iShares Core S&P Mid-Cap ETF 822,321 $ 156,060,079
Total Exchange-Traded Funds(cost $142,048,720) 156,060,079
Short-term Investments (0.69%)JPMorgan U.S. Government Money
Market Fund Capital Shares,1.17%(b) 2,065,620 2,065,620
Total Short-term Investments(cost $2,065,620) 2,065,620
TOTAL INVESTMENTS (100.06%)(cost $265,458,028) 300,984,022
LIABILITIES, NET OF OTHER ASSETS (-0.06%) (180,580)
NET ASSETS (100.00%) $ 300,803,442
(a) Non-income producing security.(b) Rate shown is the 7-day yield as of December 31, 2017.
STATE FARM MUTUAL FUND TRUST SMALL/MID CAP EQUITY FUNDSCHEDULE OF INVESTMENTS (continued)
December 31, 2017
See accompanying notes to financial statements. 81

Shares Value
Common Stocks (a) (98.12%)Australia (1.22%)Domino’s Pizza Enterprises Ltd. 54,901 $ 2,000,466
Austria (0.32%)Bawag Group AG(b)(c) 9,684 516,596
Belgium (2.25%)Anheuser-Busch InBev SA/NV 32,896 3,675,864
Brazil (0.65%)Ambev SA 15,500 99,486Ambev SA ADR 15,544 100,414Cielo SA 121,800 863,474
1,063,374
Canada (2.31%)Barrick Gold Corp. 16,344 236,498Constellation Software Inc. 2,844 1,724,093Dollarama Inc. 14,479 1,809,011
3,769,602
China (4.92%)Alibaba Group Holding Ltd. Sponsored
ADR(b) 32,456 5,596,388Ctrip.com International Ltd. ADR(b) 42,163 1,859,388Sinopharm Group Co. Ltd. H Shares 136,800 591,825
8,047,601
Colombia (1.49%)Bancolombia SA Sponsored ADR 21,422 849,597Cementos Argos SA 154,619 596,834Grupo Argos SA 36,196 253,235Grupo Aval Acciones y Valores SA ADR 23,817 202,445Grupo de Inversiones Suramericana 39,326 531,034
2,433,145
Denmark (1.38%)Genmab A/S(b) 4,356 722,408Novo Nordisk A/S Class B 28,605 1,542,117
2,264,525
France (11.98%)AXA SA 45,988 1,364,844Cie Generale des Etablissements
Michelin Class B 11,867 1,702,226Dassault Systemes SA 13,763 1,462,933Essilor International SA 13,122 1,809,821Eurofins Scientific SE 2,844 1,732,120Hermes International 228 122,079JC Decaux SA 17,059 687,835L’Oreal SA 6,940 1,540,070Pernod Ricard SA 11,612 1,838,413Schneider Electric SE (Paris) 17,529 1,490,338UbiSoft Entertainment SA(b) 30,458 2,343,997Unibail-Rodamco SE (Amsterdam) 5,507 1,387,590
Shares Value
Common Stocks (Cont.)France (Cont.)Unibail-Rodamco SE (Paris) 253 $ 63,748Vivendi 75,707 2,036,565
19,582,579
Germany (12.89%)Allianz SE Reg. 6,609 1,518,557Aroundtown SA 233,884 1,800,494Bayer AG Reg. 37,116 4,631,495Deutsche Boerse AG 24,054 2,793,762Fresenius SE & Co. KGaA 11,899 929,005Linde AG Tender Shares(b) 8,000 1,868,406SAP SE 26,684 2,991,968Scout24 AG(c) 51,333 2,097,203Wirecard AG 21,887 2,444,121
21,075,011
Hong Kong (3.45%)MGM China Holdings Ltd. 712,000 2,155,270Tencent Holdings Ltd. 67,000 3,481,700
5,636,970
India (1.67%)HDFC Bank Ltd. ADR 16,569 1,684,570Makemytrip Ltd.(b) 35,267 1,052,720
2,737,290
Ireland (1.50%)Ryanair Holdings PLC SP ADR(b) 23,533 2,451,903
Israel (0.53%)Teva Pharmaceutical Industries Ltd.
Sponsored ADR 45,771 867,360
Italy (1.25%)Telecom Italia SpA(b) 725,541 627,224Telecom Italia SpA RSP 220,654 157,792UniCredit SpA(b) 67,720 1,265,934
2,050,950
Japan (10.25%)Dentsu Inc. 15,100 639,916Fanuc Corp. 19,400 4,659,099Hoya Corp. 16,400 819,163Japan Tobacco Inc. 25,036 806,796LIFULL Co. Ltd. 111,100 993,910MISUMI Group Inc. 83,600 2,433,619Nintendo Co. Ltd. 2,100 767,686Olympus Corp. 30,100 1,154,045Sapporo Holdings Ltd. 5,000 153,095SMC Corp. 1,500 617,440SoftBank Group Corp. 9,600 759,991START TODAY Co. Ltd. 29,100 884,557Sumitomo Mitsui Financial Group Inc. 8,400 362,913
STATE FARM MUTUAL FUND TRUST INTERNATIONAL EQUITY FUNDSCHEDULE OF INVESTMENTS
December 31, 2017
82 See accompanying notes to financial statements.

Shares Value
Common Stocks (Cont.)Japan (Cont.)Tokio Marine Holdings Inc. 37,400 $ 1,706,442
16,758,672
Malaysia (0.01%)Genting BHD Warrants(b) 59,490 21,756
Mexico (0.90%)Becle SAB de CV(b) 5,500 8,839Bolsa Mexicana de Valores SAB de CV 382,045 656,933Fibra Uno Administracion SA de CV 222,700 329,477Fibra Uno Administracion SA de CV(c) 84,400 124,867Grupo Televisa SAB Sponsored ADR 19,241 359,229
1,479,345
Netherlands (9.56%)ASML Holding NV 31,445 5,476,402Heineken NV 18,340 1,912,915ING Groep NV 11,450 210,539InterXion Holding NV(b) 75,069 4,423,816Koninklijke Philips NV 62,756 2,374,891QIAGEN NV 39,932 1,235,097
15,633,660
Norway (0.27%)Statoil ASA 20,576 439,056
Spain (1.30%)Banco Bilbao Vizcaya Argentaria SA 164,795 1,406,250Cellnex Telecom SA(c) 28,169 721,599
2,127,849
Sweden (1.71%)Atlas Copco AB Class A 47,703 2,059,758Investor AB B Shares 16,167 737,291
2,797,049
Switzerland (5.68%)Compagnie Financiere Richemont
SA Reg. 13,555 1,228,289Julius Baer Group Ltd. 50,762 3,104,742LafargeHolcim Ltd. Reg. 13,827 779,715Nestle SA Reg. 16,943 1,457,051Novartis AG Reg. 16,206 1,370,388UBS Group AG 72,776 1,339,834
9,280,019
United Kingdom (13.12%)ASOS PLC(b) 10,577 958,939B&M European Value Retail SA 238,410 1,363,524ConvaTec Group PLC(c) 132,653 368,053Dechra Pharmaceuticals PLC 57,399 1,624,344Diageo PLC 44,538 1,638,625Domino’s Pizza Group PLC 374,185 1,746,498Great Portland Estates PLC 21,613 200,910Hargreaves Lansdown PLC 94,402 2,296,774
Shares Value
Common Stocks (Cont.)United Kingdom (Cont.)Just Eat PLC(b) 108,828 $ 1,147,556Land Securities Group PLC 13,225 179,985Liberty Global PLC Class A(b) 10,872 389,652Liberty Global PLC Series C(b) 9,792 331,361Liberty Latin America Ltd. Class A(b) 1,032 20,795Liberty Latin America Ltd. Class C(b) 1,221 24,286Reckitt Benckiser Group PLC 43,791 4,090,821Rolls-Royce Holdings PLC 136,893 1,565,478Rolls-Royce Holdings PLC Class C
Entitlement Shares(b)(d) 6,297,078 8,502Shire PLC 31,916 1,680,565Standard Chartered PLC(b) 127,858 1,346,668Weir Group PLC, The 16,483 472,464
21,455,800
United States (7.51%)Las Vegas Sands Corp. 63,831 4,435,616Schlumberger Ltd. 43,771 2,949,728Worldpay Inc. Class A(b) 27,536 2,025,273Wynn Resorts Ltd. 17,044 2,873,448
12,284,065Total Common Stocks(cost $119,342,366) 160,450,507
Preferred Stocks (a) (0.14%)Colombia (0.14%)Grupo Argos SA, 0.00% 22,328 143,495Grupo de Inversiones
Suramericana, 0.00% 6,928 90,533
234,028Total Preferred Stocks(cost $220,324) 234,028
STATE FARM MUTUAL FUND TRUST INTERNATIONAL EQUITY FUNDSCHEDULE OF INVESTMENTS (continued)
December 31, 2017
See accompanying notes to financial statements. 83

Shares Value
Short-term Investments (0.87%)State Street Institutional U.S.
Government Money Market FundPremier Class, 1.21%(e) 1,422,205 $ 1,422,205
Total Short-term Investments(cost $1,422,205) 1,422,205
TOTAL INVESTMENTS (99.13%)(cost $120,984,895) 162,106,740
CASH AND OTHER ASSETS, NET OFLIABILITIES (0.87%) 1,420,943
NET ASSETS (100.00%) $ 163,527,683
(a) The Fund used data provided by an independent statistical fair value serviceto fair value its holdings listed on the Sao Paulo (Brazil) Stock Exchangewhich did not trade on the last day of the period because the exchange wasclosed. This method of fair valuing foreign securities was established in thevaluation procedures adopted by the Board of Trustees.
(b) Non-income producing security.(c) Securities exempt from registration pursuant to Rule 144A under the
Securities Act of 1933. These securities may be resold in transactionsexempt from registration, normally to qualified institutional buyers. AtDecember 31, 2017, the value of these securities amounted to $3,828,318or 2.34% of net assets.
(d) In accordance with the Trust’s valuation procedures, State Farm InvestmentManagement Corp. (“SFIMC”) determined the fair value for the securityconsidering the facts and circumstances related to the particular security.The fair value for this security was not determined using the Trust’sindependent statistical fair value service.
(e) Rate shown is the 7-day yield as of December 31, 2017.
ADR – American Depositary Receipt
FOREIGN CURRENCY DENOMINATIONS
Currency Value %
Euro $ 59,003,596 36.40United States Dollar 35,391,789 21.83British Pound 20,689,706 12.76Japanese Yen 16,758,672 10.34Swiss Franc 9,280,019 5.73Hong Kong Dollar 6,228,795 3.84Canadian Dollar 3,533,104 2.18Swedish Krona 2,797,049 1.73Danish Krone 2,264,525 1.40Australian Dollar 2,000,466 1.23Colombian Peso 1,615,131 1.00Mexican Peso 1,120,116 0.69Brazilian Real 962,960 0.59Norwegian Krone 439,056 0.27Malaysian Ringgit 21,756 0.01
Total Investments $162,106,740 100.00%
SECTOR CLASSIFICATIONS
Sector Value %
Information Technology $ 36,846,610 22.53Consumer Discretionary 29,697,336 18.16Financials 23,986,258 14.67Health Care 23,452,697 14.34Consumer Staples 17,322,389 10.59Industrials 15,758,601 9.64Real Estate 4,087,071 2.50Materials 3,878,183 2.37Energy 3,388,784 2.07Telecommunication Services 2,266,606 1.39
Total Stocks 160,684,535 98.26Short-term Investments 1,422,205 0.87Cash and Other Assets, Net of Liabilities 1,420,943 0.87
Net Assets $163,527,683 100.00%
{
STATE FARM MUTUAL FUND TRUST INTERNATIONAL EQUITY FUNDSCHEDULE OF INVESTMENTS (continued)
December 31, 2017
84 See accompanying notes to financial statements.

Shares Value
Common Stocks (97.73%)Consumer Discretionary (11.93%)Advance Auto Parts Inc. 4,818 $ 480,306Amazon.com Inc.(a) 26,522 31,016,683Aptiv PLC 17,888 1,517,439AutoZone Inc.(a) 1,819 1,293,982Best Buy Co. Inc. 16,830 1,152,350BorgWarner Inc. 13,330 681,032CarMax Inc.(a) 12,148 779,051Carnival Corp. 26,988 1,791,194CBS Corp. Class B 23,994 1,415,646Charter Communications Inc.
Class A(a) 12,833 4,311,375Chipotle Mexican Grill Inc.(a) 1,672 483,258Comcast Corp. Class A 308,665 12,362,033Darden Restaurants Inc. 8,352 801,959Discovery Communications Inc.
Class A(a) 9,171 205,247Discovery Communications Inc.
Class C(a) 14,844 314,247DISH Network Corp. Class A(a) 15,030 717,683Dollar General Corp. 17,278 1,607,027Dollar Tree Inc.(a) 15,604 1,674,465DR Horton Inc. 22,428 1,145,398Expedia Inc. 8,167 978,162Foot Locker Inc. 8,958 419,951Ford Motor Co. 261,170 3,262,013GAP Inc., The 14,509 494,177Garmin Ltd. 7,868 468,697General Motors Co. 84,597 3,467,631Genuine Parts Co. 9,855 936,324Goodyear Tire & Rubber Co., The 16,620 536,992H&R Block Inc. 13,383 350,902Hanesbrands Inc. 24,898 520,617Harley-Davidson Inc. 11,829 601,860Hasbro Inc. 7,501 681,766Hilton Worldwide Holdings Inc. 13,737 1,097,037Home Depot Inc., The 77,448 14,678,719Interpublic Group of Companies
Inc., The 26,257 529,341Kohl’s Corp. 11,153 604,827L Brands Inc. 15,900 957,498Leggett & Platt Inc. 8,828 421,360Lennar Corp. Class A 13,470 851,843LKQ Corp.(a) 20,105 817,670Lowe’s Companies Inc. 55,112 5,122,109Macy’s Inc. 20,403 513,952Marriott International Inc. Class A 20,266 2,750,704Mattel Inc. 22,466 345,527McDonald’s Corp. 52,754 9,080,018MGM Resorts International 33,718 1,125,844Michael Kors Holdings Ltd.(a) 10,467 658,898Mohawk Industries Inc.(a) 4,172 1,151,055Netflix Inc.(a) 28,643 5,498,310Newell Brands Inc. 31,915 986,174News Corp. Class A 25,331 410,616News Corp. Class B 7,929 131,621NIKE Inc. Class B 86,952 5,438,848Nordstrom Inc. 7,696 364,636
Shares Value
Common Stocks (Cont.)Consumer Discretionary (Cont.)Norwegian Cruise Line Holdings
Ltd.(a) 11,852 $ 631,119Omnicom Group Inc. 15,734 1,145,907O’Reilly Automotive Inc.(a) 5,627 1,353,519Priceline Group Inc., The(a) 3,227 5,607,687PulteGroup Inc. 17,897 595,075PVH Corp. 5,310 728,585Ralph Lauren Corp. 3,493 362,189Ross Stores Inc. 25,517 2,047,739Royal Caribbean Cruises Ltd. 11,215 1,337,725Scripps Networks Interactive Class A 6,236 532,430Signet Jewelers Ltd. 4,566 258,207Starbucks Corp. 94,155 5,407,322Tapestry Inc. 18,953 838,291Target Corp. 35,971 2,347,108Tiffany & Co. 6,757 702,390Time Warner Inc. 51,517 4,712,260TJX Companies Inc., The 42,106 3,219,425Tractor Supply Co. 8,499 635,300TripAdvisor Inc.(a) 7,617 262,482Twenty-First Century Fox Inc. Class A 70,425 2,431,775Twenty-First Century Fox Inc. Class B 29,064 991,664Ulta Beauty Inc.(a) 3,881 868,024Under Armour Inc. Class A(a) 12,275 177,128Under Armour Inc. Class C(a) 12,405 165,235VF Corp. 21,392 1,583,008Viacom Inc. Class B 23,672 729,334Walt Disney Co., The 99,946 10,745,194Whirlpool Corp. 5,014 845,561Wyndham Worldwide Corp. 7,021 813,523Wynn Resorts Ltd. 5,329 898,416Yum! Brands Inc. 22,042 1,798,848
184,778,544
Consumer Staples (8.01%)Altria Group Inc. 126,276 9,017,369Archer-Daniels-Midland Co. 37,949 1,520,996Brown-Forman Corp. Class B 12,959 889,895Campbell Soup Co. 12,865 618,935Church & Dwight Co. Inc. 16,840 844,863Clorox Co., The 8,488 1,262,505Coca-Cola Co., The 253,758 11,642,417Colgate-Palmolive Co. 58,109 4,384,324Conagra Brands Inc. 26,877 1,012,457Constellation Brands Inc. Class A 11,505 2,629,698Costco Wholesale Corp. 28,918 5,382,218Coty Inc. Class A 31,191 620,389CVS Health Corp. 67,036 4,860,110Dr Pepper Snapple Group Inc. 12,285 1,192,382Estee Lauder Companies Inc.
Class A, The 14,936 1,900,457General Mills Inc. 37,610 2,229,897Hershey Co., The 9,281 1,053,486Hormel Foods Corp. 17,747 645,813JM Smucker Co., The 7,710 957,890Kellogg Co. 16,701 1,135,334
STATE FARM MUTUAL FUND TRUST S&P 500 INDEX FUNDSCHEDULE OF INVESTMENTS
December 31, 2017
See accompanying notes to financial statements. 85
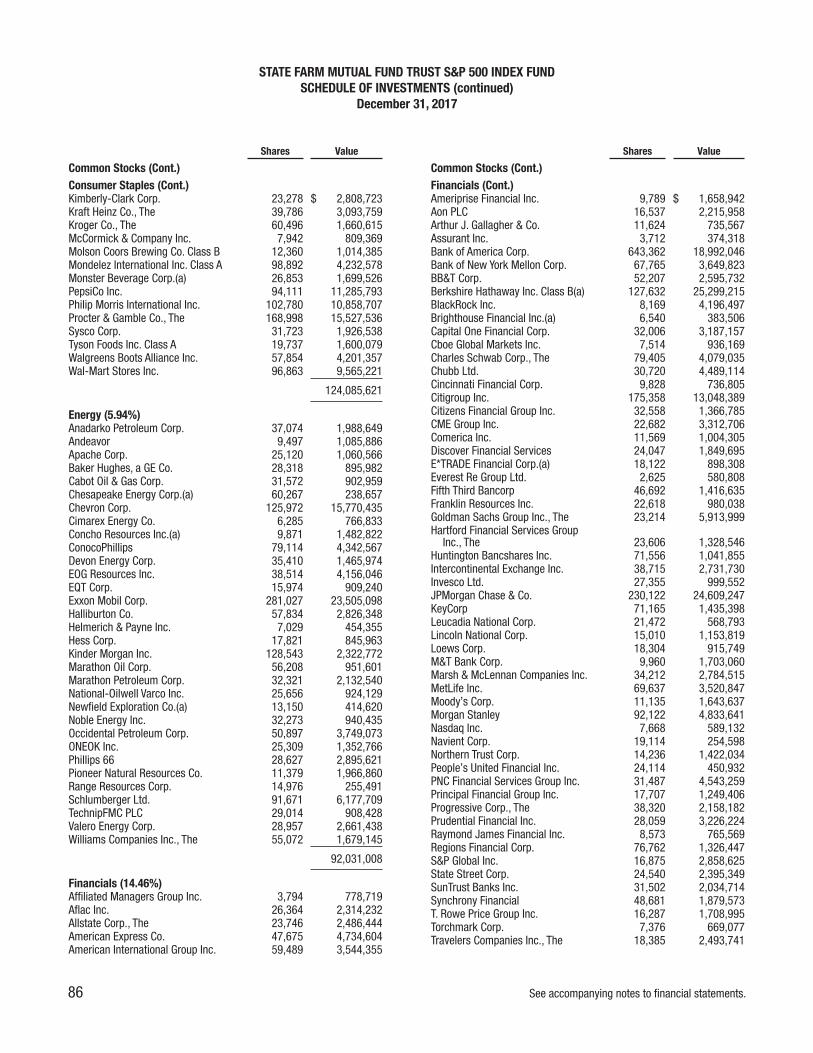
Shares Value
Common Stocks (Cont.)Consumer Staples (Cont.)Kimberly-Clark Corp. 23,278 $ 2,808,723Kraft Heinz Co., The 39,786 3,093,759Kroger Co., The 60,496 1,660,615McCormick & Company Inc. 7,942 809,369Molson Coors Brewing Co. Class B 12,360 1,014,385Mondelez International Inc. Class A 98,892 4,232,578Monster Beverage Corp.(a) 26,853 1,699,526PepsiCo Inc. 94,111 11,285,793Philip Morris International Inc. 102,780 10,858,707Procter & Gamble Co., The 168,998 15,527,536Sysco Corp. 31,723 1,926,538Tyson Foods Inc. Class A 19,737 1,600,079Walgreens Boots Alliance Inc. 57,854 4,201,357Wal-Mart Stores Inc. 96,863 9,565,221
124,085,621
Energy (5.94%)Anadarko Petroleum Corp. 37,074 1,988,649Andeavor 9,497 1,085,886Apache Corp. 25,120 1,060,566Baker Hughes, a GE Co. 28,318 895,982Cabot Oil & Gas Corp. 31,572 902,959Chesapeake Energy Corp.(a) 60,267 238,657Chevron Corp. 125,972 15,770,435Cimarex Energy Co. 6,285 766,833Concho Resources Inc.(a) 9,871 1,482,822ConocoPhillips 79,114 4,342,567Devon Energy Corp. 35,410 1,465,974EOG Resources Inc. 38,514 4,156,046EQT Corp. 15,974 909,240Exxon Mobil Corp. 281,027 23,505,098Halliburton Co. 57,834 2,826,348Helmerich & Payne Inc. 7,029 454,355Hess Corp. 17,821 845,963Kinder Morgan Inc. 128,543 2,322,772Marathon Oil Corp. 56,208 951,601Marathon Petroleum Corp. 32,321 2,132,540National-Oilwell Varco Inc. 25,656 924,129Newfield Exploration Co.(a) 13,150 414,620Noble Energy Inc. 32,273 940,435Occidental Petroleum Corp. 50,897 3,749,073ONEOK Inc. 25,309 1,352,766Phillips 66 28,627 2,895,621Pioneer Natural Resources Co. 11,379 1,966,860Range Resources Corp. 14,976 255,491Schlumberger Ltd. 91,671 6,177,709TechnipFMC PLC 29,014 908,428Valero Energy Corp. 28,957 2,661,438Williams Companies Inc., The 55,072 1,679,145
92,031,008
Financials (14.46%)Affiliated Managers Group Inc. 3,794 778,719Aflac Inc. 26,364 2,314,232Allstate Corp., The 23,746 2,486,444American Express Co. 47,675 4,734,604American International Group Inc. 59,489 3,544,355
Shares Value
Common Stocks (Cont.)Financials (Cont.)Ameriprise Financial Inc. 9,789 $ 1,658,942Aon PLC 16,537 2,215,958Arthur J. Gallagher & Co. 11,624 735,567Assurant Inc. 3,712 374,318Bank of America Corp. 643,362 18,992,046Bank of New York Mellon Corp. 67,765 3,649,823BB&T Corp. 52,207 2,595,732Berkshire Hathaway Inc. Class B(a) 127,632 25,299,215BlackRock Inc. 8,169 4,196,497Brighthouse Financial Inc.(a) 6,540 383,506Capital One Financial Corp. 32,006 3,187,157Cboe Global Markets Inc. 7,514 936,169Charles Schwab Corp., The 79,405 4,079,035Chubb Ltd. 30,720 4,489,114Cincinnati Financial Corp. 9,828 736,805Citigroup Inc. 175,358 13,048,389Citizens Financial Group Inc. 32,558 1,366,785CME Group Inc. 22,682 3,312,706Comerica Inc. 11,569 1,004,305Discover Financial Services 24,047 1,849,695E*TRADE Financial Corp.(a) 18,122 898,308Everest Re Group Ltd. 2,625 580,808Fifth Third Bancorp 46,692 1,416,635Franklin Resources Inc. 22,618 980,038Goldman Sachs Group Inc., The 23,214 5,913,999Hartford Financial Services Group
Inc., The 23,606 1,328,546Huntington Bancshares Inc. 71,556 1,041,855Intercontinental Exchange Inc. 38,715 2,731,730Invesco Ltd. 27,355 999,552JPMorgan Chase & Co. 230,122 24,609,247KeyCorp 71,165 1,435,398Leucadia National Corp. 21,472 568,793Lincoln National Corp. 15,010 1,153,819Loews Corp. 18,304 915,749M&T Bank Corp. 9,960 1,703,060Marsh & McLennan Companies Inc. 34,212 2,784,515MetLife Inc. 69,637 3,520,847Moody’s Corp. 11,135 1,643,637Morgan Stanley 92,122 4,833,641Nasdaq Inc. 7,668 589,132Navient Corp. 19,114 254,598Northern Trust Corp. 14,236 1,422,034People’s United Financial Inc. 24,114 450,932PNC Financial Services Group Inc. 31,487 4,543,259Principal Financial Group Inc. 17,707 1,249,406Progressive Corp., The 38,320 2,158,182Prudential Financial Inc. 28,059 3,226,224Raymond James Financial Inc. 8,573 765,569Regions Financial Corp. 76,762 1,326,447S&P Global Inc. 16,875 2,858,625State Street Corp. 24,540 2,395,349SunTrust Banks Inc. 31,502 2,034,714Synchrony Financial 48,681 1,879,573T. Rowe Price Group Inc. 16,287 1,708,995Torchmark Corp. 7,376 669,077Travelers Companies Inc., The 18,385 2,493,741
STATE FARM MUTUAL FUND TRUST S&P 500 INDEX FUNDSCHEDULE OF INVESTMENTS (continued)
December 31, 2017
86 See accompanying notes to financial statements.

Shares Value
Common Stocks (Cont.)Financials (Cont.)U.S. Bancorp 104,327 $ 5,589,841Unum Group 15,529 852,387Wells Fargo & Co. 293,932 17,832,854Willis Towers Watson PLC 8,585 1,293,674XL Group Ltd. 17,526 616,214Zions Bancorporation 13,524 687,425
223,928,547
Health Care (13.46%)Abbott Laboratories 115,774 6,607,222AbbVie Inc. 105,490 10,201,938Aetna Inc. 21,580 3,892,816Agilent Technologies Inc. 21,629 1,448,494Alexion Pharmaceuticals Inc.(a) 15,054 1,800,308Align Technology Inc.(a) 4,775 1,060,957Allergan PLC 22,009 3,600,232AmerisourceBergen Corp. 11,044 1,014,060Amgen Inc. 48,038 8,353,808Anthem Inc. 16,992 3,823,370Baxter International Inc. 33,173 2,144,303Becton, Dickinson and Co. 17,618 3,771,254Biogen Inc.(a) 13,992 4,457,431Boston Scientific Corp.(a) 91,468 2,267,492Bristol-Myers Squibb Co. 108,310 6,637,237Cardinal Health Inc. 21,092 1,292,307Celgene Corp.(a) 52,077 5,434,756Centene Corp.(a) 11,274 1,137,321Cerner Corp.(a) 20,898 1,408,316Cigna Corp. 16,316 3,313,616Cooper Companies Inc., The 3,224 702,445Danaher Corp. 40,645 3,772,669DaVita Inc.(a) 10,302 744,320Dentsply Sirona Inc. 15,496 1,020,102Edwards Lifesciences Corp.(a) 14,095 1,588,647Eli Lilly and Co. 64,116 5,415,237Envision Healthcare Corp.(a) 7,758 268,116Express Scripts Holding Co.(a) 37,480 2,797,507Gilead Sciences Inc. 86,918 6,226,806HCA Healthcare Inc.(a) 19,085 1,676,426Henry Schein Inc.(a) 10,518 734,998Hologic Inc.(a) 18,369 785,275Humana Inc. 9,624 2,387,426IDEXX Laboratories Inc.(a) 5,949 930,305Illumina Inc.(a) 9,656 2,109,739Incyte Corp.(a) 11,368 1,076,663Intuitive Surgical Inc.(a) 7,389 2,696,542IQVIA Holdings Inc.(a) 9,635 943,267Johnson & Johnson 178,177 24,894,890Laboratory Corp. of America
Holdings(a) 6,821 1,088,018McKesson Corp. 14,068 2,193,905Medtronic PLC 89,575 7,233,181Merck & Co. Inc. 181,002 10,184,983Mettler-Toledo International Inc.(a) 1,716 1,063,096Mylan NV(a) 35,730 1,511,736Patterson Companies Inc. 5,351 193,332PerkinElmer Inc. 7,469 546,133
Shares Value
Common Stocks (Cont.)Health Care (Cont.)Perrigo Co. PLC 8,836 $ 770,146Pfizer Inc. 395,331 14,318,889Quest Diagnostics Inc. 9,198 905,911Regeneron Pharmaceuticals Inc.(a) 5,065 1,904,237ResMed Inc. 9,462 801,337Stryker Corp. 21,298 3,297,782Thermo Fisher Scientific Inc. 26,536 5,038,656UnitedHealth Group Inc. 64,267 14,168,303Universal Health Services Inc. Class B 5,965 676,133Varian Medical Systems Inc.(a) 6,131 681,461Vertex Pharmaceuticals Inc.(a) 16,643 2,494,120Waters Corp.(a) 5,411 1,045,351Zimmer Biomet Holdings Inc. 13,465 1,624,822Zoetis Inc. 32,755 2,359,670
208,539,820
Industrials (10.05%)3M Co. 39,492 9,295,233A.O. Smith Corp. 9,829 602,321Acuity Brands Inc. 2,893 509,168Alaska Air Group Inc. 8,264 607,487Allegion PLC 6,309 501,944American Airlines Group Inc. 28,878 1,502,522AMETEK Inc. 15,439 1,118,864Arconic Inc. 28,030 763,817Boeing Co., The 37,130 10,950,008Caterpillar Inc. 39,314 6,195,100CH Robinson Worldwide Inc. 9,499 846,266Cintas Corp. 5,758 897,269CSX Corp. 59,143 3,253,456Cummins Inc. 10,270 1,814,093Deere & Co. 21,311 3,335,385Delta Air Lines Inc. 43,407 2,430,792Dover Corp. 10,345 1,044,742Eaton Corp. PLC 29,157 2,303,695Emerson Electric Co. 43,129 3,005,660Equifax Inc. 7,900 931,568Expeditors International of
Washington Inc. 12,182 788,054Fastenal Co. 18,969 1,037,415FedEx Corp. 16,326 4,073,990Flowserve Corp. 8,630 363,582Fluor Corp. 9,309 480,810Fortive Corp. 20,202 1,461,615Fortune Brands Home & Security Inc. 10,115 692,271General Dynamics Corp. 18,555 3,775,015General Electric Co. 573,882 10,014,241Harris Corp. 7,888 1,117,335Honeywell International Inc. 50,414 7,731,491IHS Markit Ltd.(a) 24,203 1,092,765Illinois Tool Works Inc. 20,405 3,404,574Ingersoll-Rand PLC 16,535 1,474,757J.B. Hunt Transport Services Inc. 5,648 649,407Jacobs Engineering Group Inc. 8,155 537,904Johnson Controls International PLC 61,241 2,333,894Kansas City Southern 7,107 747,799L3 Technologies Inc. 5,126 1,014,179
STATE FARM MUTUAL FUND TRUST S&P 500 INDEX FUNDSCHEDULE OF INVESTMENTS (continued)
December 31, 2017
See accompanying notes to financial statements. 87

Shares Value
Common Stocks (Cont.)Industrials (Cont.)Lockheed Martin Corp. 16,613 $ 5,333,604Masco Corp. 21,700 953,498Nielsen Holdings PLC 22,236 809,390Norfolk Southern Corp. 18,936 2,743,826Northrop Grumman Corp. 11,600 3,560,156PACCAR Inc. 23,598 1,677,346Parker Hannifin Corp. 8,849 1,766,083Pentair PLC 11,031 779,009Quanta Services Inc.(a) 9,992 390,787Raytheon Co. 19,355 3,635,837Republic Services Inc. 15,430 1,043,222Robert Half International Inc. 8,311 461,593Rockwell Automation Inc. 8,518 1,672,509Rockwell Collins Inc. 10,795 1,464,018Roper Technologies Inc. 6,833 1,769,747Snap-on Inc. 3,865 673,670Southwest Airlines Co. 36,689 2,401,295Stanley Black & Decker Inc. 10,264 1,741,698Stericycle Inc.(a) 5,660 384,823Textron Inc. 17,604 996,210TransDigm Group Inc. 3,315 910,365Union Pacific Corp. 52,092 6,985,537United Continental Holdings Inc.(a) 17,229 1,161,235United Parcel Service Inc. Class B 45,743 5,450,278United Rentals Inc.(a) 5,593 961,493United Technologies Corp. 49,147 6,269,683Verisk Analytics Inc.(a) 10,406 998,976W.W. Grainger Inc. 3,535 835,144Waste Management Inc. 26,931 2,324,145Xylem Inc. 11,789 804,010
155,659,675
Information Technology (23.23%)Accenture PLC Class A 40,896 6,260,769Activision Blizzard Inc. 50,297 3,184,806Adobe Systems Inc.(a) 32,621 5,716,504Advanced Micro Devices Inc.(a) 54,390 559,129Akamai Technologies Inc.(a) 11,468 745,879Alliance Data Systems Corp. 3,216 815,192Alphabet Inc. Class A(a) 19,767 20,822,558Alphabet Inc. Class C(a) 20,020 20,948,928Amphenol Corp. Class A 20,431 1,793,842Analog Devices Inc. 24,568 2,187,289ANSYS Inc.(a) 5,758 849,823Apple Inc. 340,791 57,672,061Applied Materials Inc. 70,576 3,607,845Autodesk Inc.(a) 14,604 1,530,937Automatic Data Processing Inc. 29,348 3,439,292Broadcom Ltd. 26,966 6,927,565CA Inc. 20,802 692,291Cadence Design Systems Inc.(a) 18,669 780,738Cisco Systems Inc. 327,148 12,529,768Citrix Systems Inc.(a) 9,962 876,656Cognizant Technology Solutions
Corp. Class A 39,389 2,797,407Corning Inc. 57,511 1,839,777CSRA Inc. 10,862 324,991
Shares Value
Common Stocks (Cont.)Information Technology (Cont.)DXC Technology Co. 18,875 $ 1,791,238eBay Inc.(a) 64,287 2,426,191Electronic Arts Inc.(a) 20,563 2,160,349F5 Networks Inc.(a) 4,407 578,287Facebook Inc. Class A(a) 158,160 27,908,914Fidelity National Information
Services Inc. 22,087 2,078,166Fiserv Inc.(a) 13,791 1,808,414FLIR Systems Inc. 8,712 406,153Gartner Inc.(a) 5,986 737,176Global Payments Inc. 10,555 1,058,033Hewlett Packard Enterprise Co. 105,550 1,515,698HP Inc. 111,707 2,346,961Intel Corp. 310,391 14,327,649International Business Machines Corp. 57,008 8,746,167Intuit Inc. 16,223 2,559,665Juniper Networks Inc. 25,339 722,162KLA-Tencor Corp. 10,376 1,090,206Lam Research Corp. 10,826 1,992,742Mastercard Inc. Class A 61,465 9,303,342Microchip Technology Inc. 15,395 1,352,913Micron Technology Inc.(a) 76,318 3,138,196Microsoft Corp. 511,601 43,762,350Motorola Solutions Inc. 11,033 996,721NetApp Inc. 17,793 984,309NVIDIA Corp. 40,103 7,759,931Oracle Corp. 201,614 9,532,310Paychex Inc. 21,086 1,435,535PayPal Holdings Inc.(a) 74,931 5,516,420Qorvo Inc.(a) 8,280 551,448QUALCOMM Inc. 97,554 6,245,407Red Hat Inc.(a) 11,987 1,439,639salesforce.com inc.(a) 45,409 4,642,162Seagate Technology PLC 19,896 832,449Skyworks Solutions Inc. 12,278 1,165,796Symantec Corp. 40,556 1,138,001Synopsys Inc.(a) 10,039 855,724TE Connectivity Ltd. 23,647 2,247,411Texas Instruments Inc. 65,220 6,811,577Total System Services Inc. 10,953 866,273VeriSign Inc.(a) 5,835 667,757Visa Inc. Class A 120,274 13,713,641Western Digital Corp. 19,492 1,550,199Western Union Co. 31,454 597,941Xerox Corp. 14,084 410,549Xilinx Inc. 16,358 1,102,856
359,779,075
Materials (2.94%)Air Products & Chemicals Inc. 14,532 2,384,411Albemarle Corp. 7,404 946,898Avery Dennison Corp. 6,014 690,768Ball Corp. 22,950 868,657CF Industries Holdings Inc. 15,055 640,440DowDuPont Inc. 155,453 11,071,363Eastman Chemical Co. 9,827 910,373Ecolab Inc. 17,480 2,345,466
STATE FARM MUTUAL FUND TRUST S&P 500 INDEX FUNDSCHEDULE OF INVESTMENTS (continued)
December 31, 2017
88 See accompanying notes to financial statements.

Shares Value
Common Stocks (Cont.)Materials (Cont.)FMC Corp. 8,823 $ 835,184Freeport-McMoRan Inc.(a) 88,214 1,672,537International Flavors & Fragrances Inc. 5,337 814,480International Paper Co. 27,580 1,597,985LyondellBasell Industries NV
Class A 21,405 2,361,400Martin Marietta Materials Inc. 4,138 914,664Monsanto Co. 29,190 3,408,808Mosaic Co., The 23,435 601,342Newmont Mining Corp. 35,909 1,347,306Nucor Corp. 21,294 1,353,873Packaging Corporation of America 6,287 757,898PPG Industries Inc. 17,184 2,007,435Praxair Inc. 19,083 2,951,758Sealed Air Corp. 12,757 628,920Sherwin-Williams Co., The 5,427 2,225,287Vulcan Materials Co. 8,735 1,121,312WestRock Co. 16,769 1,059,968
45,518,533
Real Estate (2.82%)Alexandria Real Estate Equities Inc. 6,334 827,157American Tower Corp. 28,296 4,036,990Apartment Investment and
Management Co. 10,870 475,128AvalonBay Communities Inc. 9,090 1,621,748Boston Properties Inc. 10,319 1,341,780CBRE Group Inc. Class A(a) 20,180 873,996Crown Castle International Corp. 26,829 2,978,287Digital Realty Trust Inc. 13,633 1,552,799Duke Realty Corp. 23,714 645,258Equinix Inc. 5,169 2,342,694Equity Residential 24,628 1,570,528Essex Property Trust Inc. 4,429 1,069,028Extra Space Storage Inc. 8,199 717,003Federal Realty Investment Trust 4,718 626,598GGP Inc. 41,317 966,405HCP Inc. 30,967 807,617Host Hotels & Resorts Inc. 49,437 981,324Iron Mountain Inc. 17,665 666,500Kimco Realty Corp. 27,902 506,421Macerich Co., The 7,173 471,123Mid-America Apartment
Communities Inc. 7,506 754,803Prologis Inc. 35,501 2,290,170Public Storage 9,993 2,088,537Realty Income Corp. 18,419 1,050,251Regency Centers Corp. 9,684 669,939SBA Communications Corp.(a) 7,779 1,270,777Simon Property Group Inc. 20,570 3,532,692SL Green Realty Corp. 6,503 656,348UDR Inc. 17,327 667,436Ventas Inc. 23,709 1,422,777Vornado Realty Trust 11,372 889,063Welltower Inc. 24,502 1,562,493Weyerhaeuser Co. 50,324 1,774,424
43,708,094
Shares Value
Common Stocks (Cont.)Telecommunication Services (2.02%)AT&T Inc. 407,222 $ 15,832,791CenturyLink Inc. 64,463 1,075,243Verizon Communications Inc. 270,555 14,320,476
31,228,510
Utilities (2.87%)AES Corp., The 43,622 472,426Alliant Energy Corp. 14,983 638,426Ameren Corp. 15,960 941,480American Electric Power Company Inc. 32,562 2,395,586American Water Works Co. Inc. 11,732 1,073,361CenterPoint Energy Inc. 28,694 813,762CMS Energy Corp. 19,007 899,031Consolidated Edison Inc. 20,509 1,742,240Dominion Energy Inc. 42,586 3,452,021DTE Energy Co. 12,147 1,329,611Duke Energy Corp. 46,514 3,912,293Edison International 21,892 1,384,450Entergy Corp. 11,767 957,716Eversource Energy 20,847 1,317,113Exelon Corp. 63,535 2,503,914FirstEnergy Corp. 29,833 913,486NextEra Energy Inc. 31,260 4,882,499NiSource Inc. 21,323 547,361NRG Energy Inc. 19,906 566,923PG&E Corp. 33,803 1,515,388Pinnacle West Capital Corp. 7,461 635,528PPL Corp. 45,619 1,411,908Public Service Enterprise Group Inc. 33,890 1,745,335SCANA Corp. 9,482 377,194Sempra Energy 16,778 1,793,904Southern Co. 66,563 3,201,015WEC Energy Group Inc. 21,204 1,408,582Xcel Energy Inc. 33,996 1,635,548
44,468,101Total Common Stocks(cost $735,348,198) 1,513,725,528
STATE FARM MUTUAL FUND TRUST S&P 500 INDEX FUNDSCHEDULE OF INVESTMENTS (continued)
December 31, 2017
See accompanying notes to financial statements. 89

Shares Value
Short-term Investments (2.07%)State Street Institutional U.S.
Government Money Market FundPremier Class, 1.21%(b) 32,073,816 $ 32,073,816
Total Short-term Investments(cost $32,073,816) 32,073,816
TOTAL INVESTMENTS (99.80%)(cost $767,422,014) 1,545,799,344
CASH AND OTHER ASSETS, NET OF LIABILITIES(0.20%)(c) 3,162,980
NET ASSETS (100.00%) $1,548,962,324
(a) Non-income producing security.(b) Rate shown is the 7-day yield as of December 31, 2017.(c) At December 31, 2017, cash in the amount of $1,167,000 has been
pledged to cover, in whole or in part, margin requirements for open futurescontracts.
OPEN FUTURES CONTRACTS
DescriptionContractsPurchased Expiration
NotionalValue
MarketValue
UnrealizedGain (Loss)
S&P 500 Mini Index 258 March 2018 $34,299,650 $34,520,400 $220,750
STATE FARM MUTUAL FUND TRUST S&P 500 INDEX FUNDSCHEDULE OF INVESTMENTS (continued)
December 31, 2017
90 See accompanying notes to financial statements.

Shares Value
Common Stocks (98.59%)Consumer Discretionary (12.33%)1-800-FLOWERS.COM Inc.(a) 6,934 $ 74,194Aaron’s Inc. 15,802 629,710Abercrombie & Fitch Co. Class A 17,134 298,646Acushnet Holdings Corp. 7,381 155,591Adtalem Global Education Inc.(a) 15,031 632,054AMC Entertainment Holdings Inc.
Class A 13,243 199,969American Axle & Manufacturing
Holdings Inc.(a) 24,491 417,082American Eagle Outfitters Inc. 41,262 775,726American Outdoor Brands Corp.(a) 13,386 171,876American Public Education Inc.(a) 3,946 98,847America’s Car-Mart Inc.(a) 2,000 89,300Asbury Automotive Group Inc.(a) 4,578 292,992Ascena Retail Group Inc.(a) 44,720 105,092Ascent Capital Group LLC Class A(a) 2,627 30,184At Home Group Inc.(a) 1,367 41,543AV Homes Inc.(a) 2,684 44,689Barnes & Noble Education Inc.(a) 10,293 84,814Barnes & Noble Inc. 16,215 108,641Bassett Furniture Industries Inc. 2,600 97,760Beasley Broadcast Group Inc.
Class A 1,325 17,755Beazer Homes USA Inc.(a) 7,706 148,032Belmond Ltd. Class A(a) 21,314 261,097Big 5 Sporting Goods Corp. 5,444 41,374Big Lots Inc. 10,646 597,773Biglari Holdings Inc.(a) 264 109,402BJ’s Restaurants Inc. 5,071 184,584Bloomin’ Brands Inc. 23,551 502,578Bojangles’ Inc.(a) 4,496 53,053Boot Barn Holdings Inc(a) 2,709 44,996Boyd Gaming Corp. 20,969 734,963Bridgepoint Education Inc.(a) 4,363 36,213Brinker International Inc. 11,755 456,564Buckle Inc., The 7,478 177,603Buffalo Wild Wings Inc.(a) 3,913 611,798Build-A-Bear Workshop Inc.(a) 3,700 34,040Caesars Entertainment Corp.(a) 34,117 431,580Caleres Inc. 10,464 350,335Callaway Golf Co. 23,757 330,935Cambium Learning Group Inc.(a) 3,100 17,608Camping World Holdings Inc. Class A 8,084 361,597Capella Education Co. 2,805 217,107Career Education Corp.(a) 16,995 205,300Carriage Services Inc. 4,085 105,025Carrols Restaurant Group Inc.(a) 8,700 105,705Carvana Co.(a) 3,235 61,853Cato Corp. Class A 5,575 88,754Cavco Industries Inc.(a) 2,134 325,648Central European Media Enterprises
Ltd. Class A(a) 19,051 88,587Century Casinos Inc.(a) 5,863 53,529Century Communities Inc.(a) 5,019 156,091Cheesecake Factory Inc., The 10,897 525,017Chegg Inc.(a) 24,386 397,980Chico’s FAS Inc. 31,959 281,878Children’s Place Inc., The 4,367 634,743
Shares Value
Common Stocks (Cont.)Consumer Discretionary (Cont.)Churchill Downs Inc. 3,451 $ 803,048Chuy’s Holdings Inc.(a) 4,277 119,970Citi Trends Inc. 3,197 84,593Clarus Corp.(a) 5,071 39,807Clear Channel Outdoor Holdings Inc.
Class A 9,937 45,710Collectors Universe Inc. 2,144 61,404Columbia Sportswear Co. 7,206 517,967Conn’s Inc.(a) 4,833 171,813Container Store Group Inc., The(a) 3,526 16,713Cooper Tire & Rubber Co. 12,960 458,136Cooper-Standard Holdings Inc.(a) 4,344 532,140Core-Mark Holding Company Inc. 11,566 365,254Cracker Barrel Old Country Store Inc. 4,873 774,271Crocs Inc.(a) 17,512 221,352CSS Industries Inc. 2,418 67,293Culp Inc. 2,899 97,117Daily Journal Corp.(a) 305 70,217Dana Inc. 36,650 1,173,167Dave & Buster’s Entertainment Inc.(a) 10,276 566,927Deckers Outdoor Corp.(a) 8,038 645,050Del Frisco’s Restaurant Group Inc.(a) 5,863 89,411Del Taco Restaurants Inc.(a) 8,599 104,220Delta Apparel Inc.(a) 1,816 36,683Denny’s Corp.(a) 16,606 219,863Dillard’s Inc. Class A 3,491 209,635DineEquity Inc. 4,306 218,443Dorman Products Inc.(a) 6,794 415,385Drive Shack Inc. 16,191 89,536DSW Inc. Class A 16,038 343,374Duluth Holdings Inc.(a) 2,470 44,090E.W. Scripps Co. Class A, The(a) 15,161 236,966El Pollo Loco Holdings Inc.(a) 5,328 52,747Eldorado Resorts Inc.(a) 11,689 387,490Emerald Expositions Events Inc. 4,333 88,133Empire Resorts Inc.(a) 740 19,980Entercom Communications Corp.
Class A 32,737 353,560Entravision Communications Corp.
Class A 16,849 120,470Eros International PLC(a) 6,300 60,795Escalade Inc. 2,500 30,750Ethan Allen Interiors Inc. 6,422 183,669Express Inc.(a) 19,914 202,127Fiesta Restaurant Group Inc.(a) 6,800 129,200Finish Line Inc. Class A, The 9,417 136,829Five Below Inc.(a) 13,537 897,774Flexsteel Industries Inc. 1,953 91,361Fogo De Chao Inc.(a) 2,433 28,223Fossil Group Inc.(a) 11,188 86,931Fox Factory Holding Corp.(a) 9,091 353,185Francesca’s Holdings Corp.(a) 10,214 74,664Fred’s Inc. Class A 9,340 37,827FTD Companies Inc.(a) 4,651 33,441Funko Inc. Class A(a) 2,178 14,484Gaia Inc.(a) 2,106 26,114Gannett Co. Inc. 28,706 332,703
STATE FARM MUTUAL FUND TRUST SMALL CAP INDEX FUNDSCHEDULE OF INVESTMENTS
December 31, 2017
See accompanying notes to financial statements. 91

Shares Value
Common Stocks (Cont.)Consumer Discretionary (Cont.)Genesco Inc.(a) 5,020 $ 163,150Gentherm Inc.(a) 9,200 292,100G-III Apparel Group Ltd.(a) 10,708 395,018Global Eagle Entertainment Inc.(a) 12,014 27,512GNC Holdings Inc. Class A 18,241 67,309Golden Entertainment Inc.(a) 2,854 93,183GoPro Inc. Class A(a) 26,911 203,716Grand Canyon Education Inc.(a) 11,839 1,059,946Gray Television Inc.(a) 15,735 263,561Green Brick Partners Inc.(a) 6,407 72,399Group 1 Automotive Inc. 4,996 354,566Groupon Inc.(a) 85,049 433,750Guess? Inc. 14,923 251,900Habit Restaurants Inc., The Class A(a) 5,244 50,080Hamilton Beach Brands Holding Co.
Class A 1,148 29,492Haverty Furniture Companies Inc. 5,035 114,043Helen of Troy Ltd.(a) 6,879 662,792Hemisphere Media Group Inc.(a) 4,149 47,921Hibbett Sports Inc.(a) 5,145 104,958Hooker Furniture Corp. 2,963 125,779Horizon Global Corp.(a) 6,029 84,527Houghton Mifflin Harcourt Co.(a) 26,944 250,579Hovnanian Enterprises Inc. Class A(a) 29,924 100,245HSN Inc. 481 19,408Iconix Brand Group Inc.(a) 13,474 17,381ILG Inc. 26,596 757,454IMAX Corp.(a) 14,231 329,448Inspired Entertainment Inc.(a) 1,005 9,849Installed Building Products Inc.(a) 5,404 410,434International Speedway Corp. Class A 6,071 241,929iRobot Corp.(a) 6,632 508,674J. Alexander’s Holdings Inc.(a) 3,368 32,670J.C. Penney Company Inc.(a) 76,459 241,610J.Jill Inc.(a) 3,069 23,938Jack in the Box Inc. 7,322 718,361Johnson Outdoors Inc. Class A 1,230 76,371K12 Inc.(a) 9,299 147,854KB Home 21,458 685,583Kirkland’s Inc.(a) 3,634 43,481La Quinta Holdings Inc.(a) 20,799 383,950Lands’ End Inc.(a) 3,474 67,917Laureate Education Inc. Class A(a) 13,884 188,267La-Z-Boy Inc. 12,256 382,387LCI Industries 6,244 811,720LGI Homes Inc.(a) 4,437 332,908Libbey Inc. 5,817 43,744Liberty Media Corp. - Liberty Braves
Class A(a) 2,235 49,282Liberty Media Corp. - Liberty Braves
Class C(a) 9,060 201,313Liberty Tax Inc. 1,400 15,400Liberty TripAdvisor Holdings Inc.
Class A(a) 17,670 166,540Lifetime Brands Inc. 2,981 49,187Lindblad Expeditions Holdings Inc.(a) 5,201 50,918Lithia Motors Inc. Class A 5,817 660,753Loral Space & Communications Inc.(a) 3,400 149,770
Shares Value
Common Stocks (Cont.)Consumer Discretionary (Cont.)Lumber Liquidators Holdings Inc.(a) 7,074 $ 222,053M.D.C. Holdings Inc. 11,283 359,702M/I Homes Inc.(a) 6,337 217,993Malibu Boats Inc. Class A(a) 4,996 148,531Marcus Corp., The 4,843 132,456Marine Products Corp. 2,589 32,984MarineMax Inc.(a) 5,420 102,438Marriott Vacations Worldwide Corp. 5,359 724,590MCBC Holdings Inc.(a) 4,827 107,256MDC Partners Inc. Class A(a) 14,132 137,787Meredith Corp. 9,858 651,121Meritage Homes Corp.(a) 9,580 490,496Modine Manufacturing Co.(a) 12,520 252,904Monarch Casino & Resort Inc.(a) 2,745 123,031Monro Inc. 8,048 458,334Motorcar Parts of America Inc.(a) 4,777 119,377Movado Group Inc. 3,476 111,927MSG Networks Inc. Class A(a) 15,007 303,892Nathan’s Famous Inc. 743 56,097National CineMedia Inc. 15,441 105,925National Vision Holdings Inc.(a) 4,545 184,572Nautilus Inc.(a) 8,074 107,788New Home Company Inc., The(a) 3,241 40,610New Media Investment Group Inc. 12,230 205,219New York Times Co. Class A, The 31,474 582,269Nexstar Media Group Inc. 11,027 862,311Noodles & Company(a) 3,429 18,002NutriSystem Inc. 7,358 387,031Office Depot Inc. 127,012 449,622Ollie’s Bargain Outlet Holdings Inc.(a) 11,726 624,410Overstock.com Inc.(a) 4,133 264,099Oxford Industries Inc. 3,971 298,579Papa John’s International Inc. 6,559 368,025Party City Holdco Inc.(a) 6,917 96,492Penn National Gaming Inc.(a) 20,834 652,729Perry Ellis International Inc.(a) 3,140 78,626PetMed Express Inc. 5,100 232,050PICO Holdings Inc. 5,707 73,050Pier 1 Imports Inc. 22,109 91,531Pinnacle Entertainment Inc.(a) 13,510 442,182Planet Fitness Inc. Class A(a) 21,646 749,601Potbelly Corp.(a) 6,054 74,464RCI Hospitality Holdings Inc. 2,323 64,998Reading International Inc. Class A(a) 4,300 71,810Red Lion Hotels Corp.(a) 4,827 47,546Red Robin Gourmet Burgers Inc.(a) 3,380 190,632Red Rock Resorts Inc. Class A 17,485 589,944Regis Corp.(a) 8,865 136,166Rent-A-Center Inc. 11,371 126,218RH(a) 4,978 429,153Ruth’s Hospitality Group Inc. 7,733 167,419Saga Communications Inc. Class A 896 36,243Salem Media Group Inc. 2,419 10,886Scholastic Corp. 6,822 273,630Scientific Games Corp. Class A(a) 13,323 683,470Sears Holdings Corp.(a) 2,769 9,913SeaWorld Entertainment Inc.(a) 17,897 242,862
STATE FARM MUTUAL FUND TRUST SMALL CAP INDEX FUNDSCHEDULE OF INVESTMENTS (continued)
December 31, 2017
92 See accompanying notes to financial statements.

Shares Value
Common Stocks (Cont.)Consumer Discretionary (Cont.)Sequential Brands Group Inc.(a) 11,050 $ 19,669Shake Shack Inc. Class A(a) 5,754 248,573Shiloh Industries Inc.(a) 3,906 32,029Shoe Carnival Inc. 2,992 80,036Shutterfly Inc.(a) 8,195 407,701Sinclair Broadcast Group Inc.
Class A 18,213 689,362Sleep Number Corp.(a) 9,973 374,885Sonic Automotive Inc. 6,213 114,630Sonic Corp. 9,817 269,771Sotheby’s(a) 9,703 500,675Speedway Motorsports Inc. 2,854 53,855Sportsman’s Warehouse Holdings
Inc.(a) 9,580 63,324Standard Motor Products Inc. 5,285 237,349Steven Madden Ltd.(a) 14,971 699,146Stoneridge Inc.(a) 6,525 149,162Strayer Education Inc. 2,720 243,658Sturm, Ruger & Company Inc. 4,192 234,123Superior Industries International Inc. 6,389 94,877Superior Uniform Group Inc. 2,227 59,483Tailored Brands Inc. 12,654 276,237Taylor Morrison Home Corp. Class A(a) 20,195 494,172Tenneco Inc. 12,782 748,258Texas Roadhouse Inc. Class A 17,051 898,247Tile Shop Holdings Inc., The 9,921 95,242Tilly’s Inc. Class A 3,717 54,863Time Inc. 25,399 468,612TopBuild Corp.(a) 9,021 683,251Tower International Inc. 4,873 148,870Townsquare Media Inc.(a) 2,368 18,186TRI Pointe Group Inc.(a) 38,151 683,666tronc Inc.(a) 5,282 92,910Unifi Inc.(a) 4,115 147,605Universal Electronics Inc.(a) 3,738 176,621Vera Bradley Inc.(a) 5,547 67,562Vista Outdoor Inc.(a) 14,935 217,603Vitamin Shoppe Inc.(a) 6,309 27,760VOXX International Corp.(a) 5,181 29,014Weight Watchers International Inc.(a) 7,082 313,591Weyco Group Inc. 1,700 50,524WideOpenWest Inc.(a) 5,113 54,044William Lyon Homes Class A(a) 6,910 200,943Wingstop Inc. 7,407 288,725Winmark Corp. 497 64,312Winnebago Industries Inc. 7,903 439,407Wolverine World Wide Inc. 23,837 759,924World Wrestling Entertainment Inc. 9,707 296,840Zagg Inc.(a) 7,200 132,840Zoe’s Kitchen Inc.(a) 5,000 83,600Zumiez Inc.(a) 4,699 97,857
66,255,486
Consumer Staples (2.73%)Alico Inc. 885 26,104Amplify Snack Brands Inc.(a) 8,793 105,604
Shares Value
Common Stocks (Cont.)Consumer Staples (Cont.)Andersons Inc., The 7,023 $ 218,766B&G Foods Inc. Class A 16,784 589,958Bob Evans Farms Inc. 4,982 392,681Boston Beer Co. Inc.(a) 2,105 402,266Calavo Growers Inc. 3,967 334,815Cal-Maine Foods Inc.(a) 7,324 325,552Castle Brands Inc.(a) 22,223 27,112Central Garden & Pet Co.(a) 2,813 109,482Central Garden & Pet Co. Class A(a) 8,826 332,828Chefs’ Warehouse Inc., The(a) 4,800 98,400Coca-Cola Bottling Co. Consolidated 1,217 261,971Craft Brew Alliance Inc.(a) 3,416 65,587Darling Ingredients Inc.(a) 41,283 748,461Dean Foods Co. 22,439 259,395e.l.f. Beauty Inc.(a) 5,375 119,916Farmer Brothers Co.(a) 2,031 65,297Fresh Del Monte Produce Inc. 8,146 388,320Freshpet Inc.(a) 5,899 111,786Hostess Brands Inc.(a) 20,884 309,292HRG Group Inc.(a) 29,985 508,246Ingles Markets Inc. Class A 3,588 124,145Inter Parfums Inc. 4,504 195,699J&J Snack Foods Corp. 3,727 565,870John B. Sanfilippo & Son Inc. 2,288 144,716Lancaster Colony Corp. 4,655 601,473Landec Corp.(a) 6,700 84,420Lifeway Foods Inc.(a) 1,100 8,800Limoneira Co. 2,967 66,461Medifast Inc. 2,760 192,676MGP Ingredients Inc. 3,195 245,632National Beverage Corp. 3,029 295,146Natural Grocers by Vitamin Cottage
Inc.(a) 2,202 19,664Natural Health Trends Corp. 1,900 28,861Nature’s Sunshine Products Inc. 2,686 31,023Oil-Dri Corporation of America 1,200 49,800Orchids Paper Products Co. 2,400 30,720Performance Food Group Co.(a) 22,934 759,115PriceSmart Inc. 5,481 471,914Primo Water Corp.(a) 6,052 76,074Revlon Inc. Class A(a) 3,254 70,937Sanderson Farms Inc. 5,025 697,370Seneca Foods Corp. Class A(a) 1,805 55,504Smart & Final Stores Inc.(a) 5,816 49,727Snyder’s-Lance Inc. 21,694 1,086,436SpartanNash Co. 8,984 239,693SUPERVALU Inc.(a) 9,395 202,932Tootsie Roll Industries Inc. 4,203 152,989Turning Point Brands Inc. 1,571 33,195United Natural Foods Inc.(a) 12,917 636,421Universal Corp. 6,278 329,595USANA Health Sciences Inc.(a) 2,811 208,155Vector Group Ltd. 24,420 546,520Village Super Market Inc. Class A 1,928 44,209WD-40 Co. 3,456 407,808
STATE FARM MUTUAL FUND TRUST SMALL CAP INDEX FUNDSCHEDULE OF INVESTMENTS (continued)
December 31, 2017
See accompanying notes to financial statements. 93

Shares Value
Common Stocks (Cont.)Consumer Staples (Cont.)Weis Markets Inc. 2,444 $ 101,157
14,656,696
Energy (3.94%)Abraxas Petroleum Corp.(a) 38,498 94,705Adams Resources & Energy Inc. 500 21,745Approach Resources Inc.(a) 11,105 32,871Arch Coal Inc. Class A 4,888 455,366Archrock Inc. 18,345 192,623Ardmore Shipping Corp.(a) 8,572 68,576Basic Energy Services Inc.(a) 4,490 105,380Bill Barrett Corp.(a) 19,874 101,954Bonanza Creek Energy Inc.(a) 5,262 145,179Bristow Group Inc. 8,823 118,846C&J Energy Services Inc.(a) 11,621 388,955California Resources Corp.(a) 10,403 202,234Callon Petroleum Co.(a) 50,271 610,793CARBO Ceramics Inc.(a) 6,179 62,902Carrizo Oil & Gas Inc.(a) 19,407 412,981Clean Energy Fuels Corp.(a) 35,633 72,335Cloud Peak Energy Inc.(a) 19,597 87,207Contango Oil & Gas Co.(a) 6,309 29,715CVR Energy Inc. 4,026 149,928Delek US Holdings Inc. 19,443 679,338Denbury Resources Inc.(a) 104,025 229,895DHT Holdings Inc. 20,681 74,245Diamond Offshore Drilling Inc.(a) 16,069 298,723Dorian LPG Ltd.(a) 6,031 49,575Dril-Quip Inc.(a) 9,450 450,765Earthstone Energy Inc. Class A(a) 6,033 64,131Eclipse Resources Corp.(a) 22,688 54,451Energy XXI Gulf Coast Inc.(a) 7,869 45,168Ensco PLC Class A 106,971 632,199EP Energy Corp. Class A(a) 9,811 23,154Era Group Inc.(a) 5,000 53,750Evolution Petroleum Corp. 6,708 45,950Exterran Corp.(a) 8,198 257,745Fairmount Santrol Holdings Inc.(a) 40,542 212,035Forum Energy Technologies Inc.(a) 19,823 308,248Frank’s International NV 12,851 85,459Frontline Ltd. 19,281 88,500GasLog Ltd. 10,809 240,500Gastar Exploration Inc.(a) 46,132 48,439Gener8 Maritime Inc.(a) 12,561 83,154Geospace Technologies Corp.(a) 3,300 42,801Golar LNG Ltd. 24,425 728,109Green Plains Inc. 9,600 161,760Gulf Island Fabrication Inc. 3,453 46,357Halcon Resources Corp.(a) 32,579 246,623Hallador Energy Co. 3,987 24,281Helix Energy Solutions Group Inc.(a) 35,617 268,552Independence Contract Drilling Inc.(a) 7,450 29,651International Seaways Inc.(a) 7,635 140,942Isramco Inc.(a) 222 23,232Jagged Peak Energy Inc.(a) 14,225 224,471Jones Energy Inc. Class A(a) 12,746 14,021Keane Group Inc.(a) 9,575 182,021
Shares Value
Common Stocks (Cont.)Energy (Cont.)Key Energy Services Inc.(a) 2,652 $ 31,267Lilis Energy Inc.(a) 10,828 55,331Mammoth Energy Services Inc.(a) 1,739 34,137Matador Resources Co.(a) 24,337 757,611Matrix Service Co.(a) 6,700 119,260McDermott International Inc.(a) 71,181 468,371Midstates Petroleum Company Inc.(a) 3,236 53,653NACCO Industries Inc. Class A 1,148 43,222Natural Gas Services Group(a) 3,100 81,220Navios Maritime Acquisition Corp. 20,400 22,644NCS Multistage Holdings Inc.(a) 2,879 42,436Newpark Resources Inc.(a) 20,863 179,422Noble Corp. PLC(a) 63,676 287,816Nordic American Tankers Ltd. 25,810 63,493Oasis Petroleum Inc.(a) 59,438 499,874Oil States International Inc.(a) 12,500 353,750Overseas Shipholding Group Inc.
Class A(a) 10,678 29,258Pacific Ethanol Inc.(a) 10,819 49,226Panhandle Oil & Gas Inc. 4,126 84,789Par Pacific Holdings Inc.(a) 8,058 155,358Parker Drilling Co.(a) 39,338 39,338PDC Energy Inc.(a) 16,683 859,842Peabody Energy Corp.(a) 17,009 669,644Penn Virginia Corp.(a) 3,804 148,774PHI Inc.(a) 3,200 37,024Pioneer Energy Services Corp.(a) 18,501 56,428ProPetro Holding Corp.(a) 14,148 285,224Ranger Energy Services Inc.(a) 1,116 10,301Renewable Energy Group Inc.(a) 10,483 123,699Resolute Energy Corp.(a) 5,665 178,278REX American Resources Corp.(a) 1,511 125,096RigNet Inc.(a) 3,601 53,835Ring Energy Inc.(a) 13,066 181,617Rowan Companies PLC Class A(a) 29,096 455,643Sanchez Energy Corp.(a) 13,805 73,305SandRidge Energy Inc.(a) 8,445 177,936Scorpio Tankers Inc. 59,742 182,213SEACOR Holdings Inc.(a) 4,234 195,695SEACOR Marine Holdings Inc.(a) 4,256 49,795Select Energy Services Inc. Class A(a) 6,529 119,089SemGroup Corp. Class A 16,448 496,730Ship Finance International Ltd. 15,661 242,746SilverBow Resources Inc.(a) 1,950 57,954Smart Sand Inc.(a) 5,612 48,600Solaris Oilfield Infrastructure Inc. Class
A(a) 4,065 87,032SRC Energy Inc.(a) 60,934 519,767Stone Energy Corp.(a) 5,059 162,697Superior Energy Services Inc.(a) 37,755 363,581Teekay Corp. 13,678 127,479Teekay Tankers Ltd. Class A 46,089 64,525Tellurian Inc.(a) 14,375 140,013TETRA Technologies Inc.(a) 28,359 121,093Ultra Petroleum Corp.(a) 49,058 444,465Unit Corp.(a) 13,454 295,988Uranium Energy Corp.(a) 34,861 61,704
STATE FARM MUTUAL FUND TRUST SMALL CAP INDEX FUNDSCHEDULE OF INVESTMENTS (continued)
December 31, 2017
94 See accompanying notes to financial statements.
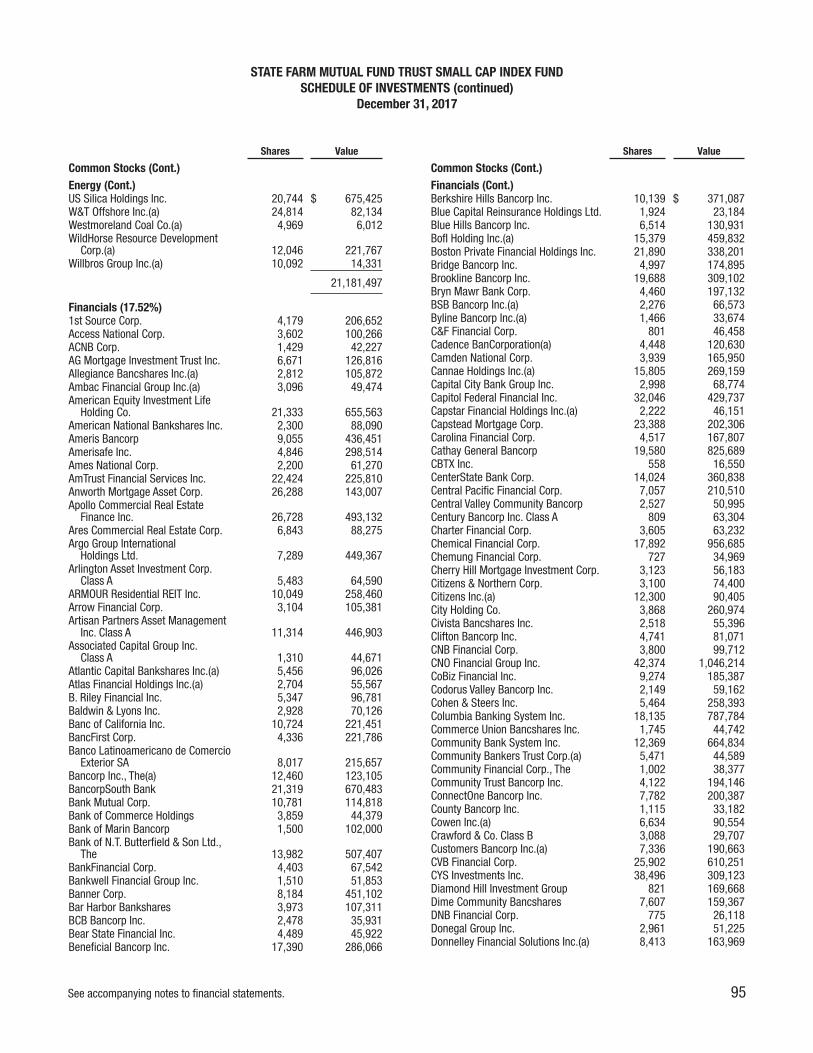
Shares Value
Common Stocks (Cont.)Energy (Cont.)US Silica Holdings Inc. 20,744 $ 675,425W&T Offshore Inc.(a) 24,814 82,134Westmoreland Coal Co.(a) 4,969 6,012WildHorse Resource Development
Corp.(a) 12,046 221,767Willbros Group Inc.(a) 10,092 14,331
21,181,497
Financials (17.52%)1st Source Corp. 4,179 206,652Access National Corp. 3,602 100,266ACNB Corp. 1,429 42,227AG Mortgage Investment Trust Inc. 6,671 126,816Allegiance Bancshares Inc.(a) 2,812 105,872Ambac Financial Group Inc.(a) 3,096 49,474American Equity Investment Life
Holding Co. 21,333 655,563American National Bankshares Inc. 2,300 88,090Ameris Bancorp 9,055 436,451Amerisafe Inc. 4,846 298,514Ames National Corp. 2,200 61,270AmTrust Financial Services Inc. 22,424 225,810Anworth Mortgage Asset Corp. 26,288 143,007Apollo Commercial Real Estate
Finance Inc. 26,728 493,132Ares Commercial Real Estate Corp. 6,843 88,275Argo Group International
Holdings Ltd. 7,289 449,367Arlington Asset Investment Corp.
Class A 5,483 64,590ARMOUR Residential REIT Inc. 10,049 258,460Arrow Financial Corp. 3,104 105,381Artisan Partners Asset Management
Inc. Class A 11,314 446,903Associated Capital Group Inc.
Class A 1,310 44,671Atlantic Capital Bankshares Inc.(a) 5,456 96,026Atlas Financial Holdings Inc.(a) 2,704 55,567B. Riley Financial Inc. 5,347 96,781Baldwin & Lyons Inc. 2,928 70,126Banc of California Inc. 10,724 221,451BancFirst Corp. 4,336 221,786Banco Latinoamericano de Comercio
Exterior SA 8,017 215,657Bancorp Inc., The(a) 12,460 123,105BancorpSouth Bank 21,319 670,483Bank Mutual Corp. 10,781 114,818Bank of Commerce Holdings 3,859 44,379Bank of Marin Bancorp 1,500 102,000Bank of N.T. Butterfield & Son Ltd.,
The 13,982 507,407BankFinancial Corp. 4,403 67,542Bankwell Financial Group Inc. 1,510 51,853Banner Corp. 8,184 451,102Bar Harbor Bankshares 3,973 107,311BCB Bancorp Inc. 2,478 35,931Bear State Financial Inc. 4,489 45,922Beneficial Bancorp Inc. 17,390 286,066
Shares Value
Common Stocks (Cont.)Financials (Cont.)Berkshire Hills Bancorp Inc. 10,139 $ 371,087Blue Capital Reinsurance Holdings Ltd. 1,924 23,184Blue Hills Bancorp Inc. 6,514 130,931BofI Holding Inc.(a) 15,379 459,832Boston Private Financial Holdings Inc. 21,890 338,201Bridge Bancorp Inc. 4,997 174,895Brookline Bancorp Inc. 19,688 309,102Bryn Mawr Bank Corp. 4,460 197,132BSB Bancorp Inc.(a) 2,276 66,573Byline Bancorp Inc.(a) 1,466 33,674C&F Financial Corp. 801 46,458Cadence BanCorporation(a) 4,448 120,630Camden National Corp. 3,939 165,950Cannae Holdings Inc.(a) 15,805 269,159Capital City Bank Group Inc. 2,998 68,774Capitol Federal Financial Inc. 32,046 429,737Capstar Financial Holdings Inc.(a) 2,222 46,151Capstead Mortgage Corp. 23,388 202,306Carolina Financial Corp. 4,517 167,807Cathay General Bancorp 19,580 825,689CBTX Inc. 558 16,550CenterState Bank Corp. 14,024 360,838Central Pacific Financial Corp. 7,057 210,510Central Valley Community Bancorp 2,527 50,995Century Bancorp Inc. Class A 809 63,304Charter Financial Corp. 3,605 63,232Chemical Financial Corp. 17,892 956,685Chemung Financial Corp. 727 34,969Cherry Hill Mortgage Investment Corp. 3,123 56,183Citizens & Northern Corp. 3,100 74,400Citizens Inc.(a) 12,300 90,405City Holding Co. 3,868 260,974Civista Bancshares Inc. 2,518 55,396Clifton Bancorp Inc. 4,741 81,071CNB Financial Corp. 3,800 99,712CNO Financial Group Inc. 42,374 1,046,214CoBiz Financial Inc. 9,274 185,387Codorus Valley Bancorp Inc. 2,149 59,162Cohen & Steers Inc. 5,464 258,393Columbia Banking System Inc. 18,135 787,784Commerce Union Bancshares Inc. 1,745 44,742Community Bank System Inc. 12,369 664,834Community Bankers Trust Corp.(a) 5,471 44,589Community Financial Corp., The 1,002 38,377Community Trust Bancorp Inc. 4,122 194,146ConnectOne Bancorp Inc. 7,782 200,387County Bancorp Inc. 1,115 33,182Cowen Inc.(a) 6,634 90,554Crawford & Co. Class B 3,088 29,707Customers Bancorp Inc.(a) 7,336 190,663CVB Financial Corp. 25,902 610,251CYS Investments Inc. 38,496 309,123Diamond Hill Investment Group 821 169,668Dime Community Bancshares 7,607 159,367DNB Financial Corp. 775 26,118Donegal Group Inc. 2,961 51,225Donnelley Financial Solutions Inc.(a) 8,413 163,969
STATE FARM MUTUAL FUND TRUST SMALL CAP INDEX FUNDSCHEDULE OF INVESTMENTS (continued)
December 31, 2017
See accompanying notes to financial statements. 95

Shares Value
Common Stocks (Cont.)Financials (Cont.)Dynex Capital Inc. 13,301 $ 93,240Eagle Bancorp Inc.(a) 7,856 454,862eHealth Inc.(a) 3,939 68,420Elevate Credit Inc.(a) 3,834 28,870Ellington Residential Mortgage REIT 2,761 33,242EMC Insurance Group Inc. 2,447 70,204Employers Holdings Inc. 8,175 362,970Encore Capital Group Inc.(a) 6,248 263,041Enova International Inc.(a) 8,672 131,814Enstar Group Ltd.(a) 2,877 577,558Entegra Financial Corp.(a) 1,678 49,082Enterprise Bancorp Inc. 2,514 85,602Enterprise Financial Services Corp. 5,742 259,251Equity Bancshares Inc. Class A(a) 2,793 98,900ESSA Bancorp Inc. 2,248 35,226Essent Group Ltd.(a) 20,578 893,497Evans Bancorp Inc. 1,166 48,855Evercore Inc. Class A 9,679 871,110EZCORP Inc. Class A(a) 12,355 150,731Farmers & Merchants Bancorp Inc. 2,176 88,781Farmers Capital Bank Corp. 1,800 69,300Farmers National Banc Corp. 6,787 100,108FB Financial Corp.(a) 3,271 137,349FBL Financial Group Inc. Class A 2,551 177,677FCB Financial Holdings Inc. Class A(a) 9,208 467,766Federal Agricultural Mortgage Corp.
Class C 2,347 183,629Federated National Holding Co. 3,558 58,956Fidelity Southern Corp. 5,265 114,777Financial Engines Inc. 14,533 440,350Financial Institutions Inc. 3,700 115,070First BanCorp(a) 48,546 247,585First Bancorp (North Carolina) 7,230 255,291First Bancorp Inc. 2,862 77,932First Bancshares Inc., The 2,167 74,111First Busey Corp. 9,728 291,256First Business Financial Services Inc. 2,000 44,240First Citizens BancShares Inc. Class A 1,897 764,491First Commonwealth Financial Corp. 25,224 361,208First Community Bancshares Inc. 4,032 115,839First Connecticut Bancorp Inc. 3,703 96,833First Defiance Financial Corp. 2,589 134,550First Financial Bancorp 15,038 396,251First Financial Bankshares Inc. 15,883 715,529First Financial Corp. Indiana 2,566 116,368First Financial Northwest Inc. 2,146 33,284First Foundation Inc.(a) 7,054 130,781First Guaranty Bancshares Inc. 1,047 26,175First Internet Bancorp 1,888 72,027First Interstate BancSystem Inc. 6,693 268,055First Merchants Corp. 10,573 444,700First Mid-Illinois Bancshares Inc. 2,421 93,305First Midwest Bancorp Inc. 25,661 616,121First Northwest Bancorp(a) 2,932 47,792First of Long Island Corp., The 6,070 172,995FirstCash Inc. 11,630 784,443Flagstar Bancorp Inc.(a) 5,245 196,268
Shares Value
Common Stocks (Cont.)Financials (Cont.)Flushing Financial Corp. 6,707 $ 184,443FNB Bancorp 1,308 47,729Franklin Financial Network Inc.(a) 3,122 106,460Fulton Financial Corp. 43,050 770,595Gain Capital Holdings Inc. 9,344 93,440GAMCO Investors Inc. 1,355 40,176Genworth Financial Inc. Class A(a) 128,172 398,615German American Bancorp Inc. 5,632 198,979Glacier Bancorp Inc. 19,609 772,399Global Indemnity Ltd.(a) 2,257 94,839Granite Point Mortgage Trust Inc. 11,135 197,535Great Ajax Corp. 3,742 51,714Great Southern Bancorp Inc. 2,713 140,126Great Western Bancorp Inc. 14,575 580,085Green Bancorp Inc.(a) 5,117 103,875Green Dot Corp. Class A(a) 11,634 701,065Greene County Bancorp Inc. 553 18,028Greenhill & Co. Inc. 6,029 117,566Greenlight Capital Re Ltd. Class A(a) 7,873 158,247Guaranty Bancorp 6,080 168,112Guaranty Bancshares Inc. 519 15,907Hallmark Financial Services Inc.(a) 4,391 45,798Hamilton Lane Inc. Class A 3,858 136,535Hancock Holding Co. 21,284 1,053,558Hanmi Financial Corp. 8,220 249,477Hannon Armstrong Sustainable
Infrastructure Capital Inc. 12,688 305,273HarborOne Bancorp Inc.(a) 3,823 73,249HCI Group Inc. 2,144 64,106Health Insurance Innovations Inc.
Class A(a) 2,919 72,829Heartland Financial USA Inc. 6,192 332,201Heritage Commerce Corp. 9,347 143,196Heritage Financial Corp. 7,557 232,756Heritage Insurance Holdings Inc. 5,507 99,236Hilltop Holdings Inc. 18,725 474,304Hingham Institution for Savings 380 78,660Home Bancorp Inc. 1,446 62,496Home Bancshares Inc. 39,616 921,072HomeStreet Inc.(a) 6,688 193,618HomeTrust Bancshares Inc.(a) 4,660 119,995Hope Bancorp Inc. 31,849 581,244Horace Mann Educators Corp. 10,367 457,185Horizon Bancorp 5,385 149,703Houlihan Lokey Inc. 6,324 287,299Howard Bancorp Inc.(a) 2,253 49,566IBERIABANK Corp. 12,939 1,002,773Impac Mortgage Holdings Inc.(a) 2,776 28,204Independence Holding Co. 1,398 38,375Independent Bank Corp. 6,936 484,480Independent Bank Corp. (Michigan) 5,123 114,499Independent Bank Group Inc. 4,607 311,433Infinity Property & Casualty Corp. 2,713 287,578International Bancshares Corp. 14,019 556,554INTL FCStone Inc.(a) 3,927 167,015Invesco Mortgage Capital 27,841 496,405Investar Holding Corp. 2,110 50,851
STATE FARM MUTUAL FUND TRUST SMALL CAP INDEX FUNDSCHEDULE OF INVESTMENTS (continued)
December 31, 2017
96 See accompanying notes to financial statements.

Shares Value
Common Stocks (Cont.)Financials (Cont.)Investment Technology Group Inc. 8,661 $ 166,724Investors Bancorp Inc. 66,135 917,954Investors Title Co. 354 70,216James River Group Holdings Ltd. 6,165 246,662Kearny Financial Corp. 19,503 281,818Kemper Corp. 9,964 686,520Kingstone Companies Inc. 2,427 45,628Kinsale Capital Group Inc. 3,817 171,765KKR Real Estate Finance Trust Inc. 2,819 56,408Ladder Capital Corp. 19,439 264,954Ladenburg Thalmann Financial
Services Inc. 25,430 80,359Lakeland Bancorp Inc. 11,641 224,089Lakeland Financial Corp. 6,198 300,541LCNB Corp. 2,051 41,943LegacyTexas Financial Group Inc. 11,668 492,506LendingClub Corp.(a) 83,262 343,872LendingTree Inc.(a) 1,633 555,955Live Oak Bancshares Inc. 5,768 137,567Macatawa Bank Corp. 6,118 61,180Maiden Holdings Ltd. 15,879 104,801MainSource Financial Group Inc. 6,415 232,929Malvern Bancorp Inc.(a) 1,665 43,623Marlin Business Services Corp. 2,159 48,362MB Financial Inc. 20,338 905,448MBIA Inc.(a) 22,660 165,871MBT Financial Corp. 4,156 44,054Medley Management Inc. Class A 1,502 9,763Mercantile Bank Corp. 4,257 150,570Merchants Bancorp 1,385 27,257Meridian Bancorp Inc. 11,939 245,943Meta Financial Group Inc. 2,342 216,986Metropolitan Bank Holding Corp.(a) 774 32,585MGIC Investment Corp.(a) 93,328 1,316,858Middlefield Banc Corp. 669 32,246Midland States Bancorp Inc. 3,984 129,400MidSouth Bancorp Inc. 3,546 46,985MidWestOne Financial Group Inc. 2,892 96,969Moelis & Co. 7,986 387,321MTGE Investment Corp. 11,349 209,957MutualFirst Financial Inc. 1,344 51,811National Bank Holdings Corp. Class A 6,279 203,628National Bankshares Inc. 1,700 77,265National Commerce Corp.(a) 2,739 110,245National General Holdings Corp. 11,982 235,326National Western Life Group Inc.
Class A 593 196,295Nationstar Mortgage Holdings Inc.(a) 7,849 145,207Navigators Group Inc., The 5,037 245,302NBT Bancorp Inc. 11,097 408,370Nelnet Inc. Class A 4,766 261,081New York Mortgage Trust Inc. 29,986 185,014NI Holdings Inc.(a) 2,754 46,763Nicolet Bankshares Inc.(a) 2,338 127,982NMI Holdings Inc. Class A(a) 14,113 239,921Northeast Bancorp 1,675 38,776Northfield Bancorp Inc. 11,334 193,585
Shares Value
Common Stocks (Cont.)Financials (Cont.)Northrim BanCorp Inc. 1,641 $ 55,548Northwest Bancshares Inc. 23,770 397,672Norwood Financial Corp. 1,443 47,619OceanFirst Financial Corp. 8,219 215,749Ocwen Financial Corp.(a) 27,500 86,075OFG Bancorp 11,711 110,083Ohio Valley Banc Corp. 1,011 40,844Old Line Bancshares Inc. 2,037 59,969Old National Bancorp 33,451 583,720Old Point Financial Corp. 881 26,210Old Second Bancorp Inc. 7,100 96,915OM Asset Management PLC 18,894 316,475On Deck Capital Inc.(a) 12,136 69,661Oppenheimer Holdings Inc. Class A 2,680 71,824Opus Bank(a) 4,865 132,815Orchid Island Capital Inc. 10,437 96,855Oritani Financial Corp. 10,256 168,198Orrstown Financial Services Inc. 1,633 41,233Owens Realty Mortgage Inc. 2,720 43,547Pacific Mercantile Bancorp(a) 3,714 32,498Pacific Premier Bancorp Inc.(a) 9,814 392,560Paragon Commercial Corp.(a) 1,090 57,999Park National Corp. 3,287 341,848Parke Bancorp Inc. 1,456 29,921PCSB Financial Corp.(a) 4,726 90,030Peapack-Gladstone Financial Corp. 4,109 143,897Penns Woods Bancorp Inc. 1,257 58,551PennyMac Mortgage Investment Trust 15,371 247,012Peoples Bancorp Inc. 4,259 138,929Peoples Bancorp of North Carolina Inc. 1,168 35,846Peoples Financial Services Corp. 1,900 88,502People’s Utah Bancorp 3,262 98,839PHH Corp.(a) 7,693 79,238Piper Jaffray Companies Inc. 3,610 311,363PJT Partners Inc. Class A 4,400 200,640PRA Group Inc.(a) 11,391 378,181Preferred Bank 3,230 189,859Premier Financial Bancorp Inc. 2,157 43,313Primerica Inc. 11,182 1,135,532Provident Bancorp Inc.(a) 1,045 27,640Provident Financial Holdings Inc. 1,708 31,427Provident Financial Services Inc. 15,115 407,652Prudential Bancorp Inc. 2,028 35,693Pzena Investment Management Inc.
Class A 3,586 38,263QCR Holdings Inc. 3,141 134,592Radian Group Inc. 54,670 1,126,749RBB Bancorp 743 20,336Redwood Trust Inc. 19,693 291,850Regional Management Corp.(a) 2,600 68,406Renasant Corp. 11,409 466,514Republic Bancorp Inc. Class A 2,619 99,574Republic First Bancorp Inc.(a) 13,455 113,695Resource Capital Corp. 8,574 80,338Riverview Bancorp Inc. 5,029 43,601RLI Corp. 9,846 597,258
STATE FARM MUTUAL FUND TRUST SMALL CAP INDEX FUNDSCHEDULE OF INVESTMENTS (continued)
December 31, 2017
See accompanying notes to financial statements. 97

Shares Value
Common Stocks (Cont.)Financials (Cont.)S&T Bancorp Inc. 8,884 $ 353,672Safeguard Scientifics Inc.(a) 5,216 58,419Safety Insurance Group Inc. 3,764 302,626Sandy Spring Bancorp Inc. 5,736 223,819Seacoast Banking Corporation of
Florida(a) 10,452 263,495Selective Insurance Group Inc. 14,629 858,722ServisFirst Bancshares Inc. 11,607 481,691Shore Bancshares Inc. 2,988 49,900SI Financial Group Inc. 2,871 42,204Sierra Bancorp 3,000 79,680Silvercrest Asset Management Group
Inc. Class A 1,782 28,601Simmons First National Corp. 10,173 580,878SmartFinancial Inc.(a) 1,823 39,559South State Corp. 9,106 793,588Southern First Bancshares Inc.(a) 1,427 58,864Southern Missouri Bancorp Inc. 1,446 54,355Southern National Bancorp of
Virginia Inc. 5,216 83,612Southside Bancshares Inc. 7,260 244,517State Auto Financial Corp. 4,446 129,468State Bank Financial Corp. 9,764 291,358Sterling Bancorp 54,468 1,339,913Stewart Information Services Corp. 5,234 221,398Stifel Financial Corp. 16,682 993,580Stock Yards Bancorp Inc. 5,650 213,005Summit Financial Group Inc. 2,641 69,511Sun Bancorp Inc. 2,832 68,818Sunshine Bancorp Inc.(a) 1,920 44,045Sutherland Asset Management Corp. 4,818 72,993Territorial Bancorp Inc. 2,085 64,364Texas Capital Bancshares Inc.(a) 12,549 1,115,606Third Point Reinsurance Ltd.(a) 22,882 335,221Timberland Bancorp Inc. 1,578 41,896Tiptree Inc. 5,976 35,557Tompkins Financial Corp. 3,558 289,443TowneBank 13,980 429,885TPG RE Finance Trust Inc. 2,685 51,149Trico Bancshares 5,323 201,529Tristate Capital Holdings Inc.(a) 5,500 126,500Triumph Bancorp Inc.(a) 4,572 144,018Trupanion Inc.(a) 5,880 172,108Trustco Bank Corp. NY 23,377 215,068Trustmark Corp. 16,681 531,457Two River Bancorp 1,809 32,797UMB Financial Corp. 11,480 825,642Umpqua Holdings Corp. 56,102 1,166,922Union Bankshares Corp. 10,745 388,647Union Bankshares Inc. 889 47,073United Bankshares Inc. 25,084 871,669United Community Banks Inc. 18,536 521,603United Community Financial Corp. 12,500 114,125United Financial Bancorp Inc. 13,173 232,372United Fire Group Inc. 5,224 238,110United Insurance Holdings Corp. 5,451 94,030United Security Bancshares 3,268 35,948
Shares Value
Common Stocks (Cont.)Financials (Cont.)Unity Bancorp Inc. 1,926 $ 38,039Universal Insurance Holdings Inc. 7,933 216,968Univest Corp. of Pennsylvania 6,643 186,336Valley National Bancorp 65,668 736,795Veritex Holdings Inc.(a) 3,723 102,718Virtu Financial Inc. Class A 6,783 124,129Virtus Investment Partners Inc. 1,768 203,408Waddell & Reed Financial Inc. Class A 20,045 447,805Walker & Dunlop Inc.(a) 6,951 330,173Washington Federal Inc. 21,954 751,925Washington Trust Bancorp Inc. 3,982 212,042WashingtonFirst Bankshares Inc. 2,532 86,746Waterstone Financial Inc. 6,915 117,901WesBanco Inc. 10,427 423,858West Bancorporation 4,200 105,630Westamerica Bancorporation 6,256 372,545Western Asset Mortgage
Capital Corp. 11,366 113,092Western New England Bancorp Inc. 6,784 73,946Westwood Holdings Group Inc. 2,134 141,292Wintrust Financial Corp. 14,051 1,157,381WisdomTree Investments Inc. 29,596 371,430WMIH Corp.(a) 51,344 43,596World Acceptance Corp.(a) 1,453 117,286WSFS Financial Corp. 7,335 350,980Xenith Bankshares Inc.(a) 1,347 45,569
94,082,506
Health Care (15.15%)AAC Holdings Inc.(a) 2,887 25,983Abaxis Inc. 5,287 261,812Abeona Therapeutics Inc.(a) 7,194 114,025Accelerate Diagnostics Inc.(a) 6,761 177,138Acceleron Pharma Inc.(a) 9,586 406,830Accuray Inc.(a) 21,167 91,018Aceto Corp. 7,364 76,070Achaogen Inc.(a) 8,840 94,942Achillion Pharmaceuticals Inc.(a) 30,812 88,739Aclaris Therapeutics Inc.(a) 5,828 143,718Acorda Therapeutics Inc.(a) 11,223 240,733Adamas Pharmaceuticals Inc.(a) 3,821 129,494Addus HomeCare Corp.(a) 1,678 58,394Aduro Biotech Inc.(a) 10,795 80,963Advaxis Inc.(a) 9,692 27,525Aerie Pharmaceuticals Inc.(a) 8,228 491,623Agenus Inc.(a) 18,600 60,636Aileron Therapeutics Inc.(a) 1,175 12,385Aimmune Therapeutics Inc.(a) 8,691 328,694Akcea Therapeutics Inc.(a) 3,820 66,315Akebia Therapeutics Inc.(a) 11,505 171,079Alder Biopharmaceuticals Inc.(a) 16,065 183,944Allena Pharmaceuticals Inc.(a) 1,354 13,621Allscripts Healthcare Solutions Inc.(a) 45,918 668,107Almost Family Inc.(a) 3,327 184,149AMAG Pharmaceuticals Inc.(a) 9,117 120,800Amedisys Inc.(a) 7,388 389,421
STATE FARM MUTUAL FUND TRUST SMALL CAP INDEX FUNDSCHEDULE OF INVESTMENTS (continued)
December 31, 2017
98 See accompanying notes to financial statements.

Shares Value
Common Stocks (Cont.)Health Care (Cont.)American Renal Associates Holdings
Inc.(a) 2,656 $ 46,214Amicus Therapeutics Inc.(a) 42,636 613,532AMN Healthcare Services Inc.(a) 12,026 592,281Amphastar Pharmaceuticals Inc.(a) 9,135 175,757Analogic Corp. 3,026 253,432AnaptysBio Inc.(a) 4,577 460,995Anavex Life Sciences Corp.(a) 8,376 26,971Angiodynamics Inc.(a) 9,498 157,952ANI Pharmaceuticals Inc.(a) 2,055 132,445Anika Therapeutics Inc.(a) 3,612 194,723Antares Pharma Inc.(a) 37,153 73,934Apellis Pharmaceuticals Inc.(a) 2,724 59,111Aratana Therapeutics Inc.(a) 10,556 55,525Ardelyx Inc.(a) 8,691 57,361Arena Pharmaceuticals Inc.(a) 10,048 341,331Array Biopharma Inc.(a) 49,637 635,354Assembly Biosciences Inc.(a) 4,109 185,932Asterias Biotherapeutics(a) 5,683 12,787Atara Biotherapeutics Inc.(a) 6,928 125,397Athenex Inc.(a) 1,663 26,442Athersys Inc.(a) 30,406 55,035AtriCure Inc.(a) 8,148 148,620Atrion Corp. 369 232,691Audentes Therapeutics Inc.(a) 3,925 122,656AveXis Inc.(a) 6,146 680,178AxoGen Inc.(a) 7,053 199,600Axovant Sciences Ltd.(a) 8,534 44,974Bellicum Pharmaceutical Inc.(a) 7,195 60,510BioCryst Pharmaceuticals Inc.(a) 24,841 121,969Biohaven Pharmaceutical Holding
Company Ltd.(a) 2,630 70,957BioScrip Inc.(a) 30,994 90,193BioSpecifics Technologies Corp.(a) 1,431 62,005BioTelemetry Inc.(a) 7,986 238,781BioTime Inc.(a) 19,903 42,791Bluebird Bio Inc.(a) 12,291 2,189,027Blueprint Medicines Corp.(a) 10,648 802,966Calithera Biosciences Inc.(a) 7,937 66,274Calyxt Inc.(a) 2,038 44,897Cambrex Corp.(a) 8,084 388,032Cantel Medical Corp. 9,264 952,988Capital Senior Living Corp.(a) 6,561 88,508Cara Therapeutics Inc.(a) 6,765 82,804Cardiovascular Systems Inc.(a) 8,549 202,526Cascadian Therapeutics Inc.(a) 8,633 31,942Castlight Health Inc. Class B(a) 16,604 62,265Catalent Inc.(a) 33,541 1,377,864Catalyst Pharmaceuticals Inc.(a) 18,363 71,799Celcuity Inc.(a) 881 16,695Celldex Therapeutics Inc.(a) 31,299 88,889Cerus Corp.(a) 30,477 103,012Chemed Corp. 4,004 973,052ChemoCentryx Inc.(a) 5,355 31,862Chimerix Inc.(a) 11,084 51,319Civitas Solutions Inc.(a) 4,333 74,094Clearside Biomedical Inc.(a) 5,346 37,422
Shares Value
Common Stocks (Cont.)Health Care (Cont.)Clovis Oncology Inc.(a) 10,995 $ 747,660Coherus Biosciences Inc.(a) 9,605 84,524Collegium Pharmaceutical Inc.(a) 6,754 124,679Community Health Systems Inc.(a) 24,948 106,278Computer Programs & Systems Inc. 2,972 89,309Conatus Pharmaceuticals Inc.(a) 6,669 30,811Concert Pharmaceuticals Inc.(a) 4,488 116,105ConforMis Inc.(a) 8,957 21,318Conmed Corp. 6,684 340,683Corbus Pharmaceuticals Holdings
Inc.(a) 11,500 81,650Corcept Therapeutics Inc.(a) 22,787 411,533Corindus Vascular Robotics Inc.(a) 21,596 21,812Corium International Inc.(a) 6,632 63,734Corvel Corp.(a) 2,242 118,602Corvus Pharmaceuticals Inc.(a) 2,140 22,170Cotiviti Holdings Inc.(a) 9,088 292,724Cross Country Healthcare Inc.(a) 9,593 122,407CryoLife Inc.(a) 8,171 156,475Curis Inc.(a) 33,389 23,372Cutera Inc.(a) 3,500 158,725Cytokinetics Inc.(a) 10,814 88,134CytomX Therapeutics Inc.(a) 7,527 158,895Deciphera Pharmaceuticals Inc.(a) 2,088 47,335DepoMed Inc.(a) 15,071 121,322Dermira Inc.(a) 9,924 275,986Diplomat Pharmacy Inc.(a) 12,166 244,172Dova Pharmaceuticals Inc.(a) 1,248 35,942Durect Corp.(a) 34,343 31,657Dyax Corp. Contingent
Value Rights(a)(b) 35,404 39,298Dynavax Technologies Corp.(a) 15,618 292,057Eagle Pharmaceuticals Inc.(a) 2,163 115,547Edge Therapeutics Inc.(a) 5,103 47,815Editas Medicine Inc.(a) 8,820 271,039Emergent Biosolutions Inc.(a) 8,491 394,577Enanta Pharmaceuticals Inc.(a) 3,733 219,052Endologix Inc.(a) 20,994 112,318Ensign Group Inc., The 12,470 276,834Entellus Medical Inc.(a) 3,157 76,999Enzo Biochem Inc.(a) 9,922 80,864Epizyme Inc.(a) 12,471 156,511Esperion Therapeutics Inc.(a) 4,397 289,498Evolent Health Inc. Class A(a) 15,118 185,951Exact Sciences Corp.(a) 29,511 1,550,508Exactech Inc.(a) 2,600 128,570Fate Therapeutics Inc.(a) 9,589 58,589FibroGen Inc.(a) 17,388 824,191Five Prime Therapeutics Inc.(a) 7,150 156,728Flexion Therapeutics Inc.(a) 8,400 210,336Fluidigm Corp.(a) 10,478 61,715Fonar Corp.(a) 1,578 38,424Fortress Biotech Inc.(a) 8,043 32,092Foundation Medicine Inc.(a) 3,716 253,431G1 Therapeutics Inc.(a) 1,961 38,906Genesis Healthcare Inc.(a) 10,551 8,049GenMark Diagnostics Inc.(a) 13,088 54,577
STATE FARM MUTUAL FUND TRUST SMALL CAP INDEX FUNDSCHEDULE OF INVESTMENTS (continued)
December 31, 2017
See accompanying notes to financial statements. 99

Shares Value
Common Stocks (Cont.)Health Care (Cont.)Genocea Biosciences Inc.(a) 7,265 $ 8,427Genomic Health Inc.(a) 4,926 168,469Geron Corp.(a) 39,201 70,562Glaukos Corp.(a) 7,476 191,759Global Blood Therapeutics Inc.(a) 9,175 361,036Globus Medical Inc. Class A(a) 17,964 738,320Haemonetics Corp.(a) 13,487 783,325Halozyme Therapeutics Inc.(a) 29,625 600,203Halyard Health Inc.(a) 11,913 550,142HealthEquity Inc.(a) 12,459 581,337Healthsouth Corp. 24,730 1,221,909HealthStream Inc.(a) 6,817 157,882Heron Therapeutics Inc.(a) 11,364 205,688Heska Corp.(a) 1,599 128,256HMS Holdings Corp.(a) 20,764 351,950Horizon Pharma PLC(a) 41,517 606,148ICU Medical Inc.(a) 3,840 829,440Idera Pharmaceuticals Inc.(a) 36,086 76,141Ignyta Inc.(a) 15,057 402,022Immune Design Corp.(a) 9,222 35,966ImmunoGen Inc.(a) 25,543 163,731Immunomedics Inc.(a) 26,115 422,018Impax Laboratories Inc.(a) 18,168 302,497INC Research Holdings Inc. Class A(a) 13,859 604,252Innoviva Inc.(a) 18,154 257,605Inogen Inc.(a) 4,264 507,757Inovalon Holdings Inc. Class A(a) 16,335 245,025Inovio Pharmaceuticals Inc.(a) 20,584 85,012Insmed Inc.(a) 19,380 604,268Insulet Corp.(a) 14,565 1,004,985Insys Therapeutics Inc.(a) 6,200 59,644Integer Holdings Corp.(a) 8,007 362,717Integra LifeSciences Holdings Corp.(a) 15,983 764,946Intellia Therapeutics Inc.(a) 4,570 87,835Intersect ENT Inc.(a) 6,507 210,827Intra-Cellular Therapies Inc.(a) 10,695 154,864Invacare Corp. 8,104 136,552Invitae Corp.(a) 10,046 91,218Iovance Biotherapeutics Inc.(a) 16,493 131,944iRhythm Technologies Inc.(a) 3,602 201,892Ironwood Pharmaceuticals Inc.(a) 32,854 492,481Jounce Therapeutics Inc.(a) 3,614 46,079K2M Group Holdings Inc.(a) 10,527 189,486Kala Pharmaceuticals Inc.(a) 2,030 37,535Karyopharm Therapeutics Inc.(a) 8,731 83,818Keryx Biopharmaceuticals Inc.(a) 22,994 106,922Kindred Biosciences Inc.(a) 5,325 50,321Kindred Healthcare Inc. 22,044 213,827Kura Oncology Inc.(a) 4,934 75,490La Jolla Pharmaceutical Co.(a) 4,523 145,550Lannett Company Inc.(a) 7,366 170,891Lantheus Holdings Inc.(a) 7,820 159,919LeMaitre Vascular Inc. 3,883 123,635Lexicon Pharmaceuticals Inc.(a) 11,096 109,628LHC Group Inc.(a) 3,835 234,894Ligand Pharmaceuticals Inc.
Class B(a) 5,027 688,347
Shares Value
Common Stocks (Cont.)Health Care (Cont.)LivaNova PLC(a) 12,198 $ 974,864Loxo Oncology Inc.(a) 5,700 479,826Luminex Corp. 10,619 209,194MacroGenics Inc.(a) 8,395 159,505Madrigal Pharmaceuticals Inc.(a) 1,132 103,906Magellan Health Inc.(a) 6,051 584,224Masimo Corp.(a) 11,326 960,445Matinas BioPharma Holdings Inc.(a) 13,754 15,955Medicines Co., The(a) 17,063 466,502MediciNova Inc.(a) 7,302 47,244Medidata Solutions Inc.(a) 14,111 894,214Medpace Holdings Inc.(a) 1,660 60,192Melinta Therapeutics Inc.(a) 2,317 36,609Meridian Bioscience Inc. 10,951 153,314Merit Medical Systems Inc.(a) 12,442 537,494Merrimack Pharmaceuticals Inc. 3,158 32,370Mersana Therapeutics Inc.(a) 1,187 19,502MiMedx Group Inc.(a) 26,098 329,096Minerva Neurosciences Inc.(a) 6,493 39,283Miragen Therapeutics Inc.(a) 3,153 32,886Molina Healthcare Inc.(a) 11,203 859,046Momenta Pharmaceuticals Inc.(a) 19,138 266,975MyoKardia Inc.(a) 4,967 209,111Myriad Genetics Inc.(a) 16,259 558,415NanoString Technologies Inc.(a) 5,518 41,219NantHealth Inc.(a) 4,515 13,771NantKwest Inc.(a) 7,897 35,458Natera Inc.(a) 8,142 73,197National Healthcare Corp. 2,874 175,142National Research Corp. Class A 2,400 89,520Natus Medical Inc.(a) 7,636 291,695Nektar Therapeutics(a) 37,283 2,226,541Neogen Corp.(a) 9,390 771,952NeoGenomics Inc.(a) 14,347 127,114Neos Therapeutics Inc.(a) 5,718 58,324Nevro Corp.(a) 6,896 476,100NewLink Genetics Corp.(a) 7,896 64,037Novavax Inc.(a) 81,906 101,563Novelion Therapeutics Inc.(a) 3,798 11,850Novocure Ltd.(a) 15,039 303,788NuVasive Inc.(a) 12,878 753,234NxStage Medical Inc.(a) 16,551 401,031Nymox Pharmaceutical Corp.(a) 7,291 24,060Obalon Therapeutics Inc.(a) 2,139 14,139Ocular Therapeutix Inc.(a) 5,875 26,144Omeros Corp.(a) 11,845 230,148Omnicell Inc.(a) 9,482 459,877Omthera Pharmaceuticals Inc.
Contingent Value Rights(a)(b)(c) 1,326 0Optinose Inc.(a) 1,129 21,338OraSure Technologies Inc.(a) 14,563 274,658Organovo Holdings Inc.(a) 23,400 31,356Orthofix International NV(a) 4,222 230,943OrthoPediatrics Corp.(a) 926 17,770Otonomy Inc.(a) 7,306 40,548Ovid Therapeutics Inc.(a) 1,295 12,782Owens & Minor Inc. 15,096 285,012
STATE FARM MUTUAL FUND TRUST SMALL CAP INDEX FUNDSCHEDULE OF INVESTMENTS (continued)
December 31, 2017
100 See accompanying notes to financial statements.
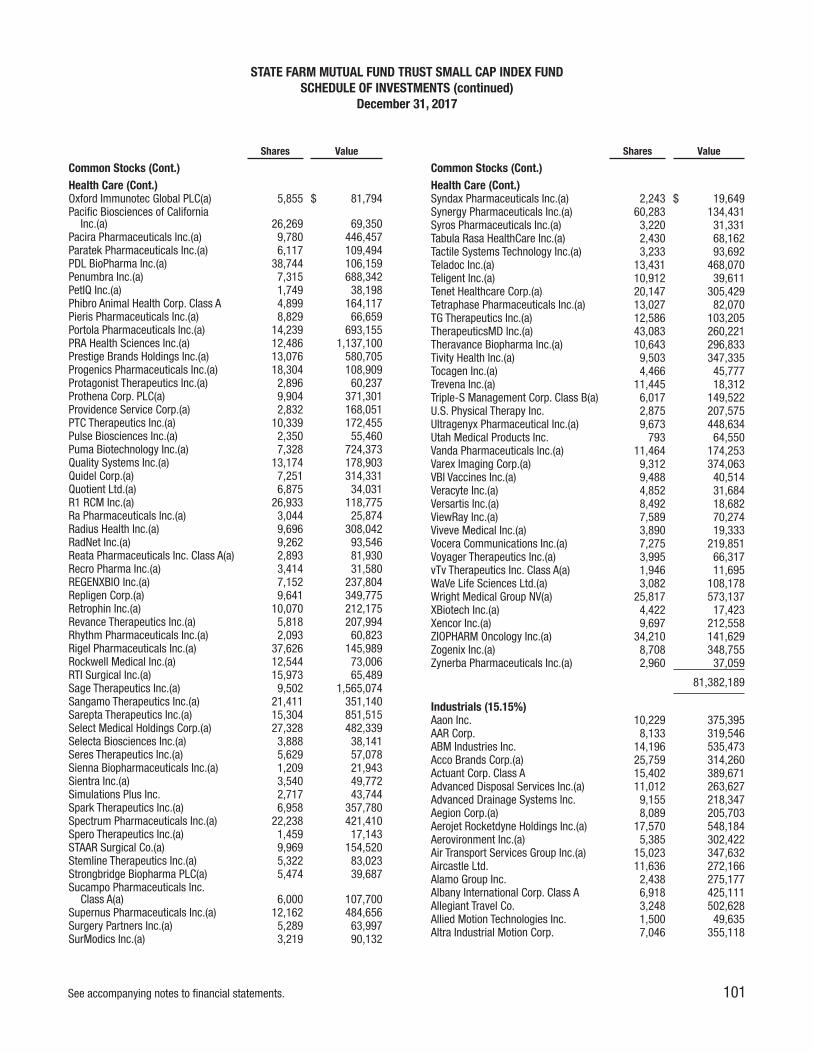
Shares Value
Common Stocks (Cont.)Health Care (Cont.)Oxford Immunotec Global PLC(a) 5,855 $ 81,794Pacific Biosciences of California
Inc.(a) 26,269 69,350Pacira Pharmaceuticals Inc.(a) 9,780 446,457Paratek Pharmaceuticals Inc.(a) 6,117 109,494PDL BioPharma Inc.(a) 38,744 106,159Penumbra Inc.(a) 7,315 688,342PetIQ Inc.(a) 1,749 38,198Phibro Animal Health Corp. Class A 4,899 164,117Pieris Pharmaceuticals Inc.(a) 8,829 66,659Portola Pharmaceuticals Inc.(a) 14,239 693,155PRA Health Sciences Inc.(a) 12,486 1,137,100Prestige Brands Holdings Inc.(a) 13,076 580,705Progenics Pharmaceuticals Inc.(a) 18,304 108,909Protagonist Therapeutics Inc.(a) 2,896 60,237Prothena Corp. PLC(a) 9,904 371,301Providence Service Corp.(a) 2,832 168,051PTC Therapeutics Inc.(a) 10,339 172,455Pulse Biosciences Inc.(a) 2,350 55,460Puma Biotechnology Inc.(a) 7,328 724,373Quality Systems Inc.(a) 13,174 178,903Quidel Corp.(a) 7,251 314,331Quotient Ltd.(a) 6,875 34,031R1 RCM Inc.(a) 26,933 118,775Ra Pharmaceuticals Inc.(a) 3,044 25,874Radius Health Inc.(a) 9,696 308,042RadNet Inc.(a) 9,262 93,546Reata Pharmaceuticals Inc. Class A(a) 2,893 81,930Recro Pharma Inc.(a) 3,414 31,580REGENXBIO Inc.(a) 7,152 237,804Repligen Corp.(a) 9,641 349,775Retrophin Inc.(a) 10,070 212,175Revance Therapeutics Inc.(a) 5,818 207,994Rhythm Pharmaceuticals Inc.(a) 2,093 60,823Rigel Pharmaceuticals Inc.(a) 37,626 145,989Rockwell Medical Inc.(a) 12,544 73,006RTI Surgical Inc.(a) 15,973 65,489Sage Therapeutics Inc.(a) 9,502 1,565,074Sangamo Therapeutics Inc.(a) 21,411 351,140Sarepta Therapeutics Inc.(a) 15,304 851,515Select Medical Holdings Corp.(a) 27,328 482,339Selecta Biosciences Inc.(a) 3,888 38,141Seres Therapeutics Inc.(a) 5,629 57,078Sienna Biopharmaceuticals Inc.(a) 1,209 21,943Sientra Inc.(a) 3,540 49,772Simulations Plus Inc. 2,717 43,744Spark Therapeutics Inc.(a) 6,958 357,780Spectrum Pharmaceuticals Inc.(a) 22,238 421,410Spero Therapeutics Inc.(a) 1,459 17,143STAAR Surgical Co.(a) 9,969 154,520Stemline Therapeutics Inc.(a) 5,322 83,023Strongbridge Biopharma PLC(a) 5,474 39,687Sucampo Pharmaceuticals Inc.
Class A(a) 6,000 107,700Supernus Pharmaceuticals Inc.(a) 12,162 484,656Surgery Partners Inc.(a) 5,289 63,997SurModics Inc.(a) 3,219 90,132
Shares Value
Common Stocks (Cont.)Health Care (Cont.)Syndax Pharmaceuticals Inc.(a) 2,243 $ 19,649Synergy Pharmaceuticals Inc.(a) 60,283 134,431Syros Pharmaceuticals Inc.(a) 3,220 31,331Tabula Rasa HealthCare Inc.(a) 2,430 68,162Tactile Systems Technology Inc.(a) 3,233 93,692Teladoc Inc.(a) 13,431 468,070Teligent Inc.(a) 10,912 39,611Tenet Healthcare Corp.(a) 20,147 305,429Tetraphase Pharmaceuticals Inc.(a) 13,027 82,070TG Therapeutics Inc.(a) 12,586 103,205TherapeuticsMD Inc.(a) 43,083 260,221Theravance Biopharma Inc.(a) 10,643 296,833Tivity Health Inc.(a) 9,503 347,335Tocagen Inc.(a) 4,466 45,777Trevena Inc.(a) 11,445 18,312Triple-S Management Corp. Class B(a) 6,017 149,522U.S. Physical Therapy Inc. 2,875 207,575Ultragenyx Pharmaceutical Inc.(a) 9,673 448,634Utah Medical Products Inc. 793 64,550Vanda Pharmaceuticals Inc.(a) 11,464 174,253Varex Imaging Corp.(a) 9,312 374,063VBI Vaccines Inc.(a) 9,488 40,514Veracyte Inc.(a) 4,852 31,684Versartis Inc.(a) 8,492 18,682ViewRay Inc.(a) 7,589 70,274Viveve Medical Inc.(a) 3,890 19,333Vocera Communications Inc.(a) 7,275 219,851Voyager Therapeutics Inc.(a) 3,995 66,317vTv Therapeutics Inc. Class A(a) 1,946 11,695WaVe Life Sciences Ltd.(a) 3,082 108,178Wright Medical Group NV(a) 25,817 573,137XBiotech Inc.(a) 4,422 17,423Xencor Inc.(a) 9,697 212,558ZIOPHARM Oncology Inc.(a) 34,210 141,629Zogenix Inc.(a) 8,708 348,755Zynerba Pharmaceuticals Inc.(a) 2,960 37,059
81,382,189
Industrials (15.15%)Aaon Inc. 10,229 375,395AAR Corp. 8,133 319,546ABM Industries Inc. 14,196 535,473Acco Brands Corp.(a) 25,759 314,260Actuant Corp. Class A 15,402 389,671Advanced Disposal Services Inc.(a) 11,012 263,627Advanced Drainage Systems Inc. 9,155 218,347Aegion Corp.(a) 8,089 205,703Aerojet Rocketdyne Holdings Inc.(a) 17,570 548,184Aerovironment Inc.(a) 5,385 302,422Air Transport Services Group Inc.(a) 15,023 347,632Aircastle Ltd. 11,636 272,166Alamo Group Inc. 2,438 275,177Albany International Corp. Class A 6,918 425,111Allegiant Travel Co. 3,248 502,628Allied Motion Technologies Inc. 1,500 49,635Altra Industrial Motion Corp. 7,046 355,118
STATE FARM MUTUAL FUND TRUST SMALL CAP INDEX FUNDSCHEDULE OF INVESTMENTS (continued)
December 31, 2017
See accompanying notes to financial statements. 101
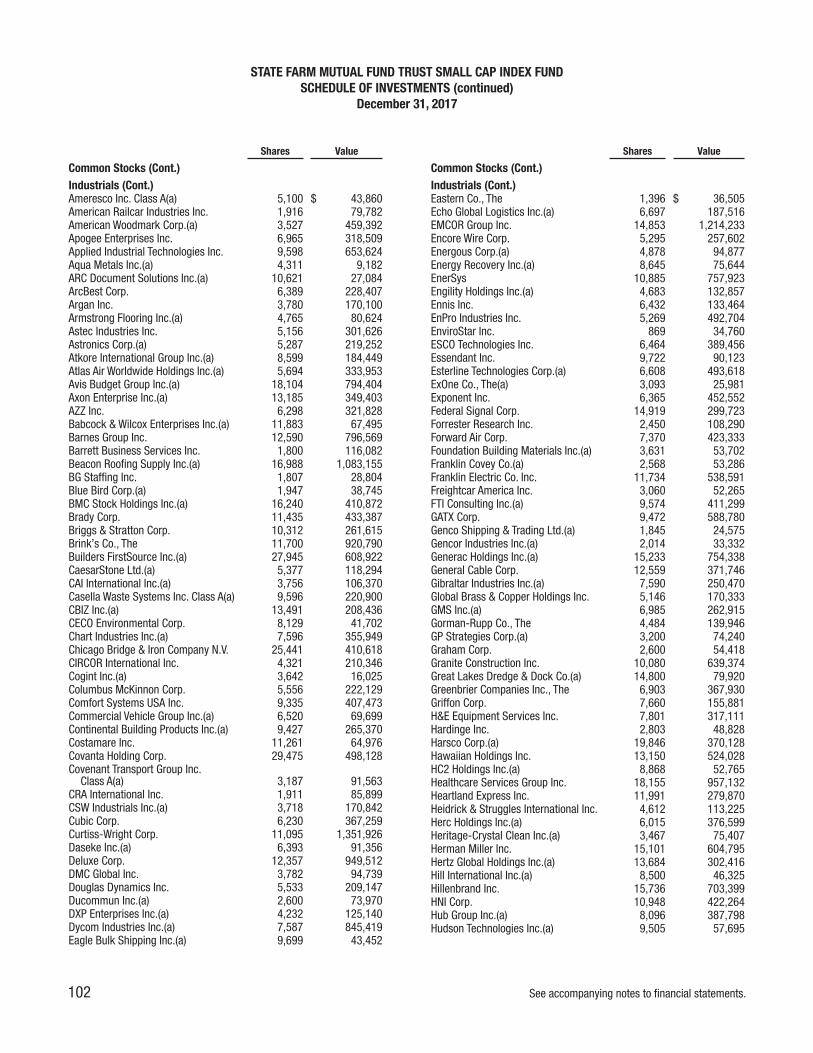
Shares Value
Common Stocks (Cont.)Industrials (Cont.)Ameresco Inc. Class A(a) 5,100 $ 43,860American Railcar Industries Inc. 1,916 79,782American Woodmark Corp.(a) 3,527 459,392Apogee Enterprises Inc. 6,965 318,509Applied Industrial Technologies Inc. 9,598 653,624Aqua Metals Inc.(a) 4,311 9,182ARC Document Solutions Inc.(a) 10,621 27,084ArcBest Corp. 6,389 228,407Argan Inc. 3,780 170,100Armstrong Flooring Inc.(a) 4,765 80,624Astec Industries Inc. 5,156 301,626Astronics Corp.(a) 5,287 219,252Atkore International Group Inc.(a) 8,599 184,449Atlas Air Worldwide Holdings Inc.(a) 5,694 333,953Avis Budget Group Inc.(a) 18,104 794,404Axon Enterprise Inc.(a) 13,185 349,403AZZ Inc. 6,298 321,828Babcock & Wilcox Enterprises Inc.(a) 11,883 67,495Barnes Group Inc. 12,590 796,569Barrett Business Services Inc. 1,800 116,082Beacon Roofing Supply Inc.(a) 16,988 1,083,155BG Staffing Inc. 1,807 28,804Blue Bird Corp.(a) 1,947 38,745BMC Stock Holdings Inc.(a) 16,240 410,872Brady Corp. 11,435 433,387Briggs & Stratton Corp. 10,312 261,615Brink’s Co., The 11,700 920,790Builders FirstSource Inc.(a) 27,945 608,922CaesarStone Ltd.(a) 5,377 118,294CAI International Inc.(a) 3,756 106,370Casella Waste Systems Inc. Class A(a) 9,596 220,900CBIZ Inc.(a) 13,491 208,436CECO Environmental Corp. 8,129 41,702Chart Industries Inc.(a) 7,596 355,949Chicago Bridge & Iron Company N.V. 25,441 410,618CIRCOR International Inc. 4,321 210,346Cogint Inc.(a) 3,642 16,025Columbus McKinnon Corp. 5,556 222,129Comfort Systems USA Inc. 9,335 407,473Commercial Vehicle Group Inc.(a) 6,520 69,699Continental Building Products Inc.(a) 9,427 265,370Costamare Inc. 11,261 64,976Covanta Holding Corp. 29,475 498,128Covenant Transport Group Inc.
Class A(a) 3,187 91,563CRA International Inc. 1,911 85,899CSW Industrials Inc.(a) 3,718 170,842Cubic Corp. 6,230 367,259Curtiss-Wright Corp. 11,095 1,351,926Daseke Inc.(a) 6,393 91,356Deluxe Corp. 12,357 949,512DMC Global Inc. 3,782 94,739Douglas Dynamics Inc. 5,533 209,147Ducommun Inc.(a) 2,600 73,970DXP Enterprises Inc.(a) 4,232 125,140Dycom Industries Inc.(a) 7,587 845,419Eagle Bulk Shipping Inc.(a) 9,699 43,452
Shares Value
Common Stocks (Cont.)Industrials (Cont.)Eastern Co., The 1,396 $ 36,505Echo Global Logistics Inc.(a) 6,697 187,516EMCOR Group Inc. 14,853 1,214,233Encore Wire Corp. 5,295 257,602Energous Corp.(a) 4,878 94,877Energy Recovery Inc.(a) 8,645 75,644EnerSys 10,885 757,923Engility Holdings Inc.(a) 4,683 132,857Ennis Inc. 6,432 133,464EnPro Industries Inc. 5,269 492,704EnviroStar Inc. 869 34,760ESCO Technologies Inc. 6,464 389,456Essendant Inc. 9,722 90,123Esterline Technologies Corp.(a) 6,608 493,618ExOne Co., The(a) 3,093 25,981Exponent Inc. 6,365 452,552Federal Signal Corp. 14,919 299,723Forrester Research Inc. 2,450 108,290Forward Air Corp. 7,370 423,333Foundation Building Materials Inc.(a) 3,631 53,702Franklin Covey Co.(a) 2,568 53,286Franklin Electric Co. Inc. 11,734 538,591Freightcar America Inc. 3,060 52,265FTI Consulting Inc.(a) 9,574 411,299GATX Corp. 9,472 588,780Genco Shipping & Trading Ltd.(a) 1,845 24,575Gencor Industries Inc.(a) 2,014 33,332Generac Holdings Inc.(a) 15,233 754,338General Cable Corp. 12,559 371,746Gibraltar Industries Inc.(a) 7,590 250,470Global Brass & Copper Holdings Inc. 5,146 170,333GMS Inc.(a) 6,985 262,915Gorman-Rupp Co., The 4,484 139,946GP Strategies Corp.(a) 3,200 74,240Graham Corp. 2,600 54,418Granite Construction Inc. 10,080 639,374Great Lakes Dredge & Dock Co.(a) 14,800 79,920Greenbrier Companies Inc., The 6,903 367,930Griffon Corp. 7,660 155,881H&E Equipment Services Inc. 7,801 317,111Hardinge Inc. 2,803 48,828Harsco Corp.(a) 19,846 370,128Hawaiian Holdings Inc. 13,150 524,028HC2 Holdings Inc.(a) 8,868 52,765Healthcare Services Group Inc. 18,155 957,132Heartland Express Inc. 11,991 279,870Heidrick & Struggles International Inc. 4,612 113,225Herc Holdings Inc.(a) 6,015 376,599Heritage-Crystal Clean Inc.(a) 3,467 75,407Herman Miller Inc. 15,101 604,795Hertz Global Holdings Inc.(a) 13,684 302,416Hill International Inc.(a) 8,500 46,325Hillenbrand Inc. 15,736 703,399HNI Corp. 10,948 422,264Hub Group Inc.(a) 8,096 387,798Hudson Technologies Inc.(a) 9,505 57,695
STATE FARM MUTUAL FUND TRUST SMALL CAP INDEX FUNDSCHEDULE OF INVESTMENTS (continued)
December 31, 2017
102 See accompanying notes to financial statements.

Shares Value
Common Stocks (Cont.)Industrials (Cont.)Hurco Companies Inc. 1,569 $ 66,212Huron Consulting Group Inc.(a) 5,770 233,397Huttig Building Products Inc.(a) 6,126 40,738Hyster-Yale Materials Handling Inc. 2,683 228,484ICF International Inc.(a) 4,555 239,138IES Holdings Inc.(a) 1,968 33,948Innerworkings Inc.(a) 11,869 119,046Insperity Inc. 9,258 530,946Insteel Industries Inc. 4,500 127,440Interface Inc. 15,013 377,577JELD-WEN Holding Inc.(a) 16,968 668,030John Bean Technologies Corp. 7,903 875,652Kadant Inc. 2,758 276,903Kaman Corp. 6,774 398,582KBR Inc. 35,045 694,942Kelly Services Inc. Class A 7,516 204,961Kennametal Inc. 20,104 973,235Keyw Holding Corp., The(a) 12,213 71,690Kforce Inc. 6,210 156,803Kimball International Inc. Class B 9,563 178,541KLX Inc.(a) 12,954 884,111Knight-Swift Transportation Holdings
Inc. 31,763 1,388,678Knoll Inc. 12,592 290,120Korn/Ferry International 13,346 552,257Kratos Defense & Security Solutions
Inc.(a) 21,642 229,189L.B. Foster Co. Class A(a) 2,058 55,875Lawson Products Inc.(a) 1,400 34,650Layne Christensen Co.(a) 4,883 61,282Lindsay Corp. 2,581 227,644LSC Communications Inc. 8,804 133,381LSI Industries Inc. 5,747 39,539Lydall Inc.(a) 4,007 203,355Manitowoc Company Inc., The(a) 8,246 324,398Marten Transport Ltd. 10,328 209,658Masonite International Corp.(a) 7,210 534,622MasTec Inc.(a) 16,971 830,730Matson Inc. 10,586 315,886Matthews International Corp. Class A 7,649 403,867McGrath Rentcorp 5,756 270,417Mercury Systems Inc.(a) 11,689 600,230Meritor Inc.(a) 21,210 497,587Milacron Holdings Corp.(a) 13,571 259,749Miller Industries Inc. 2,950 76,110Mistras Group Inc.(a) 4,362 102,376Mobile Mini Inc. 10,778 371,841Moog Inc. Class A(a) 8,101 703,572MRC Global Inc.(a) 21,731 367,689MSA Safety Inc. 8,475 656,982Mueller Industries Inc. 14,034 497,225Mueller Water Products Inc. 39,300 492,429Multi-Color Corp. 3,293 246,481MYR Group Inc.(a) 3,968 141,777National Presto Industries Inc. 1,315 130,777Navigant Consulting Inc.(a) 11,949 231,930Navios Maritime Holdings Inc.(a) 22,728 27,274
Shares Value
Common Stocks (Cont.)Industrials (Cont.)Navistar International Corp.(a) 12,467 $ 534,585NCI Building Systems Inc.(a) 10,421 201,125Nexeo Solutions Inc.(a) 6,806 61,935NL Industries Inc.(a) 1,843 26,263NN Inc. 6,990 192,924Northwest Pipe Co.(a) 2,409 46,108NOW Inc.(a) 25,923 285,931NV5 Global Inc.(a) 1,941 105,105Omega Flex Inc. 800 57,128On Assignment Inc.(a) 12,770 820,728Orion Group Holdings Inc.(a) 6,764 52,962Park-Ohio Holdings Corp. 2,366 108,718Patrick Industries Inc.(a) 6,016 417,811PGT Innovations Inc.(a) 12,594 212,209Plug Power Inc.(a) 58,142 137,215Ply Gem Holdings Inc.(a) 6,097 112,795Powell Industries Inc. 2,355 67,471Preformed Line Products Co. 600 42,630Primoris Services Corp. 10,034 272,824Proto Labs Inc.(a) 6,347 653,741Quad Graphics Inc. 8,283 187,196Quanex Building Products Corp. 9,084 212,566R.R. Donnelley & Sons Co. 17,389 161,718Radiant Logistics Inc.(a) 8,900 40,940Raven Industries Inc. 9,349 321,138RBC Bearings Inc.(a) 5,839 738,050Resources Connection Inc. 7,622 117,760REV Group Inc. 5,980 194,529Revolution Lighting Technologies
Inc.(a) 3,077 10,123Rexnord Corp.(a) 26,076 678,498Roadrunner Transportation Systems
Inc.(a) 8,040 61,988RPX Corp. 12,185 163,766Rush Enterprises Inc. Class A(a) 7,571 384,683Rush Enterprises Inc. Class B(a) 1,298 62,577Safe Bulkers Inc.(a) 12,292 39,703Saia Inc.(a) 6,286 444,735Schneider National Inc. Class B 10,319 294,711Scorpio Bulkers Inc. 15,542 115,011Simpson Manufacturing Co. Inc. 10,225 587,017SiteOne Landscape Supply Inc.(a) 8,613 660,617SkyWest Inc. 12,620 670,122Spartan Motors Inc. 8,811 138,773Sparton Corp.(a) 2,600 59,956SPX Corp.(a) 10,332 324,321SPX FLOW Inc.(a) 10,804 513,730Standard Plus Corp.(a) 4,567 169,436Standex International Corp. 3,115 317,263Steelcase Inc. 21,492 326,678Sterling Construction Company Inc.(a) 6,528 106,276Sun Hydraulics Corp. 5,997 387,946Sunrun Inc.(a) 22,706 133,965Team Inc.(a) 7,533 112,242Tennant Co. 4,366 317,190Tetra Tech Inc. 14,204 683,923Textainer Group Holdings Ltd.(a) 7,126 153,209
STATE FARM MUTUAL FUND TRUST SMALL CAP INDEX FUNDSCHEDULE OF INVESTMENTS (continued)
December 31, 2017
See accompanying notes to financial statements. 103

Shares Value
Common Stocks (Cont.)Industrials (Cont.)Thermon Group Holdings Inc.(a) 8,455 $ 200,130Titan International Inc. 13,015 167,633Titan Machinery Inc.(a) 5,044 106,781TPI Composites Inc.(a) 2,821 57,718Trex Co. Inc.(a) 7,565 819,970TriMas Corp.(a) 11,808 315,864TriNet Group Inc.(a) 10,491 465,171Triton International Ltd. of Bermuda 11,959 447,865Triumph Group Inc. 12,140 330,208TrueBlue Inc.(a) 10,346 284,515Tutor Perini Corp.(a) 9,318 236,211Twin Disc Inc.(a) 2,117 56,249UniFirst Corp. 3,928 647,727Universal Forest Products Inc. 15,243 573,442Universal Logistics Holdings Inc. 2,402 57,048US Ecology Inc. 5,353 273,003Vectrus Inc.(a) 2,806 86,565Veritiv Corp.(a) 3,017 87,191Viad Corp. 5,159 285,809Vicor Corp.(a) 4,522 94,510Vivint Solar Inc.(a) 8,937 36,195VSE Corp. 2,161 104,657Wabash National Corp. 14,912 323,590WageWorks Inc.(a) 9,877 612,374Watts Water Technologies Inc. 6,998 531,498Werner Enterprises Inc. 11,890 459,549Wesco Aircraft Holdings Inc.(a) 14,370 106,338Willdan Group Inc.(a) 1,999 47,856Willis Lease Finance Corp.(a) 1,221 30,488Woodward Inc. 13,580 1,039,413YRC Worldwide Inc.(a) 8,880 127,694
81,382,715
Information Technology (16.42%)2U Inc.(a) 12,022 775,5393D Systems Corp.(a) 28,257 244,1408x8 Inc.(a) 22,882 322,636A10 Networks Inc.(a) 12,771 98,592Acacia Communications Inc.(a) 4,831 175,027ACI Worldwide Inc.(a) 29,018 657,838Actua Corp.(a) 7,962 124,207Acxiom Corp.(a) 19,613 540,534Adtran Inc. 12,309 238,173Advanced Energy Industries Inc.(a) 9,986 673,855Aerohive Networks Inc.(a) 8,122 47,351Agilysys Inc.(a) 3,514 43,152Akoustis Technologies Inc.(a) 2,109 13,139Alarm.com Holdings Inc.(a) 5,269 198,905Alpha & Omega Semiconductor
Ltd.(a) 5,259 86,037Alteryx Inc. Class A(a) 5,971 150,887Ambarella Inc.(a) 8,121 477,109Amber Road Inc.(a) 4,282 31,430American Software Inc. Class A 6,300 73,269Amkor Technology Inc.(a) 26,528 266,606Anixter International Inc.(a) 7,361 559,436AppFolio Inc. Class A(a) 2,377 98,646
Shares Value
Common Stocks (Cont.)Information Technology (Cont.)Applied Optoelectronics Inc.(a) 4,815 $ 182,103Apptio Inc. Class A(a) 5,610 131,947Aquantia Corp.(a) 1,469 16,644Aspen Technology Inc.(a) 18,404 1,218,345Avid Technology Inc.(a) 9,149 49,313AVX Corp. 11,800 204,140Axcelis Technologies Inc.(a) 7,818 224,377AXT Inc.(a) 9,596 83,485Badger Meter Inc. 7,260 347,028Barracuda Networks Inc.(a) 6,573 180,758Bazaarvoice Inc.(a) 20,953 114,194Bel Fuse Inc. 2,483 62,510Belden Inc. 10,477 808,510Benchmark Electronics Inc.(a) 12,488 363,401Benefitfocus Inc.(a) 4,161 112,347Blackbaud Inc. 12,008 1,134,636Blackhawk Network Holdings Inc.(a) 13,587 484,377BlackLine Inc.(a) 4,008 131,462Blucora Inc.(a) 11,371 251,299Bottomline Technologies Inc.(a) 9,666 335,217Box Inc. Class A(a) 20,495 432,854Brightcove Inc.(a) 8,000 56,800BroadSoft Inc.(a) 8,037 441,231Brooks Automation Inc. 17,556 418,711Cabot Microelectronics Corp. 6,238 586,871CACI International Inc. Class A(a) 6,129 811,173CalAmp Corp.(a) 9,090 194,799Calix Inc.(a) 11,220 66,759Callidus Software Inc.(a) 17,372 497,708Carbonite Inc.(a) 6,552 164,455Cardtronics PLC Class A(a) 11,624 215,276Care.com Inc.(a) 3,810 68,732Cars.com Inc.(a) 18,294 527,599Cass Information Systems Inc. 2,833 164,909CEVA Inc.(a) 5,676 261,947ChannelAdvisor Corp.(a) 5,766 51,894Ciena Corp.(a) 35,072 734,057Cimpress NV(a) 6,277 752,487Cirrus Logic Inc.(a) 16,237 842,051Clearfield Inc.(a) 2,800 34,300Cloudera Inc.(a) 24,772 409,233Cohu Inc. 6,608 145,046CommerceHub Inc. Series A(a) 3,662 80,527CommerceHub Inc. Series C(a) 7,478 153,972CommVault Systems Inc.(a) 10,127 531,668Comtech Telecommunications Corp. 5,926 131,083Control4 Corp.(a) 6,355 189,125Convergys Corp. 23,293 547,386Cornerstone OnDemand Inc.(a) 13,323 470,702Coupa Software Inc.(a) 8,233 257,034CPI Card Group Inc. 1,189 4,364Cray Inc.(a) 9,852 238,418Cree Inc.(a) 24,481 909,224CSG Systems International Inc. 8,356 366,160CTS Corp. 8,064 207,648CyberOptics Corp.(a) 1,789 26,835Daktronics Inc. 9,652 88,123
STATE FARM MUTUAL FUND TRUST SMALL CAP INDEX FUNDSCHEDULE OF INVESTMENTS (continued)
December 31, 2017
104 See accompanying notes to financial statements.
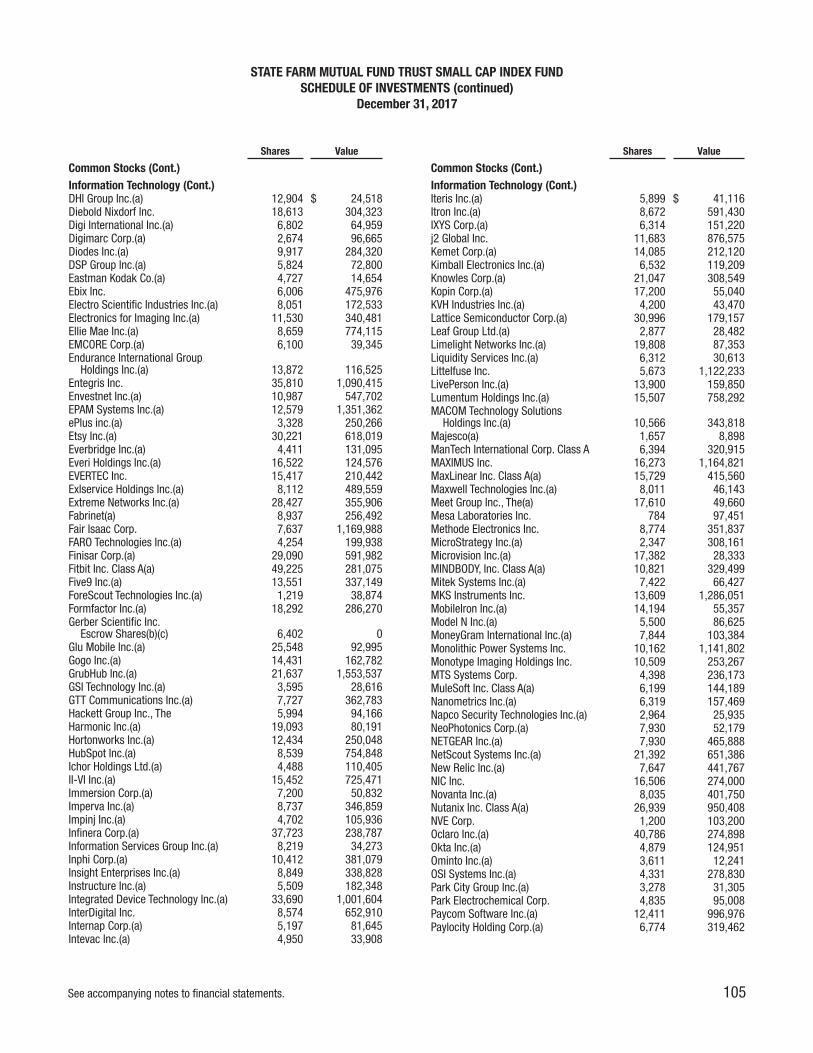
Shares Value
Common Stocks (Cont.)Information Technology (Cont.)DHI Group Inc.(a) 12,904 $ 24,518Diebold Nixdorf Inc. 18,613 304,323Digi International Inc.(a) 6,802 64,959Digimarc Corp.(a) 2,674 96,665Diodes Inc.(a) 9,917 284,320DSP Group Inc.(a) 5,824 72,800Eastman Kodak Co.(a) 4,727 14,654Ebix Inc. 6,006 475,976Electro Scientific Industries Inc.(a) 8,051 172,533Electronics for Imaging Inc.(a) 11,530 340,481Ellie Mae Inc.(a) 8,659 774,115EMCORE Corp.(a) 6,100 39,345Endurance International Group
Holdings Inc.(a) 13,872 116,525Entegris Inc. 35,810 1,090,415Envestnet Inc.(a) 10,987 547,702EPAM Systems Inc.(a) 12,579 1,351,362ePlus inc.(a) 3,328 250,266Etsy Inc.(a) 30,221 618,019Everbridge Inc.(a) 4,411 131,095Everi Holdings Inc.(a) 16,522 124,576EVERTEC Inc. 15,417 210,442Exlservice Holdings Inc.(a) 8,112 489,559Extreme Networks Inc.(a) 28,427 355,906Fabrinet(a) 8,937 256,492Fair Isaac Corp. 7,637 1,169,988FARO Technologies Inc.(a) 4,254 199,938Finisar Corp.(a) 29,090 591,982Fitbit Inc. Class A(a) 49,225 281,075Five9 Inc.(a) 13,551 337,149ForeScout Technologies Inc.(a) 1,219 38,874Formfactor Inc.(a) 18,292 286,270Gerber Scientific Inc.
Escrow Shares(b)(c) 6,402 0Glu Mobile Inc.(a) 25,548 92,995Gogo Inc.(a) 14,431 162,782GrubHub Inc.(a) 21,637 1,553,537GSI Technology Inc.(a) 3,595 28,616GTT Communications Inc.(a) 7,727 362,783Hackett Group Inc., The 5,994 94,166Harmonic Inc.(a) 19,093 80,191Hortonworks Inc.(a) 12,434 250,048HubSpot Inc.(a) 8,539 754,848Ichor Holdings Ltd.(a) 4,488 110,405II-VI Inc.(a) 15,452 725,471Immersion Corp.(a) 7,200 50,832Imperva Inc.(a) 8,737 346,859Impinj Inc.(a) 4,702 105,936Infinera Corp.(a) 37,723 238,787Information Services Group Inc.(a) 8,219 34,273Inphi Corp.(a) 10,412 381,079Insight Enterprises Inc.(a) 8,849 338,828Instructure Inc.(a) 5,509 182,348Integrated Device Technology Inc.(a) 33,690 1,001,604InterDigital Inc. 8,574 652,910Internap Corp.(a) 5,197 81,645Intevac Inc.(a) 4,950 33,908
Shares Value
Common Stocks (Cont.)Information Technology (Cont.)Iteris Inc.(a) 5,899 $ 41,116Itron Inc.(a) 8,672 591,430IXYS Corp.(a) 6,314 151,220j2 Global Inc. 11,683 876,575Kemet Corp.(a) 14,085 212,120Kimball Electronics Inc.(a) 6,532 119,209Knowles Corp.(a) 21,047 308,549Kopin Corp.(a) 17,200 55,040KVH Industries Inc.(a) 4,200 43,470Lattice Semiconductor Corp.(a) 30,996 179,157Leaf Group Ltd.(a) 2,877 28,482Limelight Networks Inc.(a) 19,808 87,353Liquidity Services Inc.(a) 6,312 30,613Littelfuse Inc. 5,673 1,122,233LivePerson Inc.(a) 13,900 159,850Lumentum Holdings Inc.(a) 15,507 758,292MACOM Technology Solutions
Holdings Inc.(a) 10,566 343,818Majesco(a) 1,657 8,898ManTech International Corp. Class A 6,394 320,915MAXIMUS Inc. 16,273 1,164,821MaxLinear Inc. Class A(a) 15,729 415,560Maxwell Technologies Inc.(a) 8,011 46,143Meet Group Inc., The(a) 17,610 49,660Mesa Laboratories Inc. 784 97,451Methode Electronics Inc. 8,774 351,837MicroStrategy Inc.(a) 2,347 308,161Microvision Inc.(a) 17,382 28,333MINDBODY, Inc. Class A(a) 10,821 329,499Mitek Systems Inc.(a) 7,422 66,427MKS Instruments Inc. 13,609 1,286,051MobileIron Inc.(a) 14,194 55,357Model N Inc.(a) 5,500 86,625MoneyGram International Inc.(a) 7,844 103,384Monolithic Power Systems Inc. 10,162 1,141,802Monotype Imaging Holdings Inc. 10,509 253,267MTS Systems Corp. 4,398 236,173MuleSoft Inc. Class A(a) 6,199 144,189Nanometrics Inc.(a) 6,319 157,469Napco Security Technologies Inc.(a) 2,964 25,935NeoPhotonics Corp.(a) 7,930 52,179NETGEAR Inc.(a) 7,930 465,888NetScout Systems Inc.(a) 21,392 651,386New Relic Inc.(a) 7,647 441,767NIC Inc. 16,506 274,000Novanta Inc.(a) 8,035 401,750Nutanix Inc. Class A(a) 26,939 950,408NVE Corp. 1,200 103,200Oclaro Inc.(a) 40,786 274,898Okta Inc.(a) 4,879 124,951Ominto Inc.(a) 3,611 12,241OSI Systems Inc.(a) 4,331 278,830Park City Group Inc.(a) 3,278 31,305Park Electrochemical Corp. 4,835 95,008Paycom Software Inc.(a) 12,411 996,976Paylocity Holding Corp.(a) 6,774 319,462
STATE FARM MUTUAL FUND TRUST SMALL CAP INDEX FUNDSCHEDULE OF INVESTMENTS (continued)
December 31, 2017
See accompanying notes to financial statements. 105
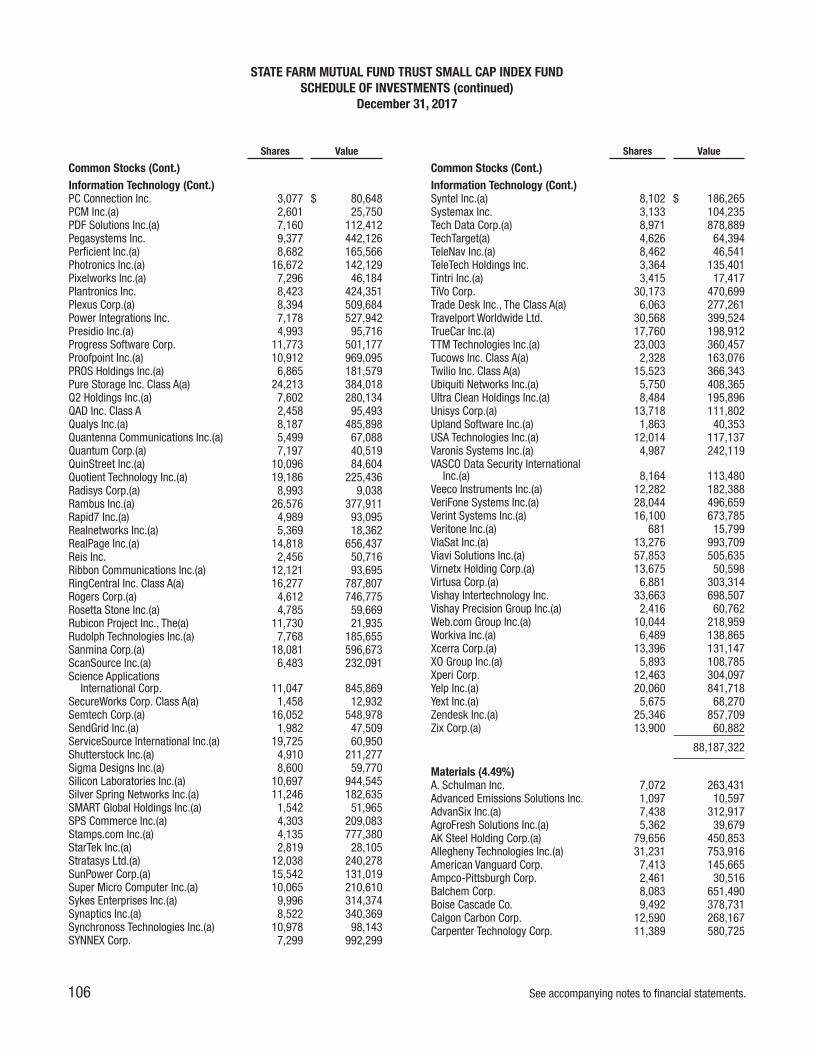
Shares Value
Common Stocks (Cont.)Information Technology (Cont.)PC Connection Inc. 3,077 $ 80,648PCM Inc.(a) 2,601 25,750PDF Solutions Inc.(a) 7,160 112,412Pegasystems Inc. 9,377 442,126Perficient Inc.(a) 8,682 165,566Photronics Inc.(a) 16,672 142,129Pixelworks Inc.(a) 7,296 46,184Plantronics Inc. 8,423 424,351Plexus Corp.(a) 8,394 509,684Power Integrations Inc. 7,178 527,942Presidio Inc.(a) 4,993 95,716Progress Software Corp. 11,773 501,177Proofpoint Inc.(a) 10,912 969,095PROS Holdings Inc.(a) 6,865 181,579Pure Storage Inc. Class A(a) 24,213 384,018Q2 Holdings Inc.(a) 7,602 280,134QAD Inc. Class A 2,458 95,493Qualys Inc.(a) 8,187 485,898Quantenna Communications Inc.(a) 5,499 67,088Quantum Corp.(a) 7,197 40,519QuinStreet Inc.(a) 10,096 84,604Quotient Technology Inc.(a) 19,186 225,436Radisys Corp.(a) 8,993 9,038Rambus Inc.(a) 26,576 377,911Rapid7 Inc.(a) 4,989 93,095Realnetworks Inc.(a) 5,369 18,362RealPage Inc.(a) 14,818 656,437Reis Inc. 2,456 50,716Ribbon Communications Inc.(a) 12,121 93,695RingCentral Inc. Class A(a) 16,277 787,807Rogers Corp.(a) 4,612 746,775Rosetta Stone Inc.(a) 4,785 59,669Rubicon Project Inc., The(a) 11,730 21,935Rudolph Technologies Inc.(a) 7,768 185,655Sanmina Corp.(a) 18,081 596,673ScanSource Inc.(a) 6,483 232,091Science Applications
International Corp. 11,047 845,869SecureWorks Corp. Class A(a) 1,458 12,932Semtech Corp.(a) 16,052 548,978SendGrid Inc.(a) 1,982 47,509ServiceSource International Inc.(a) 19,725 60,950Shutterstock Inc.(a) 4,910 211,277Sigma Designs Inc.(a) 8,600 59,770Silicon Laboratories Inc.(a) 10,697 944,545Silver Spring Networks Inc.(a) 11,246 182,635SMART Global Holdings Inc.(a) 1,542 51,965SPS Commerce Inc.(a) 4,303 209,083Stamps.com Inc.(a) 4,135 777,380StarTek Inc.(a) 2,819 28,105Stratasys Ltd.(a) 12,038 240,278SunPower Corp.(a) 15,542 131,019Super Micro Computer Inc.(a) 10,065 210,610Sykes Enterprises Inc.(a) 9,996 314,374Synaptics Inc.(a) 8,522 340,369Synchronoss Technologies Inc.(a) 10,978 98,143SYNNEX Corp. 7,299 992,299
Shares Value
Common Stocks (Cont.)Information Technology (Cont.)Syntel Inc.(a) 8,102 $ 186,265Systemax Inc. 3,133 104,235Tech Data Corp.(a) 8,971 878,889TechTarget(a) 4,626 64,394TeleNav Inc.(a) 8,462 46,541TeleTech Holdings Inc. 3,364 135,401Tintri Inc.(a) 3,415 17,417TiVo Corp. 30,173 470,699Trade Desk Inc., The Class A(a) 6,063 277,261Travelport Worldwide Ltd. 30,568 399,524TrueCar Inc.(a) 17,760 198,912TTM Technologies Inc.(a) 23,003 360,457Tucows Inc. Class A(a) 2,328 163,076Twilio Inc. Class A(a) 15,523 366,343Ubiquiti Networks Inc.(a) 5,750 408,365Ultra Clean Holdings Inc.(a) 8,484 195,896Unisys Corp.(a) 13,718 111,802Upland Software Inc.(a) 1,863 40,353USA Technologies Inc.(a) 12,014 117,137Varonis Systems Inc.(a) 4,987 242,119VASCO Data Security International
Inc.(a) 8,164 113,480Veeco Instruments Inc.(a) 12,282 182,388VeriFone Systems Inc.(a) 28,044 496,659Verint Systems Inc.(a) 16,100 673,785Veritone Inc.(a) 681 15,799ViaSat Inc.(a) 13,276 993,709Viavi Solutions Inc.(a) 57,853 505,635Virnetx Holding Corp.(a) 13,675 50,598Virtusa Corp.(a) 6,881 303,314Vishay Intertechnology Inc. 33,663 698,507Vishay Precision Group Inc.(a) 2,416 60,762Web.com Group Inc.(a) 10,044 218,959Workiva Inc.(a) 6,489 138,865Xcerra Corp.(a) 13,396 131,147XO Group Inc.(a) 5,893 108,785Xperi Corp. 12,463 304,097Yelp Inc.(a) 20,060 841,718Yext Inc.(a) 5,675 68,270Zendesk Inc.(a) 25,346 857,709Zix Corp.(a) 13,900 60,882
88,187,322
Materials (4.49%)A. Schulman Inc. 7,072 263,431Advanced Emissions Solutions Inc. 1,097 10,597AdvanSix Inc.(a) 7,438 312,917AgroFresh Solutions Inc.(a) 5,362 39,679AK Steel Holding Corp.(a) 79,656 450,853Allegheny Technologies Inc.(a) 31,231 753,916American Vanguard Corp. 7,413 145,665Ampco-Pittsburgh Corp. 2,461 30,516Balchem Corp. 8,083 651,490Boise Cascade Co. 9,492 378,731Calgon Carbon Corp. 12,590 268,167Carpenter Technology Corp. 11,389 580,725
STATE FARM MUTUAL FUND TRUST SMALL CAP INDEX FUNDSCHEDULE OF INVESTMENTS (continued)
December 31, 2017
106 See accompanying notes to financial statements.
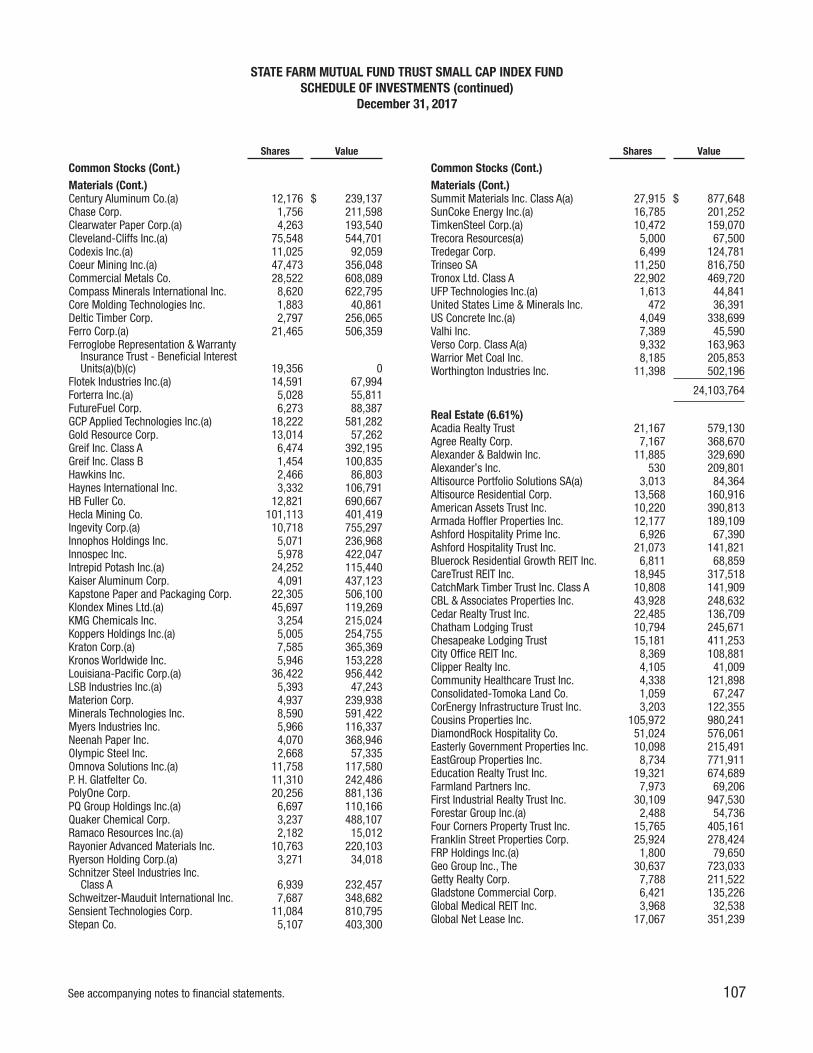
Shares Value
Common Stocks (Cont.)Materials (Cont.)Century Aluminum Co.(a) 12,176 $ 239,137Chase Corp. 1,756 211,598Clearwater Paper Corp.(a) 4,263 193,540Cleveland-Cliffs Inc.(a) 75,548 544,701Codexis Inc.(a) 11,025 92,059Coeur Mining Inc.(a) 47,473 356,048Commercial Metals Co. 28,522 608,089Compass Minerals International Inc. 8,620 622,795Core Molding Technologies Inc. 1,883 40,861Deltic Timber Corp. 2,797 256,065Ferro Corp.(a) 21,465 506,359Ferroglobe Representation & Warranty
Insurance Trust - Beneficial InterestUnits(a)(b)(c) 19,356 0
Flotek Industries Inc.(a) 14,591 67,994Forterra Inc.(a) 5,028 55,811FutureFuel Corp. 6,273 88,387GCP Applied Technologies Inc.(a) 18,222 581,282Gold Resource Corp. 13,014 57,262Greif Inc. Class A 6,474 392,195Greif Inc. Class B 1,454 100,835Hawkins Inc. 2,466 86,803Haynes International Inc. 3,332 106,791HB Fuller Co. 12,821 690,667Hecla Mining Co. 101,113 401,419Ingevity Corp.(a) 10,718 755,297Innophos Holdings Inc. 5,071 236,968Innospec Inc. 5,978 422,047Intrepid Potash Inc.(a) 24,252 115,440Kaiser Aluminum Corp. 4,091 437,123Kapstone Paper and Packaging Corp. 22,305 506,100Klondex Mines Ltd.(a) 45,697 119,269KMG Chemicals Inc. 3,254 215,024Koppers Holdings Inc.(a) 5,005 254,755Kraton Corp.(a) 7,585 365,369Kronos Worldwide Inc. 5,946 153,228Louisiana-Pacific Corp.(a) 36,422 956,442LSB Industries Inc.(a) 5,393 47,243Materion Corp. 4,937 239,938Minerals Technologies Inc. 8,590 591,422Myers Industries Inc. 5,966 116,337Neenah Paper Inc. 4,070 368,946Olympic Steel Inc. 2,668 57,335Omnova Solutions Inc.(a) 11,758 117,580P. H. Glatfelter Co. 11,310 242,486PolyOne Corp. 20,256 881,136PQ Group Holdings Inc.(a) 6,697 110,166Quaker Chemical Corp. 3,237 488,107Ramaco Resources Inc.(a) 2,182 15,012Rayonier Advanced Materials Inc. 10,763 220,103Ryerson Holding Corp.(a) 3,271 34,018Schnitzer Steel Industries Inc.
Class A 6,939 232,457Schweitzer-Mauduit International Inc. 7,687 348,682Sensient Technologies Corp. 11,084 810,795Stepan Co. 5,107 403,300
Shares Value
Common Stocks (Cont.)Materials (Cont.)Summit Materials Inc. Class A(a) 27,915 $ 877,648SunCoke Energy Inc.(a) 16,785 201,252TimkenSteel Corp.(a) 10,472 159,070Trecora Resources(a) 5,000 67,500Tredegar Corp. 6,499 124,781Trinseo SA 11,250 816,750Tronox Ltd. Class A 22,902 469,720UFP Technologies Inc.(a) 1,613 44,841United States Lime & Minerals Inc. 472 36,391US Concrete Inc.(a) 4,049 338,699Valhi Inc. 7,389 45,590Verso Corp. Class A(a) 9,332 163,963Warrior Met Coal Inc. 8,185 205,853Worthington Industries Inc. 11,398 502,196
24,103,764
Real Estate (6.61%)Acadia Realty Trust 21,167 579,130Agree Realty Corp. 7,167 368,670Alexander & Baldwin Inc. 11,885 329,690Alexander’s Inc. 530 209,801Altisource Portfolio Solutions SA(a) 3,013 84,364Altisource Residential Corp. 13,568 160,916American Assets Trust Inc. 10,220 390,813Armada Hoffler Properties Inc. 12,177 189,109Ashford Hospitality Prime Inc. 6,926 67,390Ashford Hospitality Trust Inc. 21,073 141,821Bluerock Residential Growth REIT Inc. 6,811 68,859CareTrust REIT Inc. 18,945 317,518CatchMark Timber Trust Inc. Class A 10,808 141,909CBL & Associates Properties Inc. 43,928 248,632Cedar Realty Trust Inc. 22,485 136,709Chatham Lodging Trust 10,794 245,671Chesapeake Lodging Trust 15,181 411,253City Office REIT Inc. 8,369 108,881Clipper Realty Inc. 4,105 41,009Community Healthcare Trust Inc. 4,338 121,898Consolidated-Tomoka Land Co. 1,059 67,247CorEnergy Infrastructure Trust Inc. 3,203 122,355Cousins Properties Inc. 105,972 980,241DiamondRock Hospitality Co. 51,024 576,061Easterly Government Properties Inc. 10,098 215,491EastGroup Properties Inc. 8,734 771,911Education Realty Trust Inc. 19,321 674,689Farmland Partners Inc. 7,973 69,206First Industrial Realty Trust Inc. 30,109 947,530Forestar Group Inc.(a) 2,488 54,736Four Corners Property Trust Inc. 15,765 405,161Franklin Street Properties Corp. 25,924 278,424FRP Holdings Inc.(a) 1,800 79,650Geo Group Inc., The 30,637 723,033Getty Realty Corp. 7,788 211,522Gladstone Commercial Corp. 6,421 135,226Global Medical REIT Inc. 3,968 32,538Global Net Lease Inc. 17,067 351,239
STATE FARM MUTUAL FUND TRUST SMALL CAP INDEX FUNDSCHEDULE OF INVESTMENTS (continued)
December 31, 2017
See accompanying notes to financial statements. 107

Shares Value
Common Stocks (Cont.)Real Estate (Cont.)Government Properties
Income Trust 9,012 $ 167,082Gramercy Property Trust 40,527 1,080,450Griffin Industrial Realty Inc. 289 10,606Healthcare Realty Trust Inc. 31,345 1,006,801Hersha Hospitality Trust 9,628 167,527HFF Inc. Class A 9,214 448,169Independence Realty Trust Inc. 20,428 206,119InfraREIT Inc.(a) 10,508 195,239Investors Real Estate Trust 30,056 170,718iStar Inc.(a) 15,779 178,303Jernigan Capital Inc. 3,293 62,600Kennedy-Wilson Holdings Inc. 30,355 526,659Kite Realty Group Trust 20,668 405,093LaSalle Hotel Properties 28,593 802,606Lexington Realty Trust 55,706 537,563LTC Properties Inc. 10,039 437,198Mack-Cali Realty Corp. 22,428 483,548Marcus & Millichap Inc.(a) 4,235 138,103Maui Land & Pineapple Company
Inc.(a) 1,677 29,012MedEquities Realty Trust Inc. 7,912 88,773Monmouth Real Estate Investment
Corp. Class A 18,563 330,421National Health Investors Inc. 10,195 768,499National Storage Affiliates Trust 11,236 306,293New Senior Investment Group Inc. 20,291 153,400NexPoint Residential Trust Inc. 4,766 133,162NorthStar Realty Europe Corp. 14,587 195,903One Liberty Properties Inc. 3,687 95,567Pebblebrook Hotel Trust 17,662 656,497Pennsylvania Real Estate
Investment Trust 17,907 212,914Physicians Realty Trust 45,424 817,178Potlatch Corp. 10,331 515,517Preferred Apartment Communities Inc.
Class A 9,088 184,032PS Business Parks Inc. 5,098 637,709QTS Realty Trust Inc. Class A 12,578 681,224Quality Care Properties Inc.(a) 23,369 322,726RAIT Financial Trust 24,094 9,035Ramco-Gershenson Properties Trust 19,843 292,287RE/MAX Holdings Inc. Class A 4,700 227,950Redfin Corp.(a) 2,672 83,687Retail Opportunity Investments Corp. 27,573 550,081Rexford Industrial Realty Inc. 19,812 577,718RLJ Lodging Trust 43,502 955,739RMR Group Inc., The Class A 1,869 110,832Ryman Hospitality Properties Inc. 11,358 783,929Sabra Health Care REIT Inc. 45,213 848,648Safety, Income and Growth Inc. 2,358 41,501Saul Centers Inc. 3,039 187,658Select Income REIT 16,098 404,543Seritage Growth Properties Class A 6,690 270,677St. Joe Co., The(a) 10,976 198,117STAG Industrial Inc. 23,539 643,321Stratus Properties Inc. 1,721 51,114Summit Hotel Properties Inc. 25,828 393,360
Shares Value
Common Stocks (Cont.)Real Estate (Cont.)Sunstone Hotel Investors Inc. 57,325 $ 947,582Tejon Ranch Co.(a) 4,363 90,576Terreno Realty Corp. 13,543 474,818Tier REIT Inc. 12,005 244,782Transcontinental Realty Investors
Inc.(a) 421 13,186Trinity Place Holdings Inc.(a) 5,830 40,519UMH Properties Inc. 7,732 115,207Universal Health Realty Income Trust 3,158 237,197Urban Edge Properties 25,721 655,628Urstadt Biddle Properties Inc. Class A 7,212 156,789Washington Prime Group Inc. 47,559 338,620Washington Real Estate
Investment Trust 19,759 614,900Whitestone REIT 10,011 144,259Xenia Hotels & Resorts Inc. 27,326 589,968
35,507,742
Telecommunication Services (0.75%)ATN International Inc. 2,674 147,762Boingo Wireless Inc.(a) 9,619 216,428Cincinnati Bell Inc.(a) 10,275 214,234Cogent Communications Holdings Inc. 10,352 468,946Consolidated Communications
Holdings Inc. 16,066 195,845Frontier Communications Corp. 20,577 139,101General Communication Inc.
Class A(a) 6,587 257,025Globalstar Inc.(a) 143,113 187,478Hawaiian Telcom Holdco Inc.(a) 1,724 53,203IDT Corp. Class B 4,305 45,633Intelsat SA(a) 10,207 34,602Iridium Communications Inc.(a) 20,513 242,053Ooma Inc.(a) 4,383 52,377Orbcomm Inc.(a) 16,700 170,006pdvWireless Inc.(a) 2,601 83,492Shenandoah Telecommunications Co. 11,686 394,987Spok Holdings Inc. 5,566 87,108Straight Path Communications Inc.
Class B(a) 2,432 442,113Vonage Holdings Corp.(a) 51,112 519,809Windstream Holdings Inc. 48,430 89,596
4,041,798
Utilities (3.50%)ALLETE Inc. 12,905 959,617American States Water Co. 9,174 531,266AquaVenture Holdings Ltd.(a) 2,972 46,125Artesian Resources Corp.
Class A 1,986 76,580Atlantic Power Corp.(a) 33,973 79,837Avista Corp. 16,411 845,002Black Hills Corp. 13,700 823,507Cadiz Inc.(a) 5,366 76,466California Water Service Group 12,104 548,916Chesapeake Utilities Corp. 4,132 324,569Connecticut Water Service Inc. 2,859 164,135
STATE FARM MUTUAL FUND TRUST SMALL CAP INDEX FUNDSCHEDULE OF INVESTMENTS (continued)
December 31, 2017
108 See accompanying notes to financial statements.

Shares Value
Common Stocks (Cont.)Utilities (Cont.)Consolidated Water Co. Ltd.
Ordinary Shares 3,600 $ 45,360Dynegy Inc.(a) 27,590 326,942El Paso Electric Co. 10,229 566,175Evoqua Water Technologies Corp.(a) 7,611 180,457Genie Energy Ltd. Class B 3,000 13,080Global Water Resources Inc. 2,059 19,231Idacorp Inc. 12,630 1,153,877MGE Energy Inc. 9,042 570,550Middlesex Water Co. 4,153 165,746New Jersey Resources Corp. 21,662 870,812Northwest Natural Gas Co. 7,094 423,157NorthWestern Corp. 12,423 741,653NRG Yield Inc. Class A 9,542 179,867NRG Yield Inc. Class C 15,495 292,856ONE Gas Inc. 13,151 963,442Ormat Technologies Inc. 10,274 657,125Otter Tail Corp. 9,863 438,410Pattern Energy Group Inc. 19,755 424,535PNM Resources Inc. 20,554 831,409Portland General Electric Co. 22,957 1,046,380Pure Cycle Corp.(a) 4,046 33,784RGC Resources Inc. 1,598 43,274SJW Group 4,022 256,724South Jersey Industries Inc. 20,341 635,249Southwest Gas Holdings Inc. 12,122 975,579Spark Energy Inc. Class A 3,020 37,448Spire Inc. 12,060 906,309TerraForm Power Inc. Class A 11,461 137,074Unitil Corp. 3,637 165,920WGL Holdings Inc. 13,105 1,124,933
Shares Value
Common Stocks (Cont.)Utilities (Cont.)York Water Co., The 3,300 $ 111,870
18,815,248Total Common Stocks(cost $353,803,598) 529,596,963
Short-term Investments (1.21%)JPMorgan U.S. Government Money
Market Fund Capital Shares,1.17%(d) 6,489,394 6,489,394
Total Short-term Investments(cost $6,489,394) 6,489,394
TOTAL INVESTMENTS (99.80%)(cost $360,292,992) 536,086,357
CASH (e) AND OTHER ASSETS, NET OFLIABILITIES (0.20%) 1,100,067
NET ASSETS (100.00%) $537,186,424
(a) Non-income producing security.(b) In accordance with the Trust’s valuation procedures, State Farm Investment
Management Corp. (“SFIMC”) determined the fair value for the securityconsidering the facts and circumstances related to the particular security.
(c) Security was valued using significant unobservable inputs.(d) Rate shown is the 7-day yield as of December 31, 2017.(e) At December 31, 2017, cash in the amount of $309,000 has been pledged
to cover, in whole or in part, margin requirements for open futures contracts.
OPEN FUTURES CONTRACTS
DescriptionContractsPurchased Expiration
NotionalValue
MarketValue
UnrealizedGain (Loss)
Russell 2000 Mini Index 99 March 2018 $7,587,153 $7,605,675 $18,522
STATE FARM MUTUAL FUND TRUST SMALL CAP INDEX FUNDSCHEDULE OF INVESTMENTS (continued)
December 31, 2017
See accompanying notes to financial statements. 109

Shares Value
Common Stocks (a) (99.10%)Australia (6.89%)AGL Energy Ltd. 12,685 $ 241,101Alumina Ltd. 55,470 105,172Amcor Ltd. 23,377 281,259AMP Ltd. 59,701 241,759APA Group 20,886 135,748Aristocrat Leisure Ltd. 10,755 198,881ASX Ltd. 4,061 173,829Aurizon Holdings Ltd. 42,875 165,928AusNet Services 36,364 51,213Australia & New Zealand Banking
Group Ltd. 57,988 1,300,346Bank of Queensland Ltd. 8,455 83,914Bendigo and Adelaide Bank Ltd. 9,322 84,882BGP Holdings PLC(b)(c)(d) 183,756 0BHP Billiton Ltd. 63,077 1,455,313BlueScope Steel Ltd. 11,558 138,609Boral Ltd. 21,808 132,552Brambles Ltd. 32,065 251,939Caltex Australia Ltd. 5,407 143,651Challenger Ltd. 11,648 127,510CIMIC Group Ltd. 2,074 83,258Coca-Cola Amatil Ltd. 11,437 75,941Cochlear Ltd. 1,237 165,266Commonwealth Bank of Australia 34,323 2,151,548Computershare Ltd. 9,303 118,316Crown Resorts Ltd. 7,339 74,556CSL Ltd. 8,975 989,488Dexus 20,341 154,743Domino’s Pizza Enterprises Ltd. 1,181 43,033Flight Centre Travel Group Ltd. 1,064 36,727Fortescue Metals Group Ltd. 32,279 122,906Goodman Group 37,022 243,224GPT Group 37,760 150,552Harvey Norman Holdings Ltd. 11,319 36,828Healthscope Ltd. 37,570 61,559Incitec Pivot Ltd. 34,102 103,772Insurance Australia Group Ltd. 45,987 259,781James Hardie Industries PLC 8,039 141,882LendLease Group 11,207 142,969Macquarie Group Ltd. 6,341 492,926Medibank Private Ltd. 47,732 122,529Mirvac Group 77,776 142,609National Australia Bank Ltd. 53,116 1,225,492Newcrest Mining Ltd. 14,648 260,812Oil Search Ltd. 27,744 168,632Orica Ltd. 7,280 102,812Origin Energy Ltd.(c) 35,778 262,967QBE Insurance Group Ltd. 28,216 235,126Ramsay Health Care Ltd. 2,844 155,599REA Group Ltd. 1,046 62,557Rio Tinto Ltd. 8,384 495,920Santos Ltd.(c) 37,844 160,926Scentre Group 107,918 352,811Seek Ltd. 6,996 103,769Sonic Healthcare Ltd. 7,802 139,161South32 Ltd. 100,393 273,378
Shares Value
Common Stocks (Cont.)Australia (Cont.)Stockland 48,738 $ 170,365Suncorp Group Ltd. 26,042 281,625Sydney Airport 22,252 122,403Tabcorp Holding Ltd. 37,731 164,273Telstra Corp. Ltd. 83,524 236,566TPG Telecom Ltd. 7,255 37,191Transurban Group 45,251 438,867Treasury Wine Estates Ltd. 14,499 180,553Vicinity Centres 71,161 151,024Wesfarmers Ltd. 22,984 796,596Westfield Corp. 39,848 295,058Westpac Banking Corp. 67,812 1,658,739Woodside Petroleum Ltd. 16,915 436,588Woolworths Group Ltd. 25,414 541,339
20,739,168
Austria (0.25%)Andritz AG 1,161 65,591Erste Group Bank AG 6,092 263,909OMV AG 2,973 188,453Raiffeisen Bank International AG(c) 2,187 79,247VoestAlpine AG 2,369 141,682
738,882
Belgium (1.10%)Ageas 3,934 192,183Anheuser-Busch InBev SA/NV 14,892 1,664,061Colruyt SA 1,375 71,535Groupe Bruxelles Lambert SA 1,687 182,153KBC Group NV 5,061 431,811Proximus SA 3,216 105,536Solvay SA 1,497 208,177Telenet Group Holding NV(c) 1,033 71,999UCB SA 2,552 202,644Umicore SA 3,844 181,975
3,312,074
Denmark (1.82%)A.P. Moller-Maersk A/S Class A 76 126,897A.P. Moller-Maersk A/S Class B 132 230,612Carlsberg A/S Class B 2,029 243,623Chr. Hansen Holding A/S 2,028 190,226Coloplast A/S Class B 2,249 178,878Danske Bank A/S 14,892 579,868DSV A/S 3,835 301,994Genmab A/S(c) 1,167 193,538H. Lundbeck A/S 1,396 70,872ISS A/S 3,443 133,343Novo Nordisk A/S Class B 37,248 2,008,067Novozymes A/S B Shares 4,655 265,959Orsted A/S(e) 3,580 195,424Pandora A/S 2,159 235,048TDC A/S 16,066 98,731Tryg A/S 2,594 64,884Vestas Wind Systems A/S 4,220 291,640
STATE FARM MUTUAL FUND TRUST INTERNATIONAL INDEX FUNDSCHEDULE OF INVESTMENTS
December 31, 2017
110 See accompanying notes to financial statements.

Shares Value
Common Stocks (Cont.)Denmark (Cont.)William Demant Holding A/S(c) 2,417 $ 67,586
5,477,190
Finland (0.93%)Elisa OYJ 3,002 117,856Fortum OYJ 9,264 183,404Kone Corp. OYJ Class B 6,558 352,356Metso OYJ 2,272 77,611Neste OYJ 2,616 167,455Nokia OYJ 117,275 547,934Nokian Renkaat OYJ 2,334 105,857Orion OYJ Class B 2,131 79,468Sampo OYJ A Shares 8,682 477,103Stora Enso OYJ R Shares 11,110 176,227UPM-Kymmene OYJ 10,773 334,912Wartsila OYJ Class B 3,004 189,589
2,809,772
France (10.64%)Accor SA 3,777 194,869Aeroports de Paris (ADP) 626 119,050Air Liquide SA 8,605 1,084,610Airbus SE 11,701 1,165,273Alstom SA 3,114 129,296Amundi SA(e) 1,087 92,144ArcelorMittal(c) 13,407 436,182Arkema 1,387 168,999AtoS 1,846 268,781AXA SA 39,216 1,163,863BioMerieux 686 61,477BNP Paribas SA 22,653 1,691,967Bollore 17,804 96,728Bouygues SA 4,298 223,348Bureau Veritas SA 5,248 143,504Capgemini SE 3,246 385,148Carrefour SA 11,866 256,843Casino Guichard Perrachon SA 1,133 68,733Cie Generale des Etablissements
Michelin Class B 3,453 495,305CNP Assurances 3,501 80,884Compagnie de Saint-Gobain 10,087 556,490Credit Agricole SA 22,643 374,921Danone 11,915 1,000,020Dassault Aviation SA 47 73,192Dassault Systemes SA 2,596 275,941Edenred 4,505 130,701Eiffage SA 1,386 151,898Electricite de France 11,697 146,241Engie 35,267 606,587Essilor International SA 4,188 577,620Eurazeo SA 889 82,133Eurofins Scientific SE 227 138,253Eutelsat Communications 3,828 88,622Faurecia 1,305 101,981Fonciere des Regions 704 79,807Gecina SA 993 183,364Getlink SE 9,570 123,093
Shares Value
Common Stocks (Cont.)France (Cont.)Hermes International 643 $ 344,283ICADE 673 66,158Iliad SA 548 131,339Imerys SA 755 71,148Ingenico Group 1,143 122,071Ipsen SA 759 90,677JC Decaux SA 1,523 61,409Kering 1,492 703,539Klepierre SA 4,651 204,609Lagardere SCA 2,491 79,891Legrand SA 5,537 426,450L’Oreal SA 5,082 1,127,757LVMH Moet Hennessy Louis
Vuitton SE 5,451 1,605,009Natixis SA 19,396 153,504Orange 40,305 700,010Pernod Ricard SA 4,286 678,560Peugeot SA 11,046 224,714Publicis Groupe 4,170 283,441Remy Cointreau SA 473 65,550Renault SA 3,581 360,533Rexel SA 6,135 111,299Safran SA 6,385 658,160Sanofi 22,732 1,959,707Schneider Electric SE (Paris) 11,331 963,377SCOR SE 3,435 138,255SEB SA 468 86,728SES 7,015 109,504Societe BIC SA 562 61,808Societe Generale 15,431 797,065Sodexo 1,862 250,333STMicroelectronics NV 12,500 273,041Suez 6,960 122,467Teleperformance 978 140,169Thales SA 2,229 240,381Total SA 47,318 2,614,180UbiSoft Entertainment SA(c) 1,158 89,118Unibail-Rodamco SE (Amsterdam) 1,971 496,630Valeo SA 4,827 360,647Veolia Environnement 9,524 243,117Vinci SA 10,185 1,040,573Vivendi 20,783 559,076Wendel 570 98,757Zodiac Aerospace 4,128 123,478
32,056,390
Germany (9.20%)adidas AG 3,784 758,899Allianz SE Reg. 8,974 2,061,966Axel Springer SE 977 76,349BASF SE 18,183 2,001,479Bayer AG Reg. 16,503 2,059,316Bayerische Motoren Werke (BMW) AG 6,683 696,254Beiersdorf AG 2,035 239,042Brenntag AG 3,186 201,725Commerzbank AG(c) 20,892 313,466Continental AG 2,201 594,327
STATE FARM MUTUAL FUND TRUST INTERNATIONAL INDEX FUNDSCHEDULE OF INVESTMENTS (continued)
December 31, 2017
See accompanying notes to financial statements. 111

Shares Value
Common Stocks (Cont.)Germany (Cont.)Covestro AG(e) 2,395 $ 247,219Daimler AG Registered Shares 19,170 1,628,479Deutsche Bank AG Reg. 40,987 780,704Deutsche Boerse AG 3,896 452,503Deutsche Lufthansa AG Reg. 4,678 172,428Deutsche Post AG 19,615 935,518Deutsche Telekom AG 66,010 1,171,794Deutsche Wohnen SE 7,088 310,075Drillisch AG 979 80,851E.ON SE 44,667 485,612Evonik Industries AG 3,382 127,296Fraport AG 842 92,804Fresenius Medical Care AG &
Co. KGaA 4,152 437,300Fresenius SE & Co. KGaA 8,389 654,964GEA Group AG 3,722 178,678Hannover Rueck SE 1,190 149,778HeidelbergCement AG 2,989 323,668Henkel AG & Co. KGaA 2,124 254,848Hochtief AG 417 73,850Hugo Boss AG 1,323 112,610Infineon Technologies AG 22,890 627,153Innogy SE(e) 2,906 113,930K+S AG Reg. 4,041 100,633KION Group AG 1,439 124,279Lanxess AG 1,847 146,907Linde AG Tender Shares(c) 3,709 866,239MAN AG 711 81,385Merck KGaA 2,625 282,677Metro AG(c) 3,642 72,758MTU Aero Engines AG 973 174,418Muenchener Rueckversicherungs-
Gesellschaft AG Reg. 3,051 661,679Osram Licht AG 1,918 172,437ProSiebenSat.1 Media SE 4,598 158,363QIAGEN NV 4,321 135,783RTL Group SA 781 62,850RWE AG(c) 10,068 205,361SAP SE 19,516 2,188,249Siemens AG Reg. 15,214 2,120,261Symrise AG 2,173 186,733Telefonica Deutschland Holding AG 13,509 67,850ThyssenKrupp AG 8,154 236,909Uniper SE 3,922 122,351United Internet AG Reg. 2,483 170,829Volkswagen AG 655 132,582Vonovia SE 9,187 456,243Wirecard AG 2,312 258,181Zalando SE(c)(e) 2,246 118,884
27,719,726
Hong Kong (3.57%)AIA Group Ltd. 240,842 2,054,577ASM Pacific Technology Ltd. 4,692 65,400Bank of East Asia Ltd., The 25,198 109,173BOC Hong Kong
Holdings Ltd. 74,500 377,609
Shares Value
Common Stocks (Cont.)Hong Kong (Cont.)CK Asset Holdings Ltd. 53,581 $ 468,406CK Hutchison Holdings Ltd. 54,081 679,054CK Infrastructure Holdings Ltd. 13,611 116,984CLP Holdings Ltd. 33,005 337,745First Pacific Company Ltd. 44,353 30,088Galaxy Entertainment Group Ltd. 47,880 384,249Hang Lung Group Ltd. 18,000 66,237Hang Lung Properties Ltd. 33,000 80,675Hang Seng Bank Ltd. 15,643 388,430Henderson Land Development
Co. Ltd. 24,231 159,724HK Electric Investments(e) 3,500 3,203HKT Trust and HKT Ltd. 73,100 93,190Hong Kong & China Gas Co. Ltd. 174,163 341,511Hong Kong Exchanges & Clearing Ltd. 23,479 720,642Hongkong Land Holdings Ltd. 24,200 170,368Hysan Development Co. Ltd. 11,916 63,219Jardine Matheson Holdings Ltd. 4,300 261,225Jardine Strategic Holdings Ltd. 4,300 170,194Kerry Properties Ltd. 12,328 55,464Kingston Financial Group Ltd. 78,000 74,877Li & Fung Ltd. 115,240 63,278Link REIT 44,762 415,086Melco Resorts & Entertainment
Ltd. ADR 5,004 145,316MGM China Holdings Ltd. 17,454 52,834Minth Group Ltd. 12,000 72,419MTR Corporation Ltd. 30,526 178,948New World Development
Company Ltd. 111,318 167,272NWS Holdings Ltd. 33,601 60,640PCCW Ltd. 83,704 48,640Power Assets Holdings Ltd. 28,982 244,643Sands China Ltd. 50,772 262,215Shangri-La Asia Ltd. 26,974 61,248Sino Land Co. Ltd. 64,946 115,048SJM Holdings Ltd. 38,022 34,066Sun Hung Kai Properties Ltd. 29,099 485,675Swire Pacific Ltd. Class A 10,821 100,207Swire Properties Ltd. 23,996 77,398Techtronic Industries Company Ltd. 27,999 182,590WH Group Ltd.(e) 167,000 188,528Wharf Holdings Ltd., The 24,700 85,359Wharf Real Estate Investment Co.(c) 24,700 164,396Wheelock and Co. Ltd. 16,104 115,016Wynn Macau Ltd. 29,936 94,833Yue Yuen Industrial Holdings Ltd. 14,000 55,012
10,742,911
Ireland (0.47%)AIB Group PLC 15,836 104,504Bank of Ireland Group PLC(c) 20,024 170,463CRH PLC (Dublin) 16,808 604,104Kerry Group PLC Class A (Dublin) 3,197 358,658Paddy Power Betfair PLC 1,612 191,868
1,429,597
STATE FARM MUTUAL FUND TRUST INTERNATIONAL INDEX FUNDSCHEDULE OF INVESTMENTS (continued)
December 31, 2017
112 See accompanying notes to financial statements.

Shares Value
Common Stocks (Cont.)Israel (0.47%)Azrieli Group Ltd. 804 $ 44,931Bank Hapoalim B.M. 21,941 161,129Bank Leumi Le-Israel 30,193 181,738Bezeq The Israeli Telecommunication
Corporation Ltd. 43,769 66,141Check Point Software Technologies
Ltd.(c) 2,603 269,723Elbit Systems Ltd. 487 65,054Frutarom Industries Ltd. 794 74,404Israel Chemicals Ltd. 11,028 44,655Mizrahi Tefahot Bank Ltd. 1,665 30,670NICE Ltd. 1,321 120,708Teva Pharmaceutical Industries Ltd.
Sponsored ADR 18,144 343,829
1,402,982
Italy (2.34%)Assicurazioni Generali SpA 25,188 459,371Atlantia SpA 8,677 274,020CNH Industrial NV 20,614 276,275Davide Campari-Milano SpA 9,824 75,969Enel SpA 164,313 1,011,384Eni SpA 51,821 858,048EXOR NV 2,189 134,213Ferrari NV (Italy) 2,479 260,114Fiat Chrysler Automobiles NV (Italy)(c) 21,589 386,222Intesa Sanpaolo 264,874 880,331Intesa Sanpaolo RSP 19,708 62,900Leonardo SpA 8,213 97,755Luxottica Group SpA 3,421 209,955Mediobanca SpA 11,592 131,576Poste Italiane SpA(e) 10,545 79,394Prysmian SpA 4,044 131,931Recordati SpA 2,111 93,869Snam SpA 45,707 223,753Telecom Italia SpA(c) 229,590 198,479Telecom Italia SpA RSP 121,668 87,006Tenaris SA 9,773 154,316Terna - Rete Elettrica Nationale SpA 28,400 165,063UniCredit SpA(c) 40,402 755,261UnipolSai SpA 16,577 38,726
7,045,931
Japan (23.97%)ABC-Mart Inc. 700 40,193ACOM Co. Ltd.(c) 9,100 38,363Aeon Co. Ltd. 12,100 204,307Aeon Credit Service Co. Ltd. 2,300 53,563Aeon Mall Co. Ltd. 2,100 41,077Air Water Inc. 2,769 58,440Aisin Seiki Co. Ltd. 3,600 202,245Ajinomoto Co. Inc. 11,300 212,712Alfresa Holdings Corp. 3,600 84,572All Nippon Airways Co. Ltd. 2,500 104,415Alps Electric Co. Ltd. 4,200 120,027Amada Holdings Co. Ltd. 7,000 95,301Aozora Bank Ltd. 2,500 97,293
Shares Value
Common Stocks (Cont.)Japan (Cont.)Asahi Glass Co. Ltd. 4,200 $ 181,904Asahi Group Holdings Ltd. 7,900 391,933Asahi Kasei Corp. 26,000 335,398ASICS Corp. 3,400 54,195Astellas Pharma Inc. 41,800 533,096Bandai Namco Holdings Inc. 4,200 137,360Bank of Kyoto Ltd., The 1,400 72,935Benesse Holdings Inc. 1,300 45,862Bridgestone Corp. 13,000 604,340Brother Industries Ltd. 5,100 125,831CALBEE Inc. 1,600 52,043Canon Inc. 21,600 805,148Casio Computer Co. Ltd. 3,900 56,107Central Japan Railway Co. 2,900 519,388Chiba Bank Ltd., The 14,000 116,548Chubu Electric Power Co. Inc. 13,500 167,799Chugai Pharmaceutical Co. Ltd. 4,700 240,683Chugoku Electric Power Company
Inc., The 6,100 65,561Coca-Cola Bottlers Japan Inc. 2,500 91,302Concordia Financial Group Ltd. 23,000 138,806Credit Saison Co. Ltd. 2,800 50,943Cyberdyne Inc.(c) 2,000 34,453Dai Nippon Printing Co. Ltd. 5,500 122,667Daicel Chemical Industries Ltd. 5,700 64,854Daifuku Co. Ltd. 1,800 98,087Dai-ichi Life Holdings Inc. 21,200 437,265Daiichi Sankyo Co. Ltd. 11,640 303,410Daikin Industries Ltd. 5,000 591,746Daito Trust Construction Co. Ltd. 1,400 285,467Daiwa House Industry Co. Ltd. 11,400 437,788Daiwa House REIT Investment Co. 29 68,900Daiwa Securities Group Inc. 28,000 175,666DeNA Co. Ltd. 2,200 45,357Denso Corp. 9,600 576,213Dentsu Inc. 4,416 187,144Disco Corp. 600 133,499Don Quijote Holdings Co. Ltd. 2,400 125,458East Japan Railway Co. 6,013 586,758Eisai Co. Ltd. 5,200 296,101Electric Power Development Co. Ltd. 3,200 86,195FamilyMart UNY Holdings Co. Ltd. 1,700 119,192Fanuc Corp. 3,900 936,623Fast Retailing Co. Ltd. 1,000 398,580Fuji Electric Co. Ltd. 10,000 75,349FUJIFILM Holdings Corp. 7,600 310,610Fujitsu Ltd. 38,000 270,713Fukuoka Financial Group Inc. 15,000 84,269Hachijuni Bank Ltd., The 7,549 43,348Hakuhodo DY Holdings Inc. 4,700 61,026Hamamatsu Photonics KK 2,600 87,455Hankyu Hanshin Holdings Inc. 4,800 192,980Hikari Tsushin Inc. 400 57,511Hino Motors Ltd. 5,000 64,788Hirose Electric Co. Ltd. 600 87,704Hisamitsu Pharmaceutical Co. Inc. 1,100 66,679Hitachi Chemical Co. Ltd. 2,100 53,937
STATE FARM MUTUAL FUND TRUST INTERNATIONAL INDEX FUNDSCHEDULE OF INVESTMENTS (continued)
December 31, 2017
See accompanying notes to financial statements. 113

Shares Value
Common Stocks (Cont.)Japan (Cont.)Hitachi Construction Machinery
Co. Ltd. 2,100 $ 76,321Hitachi High-Technologies Corp. 1,200 50,588Hitachi Ltd. 94,000 732,395Hitachi Metals Ltd. 4,300 61,748Honda Motor Co. Ltd. 33,600 1,151,659Hoshizaki Corp. 1,000 88,662Hoya Corp. 7,600 379,612Hulic Company Ltd. 6,500 73,033Idemitsu Kosan Co. Ltd. 2,500 100,399IHI Corp. 2,800 93,188Iida Group Holdings Co. Ltd. 3,300 62,237INPEX Corp. 19,600 245,098Isetan Mitsukoshi Holdings Ltd. 6,940 86,046Isuzu Motors Ltd. 11,100 185,895Itochu Corp. 30,200 563,662J. Front Retailing Co. Ltd. 4,800 90,441Japan Airlines Co. Ltd. 2,600 101,716Japan Airport Terminal Co. Ltd. 800 29,678Japan Exchange Group Inc. 10,500 182,742Japan Post Bank Co. Ltd. 8,200 106,762Japan Post Holdings Co. Ltd. 31,700 363,491Japan Prime Realty Investment Corp. 17 54,014Japan Real Estate Investment Corp. 26 123,452Japan Retail Fund Investment Corp. 54 99,014Japan Tobacco Inc. 22,200 715,404JFE Holdings Inc. 10,500 252,168JGC Corp. 4,000 77,355JSR Corp. 3,700 72,834JTEKT Corp. 4,900 84,193JXTG Holdings Inc. 62,200 401,326Kajima Corp. 18,000 173,171Kakaku.com Inc. 2,900 49,030Kamigumi Co. Ltd. 2,500 55,314Kaneka Corp. 6,000 54,795Kansai Electric Power Company
Inc., The 14,200 173,916Kansai Paint Co. Ltd. 4,300 111,741Kao Corp. 10,000 676,193Kawasaki Heavy Industries Ltd. 2,900 101,793KDDI Corp. 36,500 908,491Keihan Holdings Co. Ltd. 2,000 58,931Keikyu Corp. 4,500 86,466Keio Corp. 2,400 105,542Keisei Electric Railway Co. Ltd. 3,000 96,383Keyence Corp. 1,940 1,086,779Kikkoman Corp. 3,000 121,411Kintetsu Group Holdings Co. Ltd. 3,800 145,693Kirin Holdings Co. Ltd. 17,500 441,169Kobe Steel Ltd.(c) 6,100 56,574Koito Manufacturing Company Ltd. 2,224 156,326Komatsu Ltd. 18,700 676,801Konami Holdings Corp. 2,000 110,051Konica Minolta Holdings Inc. 9,000 86,585KOSE Corp. 600 93,668Kubota Corp. 20,000 392,190Kuraray Co. Ltd. 7,500 141,513
Shares Value
Common Stocks (Cont.)Japan (Cont.)Kurita Water Industries Ltd. 2,000 $ 64,966Kyocera Corp. 6,500 425,334Kyowa Hakko Kirin Co. Ltd. 5,100 98,628Kyushu Electric Power Co. Inc. 8,600 90,141Kyushu Financial Group Inc. 7,000 42,370Kyushu Railway Co. 3,200 99,259Lawson Inc. 900 59,827LINE Corp.(c) 900 36,703Lion Corp. 4,500 85,267LIXIL Group Corp. 5,400 146,173M3 Inc. 4,000 140,759Mabuchi Motor Co. Ltd. 1,000 54,227Makita Corp. 4,500 189,106Marubeni Corp. 31,100 225,256Marui Group Co. Ltd. 4,500 82,392Maruichi Steel Tube Ltd. 1,000 29,288Mazda Motor Corp. 11,800 158,293McDonald’s Holdings Company
(Japan) Ltd. 1,300 57,169Mebuki Financial Group Inc. 19,540 82,721Medipal Holdings Corp. 3,400 66,597MEIJI Holdings Company Ltd. 2,400 204,269Minebea Mitsumi Inc. 7,600 159,386MISUMI Group Inc. 5,700 165,929Mitsubishi Chemical Holdings Corp. 28,900 317,150Mitsubishi Corp. 30,400 839,895Mitsubishi Electric Corp. 39,000 647,779Mitsubishi Estate Company Ltd. 25,300 440,098Mitsubishi Gas Chemical Co. Inc. 3,500 100,488Mitsubishi Heavy Industries Ltd. 6,500 242,867Mitsubishi Materials Corp. 2,400 85,414Mitsubishi Motors Corp. 13,500 97,528Mitsubishi Tanabe Pharma Corp. 4,500 93,135Mitsubishi UFJ Financial Group Inc. 236,300 1,733,111Mitsubishi UFJ Lease & Finance
Co. Ltd. 9,500 56,574Mitsui & Co. Ltd. 30,700 499,156Mitsui Chemicals Inc. 3,600 115,820Mitsui Fudosan Co. Ltd. 18,000 403,373Mitsui OSK Lines Ltd. 2,400 80,089mixi Inc. 1,000 44,908Mizuho Financial Group Inc. 465,429 845,146MS&AD Insurance Group Holdings Inc. 9,600 324,956Murata Manufacturing Co. Ltd. 3,700 496,508Nabtesco Corp. 2,345 89,908Nagoya Railroad Co. Ltd. 3,600 90,643NEC Corp. 5,200 140,297Nexon Co. Ltd.(c) 3,700 107,708NGK Insulators Ltd. 5,700 107,651NGK Spark Plug Co. Ltd. 2,700 65,634NH Foods Ltd. 3,000 73,166Nidec Corp. 4,800 673,512Nikon Corp. 7,000 141,025Nintendo Co. Ltd. 2,300 840,799Nippon Building Fund Inc. 28 136,925Nippon Electric Glass Co. Ltd. 1,500 57,244Nippon Express Co. Ltd. 1,600 106,359
STATE FARM MUTUAL FUND TRUST INTERNATIONAL INDEX FUNDSCHEDULE OF INVESTMENTS (continued)
December 31, 2017
114 See accompanying notes to financial statements.

Shares Value
Common Stocks (Cont.)Japan (Cont.)Nippon Paint Co. Ltd. 3,400 $ 107,575Nippon Prologis REIT Inc. 32 67,678Nippon Steel Corp. 15,300 392,565Nippon Telegraph & Telephone Corp. 14,000 658,655Nippon Yusen KK(c) 3,300 80,512Nissan Chemical Industries Ltd. 2,600 103,723Nissan Motor Co. Ltd. 46,900 467,647Nisshin Seifun Group Inc. 4,100 82,819Nissin Foods Holdings Co. Ltd. 1,100 80,346Nitori Holdings Co. Ltd. 1,600 228,125Nitto Denko Corp. 3,300 293,171NOK Corp. 2,000 46,701Nomura Holdings Inc. 73,300 432,677Nomura Real Estate Holdings Inc. 2,300 51,562Nomura Real Estate Master Fund Inc. 76 94,363Nomura Research Institute Ltd. 2,860 133,006NSK Ltd. 7,800 122,806NTT Data Corp. 13,000 154,489NTT DoCoMo Inc. 26,600 628,201Obayashi Corp. 13,000 157,373OBIC Co. Ltd. 1,300 95,531Odakyu Electric Railway Co. Ltd. 6,000 128,334Oji Paper Co. Ltd. 16,000 106,501Olympus Corp. 5,900 226,208OMRON Corp. 4,000 238,562Ono Pharmaceutical Co. Ltd. 8,300 193,440Oracle Corp. Japan 700 58,025Oriental Land Co. Ltd. 4,400 401,047Orix Corp. 26,700 451,299Osaka Gas Co. Ltd. 7,600 146,368OTSUKA Corp. 1,100 84,349Otsuka Holdings Co. Ltd. 7,531 330,716Panasonic Corp. 43,000 629,496Park24 Co. Ltd. 2,400 57,447Persol Holdings Co. Ltd. 2,800 70,177Pola Orbis Holdings Inc. 2,000 70,202Rakuten Inc. 18,800 172,274Recruit Holdings Co Ltd. 22,200 551,675Renesas Electronics Corp.(c) 10,200 118,860Resona Holdings Inc. 42,595 254,455Ricoh Co. Ltd. 14,300 132,879RINNAI Corp. 700 63,368Rohm Co. Ltd. 1,900 210,446Ryohin Keikaku Co. Ltd. 500 155,758Sankyo Co. Ltd. 1,000 31,462Santen Pharmaceutical Co. Ltd. 7,800 122,599SBI Holdings Inc. 4,000 83,639Secom Co. Ltd. 4,300 324,651Sega Sammy Holdings Inc. 3,526 43,748Seibu Holdings Inc. 3,600 68,086Seiko Epson Corp. 5,500 129,794Sekisui Chemical Co. Ltd. 8,100 162,611Sekisui House Ltd. 11,400 205,944Seven & I Holdings Co. Ltd. 15,180 630,911Seven Bank Ltd. 13,400 45,905Sharp Corp.(c) 3,100 106,474Shimadzu Corp. 5,000 113,690
Shares Value
Common Stocks (Cont.)Japan (Cont.)Shimamura Co. Ltd. 500 $ 55,026Shimano Inc. 1,500 211,005Shimizu Corp. 11,000 113,637Shin-Etsu Chemical Co. Ltd. 7,600 772,310Shinsei Bank Ltd. 3,500 60,541Shionogi & Co. Ltd. 6,000 324,668Shiseido Co. Ltd. 7,600 367,336Shizuoka Bank Ltd., The 11,000 113,637Showa Shell Sekiyu KK 4,600 62,463SMC Corp. 1,100 452,789SoftBank Group Corp. 16,400 1,298,318Sohgo Security Services Co. Ltd. 1,500 81,606Sompo Holdings Inc. 7,200 278,862Sony Corp. 25,100 1,132,312Sony Financial Holdings Inc. 3,800 67,316Stanley Electric Co. Ltd. 2,900 117,750START TODAY Co. Ltd. 3,600 109,430Subaru Corp. 12,100 384,773SUMCO Corp. 4,600 117,904Sumitomo Chemical Co. Ltd. 29,000 208,476Sumitomo Corp. 24,000 407,899Sumitomo Dainippon Pharma Co. Ltd. 3,000 44,571Sumitomo Electric Industries Ltd. 15,400 260,368Sumitomo Heavy Industries Ltd. 2,200 93,135Sumitomo Metal Mining Co. Ltd. 5,000 229,776Sumitomo Mitsui Financial Group Inc. 26,289 1,135,787Sumitomo Mitsui Trust Holdings Inc. 6,600 262,008Sumitomo Realty & Development
Co. Ltd. 7,000 230,051Sumitomo Rubber Industries Ltd. 3,800 70,688Sundrug Co. Ltd. 1,600 74,409Suntory Beverage & Food Ltd. 2,800 124,500Suruga Bank Ltd. 3,500 75,079Suzuken Co. Ltd. 1,700 69,931Suzuki Motor Corp. 6,998 405,813Sysmex Corp. 3,100 244,038T&D Holdings Inc. 9,700 165,892Taiheiyo Cement Corp. 2,600 112,261Taisei Corp. 4,200 209,115Taisho Pharmaceutical Holdings
Co. Ltd. 600 47,925Taiyo Nippon Sanso Corp. 3,000 41,988Takashimaya Co. Ltd. 6,000 63,155Takeda Pharmaceutical Company Ltd. 13,900 789,651TDK Corp. 2,600 207,446Teijin Ltd. 3,600 80,195Terumo Corp. 6,500 308,054THK Co. Ltd. 2,700 101,362Tobu Railway Co. Ltd. 3,400 109,838Toho Co. Ltd. 2,200 76,246Toho Gas Co. Ltd. 1,600 43,878Tohoku Electric Power Co. Inc. 9,100 116,380Tokio Marine Holdings Inc. 13,600 620,525Tokyo Electric Power Company
Holdings Inc.(c) 29,200 115,582Tokyo Electron Ltd. 3,100 561,260Tokyo Gas Co. Ltd. 7,400 169,345
STATE FARM MUTUAL FUND TRUST INTERNATIONAL INDEX FUNDSCHEDULE OF INVESTMENTS (continued)
December 31, 2017
See accompanying notes to financial statements. 115

Shares Value
Common Stocks (Cont.)Japan (Cont.)Tokyo Tatemono Co. Ltd. 4,000 $ 54,032Tokyu Corp. 11,000 175,532Tokyu Fudosan Holdings Corp. 11,100 80,288Toppan Printing Co. Ltd. 11,000 99,481Toray Industries Inc. 30,000 282,893Toshiba Corp.(c) 130,000 365,742Tosoh Corp. 6,000 136,002Toto Ltd. 3,000 177,058Toyo Seikan Kaisha Ltd. 3,800 61,043Toyo Suisan Kaisha Ltd. 1,600 68,374Toyoda Gosei Co. Ltd. 1,200 30,534Toyota Industries Corp. 3,400 218,469Toyota Motor Corp. 51,700 3,309,626Toyota Tsusho Corp. 4,400 177,093Trend Micro Inc.(c) 2,400 136,108Tsuruha Holdings Inc. 800 108,773Unicharm Corp. 8,100 210,596United Urban Investment Corp. 58 83,442USS Co. Ltd. 4,400 93,174West Japan Railway Co. 3,300 240,951Yahoo Japan Corp. 30,000 137,653Yakult Honsha Co. Ltd. 1,700 128,245Yamada Denki Co. Ltd. 13,600 74,955Yamaguchi Financial Group Inc. 4,000 47,535Yamaha Corp. 3,600 132,913Yamaha Motor Co. Ltd. 5,900 193,481Yamato Holdings Co. Ltd. 7,100 142,882Yamazaki Baking Co. Ltd. 2,300 44,847Yaskawa Electric Corp. 4,900 215,917Yokogawa Electric Corp. 5,100 97,677Yokohama Rubber Company Ltd., The 2,000 49,044
72,205,662
Netherlands (3.50%)ABN AMRO Group NV CVA(e) 8,519 274,959Aegon NV 34,404 219,401AerCap Holdings NV(c) 2,556 134,471Akzo Nobel NV 5,085 445,512Altice NV Class A(c) 9,697 101,759ASML Holding NV 7,706 1,342,063Heineken Holding NV 2,320 229,623Heineken NV 5,220 544,461ING Groep NV 78,195 1,437,825Koninklijke Ahold Delhaize NV 25,862 568,944Koninklijke DSM NV 3,727 356,271Koninklijke KPN NV 64,580 225,330Koninklijke Philips NV 18,781 710,734Koninklijke Vopak NV 1,545 67,792NN Group NV 6,264 271,473NXP Semiconductors NV(c) 6,981 817,405Randstad Holding NV 2,401 147,614Reed Elsevier NV 19,498 448,359Royal Boskalis Westminster NV 1,984 74,819Unilever NV CVA 32,498 1,830,902Wolters Kluwer CVA 5,848 305,087
10,554,804
Shares Value
Common Stocks (Cont.)New Zealand (0.17%)Auckland International Airport Ltd. 19,230 $ 88,311Fisher & Paykel Healthcare
Corporation Ltd. 9,724 98,892Fletcher Building Ltd. 13,758 74,102Mercury NZ Ltd. 16,801 40,126Meridian Energy Ltd. 25,867 53,621Ryman Healthcare Ltd. 7,066 53,031Spark New Zealand Ltd. 36,499 93,897
501,980
Norway (0.65%)DnB NOR ASA 19,726 365,421Gjensidige Forsikring ASA 4,030 76,029Marine Harvest ASA 7,804 132,117Norsk Hydro ASA 26,894 204,229Orkla ASA 16,244 172,221Schibsted ASA Class B 1,790 47,526Statoil ASA 22,815 486,833Telenor ASA 14,289 306,121Yara International ASA 3,632 166,635
1,957,132
Portugal (0.14%)Banco Espirito Santo SA Reg.(b)(c)(d) 47,542 0Energias de Portugal SA 48,947 169,433Galp Energia SGPS SA 8,842 162,584Jeronimo Martins SGPS SA 5,271 102,424
434,441
Singapore (1.33%)Ascendas Real Estate
Investment Trust 56,000 113,890CapitaLand Commercial Trust Ltd. 50,721 73,193Capitaland Ltd. 51,800 136,718CapitaLand Mall Trust 52,300 83,292City Developments Ltd. 8,300 77,511Comfortdelgro Corp. Ltd. 40,600 60,105DBS Group Holdings Ltd. 36,107 670,873Genting Singapore PLC 122,100 119,594Global Logistic Properties Ltd. 50,326 126,807Golden Agri-Resources Ltd. 141,330 39,098Hutchison Port Holdings Trust 114,000 47,310Jardine Cycle & Carriage Ltd. 2,014 61,243Keppel Corp. Ltd. 29,400 161,569Oversea-Chinese Banking
Corporation Ltd. 61,625 570,888SATS Ltd. 14,000 54,432Sembcorp Industries Ltd. 22,120 50,113Singapore Airlines Ltd. 9,267 73,931Singapore Exchange Ltd. 16,000 89,005Singapore Press Holdings Ltd. 24,300 48,148Singapore Technologies
Engineering Ltd. 33,500 81,655Singapore Telecommunications Ltd. 165,250 441,095StarHub Ltd. 12,000 25,571Suntec Real Estate Investment Trust 49,900 80,216
STATE FARM MUTUAL FUND TRUST INTERNATIONAL INDEX FUNDSCHEDULE OF INVESTMENTS (continued)
December 31, 2017
116 See accompanying notes to financial statements.

Shares Value
Common Stocks (Cont.)Singapore (Cont.)United Overseas Bank Ltd. 25,988 $ 513,950UOL Group Ltd. 10,076 66,824Wilmar International Ltd. 32,300 74,625Yangzijiang Shipbuilding Holdings Ltd. 46,448 51,051
3,992,707
Spain (3.19%)Abertis Infraestructuras SA 14,048 312,670ACS Actividades de Construccion y
Servicios SA 4,863 190,333Aena SME SA(e) 1,391 282,059Amadeus IT Group SA 8,793 634,177Banco Bilbao Vizcaya Argentaria SA 133,464 1,138,892Banco de Sabadell SA 107,692 213,979Banco Santander SA 319,454 2,100,082Bankia SA 20,341 97,307Bankinter SA 13,977 132,552CaixaBank SA 71,365 333,004Enagas SA 3,190 91,363Endesa SA 6,586 141,094Ferrovial SA 9,986 226,754Gas Natural SDG SA 7,278 168,101Grifols SA 6,021 176,453Iberdrola SA 112,440 871,525Industria de Diseno Textil SA 21,414 746,270International Consolidated Airlines
Group SA 10,743 93,272Mapfre SA 22,347 71,805Red Electrica Corporacion SA 8,720 195,757Repsol SA 24,873 440,048Repsol SA Rights(c) 24,873 11,311Siemens Gamesa Renewable
Energy SA 4,812 65,993Telefonica SA 90,350 880,802
9,615,603
Sweden (2.67%)Alfa Laval AB 5,972 141,091Assa Abloy AB Class B 19,235 399,562Atlas Copco AB Class A 13,294 574,019Atlas Copco AB Class B 7,737 296,724Boliden AB 5,671 193,986Electrolux AB Series B 4,496 144,859Essity Aktiebolag Class B(c) 11,885 337,580Getinge AB B Shares 4,570 66,296Hennes & Mauritz AB (H&M) B Shares 18,720 386,353Hexagon AB B Shares 5,308 265,882Husqvarna AB B Shares 8,516 81,079ICA Gruppen AB 1,632 59,267Industrivarden AB C Shares 3,318 81,907Investor AB B Shares 9,345 426,176Kinnevik AB Class B 4,729 159,861L E Lundbergforetagen AB B Shares 788 58,886Lundin Petroleum AB(c) 3,463 79,281Millicom International Cellular
SA SDR 1,326 89,552Nordea Bank AB 60,180 728,490
Shares Value
Common Stocks (Cont.)Sweden (Cont.)Sandvik AB 21,923 $ 384,042Securitas AB Class B 6,793 118,584Skandinaviska Enskilda Banken AB
Class A 28,977 340,174Skanska AB Class B 6,871 142,394SKF AB B Shares 7,613 169,093Svenska Handelsbanken AB A Shares 30,852 421,986Swedbank AB - A Shares 18,279 440,981Swedish Match AB 3,673 144,715Tele2 AB B Shares 6,813 83,718Telefonaktiebolaget LM Ericsson
B Shares 61,954 406,703Telia Company AB 52,441 233,658Volvo AB B Shares 31,369 583,931
8,040,830
Switzerland (7.99%)ABB Ltd. Reg. 36,385 975,295Adecco Group AG Reg. 3,282 251,088Baloise Holding AG Reg. 933 145,247Barry Callebaut AG Reg. 42 87,625Chocoladefabriken Lindt & Sprungli
AG Reg. 2 144,666Chocoladefabriken Lindt &
Sprungli AG 21 128,226Clariant AG Reg. 3,810 106,545Compagnie Financiere Richemont
SA Reg. 10,487 950,282Credit Suisse Group AG Reg. 48,139 859,581Dufry AG Reg.(c) 707 105,130Ems-Chemie Holding AG Reg 165 110,144Geberit AG Reg. 755 332,465Givaudan SA Reg. 185 427,544Julius Baer Group Ltd. 4,517 276,272Kuehne & Nagel International
AG Reg. 1,118 197,912LafargeHolcim Ltd. Reg. 9,188 518,119Lonza Group AG Reg. 1,454 392,876Nestle SA Reg. 62,022 5,333,720Novartis AG Reg. 44,598 3,771,230Pargesa Holding SA 779 67,551Partners Group Holding AG 359 246,100Roche Holding AG 13,927 3,523,019Schindler Holding AG 829 190,820Schindler Holding AG Reg. 417 94,359SGS SA Reg 102 265,978Sika AG 43 341,547Sonova Holding AG Reg. 1,083 169,155Straumann Holding AG Reg. 192 135,658Swatch Group AG Reg., The 1,012 77,371Swatch Group AG, The 623 254,072Swiss Life Holding AG Reg. 657 232,608Swiss Prime Site AG Reg. 1,425 131,613Swiss Re AG 6,173 578,056Swisscom AG 525 279,350UBS Group AG 72,577 1,336,171Vifor Pharma AG 984 126,124
STATE FARM MUTUAL FUND TRUST INTERNATIONAL INDEX FUNDSCHEDULE OF INVESTMENTS (continued)
December 31, 2017
See accompanying notes to financial statements. 117
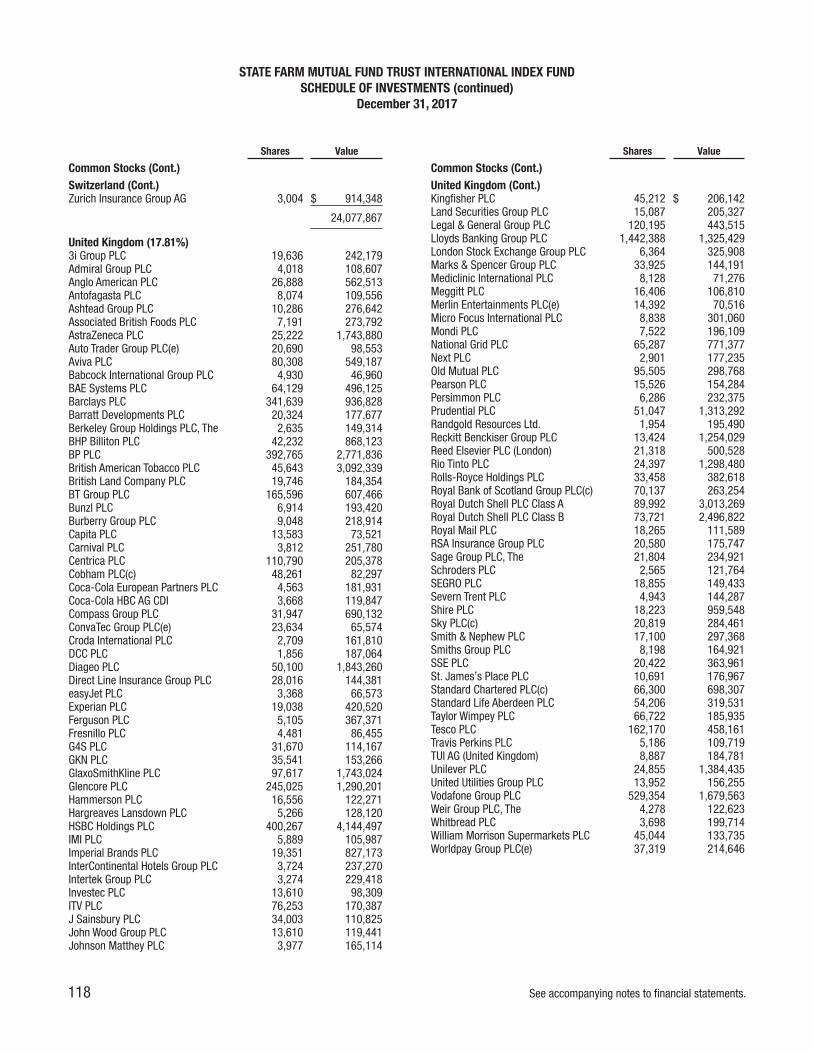
Shares Value
Common Stocks (Cont.)Switzerland (Cont.)Zurich Insurance Group AG 3,004 $ 914,348
24,077,867
United Kingdom (17.81%)3i Group PLC 19,636 242,179Admiral Group PLC 4,018 108,607Anglo American PLC 26,888 562,513Antofagasta PLC 8,074 109,556Ashtead Group PLC 10,286 276,642Associated British Foods PLC 7,191 273,792AstraZeneca PLC 25,222 1,743,880Auto Trader Group PLC(e) 20,690 98,553Aviva PLC 80,308 549,187Babcock International Group PLC 4,930 46,960BAE Systems PLC 64,129 496,125Barclays PLC 341,639 936,828Barratt Developments PLC 20,324 177,677Berkeley Group Holdings PLC, The 2,635 149,314BHP Billiton PLC 42,232 868,123BP PLC 392,765 2,771,836British American Tobacco PLC 45,643 3,092,339British Land Company PLC 19,746 184,354BT Group PLC 165,596 607,466Bunzl PLC 6,914 193,420Burberry Group PLC 9,048 218,914Capita PLC 13,583 73,521Carnival PLC 3,812 251,780Centrica PLC 110,790 205,378Cobham PLC(c) 48,261 82,297Coca-Cola European Partners PLC 4,563 181,931Coca-Cola HBC AG CDI 3,668 119,847Compass Group PLC 31,947 690,132ConvaTec Group PLC(e) 23,634 65,574Croda International PLC 2,709 161,810DCC PLC 1,856 187,064Diageo PLC 50,100 1,843,260Direct Line Insurance Group PLC 28,016 144,381easyJet PLC 3,368 66,573Experian PLC 19,038 420,520Ferguson PLC 5,105 367,371Fresnillo PLC 4,481 86,455G4S PLC 31,670 114,167GKN PLC 35,541 153,266GlaxoSmithKline PLC 97,617 1,743,024Glencore PLC 245,025 1,290,201Hammerson PLC 16,556 122,271Hargreaves Lansdown PLC 5,266 128,120HSBC Holdings PLC 400,267 4,144,497IMI PLC 5,889 105,987Imperial Brands PLC 19,351 827,173InterContinental Hotels Group PLC 3,724 237,270Intertek Group PLC 3,274 229,418Investec PLC 13,610 98,309ITV PLC 76,253 170,387J Sainsbury PLC 34,003 110,825John Wood Group PLC 13,610 119,441Johnson Matthey PLC 3,977 165,114
Shares Value
Common Stocks (Cont.)United Kingdom (Cont.)Kingfisher PLC 45,212 $ 206,142Land Securities Group PLC 15,087 205,327Legal & General Group PLC 120,195 443,515Lloyds Banking Group PLC 1,442,388 1,325,429London Stock Exchange Group PLC 6,364 325,908Marks & Spencer Group PLC 33,925 144,191Mediclinic International PLC 8,128 71,276Meggitt PLC 16,406 106,810Merlin Entertainments PLC(e) 14,392 70,516Micro Focus International PLC 8,838 301,060Mondi PLC 7,522 196,109National Grid PLC 65,287 771,377Next PLC 2,901 177,235Old Mutual PLC 95,505 298,768Pearson PLC 15,526 154,284Persimmon PLC 6,286 232,375Prudential PLC 51,047 1,313,292Randgold Resources Ltd. 1,954 195,490Reckitt Benckiser Group PLC 13,424 1,254,029Reed Elsevier PLC (London) 21,318 500,528Rio Tinto PLC 24,397 1,298,480Rolls-Royce Holdings PLC 33,458 382,618Royal Bank of Scotland Group PLC(c) 70,137 263,254Royal Dutch Shell PLC Class A 89,992 3,013,269Royal Dutch Shell PLC Class B 73,721 2,496,822Royal Mail PLC 18,265 111,589RSA Insurance Group PLC 20,580 175,747Sage Group PLC, The 21,804 234,921Schroders PLC 2,565 121,764SEGRO PLC 18,855 149,433Severn Trent PLC 4,943 144,287Shire PLC 18,223 959,548Sky PLC(c) 20,819 284,461Smith & Nephew PLC 17,100 297,368Smiths Group PLC 8,198 164,921SSE PLC 20,422 363,961St. James’s Place PLC 10,691 176,967Standard Chartered PLC(c) 66,300 698,307Standard Life Aberdeen PLC 54,206 319,531Taylor Wimpey PLC 66,722 185,935Tesco PLC 162,170 458,161Travis Perkins PLC 5,186 109,719TUI AG (United Kingdom) 8,887 184,781Unilever PLC 24,855 1,384,435United Utilities Group PLC 13,952 156,255Vodafone Group PLC 529,354 1,679,563Weir Group PLC, The 4,278 122,623Whitbread PLC 3,698 199,714William Morrison Supermarkets PLC 45,044 133,735Worldpay Group PLC(e) 37,319 214,646
STATE FARM MUTUAL FUND TRUST INTERNATIONAL INDEX FUNDSCHEDULE OF INVESTMENTS (continued)
December 31, 2017
118 See accompanying notes to financial statements.

Shares Value
Common Stocks (Cont.)United Kingdom (Cont.)WPP PLC 25,388 $ 459,663
53,655,768Total Common Stocks(cost $213,931,347) 298,511,417
Preferred Stocks (0.57%)Germany (0.57%)Bayerische Moteren Werke (BMW)
AG, 0.00% 1,162 104,064Fuchs Petrolub SE, 0.00% 1,403 74,490Henkel AG & Co. KGaA, 0.00% 3,596 476,123Porsche Automobil Holding SE, 0.00% 3,177 265,996Schaeffler AG, 0.00% 3,322 58,932Volkswagen AG, 0.00% 3,746 748,132
1,727,737Total Preferred Stocks(cost $901,481) 1,727,737
TOTAL INVESTMENTS (99.67%)(cost $214,832,828) 300,239,154
CASH (f) AND OTHER ASSETS, NET OFLIABILITIES (0.33%) 989,033
NET ASSETS (100.00%) $ 301,228,187
(a) The Fund used data provided by an independent statistical fair value serviceto fair value its holdings listed on the Tel-Aviv (Israel) Stock Exchange whichdid not trade on the last day of the period because the exchange wasclosed. This method of fair valuing foreign securities was established in thevaluation procedures adopted by the Board of Trustees.
(b) Security was valued using significant unobservable inputs.(c) Non-income producing security.(d) In accordance with the Trust’s valuation procedures, State Farm Investment
Management Corp. (“SFIMC”) determined the fair value for the securityconsidering the facts and circumstances related to the particular security.The fair value for this security was not determined using the Trust’sindependent statistical fair value service.
(e) Securities exempt from registration pursuant to Rule 144A under theSecurities Act of 1933. These securities may be resold in transactionsexempt from registration, normally to qualified institutional buyers. AtDecember 31, 2017, the value of these securities amounted to $2,045,033or 0.68% of net assets.
(f) At December 31, 2017, foreign currencies in the amount of $122,113 hasbeen pledged to cover, in whole or in part, margin requirements for openfutures contracts.
SDR – Swedish Depositary ReceiptADR – American Depositary Receipt
FOREIGN CURRENCY DENOMINATIONS
Currency Value %
Euro $ 96,675,012 32.20Japanese Yen 72,205,662 24.05British Pound 53,473,837 17.81Swiss Franc 24,077,867 8.02Australian Dollar 20,739,168 6.91Hong Kong Dollar 9,995,808 3.33Swedish Krona 8,040,830 2.68Danish Krone 5,477,190 1.82Singapore Dollar 3,945,397 1.31United States Dollar 2,359,841 0.79Norwegian Krone 1,957,132 0.65Israeli Shekel 789,430 0.26New Zealand Dollar 501,980 0.17
Total Investments $300,239,154 100.00%
SECTOR CLASSIFICATIONS
Sector Value %
Financials $ 63,598,880 21.11Industrials 43,931,489 14.58Consumer Discretionary 36,906,051 12.25Consumer Staples 33,580,000 11.15Health Care 30,291,261 10.06Materials 24,628,345 8.18Information Technology 19,353,427 6.42Energy 15,928,835 5.29Telecommunication Services 11,680,968 3.88Real Estate 10,810,726 3.59Utilities 9,529,172 3.16
Total Stocks 300,239,154 99.67Cash and Other Assets, Net of Liabilities 989,033 0.33
Net Assets $301,228,187 100.00%
STATE FARM MUTUAL FUND TRUST INTERNATIONAL INDEX FUNDSCHEDULE OF INVESTMENTS (continued)
December 31, 2017
See accompanying notes to financial statements. 119

OPEN FUTURES CONTRACTS
DescriptionContractsPurchased Expiration
NotionalValue
MarketValue
UnrealizedGain (Loss)
ASX SPI 200 Index 2 March 2018 $233,763 $234,700 $ 937FTSE 100 Index 6 March 2018 603,477 616,578 13,101Nikkei 225 Index 6 March 2018 603,155 605,465 2,310
Total $16,348
STATE FARM MUTUAL FUND TRUST INTERNATIONAL INDEX FUNDSCHEDULE OF INVESTMENTS (continued)
December 31, 2017
120 See accompanying notes to financial statements.

Shares Value
Registered Investment Companies (98.72%)State Farm Mutual Fund Trust Bond
Fund Institutional Shares(a) 14,300,194 $ 159,876,166State Farm Mutual Fund Trust Equity
Fund Institutional Shares(a) 21,591,596 231,461,913
Total Registered Investment Companies(cost $318,937,001) 391,338,079
TOTAL INVESTMENTS (98.72%)(cost $318,937,001) 391,338,079
CASH AND OTHER ASSETS, NET OFLIABILITIES (1.28%) 5,087,880
NET ASSETS (100.00%) $ 396,425,959
(a) As of December 31, 2017, investments in issuers considered to be affiliates of the Equity and Bond Fund for purposes of Section 2(a)(3) of the Investment Company Actof 1940, as amended, were as follows:
SecurityShares Held at
December 31, 2016Shares
Purchased Shares SoldShares Held at
December 31, 2017Value at
December 31, 2017
State Farm Mutual Fund Trust BondFund Institutional Shares 13,200,046 1,100,148 — 14,300,194 $159,876,166
State Farm Mutual Fund Trust EquityFund Institutional Shares 23,800,137 — 2,208,541 21,591,596 231,461,913
$391,338,079
For the year ended December 31, 2017
SecurityIncome
DividendsCapital GainDividends
Realized Gain (Loss)on Sales
Change in UnrealizedAppreciation (Depreciation)
State Farm Mutual Fund Trust BondFund Institutional Shares $3,772,727 $ 385,748 $ — $ 131,647
State Farm Mutual Fund Trust EquityFund Institutional Shares 1,781,307 16,491,877 1,005,868 31,150,768
$5,554,034 $16,877,625 $1,005,868 $31,282,415
STATE FARM MUTUAL FUND TRUST EQUITY AND BOND FUNDSCHEDULE OF INVESTMENTS
December 31, 2017
See accompanying notes to financial statements. 121
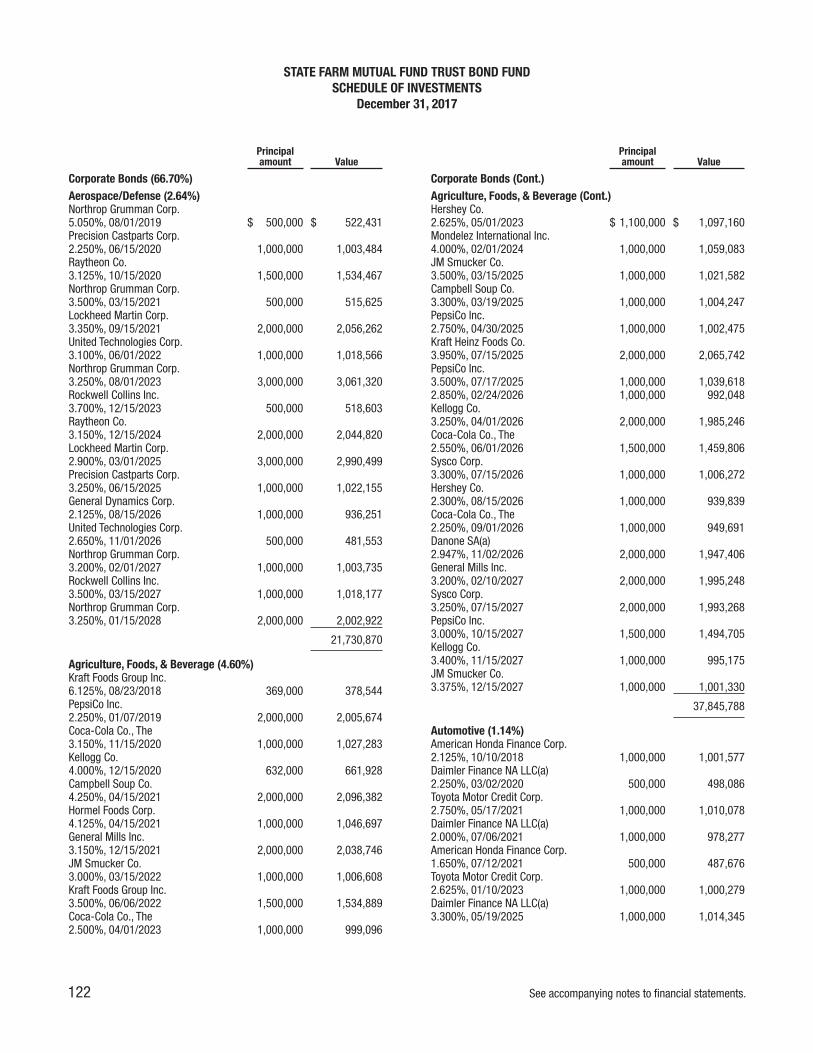
Principalamount Value
Corporate Bonds (66.70%)Aerospace/Defense (2.64%)Northrop Grumman Corp.5.050%, 08/01/2019 $ 500,000 $ 522,431Precision Castparts Corp.2.250%, 06/15/2020 1,000,000 1,003,484Raytheon Co.3.125%, 10/15/2020 1,500,000 1,534,467Northrop Grumman Corp.3.500%, 03/15/2021 500,000 515,625Lockheed Martin Corp.3.350%, 09/15/2021 2,000,000 2,056,262United Technologies Corp.3.100%, 06/01/2022 1,000,000 1,018,566Northrop Grumman Corp.3.250%, 08/01/2023 3,000,000 3,061,320Rockwell Collins Inc.3.700%, 12/15/2023 500,000 518,603Raytheon Co.3.150%, 12/15/2024 2,000,000 2,044,820Lockheed Martin Corp.2.900%, 03/01/2025 3,000,000 2,990,499Precision Castparts Corp.3.250%, 06/15/2025 1,000,000 1,022,155General Dynamics Corp.2.125%, 08/15/2026 1,000,000 936,251United Technologies Corp.2.650%, 11/01/2026 500,000 481,553Northrop Grumman Corp.3.200%, 02/01/2027 1,000,000 1,003,735Rockwell Collins Inc.3.500%, 03/15/2027 1,000,000 1,018,177Northrop Grumman Corp.3.250%, 01/15/2028 2,000,000 2,002,922
21,730,870
Agriculture, Foods, & Beverage (4.60%)Kraft Foods Group Inc.6.125%, 08/23/2018 369,000 378,544PepsiCo Inc.2.250%, 01/07/2019 2,000,000 2,005,674Coca-Cola Co., The3.150%, 11/15/2020 1,000,000 1,027,283Kellogg Co.4.000%, 12/15/2020 632,000 661,928Campbell Soup Co.4.250%, 04/15/2021 2,000,000 2,096,382Hormel Foods Corp.4.125%, 04/15/2021 1,000,000 1,046,697General Mills Inc.3.150%, 12/15/2021 2,000,000 2,038,746JM Smucker Co.3.000%, 03/15/2022 1,000,000 1,006,608Kraft Foods Group Inc.3.500%, 06/06/2022 1,500,000 1,534,889Coca-Cola Co., The2.500%, 04/01/2023 1,000,000 999,096
Principalamount Value
Corporate Bonds (Cont.)Agriculture, Foods, & Beverage (Cont.)Hershey Co.2.625%, 05/01/2023 $ 1,100,000 $ 1,097,160Mondelez International Inc.4.000%, 02/01/2024 1,000,000 1,059,083JM Smucker Co.3.500%, 03/15/2025 1,000,000 1,021,582Campbell Soup Co.3.300%, 03/19/2025 1,000,000 1,004,247PepsiCo Inc.2.750%, 04/30/2025 1,000,000 1,002,475Kraft Heinz Foods Co.3.950%, 07/15/2025 2,000,000 2,065,742PepsiCo Inc.3.500%, 07/17/2025 1,000,000 1,039,6182.850%, 02/24/2026 1,000,000 992,048Kellogg Co.3.250%, 04/01/2026 2,000,000 1,985,246Coca-Cola Co., The2.550%, 06/01/2026 1,500,000 1,459,806Sysco Corp.3.300%, 07/15/2026 1,000,000 1,006,272Hershey Co.2.300%, 08/15/2026 1,000,000 939,839Coca-Cola Co., The2.250%, 09/01/2026 1,000,000 949,691Danone SA(a)2.947%, 11/02/2026 2,000,000 1,947,406General Mills Inc.3.200%, 02/10/2027 2,000,000 1,995,248Sysco Corp.3.250%, 07/15/2027 2,000,000 1,993,268PepsiCo Inc.3.000%, 10/15/2027 1,500,000 1,494,705Kellogg Co.3.400%, 11/15/2027 1,000,000 995,175JM Smucker Co.3.375%, 12/15/2027 1,000,000 1,001,330
37,845,788
Automotive (1.14%)American Honda Finance Corp.2.125%, 10/10/2018 1,000,000 1,001,577Daimler Finance NA LLC(a)2.250%, 03/02/2020 500,000 498,086Toyota Motor Credit Corp.2.750%, 05/17/2021 1,000,000 1,010,078Daimler Finance NA LLC(a)2.000%, 07/06/2021 1,000,000 978,277American Honda Finance Corp.1.650%, 07/12/2021 500,000 487,676Toyota Motor Credit Corp.2.625%, 01/10/2023 1,000,000 1,000,279Daimler Finance NA LLC(a)3.300%, 05/19/2025 1,000,000 1,014,345
STATE FARM MUTUAL FUND TRUST BOND FUNDSCHEDULE OF INVESTMENTS
December 31, 2017
122 See accompanying notes to financial statements.

Principalamount Value
Corporate Bonds (Cont.)Automotive (Cont.)BMW US Capital LLC(a)2.800%, 04/11/2026 $ 500,000 $ 488,834American Honda Finance Corp.2.300%, 09/09/2026 2,000,000 1,893,052BMW US Capital LLC(a)3.300%, 04/06/2027 1,000,000 1,012,877
9,385,081
Banks (3.99%)Bank of New York Mellon Corp.2.100%, 08/01/2018 1,000,000 1,000,950Wells Fargo & Co.2.150%, 01/15/2019 1,000,000 1,001,605Bank of New York Mellon Corp.2.200%, 05/15/2019 1,000,000 1,001,332KFW4.875%, 06/17/2019 1,000,000 1,041,395Bank of New York Mellon Corp.2.300%, 09/11/2019 1,000,000 1,002,607Wells Fargo & Co.2.150%, 01/30/2020 1,000,000 997,807State Street Corp.2.550%, 08/18/2020 1,000,000 1,006,633PNC Bank NA2.150%, 04/29/2021 1,000,000 991,105Toronto-Dominion Bank, The1.800%, 07/13/2021 1,000,000 979,267Bank of New York Mellon Corp.3.550%, 09/23/2021 1,000,000 1,037,556U.S. Bancorp3.700%, 01/30/2024 500,000 525,120Bank of New York Mellon Corp.3.400%, 05/15/2024 500,000 518,842Wells Fargo & Co.3.300%, 09/09/2024 2,000,000 2,031,022Bank of New York Mellon Corp.3.250%, 09/11/2024 1,000,000 1,021,005State Street Corp.3.300%, 12/16/2024 2,000,000 2,065,758US Bank NA2.800%, 01/27/2025 3,000,000 2,979,768Wells Fargo & Co.3.000%, 02/19/2025 1,000,000 991,649PNC Bank NA2.950%, 02/23/2025 1,500,000 1,496,969Bank of New York Mellon Corp.3.000%, 02/24/2025 500,000 500,090PNC Bank NA3.250%, 06/01/2025 500,000 507,465State Street Corp.3.550%, 08/18/2025 500,000 519,593Bank of New York Mellon Corp.2.800%, 05/04/2026 500,000 488,277State Street Corp.2.650%, 05/19/2026 1,000,000 972,814
Principalamount Value
Corporate Bonds (Cont.)Banks (Cont.)U.S. Bancorp2.375%, 07/22/2026 $ 1,000,000 $ 941,523Bank of New York Mellon Corp.2.450%, 08/17/2026 1,000,000 949,736Wells Fargo & Co.3.000%, 10/23/2026 3,334,000 3,267,843U.S. Bancorp3.150%, 04/27/2027 1,000,000 1,001,831PNC Bank NA3.100%, 10/25/2027 2,000,000 1,997,028
32,836,590
Building Materials & Construction (1.00%)CRH America Inc.5.750%, 01/15/2021 1,000,000 1,083,798Fluor Corp.3.375%, 09/15/2021 2,000,000 2,044,598Sonoco Products Co.4.375%, 11/01/2021 1,000,000 1,048,174Stanley Black & Decker Inc.2.900%, 11/01/2022 1,500,000 1,514,504Fluor Corp.3.500%, 12/15/2024 1,000,000 1,026,669CRH America Inc.(a)3.875%, 05/18/2025 1,000,000 1,043,852CRH America Finance, Inc.(a)3.400%, 05/09/2027 500,000 499,887
8,261,482
Chemicals (3.89%)E.I. du Pont de Nemours and Co.6.000%, 07/15/2018 500,000 510,603Ecolab Inc.2.250%, 01/12/2020 1,000,000 999,485PPG Industries Inc.3.600%, 11/15/2020 1,000,000 1,025,588E.I. du Pont de Nemours and Co.3.625%, 01/15/2021 1,000,000 1,033,469Praxair Inc.4.050%, 03/15/2021 1,000,000 1,050,617Monsanto Co.2.750%, 07/15/2021 500,000 502,238Praxair Inc.3.000%, 09/01/2021 1,000,000 1,017,673Dow Chemical Co., The4.125%, 11/15/2021 1,500,000 1,572,798Sherwin-Williams Co., The4.200%, 01/15/2022 2,000,000 2,094,800Syngenta Finance NV3.125%, 03/28/2022 2,000,000 1,944,604Monsanto Co.2.200%, 07/15/2022 1,300,000 1,258,745E.I. du Pont de Nemours and Co.2.800%, 02/15/2023 2,000,000 1,995,574
STATE FARM MUTUAL FUND TRUST BOND FUNDSCHEDULE OF INVESTMENTS (continued)
December 31, 2017
See accompanying notes to financial statements. 123
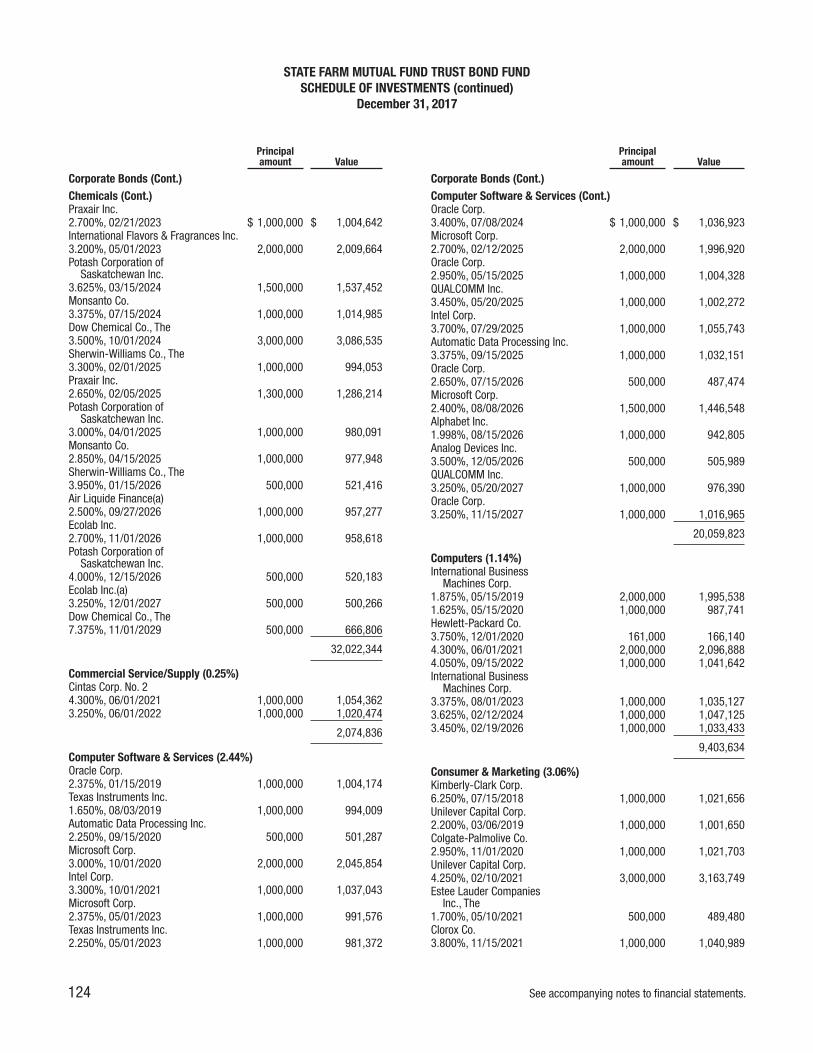
Principalamount Value
Corporate Bonds (Cont.)Chemicals (Cont.)Praxair Inc.2.700%, 02/21/2023 $ 1,000,000 $ 1,004,642International Flavors & Fragrances Inc.3.200%, 05/01/2023 2,000,000 2,009,664Potash Corporation of
Saskatchewan Inc.3.625%, 03/15/2024 1,500,000 1,537,452Monsanto Co.3.375%, 07/15/2024 1,000,000 1,014,985Dow Chemical Co., The3.500%, 10/01/2024 3,000,000 3,086,535Sherwin-Williams Co., The3.300%, 02/01/2025 1,000,000 994,053Praxair Inc.2.650%, 02/05/2025 1,300,000 1,286,214Potash Corporation of
Saskatchewan Inc.3.000%, 04/01/2025 1,000,000 980,091Monsanto Co.2.850%, 04/15/2025 1,000,000 977,948Sherwin-Williams Co., The3.950%, 01/15/2026 500,000 521,416Air Liquide Finance(a)2.500%, 09/27/2026 1,000,000 957,277Ecolab Inc.2.700%, 11/01/2026 1,000,000 958,618Potash Corporation of
Saskatchewan Inc.4.000%, 12/15/2026 500,000 520,183Ecolab Inc.(a)3.250%, 12/01/2027 500,000 500,266Dow Chemical Co., The7.375%, 11/01/2029 500,000 666,806
32,022,344
Commercial Service/Supply (0.25%)Cintas Corp. No. 24.300%, 06/01/2021 1,000,000 1,054,3623.250%, 06/01/2022 1,000,000 1,020,474
2,074,836
Computer Software & Services (2.44%)Oracle Corp.2.375%, 01/15/2019 1,000,000 1,004,174Texas Instruments Inc.1.650%, 08/03/2019 1,000,000 994,009Automatic Data Processing Inc.2.250%, 09/15/2020 500,000 501,287Microsoft Corp.3.000%, 10/01/2020 2,000,000 2,045,854Intel Corp.3.300%, 10/01/2021 1,000,000 1,037,043Microsoft Corp.2.375%, 05/01/2023 1,000,000 991,576Texas Instruments Inc.2.250%, 05/01/2023 1,000,000 981,372
Principalamount Value
Corporate Bonds (Cont.)Computer Software & Services (Cont.)Oracle Corp.3.400%, 07/08/2024 $ 1,000,000 $ 1,036,923Microsoft Corp.2.700%, 02/12/2025 2,000,000 1,996,920Oracle Corp.2.950%, 05/15/2025 1,000,000 1,004,328QUALCOMM Inc.3.450%, 05/20/2025 1,000,000 1,002,272Intel Corp.3.700%, 07/29/2025 1,000,000 1,055,743Automatic Data Processing Inc.3.375%, 09/15/2025 1,000,000 1,032,151Oracle Corp.2.650%, 07/15/2026 500,000 487,474Microsoft Corp.2.400%, 08/08/2026 1,500,000 1,446,548Alphabet Inc.1.998%, 08/15/2026 1,000,000 942,805Analog Devices Inc.3.500%, 12/05/2026 500,000 505,989QUALCOMM Inc.3.250%, 05/20/2027 1,000,000 976,390Oracle Corp.3.250%, 11/15/2027 1,000,000 1,016,965
20,059,823
Computers (1.14%)International Business
Machines Corp.1.875%, 05/15/2019 2,000,000 1,995,5381.625%, 05/15/2020 1,000,000 987,741Hewlett-Packard Co.3.750%, 12/01/2020 161,000 166,1404.300%, 06/01/2021 2,000,000 2,096,8884.050%, 09/15/2022 1,000,000 1,041,642International Business
Machines Corp.3.375%, 08/01/2023 1,000,000 1,035,1273.625%, 02/12/2024 1,000,000 1,047,1253.450%, 02/19/2026 1,000,000 1,033,433
9,403,634
Consumer & Marketing (3.06%)Kimberly-Clark Corp.6.250%, 07/15/2018 1,000,000 1,021,656Unilever Capital Corp.2.200%, 03/06/2019 1,000,000 1,001,650Colgate-Palmolive Co.2.950%, 11/01/2020 1,000,000 1,021,703Unilever Capital Corp.4.250%, 02/10/2021 3,000,000 3,163,749Estee Lauder Companies
Inc., The1.700%, 05/10/2021 500,000 489,480Clorox Co.3.800%, 11/15/2021 1,000,000 1,040,989
STATE FARM MUTUAL FUND TRUST BOND FUNDSCHEDULE OF INVESTMENTS (continued)
December 31, 2017
124 See accompanying notes to financial statements.
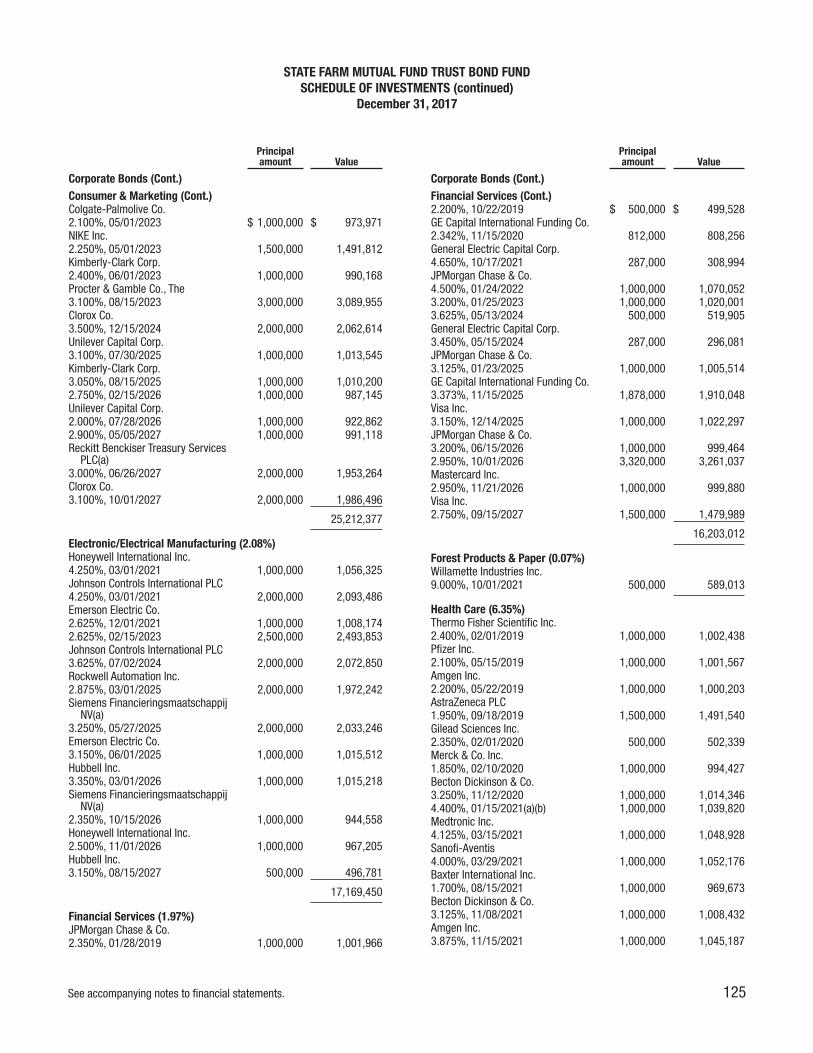
Principalamount Value
Corporate Bonds (Cont.)Consumer & Marketing (Cont.)Colgate-Palmolive Co.2.100%, 05/01/2023 $ 1,000,000 $ 973,971NIKE Inc.2.250%, 05/01/2023 1,500,000 1,491,812Kimberly-Clark Corp.2.400%, 06/01/2023 1,000,000 990,168Procter & Gamble Co., The3.100%, 08/15/2023 3,000,000 3,089,955Clorox Co.3.500%, 12/15/2024 2,000,000 2,062,614Unilever Capital Corp.3.100%, 07/30/2025 1,000,000 1,013,545Kimberly-Clark Corp.3.050%, 08/15/2025 1,000,000 1,010,2002.750%, 02/15/2026 1,000,000 987,145Unilever Capital Corp.2.000%, 07/28/2026 1,000,000 922,8622.900%, 05/05/2027 1,000,000 991,118Reckitt Benckiser Treasury Services
PLC(a)3.000%, 06/26/2027 2,000,000 1,953,264Clorox Co.3.100%, 10/01/2027 2,000,000 1,986,496
25,212,377
Electronic/Electrical Manufacturing (2.08%)Honeywell International Inc.4.250%, 03/01/2021 1,000,000 1,056,325Johnson Controls International PLC4.250%, 03/01/2021 2,000,000 2,093,486Emerson Electric Co.2.625%, 12/01/2021 1,000,000 1,008,1742.625%, 02/15/2023 2,500,000 2,493,853Johnson Controls International PLC3.625%, 07/02/2024 2,000,000 2,072,850Rockwell Automation Inc.2.875%, 03/01/2025 2,000,000 1,972,242Siemens Financieringsmaatschappij
NV(a)3.250%, 05/27/2025 2,000,000 2,033,246Emerson Electric Co.3.150%, 06/01/2025 1,000,000 1,015,512Hubbell Inc.3.350%, 03/01/2026 1,000,000 1,015,218Siemens Financieringsmaatschappij
NV(a)2.350%, 10/15/2026 1,000,000 944,558Honeywell International Inc.2.500%, 11/01/2026 1,000,000 967,205Hubbell Inc.3.150%, 08/15/2027 500,000 496,781
17,169,450
Financial Services (1.97%)JPMorgan Chase & Co.2.350%, 01/28/2019 1,000,000 1,001,966
Principalamount Value
Corporate Bonds (Cont.)Financial Services (Cont.)2.200%, 10/22/2019 $ 500,000 $ 499,528GE Capital International Funding Co.2.342%, 11/15/2020 812,000 808,256General Electric Capital Corp.4.650%, 10/17/2021 287,000 308,994JPMorgan Chase & Co.4.500%, 01/24/2022 1,000,000 1,070,0523.200%, 01/25/2023 1,000,000 1,020,0013.625%, 05/13/2024 500,000 519,905General Electric Capital Corp.3.450%, 05/15/2024 287,000 296,081JPMorgan Chase & Co.3.125%, 01/23/2025 1,000,000 1,005,514GE Capital International Funding Co.3.373%, 11/15/2025 1,878,000 1,910,048Visa Inc.3.150%, 12/14/2025 1,000,000 1,022,297JPMorgan Chase & Co.3.200%, 06/15/2026 1,000,000 999,4642.950%, 10/01/2026 3,320,000 3,261,037Mastercard Inc.2.950%, 11/21/2026 1,000,000 999,880Visa Inc.2.750%, 09/15/2027 1,500,000 1,479,989
16,203,012
Forest Products & Paper (0.07%)Willamette Industries Inc.9.000%, 10/01/2021 500,000 589,013
Health Care (6.35%)Thermo Fisher Scientific Inc.2.400%, 02/01/2019 1,000,000 1,002,438Pfizer Inc.2.100%, 05/15/2019 1,000,000 1,001,567Amgen Inc.2.200%, 05/22/2019 1,000,000 1,000,203AstraZeneca PLC1.950%, 09/18/2019 1,500,000 1,491,540Gilead Sciences Inc.2.350%, 02/01/2020 500,000 502,339Merck & Co. Inc.1.850%, 02/10/2020 1,000,000 994,427Becton Dickinson & Co.3.250%, 11/12/2020 1,000,000 1,014,3464.400%, 01/15/2021(a)(b) 1,000,000 1,039,820Medtronic Inc.4.125%, 03/15/2021 1,000,000 1,048,928Sanofi-Aventis4.000%, 03/29/2021 1,000,000 1,052,176Baxter International Inc.1.700%, 08/15/2021 1,000,000 969,673Becton Dickinson & Co.3.125%, 11/08/2021 1,000,000 1,008,432Amgen Inc.3.875%, 11/15/2021 1,000,000 1,045,187
STATE FARM MUTUAL FUND TRUST BOND FUNDSCHEDULE OF INVESTMENTS (continued)
December 31, 2017
See accompanying notes to financial statements. 125

Principalamount Value
Corporate Bonds (Cont.)Health Care (Cont.)Abbott Laboratories2.550%, 03/15/2022 $ 1,000,000 $ 989,679Zimmer Holdings Inc.3.150%, 04/01/2022 1,000,000 1,002,449Novartis Capital Corp.2.400%, 09/21/2022 1,000,000 994,417Thermo Fisher Scientific Inc.3.150%, 01/15/2023 1,500,000 1,518,740GlaxoSmithKline Capital Inc.2.800%, 03/18/2023 2,000,000 2,017,420Merck & Co. Inc.2.800%, 05/18/2023 2,000,000 2,016,650Pfizer Inc.3.000%, 06/15/2023 1,000,000 1,021,857Bristol-Myers Squibb Co.3.250%, 11/01/2023 1,000,000 1,036,626Pfizer Inc.3.400%, 05/15/2024 1,000,000 1,038,407Amgen Inc.3.625%, 05/22/2024 1,000,000 1,038,989Bayer U.S. Finance LLC(a)3.375%, 10/08/2024 1,000,000 1,017,450Becton Dickinson & Co.3.734%, 12/15/2024 2,000,000 2,048,392Gilead Sciences Inc.3.500%, 02/01/2025 500,000 517,105Merck & Co. Inc.2.750%, 02/10/2025 1,000,000 995,952Abbott Laboratories2.950%, 03/15/2025 1,000,000 981,103EMD Finance LLC(a)3.250%, 03/19/2025 1,000,000 1,005,690Zimmer Holdings Inc.3.550%, 04/01/2025 2,000,000 1,998,672Amgen Inc.3.125%, 05/01/2025 1,000,000 1,004,094Eli Lilly and Co.2.750%, 06/01/2025 1,000,000 1,002,775Gilead Sciences Inc.3.650%, 03/01/2026 1,000,000 1,037,400Johnson & Johnson2.450%, 03/01/2026 500,000 487,588Stryker Corp.3.500%, 03/15/2026 1,000,000 1,031,851Becton Dickinson & Co.(a)(b)3.000%, 05/15/2026 1,500,000 1,511,250Roche Holdings Inc.(a)2.625%, 05/15/2026 1,500,000 1,462,232Pfizer Inc.2.750%, 06/03/2026 1,500,000 1,480,665Baxter International Inc.2.600%, 08/15/2026 1,000,000 953,490Amgen Inc.2.600%, 08/19/2026 1,000,000 957,530Thermo Fisher Scientific Inc.2.950%, 09/19/2026 500,000 485,855
Principalamount Value
Corporate Bonds (Cont.)Health Care (Cont.)Abbott Laboratories3.750%, 11/30/2026 $ 1,000,000 $ 1,026,866Gilead Sciences Inc.2.950%, 03/01/2027 1,000,000 983,542AstraZeneca PLC3.125%, 06/12/2027 2,000,000 1,976,340Zoetis Inc.3.000%, 09/12/2027 1,000,000 976,836Amgen Inc.3.200%, 11/02/2027 1,000,000 998,761Johnson & Johnson2.900%, 01/15/2028 500,000 500,743
52,288,492
Machinery & Manufacturing (3.06%)John Deere Capital Corp.1.700%, 01/15/2020 1,000,000 990,250Danaher Corp.2.400%, 09/15/2020 500,000 501,885Cooper U.S. Inc.3.875%, 12/15/2020 1,000,000 1,034,411Dover Corp.4.300%, 03/01/2021 1,000,000 1,056,028Caterpillar Inc.3.900%, 05/27/2021 1,000,000 1,051,630Illinois Tool Works Inc.3.375%, 09/15/2021 1,000,000 1,028,870Bemis Company Inc.4.500%, 10/15/2021 1,000,000 1,055,209Parker Hannifin Corp.3.500%, 09/15/2022 1,000,000 1,033,200Caterpillar Financial Services Corp.2.625%, 03/01/2023 2,000,000 1,994,214John Deere Capital Corp.2.800%, 03/06/2023 1,000,000 1,003,902Covidien International2.950%, 06/15/2023 3,000,000 3,027,429Caterpillar Inc.3.400%, 05/15/2024 1,000,000 1,038,970Parker Hannifin Corp.3.300%, 11/21/2024 500,000 511,6493M Co.3.000%, 08/07/2025 1,000,000 1,012,306John Deere Capital Corp.3.400%, 09/11/2025 1,000,000 1,033,9902.650%, 06/10/2026 500,000 489,721Caterpillar Financial Services Corp.2.400%, 08/09/2026 1,000,000 956,175Bemis Company Inc.3.100%, 09/15/2026 1,000,000 965,745John Deere Capital Corp.2.800%, 09/08/2027 2,000,000 1,963,156Eaton Corp.3.103%, 09/15/2027 3,500,000 3,438,652
25,187,392
STATE FARM MUTUAL FUND TRUST BOND FUNDSCHEDULE OF INVESTMENTS (continued)
December 31, 2017
126 See accompanying notes to financial statements.

Principalamount Value
Corporate Bonds (Cont.)Media & Broadcasting (2.71%)Time Warner Inc.2.100%, 06/01/2019 $ 1,500,000 $ 1,497,098S&P Global Inc.3.300%, 08/14/2020 1,000,000 1,018,602Walt Disney Co., The2.750%, 08/16/2021 2,000,000 2,030,114Thomson Reuters Corp.3.950%, 09/30/2021 1,000,000 1,035,084Reed Elsevier Capital3.125%, 10/15/2022 2,000,000 2,015,256Thomson Reuters Corp.4.300%, 11/23/2023 1,000,000 1,055,482Time Warner Inc.3.550%, 06/01/2024 1,500,000 1,516,481Thomson Reuters Corp.3.850%, 09/29/2024 1,000,000 1,036,621Comcast Corp.3.375%, 02/15/2025 2,000,000 2,053,494S&P Global Inc.4.000%, 06/15/2025 1,500,000 1,575,632Time Warner Inc.3.600%, 07/15/2025 1,000,000 1,002,237S&P Global Inc.4.400%, 02/15/2026 1,000,000 1,083,507Thomson Reuters Corp.3.350%, 05/15/2026 1,000,000 995,240Walt Disney Co., The1.850%, 07/30/2026 500,000 457,894Comcast Corp.2.350%, 01/15/2027 500,000 472,199S&P Global Inc.2.950%, 01/22/2027 500,000 489,913Moody’s Corp.(a)3.250%, 01/15/2028 2,000,000 1,977,206Comcast Corp.3.150%, 02/15/2028 1,000,000 1,003,196
22,315,256
Mining & Metals (0.35%)Barrick NA Finance LLC4.400%, 05/30/2021 1,000,000 1,058,511Alcoa Inc.5.870%, 02/23/2022 750,000 811,875Rio Tinto Finance USA Ltd.3.750%, 06/15/2025 1,000,000 1,048,235
2,918,621
Oil & Gas (6.35%)Chevron Corp.1.718%, 06/24/2018 2,000,000 1,999,996Shell International Finance1.900%, 08/10/2018 1,500,000 1,500,230Total Capital SA2.125%, 08/10/2018 1,000,000 1,002,500Chevron Corp.4.950%, 03/03/2019 1,000,000 1,033,478
Principalamount Value
Corporate Bonds (Cont.)Oil & Gas (Cont.)Marathon Oil Corp.2.700%, 06/01/2020 $ 1,000,000 $ 1,000,140Chevron Corp.2.427%, 06/24/2020 2,000,000 2,009,780Trans-Canada Pipelines3.800%, 10/01/2020 1,000,000 1,036,855Apache Corp.3.625%, 02/01/2021 500,000 511,877Occidental Petroleum Corp.4.100%, 02/01/2021 1,000,000 1,047,337Statoil ASA2.750%, 11/10/2021 1,000,000 1,013,477Canadian Natural Resources Ltd.3.450%, 11/15/2021 1,000,000 1,022,849Apache Corp.3.250%, 04/15/2022 724,000 729,468Devon Energy Corp.3.250%, 05/15/2022 1,500,000 1,525,793Total Capital International SA2.700%, 01/25/2023 1,000,000 1,005,732Occidental Petroleum Corp.2.700%, 02/15/2023 1,000,000 1,000,620EOG Resources Inc.2.625%, 03/15/2023 2,000,000 1,977,054Total Capital Canada Ltd.2.750%, 07/15/2023 1,500,000 1,507,890Shell International Finance3.400%, 08/12/2023 500,000 519,164Trans-Canada Pipelines3.750%, 10/16/2023 1,000,000 1,044,837Total Capital International SA3.700%, 01/15/2024 1,000,000 1,054,374Exxon Mobil Corp.3.176%, 03/15/2024 1,000,000 1,031,302Canadian Natural Resources Ltd.3.800%, 04/15/2024 1,000,000 1,029,836Ensco PLC4.500%, 10/01/2024 2,000,000 1,680,000Statoil ASA3.250%, 11/10/2024 500,000 514,028ConocoPhillips Co.3.350%, 11/15/2024 1,500,000 1,544,318Suncor Energy Inc.3.600%, 12/01/2024 1,000,000 1,021,960Canadian Natural Resources Ltd.3.900%, 02/01/2025 1,000,000 1,029,555Woodside Finance Ltd.(a)3.650%, 03/05/2025 2,000,000 2,012,128Ensco PLC5.200%, 03/15/2025 500,000 425,000Shell International Finance3.250%, 05/11/2025 1,500,000 1,541,532ConocoPhillips Co.3.350%, 05/15/2025 1,000,000 1,029,966Marathon Oil Corp.3.850%, 06/01/2025 1,000,000 1,017,937
STATE FARM MUTUAL FUND TRUST BOND FUNDSCHEDULE OF INVESTMENTS (continued)
December 31, 2017
See accompanying notes to financial statements. 127

Principalamount Value
Corporate Bonds (Cont.)Oil & Gas (Cont.)Occidental Petroleum Corp.3.500%, 06/15/2025 $ 500,000 $ 517,774Florida Gas Transmission Co.(a)4.350%, 07/15/2025 1,500,000 1,602,140Devon Energy Corp.5.850%, 12/15/2025 1,000,000 1,167,675Exxon Mobil Corp.3.043%, 03/01/2026 2,000,000 2,030,886Occidental Petroleum Corp.3.400%, 04/15/2026 1,000,000 1,024,118Shell International Finance2.875%, 05/10/2026 2,000,000 2,000,016Chevron Corp.2.954%, 05/16/2026 1,500,000 1,499,514Woodside Finance Ltd.(a)3.700%, 09/15/2026 1,000,000 1,004,290Occidental Petroleum Corp.3.000%, 02/15/2027 500,000 497,076Canadian Natural Resources Ltd.3.850%, 06/01/2027 1,000,000 1,020,669Baker Hughes, a GE Co., LLC / Baker
Hughes Co-Obligor, Inc.(a)3.337%, 12/15/2027 1,000,000 998,321Woodside Finance Ltd.(a)3.700%, 03/15/2028 1,500,000 1,489,697
52,273,189
Retailers (3.87%)Home Depot Inc.2.250%, 09/10/2018 1,000,000 1,002,862CVS Caremark Corp.2.250%, 12/05/2018 1,000,000 1,001,325McDonald’s Corp.1.875%, 05/29/2019 500,000 498,009Costco Wholesale Corp.1.700%, 12/15/2019 2,000,000 1,987,170Home Depot Inc.3.950%, 09/15/2020 1,000,000 1,046,269Wal-Mart Stores Inc.3.250%, 10/25/2020 2,000,000 2,060,496TJX Companies Inc., The2.750%, 06/15/2021 1,500,000 1,521,063Lowe’s Companies Inc.3.800%, 11/15/2021 1,000,000 1,044,689Walgreens Boots Alliance Inc.3.300%, 11/18/2021 1,000,000 1,016,691Walgreen Co.3.100%, 09/15/2022 2,000,000 2,007,994CVS Caremark Corp.2.750%, 12/01/2022 1,000,000 985,083Home Depot Inc.2.700%, 04/01/2023 1,000,000 1,009,568Wal-Mart Stores Inc.2.550%, 04/11/2023 1,000,000 1,003,648Lowe’s Companies Inc.3.875%, 09/15/2023 1,000,000 1,061,344
Principalamount Value
Corporate Bonds (Cont.)Retailers (Cont.)CVS Health Corp.3.375%, 08/12/2024 $ 1,500,000 $ 1,508,088Lowe’s Companies Inc.3.125%, 09/15/2024 1,000,000 1,015,428Walgreens Boots Alliance Inc.3.800%, 11/18/2024 500,000 510,627McDonald’s Corp.3.375%, 05/26/2025 2,000,000 2,062,764CVS Health Corp.3.875%, 07/20/2025 1,000,000 1,029,869Lowe’s Companies Inc.3.375%, 09/15/2025 1,000,000 1,030,383Home Depot Inc.3.000%, 04/01/2026 1,000,000 1,001,306CVS Health Corp.2.875%, 06/01/2026 1,000,000 958,760Walgreens Boots Alliance Inc.3.450%, 06/01/2026 500,000 494,428McDonald’s Corp.3.500%, 03/01/2027 2,000,000 2,056,850Amazon.com Inc.(a)3.150%, 08/22/2027 2,000,000 2,003,014Home Depot Inc.2.800%, 09/14/2027 1,000,000 983,769
31,901,497
Telecom & Telecom Equipment (3.05%)AT&T Inc.2.375%, 11/27/2018 1,000,000 1,003,065Vodafone Group PLC5.450%, 06/10/2019 500,000 522,535Verizon Communications Inc.2.625%, 02/21/2020 630,000 635,322Cisco Systems Inc.2.450%, 06/15/2020 1,000,000 1,006,542Telefonica Emisiones SAU5.462%, 02/16/2021 1,000,000 1,081,712Vodafone Group PLC4.375%, 03/16/2021 2,000,000 2,116,358AT&T Inc.4.450%, 05/15/2021 1,000,000 1,054,791Deutsche Telekom International
Finance BV(a)1.950%, 09/19/2021 1,000,000 972,425AT&T Inc.3.000%, 02/15/2022 1,000,000 1,002,0402.625%, 12/01/2022 1,000,000 984,441Vodafone Group PLC2.950%, 02/19/2023 1,000,000 1,004,103Verizon Communications inc.5.150%, 09/15/2023 1,000,000 1,112,644AT&T Inc.3.900%, 03/11/2024 2,000,000 2,052,574Verizon Communications Inc.4.150%, 03/15/2024 1,000,000 1,051,7923.500%, 11/01/2024 1,000,000 1,017,927
STATE FARM MUTUAL FUND TRUST BOND FUNDSCHEDULE OF INVESTMENTS (continued)
December 31, 2017
128 See accompanying notes to financial statements.

Principalamount Value
Corporate Bonds (Cont.)Telecom & Telecom Equipment (Cont.)AT&T Inc.3.400%, 05/15/2025 $ 2,000,000 $ 1,966,300Cisco Systems Inc.3.500%, 06/15/2025 1,000,000 1,044,3512.950%, 02/28/2026 500,000 502,361Verizon Communications Inc.2.625%, 08/15/2026 1,500,000 1,412,834Cisco Systems Inc.2.500%, 09/20/2026 500,000 483,653Deutsche Telekom International
Finance BV(a)3.600%, 01/19/2027 1,000,000 1,004,851Verizon Communications Inc.4.125%, 03/16/2027 2,000,000 2,085,426
25,118,047
Transportation (2.03%)JB Hunt Transport Services Inc.2.400%, 03/15/2019 500,000 500,532United Parcel Service Inc.3.125%, 01/15/2021 1,500,000 1,536,921JB Hunt Transport Services Inc.3.300%, 08/15/2022 1,000,000 1,012,979Union Pacific Corp.2.750%, 04/15/2023 2,000,000 2,007,822Burlington Northern Santa Fe3.850%, 09/01/2023 2,000,000 2,114,408CSX Corp.3.700%, 11/01/2023 1,000,000 1,037,456Norfolk Southern Corp.3.850%, 01/15/2024 1,000,000 1,055,107JB Hunt Transport Services Inc.3.850%, 03/15/2024 500,000 515,800CSX Corp.3.400%, 08/01/2024 1,000,000 1,027,754Burlington Northern Santa Fe3.000%, 04/01/2025 1,000,000 1,007,697Union Pacific Corp.3.250%, 08/15/2025 500,000 513,368Canadian National Railway Co.2.750%, 03/01/2026 1,000,000 992,650Union Pacific Corp.2.750%, 03/01/2026 1,000,000 988,444FedEx Corp.3.250%, 04/01/2026 500,000 503,813Norfolk Southern Corp.2.900%, 06/15/2026 1,000,000 983,665CSX Corp.2.600%, 11/01/2026 1,000,000 954,270
16,752,686
Utilities & Energy (10.66%)Southern California Gas Co.5.450%, 04/15/2018 500,000 505,155Pacificorp5.650%, 07/15/2018 500,000 510,270
Principalamount Value
Corporate Bonds (Cont.)Utilities & Energy (Cont.)Public Service Electric and Gas Co.2.300%, 09/15/2018 $ 1,000,000 $ 1,000,797Pacific Gas & Electric8.250%, 10/15/2018 249,000 260,547MidAmerican Energy Co.2.400%, 03/15/2019 1,000,000 1,003,964Alabama Power Co.3.375%, 10/01/2020 1,000,000 1,024,756Pacific Gas & Electric3.500%, 10/01/2020 1,000,000 1,024,651Kentucky Utilities Co.3.250%, 11/01/2020 1,000,000 1,024,481Public Service Company of Colorado3.200%, 11/15/2020 1,000,000 1,021,202Appalachian Power Co.4.600%, 03/30/2021 500,000 529,630Pacific Gas & Electric3.250%, 09/15/2021 1,000,000 1,018,862Southern California Edison Co.2.400%, 02/01/2022 1,000,000 992,817Baltimore Gas & Electric Co.2.800%, 08/15/2022 500,000 501,493PPL Electric Utilities2.500%, 09/01/2022 500,000 495,821Tampa Electric Co.2.600%, 09/15/2022 500,000 493,737Connecticut Light & Power2.500%, 01/15/2023 1,000,000 991,876Indiana Michigan Power Co.3.200%, 03/15/2023 2,500,000 2,532,223Kansas City Power & Light Co.3.150%, 03/15/2023 2,000,000 2,009,128Public Service Company of Colorado2.500%, 03/15/2023 2,000,000 1,987,604Virginia Electric & Power Co.2.750%, 03/15/2023 1,500,000 1,493,021Public Service Electric and Gas Co.2.375%, 05/15/2023 1,500,000 1,474,563Florida Power & Light Co.2.750%, 06/01/2023 2,000,000 2,004,872Pacificorp2.950%, 06/01/2023 1,000,000 1,019,875Pacific Gas & Electric3.250%, 06/15/2023 2,000,000 2,019,476Baltimore Gas & Electric Co.3.350%, 07/01/2023 3,000,000 3,075,432Consumers Energy Co.3.375%, 08/15/2023 1,000,000 1,026,960Laclede Gas Co.3.400%, 08/15/2023 1,000,000 1,018,382Duke Energy Ohio Inc.3.800%, 09/01/2023 1,200,000 1,261,822San Diego Gas & Electric Co.3.600%, 09/01/2023 2,000,000 2,076,110Nabors Industries Inc.5.100%, 09/15/2023 2,000,000 1,870,000
STATE FARM MUTUAL FUND TRUST BOND FUNDSCHEDULE OF INVESTMENTS (continued)
December 31, 2017
See accompanying notes to financial statements. 129

Principalamount Value
Corporate Bonds (Cont.)Utilities & Energy (Cont.)DTE Electric Co.3.650%, 03/15/2024 $ 2,000,000 $ 2,099,146Florida Power & Light Co.3.250%, 06/01/2024 1,000,000 1,028,027Arizona Public Service Co.3.350%, 06/15/2024 500,000 511,909Pacific Gas & Electric3.400%, 08/15/2024 1,000,000 1,019,066Southern California Gas Co.3.150%, 09/15/2024 1,000,000 1,017,482Commonwealth Edison Co.3.100%, 11/01/2024 1,000,000 1,010,050Consolidated Edison Co. of New York3.300%, 12/01/2024 500,000 512,857Interstate Power & Light Co.3.250%, 12/01/2024 1,000,000 1,012,749Ameren Illinois Co.3.250%, 03/01/2025 500,000 509,589Alabama Power Co.2.800%, 04/01/2025 1,000,000 985,437Arizona Public Service Co.3.150%, 05/15/2025 500,000 503,652Public Service Company of Colorado2.900%, 05/15/2025 500,000 497,046Virginia Electric & Power Co.3.100%, 05/15/2025 1,000,000 1,007,562Appalachian Power Co.3.400%, 06/01/2025 1,000,000 1,020,348Wisconsin Electric Power3.100%, 06/01/2025 1,000,000 1,006,436Public Service Company of
New Mexico3.850%, 08/01/2025 1,500,000 1,534,757Duke Energy Progress LLC3.250%, 08/15/2025 2,000,000 2,041,624Interstate Power & Light Co.3.400%, 08/15/2025 1,000,000 1,014,923Kansas City Power & Light Co.3.650%, 08/15/2025 1,000,000 1,023,560AEP Texas Central Co.(a)3.850%, 10/01/2025 1,000,000 1,044,270Florida Power & Light Co.3.125%, 12/01/2025 1,000,000 1,016,796Jersey Central Power & Light(a)4.300%, 01/15/2026 1,000,000 1,043,632Virginia Electric & Power Co.3.150%, 01/15/2026 1,500,000 1,514,396Georgia Power Co.3.250%, 04/01/2026 1,000,000 1,002,703San Diego Gas & Electric Co.2.500%, 05/15/2026 500,000 481,759NSTAR Electric Co.2.700%, 06/01/2026 1,000,000 965,620
Principalamount Value
Corporate Bonds (Cont.)Utilities & Energy (Cont.)San Diego Gas & Electric Co.6.000%, 06/01/2026 $ 500,000 $ 600,907Commonwealth Edison Co.2.550%, 06/15/2026 1,000,000 967,053Southern California Gas Co.2.600%, 06/15/2026 1,000,000 968,694Westar Energy Inc.2.550%, 07/01/2026 1,000,000 963,674Baltimore Gas & Electric Co.2.400%, 08/15/2026 1,000,000 944,361KeySpan Gas East Corp.(a)2.742%, 08/15/2026 1,000,000 972,106CenterPoint Energy Houston
Electric LLC2.400%, 09/01/2026 1,000,000 950,863Arizona Public Service Co.2.550%, 09/15/2026 1,000,000 946,474Public Service Electric and Gas Co.2.250%, 09/15/2026 1,000,000 940,644MidAmerican Energy Co.3.100%, 05/01/2027 1,000,000 1,005,082NSTAR Electric Co.3.200%, 05/15/2027 1,500,000 1,518,167Appalachian Power Co.3.300%, 06/01/2027 1,500,000 1,504,575Rochester Gas & Electric Corp.(a)3.100%, 06/01/2027 1,000,000 989,882Atmos Energy Corp.3.000%, 06/15/2027 500,000 497,497Union Electric Co.2.950%, 06/15/2027 1,000,000 990,669Boston Gas Co.(a)3.150%, 08/01/2027 1,000,000 996,784Arizona Public Service Co.2.950%, 09/15/2027 1,000,000 984,905Wisconsin Power & Light3.050%, 10/15/2027 2,000,000 2,000,470Consolidated Edison Co. of New York3.125%, 11/15/2027 1,000,000 1,008,599Pacific Gas & Electric(a)3.300%, 12/01/2027 1,000,000 990,646Pennsylvania Electric Co.(a)3.250%, 03/15/2028 2,000,000 1,967,912Northern States Power Co.6.200%, 07/01/2037 1,000,000 1,364,761
87,769,648Total Corporate Bonds(cost $543,868,032) 549,319,128
STATE FARM MUTUAL FUND TRUST BOND FUNDSCHEDULE OF INVESTMENTS (continued)
December 31, 2017
130 See accompanying notes to financial statements.

Principalamount Value
Government Agency Securities (c) (16.53%)Agency Commercial Mortgage-Backed Securities (13.38%)Federal Home Loan Mortgage Corp.Series K020, Class A22.373%, 05/25/2022 $10,000,000 $ 9,976,719Series K025, Class A22.682%, 10/25/2022 5,000,000 5,059,190Series K724, Class A23.062%, 11/25/2023 500,000 513,194Series K725, Class A23.002%, 01/25/2024 7,000,000 7,154,903Series K055, Class A22.673%, 03/25/2026 2,000,000 1,983,722Series K060, Class A23.300%, 10/25/2026 1,500,000 1,554,153Series K061, Class A23.347%, 11/25/2026 2,000,000 2,079,580Series K062, Class A23.413%, 12/25/2026 4,000,000 4,177,484Series K063, Class A23.430%, 01/25/2027 5,000,000 5,228,300Series K064, Class A23.224%, 03/25/2027 3,500,000 3,606,740Series K068, Class A23.244%, 08/25/2027 2,000,000 2,060,246Series K069, Class A23.187%, 09/25/2027 3,000,000 3,076,281Series K071, Class A23.286%, 11/25/2027 2,000,000 2,066,048Series K070, Class A23.303%, 11/25/2027 1,000,000 1,034,395Federal National Mortgage AssociationSeries 2012-M3, Class 1A23.044%, 01/25/2022 10,000,000 10,208,500Series 2012-M5, Class A22.715%, 02/25/2022 7,000,000 7,086,555Series 2012-M9, Class A22.482%, 04/25/2022 9,132,352 9,137,914Series 2012-M13, Class A22.377%, 05/25/2022 5,000,000 4,992,210Series 2013-M3, Class A22.509%, 11/25/2022 6,000,000 6,008,826Series 2016-M13, Class A22.477%, 09/25/2026 1,000,000 972,971Series 2017-M1, Class A22.417%, 10/25/2026 3,000,000 2,900,463Series 2017-M4, Class A22.597%, 12/25/2026 6,000,000 5,879,826Series 2017-M3, Class A22.486%, 12/25/2026 5,000,000 4,858,030Series 2017-M2, Class A22.784%, 02/25/2027 2,500,000 2,488,513Series 2017-M12, Class A23.079%, 06/25/2027 4,000,000 4,067,432Series 2017-M13, Class A22.939%, 09/25/2027 2,000,000 2,013,072
110,185,267
Agency Mortgage-Backed Securities (2.88%)Federal Home Loan Mortgage Corp.5.000%, 09/01/2018 6,022 6,137
Principalamount Value
Government Agency Securities (Cont.)Agency Mortgage-Backed Securities (Cont.)5.000%, 09/01/2018 $ 3,630 $ 3,7014.500%, 11/01/2018 9,366 9,5015.500%, 11/01/2018 2,644 2,6525.000%, 01/01/2019 7,531 7,6795.000%, 04/01/2019 3,991 4,0694.500%, 05/01/2019 9,733 9,8714.000%, 05/01/2019 5,385 5,5435.500%, 06/01/2019 8,573 8,6195.000%, 01/01/2020 11,260 11,4825.500%, 04/01/2020 23,778 24,4465.500%, 07/01/2020 28,855 29,4875.000%, 05/01/2021 46,904 48,2896.000%, 07/01/2021 43,862 45,8464.500%, 05/01/2024 132,005 138,2994.500%, 05/01/2024 56,828 59,4154.500%, 09/01/2024 132,618 139,1074.000%, 10/01/2024 219,339 227,5824.000%, 01/01/2025 142,856 148,3554.000%, 07/01/2025 156,434 162,6604.500%, 08/01/2025 137,628 143,7503.500%, 04/01/2026 266,620 275,5542.500%, 02/01/2027 2,274,443 2,287,2266.000%, 11/01/2028 4,181 4,6706.500%, 06/01/2029 10,561 11,7337.500%, 12/01/2030 791 8176.500%, 09/01/2031 1,781 2,0506.000%, 11/01/2032 15,091 17,0836.000%, 12/01/2032 8,287 9,3625.500%, 05/01/2033 158,645 174,8225.500%, 07/01/2033 182,532 200,5675.000%, 08/01/2033 52,262 56,9335.500%, 03/01/2034 15,989 17,5235.000%, 04/01/2034 23,486 25,3206.000%, 07/01/2034 137,016 153,0475.500%, 05/01/2035 174,414 191,8855.000%, 05/01/2035 136,457 148,7274.500%, 08/01/2035 39,169 41,7295.000%, 10/01/2035 28,228 30,4176.500%, 08/01/2036 64,936 72,9955.500%, 10/01/2037 53,507 59,1405.500%, 11/01/2037 72,383 80,0386.000%, 01/01/2038 34,762 39,2306.000%, 01/01/2038 33,534 37,4584.500%, 06/01/2039 316,587 337,7825.000%, 06/01/2039 195,324 212,7674.500%, 10/01/2039 389,243 415,2635.000%, 10/01/2039 317,910 346,3835.000%, 01/01/2040 179,697 195,7954.500%, 02/01/2040 128,756 137,2744.000%, 07/01/2041 833,119 874,701Federal National Mortgage Association5.500%, 01/01/2018 64 645.000%, 02/01/2018 633 6455.000%, 05/01/2018 3,921 3,9925.000%, 05/01/2018 3,687 3,7534.500%, 05/01/2018 3,498 3,552
STATE FARM MUTUAL FUND TRUST BOND FUNDSCHEDULE OF INVESTMENTS (continued)
December 31, 2017
See accompanying notes to financial statements. 131

Principalamount Value
Government Agency Securities (Cont.)Agency Mortgage-Backed Securities (Cont.)4.500%, 05/01/2018 $ 2,811 $ 2,8545.000%, 05/01/2018 1,879 1,9164.500%, 03/01/2019 8,169 8,2845.500%, 10/01/2019 47,299 47,9245.000%, 11/01/2019 26,074 26,6094.500%, 12/01/2019 16,785 17,0855.000%, 06/01/2020 43,269 44,0484.500%, 09/01/2020 26,772 27,3555.500%, 05/01/2021 49,780 51,1574.500%, 04/01/2023 10,198 10,4265.000%, 01/01/2024 98,020 103,4374.500%, 04/01/2024 21,540 22,2874.000%, 06/01/2024 98,890 102,6915.000%, 10/01/2024 176,626 184,9524.500%, 11/01/2024 109,676 113,0493.500%, 12/01/2025 234,873 243,0573.000%, 12/01/2026 566,595 578,6787.500%, 09/01/2029 10,731 11,8786.500%, 05/01/2030 7,917 8,9526.500%, 08/01/2031 611 6786.500%, 10/01/2031 5,595 6,2556.000%, 11/01/2031 7,207 8,0547.000%, 01/01/2032 10,929 12,4653.000%, 02/01/2032 2,796,108 2,837,0803.000%, 02/01/2032 2,292,335 2,331,2486.000%, 03/01/2032 9,984 11,1566.500%, 03/01/2032 2,390 2,7346.500%, 04/01/2032 21,763 24,1237.000%, 04/01/2032 6,566 7,1696.500%, 05/01/2032 32,110 35,5926.000%, 05/01/2032 5,244 5,9347.000%, 06/01/2032 16,580 19,0386.500%, 06/01/2032 2,214 2,4556.500%, 07/01/2032 7,618 8,4446.000%, 08/01/2032 57,862 65,3585.500%, 10/01/2032 57,188 63,3376.500%, 10/01/2032 24,912 27,6136.000%, 11/01/2032 21,192 23,9426.000%, 01/01/2033 27,869 31,1335.500%, 03/01/2033 21,813 24,1875.500%, 03/01/2033 16,986 18,8116.000%, 04/01/2033 34,724 38,8035.000%, 05/01/2033 82,859 90,0085.000%, 05/01/2033 17,800 19,2495.000%, 08/01/2033 90,932 98,7685.500%, 10/01/2033 59,949 66,4465.000%, 03/01/2034 132,784 143,8455.500%, 05/01/2034 138,169 153,2476.000%, 07/01/2034 71,804 81,4495.500%, 12/01/2034 167,474 185,6805.500%, 04/01/2035 93,505 103,6525.000%, 07/01/2035 91,480 99,3575.500%, 07/01/2035 90,738 100,6065.000%, 10/01/2035 67,778 73,3645.000%, 11/01/2035 23,441 25,4506.000%, 08/01/2036 39,383 44,553
Principalamount Value
Government Agency Securities (Cont.)Agency Mortgage-Backed Securities (Cont.)6.000%, 12/01/2037 $ 15,545 $ 17,4055.500%, 02/01/2038 69,162 76,2115.500%, 06/01/2038 167,446 184,5584.500%, 03/01/2039 339,383 366,0244.500%, 05/01/2039 163,161 173,7915.000%, 05/01/2039 110,497 118,6585.000%, 11/01/2039 513,688 562,2174.500%, 01/01/2040 241,114 257,7264.500%, 09/01/2040 455,274 488,0183.500%, 01/01/2041 1,011,852 1,044,7994.500%, 04/01/2041 323,090 346,3385.000%, 05/01/2041 317,403 342,7544.000%, 11/01/2041 905,451 950,947Government National Mortgage Association6.500%, 06/15/2028 17,121 19,4316.000%, 11/15/2028 9,761 10,9136.500%, 03/15/2029 20,290 23,1367.000%, 06/15/2029 14,940 15,0787.500%, 08/20/2030 4,927 5,7036.000%, 01/15/2032 8,492 9,5975.500%, 10/15/2033 84,694 94,0685.000%, 11/20/2033 131,371 142,9156.000%, 12/20/2033 43,896 50,2035.500%, 11/15/2038 88,953 97,7335.000%, 09/15/2039 224,530 241,9074.500%, 10/15/2039 343,406 362,9145.000%, 12/15/2039 104,233 113,0314.000%, 09/20/2040 969,915 1,020,7874.500%, 03/20/2041 193,812 205,5665.000%, 05/20/2041 152,851 166,192
23,713,329
Agency Notes & Bonds (0.27%)Federal National Mortgage Association7.125%, 01/15/2030 500,000 720,277Tennessee Valley Authority1.750%, 10/15/2018 1,500,000 1,500,198
2,220,475Total Government Agency Securities(cost $134,886,202) 136,119,071
STATE FARM MUTUAL FUND TRUST BOND FUNDSCHEDULE OF INVESTMENTS (continued)
December 31, 2017
132 See accompanying notes to financial statements.

Principalamount Value
U.S. Treasury Obligations (13.29%)8.125%, 08/15/2019 $ 750,000 $ 824,2386.875%, 08/15/2025 5,000,000 6,582,0303.500%, 02/15/2018 9,000,000 9,023,4543.875%, 05/15/2018 2,000,000 2,017,8903.750%, 11/15/2018 17,000,000 17,285,5491.625%, 04/30/2019 5,000,000 4,984,5701.625%, 06/30/2020 5,000,000 4,963,0852.625%, 08/15/2020 5,000,000 5,087,3051.375%, 04/30/2021 5,000,000 4,891,7951.625%, 04/30/2023 3,000,000 2,908,4761.625%, 10/31/2023 2,500,000 2,413,5752.000%, 05/31/2024 5,000,000 4,906,6402.375%, 08/15/2024 10,000,000 10,032,0302.250%, 11/15/2024 5,000,000 4,974,2202.000%, 02/15/2025 10,000,000 9,775,3902.250%, 11/15/2025 10,000,000 9,912,1102.250%, 02/15/2027 6,000,000 5,921,2502.375%, 05/15/2027 3,000,000 2,991,444
Total U.S. Treasury Obligations(cost $109,971,165) 109,495,051
Shares Value
Short-term Investments (2.88%)JPMorgan U.S. Government Money
Market Fund Capital Shares,1.17%(d) 23,701,570 $ 23,701,570
Total Short-term Investments(cost $23,701,570) 23,701,570
TOTAL INVESTMENTS (99.40%)(cost $812,426,969) 818,634,820
OTHER ASSETS, NET OF LIABILITIES (0.60%) 4,925,645
NET ASSETS (100.00%) $ 823,560,465
(a) Securities exempt from registration pursuant to Rule 144A under theSecurities Act of 1933. These securities may be resold in transactionsexempt from registration, normally to qualified institutional buyers. AtDecember 31, 2017, the value of these securities amounted to $40,977,921or 4.98% of net assets.
(b) In accordance with the Trust’s valuation procedures, State Farm InvestmentManagement Corp. (“SFIMC”) determined the fair value for the securityconsidering the facts and circumstances related to the particular security.
(c) The obligations of the Government National Mortgage Association (“GinnieMae”) are backed by the full faith and credit of the U.S. Government. Theobligations of the remaining U.S. Government-sponsored entities are neitherissued nor guaranteed by the United States Treasury. On September 6,2008, the Federal Housing Finance Agency placed the Federal NationalMortgage Association (“Fannie Mae”) and the Federal Home Loan MortgageCorp. (“Freddie Mac”) into conservatorship. The United States Treasury hasput in place a set of financing agreements to help ensure that these entitiescontinue to meet their obligations to holders of bonds they have issued orguaranteed.
(d) Rate shown is the 7-day yield as of December 31, 2017.
STATE FARM MUTUAL FUND TRUST BOND FUNDSCHEDULE OF INVESTMENTS (continued)
December 31, 2017
See accompanying notes to financial statements. 133
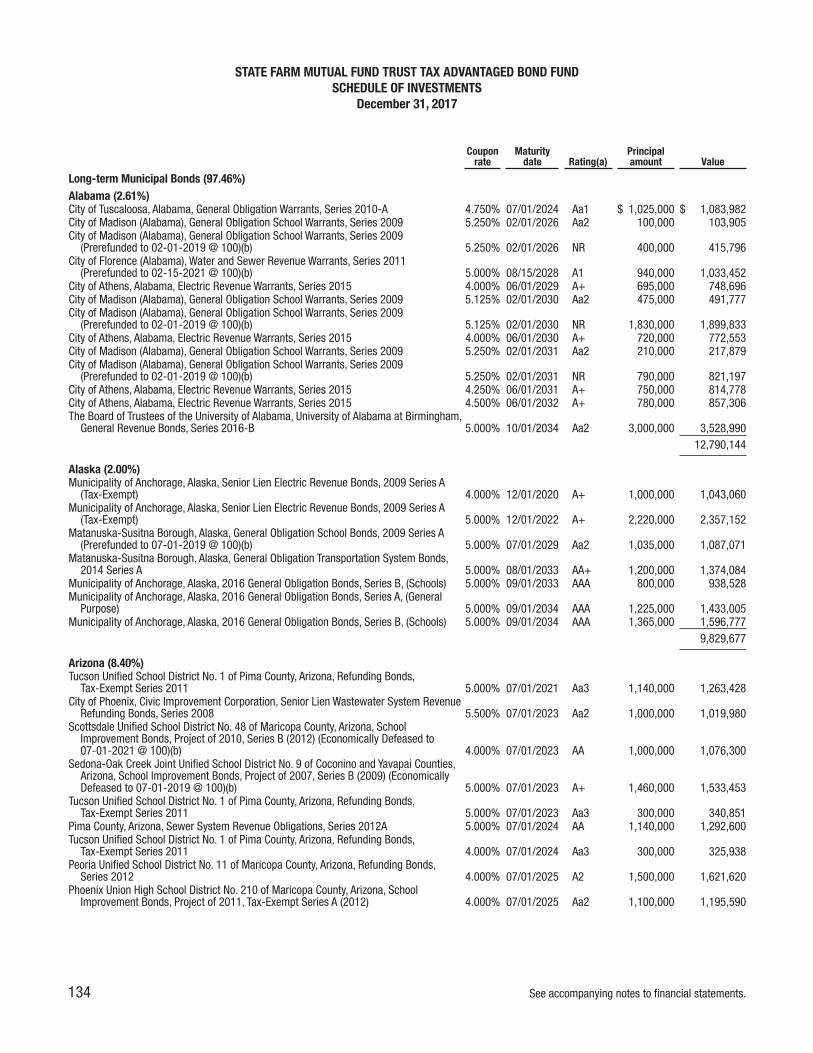
Couponrate
Maturitydate Rating(a)
Principalamount Value
Long-term Municipal Bonds (97.46%)Alabama (2.61%)City of Tuscaloosa, Alabama, General Obligation Warrants, Series 2010-A 4.750% 07/01/2024 Aa1 $ 1,025,000 $ 1,083,982City of Madison (Alabama), General Obligation School Warrants, Series 2009 5.250% 02/01/2026 Aa2 100,000 103,905City of Madison (Alabama), General Obligation School Warrants, Series 2009
(Prerefunded to 02-01-2019 @ 100)(b) 5.250% 02/01/2026 NR 400,000 415,796City of Florence (Alabama), Water and Sewer Revenue Warrants, Series 2011
(Prerefunded to 02-15-2021 @ 100)(b) 5.000% 08/15/2028 A1 940,000 1,033,452City of Athens, Alabama, Electric Revenue Warrants, Series 2015 4.000% 06/01/2029 A+ 695,000 748,696City of Madison (Alabama), General Obligation School Warrants, Series 2009 5.125% 02/01/2030 Aa2 475,000 491,777City of Madison (Alabama), General Obligation School Warrants, Series 2009
(Prerefunded to 02-01-2019 @ 100)(b) 5.125% 02/01/2030 NR 1,830,000 1,899,833City of Athens, Alabama, Electric Revenue Warrants, Series 2015 4.000% 06/01/2030 A+ 720,000 772,553City of Madison (Alabama), General Obligation School Warrants, Series 2009 5.250% 02/01/2031 Aa2 210,000 217,879City of Madison (Alabama), General Obligation School Warrants, Series 2009
(Prerefunded to 02-01-2019 @ 100)(b) 5.250% 02/01/2031 NR 790,000 821,197City of Athens, Alabama, Electric Revenue Warrants, Series 2015 4.250% 06/01/2031 A+ 750,000 814,778City of Athens, Alabama, Electric Revenue Warrants, Series 2015 4.500% 06/01/2032 A+ 780,000 857,306The Board of Trustees of the University of Alabama, University of Alabama at Birmingham,
General Revenue Bonds, Series 2016-B 5.000% 10/01/2034 Aa2 3,000,000 3,528,99012,790,144
Alaska (2.00%)Municipality of Anchorage, Alaska, Senior Lien Electric Revenue Bonds, 2009 Series A
(Tax-Exempt) 4.000% 12/01/2020 A+ 1,000,000 1,043,060Municipality of Anchorage, Alaska, Senior Lien Electric Revenue Bonds, 2009 Series A
(Tax-Exempt) 5.000% 12/01/2022 A+ 2,220,000 2,357,152Matanuska-Susitna Borough, Alaska, General Obligation School Bonds, 2009 Series A
(Prerefunded to 07-01-2019 @ 100)(b) 5.000% 07/01/2029 Aa2 1,035,000 1,087,071Matanuska-Susitna Borough, Alaska, General Obligation Transportation System Bonds,
2014 Series A 5.000% 08/01/2033 AA+ 1,200,000 1,374,084Municipality of Anchorage, Alaska, 2016 General Obligation Bonds, Series B, (Schools) 5.000% 09/01/2033 AAA 800,000 938,528Municipality of Anchorage, Alaska, 2016 General Obligation Bonds, Series A, (General
Purpose) 5.000% 09/01/2034 AAA 1,225,000 1,433,005Municipality of Anchorage, Alaska, 2016 General Obligation Bonds, Series B, (Schools) 5.000% 09/01/2034 AAA 1,365,000 1,596,777
9,829,677
Arizona (8.40%)Tucson Unified School District No. 1 of Pima County, Arizona, Refunding Bonds,
Tax-Exempt Series 2011 5.000% 07/01/2021 Aa3 1,140,000 1,263,428City of Phoenix, Civic Improvement Corporation, Senior Lien Wastewater System Revenue
Refunding Bonds, Series 2008 5.500% 07/01/2023 Aa2 1,000,000 1,019,980Scottsdale Unified School District No. 48 of Maricopa County, Arizona, School
Improvement Bonds, Project of 2010, Series B (2012) (Economically Defeased to07-01-2021 @ 100)(b) 4.000% 07/01/2023 AA 1,000,000 1,076,300
Sedona-Oak Creek Joint Unified School District No. 9 of Coconino and Yavapai Counties,Arizona, School Improvement Bonds, Project of 2007, Series B (2009) (EconomicallyDefeased to 07-01-2019 @ 100)(b) 5.000% 07/01/2023 A+ 1,460,000 1,533,453
Tucson Unified School District No. 1 of Pima County, Arizona, Refunding Bonds,Tax-Exempt Series 2011 5.000% 07/01/2023 Aa3 300,000 340,851
Pima County, Arizona, Sewer System Revenue Obligations, Series 2012A 5.000% 07/01/2024 AA 1,140,000 1,292,600Tucson Unified School District No. 1 of Pima County, Arizona, Refunding Bonds,
Tax-Exempt Series 2011 4.000% 07/01/2024 Aa3 300,000 325,938Peoria Unified School District No. 11 of Maricopa County, Arizona, Refunding Bonds,
Series 2012 4.000% 07/01/2025 A2 1,500,000 1,621,620Phoenix Union High School District No. 210 of Maricopa County, Arizona, School
Improvement Bonds, Project of 2011, Tax-Exempt Series A (2012) 4.000% 07/01/2025 Aa2 1,100,000 1,195,590
STATE FARM MUTUAL FUND TRUST TAX ADVANTAGED BOND FUNDSCHEDULE OF INVESTMENTS
December 31, 2017
134 See accompanying notes to financial statements.

Couponrate
Maturitydate Rating(a)
Principalamount Value
Long-term Municipal Bonds (Cont.)Arizona (Cont.)Pima County, Arizona, Sewer System Revenue Obligations, Series 2012A 5.000% 07/01/2025 AA $ 2,000,000 $ 2,263,120Scottsdale Unified School District No. 48 of Maricopa County, Arizona, School
Improvement Bonds, Project of 2010, Series B (2012) (Economically Defeased to07-01-2021 @ 100)(b) 4.250% 07/01/2025 AA 2,000,000 2,169,480
Phoenix Union High School District No. 210 of Maricopa County, Arizona, SchoolImprovement Bonds, Project of 2011, Tax-Exempt Series A (2012) 4.000% 07/01/2026 Aa2 500,000 540,540
Pima County, Arizona, General Obligation Bonds, Series 2012A 4.000% 07/01/2026 AA- 2,015,000 2,168,503Pima County, Arizona, Sewer System Revenue Obligations, Series 2012A 5.000% 07/01/2026 AA 1,725,000 1,950,354Amphitheater Unified School District No. 10 of Pima County, Arizona, School Improvement
Bonds, Project of 2007, Series B (2009) (Bank Qualified) (Economically Defeased to07-01-2019 @ 100)(b) 5.000% 07/01/2027 A+ 2,000,000 2,100,620
City of Phoenix, Arizona, Various Purpose General Obligation Bonds, Series 2012A 4.000% 07/01/2027 Aa1 2,000,000 2,168,420Pima County, Arizona, Sewer System Revenue Obligations, Series 2012A 5.000% 07/01/2027 AA 1,000,000 1,130,180Pinal County Community College District of Pinal County, Arizona, General Obligation
Bonds, Project of 2008, Series B (2012) 4.500% 07/01/2027 AA- 2,480,000 2,666,521Paradise Valley Unified School District No. 69 of Maricopa County, Arizona, School
Improvement Bonds, Project of 2011 Series A (2012) 4.000% 07/01/2028 Aa2 4,165,000 4,450,969Pima County, Arizona, General Obligation Bonds, Series 2013A 4.000% 07/01/2028 AA- 3,000,000 3,212,160Paradise Valley Unified School District No. 69 of Maricopa County, Arizona, School
Improvement Bonds, Project of 2011 Series A (2012) 4.000% 07/01/2029 Aa2 2,000,000 2,132,020Marana Unified School District No. 6 of Pima County, Arizona, School Improvement
Bonds, Project of 2014, Series B (2016) 4.000% 07/01/2030 A 1,450,000 1,598,016Salt River Project Agricultural Improvement and Power District, Arizona, Salt River Project
Electric System Refunding Revenue Bonds, 2016 Series A 5.000% 01/01/2034 AA 2,480,000 2,996,60941,217,272
Arkansas (3.06%)Beaver Water District of Benton and Washington Counties, Arkansas, Water Refunding
Revenue Bonds, Series 2010 4.000% 11/15/2021 AA+ 1,000,000 1,059,740Board of Trustees of the University of Arkansas, Various Facility Revenue Bonds,
(Fayetteville Campus), Refunding Series 2015A 3.000% 11/01/2023 Aa2 1,000,000 1,059,260State of Arkansas, Higher Education General Obligation Bonds, Refunding Series 2015 4.000% 06/01/2029 AA 5,605,000 6,208,659Board of Trustees of the University of Arkansas, Various Facility Revenue Bonds
(Fayetteville Campus), Series 2012B 5.000% 11/01/2029 Aa2 1,935,000 2,169,348Rogers School District No. 30 of Benton County, Arkansas Refunding Bonds 4.000% 02/01/2030 NR 1,000,000 1,038,190City of Rogers, Arkansas, Water Revenue Refunding Bonds, Series 2016 4.000% 11/01/2030 Aa2 505,000 544,769City of Little Rock, Arkansas, Sewer Refunding Revenue Bonds, Series 2015 5.000% 10/01/2033 Aa3 2,500,000 2,913,500
14,993,466
California (4.38%)Santa Barbara County, California, Santa Barbara Schools Financing Authority, 2007
General Obligation Revenue Bonds, Series B 4.750% 08/01/2024 Aa2 1,000,000 1,002,650State of California, Various Purpose General Obligation Bonds (Prerefunded to 03-01-18
@ 100)(b) 5.500% 03/01/2026 AA+ 1,300,000 1,308,788Marin Community College District, (Marin County, California), Election of 2004 General
Obligation Bonds, Series C (Prerefunded to 08-01-2021 @ 100)(b) 4.250% 08/01/2027 Aaa 1,440,000 1,571,112Atascadero Unified School District, (San Luis Obispo County, California) General
Obligation Bonds, 2010 Election, Series B 5.000% 08/01/2029 Aa3 1,395,000 1,653,605Ventura County Community College District (Ventura County, California) Election of 2002
General Obligation Bonds, Series C (Prerefunded to 08-01-2018 @ 100)(b) 5.500% 08/01/2029 Aa2 1,000,000 1,023,680Atascadero Unified School District, (San Luis Obispo County, California) General
Obligation Bonds, 2010 Election, Series B 5.000% 08/01/2030 Aa3 1,000,000 1,182,000Palomar Community College District, (San Diego County, California), 2015 General
Obligation Refunding Bonds 5.000% 05/01/2031 AA 1,500,000 1,764,990Sequoia Union High School District, (County of San Mateo, State of California), General
Obligation Bonds, Election of 2014, Series 2016 3.000% 07/01/2031 AA 2,000,000 2,033,080Atascadero Unified School District, (San Luis Obispo County, California) General
Obligation Bonds, 2010 Election, Series B 5.000% 08/01/2031 Aa3 840,000 987,790
STATE FARM MUTUAL FUND TRUST TAX ADVANTAGED BOND FUNDSCHEDULE OF INVESTMENTS (continued)
December 31, 2017
See accompanying notes to financial statements. 135

Couponrate
Maturitydate Rating(a)
Principalamount Value
Long-term Municipal Bonds (Cont.)California (Cont.)Newark Unified School District, (Alameda County, California), General Obligation Bonds,
Election of 2011, Series C 3.000% 08/01/2031 Aa3 $ 980,000 $ 993,348Santa Monica-Malibu Unified School District, (Los Angeles County, California), Election of
2012 General Obligation Bonds, Series B 5.000% 07/01/2032 AA 1,920,000 2,269,210East Side Union High School District, (Santa Clara County, California), 2015 General
Obligation Refunding Bonds 5.000% 08/01/2032 A+ 1,000,000 1,189,820East Side Union High School District, (Santa Clara County, California), 2015 General
Obligation Refunding Bonds 5.000% 08/01/2033 A+ 1,000,000 1,182,950Sonoma County Junior College District, (Sonoma, Mendocino and Marin Counties,
California), Election of 2014 General Obligation Bonds, Series A 5.000% 08/01/2034 AA- 2,780,000 3,334,88821,497,911
Colorado (2.35%)El Paso County School District No. 20 (Academy), El Paso County, Colorado, General
Obligation Refunding Bonds, Series 2012 4.000% 12/15/2022 Aa2 1,000,000 1,084,710El Paso County School District No. 20 (Academy), El Paso County, Colorado, General
Obligation Refunding Bonds, Series 2012 4.000% 12/15/2024 Aa2 1,350,000 1,452,573Jefferson County School District No. R-1, (in Jefferson and Broomfield Counties,
Colorado), General Obligation Refunding Bonds, Series 2012 3.500% 12/15/2024 Aa2 195,000 210,345Cherry Creek School District No. 5, (Arapahoe County, Colorado), General Obligation
Bonds, Series 2009 (Prerefunded to 12-15-2018 @ 100)(b) 5.000% 12/15/2025 Aa1 1,185,000 1,224,200El Paso County School District No. 20 (Academy), El Paso County, Colorado, General
Obligation Refunding Bonds, Series 2012 4.000% 12/15/2025 Aa2 1,385,000 1,481,521City and County of Denver, Colorado, Master Resolution Water Revenue Bonds,
Series 2012A 4.000% 12/15/2026 Aaa 1,230,000 1,316,678Apex Park and Recreation District, Jefferson County, Colorado, General Obligation Bonds,
Series 2016 5.000% 12/01/2033 Aa2 1,500,000 1,789,935Adams 12 Five Star Schools, Adams County and the City and County of Broomfield,
Colorado, General Obligation Bonds, Series 2016B 5.000% 12/15/2036 A+ 2,500,000 2,974,12511,534,087
Connecticut (2.62%)Town of New Canaan, Connecticut, General Obligation Refunding Bonds, Series C 4.000% 04/01/2021 Aaa 1,010,000 1,039,724Town of New Canaan, Connecticut, General Obligation Refunding Bonds, Issue of 2010,
Series A 4.000% 06/15/2023 Aaa 1,230,000 1,243,899City of Stamford, Connecticut, General Obligation Bonds, Issue of 2013 3.000% 02/01/2029 Aa1 750,000 769,103State of Connecticut Health and Educational Facilities Authority, Revenue Bonds, Yale
University Issue, Series 2016A(c) 2.000% 07/01/2042 Aaa 10,000,000 9,815,30012,868,026
Delaware (0.70%)New Castle County, Delaware, General Obligation Bonds, Series 2012B 4.000% 07/15/2026 Aaa 2,045,000 2,245,615The City of Wilmington, Delaware, General Obligation Bonds, Series of 2008A
(Prerefunded to 12-01-2018 @ 100)(b) 5.000% 12/01/2028 NR 1,120,000 1,155,538The City of Wilmington, Delaware, General Obligation Bonds, Series of 2008A
(Prerefunded to 12-01-2018 @ 100)(b) 5.000% 12/01/2028 Aa2 50,000 51,5873,452,740
Florida (3.77%)State of Florida, Department of Transportation, Turnpike Revenue Bonds, Series 2010B 5.000% 07/01/2024 Aa2 3,130,000 3,412,827City of Winter Park, Florida, Water and Sewer Refunding and Improvement Revenue
Bonds, Series 2009 (Prerefunded to 12-01-2019 @ 100)(b) 4.250% 12/01/2024 AA- 1,000,000 1,049,090Palm Beach County, Florida, Water and Sewer Revenue Refunding Bonds, Series 2013 5.000% 10/01/2029 Aaa 1,750,000 2,032,485Broward County, Florida Water and Sewer Utility Revenue Refunding Bonds, Series
2015A 5.000% 10/01/2030 Aa1 1,400,000 1,667,792Palm Beach County, Florida, Water and Sewer Revenue Refunding Bonds, Series 2013 5.000% 10/01/2030 Aaa 1,960,000 2,270,621
STATE FARM MUTUAL FUND TRUST TAX ADVANTAGED BOND FUNDSCHEDULE OF INVESTMENTS (continued)
December 31, 2017
136 See accompanying notes to financial statements.

Couponrate
Maturitydate Rating(a)
Principalamount Value
Long-term Municipal Bonds (Cont.)Florida (Cont.)City of Pembroke Pines, Florida, General Obligation Bonds, Series 2015 5.000% 09/01/2032 Aa2 $ 2,500,000 $ 2,919,925Central Florida Expressway Authority, Senior Lien Refunding Revenue Bonds, Series
2016B 5.000% 07/01/2033 A1 2,500,000 2,969,350City of Riviera Beach (Florida), Utility Special District, Water and Sewer Revenue Bonds,
Series 2016 5.000% 10/01/2033 A+ 1,845,000 2,160,93818,483,028
Georgia (0.66%)Fulton County, Georgia, Water and Sewerage Revenue Refunding Bonds, Series 2011 5.000% 01/01/2025 Aa2 2,000,000 2,188,200Spalding County Water and Sewerage Facilities Authority (Georgia), Revenue Bonds,
Series 2008 (Prerefunded to 09-01-2018 @ 100)(b) 6.125% 09/01/2028 A1 1,000,000 1,030,5603,218,760
Hawaii (0.43%)State of Hawaii, Highway Revenue Bonds, Series 2008 (Prerefunded to 01-01-2019 @
100)(b) 6.000% 01/01/2029 Aa2 2,000,000 2,089,120
Idaho (0.80%)School District No. 271 (Coeur d’Alene), Kootenai County, State of Idaho, General
Obligation Bonds, Series 2012B 4.000% 09/15/2022 Aa2 2,280,000 2,510,440Bonneville County, State of Idaho, School District No. 91 (Idaho Falls), General Obligation
Bonds, Series 2012A 5.000% 09/15/2028 Aa3 1,220,000 1,388,6533,899,093
Indiana (2.20%)City of Fort Wayne, Indiana, Sewage Works Revenue Bonds of 2010 4.500% 08/01/2025 A1 1,000,000 1,064,310Hamilton Southeastern Consolidated School Building Corporation, Hamilton County,
Indiana, Unlimited Ad Valorem Property Tax First Mortgage Bonds, Series 2015F 5.000% 07/15/2031 AA- 1,735,000 2,028,545Indiana Housing and Community Development Authority, Single Family Mortgage
Revenue Bonds, 2008 Series A 6.250% 07/01/2033 Aaa 30,000 30,627Perry Township Multischool Building Corporation of 1996, Indianapolis, Indiana,
Unlimited Ad Valorem Property Tax First Mortgage Bonds, Series 2016 5.000% 07/15/2033 A+ 1,890,000 2,220,901New Albany-Floyd County School Building Corporation, Ad Valorem Property Tax First
Mortgage Bonds, Series 2017, (Floyd County, Indiana) 5.000% 07/15/2034 A+ 2,920,000 3,440,840Valparaiso Multi-Schools Building Corporation, (Porter County, Indiana), Unlimited Ad
Valorem Property Tax First Mortgage Bonds, Series 2015 5.000% 07/15/2034 AA- 1,720,000 1,983,83110,769,054
Iowa (1.77%)City of Des Moines, Iowa, General Obligation Refunding Bonds, Series 2010B,
(Urban Renewal) 4.000% 06/01/2021 Aa2 350,000 353,479Board of Regents, State of Iowa, Academic Building Revenue Bonds, Series S.U.I. 2012
(The State University of Iowa) 3.000% 07/01/2022 AA 1,510,000 1,587,901City of Des Moines, Iowa, General Obligation Refunding Bonds, Series 2010B,
(Urban Renewal) 4.000% 06/01/2023 Aa2 1,410,000 1,422,563City of Des Moines, Iowa, General Obligation Bonds, Series 2016A 2.375% 06/01/2030 Aa2 1,825,000 1,764,666Des Moines Metropolitan, Wastewater Reclamation Authority, Sewer Revenue Refunding
Bonds, Series 2013B 4.000% 06/01/2030 Aa3 3,400,000 3,555,4828,684,091
Kansas (2.01%)Unified School District No. 512, Johnson County, Kansas, (Shawnee Mission), General
Obligation Refunding and Improvement Bonds, Series 2015-A 5.000% 10/01/2031 Aaa 2,630,000 3,166,178Unified School District No. 233, Johnson County, Kansas (Olathe), General Obligation
School Bonds, Series 2016A 4.000% 09/01/2032 Aa2 2,500,000 2,727,125Unified School District No. 233, Johnson County, Kansas (Olathe), General Obligation
School Bonds, Series 2016A 4.000% 09/01/2033 Aa2 2,500,000 2,722,325
STATE FARM MUTUAL FUND TRUST TAX ADVANTAGED BOND FUNDSCHEDULE OF INVESTMENTS (continued)
December 31, 2017
See accompanying notes to financial statements. 137

Couponrate
Maturitydate Rating(a)
Principalamount Value
Long-term Municipal Bonds (Cont.)Kansas (Cont.)Unified School District No. 497, Douglas County, Kansas, (Lawrence), General Obligation
Refunding and Improvement Bonds, Series 2016-A 5.000% 09/01/2035 Aa2 $ 1,065,000 $ 1,238,7559,854,383
Kentucky (0.27%)Northern Kentucky Water District Revenue Bonds, 2013 Series A 4.125% 02/01/2031 Aa3 1,255,000 1,340,968
Louisiana (0.03%)Parish-Wide School District of Ascension Parish, Louisiana, General Obligation School
Bonds, Series 2013 3.000% 03/01/2025 AA 160,000 167,245
Maryland (0.99%)Howard County, Maryland, Consolidated Public Improvement Bonds, 2012 Series A
(Prerefunded to 02-15-2020 @100)(b) 4.000% 02/15/2023 Aaa 1,845,000 1,936,383Howard County, Maryland, Metropolitan District Bonds, 2012 Series A (Prerefunded to
02-15-2020 @ 100)(b) 4.000% 02/15/2032 Aaa 2,790,000 2,928,1894,864,572
Massachusetts (1.06%)Town of Carlisle, Massachusetts, General Obligation Municipal Purpose Loan of 2012
Bonds, Unlimited Tax 3.000% 11/15/2025 Aa1 465,000 481,043Town of Carlisle, Massachusetts, General Obligation Municipal Purpose Loan of 2012
Bonds, Unlimited Tax 3.000% 11/15/2026 Aa1 215,000 221,869Town of Carlisle, Massachusetts, General Obligation Municipal Purpose Loan of 2012
Bonds, Unlimited Tax 3.000% 11/15/2027 Aa1 190,000 195,641Town of Georgetown, Massachusetts, General Obligation School Bonds 4.000% 05/01/2031 Aa2 900,000 969,597The Commonwealth of Massachusetts, General Obligation Bonds, Consolidated Loan of
2014, Series A 5.000% 12/01/2034 AA 1,000,000 1,121,520The Commonwealth of Massachusetts, Commonwealth Transportation Fund Revenue
Bonds, (Accelerated Bridge Program), 2013 Series A (Prerefunded to 06-01-2021 @100)(b) 5.000% 06/01/2035 Aa1 2,000,000 2,211,500
5,201,170
Michigan (5.52%)Traverse City Area Public Schools, Counties of Grand Traverse, Leelanau and Benzie,
State of Michigan, 2010 School Building and Site Bonds(General Obligation - Unlimited Tax) 3.500% 05/01/2020 AA- 150,000 155,715
City of Petoskey, County of Emmet, State of Michigan, Water Supply and SewageDisposal System Revenue and Revenue Refunding Bonds, Series 2011 5.000% 02/01/2023 AA- 720,000 781,906
City of Petoskey, County of Emmet, State of Michigan, Water Supply and SewageDisposal System Revenue and Revenue Refunding Bonds, Series 2011 5.000% 02/01/2024 AA- 225,000 243,785
East Grand Rapids Public Schools, County of Kent, State of Michigan, 2012 RefundingBonds, (General Obligation - Unlimited Tax) 4.000% 05/01/2024 A+ 1,625,000 1,699,653
Howell Public Schools, County of Livingston, State of Michigan, 2012 Refunding Bonds,(General Obligation - Unlimited Tax) 4.250% 05/01/2025 A+ 2,760,000 2,989,908
East Grand Rapids Public Schools, County of Kent, State of Michigan, 2012 RefundingBonds, (General Obligation - Unlimited Tax) 4.000% 05/01/2027 A+ 1,600,000 1,672,016
Plymouth-Canton Community Schools, Counties of Wayne and Washtenaw, State ofMichigan, 2012 Refunding Bonds, Series A, (General Obligation - Unlimited Tax) 4.000% 05/01/2027 Aa3 4,240,000 4,576,995
Birmingham Public Schools, County of Oakland, State of Michigan, 2013 RefundingBonds, (General Obligation - Unlimited Tax) 4.000% 05/01/2029 AA+ 3,545,000 3,832,535
East Grand Rapids Public Schools, County of Kent, State of Michigan, 2014 RefundingBonds, Series A 5.000% 05/01/2029 A+ 1,000,000 1,161,320
East Grand Rapids Public Schools, County of Kent, State of Michigan, 2014 RefundingBonds, Series A 5.000% 05/01/2030 A+ 750,000 868,118
Hamilton Community Schools, County of Allegan, State of Michigan, 2015 RefundingBonds, (General Obligation - Unlimited Tax) 5.000% 05/01/2030 AA- 885,000 1,036,795
STATE FARM MUTUAL FUND TRUST TAX ADVANTAGED BOND FUNDSCHEDULE OF INVESTMENTS (continued)
December 31, 2017
138 See accompanying notes to financial statements.
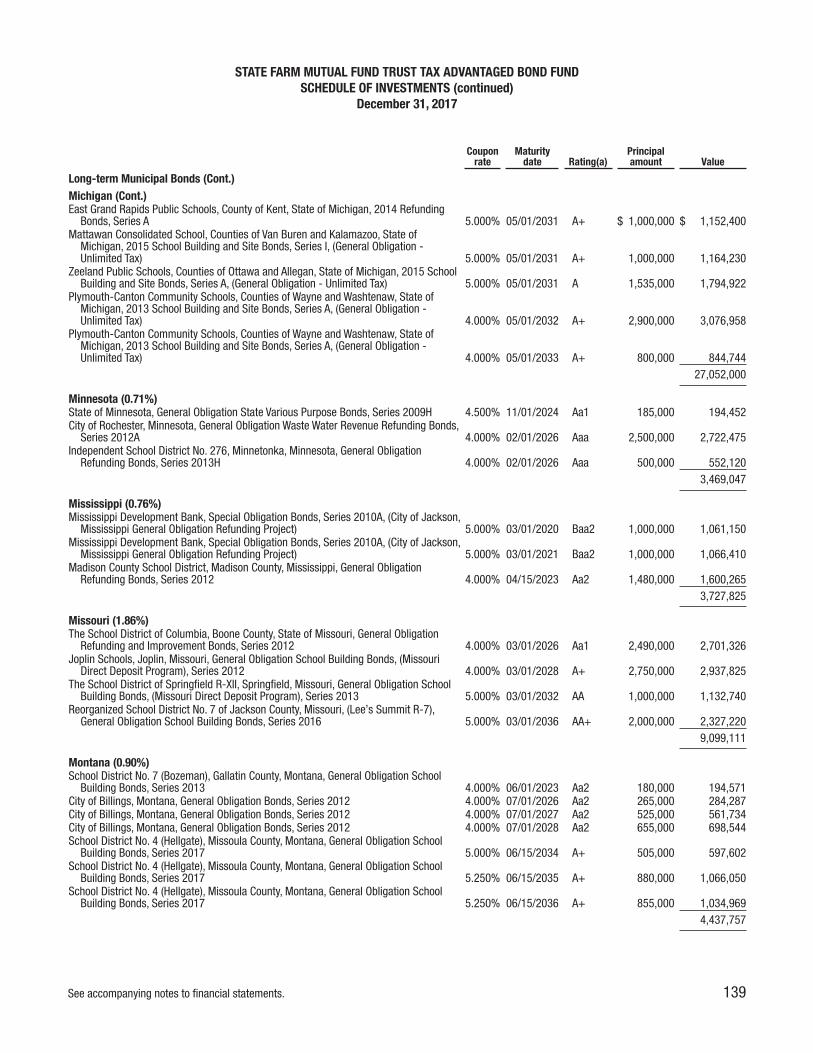
Couponrate
Maturitydate Rating(a)
Principalamount Value
Long-term Municipal Bonds (Cont.)Michigan (Cont.)East Grand Rapids Public Schools, County of Kent, State of Michigan, 2014 Refunding
Bonds, Series A 5.000% 05/01/2031 A+ $ 1,000,000 $ 1,152,400Mattawan Consolidated School, Counties of Van Buren and Kalamazoo, State of
Michigan, 2015 School Building and Site Bonds, Series I, (General Obligation -Unlimited Tax) 5.000% 05/01/2031 A+ 1,000,000 1,164,230
Zeeland Public Schools, Counties of Ottawa and Allegan, State of Michigan, 2015 SchoolBuilding and Site Bonds, Series A, (General Obligation - Unlimited Tax) 5.000% 05/01/2031 A 1,535,000 1,794,922
Plymouth-Canton Community Schools, Counties of Wayne and Washtenaw, State ofMichigan, 2013 School Building and Site Bonds, Series A, (General Obligation -Unlimited Tax) 4.000% 05/01/2032 A+ 2,900,000 3,076,958
Plymouth-Canton Community Schools, Counties of Wayne and Washtenaw, State ofMichigan, 2013 School Building and Site Bonds, Series A, (General Obligation -Unlimited Tax) 4.000% 05/01/2033 A+ 800,000 844,744
27,052,000
Minnesota (0.71%)State of Minnesota, General Obligation State Various Purpose Bonds, Series 2009H 4.500% 11/01/2024 Aa1 185,000 194,452City of Rochester, Minnesota, General Obligation Waste Water Revenue Refunding Bonds,
Series 2012A 4.000% 02/01/2026 Aaa 2,500,000 2,722,475Independent School District No. 276, Minnetonka, Minnesota, General Obligation
Refunding Bonds, Series 2013H 4.000% 02/01/2026 Aaa 500,000 552,1203,469,047
Mississippi (0.76%)Mississippi Development Bank, Special Obligation Bonds, Series 2010A, (City of Jackson,
Mississippi General Obligation Refunding Project) 5.000% 03/01/2020 Baa2 1,000,000 1,061,150Mississippi Development Bank, Special Obligation Bonds, Series 2010A, (City of Jackson,
Mississippi General Obligation Refunding Project) 5.000% 03/01/2021 Baa2 1,000,000 1,066,410Madison County School District, Madison County, Mississippi, General Obligation
Refunding Bonds, Series 2012 4.000% 04/15/2023 Aa2 1,480,000 1,600,2653,727,825
Missouri (1.86%)The School District of Columbia, Boone County, State of Missouri, General Obligation
Refunding and Improvement Bonds, Series 2012 4.000% 03/01/2026 Aa1 2,490,000 2,701,326Joplin Schools, Joplin, Missouri, General Obligation School Building Bonds, (Missouri
Direct Deposit Program), Series 2012 4.000% 03/01/2028 A+ 2,750,000 2,937,825The School District of Springfield R-XII, Springfield, Missouri, General Obligation School
Building Bonds, (Missouri Direct Deposit Program), Series 2013 5.000% 03/01/2032 AA 1,000,000 1,132,740Reorganized School District No. 7 of Jackson County, Missouri, (Lee’s Summit R-7),
General Obligation School Building Bonds, Series 2016 5.000% 03/01/2036 AA+ 2,000,000 2,327,2209,099,111
Montana (0.90%)School District No. 7 (Bozeman), Gallatin County, Montana, General Obligation School
Building Bonds, Series 2013 4.000% 06/01/2023 Aa2 180,000 194,571City of Billings, Montana, General Obligation Bonds, Series 2012 4.000% 07/01/2026 Aa2 265,000 284,287City of Billings, Montana, General Obligation Bonds, Series 2012 4.000% 07/01/2027 Aa2 525,000 561,734City of Billings, Montana, General Obligation Bonds, Series 2012 4.000% 07/01/2028 Aa2 655,000 698,544School District No. 4 (Hellgate), Missoula County, Montana, General Obligation School
Building Bonds, Series 2017 5.000% 06/15/2034 A+ 505,000 597,602School District No. 4 (Hellgate), Missoula County, Montana, General Obligation School
Building Bonds, Series 2017 5.250% 06/15/2035 A+ 880,000 1,066,050School District No. 4 (Hellgate), Missoula County, Montana, General Obligation School
Building Bonds, Series 2017 5.250% 06/15/2036 A+ 855,000 1,034,9694,437,757
STATE FARM MUTUAL FUND TRUST TAX ADVANTAGED BOND FUNDSCHEDULE OF INVESTMENTS (continued)
December 31, 2017
See accompanying notes to financial statements. 139

Couponrate
Maturitydate Rating(a)
Principalamount Value
Long-term Municipal Bonds (Cont.)Nebraska (2.49%)Douglas County School District 0010, (Elkhorn Public Schools), General Obligation
Refunding Bonds, Series 2011 4.000% 12/15/2021 AA- $ 1,140,000 $ 1,235,201Douglas County School District 0010, (Elkhorn Public Schools), General Obligation
Refunding Bonds, Series 2011 5.000% 12/15/2027 AA- 1,850,000 2,059,013Omaha Public Power District (Nebraska) Electric System Revenue Bonds, 2008 Series A
(Prerefunded to 02-01-2018 @ 100)(b) 5.500% 02/01/2028 Aa2 1,500,000 1,504,755Douglas County School District 0010, (Elkhorn Public Schools), General Obligation Bonds,
Series 2012B 4.000% 01/15/2030 AA- 1,930,000 2,076,526Sarpy County School District 0037, In the State of Nebraska, (Gretna Public Schools),
General Obligation School Building and Refunding Bonds, Series 2015 5.000% 12/15/2031 A+ 725,000 860,104Hall County School District 0002, In the State of Nebraska, (Grand Island Public Schools),
General Obligation Bonds, Series 2014 5.000% 12/15/2032 AA- 2,000,000 2,338,000Sarpy County School District 0037, In the State of Nebraska, (Gretna Public Schools),
General Obligation School Building and Refunding Bonds, Series 2015 5.000% 12/15/2032 A+ 850,000 1,004,352Sarpy County School District 0037, In the State of Nebraska, (Gretna Public Schools),
General Obligation School Building and Refunding Bonds, Series 2015 5.000% 12/15/2033 A+ 970,000 1,143,84312,221,794
New Jersey (3.71%)The Board of Education of the Township of South Brunswick in the County of Middlesex,
New Jersey, Refunding School Bonds 3.000% 12/01/2021 AA+ 80,000 83,424Middlesex County Improvement Authority, (County of Middlesex, State of New Jersey),
County-Guaranteed Open Space Trust Fund Revenue Bonds, Series 2009A 4.000% 12/15/2021 Aa2 1,205,000 1,258,876The Board of Education of the Warren Hills Regional School District in the County of
Warren, New Jersey, Refunding School Bonds, Series 2012 4.000% 02/15/2024 AA 1,390,000 1,495,890The Board of Education of the Township of North Brunswick in the County of Middlesex,
New Jersey, Refunding School Bonds 4.250% 01/15/2025 AA 2,200,000 2,371,380Township of Parsippany-Troy Hills, In the County of Morris, New Jersey, General
Obligation Refunding Bonds, Series 2012 4.000% 07/15/2025 AA 1,390,000 1,515,573The Board of Education of the Warren Hills Regional School District in the County of
Warren, New Jersey, Refunding School Bonds, Series 2012 4.000% 02/15/2026 AA 1,485,000 1,593,865The Board of Education of the Township of Bernards in the County of Somerset, New
Jersey, Refunding School Bonds, Series 2013 4.000% 07/15/2026 AAA 850,000 945,693Refunding School Bonds, Series 2012 B, The Board of Education of the Borough of
Madison, in the County of Morris, New Jersey 4.000% 12/15/2026 AA+ 1,440,000 1,570,104The Board of Education of the Somerset Hills School District in the County of Somerset,
New Jersey, Refunding School Bonds, Series 2012 4.000% 03/15/2027 Aa1 1,110,000 1,198,978The Board of Education of the Township of Wyckoff in the County of Bergen, New Jersey,
Refunding School Bonds 4.000% 04/01/2027 AA+ 1,415,000 1,552,241The Board of Education of the Township of Bernards in the County of Somerset, New
Jersey, Refunding School Bonds, Series 2013 4.000% 07/15/2027 AAA 630,000 698,128Refunding School Bonds, Series 2012 B, The Board of Education of the Borough of
Madison, in the County of Morris, New Jersey 4.000% 12/15/2027 AA+ 1,495,000 1,626,396The Board of Education of the Somerset Hills School District in the County of Somerset,
New Jersey, Refunding School Bonds, Series 2012 4.000% 03/15/2028 Aa1 920,000 992,588The Board of Education of the Township of Livingston, In the County of Essex, New
Jersey, Refunding School Bonds 4.500% 07/15/2033 AA+ 1,160,000 1,303,14418,206,280
New Mexico (1.49%)Santa Fe Public School District, Santa Fe County, New Mexico, General Obligation Bonds,
Series 2012 3.000% 08/01/2022 Aa2 1,750,000 1,835,575Las Cruces School District No. 2, General Obligation School Building Bonds, Series 2011A 4.000% 08/01/2023 Aa3 1,700,000 1,797,750City of Albuquerque, New Mexico, General Obligation General Purpose Bonds,
Series 2012A 4.000% 07/01/2024 Aa1 2,500,000 2,632,950Albuquerque Bernalillo County Water Utility Authority, Joint Water and Sewer System
Improvement Revenue Bonds, Series 2008A (Prerefunded to 07-01-2018 @ 100)(b) 5.000% 07/01/2030 Aa2 1,000,000 1,017,7307,284,005
STATE FARM MUTUAL FUND TRUST TAX ADVANTAGED BOND FUNDSCHEDULE OF INVESTMENTS (continued)
December 31, 2017
140 See accompanying notes to financial statements.

Couponrate
Maturitydate Rating(a)
Principalamount Value
Long-term Municipal Bonds (Cont.)New York (1.67%)East Hampton Union Free School District, Suffolk County, New York, School District Serial
Bonds - 2009 4.000% 06/15/2022 Aaa $ 1,285,000 $ 1,331,093Miller Place Union Free School District in the Town of Brookhaven, Suffolk County, New
York, School District Serial Bonds - 2010 4.000% 02/15/2025 Aa2 685,000 686,685County of Suffolk, New York, Public Improvement Serial Bonds - 2008 Series B 5.000% 11/01/2027 A3 1,000,000 1,031,530The Port Authority of New York and New Jersey Consolidated Bonds, One Hundred
Fifty-Third Series 4.750% 07/15/2030 Aa3 1,000,000 1,017,360The Port Authority of New York and New Jersey Consolidated Bonds, One Hundred
Seventy-Ninth Series 5.000% 12/01/2032 Aa3 1,000,000 1,158,590New York City, Municipal Water Finance Authority, Water and Sewer System Second
General Resolution Revenue Bonds, Fiscal 2014 Series DD 5.000% 06/15/2035 Aa1 2,500,000 2,945,0758,170,333
North Carolina (3.05%)City of Fayetteville, North Carolina, Public Works Commission, Revenue Refunding Bonds,
Series 2009A 5.000% 03/01/2024 Aa2 1,355,000 1,407,601County of Wake, North Carolina, General Obligation Public Improvement Bonds,
Series 2011 4.000% 04/01/2024 Aaa 2,000,000 2,132,800City of Charlotte, North Carolina, General Obligation Refunding Bonds, Series 2009B 4.000% 06/01/2024 Aaa 1,265,000 1,305,025State of North Carolina, General Obligation Public Improvement Bonds, Series 2010A
(Prerefunded to 05-01-2020 @ 100)(b) 4.000% 05/01/2026 Aaa 1,000,000 1,051,320City of Charlotte, North Carolina, Water and Sewer System Revenue Bonds, Series 2009B 4.250% 07/01/2026 Aaa 1,500,000 1,589,625City of Raleigh, North Carolina, General Obligation Public Improvement Bonds,
Series 2012B (Prerefunded to 04-01-2022 @ 100)(b) 4.000% 04/01/2027 Aaa 4,000,000 4,361,400City of Charlotte, North Carolina, Water and Sewer System Revenue Bonds, Series 2009B 5.000% 07/01/2027 Aaa 1,500,000 1,620,780City of Durham, North Carolina, General Obligation Bonds, Series 2012A 3.000% 07/01/2028 Aaa 455,000 471,089City of Charlotte, North Carolina, Water and Sewer System Revenue Bonds, Series 2008 5.000% 07/01/2038 Aaa 1,000,000 1,017,530
14,957,170
North Dakota (0.28%)West Fargo Public School District No. 6, Cass County, North Dakota, General Obligation
School Building Bonds, Series 2011 4.000% 05/01/2026 Aa3 1,300,000 1,375,088
Ohio (2.80%)Columbus City School District, Franklin County, Ohio, School Facilities Construction and
Improvement Bonds, Series 2009-B (General Obligation - Unlimited Tax) (Prerefundedto 12-01-2019 @ 100)(b) 5.000% 12/01/2023 Aa2 1,000,000 1,061,200
South-Western City School District, Franklin and Pickaway Counties, Ohio, SchoolFacilities Construction and Improvement Bonds, Series 2012 (General Obligation -Unlimited Tax) 4.000% 12/01/2025 AA- 1,315,000 1,435,375
Miami University, (A State University of Ohio), General Receipts Revenue and RefundingBonds, Series 2011 5.000% 09/01/2026 Aa3 1,000,000 1,107,240
City of Columbus, Ohio, General Obligation Bonds, Various Purpose Unlimited Tax Bonds,Series 2012A (Prerefunded to 08-15-2022 @ 100)(b) 4.000% 02/15/2027 Aaa 1,500,000 1,646,940
Plain Local School District (Stark County), Ohio, General Obligation (Unlimited Tax), SchoolImprovement Refunding Bonds, Series 2011A 4.500% 11/01/2027 AA- 2,000,000 2,158,000
City of Cincinnati, Ohio, Water System Revenue Bonds, Series 2012A (Prerefunded to12-01-2021 @ 100)(b) 4.000% 12/01/2028 Aaa 520,000 563,831
City of North Ridgeville, Ohio, General Obligation, Fire Station Bonds, Series 2016,(Unlimited Tax) 4.000% 12/01/2028 Aa1 700,000 764,435
Olentangy Local School District, Delaware and Franklin Counties, Ohio, Refunding Bonds,Series 2013B, (Tax-Exempt), (General Obligation-Unlimited Tax) 4.000% 12/01/2028 Aa1 1,870,000 2,038,599
Olentangy Local School District, Delaware and Franklin Counties, Ohio, Refunding Bonds,Series 2013B, (Tax-Exempt), (General Obligation-Unlimited Tax) 4.000% 12/01/2029 Aa1 1,680,000 1,829,822
Fairfield City School District, County of Butler, Ohio, School Improvement Unlimited Tax,General Obligation Bonds, Series 2014 5.000% 11/01/2031 Aa3 960,000 1,107,379
13,712,821
STATE FARM MUTUAL FUND TRUST TAX ADVANTAGED BOND FUNDSCHEDULE OF INVESTMENTS (continued)
December 31, 2017
See accompanying notes to financial statements. 141

Couponrate
Maturitydate Rating(a)
Principalamount Value
Long-term Municipal Bonds (Cont.)Oklahoma (1.25%)City of Tulsa, Oklahoma, General Obligation Bonds, Series 2013 4.000% 03/01/2023 AA $ 2,500,000 $ 2,613,850Oklahoma Turnpike Authority, Oklahoma Turnpike System, Second Senior Revenue
Bonds, Series 2011B (Prerefunded to 01-01-2021 @ 100)(b) 5.000% 01/01/2026 Aa3 1,000,000 1,095,640City of Oklahoma City, Oklahoma, General Obligation Bonds, Series 2008 (Prerefunded to
03-01-2018 @ 100)(b) 5.000% 03/01/2027 Aaa 400,000 402,332Oklahoma Turnpike Authority, Oklahoma Turnpike System, Second Senior Revenue
Bonds, Series 2011B (Prerefunded to 01-01-2021 @ 100)(b) 5.000% 01/01/2028 Aa3 770,000 843,643Grand River Dam Authority, Revenue Bonds, Series 2014A 5.000% 06/01/2031 A1 1,000,000 1,173,740
6,129,205
Oregon (3.24%)City of Portland, Oregon, First Lien Water System Revenue and Refunding Bonds, 2010
Series A (Tax Exempt) 4.000% 05/01/2021 Aaa 1,070,000 1,127,427City of Portland, Oregon, Second Lien Sewer System Revenue and Refunding Bonds,
2008 Series B (Prerefunded to 06-15-2018 @ 100)(b) 5.000% 06/15/2022 Aa3 1,825,000 1,854,510City of Portland, Oregon, Second Lien Sewer System Revenue and Refunding Bonds,
2008 Series B (Prerefunded to 06-15-2018 @ 100)(b) 5.000% 06/15/2023 Aa3 1,375,000 1,397,234City of Portland, Oregon, First Lien Water System Revenue Bonds, 2011 Series A 4.000% 05/01/2024 Aaa 1,500,000 1,605,600State of Oregon, State Board of Higher Education, General Obligation Bonds, 2009
Series A (Prerefunded to 08-01-2018 @ 100)(b) 5.750% 08/01/2024 Aa1 575,000 589,168North Clackamas School District No. 12, Clackamas County, Oregon, General Obligation
Refunding Bonds, Series 2014 5.000% 06/15/2029 A+ 3,585,000 4,201,979Oregon Trail School District No. 46, Clackamas County, Oregon, General Obligation
Bonds, Series 2009 (Prerefunded 06-15-2019 @100)(b) 5.000% 06/15/2029 AA- 1,000,000 1,048,970State of Oregon, State Board of Higher Education, General Obligation Bonds, 2009
Series A (Prerefunded to 08-01-2018 @ 100)(b) 5.750% 08/01/2029 Aa1 940,000 963,162Central Lincoln People’s Utility District, Oregon, Electric System Revenue Bonds, Series
2016 5.000% 12/01/2033 AA- 400,000 468,236Central Lincoln People’s Utility District, Oregon, Electric System Revenue Bonds, Series
2016 5.000% 12/01/2034 AA- 400,000 467,304Central Lincoln People’s Utility District, Oregon, Electric System Revenue Bonds, Series
2016 5.000% 12/01/2035 AA- 415,000 483,861State of Oregon, General Obligation Bonds, 2012 Series I, (ODOT Project - Tax-Exempt) 5.000% 05/01/2037 Aa1 1,500,000 1,673,085
15,880,536
Pennsylvania (3.43%)County of Berks, Pennsylvania, General Obligation Bonds, Series of 2013 5.000% 11/15/2025 Aa1 860,000 935,276Township of Cranberry, Butler County, Pennsylvania, General Obligation Bonds,
Series of 2011 4.500% 03/01/2026 Aaa 2,575,000 2,769,541County of Chester, Commonwealth of Pennsylvania, General Obligation Bonds,
Series of 2011 4.000% 11/15/2026 Aaa 1,465,000 1,592,279County of Berks, Pennsylvania, General Obligation Bonds, Series of 2013 5.000% 11/15/2027 Aa1 950,000 1,032,603County of Berks, Pennsylvania, General Obligation Bonds, Series of 2013 5.000% 11/15/2028 Aa1 995,000 1,080,063Township of Hampden, (Cumberland County, Pennsylvania), General Obligation Bonds,
Series of 2012 5.000% 05/15/2029 AA 980,000 1,066,358Township of Hampden, (Cumberland County, Pennsylvania), General Obligation Bonds,
Series of 2012 (Prerefunded to 11-15-2020 @ 100)(b) 5.000% 05/15/2029 NR 200,000 218,152County of Northampton, Commonwealth of Pennsylvania, General Obligation Bonds,
Series B of 2012 (Tax-Exempt) 5.000% 10/01/2030 AA 1,500,000 1,691,070Township of Hampden, (Cumberland County, Pennsylvania), General Obligation Bonds,
Series of 2012 5.000% 05/15/2031 AA 870,000 945,133Township of Hampden, (Cumberland County, Pennsylvania), General Obligation Bonds,
Series of 2012 (Prerefunded to 11-15-2020 @ 100)(b) 5.000% 05/15/2031 NR 185,000 201,791The Municipal Authority of the Borough of West View, (Allegheny County, Pennsylvania),
Water Revenue Bonds, Series of 2014 5.000% 11/15/2031 AA 1,000,000 1,181,710
STATE FARM MUTUAL FUND TRUST TAX ADVANTAGED BOND FUNDSCHEDULE OF INVESTMENTS (continued)
December 31, 2017
142 See accompanying notes to financial statements.
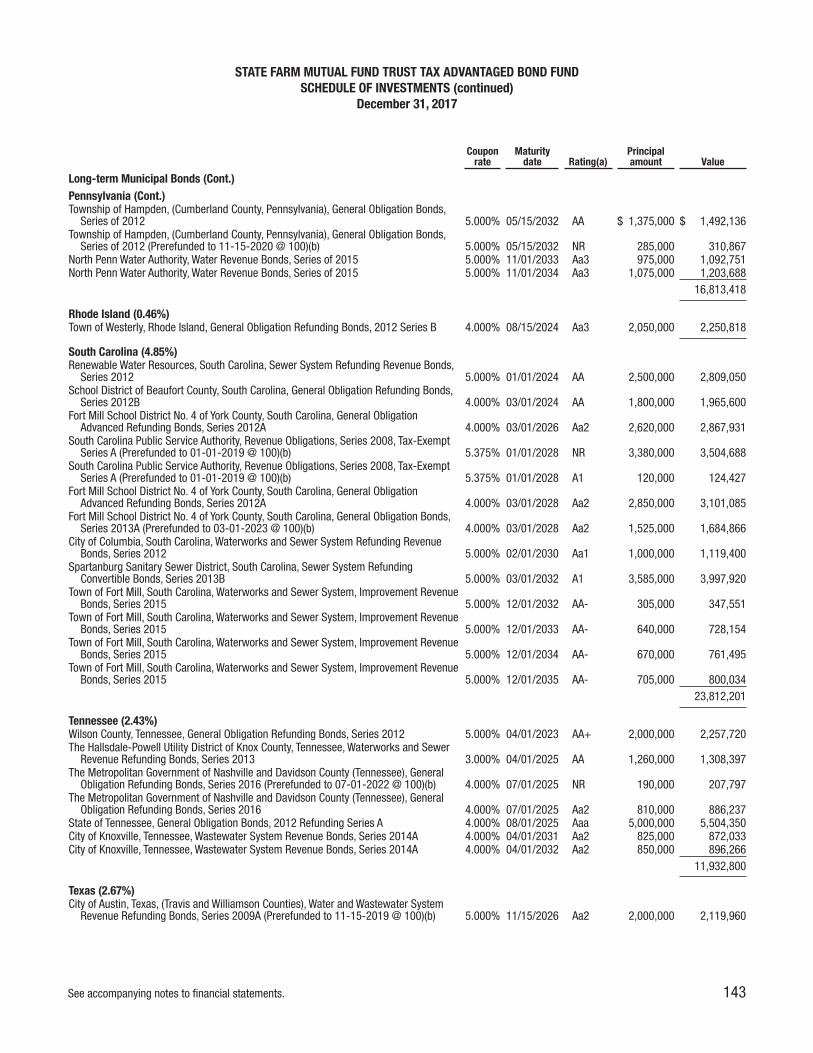
Couponrate
Maturitydate Rating(a)
Principalamount Value
Long-term Municipal Bonds (Cont.)Pennsylvania (Cont.)Township of Hampden, (Cumberland County, Pennsylvania), General Obligation Bonds,
Series of 2012 5.000% 05/15/2032 AA $ 1,375,000 $ 1,492,136Township of Hampden, (Cumberland County, Pennsylvania), General Obligation Bonds,
Series of 2012 (Prerefunded to 11-15-2020 @ 100)(b) 5.000% 05/15/2032 NR 285,000 310,867North Penn Water Authority, Water Revenue Bonds, Series of 2015 5.000% 11/01/2033 Aa3 975,000 1,092,751North Penn Water Authority, Water Revenue Bonds, Series of 2015 5.000% 11/01/2034 Aa3 1,075,000 1,203,688
16,813,418
Rhode Island (0.46%)Town of Westerly, Rhode Island, General Obligation Refunding Bonds, 2012 Series B 4.000% 08/15/2024 Aa3 2,050,000 2,250,818
South Carolina (4.85%)Renewable Water Resources, South Carolina, Sewer System Refunding Revenue Bonds,
Series 2012 5.000% 01/01/2024 AA 2,500,000 2,809,050School District of Beaufort County, South Carolina, General Obligation Refunding Bonds,
Series 2012B 4.000% 03/01/2024 AA 1,800,000 1,965,600Fort Mill School District No. 4 of York County, South Carolina, General Obligation
Advanced Refunding Bonds, Series 2012A 4.000% 03/01/2026 Aa2 2,620,000 2,867,931South Carolina Public Service Authority, Revenue Obligations, Series 2008, Tax-Exempt
Series A (Prerefunded to 01-01-2019 @ 100)(b) 5.375% 01/01/2028 NR 3,380,000 3,504,688South Carolina Public Service Authority, Revenue Obligations, Series 2008, Tax-Exempt
Series A (Prerefunded to 01-01-2019 @ 100)(b) 5.375% 01/01/2028 A1 120,000 124,427Fort Mill School District No. 4 of York County, South Carolina, General Obligation
Advanced Refunding Bonds, Series 2012A 4.000% 03/01/2028 Aa2 2,850,000 3,101,085Fort Mill School District No. 4 of York County, South Carolina, General Obligation Bonds,
Series 2013A (Prerefunded to 03-01-2023 @ 100)(b) 4.000% 03/01/2028 Aa2 1,525,000 1,684,866City of Columbia, South Carolina, Waterworks and Sewer System Refunding Revenue
Bonds, Series 2012 5.000% 02/01/2030 Aa1 1,000,000 1,119,400Spartanburg Sanitary Sewer District, South Carolina, Sewer System Refunding
Convertible Bonds, Series 2013B 5.000% 03/01/2032 A1 3,585,000 3,997,920Town of Fort Mill, South Carolina, Waterworks and Sewer System, Improvement Revenue
Bonds, Series 2015 5.000% 12/01/2032 AA- 305,000 347,551Town of Fort Mill, South Carolina, Waterworks and Sewer System, Improvement Revenue
Bonds, Series 2015 5.000% 12/01/2033 AA- 640,000 728,154Town of Fort Mill, South Carolina, Waterworks and Sewer System, Improvement Revenue
Bonds, Series 2015 5.000% 12/01/2034 AA- 670,000 761,495Town of Fort Mill, South Carolina, Waterworks and Sewer System, Improvement Revenue
Bonds, Series 2015 5.000% 12/01/2035 AA- 705,000 800,03423,812,201
Tennessee (2.43%)Wilson County, Tennessee, General Obligation Refunding Bonds, Series 2012 5.000% 04/01/2023 AA+ 2,000,000 2,257,720The Hallsdale-Powell Utility District of Knox County, Tennessee, Waterworks and Sewer
Revenue Refunding Bonds, Series 2013 3.000% 04/01/2025 AA 1,260,000 1,308,397The Metropolitan Government of Nashville and Davidson County (Tennessee), General
Obligation Refunding Bonds, Series 2016 (Prerefunded to 07-01-2022 @ 100)(b) 4.000% 07/01/2025 NR 190,000 207,797The Metropolitan Government of Nashville and Davidson County (Tennessee), General
Obligation Refunding Bonds, Series 2016 4.000% 07/01/2025 Aa2 810,000 886,237State of Tennessee, General Obligation Bonds, 2012 Refunding Series A 4.000% 08/01/2025 Aaa 5,000,000 5,504,350City of Knoxville, Tennessee, Wastewater System Revenue Bonds, Series 2014A 4.000% 04/01/2031 Aa2 825,000 872,033City of Knoxville, Tennessee, Wastewater System Revenue Bonds, Series 2014A 4.000% 04/01/2032 Aa2 850,000 896,266
11,932,800
Texas (2.67%)City of Austin, Texas, (Travis and Williamson Counties), Water and Wastewater System
Revenue Refunding Bonds, Series 2009A (Prerefunded to 11-15-2019 @ 100)(b) 5.000% 11/15/2026 Aa2 2,000,000 2,119,960
STATE FARM MUTUAL FUND TRUST TAX ADVANTAGED BOND FUNDSCHEDULE OF INVESTMENTS (continued)
December 31, 2017
See accompanying notes to financial statements. 143

Couponrate
Maturitydate Rating(a)
Principalamount Value
Long-term Municipal Bonds (Cont.)Texas (Cont.)Trinity River Authority of Texas, (Tarrant County Water Project) Improvement Revenue
Bonds, Series 2008 (Prerefunded to 02-01-2018 @ 100)(b) 5.750% 02/01/2027 Aa3 $ 1,500,000 $ 1,505,040Carrollton-Farmers Branch Independent School District (Dallas and Denton Counties,
Texas), Unlimited Tax School Building and Refunding Bonds, Series 2012 (PartiallyPrerefunded)(b) 4.000% 02/15/2028 Aa1 2,000,000 2,139,280
Lake Travis Independent School District, Unlimited Tax School Building Bonds,Series 2012 (Prerefunded to 02-15-2021 @ 100)(b) 5.000% 02/15/2029 AA+ 2,365,000 2,603,912
Carrollton-Farmers Branch Independent School District (Dallas and Denton Counties,Texas), Unlimited Tax School Building Bonds, Series 2013A 4.000% 02/15/2030 Aa1 1,000,000 1,078,590
Lake Travis Independent School District, Unlimited Tax School Building Bonds,Series 2012 (Prerefunded to 02-15-2021 @ 100)(b) 5.000% 02/15/2031 AA+ 1,565,000 1,723,096
City of Fort Worth, Texas, (Tarrant, Denton, Parker, Johnson and Wise Counties, Texas),Water and Sewer System Revenue Refunding and Improvement Bonds, Series 2016 5.000% 02/15/2033 Aa1 1,650,000 1,945,977
13,115,855
Utah (0.50%)Board of Education of Canyons School District, Utah, General Obligation Bonds, (Utah
School Bond Guaranty Program), Series 2011 4.000% 06/15/2023 Aaa 1,000,000 1,071,880Jordan Valley Water Conservancy District, Water Revenue and Refunding Bonds, Series
2014A 5.000% 10/01/2029 AA+ 75,000 79,128Weber Basin Water Conservancy District, Water Revenue Bonds, Series 2013B 4.250% 04/01/2033 AA+ 1,195,000 1,277,120
2,428,128
Virginia (2.92%)Fairfax County Water Authority, Water Refunding Revenue Bonds, Series 1997 5.000% 04/01/2021 Aaa 735,000 775,506Virginia Public School Authority, Special Obligation School Financing Bonds, Prince
William County Series 2012 (Prerefunded to 07-15-2021 @ 100)(b) 4.500% 07/15/2024 Aaa 3,285,000 3,600,294Loudoun County, Virginia, General Obligation Public Improvement Bonds, Series 2011A 4.000% 12/01/2026 Aaa 1,065,000 1,129,592Loudoun County, Virginia, General Obligation Public Improvement Bonds, Series 2011A
(Prerefunded to 12-01-2020 @ 100)(b) 4.000% 12/01/2026 NR 330,000 351,077City of Norfolk, Virginia, Water Revenue Bonds, Series 2013 5.000% 11/01/2029 Aa2 1,790,000 1,971,112City of Norfolk, Virginia, Water Revenue Bonds, Series 2013 5.000% 11/01/2030 Aa2 1,880,000 2,068,940City of Norfolk, Virginia, Water Revenue Bonds, Series 2013 5.000% 11/01/2031 Aa2 1,975,000 2,172,145City of Norfolk, Virginia, Water Revenue Bonds, Series 2013 5.000% 11/01/2032 Aa2 2,075,000 2,277,209
14,345,875
Washington (4.92%)Bellevue School District No. 405, King County, Washington, Unlimited Tax General
Obligation Refunding Bonds, 2012B 3.000% 12/01/2023 AA+ 2,020,000 2,134,413Lake Washington School District No. 414, King County, Washington, Unlimited Tax
General Obligation Bonds, 2008 (Prerefunded to 12-01-2018 @ 100)(b) 5.000% 12/01/2025 AA+ 2,000,000 2,064,380Public Utility District No. 1 of Clark County, Washington, Water System Revenue Bonds,
Series 2008 (Prerefunded to 07-01-2018 @ 100)(b) 5.000% 01/01/2028 AA- 680,000 691,886College Place School District No. 250, Walla Walla County, Washington, Unlimited Tax
General Obligation Bonds, Series 2012 4.250% 12/01/2028 A1 2,445,000 2,659,940Public Utility District No. 1 of Clark County, Washington, Water System Revenue Bonds,
Series 2008 (Prerefunded to 07-01-2018 @ 100)(b) 5.125% 01/01/2029 AA- 445,000 453,050City of Tacoma, Washington, Solid Waste Revenue Refunding Bonds, 2016B 5.000% 12/01/2030 A1 1,600,000 1,904,368Public Utility District No. 1 of Douglas County, Washington, Electric Distribution System
Revenue and Refunding Bonds, Series 2012 5.000% 12/01/2030 Aa3 1,325,000 1,495,461Public Utility District No. 1 of Cowlitz County, Washington, Production System Revenue
Refunding Bonds, 2014 5.000% 09/01/2031 A1 2,205,000 2,499,037City of Pasco, Washington, Water and Sewer Improvement and Refunding Revenue
Bonds, 2015 5.000% 12/01/2031 AA- 295,000 347,634Public Utility District No. 1 of Clark County, Washington, Water System Revenue Bonds,
Series 2014 5.000% 01/01/2032 AA- 1,100,000 1,257,476City of Pasco, Washington, Water and Sewer Improvement and Refunding Revenue
Bonds, 2015 5.000% 12/01/2032 AA- 375,000 440,438
STATE FARM MUTUAL FUND TRUST TAX ADVANTAGED BOND FUNDSCHEDULE OF INVESTMENTS (continued)
December 31, 2017
144 See accompanying notes to financial statements.

Couponrate
Maturitydate Rating(a)
Principalamount Value
Long-term Municipal Bonds (Cont.)Washington (Cont.)City of Pasco, Washington, Water and Sewer Improvement and Refunding Revenue
Bonds, 2015 5.000% 12/01/2033 AA- $ 865,000 $ 1,012,560Lake Washington School District No. 414, King County, Washington, Unlimited Tax
General Obligation and Refunding Bonds, 2016 4.000% 12/01/2033 AA+ 4,875,000 5,341,245Public Utility District No. 1 of Clark County, Washington, Generating System Revenue and
Refunding Bonds, Series 2016 5.000% 01/01/2034 A 1,585,000 1,844,32224,146,210
West Virginia (3.36%)West Virginia University Board of Governors, University Improvement Revenue Bonds,
(West Virginia University Projects), 2011 Series B 5.000% 10/01/2022 A 2,200,000 2,449,524The Board of Education of the County of Manongalia (West Virginia), Public School
Refunding Bonds, Series 2012 4.250% 05/01/2027 AA- 2,260,000 2,465,841West Virginia University Board of Governors, University Improvement Revenue Bonds,
(West Virginia University Projects), 2011 Series B 4.750% 10/01/2027 A 2,240,000 2,456,003The Board of Education of the County of Manongalia (West Virginia), Public School
Refunding Bonds, Series 2012 4.375% 05/01/2028 AA- 2,350,000 2,572,052West Virginia University Board of Governors, University Improvement Revenue Bonds,
(West Virginia University Projects), 2011 Series B 4.750% 10/01/2028 A 2,595,000 2,841,317The Board of Education of the County of Braxton (West Virginia), Public School Refunding
Bonds, Series 2016 5.000% 05/01/2029 AA- 535,000 631,450The Board of Education of the County of Braxton (West Virginia), Public School Refunding
Bonds, Series 2016 2.500% 05/01/2029 AA- 250,000 249,018The Board of Education of the County of Manongalia (West Virginia), Public School
Refunding Bonds, Series 2012 5.000% 05/01/2030 AA- 2,555,000 2,831,98816,497,193
Wisconsin (2.08%)Fox Valley Technical College District, Wisconsin, General Obligation School Facilities
Bonds, Series 2012C 3.000% 12/01/2023 Aaa 1,925,000 2,026,602School District of Elmbrook, Waukesha County, Wisconsin, General Obligation School
Building and Improvement Bonds (Prerefunded to 04-01-2018 @ 100)(b) 5.000% 04/01/2028 Aaa 850,000 857,506City of Oshkosh, Wisconsin, Storm Water Utility Revenue Bonds, Series 2013A 4.000% 05/01/2029 A1 2,495,000 2,667,679Ellsworth Community School District, Pierce County, Wisconsin, General Obligation
Refunding Bonds 3.500% 04/01/2030 Aa3 795,000 830,370Ellsworth Community School District, Pierce County, Wisconsin, General Obligation
Refunding Bonds 4.000% 04/01/2031 Aa3 430,000 466,546Ellsworth Community School District, Pierce County, Wisconsin, General Obligation
Refunding Bonds 4.000% 04/01/2032 Aa3 970,000 1,048,939Central Brown County Water Authority, Wisconsin, Water System Revenue Refunding
Bonds, Series 2014A 5.000% 11/01/2032 A+ 2,000,000 2,311,98010,209,622
Total Long-term Municipal Bonds(cost $463,909,909) 478,029,899
STATE FARM MUTUAL FUND TRUST TAX ADVANTAGED BOND FUNDSCHEDULE OF INVESTMENTS (continued)
December 31, 2017
See accompanying notes to financial statements. 145

Couponrate
Maturitydate Rating(a)
Principalamount Value
Short-term Municipal Variable Rate Demand Notes (0.98%)New York (0.98%)New York City Municipal Water Finance Authority, Water and Sewer System Revenue
Bonds, Adjustable Rate Fiscal 2012 Series B, Fiscal 2012 Subseries B-1 AdjustableRate Bonds(d) 1.730% 06/15/2045 Aa1 $ 3,000,000 $ 3,000,000
New York City Municipal Water Finance Authority, Water and Sewer System SecondGeneral Resolution Revenue Bonds, Adjustable Rate, Fiscal 2015 Series BB, Fiscal2015 Subseries BB-1(d) 1.900% 06/15/2049 Aa1 1,775,000 1,775,000
4,775,000
Total Short-term Municipal Variable Rate Demand Notes(cost $4,775,000) 4,775,000
Shares Value
Short-term Investments (0.38%)JPMorgan U.S. Government Money Market Fund Capital Shares, 1.17%(e) 1,867,369 $ 1,867,369
Total Short-term Investments(cost $1,867,369) 1,867,369
TOTAL INVESTMENTS (98.82%)(cost $470,552,278) 484,672,268
OTHER ASSETS, NET OF LIABILITIES (1.18%) 5,799,614
NET ASSETS (100.00%) $ 490,471,882
(a) Ratings are not audited and represent the lower of Moody’s or S&P issuer specific ratings.(b) Advanced Refunded Bonds are backed by an escrow or trust containing U.S. Government, U.S. Government Agency or other securities to support the timely payment of
principal and interest.(c) Rate shown is fixed until mandatory tender date of July 1, 2026.(d) Rate shown is as of December 31, 2017.(e) Rate shown is the 7-day yield as of December 31, 2017.
NR – Not Rated
STATE FARM MUTUAL FUND TRUST TAX ADVANTAGED BOND FUNDSCHEDULE OF INVESTMENTS (continued)
December 31, 2017
146 See accompanying notes to financial statements.
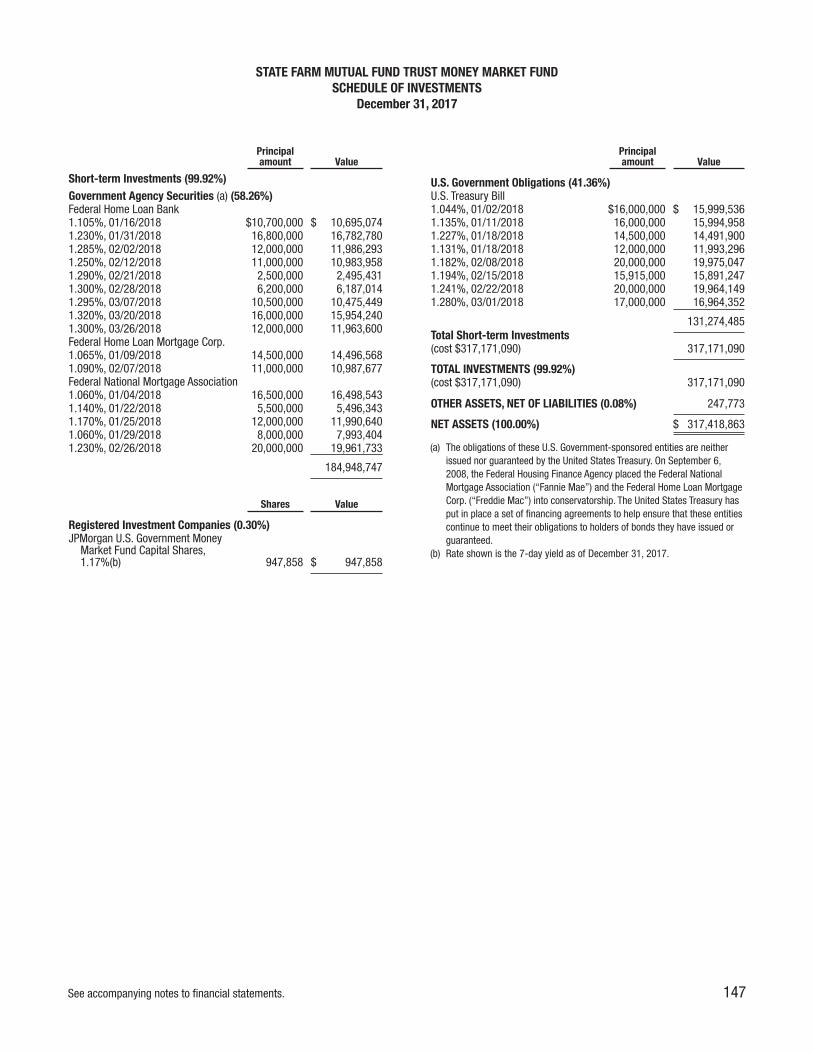
Principalamount Value
Short-term Investments (99.92%)Government Agency Securities (a) (58.26%)Federal Home Loan Bank1.105%, 01/16/2018 $10,700,000 $ 10,695,0741.230%, 01/31/2018 16,800,000 16,782,7801.285%, 02/02/2018 12,000,000 11,986,2931.250%, 02/12/2018 11,000,000 10,983,9581.290%, 02/21/2018 2,500,000 2,495,4311.300%, 02/28/2018 6,200,000 6,187,0141.295%, 03/07/2018 10,500,000 10,475,4491.320%, 03/20/2018 16,000,000 15,954,2401.300%, 03/26/2018 12,000,000 11,963,600Federal Home Loan Mortgage Corp.1.065%, 01/09/2018 14,500,000 14,496,5681.090%, 02/07/2018 11,000,000 10,987,677Federal National Mortgage Association1.060%, 01/04/2018 16,500,000 16,498,5431.140%, 01/22/2018 5,500,000 5,496,3431.170%, 01/25/2018 12,000,000 11,990,6401.060%, 01/29/2018 8,000,000 7,993,4041.230%, 02/26/2018 20,000,000 19,961,733
184,948,747
Shares Value
Registered Investment Companies (0.30%)JPMorgan U.S. Government Money
Market Fund Capital Shares,1.17%(b) 947,858 $ 947,858
Principalamount Value
U.S. Government Obligations (41.36%)U.S. Treasury Bill1.044%, 01/02/2018 $16,000,000 $ 15,999,5361.135%, 01/11/2018 16,000,000 15,994,9581.227%, 01/18/2018 14,500,000 14,491,9001.131%, 01/18/2018 12,000,000 11,993,2961.182%, 02/08/2018 20,000,000 19,975,0471.194%, 02/15/2018 15,915,000 15,891,2471.241%, 02/22/2018 20,000,000 19,964,1491.280%, 03/01/2018 17,000,000 16,964,352
131,274,485Total Short-term Investments(cost $317,171,090) 317,171,090
TOTAL INVESTMENTS (99.92%)(cost $317,171,090) 317,171,090
OTHER ASSETS, NET OF LIABILITIES (0.08%) 247,773
NET ASSETS (100.00%) $ 317,418,863
(a) The obligations of these U.S. Government-sponsored entities are neitherissued nor guaranteed by the United States Treasury. On September 6,2008, the Federal Housing Finance Agency placed the Federal NationalMortgage Association (“Fannie Mae”) and the Federal Home Loan MortgageCorp. (“Freddie Mac”) into conservatorship. The United States Treasury hasput in place a set of financing agreements to help ensure that these entitiescontinue to meet their obligations to holders of bonds they have issued orguaranteed.
(b) Rate shown is the 7-day yield as of December 31, 2017.
STATE FARM MUTUAL FUND TRUST MONEY MARKET FUNDSCHEDULE OF INVESTMENTS
December 31, 2017
See accompanying notes to financial statements. 147

Shares Value
Exchange-Traded Funds (a) (99.97%)Equity Funds (40.47%)iShares Cohen & Steers REIT ETF 174,248 $ 17,654,807iShares Core MSCI EAFE ETF 1,518,213 100,338,697iShares Core MSCI Emerging
Markets ETF 633,701 36,057,587iShares MSCI Canada ETF 348,911 10,341,723iShares Russell 1000 ETF 1,869,181 277,778,988iShares Russell 2000 ETF 405,368 61,802,405
503,974,207
Fixed Income Funds (59.50%)iShares Core U.S. Aggregate Bond ETF 5,802,560 634,393,885iShares TIPS Bond ETF 933,816 106,529,729
740,923,614Total Exchange-Traded Funds(cost $1,133,705,435) 1,244,897,821
Short-term Investments (0.12%)State Street Institutional U.S.
Government Money Market FundPremier Class, 1.21%(b) 1,481,943 1,481,943
Total Short-term Investments(cost $1,481,943) 1,481,943
TOTAL INVESTMENTS (100.09%)(cost $1,135,187,378) 1,246,379,764
CASH AND LIABILITIES, NET OFOTHER ASSETS (-0.09%) (1,110,160)
NET ASSETS (100.00%) $1,245,269,604
(a) BlackRock, as subadviser to the LifePath Funds, is an affiliate of theLifePath Funds. BlackRock or its affiliates serve as the investment adviserto each of the iShares ETFs.
(b) Rate shown is the 7-day yield as of December 31, 2017.
STATE FARM MUTUAL FUND TRUST LIFEPATH RETIREMENT FUNDSCHEDULE OF INVESTMENTS
December 31, 2017
148 See accompanying notes to financial statements.

Shares Value
Exchange-Traded Funds (a) (99.93%)Equity Funds (47.57%)iShares Cohen & Steers REIT ETF 677,888 $ 68,683,612iShares Core MSCI EAFE ETF 3,251,179 214,870,420iShares Core MSCI Emerging
Markets ETF 1,358,125 77,277,313iShares MSCI Canada ETF 736,469 21,828,942iShares Russell 1000 ETF 3,757,404 558,387,808iShares Russell 2000 ETF 604,324 92,135,237
1,033,183,332
Fixed Income Funds (52.36%)iShares Core U.S. Aggregate Bond ETF 8,974,215 981,150,926iShares TIPS Bond ETF 1,367,192 155,969,263
1,137,120,189Total Exchange-Traded Funds(cost $1,935,055,877) 2,170,303,521
Short-term Investments (0.13%)State Street Institutional U.S.
Government Money Market FundPremier Class, 1.21%(b) 2,755,429 2,755,429
Total Short-term Investments(cost $2,755,429) 2,755,429
TOTAL INVESTMENTS (100.06%)(cost $1,937,811,306) 2,173,058,950
CASH AND LIABILITIES, NET OFOTHER ASSETS (-0.06%) (1,350,090)
NET ASSETS (100.00%) $2,171,708,860
(a) BlackRock, as subadviser to the LifePath Funds, is an affiliate of theLifePath Funds. BlackRock or its affiliates serve as the investment adviserto each of the iShares ETFs.
(b) Rate shown is the 7-day yield as of December 31, 2017.
STATE FARM MUTUAL FUND TRUST LIFEPATH 2020 FUNDSCHEDULE OF INVESTMENTS
December 31, 2017
See accompanying notes to financial statements. 149

Shares Value
Exchange-Traded Funds (a) (99.95%)Equity Funds (70.48%)iShares Cohen & Steers REIT ETF 1,849,571 $ 187,398,534iShares Core MSCI EAFE ETF 5,995,359 396,233,276iShares Core MSCI Emerging
Markets ETF 2,465,477 140,285,641iShares MSCI Canada ETF 1,345,050 39,867,284iShares Russell 1000 ETF 6,199,135 921,253,452iShares Russell 2000 ETF 384,301 58,590,530
1,743,628,717
Fixed Income Funds (29.47%)iShares Core U.S. Aggregate Bond ETF 5,799,186 634,025,005iShares TIPS Bond ETF 832,002 94,914,788
728,939,793Total Exchange-Traded Funds(cost $2,108,582,299) 2,472,568,510
Shares Value
Short-term Investments (0.09%)State Street Institutional U.S.
Government Money Market FundPremier Class, 1.21%(b) 2,276,757 $ 2,276,757
Total Short-term Investments(cost $2,276,757) 2,276,757
TOTAL INVESTMENTS (100.04%)(cost $2,110,859,056) 2,474,845,267
CASH AND LIABILITIES, NET OFOTHER ASSETS (-0.04%) (987,377)
NET ASSETS (100.00%) $2,473,857,890
(a) BlackRock, as subadviser to the LifePath Funds, is an affiliate of theLifePath Funds. BlackRock or its affiliates serve as the investment adviserto each of the iShares ETFs.
(b) Rate shown is the 7-day yield as of December 31, 2017.
As of December 31, 2017, investment in an issuer considered to be an affiliate of the LifePath 2030 Fund for purposes of Section 2(a)(3) of the Investment Company Act of1940, as amended, was as follows:
SecurityShares Held at
December 31, 2016Shares
PurchasedShares
SoldShares Held at
December 31, 2017Value at
December 31, 2017
iShares Cohen & Steers REIT ETF 1,773,798 129,763 53,990 1,849,571 $187,398,534
For the year ended December 31, 2017
SecurityIncome
DividendsRealized Gain (Loss)
on SalesChange in Unrealized
Appreciation (Depreciation)
iShares Cohen & Steers REIT ETF $5,701,684 $44,006 $3,134,919
STATE FARM MUTUAL FUND TRUST LIFEPATH 2030 FUNDSCHEDULE OF INVESTMENTS
December 31, 2017
150 See accompanying notes to financial statements.

Shares Value
Exchange-Traded Funds (a) (99.84%)Equity Funds (89.55%)iShares Cohen & Steers REIT ETF 2,191,822 $ 222,075,405iShares Core MSCI EAFE ETF 6,105,334 403,501,524iShares Core MSCI Emerging
Markets ETF 2,520,179 143,398,185iShares MSCI Canada ETF 1,342,195 39,782,660iShares Russell 1000 ETF 6,039,426 897,519,098iShares Russell 2000 ETF 83,193 12,683,605
1,718,960,477
Fixed Income Funds (10.29%)iShares Core U.S. Aggregate Bond ETF 1,602,839 175,238,388iShares TIPS Bond ETF 195,541 22,307,317
197,545,705Total Exchange-Traded Funds(cost $1,575,712,482) 1,916,506,182
Shares Value
Short-term Investments (0.21%)State Street Institutional U.S.
Government Money Market FundPremier Class, 1.21%(b) 4,032,487 $ 4,032,487
Total Short-term Investments(cost $4,032,487) 4,032,487
TOTAL INVESTMENTS (100.05%)(cost $1,579,744,969) 1,920,538,669
CASH AND LIABILITIES, NET OFOTHER ASSETS (-0.05%) (873,562)
NET ASSETS (100.00%) $1,919,665,107
(a) BlackRock, as subadviser to the LifePath Funds, is an affiliate of theLifePath Funds. BlackRock or its affiliates serve as the investment adviserto each of the iShares ETFs.
(b) Rate shown is the 7-day yield as of December 31, 2017.
As of December 31, 2017, investment in an issuer considered to be an affiliate of the LifePath 2040 Fund for purposes of Section 2(a)(3) of the Investment Company Act of1940, as amended, was as follows:
SecurityShares Held at
December 31, 2016Shares
PurchasedShares
SoldShares Held at
December 31, 2017Value at
December 31, 2017
iShares Cohen & Steers REIT ETF 1,980,848 274,631 63,657 2,191,822 $222,075,405
For the year ended December 31, 2017
SecurityIncome
DividendsRealized Gain (Loss)
on SalesChange in Unrealized
Appreciation (Depreciation)
iShares Cohen & Steers REIT ETF $6,568,953 $(171,654) $3,728,620
STATE FARM MUTUAL FUND TRUST LIFEPATH 2040 FUNDSCHEDULE OF INVESTMENTS
December 31, 2017
See accompanying notes to financial statements. 151

Shares Value
Exchange-Traded Funds (a) (99.84%)Equity Funds (99.00%)iShares Cohen & Steers REIT ETF 624,334 $ 63,257,521iShares Core MSCI EAFE ETF 1,716,242 113,426,434iShares Core MSCI Emerging
Markets ETF 696,976 39,657,934iShares MSCI Canada ETF 364,554 10,805,380iShares Russell 1000 ETF 1,575,082 234,072,936iShares Russell 2000 ETF 12,386 1,888,370
463,108,575
Fixed Income Funds (0.84%)iShares Core U.S. Aggregate Bond ETF 35,921 3,927,243Total Exchange-Traded Funds(cost $379,805,600) 467,035,818
Short-term Investments (0.21%)State Street Institutional U.S.
Government Money Market FundPremier Class, 1.21%(b) 975,666 975,666
Total Short-term Investments(cost $975,666) 975,666
TOTAL INVESTMENTS (100.05%)(cost $380,781,266) 468,011,484
CASH AND LIABILITIES, NET OFOTHER ASSETS (-0.05%) (230,949)
NET ASSETS (100.00%) $ 467,780,535
(a) BlackRock, as subadviser to the LifePath Funds, is an affiliate of theLifePath Funds. BlackRock or its affiliates serve as the investment adviserto each of the iShares ETFs.
(b) Rate shown is the 7-day yield as of December 31, 2017.
STATE FARM MUTUAL FUND TRUST LIFEPATH 2050 FUNDSCHEDULE OF INVESTMENTS
December 31, 2017
152 See accompanying notes to financial statements.

(This page intentionally left blank.)
153

EquityFund
Small/Mid CapEquity Fund
InternationalEquity Fund
AssetsInvestments in affiliated securities at identified cost $ — — —Investments in unaffiliated securities at identified cost 469,589,394 265,458,028 120,984,895Foreign currencies at cost — — 1,231
Investments in affiliated securities at market value $ — — —Investments in unaffiliated securities at market value 633,510,777 300,984,022 162,106,740Cash — — 19,809Cash pledged as collateral for open futures contracts — — —Foreign currencies at value — — 1,231Foreign currencies pledged for open futures contracts at value — — —Receivables:
Dividends and interest 387,149 91,662 275,592Shares of the Fund sold 281,783 68,541 25,163Securities sold 716,584 728,227 1,373,978SFIMC — — —Federal tax expense reimbursement — 412 —Variation margin on futures contracts — — —
Prepaid expenses 4,540 2,590 1,155
Total assets 634,900,833 301,875,454 163,803,668Liabilities and Net Assets
Distributions to shareholders — — —Payables:
Shares of the Fund redeemed 397,511 234,050 43,280Securities Purchased 820,414 577,679 —Trustees’ fees and expenses 2,815 1,355 572Variation margin on futures contracts — — —Federal Tax Expense — — —
Due to bank — — —Due to affiliates 468,622 203,708 156,503Accrued liabilities 54,975 55,220 75,630
Total liabilities 1,744,337 1,072,012 275,985
Net assets applicable to shares outstanding of common stock $633,156,496 300,803,442 163,527,683Analysis of Net Assets
Paid-in-capital $449,589,056 260,514,730 122,436,173Accumulated net realized gain (loss) 19,384,391 4,730,412 1,127,532Net unrealized appreciation (depreciation) 163,921,383 35,525,994 41,136,547Accumulated undistributed net investment income (loss) 261,666 32,306 (1,172,569)
Net assets applicable to shares outstanding $633,156,496 300,803,442 163,527,683
Fund shares outstanding: Class A Shares 13,182,654 8,089,859 3,162,013Class B Shares 204,683 1,036,994 890,073Premier Shares 14,453,729 10,021,188 4,851,418Legacy Class B Shares 357,581 845,973 877,234Institutional Shares 28,385,760 4,223,228 1,855,634Class R-1 Shares 247,113 336,034 211,928Class R-2 Shares 1,460,779 940,815 474,634Class R-3 Shares 198,630 222,006 213,885
Net assets applicable to shares outstanding: Class A Shares $140,502,615 95,946,422 41,111,201Class B Shares 2,160,988 11,173,631 11,268,960Premier Shares 161,842,733 115,858,066 63,756,163Legacy Class B Shares 4,001,669 8,843,903 11,296,689Institutional Shares 304,351,309 51,767,620 24,398,285Class R-1 Shares 2,635,875 3,725,838 2,729,418Class R-2 Shares 15,530,558 10,803,809 6,158,070Class R-3 Shares 2,130,749 2,684,153 2,808,897
Net asset value: Class A Shares $ 10.66 11.86 13.00Class B Shares 10.56 10.78 12.66Premier Shares 11.20 11.56 13.14Legacy Class B Shares 11.19 10.45 12.88Institutional Shares 10.72 12.26 13.15Class R-1 Shares 10.67 11.09 12.88Class R-2 Shares 10.63 11.48 12.97Class R-3 Shares 10.73 12.09 13.13
Maximum offering price: Class A Shares $ 11.22 12.48 13.68Premier Shares 11.79 12.17 13.83
STATE FARM MUTUAL FUND TRUSTSTATEMENTS OF ASSETS AND LIABILITIES
December 31, 2017
154 See accompanying notes to financial statements.

S&P 500Index Fund
Small CapIndex Fund
InternationalIndex Fund
Equity andBond Fund
BondFund
Tax AdvantagedBond Fund
Money MarketFund
— — — 318,937,001 — — —767,422,014 360,292,992 214,832,828 — 812,426,969 470,552,278 317,171,090
— — 1,837,127 — — — —
— — — 391,338,079 — — —1,545,799,344 536,086,357 300,239,154 — 818,634,820 484,672,268 317,171,090
— 122,479 — 462,015 31,794 — —1,167,000 309,000 — — — — —
— — 1,729,703 — — — —— — 122,113 — — — —
2,642,705 760,297 764,221 18,588,122 5,569,395 5,554,517 900707,325 131,535 99,120 168,810 582,213 63,023 846,922
— 409,305 3,975 — — 781,725 —— — — 423,045 — — —— — — — — — —— — 14,506 — — — —
10,731 46,402 2,247 599 6,499 3,976 3,020
1,550,327,105 537,865,375 302,975,039 410,980,670 824,824,721 491,075,509 318,021,932
— — — 3,016,592 369,170 195,696 1,316
632,477 259,473 123,188 366,583 566,158 196,800 443,528— — — 11,000,000 — — —
7,001 2,496 984 1,982 5,298 3,408 2,192125,130 61,829 — — — — —
— — — 116,484 — — —— 92,996 1,323,352 — — — —
468,965 181,236 108,590 857 243,260 138,393 103,817131,208 80,921 190,738 52,213 80,370 69,330 52,216
1,364,781 678,951 1,746,852 14,554,711 1,264,256 603,627 603,069
1,548,962,324 537,186,424 301,228,187 396,425,959 823,560,465 490,471,882 317,418,863
764,770,180 357,626,186 235,058,769 307,329,591 816,991,934 475,988,312 317,418,8635,439,437 3,837,401 (17,177,049) 12,629,947 360,680 363,580 —
778,598,080 175,811,887 85,453,773 72,401,078 6,207,851 14,119,990 —154,627 (89,050) (2,107,306) 4,065,343 — — —
1,548,962,324 537,186,424 301,228,187 396,425,959 823,560,465 490,471,882 317,418,863
28,193,416 9,606,584 6,309,305 11,257,518 16,367,878 7,761,031 100,012,251434,786 785,274 856,803 1,218,444 824,435 176,289 225,310
34,237,171 11,453,776 9,373,404 13,640,649 29,735,665 33,577,340 122,366,603659,601 1,411,824 1,074,660 1,810,044 145,390 8,213 255,349
12,340,233 5,713,192 4,105,439 3,331,259 25,191,655 73,841,643499,811 232,150 252,894 334,067 324,873 4,246,196
1,430,246 567,564 687,115 701,982 865,718 14,645,403233,973 147,353 218,125 162,931 158,606 1,826,120
557,234,498 173,289,991 83,095,429 136,700,601 183,104,392 91,747,632 100,012,2528,666,440 13,762,595 11,304,466 14,811,963 9,215,052 2,083,670 225,309
680,779,032 204,533,401 123,210,564 167,729,285 332,875,302 396,543,510 122,366,60313,279,979 24,551,832 14,222,479 22,281,318 1,628,348 97,070 255,340
246,189,918 103,950,813 54,149,862 40,525,284 281,654,362 73,841,6409,920,658 4,175,317 3,336,757 3,998,952 3,634,120 4,246,196
28,234,110 10,238,737 9,029,441 8,420,428 9,674,158 14,645,4044,657,689 2,683,738 2,879,189 1,958,128 1,774,731 1,826,119
19.76 18.04 13.17 12.14 11.19 11.82 1.0019.93 17.53 13.19 12.16 11.18 11.82 1.0019.88 17.86 13.14 12.30 11.19 11.81 1.0020.13 17.39 13.23 12.31 11.20 11.82 1.0019.95 18.19 13.19 12.17 11.18 1.0019.85 17.99 13.19 11.97 11.19 1.0019.74 18.04 13.14 12.00 11.17 1.0019.91 18.21 13.20 12.02 11.19 1.0020.80 18.99 13.86 12.78 11.54 12.19 1.0020.93 18.80 13.83 12.95 11.54 12.18 1.00
See accompanying notes to financial statements. 155

LifePathRetirement Fund
LifePath2020 Fund
LifePath2030 Fund
LifePath2040 Fund
LifePath2050 Fund
AssetsInvestments in affiliated securities at identified cost $ — — 156,220,934 191,979,328 —Investments in unaffiliated securities at identified cost 1,135,187,378 1,937,811,306 1,954,638,122 1,387,765,641 380,781,266Foreign currencies at cost — 575 1,777 35 —
Investments in affiliated securities at market value $ — — 187,398,534 222,075,405 —Investments in unaffiliated securities at market value 1,246,379,764 2,173,058,950 2,287,446,733 1,698,463,264 468,011,484Cash 1 2 313,654 100,286 175,080Foreign currencies at value — 575 1,779 34 —Receivables:
Dividends and interest 681 2,285 2,059 4,595 435Shares of the Fund sold 102,206 635,414 733,959 870,100 246,836Securities sold 3,206,986 14,816,340 15,589,515 9,754,582 —
Prepaid expenses 10,478 17,789 20,594 14,363 2,826
Total assets 1,249,700,116 2,188,531,355 2,491,506,827 1,931,282,629 468,436,661
Liabilities and Net AssetsPayables:
Shares of the Fund redeemed 633,082 952,332 506,759 550,919 164,954Securities purchased 3,228,252 14,838,554 15,966,926 10,112,822 215,679Trustees’ fees and expenses 4,979 4,314 — 4,855 2,237
Due to affiliates 508,055 899,122 1,046,270 826,612 210,651Accrued liabilities 56,144 128,173 128,982 122,314 62,605
Total liabilities 4,430,512 16,822,495 17,648,937 11,617,522 656,126
Net assets applicable to shares outstanding of common stock $1,245,269,604 2,171,708,860 2,473,857,890 1,919,665,107 467,780,535
Analysis of Net AssetsPaid-in-capital 1,130,964,608 1,929,838,463 2,104,252,605 1,575,751,069 380,373,918Accumulated net realized gain (loss) 809,390 5,840,584 4,976,721 2,708,383 97,104Net unrealized appreciation (depreciation) 111,192,386 235,247,644 363,986,213 340,793,700 87,230,218Accumulated undistributed net investment income (loss) 2,303,220 782,169 642,351 411,955 79,295
Net assets applicable to shares outstanding $1,245,269,604 2,171,708,860 2,473,857,890 1,919,665,107 467,780,535
Fund shares outstanding:Class A Shares 27,736,830 54,903,902 64,455,776 51,653,648 25,548,307Class B Shares 455,447 1,221,641 1,619,429 1,568,123Premier Shares 54,110,980 68,696,515 58,691,820 27,238,350 9,602,878Legacy Class B Shares 214,299 564,065 540,583 500,601Institutional Shares 8,068,147 14,521,691 17,897,000 21,564,788Class R-1 Shares 461,992 1,155,433 2,019,711 1,516,619 929,749Class R-2 Shares 2,005,769 4,164,854 4,892,025 3,649,289 1,667,004Class R-3 Shares 139,718 215,946 315,585 432,320
Net assets applicable to shares outstanding:Class A Shares $ 364,728,626 821,969,218 1,059,172,268 914,354,019 316,750,967Class B Shares 6,027,201 18,205,253 26,527,604 27,677,611Premier Shares 728,003,874 1,022,702,094 964,820,946 484,231,207 118,753,204Legacy Class B Shares 2,902,707 8,493,895 8,950,573 8,963,698Institutional Shares 108,558,610 217,887,343 296,022,796 385,356,761Class R-1 Shares 6,096,978 17,209,565 32,985,934 26,732,170 11,548,528Class R-2 Shares 27,074,102 62,008,550 80,154,489 64,537,487 20,727,836Class R-3 Shares 1,877,506 3,232,942 5,223,280 7,812,154
Net asset value:Class A Shares $ 13.15 14.97 16.43 17.70 12.40Class B Shares 13.23 14.90 16.38 17.65Premier Shares 13.45 14.89 16.44 17.78 12.37Legacy Class B Shares 13.55 15.06 16.56 17.91Institutional Shares 13.46 15.00 16.54 17.87Class R-1 Shares 13.20 14.89 16.33 17.63 12.42Class R-2 Shares 13.50 14.89 16.38 17.68 12.43Class R-3 Shares 13.44 14.97 16.55 18.07
Maximum offering price:Class A Shares $ 13.84 15.76 17.29 18.63 13.05Premier Shares 14.16 15.67 17.31 18.72 13.02
STATE FARM MUTUAL FUND TRUSTSTATEMENTS OF ASSETS AND LIABILITIES
December 31, 2017
156 See accompanying notes to financial statements.

(This page intentionally left blank.)
157

EquityFund
Small/Mid CapEquity Fund
InternationalEquity Fund
S&P 500Index Fund
Small CapIndex Fund
Investment Income:Dividends from affiliated investments $ — — — — —Dividends from unaffiliated investments 9,919,813 4,013,560 2,464,941 29,147,040 6,739,084Interest 62,935 37,844 27,214 345,266 55,447Tax-exempt interest — — — — —
9,982,748 4,051,404 2,492,155 29,492,306 6,794,531Less: foreign withholding taxes — (640) (210,768) — (716)
Total investment income 9,982,748 4,050,764 2,281,387 29,492,306 6,793,815Expenses:
Investment advisory and management fees 3,625,192 2,365,474 1,187,500 1,485,801 686,813Shareholder services fees 1,379,664 640,619 321,325 3,018,249 1,107,141Distribution fees Class A 338,350 236,452 96,838 1,335,302 429,001Distribution fees Class B 22,106 113,063 98,842 84,773 108,989Distribution fees Premier 359,679 278,455 142,396 1,564,032 475,141Distribution fees Legacy Class B 29,030 62,583 67,888 97,894 161,402Distribution fees Class R-1 14,121 18,623 12,636 48,378 20,465Distribution fees Class R-2 42,722 34,207 16,801 78,799 29,458Regulatory fees 100,923 99,489 97,002 118,035 101,298Reports to shareholders 65,563 67,418 36,974 168,275 100,624Audit fees 37,804 36,894 34,306 37,731 38,614Trustees’ fees and expenses 36,011 17,901 8,991 86,412 31,506Professional fees 18,911 15,157 11,206 31,520 19,263Custodian fees 4,453 6,031 71,993 5,271 44,665Errors and omissions insurance 3,962 1,817 884 8,765 3,372ICI dues 5,957 2,101 1,258 13,470 3,387Securities valuation fees 3,100 3,478 11,479 13,151 47,999Fidelity bond expense 439 217 88 1,004 348Federal taxes — 5,088 3,144 — —License index fees — — — 139,583 67,876
Total expenses 6,087,987 4,005,067 2,221,551 8,336,445 3,477,362Less: expense reimbursement for distribution fees (a) (613,275) (559,308) (339,199) (2,442,087) (927,599)Less: additional expense reimbursements from affiliates (15,490) (588,261) (3,883) (36,053) (13,056)
Net expenses 5,459,222 2,857,498 1,878,469 5,858,305 2,536,707
Net investment income (loss) 4,523,526 1,193,266 402,918 23,634,001 4,257,108
Realized and unrealized gain (loss):Net realized gain (loss) on sales of affiliated investments — — — — —Net realized gain (loss) on sales of unaffiliated investments 58,027,933 39,640,169 14,117,170 8,195,357 29,611,628Net realized gain (loss) from affiliated investment companies — — — — —Net realized gain (loss) on foreign currency transactions — — (22,113) — —Net realized gain (loss) on futures contracts — — — 8,997,660 613,921Change in net unrealized gain (loss) on open futures contracts — — — (442,773) 54,432Change in net unrealized appreciation (depreciation) on affiliated investments — — — — —Change in net unrealized appreciation (depreciation) on unaffiliated investments and
foreign currency transactions 67,551,995 (7,882,284) 27,380,091 239,129,814 34,209,875
Net realized and unrealized gain (loss) on investments 125,579,928 31,757,885 41,475,148 255,880,058 64,489,856
Net change in net assets resulting from operations $130,103,454 32,951,151 41,878,066 279,514,059 68,746,964
(a) Effective April 1, 2017, for each Fund, VP Management Corp. agreed to waive all distribution and service (12b-1) fees for Class A, Class B, Premier, Legacy Class B, ClassR-1 and Class R-2 shares.
STATE FARM MUTUAL FUND TRUSTSTATEMENTS OF OPERATIONS
Year ended December 31, 2017
158 See accompanying notes to financial statements.

InternationalIndex Fund
Equity andBond Fund
BondFund
Tax AdvantagedBond Fund
Money MarketFund
LifePathRetirement Fund
LifePath 2020Fund
LifePath 2030Fund
LifePath 2040Fund
LifePath 2050Fund
— 5,554,034 — — — — — 5,701,684 6,568,953 —8,958,781 — — — — 27,065,274 46,891,313 46,759,713 33,835,560 9,885,823
— 576 24,619,483 32,120 2,824,286 6,165 11,854 16,747 17,399 4,991— — — 15,359,730 — — — — — —
8,958,781 5,554,610 24,619,483 15,391,850 2,824,286 27,071,439 46,903,167 52,478,144 40,421,912 9,890,814(698,294) — — — — 78,027 184,661 245,702 218,386 41,726
8,260,487 5,554,610 24,619,483 15,391,850 2,824,286 27,149,466 47,087,828 52,723,846 40,640,298 9,932,540
406,477 — 838,551 515,744 343,197 3,311,771 5,702,906 6,276,655 4,763,357 1,150,838596,951 9,469 1,757,799 873,688 740,469 2,426,836 4,444,444 5,102,035 4,128,533 1,001,640201,177 337,370 486,920 244,163 164,135 939,309 2,077,946 2,601,986 2,196,319 746,903101,496 137,908 63,019 14,887 1,546 64,245 191,168 127,287 129,741 —282,790 403,344 873,020 1,039,181 198,668 1,805,354 2,486,469 2,249,319 1,078,104 263,17387,662 144,414 12,791 754 1,768 21,486 63,832 66,123 65,544 —15,957 18,988 19,284 — 18,043 34,421 94,322 169,820 130,406 54,05825,110 23,569 28,698 — 30,101 79,096 185,949 227,674 182,638 58,34797,978 99,958 106,385 70,251 108,643 101,702 122,537 110,583 112,463 50,38272,776 55,423 90,795 28,461 57,175 118,166 180,369 276,583 189,692 113,52533,480 34,341 52,160 51,883 43,681 32,950 34,306 32,141 30,177 29,81114,736 23,236 52,076 32,364 21,470 73,380 125,824 131,313 105,019 22,14243,107 20,424 22,674 17,385 16,343 26,423 51,700 163,229 36,264 39,376
117,550 — 14,546 6,593 661 8,514 11,752 5,899 3,561 5,2271,697 2,417 5,668 3,420 2,389 8,529 13,190 19,721 10,676 3,3472,364 — 9,229 5,981 3,287 11,946 19,728 19,951 14,523 2,986
33,505 — 100,714 93,167 8,118 146 193 168 144 168191 280 638 401 271 801 2,001 2,004 1,204 49050 116,484 — — — — — — — —
110,451 — — — — — — — — —
2,245,505 1,427,625 4,534,967 2,998,323 1,759,965 9,065,075 15,808,636 17,582,491 13,178,365 3,542,413(549,683) (808,470) (1,105,698) (966,900) (303,617) (2,208,822) (3,844,896) (4,138,561) (2,889,464) (862,792)
(7,150) (513,900) (20,246) (12,270) (8,184) (30,206) (52,783) (58,984) (45,088) (10,991)
1,688,672 105,255 3,409,023 2,019,153 1,448,164 6,826,047 11,910,957 13,384,946 10,243,813 2,668,630
6,571,815 5,449,355 21,210,460 13,372,697 1,376,122 20,323,419 35,176,871 39,338,900 30,396,485 7,263,910
— 1,005,868 — — — — — 44,006 (171,654) —6,531,839 — 2,213,162 1,399,004 — 15,857,362 26,188,225 23,204,989 12,971,172 1,429,357
— 16,877,625 — — — — — — — —93,620 — — — — 920 2,121 2,880 2,601 297
238,237 — — — — — — — — —8,366 — — — — — — — — —
— 31,282,415 — — — — — 3,134,919 3,728,620 —
48,275,007 — 866,168 4,633,382 — 83,368,680 172,708,246 274,816,584 264,355,284 71,612,492
55,147,069 49,165,908 3,079,330 6,032,386 — 99,226,962 198,898,592 301,203,378 280,886,023 73,042,146
61,718,884 54,615,263 24,289,790 19,405,083 1,376,122 119,550,381 234,075,463 340,542,278 311,282,508 80,306,056
See accompanying notes to financial statements. 159
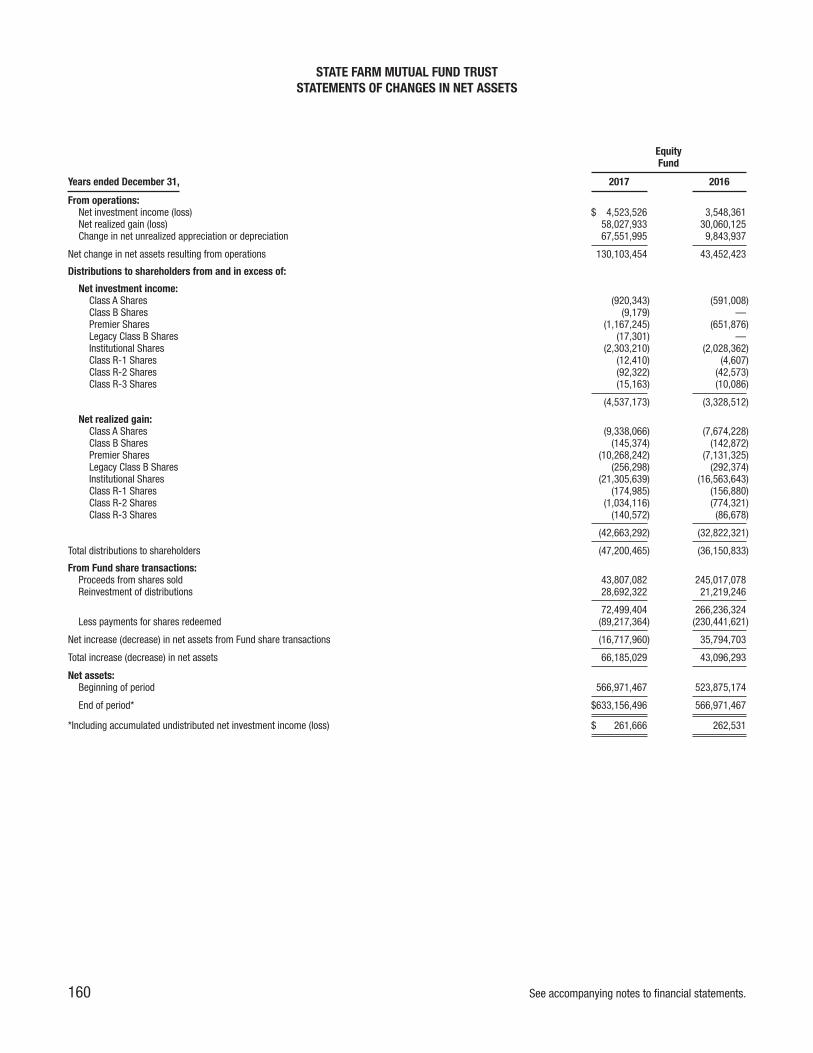
EquityFund
Years ended December 31, 2017 2016
From operations:Net investment income (loss) $ 4,523,526 3,548,361Net realized gain (loss) 58,027,933 30,060,125Change in net unrealized appreciation or depreciation 67,551,995 9,843,937
Net change in net assets resulting from operations 130,103,454 43,452,423
Distributions to shareholders from and in excess of:
Net investment income:Class A Shares (920,343) (591,008)Class B Shares (9,179) —Premier Shares (1,167,245) (651,876)Legacy Class B Shares (17,301) —Institutional Shares (2,303,210) (2,028,362)Class R-1 Shares (12,410) (4,607)Class R-2 Shares (92,322) (42,573)Class R-3 Shares (15,163) (10,086)
(4,537,173) (3,328,512)
Net realized gain:Class A Shares (9,338,066) (7,674,228)Class B Shares (145,374) (142,872)Premier Shares (10,268,242) (7,131,325)Legacy Class B Shares (256,298) (292,374)Institutional Shares (21,305,639) (16,563,643)Class R-1 Shares (174,985) (156,880)Class R-2 Shares (1,034,116) (774,321)Class R-3 Shares (140,572) (86,678)
(42,663,292) (32,822,321)
Total distributions to shareholders (47,200,465) (36,150,833)
From Fund share transactions:Proceeds from shares sold 43,807,082 245,017,078Reinvestment of distributions 28,692,322 21,219,246
72,499,404 266,236,324Less payments for shares redeemed (89,217,364) (230,441,621)
Net increase (decrease) in net assets from Fund share transactions (16,717,960) 35,794,703
Total increase (decrease) in net assets 66,185,029 43,096,293
Net assets:Beginning of period 566,971,467 523,875,174
End of period* $633,156,496 566,971,467
*Including accumulated undistributed net investment income (loss) $ 261,666 262,531
STATE FARM MUTUAL FUND TRUSTSTATEMENTS OF CHANGES IN NET ASSETS
160 See accompanying notes to financial statements.

Small/Mid CapEquity Fund
InternationalEquity Fund
S&P 500Index Fund
Small CapIndex Fund
2017 2016 2017 2016 2017 2016 2017 2016
1,193,266 (169,025) 402,918 141,316 23,634,001 18,850,053 4,257,108 3,167,70139,640,169 3,130,929 14,095,057 (1,515,088) 17,193,017 14,150,118 30,225,549 16,901,845(7,882,284) 29,271,756 27,380,091 (6,054,546) 238,687,041 102,267,974 34,264,307 65,292,519
32,951,151 32,233,660 41,878,066 (7,428,318) 279,514,059 135,268,145 68,746,964 85,362,065
(327,874) 917 (163,481) 27 (8,309,534) (7,550,440) (1,246,738) (1,069,191)(29,412) — (32,990) — (108,227) (65,897) (91,619) (18,787)
(539,559) (990) (317,622) (1) (10,598,197) (8,748,091) (1,738,140) (1,162,529)(30,644) 4 (38,485) — (166,521) (164,925) (171,686) (66,445)
(202,302) (28,754) (110,544) (13,406) (3,755,800) (3,362,119) (815,781) (736,660)(9,816) — (7,968) — (131,371) (112,578) (25,451) (14,345)
(26,513) — (20,718) — (396,644) (334,866) (66,499) (47,415)(7,846) (672) (12,344) (297) (68,207) (56,700) (18,406) (18,600)
(1,173,966) (29,495) (704,152) (13,677) (23,534,501) (20,395,616) (4,174,320) (3,133,972)
(11,134,084) (783,801) (849,516) — (5,439,275) (4,085,538) (9,246,648) (5,484,732)(1,562,695) (106,834) (243,131) — (83,316) (74,194) (792,937) (449,528)
(13,902,828) (919,147) (1,306,263) — (6,503,699) (4,419,217) (11,105,260) (5,840,336)(1,266,849) (92,050) (239,649) — (126,711) (138,053) (1,425,841) (845,734)(5,804,480) (396,353) (495,137) — (2,354,564) (1,550,967) (5,487,599) (2,911,764)
(473,116) (32,088) (57,320) — (95,341) (75,469) (227,295) (135,255)(1,290,816) (99,680) (127,185) — (272,815) (196,547) (546,832) (318,290)
(321,877) (24,227) (57,640) — (44,580) (26,676) (146,221) (79,758)
(35,756,745) (2,454,180) (3,375,841) — (14,920,301) (10,566,661) (28,978,633) (16,065,397)
(36,930,711) (2,483,675) (4,079,993) (13,677) (38,454,802) (30,962,277) (33,152,953) (19,199,369)
28,725,888 124,592,449 14,021,506 45,404,952 195,484,068 881,284,742 51,151,400 210,121,49329,016,185 1,982,711 2,415,811 10,849 38,192,871 30,763,744 27,157,949 15,882,087
57,742,073 126,575,160 16,437,317 45,415,801 233,676,939 912,048,486 78,309,349 226,003,580(45,526,094) (131,399,498) (16,254,430) (50,884,029) (263,431,753) (842,109,731) (74,483,443) (218,630,685)
12,215,979 (4,824,338) 182,887 (5,468,228) (29,754,814) 69,938,755 3,825,906 7,372,895
8,236,419 24,925,647 37,980,960 (12,910,223) 211,304,443 174,244,623 39,419,917 73,535,591
292,567,023 267,641,376 125,546,723 138,456,946 1,337,657,881 1,163,413,258 497,766,507 424,230,916
300,803,442 292,567,023 163,527,683 125,546,723 1,548,962,324 1,337,657,881 537,186,424 497,766,507
32,306 — (1,172,569) (951,181) 154,627 215,915 (89,050) (94,035)
See accompanying notes to financial statements. 161

InternationalIndex Fund
Years ended December 31, 2017 2016
From operations:Net investment income (loss) $ 6,571,815 5,732,891Net realized gain (loss) 6,863,696 (3,537,995)Change in net unrealized appreciation or depreciation 48,283,373 (1,488,251)
Net change in net assets resulting from operations 61,718,884 706,645
Distributions to shareholders from and in excess of:
Net investment income:Class A Shares (1,950,483) (1,807,267)Class B Shares (254,239) (170,182)Premier Shares (3,037,345) (2,538,430)Legacy Class B Shares (327,757) (250,618)Institutional Shares (1,306,431) (1,123,565)Class R-1 Shares (74,966) (62,155)Class R-2 Shares (206,960) (173,849)Class R-3 Shares (69,499) (52,183)
(7,227,680) (6,178,249)
Net realized gain:Class A Shares — —Class B Shares — —Premier Shares — —Legacy Class B Shares — —Institutional Shares — —Class R-1 Shares — —Class R-2 Shares — —Class R-3 Shares — —
— —
Total distributions to shareholders (7,227,680) (6,178,249)
From Fund share transactions:Proceeds from shares sold 29,397,115 120,197,981Reinvestment of distributions 5,606,177 4,877,839
35,003,292 125,075,820Less payments for shares redeemed (39,589,311) (127,324,668)
Net increase (decrease) in net assets from Fund share transactions (4,586,019) (2,248,848)
Total increase (decrease) in net assets 49,905,185 (7,720,452)
Net assets:Beginning of period 251,323,002 259,043,454
End of period* $301,228,187 251,323,002
*Including accumulated undistributed net investment income (loss) $ (2,107,306) (1,765,734)
STATE FARM MUTUAL FUND TRUSTSTATEMENTS OF CHANGES IN NET ASSETS
162 See accompanying notes to financial statements.

Equity andBond Fund
BondFund
Tax AdvantagedBond Fund
Money MarketFund
2017 2016 2017 2016 2017 2016 2017 2016
5,449,355 4,275,034 21,210,460 20,305,505 13,372,697 12,988,172 1,376,122 3,23117,883,493 13,253,972 2,213,162 621,535 1,399,004 821,497 — —31,282,415 3,565,761 866,168 1,209,131 4,633,382 (12,139,337) — —
54,615,263 21,094,767 24,289,790 22,136,171 19,405,083 1,670,332 1,376,122 3,231
(1,905,917) (1,530,448) (4,811,223) (6,833,251) (2,453,626) (5,753,657) (392,111) —(187,064) (67,629) (229,714) (199,736) (55,146) (60,869) (711) —
(2,301,960) (1,787,702) (8,977,426) (6,398,758) (10,861,140) (7,169,709) (602,304) (45)(293,958) (168,374) (46,222) (54,623) (2,785) (3,937) (703) —(567,764) (504,512) (6,783,512) (6,466,679) — — (321,444) (3,166)(51,081) (32,045) (90,281) (72,795) — — (10,488) —
(109,422) (80,079) (228,701) (230,264) — — (42,283) —(27,652) (24,512) (43,381) (49,399) — — (6,078) (20)
(5,444,818) (4,195,301) (21,210,460) (20,305,505) (13,372,697) (12,988,172) (1,376,122) (3,231)
(4,726,824) (4,302,017) (475,777) (118,756) — — — —(528,707) (463,026) (23,841) (5,782) — — — —
(5,744,200) (4,970,482) (860,210) (208,264) — — — —(786,148) (714,486) (4,235) (1,399) — — — —
(1,392,260) (1,174,456) (699,421) (147,904) — — — —(141,581) (119,020) (9,405) (2,135) — — — —(295,355) (245,100) (24,903) (5,563) — — — —(70,227) (59,458) (4,557) (980) — — — —
(13,685,302) (12,048,045) (2,102,349) (490,783) — — — —
(19,130,120) (16,243,346) (23,312,809) (20,796,288) (13,372,697) (12,988,172) (1,376,122) (3,231)
40,743,289 230,780,107 82,720,431 565,933,636 31,786,198 507,177,772 205,048,559 675,197,99015,865,485 13,558,640 18,342,091 15,882,058 10,952,383 10,182,547 1,349,014 3,188
56,608,774 244,338,747 101,062,522 581,815,694 42,738,581 517,360,319 206,397,573 675,201,178(65,246,457) (218,345,186) (140,077,118) (520,141,344) (102,893,709) (490,356,338) (269,777,390) (641,120,285)
(8,637,683) 25,993,561 (39,014,596) 61,674,350 (60,155,128) 27,003,981 (63,379,817) 34,080,893
26,847,460 30,844,982 (38,037,615) 63,014,233 (54,122,742) 15,686,141 (63,379,817) 34,080,893
369,578,499 338,733,517 861,598,080 798,583,847 544,594,624 528,908,483 380,798,680 346,717,787
396,425,959 369,578,499 823,560,465 861,598,080 490,471,882 544,594,624 317,418,863 380,798,680
4,065,343 149,566 — — — — — —
See accompanying notes to financial statements. 163

LifePathRetirement Fund
Years ended December 31, 2017 2016
From operations:Net investment income $ 20,323,419 18,541,219Net realized gain (loss) 15,858,282 (626,352)Change in net unrealized appreciation or depreciation 83,368,680 45,774,802
Net change in net assets resulting from operations 119,550,381 63,689,669
Distributions to shareholders from and in excess of:
Net investment income:Class A Shares (7,002,422) (6,156,396)Class B Shares (108,489) (58,462)Premier Shares (14,067,639) (10,318,079)Legacy Class B Shares (52,064) (40,305)Institutional Shares (2,059,762) (1,732,493)Class R-1 Shares (112,317) (80,895)Class R-2 Shares (468,219) (343,167)Class R-3 Shares (33,849) (29,890)
(23,904,761) (18,759,687)
Net realized gain:Class A Shares — —Class B Shares — —Premier Shares — —Legacy Class B Shares — —Institutional Shares — —Class R-1 Shares — —Class R-2 Shares — —Class R-3 Shares — —
— —
Total distributions to shareholders (23,904,761) (18,759,687)
From Fund share transactions:Proceeds from shares sold 92,317,750 915,559,360Reinvestment of distributions 23,661,430 18,576,726
115,979,180 934,136,086Less payments for shares redeemed (221,079,266) (977,473,687)
Net increase (decrease) in net assets from Fund share transactions (105,100,086) (43,337,601)
Total increase (decrease) in net assets (9,454,466) 1,592,381
Net assets:Beginning of period 1,254,724,070 1,253,131,689
End of period* $1,245,269,604 1,254,724,070
*Including accumulated undistributed net investment income (loss) $ 2,303,220 5,883,642
STATE FARM MUTUAL FUND TRUSTSTATEMENTS OF CHANGES IN NET ASSETS
164 See accompanying notes to financial statements.

LifePath2020 Fund
LifePath2030 Fund
LifePath2040 Fund
LifePath2050 Fund
2017 2016 2017 2016 2017 2016 2017 2016
35,176,871 32,199,647 39,338,900 35,468,209 30,396,485 27,605,871 7,263,910 6,301,25526,190,346 1,653,127 23,251,875 897,599 12,802,119 954,947 1,429,654 17,851
172,708,246 82,462,982 277,951,503 103,617,601 268,083,904 87,511,716 71,612,492 21,799,414
234,075,463 116,315,756 340,542,278 139,983,409 311,282,508 116,072,534 80,306,056 28,118,520
(12,848,134) (14,968,633) (16,648,691) (19,154,144) (14,391,200) (15,026,374) (4,940,103) (4,968,701)(242,921) (243,554) (396,829) (504,165) (413,693) (471,338) — —
(17,235,798) (19,901,807) (16,263,543) (17,397,589) (8,076,956) (7,208,087) (1,988,682) (1,901,972)(116,422) (158,328) (123,469) (165,308) (122,680) (146,295) — —
(3,547,278) (4,369,589) (4,830,205) (5,527,534) (6,248,481) (6,551,556) — —(238,434) (322,582) (468,831) (570,767) (384,281) (371,135) (166,327) (159,745)(924,487) (1,100,712) (1,212,706) (1,306,774) (968,235) (994,850) (306,718) (314,717)(50,585) (72,170) (82,101) (95,353) (119,576) (126,196) — —
(35,204,059) (41,137,375) (40,026,375) (44,721,634) (30,725,102) (30,895,831) (7,401,830) (7,345,135)
(8,297,908) (16,895,610) (8,130,497) (19,386,774) (5,236,767) (14,841,413) (798,827) (3,990,387)(185,037) (446,599) (204,733) (569,148) (159,181) (544,957) — —
(10,382,911) (19,318,365) (7,417,241) (15,588,602) (2,759,342) (6,687,671) (300,524) (1,321,484)(85,509) (234,914) (68,416) (222,936) (50,891) (205,842) — —
(2,192,882) (4,083,237) (2,256,372) (4,782,133) (2,184,972) (5,644,824) — —(174,299) (411,410) (254,020) (658,896) (153,218) (453,232) (29,089) (145,418)(628,922) (1,237,813) (616,858) (1,335,126) (369,403) (1,009,173) (52,159) (258,519)(32,621) (69,902) (39,788) (83,865) (43,701) (111,754) — —
(21,980,089) (42,697,850) (18,987,925) (42,627,480) (10,957,475) (29,498,866) (1,180,599) (5,715,808)
(57,184,148) (83,835,225) (59,014,300) (87,349,114) (41,682,577) (60,394,697) (8,582,429) (13,060,943)
199,779,517 1,331,482,644 269,941,347 1,244,541,196 225,869,924 748,115,551 76,267,239 184,840,68457,020,077 83,462,452 58,926,932 86,991,415 41,630,695 60,187,233 8,394,593 12,747,017
256,799,594 1,414,945,096 328,868,279 1,331,532,611 267,500,619 808,302,784 84,661,832 197,587,701(376,714,678) (1,399,042,798) (372,054,740) (1,195,821,948) (270,920,902) (694,348,600) (79,538,208) (139,997,450)
(119,915,084) 15,902,298 (43,186,461) 135,710,663 (3,420,283) 113,954,184 5,123,624 57,590,251
56,976,231 48,382,829 238,341,517 188,344,958 266,179,648 169,632,021 76,847,251 72,647,828
2,114,732,629 2,066,349,800 2,235,516,373 2,047,171,415 1,653,485,459 1,483,853,438 390,933,284 318,285,456
2,171,708,860 2,114,732,629 2,473,857,890 2,235,516,373 1,919,665,107 1,653,485,459 467,780,535 390,933,284
782,169 807,236 642,351 1,156,699 411,955 650,531 79,295 84,837
See accompanying notes to financial statements. 165

1. Investment ObjectiveState Farm Mutual Fund Trust (the “Trust”) has 15 separate investment portfolios (the “Funds”). The Trust is registered under the Investment Company Actof 1940 as an open-end, management investment company. Each Fund has its own investment objective, investment policies, restrictions, and attendantrisks and is diversified as defined in the Investment Company Act of 1940. Each Fund follows the accounting and reporting guidance in FinancialAccounting Standards Board (“FASB”) Accounting Standards Codification 946, “Financial Services-Investment Companies.” State Farm InvestmentManagement Corp. (“SFIMC”) is the Trust’s investment adviser.
The State Farm Equity Fund (the “Equity Fund”) seeks long-term growth of capital. The Equity Fund seeks to achieve this objective by investing, undernormal circumstances, at least 80% of its net assets (plus any borrowings for investment purposes) in stocks of large capitalization companies.
The State Farm Small/Mid Cap Equity Fund (the “Small/Mid Cap Equity Fund”) seeks long-term growth of capital. For approximately one-half of theFund’s portfolio, the Fund primarily invests under normal circumstances at least 80% of its net assets (plus any borrowings for investment purposes) instocks of small capitalization companies. For the remaining approximately one-half of the Fund’s portfolio, the Fund invests in shares of the iShares CoreS&P Mid-Cap ETF.
The performance of the Small/Mid Cap Equity Fund is directly affected by the performance of its underlying investments. The Small/Mid Cap Equity Fundthrough its investment in the iShares Core S&P Mid-Cap ETF is subject to the risks of the iShares Core S&P Mid-Cap ETF. As of December 31, 2017, theSmall/Mid Cap Equity Fund invested 51.70% of its total assets in the iShares Core S&P Mid-Cap ETF. Financial statements for the iShares Core S&P Mid-Cap ETF are available, without charge, on the SEC’s website at sec.gov.
The State Farm International Equity Fund (the “International Equity Fund”) seeks long-term growth of capital. The International Equity Fund invests itsassets primarily in securities issued by foreign companies.
The State Farm S&P 500 Index Fund (the “S&P 500 Index Fund”) seeks to provide investment results that correspond to the total return of publiclytraded common stocks in the aggregate, as represented by the S&P 500® Index. Under normal operating conditions, the S&P 500 Index Fund seeks toinvest at least 90% of its total assets in substantially all of the securities that make up the S&P 500 Index in proportions that match, approximately, theweightings of the S&P 500 Index. The S&P 500 Index tracks the common stock performance of 500 large U.S. companies.
The State Farm Small Cap Index Fund (the “Small Cap Index Fund”) seeks to match as closely as practicable, before fees and expenses, theperformance of the Russell 2000® Small Stock Index (the “Russell 2000“). Under normal operating conditions, the Small Cap Index Fund seeks to investat least 90% of its net assets in stocks that are represented in the Russell 2000 Index in weights that approximate the relative composition of thesecurities contained in the index. The Russell 2000 tracks the common stock performance of about 2,000 small U.S. companies.
The State Farm International Index Fund (the “International Index Fund”) seeks to match as closely as practicable, before fees and expenses, theperformance of an international portfolio of common stocks represented by the MSCI Europe, Australasia and Far East Free Index (the “EAFE® Free”).Under normal operating conditions, the International Index Fund seeks to invest at least 90% of its net assets in stocks that are represented in the EAFEFree Index in weights that approximate the relative composition of the securities contained in the index. The EAFE Free is a capitalization-weighted indexthat currently includes stocks of companies in 15 European countries, Australia, New Zealand, Israel, Hong Kong, Japan and Singapore.
The State Farm Equity and Bond Fund (the “Equity and Bond Fund”) seeks long-term growth of principal while providing some current income. TheEquity and Bond Fund invests in the Institutional shares of the State Farm Equity Fund and State Farm Bond Fund of the Trust.
The State Farm Bond Fund (the “Bond Fund”) seeks to realize over a period of years the highest yield consistent with investing in investment gradebonds. Under normal circumstances, the Fund typically invests at least 80% of its net assets plus any borrowings in investment grade bonds or bondsdetermined to be of comparable quality by SFIMC.
The State Farm Tax Advantaged Bond Fund (the “Tax Advantaged Bond Fund”) seeks as high a rate of income exempt from federal income taxes as isconsistent with prudent investment management. The Tax Advantaged Bond Fund normally invests so that either (1) 80% or more of the Tax AdvantagedBond Fund’s net investment income is exempt from regular federal income tax or (2) 80% or more of the Tax Advantaged Bond Fund’s net assets areinvested in securities that produce income exempt from regular federal income tax.
The State Farm Money Market Fund (the “Money Market Fund”) seeks to maximize current income to the extent consistent with the preservation ofcapital and maintenance of liquidity. Under normal conditions, the Money Market Fund invests its assets primarily (at least 99.5%) in debt securitiesissued or guaranteed by the U.S. government, or by U.S. government agencies or instrumentalities, cash, and repurchase agreements fully collateralizedby U.S. Treasury and U.S. government securities.
The State Farm LifePath® Retirement Fund (the “LifePath Retirement Fund”) seeks to provide for retirement outcomes based on quantitativelymeasured risk. In pursuit of this objective, the LifePath Retirement Fund will be broadly diversified across global asset classes.
The State Farm LifePath 2020 Fund (the “LifePath 2020 Fund”) seeks to provide for retirement outcomes based on quantitatively measured risk. Inpursuit of this objective, the LifePath 2020 Fund will be broadly diversified across global asset classes, with asset allocations becoming moreconservative over time.
STATE FARM MUTUAL FUND TRUSTNOTES TO FINANCIAL STATEMENTS
166

The State Farm LifePath 2030 Fund (the “LifePath 2030 Fund”) seeks to provide for retirement outcomes based on quantitatively measured risk. Inpursuit of this objective, the LifePath 2030 Fund will be broadly diversified across global asset classes, with asset allocations becoming moreconservative over time.
The State Farm LifePath 2040 Fund (the “LifePath 2040 Fund”) seeks to provide for retirement outcomes based on quantitatively measured risk. Inpursuit of this objective, the LifePath 2040 Fund will be broadly diversified across global asset classes, with asset allocations becoming moreconservative over time.
The State Farm LifePath 2050 Fund (the “LifePath 2050 Fund”) seeks to provide for retirement outcomes based on quantitatively measured risk. Inpursuit of this objective, the LifePath 2050 Fund will be broadly diversified across global asset classes, with asset allocations becoming moreconservative over time.
The LifePath Retirement, LifePath 2020, LifePath 2030, LifePath 2040 and LifePath 2050 Funds are collectively defined as the “LifePath Funds.” EachLifePath Fund invests its assets primarily in a combination of equity (including real estate investment trusts) and bond exchange-traded funds (“ETFs”)and a money market fund (the “LifePath Underlying Funds”) in proportion to each Fund’s own comprehensive investment strategy. The LifePath Fundsattempt to manage the investment risk in each strategy for investors whose time horizons correspond to the decade in the LifePath Fund’s name, exceptfor the LifePath Retirement Fund which is designed for investors who are currently withdrawing, or who plan to begin withdrawing, a substantial portionof their investment in the near future.
The performance of a LifePath Fund is directly affected by the performance of its LifePath Underlying Funds. In addition, the LifePath Funds, through theirinvestments in the LifePath Underlying Funds, are subject to the risks of the LifePath Underlying Funds. As of December 31, 2017 the LifePath Fundsinvested 25% or more of their total assets in the following LifePath Underlying Funds:
Fund iShares Russell 1000 ETF iShares Core U.S. Aggregate Bond ETF
LifePath Retirement Fund — 50.76%
LifePath 2020 Fund 25.51% 44.83%
LifePath 2030 Fund 36.98% 25.45%
LifePath 2040 Fund 46.48% —
LifePath 2050 Fund 49.99% —
Financial statements for the LifePath Underlying Funds noted in the preceding table are available, without charge, on the SEC’s website at sec.gov.
2. Significant Accounting PoliciesThe following is a summary of significant accounting policies followed by the Funds in the preparation of their financial statements in accordance withU.S. generally accepted accounting principles (“GAAP”).
Multi-class Fund Structure
Each Fund, other than the Tax Advantaged Bond Fund and LifePath 2050 Fund, offers eight classes of shares. The Tax Advantaged Bond Fund offers fourclasses of shares: Class A, Premier, Class B and Legacy Class B. The LifePath 2050 Fund offers four classes of shares: Class A, Premier, Class R-1 andClass R-2. Effective May 1, 2015, Class B shares and Legacy Class B shares are no longer available for purchase by new investors or by existingshareholders. Fund shareholders who own Class B shares or Legacy Class B shares may continue to exchange those shares for Class B or Legacy ClassB shares of other Funds but may not purchase new Class B or Legacy Class B shares after May 1, 2015. Except for new investments in the Money MarketFund, Class A and Premier shares are offered to investors subject to an initial sales charge. The maximum offering price for Class A and Premier shares ofeach Fund, other than the Money Market Fund, the Bond Fund and the Tax Advantaged Bond Fund, is computed by dividing the Net Asset Value (“NAV”) by0.95. The maximum offering price for Class A and Premier shares of the Bond Fund and the Tax Advantaged Bond Fund is computed by dividing the NAVby 0.97. Class B and Legacy Class B shares are offered without an initial sales charge, but are subject to higher ongoing expenses than Class Aand Premier shares and a contingent deferred sales charge payable upon certain redemptions. Class B and Legacy Class B shares automatically convertto Class A or Premier shares depending upon the value of the account and related accounts at the time of conversion eight years after issuance.Institutional shares are offered to institutional investors, including certain insurance companies, defined contribution plans and defined benefit plans, andmay be used as a funding vehicle for certain IRAs. Class R-1, R-2 and R-3 shares are available for purchase or exchange only by certain qualifiedpurchasers as defined in the prospectus for Class R-1, R-2, and R-3 shares. Institutional, Class R-1, R-2 and R-3 shares are not subject to an initial salescharge or a contingent deferred sales charge.
Effective May 23, 2016, Legacy Class A shares were renamed Premier shares. Premier shares are available to shareholders with account balance(s) equalto or greater than $100,000. Specifically, effective May 23, 2016:
STATE FARM MUTUAL FUND TRUSTNOTES TO FINANCIAL STATEMENTS (continued)
167

• Legacy Class A shareholders with account balance(s) in Legacy Class A and/or Class A shares with a total value equal to or greater than$100,000 converted to Premier shares.
• Legacy Class A shareholders with account balance(s) in Legacy Class A and/or Class A shares with a total value less than $100,000converted to Class A shares.
• Class A shareholders with account balance(s) in Class A shares with a total value equal to or greater than $100,000 converted to Premiershares.
Effective April 1, 2017, State Farm VP Management Corp. (“VP Management Corp.”) agreed to waive the receipt of sales charges for Class A, Premier,Class B and Legacy Class B shares. VP Management Corp. will discontinue waiving the receipt of sales charges if and when VP Management Corp.permits its Registered Representatives to resume their sales and servicing roles with respect to Fund shares and Fund shareholders.
Investment income and certain Fund level expenses and expense reductions, if any, are borne pro rata on the basis of fair value of settled sharesoutstanding for the Bond, Tax Advantaged Bond and Money Market Funds and, indirectly, the Equity and Bond Fund, and relative net assets for all otherFunds. Realized and unrealized gains and losses are borne pro rata on the basis of relative net assets for all Funds. However, each class bears certainexpenses unique to that class such as distribution services and certain other class specific expenses. Differences in class expenses may result in thepayment of different per share dividends by class. All shares of the Funds have equal rights with respect to voting subject to class specific arrangements.
Fund Share Valuation
The offering price of the shares of each Fund, other than Money Market Fund, is its NAV, plus an initial sales charge on the Class A and Premier shares.The offering price of the Money Market Fund and all Funds’ Class B, Legacy Class B, Institutional, Class R-1, Class R-2 and Class R-3 shares is the NAV. Aseparate NAV is calculated for each class of each Fund.
The NAV for each class of each Fund is determined as of the time of the close of regular session trading on the New York Stock Exchange (“NYSE”)(usually at 3:00 p.m., Central Time) on each day when the NYSE is open for business. Shares of the Funds will not be priced on days when the NYSE isclosed.
Securities Valuation
All investments in securities are recorded at their fair value. For more information refer to Note 3 Securities Valuation.
Securities Transactions and Investment Income
For financial reporting purposes, security transactions are accounted for on trade date (date the order to buy or sell is executed). Dividend income isrecorded on the ex-dividend date, except that certain dividends from foreign securities are recorded as soon as the information is available to the Funds.Interest income is recorded on the accrual basis and includes amortization of premiums and accretion of discounts on money market instruments andlong-term debt instruments. Realized gains and losses from security transactions are reported on an identified cost basis.
Expenses
Expenses arising in connection with a specific Fund are allocated to that Fund. Expenses arising in connection with a specific share class are allocated tothat class. Common Trust expenses are generally allocated between the Funds in proportion to each Fund’s relative net assets.
Income Taxes and Distributions to Shareholders
Each Fund is a separate taxpayer for federal income tax purposes. It is the Funds’ policy to comply with the provisions of Subchapter M of the InternalRevenue Code applicable to regulated investment companies and, in the manner provided therein, to distribute substantially all of their taxable income,including any net realized gain on sales of investments reportable for federal income tax purposes.
For more information refer to Note 5 Income Taxes and Distributions to Shareholders.
Foreign Currency Translation
Investment securities and other assets and liabilities denominated in a foreign currency are translated into U.S. dollars at the prevailing foreign exchangerates at December 31, 2017. Purchases and sales of investment securities and income and expense items denominated in foreign currencies aretranslated into U.S. dollars at the prevailing foreign exchange rates on the respective dates of transactions. That portion of realized and unrealized gainsand losses on investments that results from fluctuations in foreign currency exchange rates is not separately disclosed but is included with realized andunrealized gains and losses on investment securities.
Use of Estimates
The preparation of financial statements in conformity with GAAP requires management to make estimates and assumptions that affect the amountsreported in the financial statements and accompanying notes. Actual results could differ from those estimates.
STATE FARM MUTUAL FUND TRUSTNOTES TO FINANCIAL STATEMENTS (continued)
168
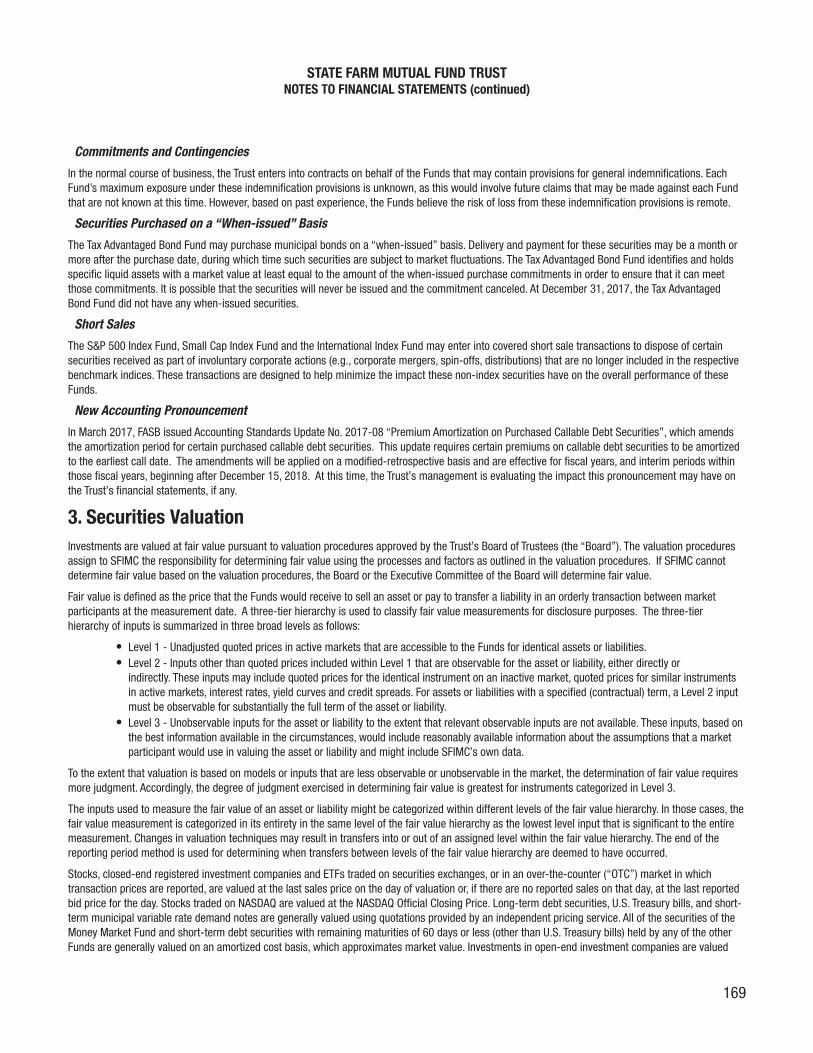
Commitments and Contingencies
In the normal course of business, the Trust enters into contracts on behalf of the Funds that may contain provisions for general indemnifications. EachFund’s maximum exposure under these indemnification provisions is unknown, as this would involve future claims that may be made against each Fundthat are not known at this time. However, based on past experience, the Funds believe the risk of loss from these indemnification provisions is remote.
Securities Purchased on a “When-issued” Basis
The Tax Advantaged Bond Fund may purchase municipal bonds on a “when-issued” basis. Delivery and payment for these securities may be a month ormore after the purchase date, during which time such securities are subject to market fluctuations. The Tax Advantaged Bond Fund identifies and holdsspecific liquid assets with a market value at least equal to the amount of the when-issued purchase commitments in order to ensure that it can meetthose commitments. It is possible that the securities will never be issued and the commitment canceled. At December 31, 2017, the Tax AdvantagedBond Fund did not have any when-issued securities.
Short Sales
The S&P 500 Index Fund, Small Cap Index Fund and the International Index Fund may enter into covered short sale transactions to dispose of certainsecurities received as part of involuntary corporate actions (e.g., corporate mergers, spin-offs, distributions) that are no longer included in the respectivebenchmark indices. These transactions are designed to help minimize the impact these non-index securities have on the overall performance of theseFunds.
New Accounting Pronouncement
In March 2017, FASB issued Accounting Standards Update No. 2017-08 “Premium Amortization on Purchased Callable Debt Securities”, which amendsthe amortization period for certain purchased callable debt securities. This update requires certain premiums on callable debt securities to be amortizedto the earliest call date. The amendments will be applied on a modified-retrospective basis and are effective for fiscal years, and interim periods withinthose fiscal years, beginning after December 15, 2018. At this time, the Trust’s management is evaluating the impact this pronouncement may have onthe Trust’s financial statements, if any.
3. Securities ValuationInvestments are valued at fair value pursuant to valuation procedures approved by the Trust’s Board of Trustees (the “Board”). The valuation proceduresassign to SFIMC the responsibility for determining fair value using the processes and factors as outlined in the valuation procedures. If SFIMC cannotdetermine fair value based on the valuation procedures, the Board or the Executive Committee of the Board will determine fair value.
Fair value is defined as the price that the Funds would receive to sell an asset or pay to transfer a liability in an orderly transaction between marketparticipants at the measurement date. A three-tier hierarchy is used to classify fair value measurements for disclosure purposes. The three-tierhierarchy of inputs is summarized in three broad levels as follows:
• Level 1 - Unadjusted quoted prices in active markets that are accessible to the Funds for identical assets or liabilities.• Level 2 - Inputs other than quoted prices included within Level 1 that are observable for the asset or liability, either directly or
indirectly. These inputs may include quoted prices for the identical instrument on an inactive market, quoted prices for similar instrumentsin active markets, interest rates, yield curves and credit spreads. For assets or liabilities with a specified (contractual) term, a Level 2 inputmust be observable for substantially the full term of the asset or liability.
• Level 3 - Unobservable inputs for the asset or liability to the extent that relevant observable inputs are not available. These inputs, based onthe best information available in the circumstances, would include reasonably available information about the assumptions that a marketparticipant would use in valuing the asset or liability and might include SFIMC’s own data.
To the extent that valuation is based on models or inputs that are less observable or unobservable in the market, the determination of fair value requiresmore judgment. Accordingly, the degree of judgment exercised in determining fair value is greatest for instruments categorized in Level 3.
The inputs used to measure the fair value of an asset or liability might be categorized within different levels of the fair value hierarchy. In those cases, thefair value measurement is categorized in its entirety in the same level of the fair value hierarchy as the lowest level input that is significant to the entiremeasurement. Changes in valuation techniques may result in transfers into or out of an assigned level within the fair value hierarchy. The end of thereporting period method is used for determining when transfers between levels of the fair value hierarchy are deemed to have occurred.
Stocks, closed-end registered investment companies and ETFs traded on securities exchanges, or in an over-the-counter (“OTC”) market in whichtransaction prices are reported, are valued at the last sales price on the day of valuation or, if there are no reported sales on that day, at the last reportedbid price for the day. Stocks traded on NASDAQ are valued at the NASDAQ Official Closing Price. Long-term debt securities, U.S. Treasury bills, and short-term municipal variable rate demand notes are generally valued using quotations provided by an independent pricing service. All of the securities of theMoney Market Fund and short-term debt securities with remaining maturities of 60 days or less (other than U.S. Treasury bills) held by any of the otherFunds are generally valued on an amortized cost basis, which approximates market value. Investments in open-end investment companies are valued
STATE FARM MUTUAL FUND TRUSTNOTES TO FINANCIAL STATEMENTS (continued)
169

each day based on the closing net asset value of the respective fund. Futures contracts are valued at the settlement price established each day on theexchange on which they are traded. Spot and forward foreign currency contracts are valued daily using quoted forward exchange rates. Short sales, ifany, are valued at market value.
Portfolio securities that are primarily traded on foreign securities exchanges (“foreign securities”) are valued at the closing values of such securities onthe respective exchange where each security is primarily traded. SFIMC may determine that a market quotation for a foreign security held by a Fund isnot reliable because of events or circumstances that have occurred between the time of the market quotation and the time the net asset value of theFund is calculated (“subsequent event”). A subsequent event might include company-specific developments, a development that might affect an entiremarket or region, a potential global development or a significant change in one or more U.S. securities indices. If SFIMC determines that the marketquotation for a foreign security is not reliable, SFIMC may use an independent statistical fair value service to assist in determining value, or SFIMC maydetermine the foreign security’s value in SFIMC’s reasonable judgment.
For securities other than foreign securities, for which market prices are not readily available or are considered unreliable, SFIMC is required to obtain bidprice quotations from brokers or dealers in the securities. If SFIMC cannot obtain a quotation for the security or if SFIMC believes the quotation does notrepresent the security’s fair value, then SFIMC will determine the security’s value in SFIMC’s reasonable judgment.
In determining a value based on reasonable judgment, SFIMC may use different methodologies, including multiple of earnings, multiple of book value,discount from market of a similar freely traded security or, for debt securities, yield to maturity. Other factors SFIMC may consider in determining value fora security include, but are not limited to, fundamental analytical data relating to the security, the nature and duration of any restrictions on disposition ofthe security, the last traded price of the security, significant global or regional events such as political unrest, natural disasters, and war, and significantmovements in major market indices, ETFs, index futures or other financial instruments in the U.S. or other markets. All securities valued based onSFIMC’s reasonable judgment are subsequently reported to the Board on a quarterly basis.
SFIMC reviews the pricing methodologies of the Funds’ approved pricing vendors, including understanding a vendor’s key inputs and assumptions invaluing securities. SFIMC also engages in transaction back-testing with respect to portfolio securities sold by the Funds to compare unrealized gains andlosses to realized gains and losses.
The inputs or methodology used for valuing securities are not necessarily an indication of the risk associated with investing in those securities. Thefollowing is a summary of the inputs used to value each Fund’s assets and liabilities as of December 31, 2017:
Investments in Securities Derivative Instruments
Fund Level 1 Level 2 Level 3 Total Level 1 Level 2 Level 3 Total
Equity Fund $ — $ — $ — $ —
Common Stocks (a) $ 625,502,228 $ — $ — $ 625,502,228
Short-term Investments 8,008,549 — — 8,008,549
Small/Mid Cap Equity Fund — — — —
Common Stocks (a) 142,858,323 — — 142,858,323
Exchange-Traded Funds 156,060,079 — — 156,060,079
Short-term Investments 2,065,620 — — 2,065,620
International Equity Fund — — — —
Common Stocks (a) 159,479,045 971,462 — 160,450,507
Preferred Stocks (a) 234,028 — — 234,028
Short-term Investments 1,422,205 — — 1,422,205
S&P 500 Index Fund 220,750 — — 220,750
Common Stocks (a) 1,513,725,528 — — 1,513,725,528
Short-term Investments 32,073,816 — — 32,073,816
Small Cap Index Fund 18,522 — — 18,522
Common Stocks (a) 529,557,665 39,298 0 529,596,963
Short-term Investments 6,489,394 — — 6,489,394
International Index Fund 16,348 — — 16,348
Common Stocks (a) 297,721,987 789,430 0 298,511,417
Preferred Stocks (a) 1,727,737 — — 1,727,737
Equity and Bond Fund — — — —
Registered Investment Companies 391,338,079 — — 391,338,079
(a) Industry classification and/or country is disclosed in the Schedules of Investments.
STATE FARM MUTUAL FUND TRUSTNOTES TO FINANCIAL STATEMENTS (continued)
170

Investments in Securities Derivative Instruments
Fund Level 1 Level 2 Level 3 Total Level 1 Level 2 Level 3 Total
Bond Fund $ — $ — $ — $ —
Corporate Bonds (a) — $549,319,128 — $ 549,319,128
Agency CommercialMortgage-Backed Securities — 110,185,267 — 110,185,267
Agency Mortgage-Backed Securities — 23,713,329 — 23,713,329
Agency Notes & Bonds — 2,220,475 — 2,220,475
U.S. Treasury Obligations — 109,495,051 — 109,495,051
Short-term Investments 23,701,570 — — 23,701,570
Tax Advantaged Bond Fund — — — —
Long-term Municipal Bonds — 478,029,899 — 478,029,899
Short-term Municipal Variable RateDemand Notes — 4,775,000 — 4,775,000
Short-term Investments 1,867,369 — — 1,867,369
Money Market Fund — — — —
Short-term Investments 947,858 316,223,232 — 317,171,090
LifePath Retirement Fund — — — —
Exchange-Traded Funds 1,244,897,821 — — 1,244,897,821
Short-term Investments 1,481,943 — — 1,481,943
LifePath 2020 Fund — — — —
Exchange-Traded Funds 2,170,303,521 — — 2,170,303,521
Short-term Investments 2,755,429 — — 2,755,429
LifePath 2030 Fund — — — —
Exchange-Traded Funds 2,472,568,510 — — 2,472,568,510
Short-term Investments 2,276,757 — — 2,276,757
LifePath 2040 Fund — — — —
Exchange-Traded Funds 1,916,506,182 — — 1,916,506,182
Short-term Investments 4,032,487 — — 4,032,487
LifePath 2050 Fund — — — —
Exchange-Traded Funds 467,035,818 — — 467,035,818
Short-term Investments 975,666 — — 975,666
(a) Industry classification and/or country is disclosed in the Schedules of Investments.
On December 31, 2016, the International Equity Fund and International Index Fund used data provided by an independent statistical fair value service tofair value common stocks and preferred stocks primarily traded on exchanges that closed before the regular close of trading of the New York StockExchange in accordance with valuation procedures approved by the Trust’s Board of Trustees, and were therefore valued using Level 2 inputs.On December 31, 2017, all of the common stocks and preferred stocks in the International Equity Fund and International Index Fund (except forInternational Equity Fund’s holdings listed on the Sao Paulo Stock Exchange and International Index Fund’s holdings listed on the Tel-Aviv Stock Exchangewhich did not trade on the last day of the period because the exchanges were closed), were valued at last traded price because the Trust’s valuationprocedures did not require the use of the independent statistical fair value service. Accordingly, using the end of the reporting period method fordetermining when transfers between levels are recognized, common stocks valued on December 31, 2017 at $91,723,531 were transferred from Level 2to Level 1 in the International Equity Fund and $285,670,643 of common stocks and preferred stocks were transferred from Level 2 to Level 1 in theInternational Index Fund.
For the remaining Funds, there were no transfers of securities between Level 1 and Level 2 as of December 31, 2017 as compared to December 31,2016.
STATE FARM MUTUAL FUND TRUSTNOTES TO FINANCIAL STATEMENTS (continued)
171

The following is a reconciliation of investments in which significant unobservable inputs (Level 3) were used in determining fair value:
Small Cap Index FundInvestments in Securities (a)
Balance as of December 31, 2016 $ 46,177
Realized gain (loss) 46,469
Change in unrealized appreciation (depreciation) (46,177)
Purchases —
Issuances —
Sales (46,469)
Transfers in —
Transfers out —
Balance as of December 31, 2017 $ —
(a) Using the end of the reporting period method for determining when transfers between levels are recognized.
The International Index Fund did not hold any Level 3 securities valued at other than zero as of December 31, 2016 or for the year ended December 31,2017. The remaining Funds (other than the Small Cap Index Fund, as noted in the preceding table) did not hold any Level 3 securities as of December 31,2016 or for the year ended December 31, 2017.
Derivative instruments, such as futures and foreign currency contracts, are valued at the unrealized appreciation (depreciation) of the instrument. Formore information, see Note 4 Derivative Instruments.
4. Derivative InstrumentsThe S&P 500 Index Fund, Small Cap Index Fund and International Index Fund are subject to equity price risk in the normal course of pursuing theirinvestment objectives. These Funds entered into stock index futures contracts to gain exposure to market fluctuations, as the use of these instrumentswas more efficient or cost effective than actually buying the underlying securities. These contracts obligated those Funds to make or take delivery ofa derivative instrument or the cash value of a securities index at a specified future date at a specified price. Realized and unrealized gains and lossesfrom these contracts are reflected in the Statements of Operations. Unrealized gains and losses on open futures contracts are reflected as a componentof net unrealized appreciation (depreciation) in the Statements of Assets and Liabilities, and in other assets in the Schedules of Investments. Marginrequirements are established by the broker or clearing house for exchange-traded and centrally cleared futures contracts. Daily fluctuations in the marginrequirements for futures contracts are recorded as variation margin receivable or payable on the Statements of Assets and Liabilities. Upon entering intoa futures contract, these Funds bore the risk of futures contracts’ prices moving unexpectedly, in which case, the Funds might not have been able toachieve the anticipated benefits of the futures contract and might realize a loss. With futures, there is minimal counterparty credit risk to a Fund sincefutures are exchange traded and the exchange’s clearing house, as the ultimate counterparty to all exchange traded futures, guarantees the futuresagainst default.
The International Equity and International Index Funds are subject to foreign currency exchange risk in the normal course of pursuing their investmentobjectives. In an attempt to decrease exposure to this risk, both Funds may engage in portfolio hedging with the objective to protect against variations inexchange rates. Portfolio hedging involves the selling of forward foreign currency contracts with respect to the actual or anticipated portfolio securityposition denominated or quoted in the particular currency. These Funds bear the market risk that arise from changes in foreign currency rates and thepotential for any credit risk should a counterparty fail to perform under a forward foreign currency contract, and as a result, might realize a loss. As ofDecember 31, 2017, neither Fund has entered into a forward foreign currency contract.
STATE FARM MUTUAL FUND TRUSTNOTES TO FINANCIAL STATEMENTS (continued)
172
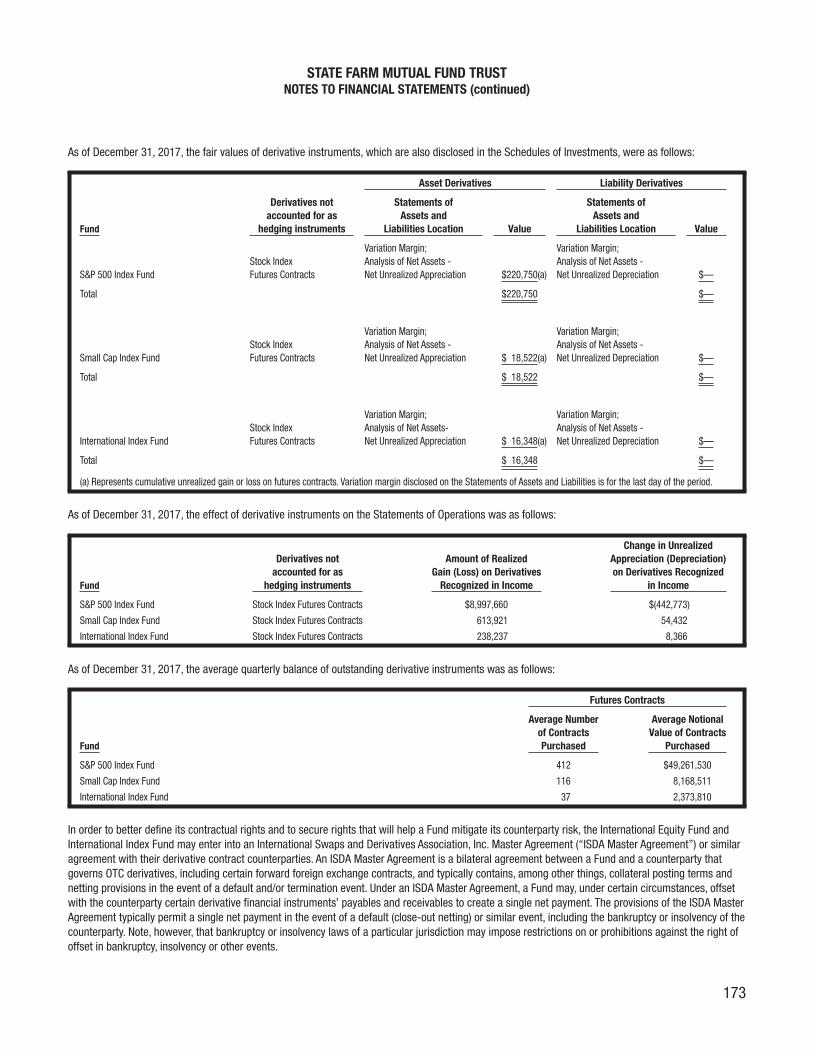
As of December 31, 2017, the fair values of derivative instruments, which are also disclosed in the Schedules of Investments, were as follows:
Asset Derivatives Liability Derivatives
Fund
Derivatives notaccounted for as
hedging instruments
Statements ofAssets and
Liabilities Location Value
Statements ofAssets and
Liabilities Location Value
S&P 500 Index FundStock IndexFutures Contracts
Variation Margin;Analysis of Net Assets -Net Unrealized Appreciation $220,750(a)
Variation Margin;Analysis of Net Assets -Net Unrealized Depreciation $—
Total $220,750 $—
Small Cap Index FundStock IndexFutures Contracts
Variation Margin;Analysis of Net Assets -Net Unrealized Appreciation $ 18,522(a)
Variation Margin;Analysis of Net Assets -Net Unrealized Depreciation $—
Total $ 18,522 $—
International Index FundStock IndexFutures Contracts
Variation Margin;Analysis of Net Assets-Net Unrealized Appreciation $ 16,348(a)
Variation Margin;Analysis of Net Assets -Net Unrealized Depreciation $—
Total $ 16,348 $—
(a) Represents cumulative unrealized gain or loss on futures contracts. Variation margin disclosed on the Statements of Assets and Liabilities is for the last day of the period.
As of December 31, 2017, the effect of derivative instruments on the Statements of Operations was as follows:
Fund
Derivatives notaccounted for as
hedging instruments
Amount of RealizedGain (Loss) on Derivatives
Recognized in Income
Change in UnrealizedAppreciation (Depreciation)on Derivatives Recognized
in Income
S&P 500 Index Fund Stock Index Futures Contracts $8,997,660 $(442,773)
Small Cap Index Fund Stock Index Futures Contracts 613,921 54,432
International Index Fund Stock Index Futures Contracts 238,237 8,366
As of December 31, 2017, the average quarterly balance of outstanding derivative instruments was as follows:
Futures Contracts
Fund
Average Numberof ContractsPurchased
Average NotionalValue of Contracts
Purchased
S&P 500 Index Fund 412 $49,261,530
Small Cap Index Fund 116 8,168,511
International Index Fund 37 2,373,810
In order to better define its contractual rights and to secure rights that will help a Fund mitigate its counterparty risk, the International Equity Fund andInternational Index Fund may enter into an International Swaps and Derivatives Association, Inc. Master Agreement (“ISDA Master Agreement”) or similaragreement with their derivative contract counterparties. An ISDA Master Agreement is a bilateral agreement between a Fund and a counterparty thatgoverns OTC derivatives, including certain forward foreign exchange contracts, and typically contains, among other things, collateral posting terms andnetting provisions in the event of a default and/or termination event. Under an ISDA Master Agreement, a Fund may, under certain circumstances, offsetwith the counterparty certain derivative financial instruments’ payables and receivables to create a single net payment. The provisions of the ISDA MasterAgreement typically permit a single net payment in the event of a default (close-out netting) or similar event, including the bankruptcy or insolvency of thecounterparty. Note, however, that bankruptcy or insolvency laws of a particular jurisdiction may impose restrictions on or prohibitions against the right ofoffset in bankruptcy, insolvency or other events.
STATE FARM MUTUAL FUND TRUSTNOTES TO FINANCIAL STATEMENTS (continued)
173

Collateral and margin requirements differ by type of derivative. Brokers can ask for margin in excess of the minimum in certain circumstances. Collateralterms are contract-specific for OTC derivatives (foreign currency exchange contracts). For financial reporting purposes, cash and non-cash collateral thathas been pledged to cover obligations of a Fund, if any, are noted in the Schedules of Investments. The Funds attempt to mitigate counterparty risk byonly entering into agreements with counterparties that they believe to be of good standing and by monitoring the financial stability of thosecounterparties.
Additionally, the netting of assets and liabilities is based on contractual netting/set-off provisions in the ISDA Master Agreement; however, in the event ofa default or insolvency of a counterparty, a court could determine that such rights are not enforceable.
The Funds did not invest in any portfolio securities or enter into any derivative transactions with gross exposure on the Statement of Assets and Liabilitiesthat could be netted subject to netting agreements as of December 31, 2017.
5. Income Taxes and Distributions to ShareholdersAs of December 31, 2017, the Trust’s management has completed a review of uncertain tax positions taken by the Funds and determined that no taxliability was required for unrecognized tax benefits, and no additional disclosures were needed. Generally, the tax authorities can initiate examinations oftax returns within the three year period beginning on the date such returns are filed. As a result, some tax returns are still open and subject toexamination. In addition, as of December 31, 2017, management is not aware of any tax positions for which it is reasonably possible that the totalamounts of unrecognized tax benefits will significantly change in the next twelve months.
As of December 31, 2017, aggregate unrealized gains and losses for all investments based on cost for federal income tax purposes for the Funds were asfollows:
FundCost of Investments
for Federal Tax PurposesGross Unrealized
AppreciationGross Unrealized
(Depreciation)Net Unrealized
Appreciation (Depreciation)
Equity Fund $ 470,101,160 $171,106,124 $ (7,696,507) $163,409,617
Small/Mid Cap Equity Fund 265,432,841 42,905,715 (7,354,534) 35,551,181
International Equity Fund 122,922,157 42,632,153 (3,447,570) 39,184,583
S&P 500 Index Fund 767,590,519 799,190,766 (20,761,191) 778,429,575
Small Cap Index Fund 360,443,747 217,430,558 (41,769,426) 175,661,132
International Index Fund 221,119,670 104,956,658 (25,820,826) 79,135,832
Equity and Bond Fund 318,940,864 72,397,215 — 72,397,215
Bond Fund 812,426,969 11,249,589 (5,041,738) 6,207,851
Tax Advantaged Bond Fund 470,552,278 14,827,358 (707,368) 14,119,990
Money Market Fund 317,171,090 — — —
LifePath Retirement Fund 1,135,675,995 110,703,769 — 110,703,769
LifePath 2020 Fund 1,940,345,667 232,713,283 — 232,713,283
LifePath 2030 Fund 2,112,837,122 362,008,145 — 362,008,145
LifePath 2040 Fund 1,581,268,642 339,270,027 — 339,270,027
LifePath 2050 Fund 381,265,115 86,746,369 — 86,746,369
The differences, if any, between the cost of investments for federal income tax purposes and the cost of investments reflected on the Schedules ofInvestments may relate to one or more of the following: return of capital transactions, mark-to-market of Passive Foreign Investment Companies(“PFICs”), mark-to-market of non-PFICs, wash sales and open futures contracts unrealized gain (loss).
The Equity Fund, Small/Mid Cap Equity Fund, International Equity Fund, S&P 500 Index Fund, Small Cap Index Fund, International Index Fund, Equity andBond Fund, LifePath 2020 Fund, LifePath 2030 Fund, LifePath 2040 Fund and LifePath 2050 Fund declare and pay dividend and capital gain distributions,if any, at least annually.
The Bond Fund, Tax Advantaged Bond Fund and Money Market Fund declare dividends daily and distribute dividends monthly on the last business day ofthe month. Capital gain distributions on these Funds, if any, are paid at least annually.
The LifePath Retirement Fund declares and distributes dividends quarterly and capital gain distributions, if any, at least annually.
STATE FARM MUTUAL FUND TRUSTNOTES TO FINANCIAL STATEMENTS (continued)
174

After utilizing capital loss carryforwards to offset realized capital gains in 2017, the following Funds had unused capital loss carryforwards available forfederal income tax purposes to be applied against future capital gains, if any. Future capital loss carryforward utilization in any given year may be subjectto Internal Revenue Code limitations. As of December 31, 2017, if not applied, the carryforwards will expire as follows:
Year of Expiration Non Expiring
Fund Utilized in 2017 2018 Short-term Long-termTotal Capital Loss
Carryforwards
International Equity Fund $ 7,387,229 $ — $ — $ — $ —
International Index Fund 3,849,234 4,077,752 483,492 8,587,469 13,148,713
Tax Advantaged Bond Fund 865,748 — — — —
LifePath Retirement Fund 13,398,159 — — — —
The International Index Fund had a capital loss carryforward of $7,747,891 that expired in 2017 and was reclassified from accumulated net realized gain(loss) to paid-in-capital on the Statement of Assets and Liabilities.
Capital losses incurred on or after January 1, 2011 are permitted to carry forward indefinitely. These losses must be utilized prior to losses incurredbefore January 1, 2011. Therefore, any losses incurred prior to 2011 may be more likely to expire unused.
As of December 31, 2017, in accordance with federal tax regulations, the components of distributable earnings on a tax basis were as follows:
FundUndistributed
Ordinary IncomeUndistributed
Long-term GainUnrealized
Appreciation (Depreciation)Accumulated
Capital and Other Losses Total
Equity Fund $4,573,398 $15,584,425 $163,409,617 $ — $183,567,440
Small/Mid Cap Equity Fund 1,326,889 3,410,642 35,551,181 — 40,288,712
International Equity Fund 147,660 1,744,565 39,199,285 — 41,091,510
S&P 500 Index Fund 861,221 4,901,345 778,429,578 — 784,192,144
Small Cap Index Fund 767,018 3,146,392 175,661,133 (14,305) 179,560,238
International Index Fund 151,200 — 79,166,931 (13,148,713) 66,169,418
Equity and Bond Fund 4,065,343 12,633,810 72,397,215 — 89,096,368
Bond Fund — 360,680 6,207,851 — 6,568,531
Tax Advantaged Bond Fund — 363,580 14,119,990 — 14,483,570
Money Market Fund — — — — —
LifePath Retirement Fund 2,303,220 1,298,008 110,703,768 — 114,304,996
LifePath 2020 Fund 799,134 8,357,981 232,713,282 — 241,870,397
LifePath 2030 Fund 664,886 6,932,253 362,008,146 — 369,605,285
LifePath 2040 Fund 418,089 4,225,923 339,270,026 — 343,914,038
LifePath 2050 Fund 439,168 221,080 86,746,369 — 87,406,617
The difference between these amounts and the undistributed net investment income reported on the Statements of Assets and Liabilities as ofDecember 31, 2017 relates to one or more of the following: short-term capital gains, foreign currency contracts, mark-to-market of PFICs, mark-to-market of non-PFICs, post-October loss deferrals, and return of capital transactions.
From November 1, 2017 through December 31, 2017, the Small Cap Index incurred $14,305 in specified losses. As permitted by the Internal RevenueCode, the Funds intend to elect to defer these losses and treat them as arising on January 1, 2018.
The timing and characterization of certain income and capital gain distributions are determined annually in accordance with federal income taxregulations, which may differ from GAAP. These differences are primarily due to differing treatment for futures contracts, the timing of the recognition ofnet realized losses, net operating losses, the timing of Fund distributions, and foreign currency transactions. As a result, net investment income and netrealized gain or loss on investment transactions for a reporting period may differ from distributions during such period. Accordingly, each Fund mayperiodically make reclassifications for permanent differences among certain of its capital accounts without impacting its net asset value.
STATE FARM MUTUAL FUND TRUSTNOTES TO FINANCIAL STATEMENTS (continued)
175

As of December 31, 2017, these reclassifications were as follows:
FundPaid inCapital
AccumulatedNet RealizedGain (Loss)
Net UnrealizedAppreciation
(Depreciation)
AccumulatedUndistributed Net
Investment Income (Loss)
Equity Fund $ — $ (12,782) $ — $ 12,782
Small/Mid Cap Equity Fund 279 (13,285) — 13,006
International Equity Fund (3,144) (76,702) — 79,846
S&P 500 Index Fund — 160,788 — (160,788)
Small Cap Index Fund — 77,803 — (77,803)
International Index Fund (7,747,941) 7,433,648 — 314,293
Equity and Bond Fund 910,768 (4,822,008) — 3,911,240
LifePath Retirement Fund — (920) — 920
LifePath 2020 Fund — (2,121) — 2,121
LifePath 2030 Fund — (173,127) — 173,127
LifePath 2040 Fund — (90,041) — 90,041
LifePath 2050 Fund — (132,378) — 132,378
The tax character of distributions was designated as follows for the years ended December 31, 2017 and December 31, 2016.
2017 Tax Exempt Income Ordinary Income Long-term Capital Gain Total
Equity Fund $ — $14,987,811 $32,212,654 $47,200,465
Small/Mid Cap Equity Fund — 12,099,742 24,830,969 36,930,711
S&P 500 Index Fund — 27,376,697 11,078,105 38,454,802
Small Cap Index Fund — 7,514,720 25,638,233 33,152,953
Equity and Bond Fund — 5,466,410 13,663,710 19,130,120
Tax Advantaged Bond Fund 13,343,737 28,960 — 13,372,697
LifePath 2020 Fund — 35,581,022 21,603,126 57,184,148
LifePath 2030 Fund — 40,252,737 18,761,563 59,014,300
LifePath 2040 Fund — 31,243,242 10,439,335 41,682,577
LifePath 2050 Fund — 7,868,588 713,841 8,582,429
2016 Tax Exempt Income Ordinary Income Long-term Capital Gain Total
S&P 500 Index Fund $ — $21,300,240 $ 9,662,037 $30,962,277
Small Cap Index Fund — 3,255,231 15,944,138 19,199,369
Bond Fund — 20,305,909 490,379 20,796,288
Tax Advantaged Bond Fund 12,975,805 12,367 — 12,988,172
For the remaining Funds, the tax distributions of ordinary income and long-term capital gains were the same as the distributions from net investmentincome and capital gains reflected in the Statement of Changes in Net Assets for the years ended December 31, 2017 and December 31, 2016.
STATE FARM MUTUAL FUND TRUSTNOTES TO FINANCIAL STATEMENTS (continued)
176
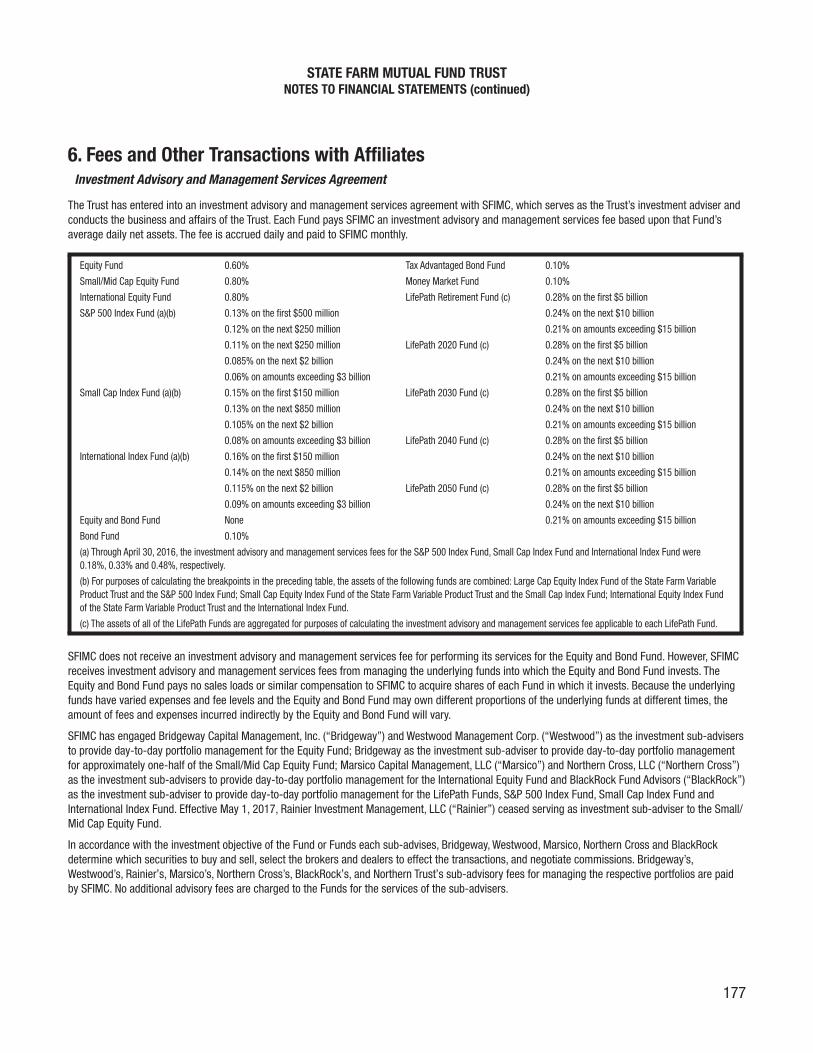
6. Fees and Other Transactions with AffiliatesInvestment Advisory and Management Services Agreement
The Trust has entered into an investment advisory and management services agreement with SFIMC, which serves as the Trust’s investment adviser andconducts the business and affairs of the Trust. Each Fund pays SFIMC an investment advisory and management services fee based upon that Fund’saverage daily net assets. The fee is accrued daily and paid to SFIMC monthly.
Equity Fund 0.60% Tax Advantaged Bond Fund 0.10%
Small/Mid Cap Equity Fund 0.80% Money Market Fund 0.10%
International Equity Fund 0.80% LifePath Retirement Fund (c) 0.28% on the first $5 billion
S&P 500 Index Fund (a)(b) 0.13% on the first $500 million 0.24% on the next $10 billion
0.12% on the next $250 million 0.21% on amounts exceeding $15 billion
0.11% on the next $250 million LifePath 2020 Fund (c) 0.28% on the first $5 billion
0.085% on the next $2 billion 0.24% on the next $10 billion
0.06% on amounts exceeding $3 billion 0.21% on amounts exceeding $15 billion
Small Cap Index Fund (a)(b) 0.15% on the first $150 million LifePath 2030 Fund (c) 0.28% on the first $5 billion
0.13% on the next $850 million 0.24% on the next $10 billion
0.105% on the next $2 billion 0.21% on amounts exceeding $15 billion
0.08% on amounts exceeding $3 billion LifePath 2040 Fund (c) 0.28% on the first $5 billion
International Index Fund (a)(b) 0.16% on the first $150 million 0.24% on the next $10 billion
0.14% on the next $850 million 0.21% on amounts exceeding $15 billion
0.115% on the next $2 billion LifePath 2050 Fund (c) 0.28% on the first $5 billion
0.09% on amounts exceeding $3 billion 0.24% on the next $10 billion
Equity and Bond Fund None 0.21% on amounts exceeding $15 billion
Bond Fund 0.10%
(a) Through April 30, 2016, the investment advisory and management services fees for the S&P 500 Index Fund, Small Cap Index Fund and International Index Fund were0.18%, 0.33% and 0.48%, respectively.
(b) For purposes of calculating the breakpoints in the preceding table, the assets of the following funds are combined: Large Cap Equity Index Fund of the State Farm VariableProduct Trust and the S&P 500 Index Fund; Small Cap Equity Index Fund of the State Farm Variable Product Trust and the Small Cap Index Fund; International Equity Index Fundof the State Farm Variable Product Trust and the International Index Fund.
(c) The assets of all of the LifePath Funds are aggregated for purposes of calculating the investment advisory and management services fee applicable to each LifePath Fund.
SFIMC does not receive an investment advisory and management services fee for performing its services for the Equity and Bond Fund. However, SFIMCreceives investment advisory and management services fees from managing the underlying funds into which the Equity and Bond Fund invests. TheEquity and Bond Fund pays no sales loads or similar compensation to SFIMC to acquire shares of each Fund in which it invests. Because the underlyingfunds have varied expenses and fee levels and the Equity and Bond Fund may own different proportions of the underlying funds at different times, theamount of fees and expenses incurred indirectly by the Equity and Bond Fund will vary.
SFIMC has engaged Bridgeway Capital Management, Inc. (“Bridgeway”) and Westwood Management Corp. (“Westwood”) as the investment sub-advisersto provide day-to-day portfolio management for the Equity Fund; Bridgeway as the investment sub-adviser to provide day-to-day portfolio managementfor approximately one-half of the Small/Mid Cap Equity Fund; Marsico Capital Management, LLC (“Marsico”) and Northern Cross, LLC (“Northern Cross”)as the investment sub-advisers to provide day-to-day portfolio management for the International Equity Fund and BlackRock Fund Advisors (“BlackRock”)as the investment sub-adviser to provide day-to-day portfolio management for the LifePath Funds, S&P 500 Index Fund, Small Cap Index Fund andInternational Index Fund. Effective May 1, 2017, Rainier Investment Management, LLC (“Rainier”) ceased serving as investment sub-adviser to the Small/Mid Cap Equity Fund.
In accordance with the investment objective of the Fund or Funds each sub-advises, Bridgeway, Westwood, Marsico, Northern Cross and BlackRockdetermine which securities to buy and sell, select the brokers and dealers to effect the transactions, and negotiate commissions. Bridgeway’s,Westwood’s, Rainier’s, Marsico’s, Northern Cross’s, BlackRock’s, and Northern Trust’s sub-advisory fees for managing the respective portfolios are paidby SFIMC. No additional advisory fees are charged to the Funds for the services of the sub-advisers.
STATE FARM MUTUAL FUND TRUSTNOTES TO FINANCIAL STATEMENTS (continued)
177

For the year ended December 31, 2017, the following fees were earned by Bridgeway, Westwood, Rainier, Marsico, Northern Crossand BlackRock for providing sub-advisory services (although not all amounts indicated were paid during that period):
Fund Bridgeway Westwood Rainier (a) MarsicoNorthern
Cross BlackRock
Equity Fund $1,239,886 $971,538 $ — $ — $ — $ —
Small/Mid Cap Equity Fund 853,642 — 272,991 — — —
International Equity Fund — — — 382,355 432,426 —
S&P 500 Index Fund — — — — — 230,161
Small Cap Index Fund — — — — — 172,697
International Index Fund — — — — — 126,384
LifePath Retirement Fund — — — — — 328,007
LifePath 2020 Fund — — — — — 564,995
LifePath 2030 Fund — — — — — 621,920
LifePath 2040 Fund — — — — — 471,964
LifePath 2050 Fund — — — — — 114,039
Total Sub-Advisory Fees $2,093,528 $971,538 $272,991 $382,355 $432,426 $2,630,167
(a) Effective May 1, 2017, Rainier ceased serving as investment sub-adviser to the Small/Mid Cap Equity Fund.
Distribution and Shareholder Services Agreements
The Trust has entered into a distribution and service plan pursuant to Rule 12b-1 under the Investment Company Act of 1940, as amended, with VPManagement Corp. Under terms of this plan, each Fund pays VP Management Corp. an annual fee based on a specified percentage of average daily netassets, up to the following amounts (not all Funds offer all classes shown):
Fund Class A Class B Premier Legacy Class B Class R-1 Class R-2
Small Cap Index Fund 0.25% 0.80% 0.25% 0.65% 0.50% 0.30%
Bond Fund 0.25% 0.65% 0.25% 0.65% 0.50% 0.30%
Tax Advantaged Bond Fund 0.25% 0.65% 0.25% 0.65%
Money Market Fund 0.15% 0.55% 0.15% 0.55% 0.40% 0.20%
LifePath 2030 Fund 0.25% 0.45% 0.25% 0.65% 0.50% 0.30%
LifePath 2040 Fund 0.25% 0.45% 0.25% 0.65% 0.50% 0.30%
All Other Funds 0.25% 0.95% 0.25% 0.65% 0.50% 0.30%
Effective April 1, 2017, for each Fund, VP Management Corp. agreed to waive all distribution and service (12b-1) fees for Class A, Class B, Premier, LegacyClass B, Class R-1 and Class R-2 shares.
STATE FARM MUTUAL FUND TRUSTNOTES TO FINANCIAL STATEMENTS (continued)
178

The annual fee amount is payable to VP Management Corp. by each Fund only to the extent VP Management Corp. has incurred distribution expenses tobe reimbursed. Any distribution expenses incurred by VP Management Corp. and not otherwise reimbursed by the Funds under the distribution plan canbe carried forward and reimbursed in a later time period in amounts not to exceed the annual fee percentages outlined above. At December 31, 2017, VPManagement Corp. had not been reimbursed for the following amounts (the TOTAL below is the cumulative amount of unreimbursed distributionexpenses incurred since the commencement of operations of the Trust, although the total amount incurred by Fund depends upon the timing ofcommencement of the applicable section of the distribution plan for each such Fund and its classes):
Equity Fund $12,766,882 Tax Advantaged Bond Fund $ 19,951,287
Small/Mid Cap Equity Fund 12,101,129 Money Market Fund 18,610,539
International Equity Fund 9,346,886 LifePath Retirement Fund 22,094,629
S&P 500 Index Fund 35,037,422 LifePath 2020 Fund 41,117,420
Small Cap Index Fund 18,403,473 LifePath 2030 Fund 32,865,563
International Index Fund 13,486,366 LifePath 2040 Fund 23,464,776
Equity and Bond Fund 14,696,264 LifePath 2050 Fund 3,633,389
Bond Fund 24,145,927 TOTAL $301,721,952
The Trust has a separate shareholder services agreement with SFIMC. Each Fund, except the Equity and Bond Fund, pays SFIMC a fee of 0.25% ofaverage daily net assets of Class A, Class B, Legacy Class B and Institutional shares and, for the current year, 0.32% of Class R-1, Class R-2 and ClassR-3 shares. Effective May 21, 2016, the Premier shares of each Fund, except the Equity and Bond Fund, pays SFIMC a fee of 0.15% of average daily netassets. Prior to May 21, 2016, the Premier shares of each Fund were the Legacy Class A shares and, except for the Equity and Bond Fund, paid SFIMC afee of 0.25% of average daily net assets. The Equity and Bond Fund does not directly pay SFIMC any shareholder services fee for Class A, Class B,Premier, Legacy Class B or Institutional shares and, for the current year, directly pays 0.07% of average daily net assets of Class R-1, Class R-2 and ClassR-3 shares. However, SFIMC receives a shareholder services fee from managing the Equity Fund and Bond Fund into which the Equity and Bond Fundinvests. Additionally, SFIMC receives proceeds from the account fee imposed on certain shareholders of the Trust which is paid by redeeming shares fromthe shareholder’s account.
STATE FARM MUTUAL FUND TRUSTNOTES TO FINANCIAL STATEMENTS (continued)
179

Expense Reduction Agreements
For all Funds, SFIMC has contractually agreed to reimburse each Class if, and to the extent, the Class’s total annual operating expenses exceed thepercentage of each Class’s average daily net assets (“expense reimbursement threshold” or “ERT”) indicated in the table below, excluding acquired fundfees and expenses. The ERTs in the table are based on applicable maximum possible fees and expenses. Any increase or decrease in 12b-1 distributionfees for a share class of a Fund will increase or decrease the applicable ERT by a corresponding amount. With respect to the Equity and Bond Fund,SFIMC has contractually agreed to reimburse all expenses directly incurred by each Class other than 12b-1 distribution fees, shareholder services feesdirectly incurred by the Fund and acquired fund fees and expenses. SFIMC may not discontinue these agreements to reimburse each class before April30, 2018, without the consent of the Board. Prior-year reimbursements and waivers, if any, are not subject to recapture. Effective May 23, 2016, LegacyClass A shares were renamed Premier shares.
Effective May 1, 2017, SFIMC contractually agreed to waive 0.29% of investment advisory and management services fees for each share class of theSmall/Mid Cap Equity Fund producing a net fee of 0.51% (0.80% - 0.29%). SFIMC may not discontinue this waiver before April 30, 2018, without theconsent of the Board.
Effective April 1, 2017, for each Fund, VP Management Corp. agreed to waive all distribution and service (12b-1) fees for Class A, Class B, Premier, LegacyClass B, Class R-1 and Class R-2 shares as noted in the Distribution and Shareholder Services Agreements table. This arrangement is voluntary and maybe eliminated by VP Management Corp. at any time.
Effective April 1, 2017, the ERT for each Fund was as follows (except for the Small/Mid Cap Equity Fund which was effective May 1, 2017):
Fund Class A Class B Premier Legacy Class B Institutional Class R-1 Class R-2 Class R-3
Equity Fund 0.95% 0.95% 0.85% 0.95% 0.95% 1.02% 1.02% 1.02%
Small/Mid Cap Equity Fund (a) 0.86% 0.86% 0.76% 0.86% 0.86% 0.93% 0.93% 0.93%
International Equity Fund 1.25% 1.25% 1.15% 1.25% 1.25% 1.32% 1.32% 1.32%
S&P 500 Index Fund 0.48% 0.48% 0.38% 0.48% 0.48% 0.55% 0.55% 0.55%
Small Cap Index Fund 0.50% 0.50% 0.40% 0.50% 0.50% 0.57% 0.57% 0.57%
International Index Fund 0.61% 0.61% 0.51% 0.61% 0.61% 0.68% 0.68% 0.68%
Equity and Bond Fund 0.00% 0.00% (0.10)% 0.00% 0.00% 0.07% 0.07% 0.07%
Bond Fund 0.45% 0.45% 0.35% 0.45% 0.45% 0.52% 0.52% 0.52%
Tax Advantaged Bond Fund 0.45% 0.45% 0.35% 0.45% — — — —
Money Market Fund 0.45% 0.45% 0.35% 0.45% 0.45% 0.52% 0.52% 0.52%
LifePath Retirement Fund 0.63% 0.63% 0.53% 0.63% 0.63% 0.70% 0.70% 0.70%
LifePath 2020 Fund 0.63% 0.63% 0.53% 0.63% 0.63% 0.70% 0.70% 0.70%
LifePath 2030 Fund 0.63% 0.63% 0.53% 0.63% 0.63% 0.70% 0.70% 0.70%
LifePath 2040 Fund 0.63% 0.63% 0.53% 0.63% 0.63% 0.70% 0.70% 0.70%
LifePath 2050 Fund 0.63% — 0.53% — — 0.70% 0.70% —
(a) From April 1, 2017 to April 30, 2017, the ERT for Small/Mid Cap Equity Fund Class A, Class B, Premier, Legacy Class B, Class R-1 and Class R-2 was 1.15%, 1.15%, 1.05%,1.15%, 1.22%, and 1.22%, respectively.
STATE FARM MUTUAL FUND TRUSTNOTES TO FINANCIAL STATEMENTS (continued)
180

Prior to April 1, 2017, the ERT for each Fund were as follows:
Fund Class A Class B Premier Legacy Class B Institutional Class R-1 Class R-2 Class R-3
Equity Fund (a) 1.20% 1.90% 1.10% 1.60% 0.95% 1.52% 1.32% 1.02%
Small/Mid Cap Equity Fund (a) 1.40% 2.10% 1.30% 1.80% 1.15% 1.72% 1.52% 1.22%
International Equity Fund (a) 1.50% 2.20% 1.40% 1.90% 1.25% 1.82% 1.62% 1.32%
S&P 500 Index Fund (b)(c) 0.73% 1.43% 0.63% 1.13% 0.48% 1.05% 0.85% 0.55%
Small Cap Index Fund (c)(d) 0.75% 1.30% 0.65% 1.15% 0.50% 1.07% 0.87% 0.57%
International Index Fund (c)(e) 0.86% 1.56% 0.76% 1.26% 0.61% 1.18% 0.98% 0.68%
Equity and Bond Fund (a) 0.25% 0.95% 0.15% 0.65% — 0.57% 0.37% 0.07%
Bond Fund (a) 0.70% 1.10% 0.60% 1.10% 0.45% 1.02% 0.82% 0.52%
Tax Advantaged Bond Fund (a) 0.70% 1.10% 0.60% 1.10%
Money Market Fund (a) 0.60% 1.00% 0.50% 1.00% 0.45% 0.92% 0.72% 0.52%
LifePath Retirement Fund (f) 0.88% 1.58% 0.78% 1.28% 0.63% 1.20% 1.00% 0.70%
LifePath 2020 Fund (f) 0.88% 1.58% 0.78% 1.28% 0.63% 1.20% 1.00% 0.70%
LifePath 2030 Fund (f) 0.88% 1.08% 0.78% 1.28% 0.63% 1.20% 1.00% 0.70%
LifePath 2040 Fund (f) 0.88% 1.08% 0.78% 1.28% 0.63% 1.20% 1.00% 0.70%
LifePath 2050 Fund (f) 0.88% 0.78% 1.20% 1.00%
(a) Through May 20, 2016, the ERT for the Premier shares of the Equity Fund, Small/Mid Cap Equity Fund, International Equity Fund, Equity and Bond Fund, Bond Fund, TaxAdvantaged Bond Fund and Money Market Fund was 1.20%, 1.40%, 1.50%, 0.25%, 0.70%, 0.70% and 0.60%, respectively.
(b) Through April 30, 2016, the ERT for the S&P 500 Index Fund Class A, Class B, Legacy Class B, Institutional, Class R-1, Class R-2, and Class R-3 was 0.78%, 1.48%, 1.18%,0.53%, 1.10%, 0.90% and 0.60%.
(c) Through April 30, 2016, the ERT for the Premier shares of the S&P 500 Index Fund, Small Cap Index Fund and International Index Fund was 0.78%, 0.93%. and 1.18%. FromMay 1, 2016 to May 20, 2016, the ERT for the Premier shares of the S&P 500 Index Fund, Small Cap Index Fund and International Index Fund was 0.73%, 0.75% and 0.86%.
(d) Through April 30, 2016, the ERT for Small Cap Index Fund Class A, Class B, Legacy Class B, Institutional, Class R-1, Class R-2 and Class R-3 was 0.93%, 1.48%, 1.33%,0.68%, 1.25%, 1.05%, and 0.75%.
(e) Through April 30, 2016, the ERT for International Index Fund Class A, Class B, Legacy Class B, Institutional, Class R-1, Class R-2 and Class R-3 was 1.18%, 1.88%, 1.58%,0.93%, 1.50%, 1.30% and 1.00%.
(f) From January 1, 2016 to May 20, 2016, the ERT for the Premier shares of each of the LifePath Retirement Fund, LifePath 2020 Fund, LifePath 2030 Fund and LifePath 2040Fund was 0.88%.
Effective May 21, 2016, to ensure that the Premier shares of the Equity and Bond Fund are subject to a shareholder services fee of 0.15% of averagedaily net assets of the Equity and Bond Fund through its investment in the Institutional shares of the Equity Fund and Bond Fund, SFIMC agreed to waivefees in the amount of 0.10% of the average daily net assets of Equity and Bond Fund Premier shares. This SFIMC waiver may be terminated by SFIMCwith 60 days notice to the Trust.
SFIMC and VP Management Corp. have agreed to waive their fees to the extent necessary to prevent the Money Market Fund’s net investment incomefrom decreasing below zero. This arrangement is voluntary and may be eliminated by SFIMC or VP Management Corp. at any time.
Related Party Disclosure
As of December 31, 2017, State Farm Mutual Automobile Insurance Company (“Auto Company”), the parent company of SFIMC, owned more than 10% ofthe outstanding shares of each Class of the following Funds:
Fund Class A Class B PremierLegacyClass B Institutional Class R-1 Class R-2 Class R-3
Small/Mid Cap Equity Fund 10.89% 84.96% 18.92% 80.10% — 33.86% 12.09% 51.24%
International Equity Fund 26.67% 94.73% 38.02% 95.42% 18.29% 56.71% 25.32% 56.19%
Small Cap Index Fund — 84.56% 18.12% 85.11% — 35.51% 14.53% 55.95%
International Index Fund 12.15% 89.50% 20.05% 90.99% — 43.60% 16.05% 50.55%
Equity and Bond Fund — 82.15% 10.25% 84.11% — 32.79% 15.60% 67.22%
Bond Fund — 59.99% — — — 29.01% 10.89% 59.42%
LifePath 2050 Fund — — — — — 10.76% — —
STATE FARM MUTUAL FUND TRUSTNOTES TO FINANCIAL STATEMENTS (continued)
181

Line of Credit
Auto Company, the parent company of SFIMC, has entered into a Line of Credit Agreement with the Trust. Under that agreement, a Fund may request andAuto Company, in its complete discretion, may lend money to a Fund for up to 30 days on an unsecured basis. The S&P 500 Index Fund, Small Cap IndexFund and International Index Fund may not borrow money from Auto Company under the agreement. Auto Company will not lend more than $50 million atany one time to the Funds and to the other mutual funds advised by SFIMC. Under the agreement, a Fund will pay interest to Auto Company on anyoutstanding loan at a benchmark interest rate that approximates the rate that creditworthy corporate issuers pay on short-term commercial paper. TheFunds did not borrow under the Line of Credit Agreement during the year ended December 31, 2017.
Officers and Trustees
Certain officers and/or trustees of the Trust are also officers and/or directors of SFIMC. The Trust made no payments to its officers or trustees except fortrustees’ fees paid to or accrued for the Trust’s independent trustees.
7. Investment TransactionsFor the year ended December 31, 2017, investment transactions (exclusive of short-term instruments) were as follows:
FundPurchases (excluding U.S.Government Obligations)
Sales/Maturities (excluding U.S.Government Obligations)
Purchases of U.S.Government Obligations
Sales/Maturities of U.S.Government Obligations
Equity Fund $316,085,896 $374,565,872 $ — $ —
Small/Mid Cap Equity Fund 267,052,027 286,394,779 — —
International Equity Fund 64,834,920 68,038,628 — —
S&P 500 Index Fund 36,943,457 44,334,556 — —
Small Cap Index Fund 70,563,618 95,406,299 — —
International Index Fund 10,542,255 14,454,856 — —
Equity and Bond Fund 12,300,000 22,750,000 — —
Bond Fund 122,037,227 173,722,838 16,875,313 17,000,000
Tax Advantaged Bond Fund 4,021,468 55,803,993 — —
LifePath Retirement Fund 41,332,529(a) 148,564,654(a) — —
LifePath 2020 Fund 146,732,760(a) 290,336,009(a) — —
LifePath 2030 Fund 146,088,735(a) 211,738,056(a) — —
LifePath 2040 Fund 109,170,610(a) 127,661,898(a) — —
LifePath 2050 Fund 26,249,967(a) 24,343,665(a) — —
(a) Purchases and sales relate primarily to investments in iShares ETFs. BlackRock, as subadviser to the LifePath Funds, is an affiliate of the LifePath Funds. BlackRock or itsaffiliates serve as the investment adviser to each of the iShares ETFs.
Cross trades for the year ended December 31, 2017 were executed by the S&P 500 Index Fund pursuant to Rule 17a-7 under the Investment CompanyAct of 1940 with other mutual funds that are affiliated with BlackRock, but are not part of the State Farm family of funds. Cross trading is the buying orselling of portfolio securities between funds. At its regularly scheduled quarterly meetings, the Board of Trustees reviews such transactions as of themost recent calendar quarter for compliance with the requirements and restrictions set forth by Rule 17a-7.
STATE FARM MUTUAL FUND TRUSTNOTES TO FINANCIAL STATEMENTS (continued)
182

8. Fund Share TransactionsAt December 31, 2017, the Funds were authorized to issue an unlimited number of shares (no par value) in an unlimited number of classes. Proceeds andpayments on Fund shares as shown in the Statements of Changes in Net Assets are in respect of the following number of shares and dollars by class(effective May 23, 2016, Legacy Class A shares were renamed Premier shares):
Year ended December 31, 2017:
Class A Dollar Amounts Class A Share Amounts
2017 Sales Reinvestments Redemptions Net Sales Reinvestments Redemptions Net
Equity Fund $12,287,380 $10,242,868 $ 29,756,861 $ (7,226,613) 1,209,616 958,214 2,867,012 (699,182)
Small/Mid Cap Equity Fund 10,537,994 10,052,071 17,593,079 2,996,986 853,291 843,293 1,404,460 292,124
International Equity Fund 3,610,196 736,513 7,194,585 (2,847,876) 300,819 56,874 602,269 (244,576)
S&P 500 Index Fund 57,515,438 13,720,233 108,424,311 (37,188,640) 3,173,351 693,023 5,907,664 (2,041,290)
Small Cap Index Fund 13,164,216 9,716,349 32,818,511 (9,937,946) 754,121 535,935 1,845,865 (555,809)
International Index Fund 6,996,378 1,706,647 16,438,162 (7,735,137) 582,247 129,895 1,349,498 (637,356)
Equity and Bond Fund 13,779,655 6,004,394 27,297,289 (7,513,240) 1,172,506 494,460 2,302,508 (635,542)
Bond Fund 15,240,480 5,074,334 43,025,779 (22,710,965) 1,356,661 451,028 3,826,512 (2,018,823)
Tax Advantaged Bond Fund 5,267,031 2,297,678 23,021,697 (15,456,988) 445,466 194,212 1,948,523 (1,308,845)
Money Market Fund 56,807,756 385,188 77,925,823 (20,732,879) 56,807,754 385,187 77,925,823 (20,732,882)
LifePath Retirement Fund 25,968,448 6,978,105 84,583,642 (51,637,089) 2,050,634 539,042 6,652,502 (4,062,826)
LifePath 2020 Fund 66,145,515 21,125,692 169,762,751 (82,491,544) 4,560,179 1,412,253 11,652,996 (5,680,564)
LifePath 2030 Fund 98,018,547 24,759,555 199,664,946 (76,886,844) 6,286,880 1,507,882 12,729,578 (4,934,816)
LifePath 2040 Fund 88,015,418 19,617,048 153,666,360 (46,033,894) 5,325,956 1,109,784 9,215,754 (2,780,014)
LifePath 2050 Fund 44,804,864 5,733,548 56,122,047 (5,583,635) 3,912,486 463,101 4,844,185 (468,598)
Class B Dollar Amounts Class B Share Amounts
2017 Sales Reinvestments Redemptions Net Sales Reinvestments Redemptions Net
Equity Fund $ 33,525 $153,910 $ 806,677 $ (619,242) 3,202 14,533 78,898 (61,163)
Small/Mid Cap Equity Fund 4,904 213,223 615,004 (396,877) 434 19,688 53,778 (33,656)
International Equity Fund — 14,233 206,500 (192,267) — 1,129 18,225 (17,096)
S&P 500 Index Fund 93,100 190,980 2,457,824 (2,173,744) 5,178 9,563 133,671 (118,930)
Small Cap Index Fund 14,175 129,075 584,282 (441,032) 856 7,326 34,198 (26,016)
International Index Fund 3,000 26,157 413,776 (384,619) 227 1,988 34,335 (32,120)
Equity and Bond Fund 5,173 123,340 472,907 (344,394) 464 10,130 40,184 (29,590)
Bond Fund 12,698 106,031 1,030,448 (911,719) 1,142 9,430 91,687 (81,115)
Tax Advantaged Bond Fund — 52,649 466,795 (414,146) — 4,449 39,429 (34,980)
Money Market Fund 251,270 691 374,265 (122,304) 251,272 691 374,265 (122,302)
LifePath Retirement Fund 7,148 108,360 2,153,177 (2,037,669) 572 8,294 168,024 (159,158)
LifePath 2020 Fund 14,537 427,726 5,872,652 (5,430,389) 1,037 28,726 405,142 (375,379)
LifePath 2030 Fund 78,035 601,038 7,291,439 (6,612,366) 5,218 36,716 465,839 (423,905)
LifePath 2040 Fund 17,322 572,517 7,670,188 (7,080,349) 1,078 32,474 465,334 (431,782)
STATE FARM MUTUAL FUND TRUSTNOTES TO FINANCIAL STATEMENTS (continued)
183

Premier Shares Dollar Amounts Premier Shares Share Amounts
2017 Sales Reinvestments Redemptions Net Sales Reinvestments Redemptions Net
Equity Fund $ 19,620,841 $11,218,140 $ 19,887,420 $ 10,951,561 1,805,299 998,869 1,861,466 942,702
Small/Mid Cap Equity Fund 10,715,017 11,348,207 13,162,709 8,900,515 872,124 976,610 1,083,722 765,012
International Equity Fund 5,766,070 992,927 4,678,074 2,080,923 479,791 75,854 393,614 162,031
S&P 500 Index Fund 91,214,563 16,874,211 101,100,303 6,988,471 4,973,700 847,094 5,494,448 326,346
Small Cap Index Fund 23,232,703 10,316,745 21,703,955 11,845,493 1,322,475 574,741 1,247,237 649,979
International Index Fund 13,255,426 2,397,017 14,154,347 1,498,096 1,095,015 182,830 1,172,804 105,041
Equity and Bond Fund 20,879,526 7,120,594 28,751,007 (750,887) 1,740,555 578,829 2,397,712 (78,328)
Bond Fund 26,680,742 9,486,882 68,383,621 (32,215,997) 2,373,908 842,700 6,078,717 (2,862,109)
Tax Advantaged Bond Fund 26,519,167 8,599,292 79,364,820 (44,246,361) 2,249,840 727,642 6,723,767 (3,746,285)
Money Market Fund 94,354,715 588,032 125,273,444 (30,330,697) 94,354,715 588,032 125,273,444 (30,330,697)
LifePath Retirement Fund 49,142,373 13,852,330 107,625,758 (44,631,055) 3,788,647 1,045,821 8,286,651 (3,452,183)
LifePath 2020 Fund 98,978,098 27,478,737 141,198,071 (14,741,236) 6,847,047 1,846,692 9,740,238 (1,046,499)
LifePath 2030 Fund 120,403,559 23,613,470 105,777,226 38,239,803 7,698,255 1,438,095 6,738,095 2,398,255
LifePath 2040 Fund 77,008,519 10,795,770 43,256,479 44,547,810 4,597,276 607,906 2,589,350 2,615,832
LifePath 2050 Fund 21,650,941 2,150,090 12,650,793 11,150,238 1,876,282 176,522 1,092,580 960,224
Legacy Class B Dollar Amounts Legacy Class B Share Amounts
2017 Sales Reinvestments Redemptions Net Sales Reinvestments Redemptions Net
Equity Fund $ 7,233 $273,597 $2,216,863 $(1,936,033) 669 24,385 209,875 (184,821)
Small/Mid Cap Equity Fund 26,236 231,442 1,105,589 (847,911) 2,367 22,021 99,932 (75,544)
International Equity Fund 750 12,457 273,363 (260,156) 66 971 24,095 (23,058)
S&P 500 Index Fund 54,142 293,138 7,242,525 (6,895,245) 3,035 14,533 391,675 (374,107)
Small Cap Index Fund 67,183 225,438 2,252,107 (1,959,486) 4,096 12,897 133,248 (116,255)
International Index Fund 14,627 28,924 613,478 (569,927) 1,281 2,191 50,791 (47,319)
Equity and Bond Fund — 167,139 1,559,473 (1,392,334) — 13,571 130,908 (117,337)
Bond Fund 11,971 50,027 873,127 (811,129) 1,066 4,440 77,584 (72,078)
Tax Advantaged Bond Fund — 2,764 40,397 (37,633) — 234 3,413 (3,179)
Money Market Fund 187,129 696 280,896 (93,071) 187,130 696 280,895 (93,069)
LifePath Retirement Fund 12,388 52,052 1,260,865 (1,196,425) 965 3,895 96,501 (91,641)
LifePath 2020 Fund 200 201,891 4,239,123 (4,037,032) 13 13,415 291,331 (277,903)
LifePath 2030 Fund 30,461 191,861 4,260,695 (4,038,373) 1,966 11,600 271,476 (257,910)
LifePath 2040 Fund 10,946 173,545 4,362,594 (4,178,103) 673 9,706 261,819 (251,440)
STATE FARM MUTUAL FUND TRUSTNOTES TO FINANCIAL STATEMENTS (continued)
184

Institutional Shares Dollar Amounts Institutional Shares Share Amounts
2017 Sales Reinvestments Redemptions Net Sales Reinvestments Redemptions Net
Equity Fund $ 8,094,430 $5,334,238 $31,450,818 $(18,022,150) 793,366 496,209 3,064,650 (1,775,075)
Small/Mid Cap Equity Fund 5,074,811 5,576,977 8,055,427 2,596,361 396,764 452,677 628,779 220,662
International Equity Fund 2,838,065 492,084 2,298,749 1,031,400 236,175 37,564 192,769 80,970
S&P 500 Index Fund 36,402,098 6,105,352 31,472,634 11,034,816 1,996,018 305,406 1,717,596 583,828
Small Cap Index Fund 11,111,112 6,021,905 12,130,075 5,002,942 626,156 329,246 681,335 274,067
International Index Fund 6,729,980 1,198,584 5,341,351 2,587,213 547,688 91,067 438,268 200,487
Equity and Bond Fund 4,066,240 1,952,610 5,037,139 981,711 342,277 160,420 432,734 69,963
Bond Fund 37,880,442 3,310,740 23,469,346 17,721,836 3,369,598 294,425 2,084,337 1,579,686
Money Market Fund 47,775,736 315,795 57,436,131 (9,344,600) 47,775,737 315,795 57,436,131 (9,344,599)
LifePath Retirement Fund 12,448,526 2,058,161 16,806,315 (2,299,628) 955,688 155,456 1,283,653 (172,509)
LifePath 2020 Fund 18,408,248 5,736,682 27,848,941 (3,704,011) 1,265,310 382,446 1,903,882 (256,126)
LifePath 2030 Fund 27,995,971 7,086,704 25,006,719 10,075,956 1,778,616 428,717 1,593,407 613,926
LifePath 2040 Fund 40,080,706 8,433,400 35,999,039 12,515,067 2,407,259 472,483 2,151,391 728,351
Class R-1 Dollar Amounts Class R-1 Share Amounts
2017 Sales Reinvestments Redemptions Net Sales Reinvestments Redemptions Net
Equity Fund $ 665,668 $187,395 $ 1,379,509 $ (526,446) 66,137 17,514 132,134 (48,483)
Small/Mid Cap Equity Fund 451,888 304,558 642,530 113,916 38,613 27,339 55,032 10,920
International Equity Fund 338,931 27,847 608,414 (241,636) 29,039 2,170 54,207 (22,998)
S&P 500 Index Fund 2,553,344 226,711 3,955,028 (1,174,973) 140,289 11,398 216,534 (64,847)
Small Cap Index Fund 782,914 159,316 1,231,767 (289,537) 43,977 8,812 70,286 (17,497)
International Index Fund 384,212 41,849 617,701 (191,640) 31,460 3,180 50,590 (15,950)
Equity and Bond Fund 436,171 127,460 480,051 83,580 37,735 10,637 41,460 6,912
Bond Fund 778,397 71,026 1,036,589 (187,166) 69,187 6,312 92,102 (16,603)
Money Market Fund 1,480,340 10,383 1,964,326 (473,603) 1,480,340 10,383 1,964,326 (473,603)
LifePath Retirement Fund 936,984 112,317 2,551,420 (1,502,119) 73,552 8,635 198,046 (115,859)
LifePath 2020 Fund 3,642,062 412,733 8,651,677 (4,596,882) 252,493 27,719 596,875 (316,663)
LifePath 2030 Fund 5,875,112 722,851 12,074,315 (5,476,352) 379,915 44,292 775,657 (351,450)
LifePath 2040 Fund 5,851,859 537,499 8,852,931 (2,463,573) 354,675 30,540 534,901 (149,686)
LifePath 2050 Fund 3,182,081 174,006 3,519,860 (163,773) 277,542 14,033 305,479 (13,904)
STATE FARM MUTUAL FUND TRUSTNOTES TO FINANCIAL STATEMENTS (continued)
185

Class R-2 Dollar Amounts Class R-2 Share Amounts
2017 Sales Reinvestments Redemptions Net Sales Reinvestments Redemptions Net
Equity Fund $ 2,495,105 $1,126,438 $ 3,391,673 $ 229,870 244,012 105,670 335,973 13,709
Small/Mid Cap Equity Fund 1,625,122 1,138,992 3,584,464 (820,350) 135,835 98,699 300,431 (65,897)
International Equity Fund 917,079 109,677 942,767 83,989 77,617 8,482 78,666 7,433
S&P 500 Index Fund 6,733,896 669,459 8,305,384 (902,029) 370,100 33,845 458,233 (54,288)
Small Cap Index Fund 2,119,571 519,092 2,987,922 (349,259) 121,152 28,632 172,169 (22,385)
International Index Fund 1,447,597 173,053 1,888,086 (267,436) 119,523 13,200 157,512 (24,789)
Equity and Bond Fund 1,514,523 338,914 1,573,633 279,804 129,982 28,219 135,271 22,930
Bond Fund 1,985,496 224,058 2,163,013 46,541 176,569 19,938 192,562 3,945
Money Market Fund 3,996,787 42,154 6,433,479 (2,394,538) 3,996,786 42,154 6,433,479 (2,394,539)
LifePath Retirement Fund 3,600,823 466,256 5,726,843 (1,659,764) 274,150 35,047 439,751 (130,554)
LifePath 2020 Fund 12,314,414 1,553,410 18,274,999 (4,407,175) 851,961 104,396 1,260,596 (304,239)
LifePath 2030 Fund 16,763,128 1,829,564 17,301,679 1,291,013 1,073,409 111,763 1,101,857 83,315
LifePath 2040 Fund 13,675,798 1,337,639 16,074,770 (1,061,333) 825,070 75,744 968,280 (67,466)
LifePath 2050 Fund 6,629,353 336,949 7,245,508 (279,206) 575,486 27,130 625,799 (23,183)
Class R-3 Dollar Amounts Class R-3 Share Amounts
2017 Sales Reinvestments Redemptions Net Sales Reinvestments Redemptions Net
Equity Fund $ 602,900 $155,736 $ 327,543 $ 431,093 53,748 14,474 32,129 36,093
Small/Mid Cap Equity Fund 289,916 150,715 767,292 (326,661) 23,186 12,405 57,175 (21,584)
International Equity Fund 550,415 30,073 51,978 528,510 42,029 2,299 4,188 40,140
S&P 500 Index Fund 917,487 112,787 473,744 556,530 50,437 5,656 24,517 31,576
Small Cap Index Fund 659,526 70,029 774,824 (45,269) 38,587 3,825 40,671 1,741
International Index Fund 565,895 33,946 122,410 477,431 42,931 2,578 10,169 35,340
Equity and Bond Fund 62,001 31,034 74,958 18,077 5,289 2,581 6,499 1,371
Bond Fund 130,205 18,993 95,195 54,003 11,576 1,688 8,528 4,736
Money Market Fund 194,826 6,075 89,026 111,875 194,827 6,075 89,026 111,876
LifePath Retirement Fund 201,060 33,849 371,246 (136,337) 15,504 2,560 28,407 (10,343)
LifePath 2020 Fund 276,443 83,206 866,464 (506,815) 18,936 5,562 60,977 (36,479)
LifePath 2030 Fund 776,534 121,889 677,721 220,702 49,688 7,369 44,219 12,838
LifePath 2040 Fund 1,209,356 163,277 1,038,541 334,092 71,676 9,046 60,588 20,134
STATE FARM MUTUAL FUND TRUSTNOTES TO FINANCIAL STATEMENTS (continued)
186

The following reflects the conversion of shares between classes (reflected as Sales and Redemptions) for the year ended December 31, 2017 (effectiveMay 23, 2016, Legacy Class A shares were renamed Premier shares).
Fund
Class ADollar Amounts
fromClass B
Class AShare Amounts
fromClass B
Class ADollar Amounts
fromPremier
Class AShare Amounts
fromPremier
Class ADollar Amounts
fromLegacy Class B
Class AShare Amounts
fromLegacy Class B
Class ADollar Amounts
fromClass R-2
Class AShare Amounts
fromClass R-2
Equity Fund $ 542,435 52,634 $ — — $1,452,254 143,447 $1,393,355 135,175
Small/Mid Cap Equity Fund 324,343 26,036 — — 738,667 59,532 1,646,047 133,955
International Equity Fund 115,357 9,780 — — 181,048 15,677 255,530 20,529
S&P 500 Index Fund 1,591,132 86,658 — — 5,695,363 312,884 1,677,583 91,055
Small Cap Index Fund 381,963 21,630 154 11 1,802,654 102,854 582,864 33,253
International Index Fund 264,238 21,841 — — 471,874 39,278 334,531 26,833
Equity and Bond Fund 206,208 17,589 — — 1,158,657 98,448 600,397 50,953
Bond Fund 580,209 51,549 — — 530,935 47,190 250,292 22,132
Tax Advantaged Bond Fund 104,629 8,822 — — 30,076 2,538 — —
Money Market Fund 30,537 30,537 (500) (500) 106,287 106,287 969,079 969,079
LifePath Retirement Fund 1,296,189 101,572 — — 891,614 70,194 132,511 10,285
LifePath 2020 Fund 3,486,181 238,747 (3,918) (284) 3,079,879 212,608 4,195,969 289,780
LifePath 2030 Fund 4,762,790 302,181 — — 3,234,936 207,180 2,630,024 166,021
LifePath 2040 Fund 5,082,075 307,265 — — 3,400,783 206,260 2,474,136 147,089
LifePath 2050 Fund — — — — — — 1,407,141 119,752
Fund
PremierDollar Amounts
fromClass A
PremierShare Amounts
fromClass A
Class R-2Dollar Amounts
fromClass R-1
Class R-2Share Amounts
fromClass R-1
Equity Fund $12,800,130 1,166,544 $1,017,184 97,724
Small/Mid Cap Equity Fund 6,746,828 544,470 394,886 33,402
International Equity Fund 3,384,933 277,250 207,715 17,614
S&P 500 Index Fund 48,562,892 2,623,933 2,006,696 110,679
Small Cap Index Fund 13,333,174 750,750 760,753 43,388
International Index Fund 7,324,666 598,338 345,794 28,771
Equity and Bond Fund 11,877,394 980,859 295,430 25,358
Bond Fund 12,717,849 1,130,666 531,523 47,191
Tax Advantaged Bond Fund 7,525,140 639,240 — —
Money Market Fund 11,360,640 11,360,640 181,487 181,487
LifePath Retirement Fund 25,748,926 1,977,899 1,288,672 97,221
LifePath 2020 Fund 58,167,720 4,000,933 5,441,220 374,309
LifePath 2030 Fund 83,824,656 5,327,897 7,409,267 474,623
LifePath 2040 Fund 58,146,774 3,447,777 4,497,784 271,065
LifePath 2050 Fund 15,239,381 1,310,494 1,826,452 157,958
STATE FARM MUTUAL FUND TRUSTNOTES TO FINANCIAL STATEMENTS (continued)
187

Year ended December 31, 2016 (effective May 23, 2016, Legacy Class A shares were renamed Premier shares; since commencement ofinvestment operations on May 16, 2016 for the LifePath 2050 Fund Premier Shares):
Class A Dollar Amounts Class A Share Amounts
2016 Sales Reinvestments Redemptions Net Sales Reinvestments Redemptions Net
Equity Fund $ 97,727,895 $ 8,251,976 $115,601,587 $ (9,621,716) 10,825,906 877,869 12,744,735 (1,040,960)
Small/Mid Cap Equity Fund 55,568,590 693,861 65,774,570 (9,512,119) 5,247,606 57,341 6,148,539 (843,592)
International Equity Fund 19,314,236 (27) 27,797,125 (8,482,916) 1,886,116 (3) 2,712,314 (826,201)
S&P 500 Index Fund 400,821,445 11,612,982 441,114,896 (28,680,469) 25,821,185 687,158 28,260,707 (1,752,364)
Small Cap Index Fund 114,980,068 6,100,964 87,418,308 33,662,724 8,038,470 357,622 5,993,934 2,402,158
International Index Fund 51,721,758 1,601,607 66,409,528 (13,086,163) 4,846,207 149,404 6,203,707 (1,208,096)
Equity and Bond Fund 100,343,113 5,310,121 124,114,449 (18,461,215) 9,132,675 477,540 11,259,147 (1,648,932)
Bond Fund 155,343,887 6,272,157 368,598,918 (206,982,874) 13,595,853 549,170 32,229,839 (18,084,816)
Tax Advantaged Bond Fund 74,705,167 4,594,610 420,615,436 (341,315,659) 6,199,617 381,538 34,804,822 (28,223,667)
Money Market Fund 298,596,227 — 365,292,020 (66,695,793) 298,596,227 — 365,292,019 (66,695,792)
LifePath Retirement Fund 227,057,809 6,124,967 719,912,647 (486,729,871) 19,014,825 502,063 60,265,438 (40,748,550)
LifePath 2020 Fund 418,502,527 31,690,897 958,268,927 (508,075,503) 30,341,990 2,298,105 69,387,400 (36,747,305)
LifePath 2030 Fund 441,859,764 38,281,572 823,063,727 (342,922,391) 30,725,018 2,627,425 57,172,447 (23,820,004)
LifePath 2040 Fund 344,414,524 29,735,813 392,323,230 (18,172,893) 23,265,306 1,955,017 26,409,992 (1,189,669)
LifePath 2050 Fund 81,095,129 8,905,321 124,873,480 (34,873,030) 7,985,994 848,931 12,288,901 (3,453,976)
Class B Dollar Amounts Class B Share Amounts
2016 Sales Reinvestments Redemptions Net Sales Reinvestments Redemptions Net
Equity Fund $ 210 $ 142,528 $ 561,111 $ (418,373) 23 15,309 61,974 (46,642)
Small/Mid Cap Equity Fund 7,264 18,798 504,966 (478,904) 749 1,689 50,901 (48,463)
International Equity Fund — — 219,164 (219,164) — — 22,175 (22,175)
S&P 500 Index Fund 101,778 139,798 2,288,044 (2,046,468) 6,297 8,209 144,484 (129,978)
Small Cap Index Fund 32,184 82,400 644,775 (530,191) 2,008 4,961 44,244 (37,275)
International Index Fund 2,792 23,012 429,156 (403,352) 268 2,141 40,146 (37,737)
Equity and Bond Fund 7,764 101,917 572,638 (462,957) 738 9,149 51,583 (41,696)
Bond Fund 94,258 95,901 948,732 (758,573) 8,245 8,395 83,107 (66,467)
Tax Advantaged Bond Fund 16,122 48,432 4,100,421 (4,035,867) 1,335 4,030 339,157 (333,792)
Money Market Fund 457,512 — 468,107 (10,595) 457,512 — 468,106 (10,594)
LifePath Retirement Fund 36,002 58,341 2,719,591 (2,625,248) 3,093 4,727 225,328 (217,508)
LifePath 2020 Fund 45,626 689,571 6,180,299 (5,445,102) 3,363 50,260 449,736 (396,113)
LifePath 2030 Fund 43,315 1,071,763 7,632,345 (6,517,267) 2,950 73,813 528,088 (451,325)
LifePath 2040 Fund 74,153 1,015,498 8,331,082 (7,241,431) 5,108 66,985 560,065 (487,972)
STATE FARM MUTUAL FUND TRUSTNOTES TO FINANCIAL STATEMENTS (continued)
188

Premier Shares Dollar Amounts Premier Shares Share Amounts
2016 Sales Reinvestments Redemptions Net Sales Reinvestments Redemptions Net
Equity Fund $100,803,560 $ 7,629,477 $ 91,518,347 $ 16,914,690 10,639,379 775,351 9,669,592 1,745,138
Small/Mid Cap Equity Fund 58,118,714 727,514 51,455,730 7,390,498 5,550,943 61,502 4,964,044 648,401
International Equity Fund 22,977,367 — 17,957,048 5,020,319 2,216,302 — 1,733,765 482,537
S&P 500 Index Fund 428,228,194 12,992,438 352,359,492 88,861,140 27,159,979 764,263 22,454,754 5,469,488
Small Cap Index Fund 81,858,205 5,575,231 111,290,009 (23,856,573) 5,645,791 329,896 7,820,625 (1,844,938)
International Index Fund 60,925,256 1,992,114 48,705,033 14,212,337 5,690,234 186,178 4,549,377 1,327,035
Equity and Bond Fund 121,150,651 5,896,759 83,705,183 43,342,227 10,869,182 524,651 7,517,296 3,876,537
Bond Fund 361,225,800 6,240,361 121,277,420 246,188,741 31,519,594 544,704 10,605,690 21,458,608
Tax Advantaged Bond Fund 432,449,880 5,536,781 65,144,538 372,842,123 35,834,354 462,042 5,470,090 30,826,306
Money Market Fund 292,309,402 42 203,139,661 89,169,783 292,309,402 42 203,139,661 89,169,783
LifePath Retirement Fund 658,332,666 10,166,778 221,414,416 447,085,028 53,670,788 811,969 17,969,552 36,513,205
LifePath 2020 Fund 865,886,124 39,028,837 378,916,960 525,998,001 62,793,561 2,844,667 27,368,662 38,269,566
LifePath 2030 Fund 741,296,637 32,890,060 313,501,272 460,685,425 51,275,757 2,255,832 21,668,841 31,862,748
LifePath 2040 Fund 323,932,330 13,822,558 231,569,826 106,185,062 21,732,979 905,184 15,574,710 7,063,453
LifePath 2050 Fund 92,107,999 3,033,548 7,508,365 87,633,182 9,059,906 290,014 707,266 8,642,654
Legacy Class B Dollar Amounts Legacy Class B Share Amounts
2016 Sales Reinvestments Redemptions Net Sales Reinvestments Redemptions Net
Equity Fund $ 33,196 $292,374 $1,768,483 $(1,442,913) 3,400 29,743 184,637 (151,494)
Small/Mid Cap Equity Fund (105) 24,312 1,029,309 (1,005,102) (10) 2,243 105,887 (103,654)
International Equity Fund — — 273,651 (273,651) — — 27,105 (27,105)
S&P 500 Index Fund 151,940 302,947 6,541,830 (6,086,943) 9,472 17,623 409,625 (382,530)
Small Cap Index Fund (107) 189,596 2,160,868 (1,971,379) (6) 11,498 150,954 (139,462)
International Index Fund 47 31,634 627,351 (595,670) 4 2,935 58,541 (55,602)
Equity and Bond Fund 8,646 180,900 1,618,171 (1,428,625) 791 16,046 144,111 (127,274)
Bond Fund 64,432 55,778 1,076,483 (956,273) 5,599 4,875 94,240 (83,766)
Tax Advantaged Bond Fund 6,603 2,724 495,943 (486,616) 550 226 41,070 (40,294)
Money Market Fund 370,936 — 665,763 (294,827) 370,936 — 665,763 (294,827)
LifePath Retirement Fund 26,866 40,305 2,056,831 (1,989,660) 2,182 3,199 166,645 (161,264)
LifePath 2020 Fund 55,952 393,068 5,161,726 (4,712,706) 3,981 28,380 372,124 (339,763)
LifePath 2030 Fund 107,922 388,146 4,739,692 (4,243,624) 7,125 26,458 326,736 (293,153)
LifePath 2040 Fund 20,045 351,481 4,525,468 (4,153,942) 1,397 22,883 300,913 (276,633)
STATE FARM MUTUAL FUND TRUSTNOTES TO FINANCIAL STATEMENTS (continued)
189

Institutional Shares Dollar Amounts Institutional Shares Share Amounts
2016 Sales Reinvestments Redemptions Net Sales Reinvestments Redemptions Net
Equity Fund $42,393,285 $ 3,827,904 $14,709,106 $31,512,083 4,637,082 405,070 1,560,212 3,481,940
Small/Mid Cap Equity Fund 7,839,455 396,032 8,300,991 (65,504) 682,348 31,722 744,214 (30,144)
International Equity Fund 2,073,802 10,785 2,651,860 (567,273) 201,549 1,077 256,416 (53,790)
S&P 500 Index Fund 38,811,107 4,912,959 27,248,890 16,475,176 2,443,811 288,141 1,698,879 1,033,073
Small Cap Index Fund 10,227,573 3,480,554 13,426,458 281,669 667,863 202,360 876,999 (6,776)
International Index Fund 5,529,818 1,026,486 7,926,378 (1,370,074) 512,593 95,576 729,192 (121,023)
Equity and Bond Fund 6,470,722 1,672,499 5,682,913 2,460,308 583,850 150,173 514,286 219,737
Bond Fund 43,169,197 2,933,994 22,061,931 24,041,260 3,779,274 256,775 1,932,524 2,103,525
Money Market Fund 68,388,948 3,126 59,056,038 9,336,036 68,388,948 3,126 59,056,038 9,336,036
LifePath Retirement Fund 19,365,308 1,732,392 20,835,559 262,141 1,575,599 138,556 1,694,169 19,986
LifePath 2020 Fund 24,644,994 8,449,418 28,336,361 4,758,051 1,762,367 611,391 2,023,373 350,385
LifePath 2030 Fund 30,331,519 10,309,528 23,910,122 16,730,925 2,076,446 702,762 1,633,071 1,146,137
LifePath 2040 Fund 50,068,797 12,195,935 35,456,454 26,808,278 3,323,869 794,548 2,340,052 1,778,365
Class R-1 Dollar Amounts Class R-1 Share Amounts
2016 Sales Reinvestments Redemptions Net Sales Reinvestments Redemptions Net
Equity Fund $ 1,023,134 $ 161,330 $ 922,401 $ 262,063 110,635 17,163 98,012 29,786
Small/Mid Cap Equity Fund 639,451 20,665 763,950 (103,834) 62,088 1,811 74,564 (10,665)
International Equity Fund 328,945 — 353,000 (24,055) 32,808 — 34,526 (1,718)
S&P 500 Index Fund 4,306,654 187,831 3,696,137 798,348 272,595 11,068 228,999 54,664
Small Cap Index Fund 904,226 98,765 682,370 320,621 61,586 5,803 45,751 21,638
International Index Fund 460,886 36,250 486,333 10,803 42,678 3,372 45,418 632
Equity and Bond Fund 674,112 99,148 439,037 334,223 61,847 9,035 40,162 30,720
Bond Fund 1,409,045 52,672 1,016,742 444,975 123,711 4,607 89,018 39,300
Money Market Fund 3,026,780 — 3,481,215 (454,435) 3,026,780 — 3,481,215 (454,435)
LifePath Retirement Fund 3,311,024 80,886 3,467,955 (76,045) 276,104 6,590 284,144 (1,450)
LifePath 2020 Fund 6,846,598 730,064 7,591,737 (15,075) 495,384 53,251 547,291 1,344
LifePath 2030 Fund 10,389,292 1,229,228 9,566,430 2,052,090 721,207 84,891 660,681 145,417
LifePath 2040 Fund 9,582,901 823,975 10,135,486 271,390 644,710 54,424 673,199 25,935
LifePath 2050 Fund 4,974,518 270,044 2,966,750 2,277,812 487,164 25,694 288,965 223,893
STATE FARM MUTUAL FUND TRUSTNOTES TO FINANCIAL STATEMENTS (continued)
190
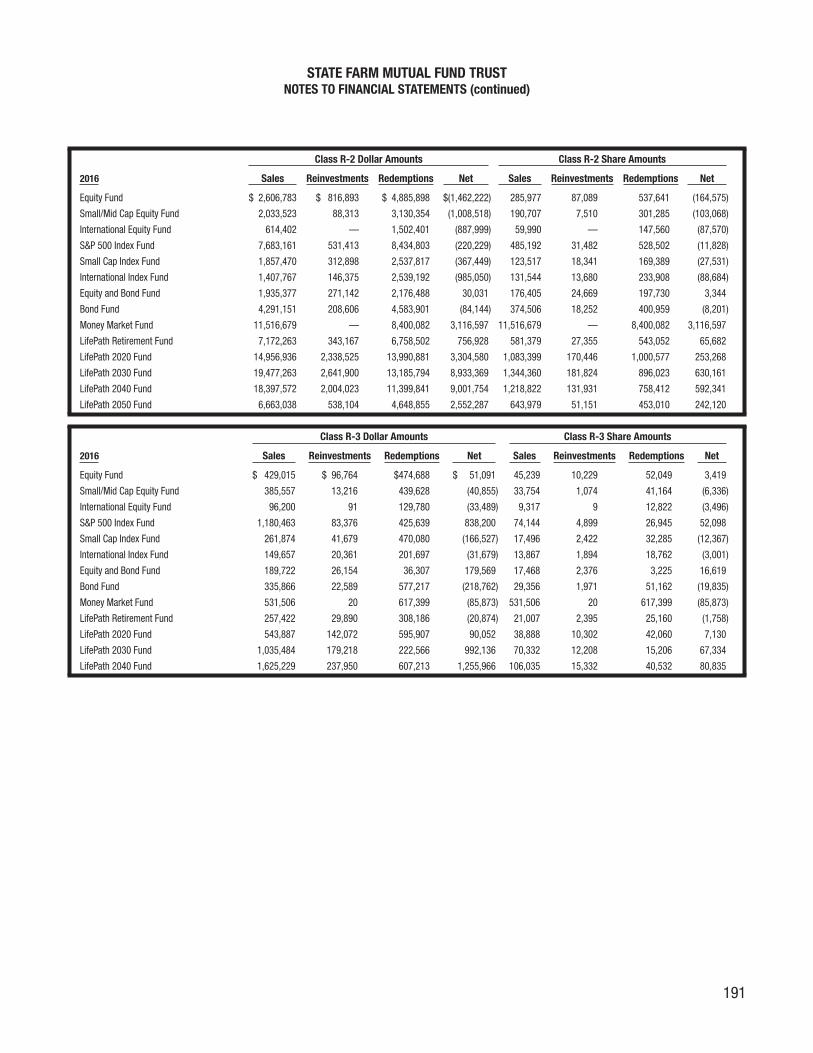
Class R-2 Dollar Amounts Class R-2 Share Amounts
2016 Sales Reinvestments Redemptions Net Sales Reinvestments Redemptions Net
Equity Fund $ 2,606,783 $ 816,893 $ 4,885,898 $(1,462,222) 285,977 87,089 537,641 (164,575)
Small/Mid Cap Equity Fund 2,033,523 88,313 3,130,354 (1,008,518) 190,707 7,510 301,285 (103,068)
International Equity Fund 614,402 — 1,502,401 (887,999) 59,990 — 147,560 (87,570)
S&P 500 Index Fund 7,683,161 531,413 8,434,803 (220,229) 485,192 31,482 528,502 (11,828)
Small Cap Index Fund 1,857,470 312,898 2,537,817 (367,449) 123,517 18,341 169,389 (27,531)
International Index Fund 1,407,767 146,375 2,539,192 (985,050) 131,544 13,680 233,908 (88,684)
Equity and Bond Fund 1,935,377 271,142 2,176,488 30,031 176,405 24,669 197,730 3,344
Bond Fund 4,291,151 208,606 4,583,901 (84,144) 374,506 18,252 400,959 (8,201)
Money Market Fund 11,516,679 — 8,400,082 3,116,597 11,516,679 — 8,400,082 3,116,597
LifePath Retirement Fund 7,172,263 343,167 6,758,502 756,928 581,379 27,355 543,052 65,682
LifePath 2020 Fund 14,956,936 2,338,525 13,990,881 3,304,580 1,083,399 170,446 1,000,577 253,268
LifePath 2030 Fund 19,477,263 2,641,900 13,185,794 8,933,369 1,344,360 181,824 896,023 630,161
LifePath 2040 Fund 18,397,572 2,004,023 11,399,841 9,001,754 1,218,822 131,931 758,412 592,341
LifePath 2050 Fund 6,663,038 538,104 4,648,855 2,552,287 643,979 51,151 453,010 242,120
Class R-3 Dollar Amounts Class R-3 Share Amounts
2016 Sales Reinvestments Redemptions Net Sales Reinvestments Redemptions Net
Equity Fund $ 429,015 $ 96,764 $474,688 $ 51,091 45,239 10,229 52,049 3,419
Small/Mid Cap Equity Fund 385,557 13,216 439,628 (40,855) 33,754 1,074 41,164 (6,336)
International Equity Fund 96,200 91 129,780 (33,489) 9,317 9 12,822 (3,496)
S&P 500 Index Fund 1,180,463 83,376 425,639 838,200 74,144 4,899 26,945 52,098
Small Cap Index Fund 261,874 41,679 470,080 (166,527) 17,496 2,422 32,285 (12,367)
International Index Fund 149,657 20,361 201,697 (31,679) 13,867 1,894 18,762 (3,001)
Equity and Bond Fund 189,722 26,154 36,307 179,569 17,468 2,376 3,225 16,619
Bond Fund 335,866 22,589 577,217 (218,762) 29,356 1,971 51,162 (19,835)
Money Market Fund 531,506 20 617,399 (85,873) 531,506 20 617,399 (85,873)
LifePath Retirement Fund 257,422 29,890 308,186 (20,874) 21,007 2,395 25,160 (1,758)
LifePath 2020 Fund 543,887 142,072 595,907 90,052 38,888 10,302 42,060 7,130
LifePath 2030 Fund 1,035,484 179,218 222,566 992,136 70,332 12,208 15,206 67,334
LifePath 2040 Fund 1,625,229 237,950 607,213 1,255,966 106,035 15,332 40,532 80,835
STATE FARM MUTUAL FUND TRUSTNOTES TO FINANCIAL STATEMENTS (continued)
191

The following reflects the conversion of shares between classes (reflected as Sales and Redemptions) for the year ended December 31, 2016 (effectiveMay 23, 2016, Legacy Class A shares were renamed Premier shares).
Fund
Class ADollar Amounts
fromClass B
Class AShare Amounts
fromClass B
Class ADollar Amounts
fromPremier
Class AShare Amounts
fromPremier
Class ADollar Amounts
fromLegacy Class B
Class AShare Amounts
fromLegacy Class B
Class ADollar Amounts
fromClass R-2
Class AShare Amounts
fromClass R-2
Equity Fund $ 269,321 29,729 $ 75,435,846 8,372,458 $ 710,906 74,649 $ 384,360 40,633
Small/Mid Cap Equity Fund 311,459 29,124 41,728,612 3,951,573 450,533 39,313 856,644 77,669
International Equity Fund 132,776 13,143 14,128,792 1,377,075 111,634 10,946 169,838 16,178
S&P 500 Index Fund 1,327,424 84,232 283,759,203 18,318,864 2,691,429 163,460 1,701,202 105,709
Small Cap Index Fund 411,513 27,480 94,495,065 6,640,553 864,133 53,869 871,674 55,713
International Index Fund 272,365 25,494 37,032,124 3,467,427 234,461 21,527 431,456 39,380
Equity and Bond Fund 252,874 22,726 65,771,605 5,990,128 603,855 53,267 46,964 4,175
Bond Fund 429,339 37,561 71,600,201 6,258,759 320,578 27,970 188,138 16,216
Tax Advantaged Bond Fund 45,390 3,763 9,740,962 805,705 11,524 965 — —
Money Market Fund 97,108 97,108 42,714,104 42,714,104 73,971 73,971 213,331 213,331
LifePath Retirement Fund 1,446,168 120,613 129,557,308 10,850,696 616,153 50,247 799,509 64,935
LifePath 2020 Fund 3,412,579 246,346 253,591,423 18,402,861 1,821,510 128,027 1,485,263 104,112
LifePath 2030 Fund 4,405,119 303,401 232,566,629 16,218,036 1,838,870 123,183 2,271,068 152,309
LifePath 2040 Fund 4,871,894 325,409 194,903,047 13,222,731 1,834,987 118,678 1,472,591 95,457
LifePath 2050 Fund — — — — — — 1,086,121 104,581
Fund
PremierDollar Amounts
fromClass A
PremierShare Amounts
fromClass A
PremierDollar Amounts
fromLegacy Class B
PremierShare Amounts
fromLegacy Class B
Equity Fund $ 91,948,338 9,724,942 $ 555,563 59,944
Small/Mid Cap Equity Fund 51,234,502 4,915,769 285,254 28,823
International Equity Fund 21,042,407 2,028,967 81,904 8,045
S&P 500 Index Fund 368,583,356 23,485,749 2,060,296 136,187
Small Cap Index Fund 69,301,901 4,820,383 708,482 52,234
International Index Fund 54,337,360 5,080,159 240,016 22,872
Equity and Bond Fund 106,726,775 9,594,867 502,525 45,926
Bond Fund 319,381,617 27,883,355 438,598 38,526
Tax Advantaged Bond Fund 387,294,740 32,087,968 16,529 1,370
Money Market Fund 144,967,308 144,967,308 83,748 83,748
LifePath Retirement Fund 601,703,109 49,134,387 619,907 51,363
LifePath 2020 Fund 803,309,820 58,335,152 1,787,405 132,441
LifePath 2030 Fund 677,200,622 46,946,036 1,561,380 111,358
LifePath 2040 Fund 296,212,429 19,898,617 1,494,389 103,788
LifePath 2050 Fund 85,068,626 8,391,127 — —
STATE FARM MUTUAL FUND TRUSTNOTES TO FINANCIAL STATEMENTS (continued)
192

Fund
Class R-1Dollar Amounts
fromPremier
Class R-1Share Amounts
fromPremier
Class R-2Dollar Amounts
fromPremier
Class R-2Share Amounts
fromPremier
Class R-2Dollar Amounts
fromClass R-1
Class R-2Share Amounts
fromClass R-1
Class R-3Dollar Amounts
fromInstitutional
Class R-3Share Amounts
fromInstitutional
Equity Fund $ 31,600 3,446 $ 29,338 3,206 $ 422,091 43,986 $105,097 11,374
Small/Mid Cap Equity Fund 15,623 1,541 13,225 1,267 279,036 26,282 39,730 3,645
International Equity Fund 3,716 357 934 89 93,911 9,064 — —
S&P 500 Index Fund 109,377 6,936 83,293 5,305 1,405,864 85,899 — —
Small Cap Index Fund 1,563 107 17,544 1,202 203,495 13,370 — —
International Index Fund 480 44 6,532 594 96,726 9,061 — —
Equity and Bond Fund 3,982 364 125,937 11,470 146,481 13,351 30,906 2,807
Bond Fund 36,078 3,143 77,376 6,752 228,700 19,937 73,934 6,440
Tax Advantaged Bond Fund — — — — — — — —
Money Market Fund 22,976 22,976 52,169 52,169 802,383 802,383 4,389 4,389
LifePath Retirement Fund 13,509 1,116 14,543 1,175 1,713,835 137,130 — —
LifePath 2020 Fund 30,127 2,172 124,130 8,937 3,296,054 237,482 — —
LifePath 2030 Fund 75,384 5,202 94,252 6,478 4,169,438 285,513 — —
LifePath 2040 Fund 34,467 2,304 34,182 2,274 6,283,001 410,946 16,258 1,059
LifePath 2050 Fund — — — — 1,468,213 139,157 — —
STATE FARM MUTUAL FUND TRUSTNOTES TO FINANCIAL STATEMENTS (continued)
193

FINANCIAL HIGHLIGHTSThe financial highlights table is intended to help you understand the financial performance of each Fund’s share classes for the past five years, or if the performanceinformation is not available for these periods, since the share class’ inception. Certain information reflects financial results for a single Fund share. The total returns withineach table represent the rate that an investor would have earned (or lost) on an investment in the Fund (assuming reinvestment of all dividends and distributions).
STATE FARM MUTUAL FUND TRUST EQUITY FUND(For a share outstanding throughout each period)
Income from investment operations Less distributions
Net asset value,beginningof period
Netinvestment
income (loss)(a)
Net gain (loss) oninvestments (both
realized and unrealized)
Total frominvestmentoperations
Netinvestmentincome(b)
Netrealized
gainTotal
distributions
Class A SharesYear ended 12/31/2017 $ 9.28 $ 0.07 $2.15 $2.22 $(0.08) $(0.76) $(0.84)Year ended 12/31/2016 9.17 0.05 0.67 0.72 (0.04) (0.57) (0.61)Year ended 12/31/2015 9.73 0.05 0.03 0.08 (0.06) (0.58) (0.64)Year ended 12/31/2014 8.62 0.05 1.25 1.30 (0.06) (0.13) (0.19)Year ended 12/31/2013 6.53 0.04 2.09 2.13 (0.04) — (0.04)
Class B SharesYear ended 12/31/2017 9.19 0.05 2.13 2.18 (0.05) (0.76) (0.81)Year ended 12/31/2016 9.12 (0.02) 0.66 0.64 — (0.57) (0.57)Year ended 12/31/2015 9.68 (0.01) 0.03 0.02 — (0.58) (0.58)Year ended 12/31/2014 8.59 (0.02) 1.24 1.22 — (0.13) (0.13)Year ended 12/31/2013 6.53 (0.02) 2.08 2.06 — — —
Premier Shares(e)Year ended 12/31/2017 9.72 0.09 2.24 2.33 (0.09) (0.76) (0.85)Year ended 12/31/2016 9.58 0.06 0.70 0.76 (0.05) (0.57) (0.62)Year ended 12/31/2015 10.12 0.06 0.03 0.09 (0.05) (0.58) (0.63)Year ended 12/31/2014 8.96 0.05 1.29 1.34 (0.05) (0.13) (0.18)Year ended 12/31/2013 6.79 0.04 2.17 2.21 (0.04) — (0.04)
Legacy Class B SharesYear ended 12/31/2017 9.70 0.06 2.24 2.30 (0.05) (0.76) (0.81)Year ended 12/31/2016 9.56 0.01 0.70 0.71 — (0.57) (0.57)Year ended 12/31/2015 10.10 0.02 0.02 0.04 — (0.58) (0.58)Year ended 12/31/2014 8.93 0.01 1.29 1.30 — (0.13) (0.13)Year ended 12/31/2013 6.77 0.01 2.15 2.16 — — —
Institutional SharesYear ended 12/31/2017 9.33 0.08 2.15 2.23 (0.08) (0.76) (0.84)Year ended 12/31/2016 9.22 0.07 0.68 0.75 (0.07) (0.57) (0.64)Year ended 12/31/2015 9.77 0.08 0.03 0.11 (0.08) (0.58) (0.66)Year ended 12/31/2014 8.65 0.07 1.25 1.32 (0.07) (0.13) (0.20)Year ended 12/31/2013 6.56 0.06 2.09 2.15 (0.06) — (0.06)
Class R-1 SharesYear ended 12/31/2017 9.28 0.06 2.14 2.20 (0.05) (0.76) (0.81)Year ended 12/31/2016 9.18 0.02 0.67 0.69 (0.02) (0.57) (0.59)Year ended 12/31/2015 9.73 0.02 0.04 0.06 (0.03) (0.58) (0.61)Year ended 12/31/2014 8.63 0.02 1.23 1.25 (0.02) (0.13) (0.15)Year ended 12/31/2013 6.53 0.01 2.09 2.10 — — —
Class R-2 SharesYear ended 12/31/2017 9.26 0.06 2.14 2.20 (0.07) (0.76) (0.83)Year ended 12/31/2016 9.16 0.04 0.66 0.70 (0.03) (0.57) (0.60)Year ended 12/31/2015 9.71 0.04 0.03 0.07 (0.04) (0.58) (0.62)Year ended 12/31/2014 8.60 0.04 1.24 1.28 (0.04) (0.13) (0.17)Year ended 12/31/2013 6.52 0.03 2.08 2.11 (0.03) — (0.03)
Class R-3 SharesYear ended 12/31/2017 9.34 0.07 2.16 2.23 (0.08) (0.76) (0.84)Year ended 12/31/2016 9.24 0.07 0.67 0.74 (0.07) (0.57) (0.64)Year ended 12/31/2015 9.77 0.08 0.03 0.11 (0.06) (0.58) (0.64)Year ended 12/31/2014 8.65 0.06 1.26 1.32 (0.07) (0.13) (0.20)Year ended 12/31/2013 6.56 0.05 2.08 2.13 (0.04) — (0.04)
(a) Average shares outstanding for the period were used to calculate net investment income per share.(b) Net investment income distribution represents less than $0.01 per share for Legacy Class B shares in 2014.(c) Total return does not reflect the effect of sales charge for Class A, Class B, Premier and Legacy Class B shares. All other classes do not have a sales charge.(d) The expense ratios include the effect of expense reduction changes.(e) Effective May 23, 2016, Legacy Class A shares were renamed Premier shares.
194 See accompanying notes to financial statements.
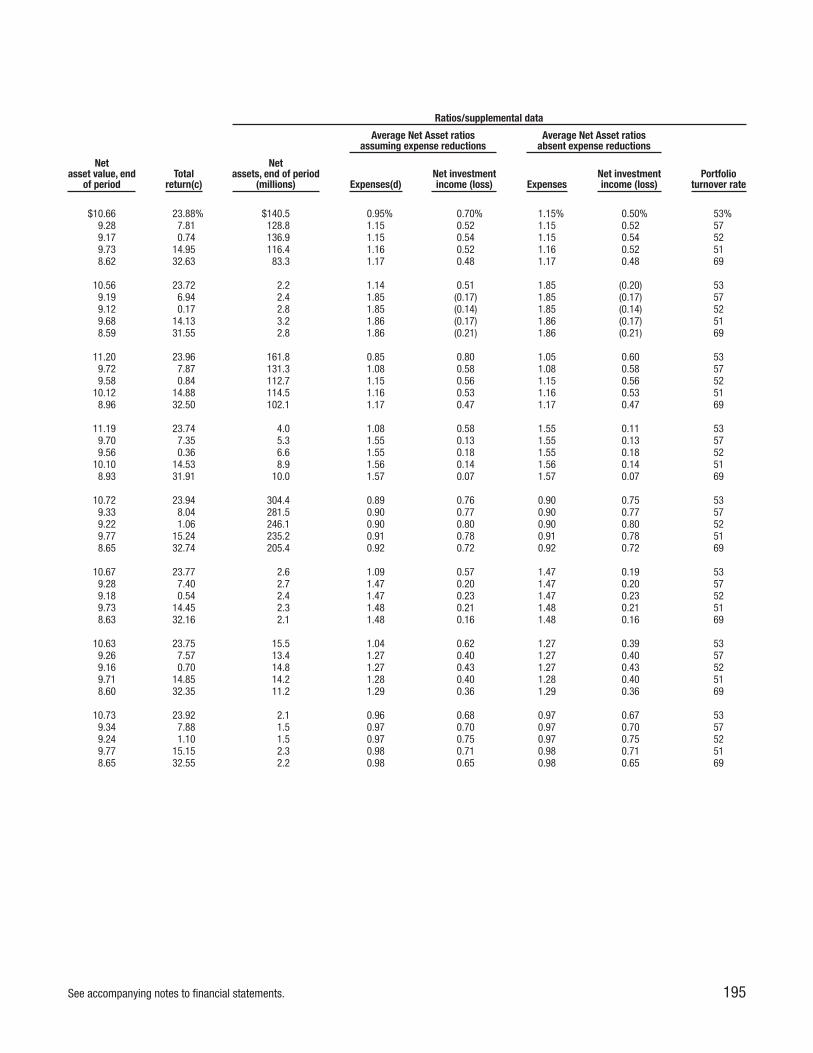
Ratios/supplemental data
Average Net Asset ratiosassuming expense reductions
Average Net Asset ratiosabsent expense reductions
Netasset value, end
of periodTotal
return(c)
Netassets, end of period
(millions) Expenses(d)Net investmentincome (loss) Expenses
Net investmentincome (loss)
Portfolioturnover rate
$10.66 23.88% $140.5 0.95% 0.70% 1.15% 0.50% 53%9.28 7.81 128.8 1.15 0.52 1.15 0.52 579.17 0.74 136.9 1.15 0.54 1.15 0.54 529.73 14.95 116.4 1.16 0.52 1.16 0.52 518.62 32.63 83.3 1.17 0.48 1.17 0.48 69
10.56 23.72 2.2 1.14 0.51 1.85 (0.20) 539.19 6.94 2.4 1.85 (0.17) 1.85 (0.17) 579.12 0.17 2.8 1.85 (0.14) 1.85 (0.14) 529.68 14.13 3.2 1.86 (0.17) 1.86 (0.17) 518.59 31.55 2.8 1.86 (0.21) 1.86 (0.21) 69
11.20 23.96 161.8 0.85 0.80 1.05 0.60 539.72 7.87 131.3 1.08 0.58 1.08 0.58 579.58 0.84 112.7 1.15 0.56 1.15 0.56 52
10.12 14.88 114.5 1.16 0.53 1.16 0.53 518.96 32.50 102.1 1.17 0.47 1.17 0.47 69
11.19 23.74 4.0 1.08 0.58 1.55 0.11 539.70 7.35 5.3 1.55 0.13 1.55 0.13 579.56 0.36 6.6 1.55 0.18 1.55 0.18 52
10.10 14.53 8.9 1.56 0.14 1.56 0.14 518.93 31.91 10.0 1.57 0.07 1.57 0.07 69
10.72 23.94 304.4 0.89 0.76 0.90 0.75 539.33 8.04 281.5 0.90 0.77 0.90 0.77 579.22 1.06 246.1 0.90 0.80 0.90 0.80 529.77 15.24 235.2 0.91 0.78 0.91 0.78 518.65 32.74 205.4 0.92 0.72 0.92 0.72 69
10.67 23.77 2.6 1.09 0.57 1.47 0.19 539.28 7.40 2.7 1.47 0.20 1.47 0.20 579.18 0.54 2.4 1.47 0.23 1.47 0.23 529.73 14.45 2.3 1.48 0.21 1.48 0.21 518.63 32.16 2.1 1.48 0.16 1.48 0.16 69
10.63 23.75 15.5 1.04 0.62 1.27 0.39 539.26 7.57 13.4 1.27 0.40 1.27 0.40 579.16 0.70 14.8 1.27 0.43 1.27 0.43 529.71 14.85 14.2 1.28 0.40 1.28 0.40 518.60 32.35 11.2 1.29 0.36 1.29 0.36 69
10.73 23.92 2.1 0.96 0.68 0.97 0.67 539.34 7.88 1.5 0.97 0.70 0.97 0.70 579.24 1.10 1.5 0.97 0.75 0.97 0.75 529.77 15.15 2.3 0.98 0.71 0.98 0.71 518.65 32.55 2.2 0.98 0.65 0.98 0.65 69
See accompanying notes to financial statements. 195

STATE FARM MUTUAL FUND TRUST SMALL/MID CAP EQUITY FUND
(For a share outstanding throughout each period)Income from investment operations Less distributions
Net asset value,beginningof period
Netinvestment
income (loss)(a)(b)
Net gain (loss) oninvestments (both
realized and unrealized)
Total frominvestmentoperations
Netinvestmentincome(c)
Netrealized
gainTotal
distributions
Class A SharesYear ended 12/31/2017 $12.03 $ 0.05 $ 1.36 $ 1.41 $(0.04) $(1.54) $(1.58)Year ended 12/31/2016 10.79 (0.01) 1.35 1.34 — (0.10) (0.10)Year ended 12/31/2015 11.81 0.02 (0.59) (0.57) (0.01) (0.44) (0.45)Year ended 12/31/2014 12.71 (0.03) 0.57 0.54 — (1.44) (1.44)Year ended 12/31/2013 10.49 (0.05) 3.62 3.57 (0.03) (1.32) (1.35)
Class B SharesYear ended 12/31/2017 11.07 0.02 1.26 1.28 (0.03) (1.54) (1.57)Year ended 12/31/2016 10.00 (0.08) 1.25 1.17 — (0.10) (0.10)Year ended 12/31/2015 11.04 (0.06) (0.54) (0.60) — (0.44) (0.44)Year ended 12/31/2014 12.04 (0.10) 0.54 0.44 — (1.44) (1.44)Year ended 12/31/2013 10.02 (0.11) 3.45 3.34 — (1.32) (1.32)
Premier Shares(f)Year ended 12/31/2017 11.77 0.06 1.33 1.39 (0.06) (1.54) (1.60)Year ended 12/31/2016 10.55 — 1.32 1.32 — (0.10) (0.10)Year ended 12/31/2015 11.55 0.02 (0.57) (0.55) (0.01) (0.44) (0.45)Year ended 12/31/2014 12.46 (0.03) 0.56 0.53 — (1.44) (1.44)Year ended 12/31/2013 10.31 (0.05) 3.55 3.50 (0.03) (1.32) (1.35)
Legacy Class B SharesYear ended 12/31/2017 10.78 0.03 1.22 1.25 (0.04) (1.54) (1.58)Year ended 12/31/2016 9.71 (0.05) 1.22 1.17 — (0.10) (0.10)Year ended 12/31/2015 10.70 (0.03) (0.52) (0.55) — (0.44) (0.44)Year ended 12/31/2014 11.69 (0.08) 0.53 0.45 — (1.44) (1.44)Year ended 12/31/2013 9.75 (0.09) 3.35 3.26 — (1.32) (1.32)
Institutional SharesYear ended 12/31/2017 12.39 0.06 1.40 1.46 (0.05) (1.54) (1.59)Year ended 12/31/2016 11.08 0.02 1.40 1.42 (0.01) (0.10) (0.11)Year ended 12/31/2015 12.11 0.05 (0.60) (0.55) (0.04) (0.44) (0.48)Year ended 12/31/2014 12.96 — 0.59 0.59 — (1.44) (1.44)Year ended 12/31/2013 10.68 (0.02) 3.68 3.66 (0.06) (1.32) (1.38)
Class R-1 SharesYear ended 12/31/2017 11.35 0.03 1.28 1.31 (0.03) (1.54) (1.57)Year ended 12/31/2016 10.21 (0.04) 1.28 1.24 — (0.10) (0.10)Year ended 12/31/2015 11.22 (0.02) (0.55) (0.57) — (0.44) (0.44)Year ended 12/31/2014 12.18 (0.07) 0.55 0.48 — (1.44) (1.44)Year ended 12/31/2013 10.11 (0.09) 3.48 3.39 — (1.32) (1.32)
Class R-2 SharesYear ended 12/31/2017 11.69 0.03 1.33 1.36 (0.03) (1.54) (1.57)Year ended 12/31/2016 10.50 (0.02) 1.31 1.29 — (0.10) (0.10)Year ended 12/31/2015 11.50 — (0.56) (0.56) — (0.44) (0.44)Year ended 12/31/2014 12.43 (0.05) 0.56 0.51 — (1.44) (1.44)Year ended 12/31/2013 10.29 (0.06) 3.54 3.48 (0.02) (1.32) (1.34)
Class R-3 SharesYear ended 12/31/2017 12.24 0.04 1.39 1.43 (0.04) (1.54) (1.58)Year ended 12/31/2016 10.95 0.01 1.38 1.39 — (0.10) (0.10)Year ended 12/31/2015 11.97 0.04 (0.59) (0.55) (0.03) (0.44) (0.47)Year ended 12/31/2014 12.84 (0.01) 0.58 0.57 — (1.44) (1.44)Year ended 12/31/2013 10.59 (0.03) 3.65 3.62 (0.05) (1.32) (1.37)
(a) Average shares outstanding for the period were used to calculate net investment income per share.(b) Net investment income represents less than $0.01 per share for Premier shares in 2016, Class R-2 shares in 2015 and Institutional shares in 2014.(c) Net investment income distribution represents less than $0.01 per share for Class R-3 shares in 2016 and Class R-2 shares in 2015.(d) Total return does not reflect the effect of sales charge for Class A, Class B, Premier and Legacy Class B shares. All other classes do not have a sales charge.(e) The expense ratios include the effect of expense reduction changes.(f) Effective May 23, 2016, Legacy Class A shares were renamed Premier shares.
196 See accompanying notes to financial statements.

Ratios/supplemental data
Average Net Asset ratiosassuming expense reductions
Average Net Asset ratiosabsent expense reductions
Netasset value, end
of periodTotal
return(d)
Netassets, end of period
(millions) Expenses(e)Net investmentincome (loss) Expenses
Net investmentincome (loss)
Portfolioturnover rate
$11.86 11.66% $ 95.9 1.00% 0.37% 1.39% (0.02)% 92%12.03 12.41 93.8 1.39 (0.08) 1.39 (0.08) 10410.79 (4.82) 93.2 1.39 0.14 1.39 0.14 12011.81 4.13 90.7 1.40 (0.26) 1.40 (0.26) 10212.71 34.04 80.2 1.40 (0.41) 1.40 (0.41) 116
10.78 11.45 11.2 1.17 0.20 2.09 (0.72) 9211.07 11.69 11.8 2.09 (0.78) 2.09 (0.78) 10410.00 (5.46) 11.2 2.09 (0.55) 2.09 (0.55) 12011.04 3.54 12.8 1.98 (0.84) 1.98 (0.84) 10212.04 33.33 13.6 1.90 (0.91) 1.90 (0.91) 116
11.56 11.70 115.9 0.90 0.47 1.29 0.08 9211.77 12.51 108.9 1.32 (0.02) 1.32 (0.02) 10410.55 (4.77) 90.8 1.39 0.14 1.39 0.14 12011.55 4.13 98.1 1.39 (0.26) 1.39 (0.26) 10212.46 33.92 98.1 1.40 (0.42) 1.40 (0.42) 116
10.45 11.45 8.8 1.11 0.26 1.79 (0.42) 9210.78 12.04 9.9 1.79 (0.48) 1.79 (0.48) 1049.71 (5.17) 10.0 1.79 (0.25) 1.79 (0.25) 120
10.70 3.73 12.0 1.79 (0.66) 1.79 (0.66) 10211.69 33.42 14.2 1.80 (0.82) 1.80 (0.82) 116
12.26 11.71 51.8 0.94 0.43 1.14 0.23 9212.39 12.81 49.6 1.14 0.17 1.14 0.17 10411.08 (4.56) 44.7 1.14 0.39 1.14 0.39 12012.11 4.44 46.8 1.14 (0.01) 1.14 (0.01) 10212.96 34.25 45.1 1.15 (0.16) 1.15 (0.16) 116
11.09 11.46 3.7 1.13 0.24 1.71 (0.34) 9211.35 12.14 3.7 1.71 (0.40) 1.71 (0.40) 10410.21 (5.11) 3.4 1.71 (0.18) 1.71 (0.18) 12011.22 3.83 3.3 1.71 (0.58) 1.71 (0.58) 10212.18 33.53 3.7 1.72 (0.74) 1.72 (0.74) 116
11.48 11.54 10.8 1.09 0.27 1.51 (0.15) 9211.69 12.28 11.8 1.51 (0.20) 1.51 (0.20) 10410.50 (4.88) 11.7 1.51 0.03 1.51 0.03 12011.50 3.98 11.9 1.52 (0.38) 1.52 (0.38) 10212.43 33.78 10.5 1.52 (0.52) 1.52 (0.52) 116
12.09 11.57 2.7 1.01 0.35 1.21 0.15 9212.24 12.71 3.0 1.21 0.10 1.21 0.10 10410.95 (4.60) 2.7 1.21 0.32 1.21 0.32 12011.97 4.33 2.8 1.21 (0.08) 1.21 (0.08) 10212.84 34.19 2.8 1.22 (0.23) 1.22 (0.23) 116
See accompanying notes to financial statements. 197

STATE FARM MUTUAL FUND TRUST INTERNATIONAL EQUITY FUND(For a share outstanding throughout each period)
Income from investment operations Less distributions
Net asset value,beginningof period
Netinvestment
income (loss)(a)(b)
Net gain (loss) oninvestments (both
realized and unrealized)
Total frominvestmentoperations
Netinvestmentincome(c)
Netrealized
gainTotal
distributions
Class A SharesYear ended 12/31/2017 $ 9.97 $ 0.03 $ 3.32 $ 3.35 $(0.05) $(0.27) $(0.32)Year ended 12/31/2016 10.55 0.02 (0.60) (0.58) — — —Year ended 12/31/2015 10.63 0.01 (0.07) (0.06) (0.02) — (0.02)Year ended 12/31/2014 11.42 0.03 (0.75) (0.72) (0.07) — (0.07)Year ended 12/31/2013 9.82 0.06 1.66 1.72 (0.12) — (0.12)
Class B SharesYear ended 12/31/2017 9.72 0.01 3.24 3.25 (0.04) (0.27) (0.31)Year ended 12/31/2016 10.35 (0.06) (0.57) (0.63) — — —Year ended 12/31/2015 10.48 (0.06) (0.07) (0.13) — — —Year ended 12/31/2014 11.27 (0.04) (0.75) (0.79) — — —Year ended 12/31/2013 9.69 0.02 1.64 1.66 (0.08) — (0.08)
Premier Shares(g)Year ended 12/31/2017 10.08 0.04 3.36 3.40 (0.07) (0.27) (0.34)Year ended 12/31/2016 10.65 0.02 (0.59) (0.57) — — —Year ended 12/31/2015 10.72 0.01 (0.06) (0.05) (0.02) — (0.02)Year ended 12/31/2014 11.53 0.03 (0.77) (0.74) (0.07) — (0.07)Year ended 12/31/2013 9.91 0.06 1.68 1.74 (0.12) — (0.12)
Legacy Class B SharesYear ended 12/31/2017 9.88 0.02 3.29 3.31 (0.04) (0.27) (0.31)Year ended 12/31/2016 10.49 (0.03) (0.58) (0.61) — — —Year ended 12/31/2015 10.59 (0.03) (0.07) (0.10) — — —Year ended 12/31/2014 11.38 (0.02) (0.75) (0.77) (0.02) — (0.02)Year ended 12/31/2013 9.79 0.02 1.64 1.66 (0.07) — (0.07)
Institutional SharesYear ended 12/31/2017 10.08 0.04 3.36 3.40 (0.06) (0.27) (0.33)Year ended 12/31/2016 10.64 0.04 (0.59) (0.55) (0.01) — (0.01)Year ended 12/31/2015 10.72 0.04 (0.07) (0.03) (0.05) — (0.05)Year ended 12/31/2014 11.53 0.06 (0.77) (0.71) (0.10) — (0.10)Year ended 12/31/2013 9.91 0.09 1.67 1.76 (0.14) — (0.14)
Class R-1 SharesYear ended 12/31/2017 9.88 0.01 3.30 3.31 (0.04) (0.27) (0.31)Year ended 12/31/2016 10.48 (0.02) (0.58) (0.60) — — —Year ended 12/31/2015 10.57 (0.03) (0.06) (0.09) — — —Year ended 12/31/2014 11.36 — (0.76) (0.76) (0.03) — (0.03)Year ended 12/31/2013 9.77 0.03 1.64 1.67 (0.08) — (0.08)
Class R-2 SharesYear ended 12/31/2017 9.95 0.02 3.31 3.33 (0.04) (0.27) (0.31)Year ended 12/31/2016 10.54 — (0.59) (0.59) — — —Year ended 12/31/2015 10.61 — (0.06) (0.06) (0.01) — (0.01)Year ended 12/31/2014 11.41 0.01 (0.75) (0.74) (0.06) — (0.06)Year ended 12/31/2013 9.81 0.04 1.67 1.71 (0.11) — (0.11)
Class R-3 SharesYear ended 12/31/2017 10.07 0.03 3.36 3.39 (0.06) (0.27) (0.33)Year ended 12/31/2016 10.64 0.03 (0.60) (0.57) — — —Year ended 12/31/2015 10.71 0.03 (0.06) (0.03) (0.04) — (0.04)Year ended 12/31/2014 11.52 0.05 (0.77) (0.72) (0.09) — (0.09)Year ended 12/31/2013 9.90 0.08 1.68 1.76 (0.14) — (0.14)
(a) Average shares outstanding for the period were used to calculate net investment income per share.(b) Net investment income represents less than $0.01 per share for Class R-2 shares in 2016 and 2015 and Class R-1 shares in 2014.(c) Net investment income distribution represents less than $0.01 per share for Class R-3 shares in 2016 and Class B shares in 2014.(d) Total return does not reflect the effect of sales charge for Class A, Class B, Premier and Legacy Class B shares. All other classes do not have a sales charge.(e) The expense ratios include the effect of expense reduction changes.(f) Net investment income (loss) represents less than 0.005% per share for Class R-2 shares in 2016.(g) Effective May 23, 2016, Legacy Class A shares were renamed Premier shares.
198 See accompanying notes to financial statements.

Ratios/supplemental data
Average Net Asset ratiosassuming expense reductions
Average Net Asset ratiosabsent expense reductions
Netasset value, end
of periodTotal
return(d)
Netassets, end of period
(millions) Expenses(e)Net investmentincome (loss) Expenses
Net investmentincome (loss)(f)
Portfolioturnover rate
$13.00 33.67% $41.1 1.29% 0.25% 1.49% 0.05% 45%9.97 (5.50) 34.0 1.50 0.19 1.53 0.16 103
10.55 (0.53) 44.6 1.50 0.08 1.52 0.06 12410.63 (6.29) 41.3 1.50 0.24 1.54 0.20 9611.42 17.53 41.0 1.50 0.56 1.53 0.53 77
12.66 33.46 11.3 1.44 0.09 2.19 (0.66) 459.72 (6.09) 8.8 2.20 (0.57) 2.22 (0.59) 103
10.35 (1.24) 9.6 2.20 (0.60) 2.22 (0.62) 12410.48 (6.97) 9.9 2.11 (0.35) 2.15 (0.39) 9611.27 17.16 10.8 1.85 0.24 1.88 0.21 77
13.14 33.74 63.8 1.19 0.35 1.39 0.15 4510.08 (5.35) 47.3 1.44 0.15 1.45 0.14 10310.65 (0.47) 44.8 1.50 0.11 1.52 0.09 12410.72 (6.43) 46.9 1.50 0.26 1.54 0.22 9611.53 17.53 51.2 1.50 0.59 1.53 0.56 77
12.88 33.59 11.3 1.38 0.16 1.89 (0.35) 459.88 (5.82) 8.9 1.90 (0.27) 1.92 (0.29) 103
10.49 (0.94) 9.7 1.90 (0.30) 1.92 (0.32) 12410.59 (6.73) 10.1 1.90 (0.14) 1.94 (0.18) 9611.38 16.99 11.5 1.90 0.20 1.93 0.17 77
13.15 33.79 24.4 1.23 0.30 1.24 0.29 4510.08 (5.19) 17.9 1.25 0.39 1.27 0.37 10310.64 (0.29) 19.5 1.25 0.35 1.27 0.33 12410.72 (6.19) 19.1 1.25 0.50 1.29 0.46 9611.53 17.81 20.3 1.25 0.83 1.28 0.80 77
12.88 33.53 2.7 1.42 0.11 1.81 (0.28) 459.88 (5.73) 2.3 1.82 (0.18) 1.84 (0.20) 103
10.48 (0.85) 2.5 1.82 (0.24) 1.84 (0.26) 12410.57 (6.71) 2.4 1.82 (0.04) 1.86 (0.08) 9611.36 17.14 2.9 1.82 0.27 1.85 0.24 77
12.97 33.56 6.2 1.37 0.17 1.61 (0.07) 459.95 (5.60) 4.7 1.62 0.03 1.65 0.00 103
10.54 (0.59) 5.8 1.62 (0.01) 1.64 (0.03) 12410.61 (6.48) 6.2 1.62 0.10 1.66 0.06 9611.41 17.40 5.8 1.62 0.40 1.65 0.37 77
13.13 33.70 2.8 1.30 0.23 1.31 0.22 4510.07 (5.34) 1.8 1.32 0.30 1.34 0.28 10310.64 (0.29) 1.9 1.32 0.29 1.34 0.27 12410.71 (6.25) 2.1 1.32 0.43 1.36 0.39 9611.52 17.74 2.2 1.32 0.76 1.35 0.73 77
See accompanying notes to financial statements. 199

STATE FARM MUTUAL FUND TRUST S&P 500 INDEX FUND(For a share outstanding throughout each period)
Income from investment operations Less distributions
Net asset value,beginningof period
Netinvestment
income (loss)(a)
Net gain (loss) oninvestments (both
realized and unrealized)
Total frominvestmentoperations
Netinvestment
income
Netrealized
gainTotal
distributions
Class A SharesYear ended 12/31/2017 $16.71 $0.29 $ 3.26 $ 3.55 $(0.30) $(0.20) $(0.50)Year ended 12/31/2016 15.37 0.24 1.49 1.73 (0.25) (0.14) (0.39)Year ended 12/31/2015 15.52 0.21 (0.11) 0.10 (0.21) (0.04) (0.25)Year ended 12/31/2014 13.91 0.18 1.61 1.79 (0.18) — (0.18)Year ended 12/31/2013 10.72 0.16 3.20 3.36 (0.17) — (0.17)
Class B SharesYear ended 12/31/2017 16.84 0.26 3.28 3.54 (0.25) (0.20) (0.45)Year ended 12/31/2016 15.48 0.12 1.50 1.62 (0.12) (0.14) (0.26)Year ended 12/31/2015 15.60 0.09 (0.10) (0.01) (0.07) (0.04) (0.11)Year ended 12/31/2014 13.98 0.08 1.60 1.68 (0.06) — (0.06)Year ended 12/31/2013 10.76 0.07 3.20 3.27 (0.05) — (0.05)
Premier Shares(d)Year ended 12/31/2017 16.80 0.31 3.29 3.60 (0.32) (0.20) (0.52)Year ended 12/31/2016 15.46 0.25 1.50 1.75 (0.27) (0.14) (0.41)Year ended 12/31/2015 15.60 0.21 (0.11) 0.10 (0.20) (0.04) (0.24)Year ended 12/31/2014 13.98 0.18 1.61 1.79 (0.17) — (0.17)Year ended 12/31/2013 10.76 0.16 3.22 3.38 (0.16) — (0.16)
Legacy Class B SharesYear ended 12/31/2017 16.99 0.27 3.33 3.60 (0.26) (0.20) (0.46)Year ended 12/31/2016 15.61 0.17 1.51 1.68 (0.16) (0.14) (0.30)Year ended 12/31/2015 15.73 0.14 (0.10) 0.04 (0.12) (0.04) (0.16)Year ended 12/31/2014 14.08 0.12 1.62 1.74 (0.09) — (0.09)Year ended 12/31/2013 10.82 0.11 3.24 3.35 (0.09) — (0.09)
Institutional SharesYear ended 12/31/2017 16.86 0.31 3.29 3.60 (0.31) (0.20) (0.51)Year ended 12/31/2016 15.51 0.28 1.50 1.78 (0.29) (0.14) (0.43)Year ended 12/31/2015 15.65 0.25 (0.11) 0.14 (0.24) (0.04) (0.28)Year ended 12/31/2014 14.02 0.22 1.62 1.84 (0.21) — (0.21)Year ended 12/31/2013 10.79 0.20 3.22 3.42 (0.19) — (0.19)
Class R-1 SharesYear ended 12/31/2017 16.77 0.27 3.28 3.55 (0.27) (0.20) (0.47)Year ended 12/31/2016 15.44 0.19 1.48 1.67 (0.20) (0.14) (0.34)Year ended 12/31/2015 15.59 0.15 (0.10) 0.05 (0.16) (0.04) (0.20)Year ended 12/31/2014 13.97 0.13 1.61 1.74 (0.12) — (0.12)Year ended 12/31/2013 10.75 0.12 3.21 3.33 (0.11) — (0.11)
Class R-2 SharesYear ended 12/31/2017 16.69 0.28 3.25 3.53 (0.28) (0.20) (0.48)Year ended 12/31/2016 15.35 0.22 1.49 1.71 (0.23) (0.14) (0.37)Year ended 12/31/2015 15.50 0.19 (0.11) 0.08 (0.19) (0.04) (0.23)Year ended 12/31/2014 13.89 0.16 1.60 1.76 (0.15) — (0.15)Year ended 12/31/2013 10.70 0.15 3.19 3.34 (0.15) — (0.15)
Class R-3 SharesYear ended 12/31/2017 16.82 0.29 3.30 3.59 (0.30) (0.20) (0.50)Year ended 12/31/2016 15.48 0.27 1.50 1.77 (0.29) (0.14) (0.43)Year ended 12/31/2015 15.62 0.23 (0.10) 0.13 (0.23) (0.04) (0.27)Year ended 12/31/2014 14.00 0.20 1.61 1.81 (0.19) — (0.19)Year ended 12/31/2013 10.78 0.19 3.22 3.41 (0.19) — (0.19)
(a) Average shares outstanding for the period were used to calculate net investment income per share.(b) Total return does not reflect the effect of sales charge for Class A, Class B, Premier and Legacy Class B shares. All other classes do not have a sales charge.(c) The expense ratios include the effect of expense reduction changes.(d) Effective May 23, 2016, Legacy Class A shares were renamed Premier shares.
200 See accompanying notes to financial statements.
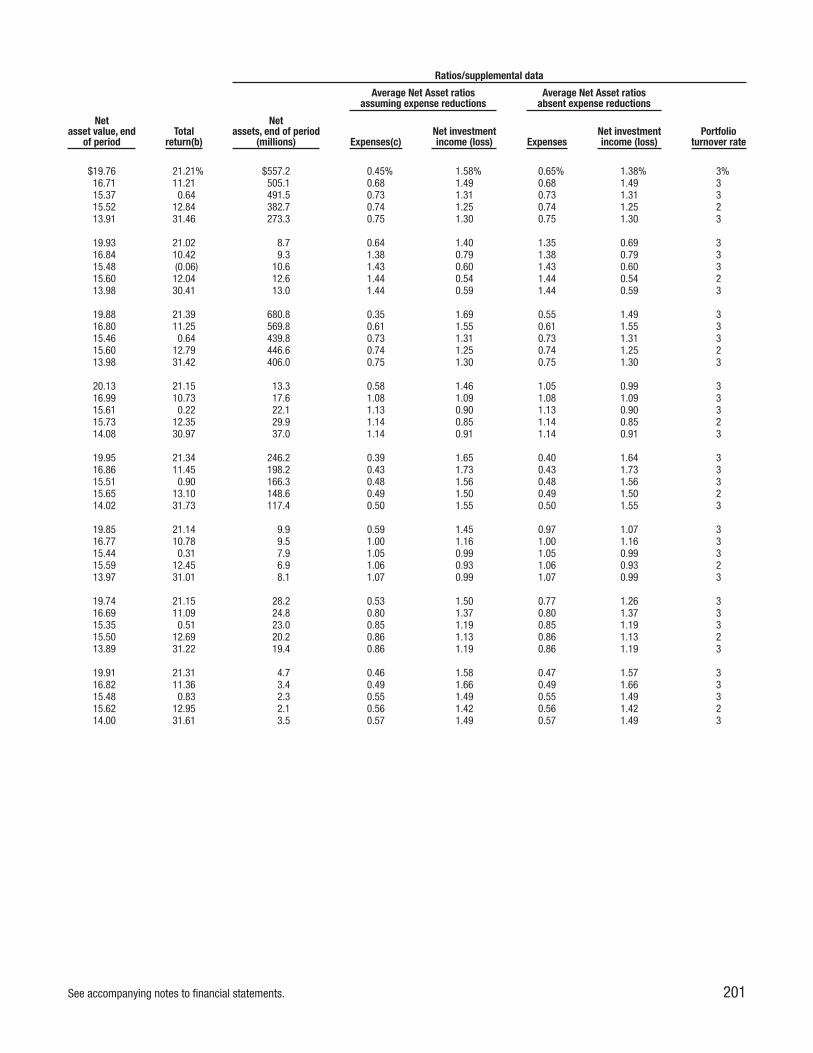
Ratios/supplemental data
Average Net Asset ratiosassuming expense reductions
Average Net Asset ratiosabsent expense reductions
Netasset value, end
of periodTotal
return(b)
Netassets, end of period
(millions) Expenses(c)Net investmentincome (loss) Expenses
Net investmentincome (loss)
Portfolioturnover rate
$19.76 21.21% $557.2 0.45% 1.58% 0.65% 1.38% 3%16.71 11.21 505.1 0.68 1.49 0.68 1.49 315.37 0.64 491.5 0.73 1.31 0.73 1.31 315.52 12.84 382.7 0.74 1.25 0.74 1.25 213.91 31.46 273.3 0.75 1.30 0.75 1.30 3
19.93 21.02 8.7 0.64 1.40 1.35 0.69 316.84 10.42 9.3 1.38 0.79 1.38 0.79 315.48 (0.06) 10.6 1.43 0.60 1.43 0.60 315.60 12.04 12.6 1.44 0.54 1.44 0.54 213.98 30.41 13.0 1.44 0.59 1.44 0.59 3
19.88 21.39 680.8 0.35 1.69 0.55 1.49 316.80 11.25 569.8 0.61 1.55 0.61 1.55 315.46 0.64 439.8 0.73 1.31 0.73 1.31 315.60 12.79 446.6 0.74 1.25 0.74 1.25 213.98 31.42 406.0 0.75 1.30 0.75 1.30 3
20.13 21.15 13.3 0.58 1.46 1.05 0.99 316.99 10.73 17.6 1.08 1.09 1.08 1.09 315.61 0.22 22.1 1.13 0.90 1.13 0.90 315.73 12.35 29.9 1.14 0.85 1.14 0.85 214.08 30.97 37.0 1.14 0.91 1.14 0.91 3
19.95 21.34 246.2 0.39 1.65 0.40 1.64 316.86 11.45 198.2 0.43 1.73 0.43 1.73 315.51 0.90 166.3 0.48 1.56 0.48 1.56 315.65 13.10 148.6 0.49 1.50 0.49 1.50 214.02 31.73 117.4 0.50 1.55 0.50 1.55 3
19.85 21.14 9.9 0.59 1.45 0.97 1.07 316.77 10.78 9.5 1.00 1.16 1.00 1.16 315.44 0.31 7.9 1.05 0.99 1.05 0.99 315.59 12.45 6.9 1.06 0.93 1.06 0.93 213.97 31.01 8.1 1.07 0.99 1.07 0.99 3
19.74 21.15 28.2 0.53 1.50 0.77 1.26 316.69 11.09 24.8 0.80 1.37 0.80 1.37 315.35 0.51 23.0 0.85 1.19 0.85 1.19 315.50 12.69 20.2 0.86 1.13 0.86 1.13 213.89 31.22 19.4 0.86 1.19 0.86 1.19 3
19.91 21.31 4.7 0.46 1.58 0.47 1.57 316.82 11.36 3.4 0.49 1.66 0.49 1.66 315.48 0.83 2.3 0.55 1.49 0.55 1.49 315.62 12.95 2.1 0.56 1.42 0.56 1.42 214.00 31.61 3.5 0.57 1.49 0.57 1.49 3
See accompanying notes to financial statements. 201

STATE FARM MUTUAL FUND TRUST SMALL CAP INDEX FUND(For a share outstanding throughout each period)
Income from investment operations Less distributions
Net asset value,beginningof period
Netinvestment
income (loss)(a)(b)
Net gain (loss) oninvestments (both
realized and unrealized)
Total frominvestmentoperations
Netinvestment
income
Netrealized
gainTotal
distributions
Class A SharesYear ended 12/31/2017 $16.82 $ 0.14 $ 2.24 $ 2.38 $(0.14) $(1.02) $(1.16)Year ended 12/31/2016 14.52 0.10 2.87 2.97 (0.11) (0.56) (0.67)Year ended 12/31/2015 16.23 0.06 (0.90) (0.84) (0.07) (0.80) (0.87)Year ended 12/31/2014 16.54 0.05 0.61 0.66 (0.05) (0.92) (0.97)Year ended 12/31/2013 12.65 0.03 4.72 4.75 (0.06) (0.80) (0.86)
Class B SharesYear ended 12/31/2017 16.37 0.11 2.19 2.30 (0.12) (1.02) (1.14)Year ended 12/31/2016 14.16 0.02 2.77 2.79 (0.02) (0.56) (0.58)Year ended 12/31/2015 15.88 (0.04) (0.88) (0.92) — (0.80) (0.80)Year ended 12/31/2014 16.25 (0.04) 0.59 0.55 — (0.92) (0.92)Year ended 12/31/2013 12.46 (0.05) 4.64 4.59 — (0.80) (0.80)
Premier Shares(e)Year ended 12/31/2017 16.66 0.16 2.22 2.38 (0.16) (1.02) (1.18)Year ended 12/31/2016 14.38 0.11 2.84 2.95 (0.11) (0.56) (0.67)Year ended 12/31/2015 16.08 0.06 (0.90) (0.84) (0.06) (0.80) (0.86)Year ended 12/31/2014 16.39 0.05 0.61 0.66 (0.05) (0.92) (0.97)Year ended 12/31/2013 12.53 0.03 4.68 4.71 (0.05) (0.80) (0.85)
Legacy Class B SharesYear ended 12/31/2017 16.25 0.12 2.16 2.28 (0.12) (1.02) (1.14)Year ended 12/31/2016 14.05 0.04 2.76 2.80 (0.04) (0.56) (0.60)Year ended 12/31/2015 15.73 — (0.88) (0.88) — (0.80) (0.80)Year ended 12/31/2014 16.08 (0.01) 0.58 0.57 — (0.92) (0.92)Year ended 12/31/2013 12.31 (0.03) 4.60 4.57 — (0.80) (0.80)
Institutional SharesYear ended 12/31/2017 16.95 0.15 2.26 2.41 (0.15) (1.02) (1.17)Year ended 12/31/2016 14.62 0.14 2.89 3.03 (0.14) (0.56) (0.70)Year ended 12/31/2015 16.34 0.10 (0.92) (0.82) (0.10) (0.80) (0.90)Year ended 12/31/2014 16.64 0.09 0.62 0.71 (0.09) (0.92) (1.01)Year ended 12/31/2013 12.71 0.07 4.75 4.82 (0.09) (0.80) (0.89)
Class R-1 SharesYear ended 12/31/2017 16.77 0.12 2.23 2.35 (0.11) (1.02) (1.13)Year ended 12/31/2016 14.49 0.06 2.84 2.90 (0.06) (0.56) (0.62)Year ended 12/31/2015 16.19 0.01 (0.90) (0.89) (0.01) (0.80) (0.81)Year ended 12/31/2014 16.51 — 0.60 0.60 — (0.92) (0.92)Year ended 12/31/2013 12.63 (0.01) 4.70 4.69 (0.01) (0.80) (0.81)
Class R-2 SharesYear ended 12/31/2017 16.82 0.12 2.24 2.36 (0.12) (1.02) (1.14)Year ended 12/31/2016 14.52 0.09 2.85 2.94 (0.08) (0.56) (0.64)Year ended 12/31/2015 16.22 0.04 (0.89) (0.85) (0.05) (0.80) (0.85)Year ended 12/31/2014 16.53 0.03 0.61 0.64 (0.03) (0.92) (0.95)Year ended 12/31/2013 12.64 0.01 4.72 4.73 (0.04) (0.80) (0.84)
Class R-3 SharesYear ended 12/31/2017 16.96 0.14 2.26 2.40 (0.13) (1.02) (1.15)Year ended 12/31/2016 14.63 0.13 2.89 3.02 (0.13) (0.56) (0.69)Year ended 12/31/2015 16.34 0.09 (0.91) (0.82) (0.09) (0.80) (0.89)Year ended 12/31/2014 16.64 0.08 0.62 0.70 (0.08) (0.92) (1.00)Year ended 12/31/2013 12.71 0.06 4.75 4.81 (0.08) (0.80) (0.88)
(a) Average shares outstanding for the period were used to calculate net investment income per share.(b) Net investment income represents less than $0.01 per share for Legacy Class B shares in 2015 and Class R-1 shares in 2014.(c) Total return does not reflect the effect of sales charge for Class A, Class B, Premier and Legacy Class B shares. All other classes do not have a sales charge.(d) The expense ratios include the effect of expense reduction changes.(e) Effective May 23, 2016, Legacy Class A shares were renamed Premier shares.
202 See accompanying notes to financial statements.

Ratios/supplemental data
Average Net Asset ratiosassuming expense reductions
Average Net Asset ratiosabsent expense reductions
Netasset value, end
of periodTotal
return(c)
Netassets, end of period
(millions) Expenses(d)Net investmentincome (loss) Expenses
Net investmentincome (loss)
Portfolioturnover rate
$18.04 14.09% $173.3 0.53% 0.79% 0.72% 0.60% 14%16.82 20.36 170.9 0.78 0.68 0.80 0.66 1914.52 (5.31) 112.7 0.93 0.38 0.93 0.38 1516.23 3.99 105.3 0.93 0.31 0.94 0.30 1616.54 37.57 87.0 0.94 0.23 0.96 0.21 14
17.53 14.00 13.8 0.66 0.66 1.27 0.05 1416.37 19.65 13.3 1.34 0.15 1.36 0.13 1914.16 (5.89) 12.0 1.59 (0.27) 1.59 (0.27) 1515.88 3.36 14.0 1.50 (0.25) 1.50 (0.25) 1616.25 36.84 14.4 1.49 (0.33) 1.51 (0.35) 14
17.86 14.24 204.5 0.43 0.89 0.62 0.70 1416.66 20.44 180.0 0.74 0.77 0.75 0.76 1914.38 (5.33) 181.9 0.93 0.39 0.93 0.39 1516.08 3.99 199.7 0.93 0.31 0.94 0.30 1616.39 37.63 200.6 0.94 0.21 0.96 0.19 14
17.39 14.01 24.6 0.63 0.69 1.12 0.20 1416.25 19.88 24.8 1.19 0.30 1.21 0.28 1914.05 (5.70) 23.4 1.33 0.00 1.33 0.00 1515.73 3.52 28.6 1.33 (0.08) 1.34 (0.09) 1616.08 37.14 32.9 1.34 (0.19) 1.36 (0.21) 14
18.19 14.18 104.0 0.47 0.85 0.47 0.85 1416.95 20.65 92.2 0.54 0.95 0.56 0.93 1914.62 (5.12) 79.6 0.68 0.63 0.68 0.63 1516.34 4.24 82.4 0.68 0.56 0.69 0.55 1616.64 37.96 78.7 0.69 0.47 0.71 0.45 14
17.99 14.00 4.2 0.67 0.66 1.04 0.29 1416.77 19.93 4.2 1.11 0.37 1.13 0.35 1914.49 (5.59) 3.3 1.25 0.08 1.25 0.08 1516.19 3.61 3.7 1.25 (0.01) 1.26 (0.02) 1616.51 37.25 4.2 1.26 (0.10) 1.28 (0.12) 14
18.04 14.02 10.2 0.61 0.71 0.84 0.48 1416.82 20.19 9.9 0.91 0.57 0.93 0.55 1914.52 (5.42) 9.0 1.05 0.27 1.05 0.27 1516.22 3.89 9.0 1.05 0.18 1.06 0.17 1616.53 37.44 8.9 1.06 0.10 1.08 0.08 14
18.21 14.10 2.7 0.54 0.77 0.54 0.77 1416.96 20.56 2.5 0.61 0.88 0.63 0.86 1914.63 (5.12) 2.3 0.75 0.57 0.75 0.57 1516.34 4.15 2.4 0.75 0.49 0.76 0.48 1616.64 37.86 2.5 0.76 0.40 0.78 0.38 14
See accompanying notes to financial statements. 203
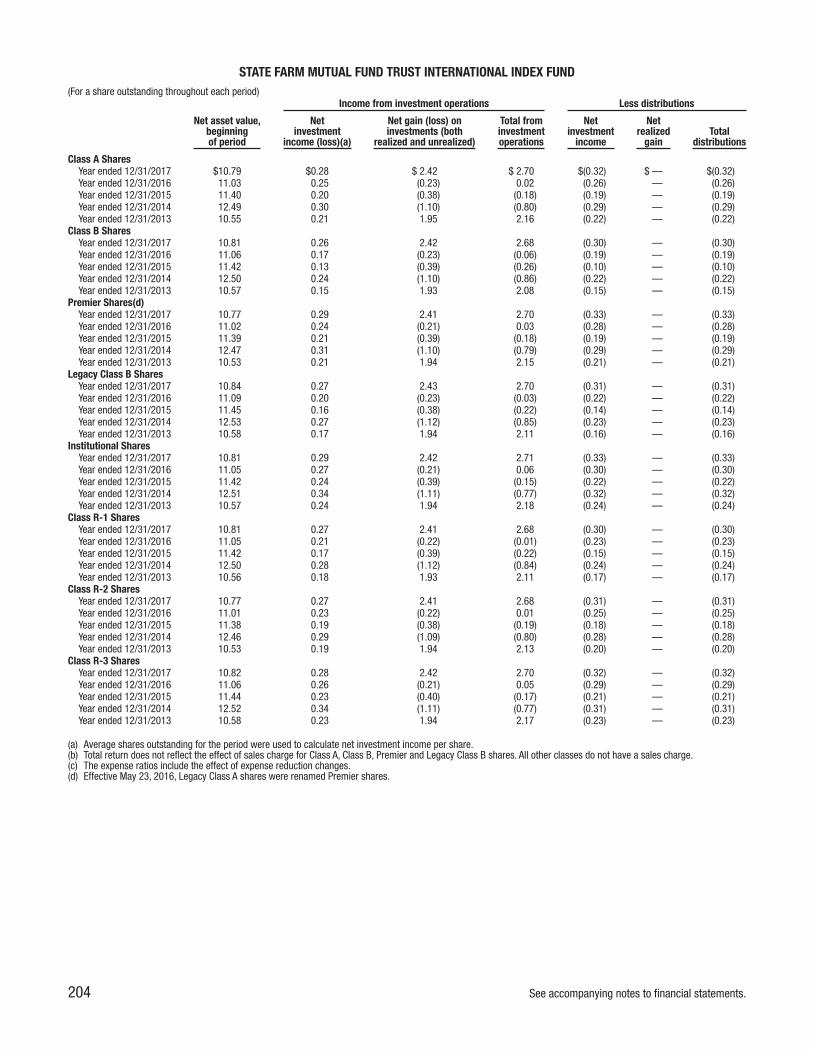
STATE FARM MUTUAL FUND TRUST INTERNATIONAL INDEX FUND(For a share outstanding throughout each period)
Income from investment operations Less distributions
Net asset value,beginningof period
Netinvestment
income (loss)(a)
Net gain (loss) oninvestments (both
realized and unrealized)
Total frominvestmentoperations
Netinvestment
income
Netrealized
gainTotal
distributions
Class A SharesYear ended 12/31/2017 $10.79 $0.28 $ 2.42 $ 2.70 $(0.32) $ — $(0.32)Year ended 12/31/2016 11.03 0.25 (0.23) 0.02 (0.26) — (0.26)Year ended 12/31/2015 11.40 0.20 (0.38) (0.18) (0.19) — (0.19)Year ended 12/31/2014 12.49 0.30 (1.10) (0.80) (0.29) — (0.29)Year ended 12/31/2013 10.55 0.21 1.95 2.16 (0.22) — (0.22)
Class B SharesYear ended 12/31/2017 10.81 0.26 2.42 2.68 (0.30) — (0.30)Year ended 12/31/2016 11.06 0.17 (0.23) (0.06) (0.19) — (0.19)Year ended 12/31/2015 11.42 0.13 (0.39) (0.26) (0.10) — (0.10)Year ended 12/31/2014 12.50 0.24 (1.10) (0.86) (0.22) — (0.22)Year ended 12/31/2013 10.57 0.15 1.93 2.08 (0.15) — (0.15)
Premier Shares(d)Year ended 12/31/2017 10.77 0.29 2.41 2.70 (0.33) — (0.33)Year ended 12/31/2016 11.02 0.24 (0.21) 0.03 (0.28) — (0.28)Year ended 12/31/2015 11.39 0.21 (0.39) (0.18) (0.19) — (0.19)Year ended 12/31/2014 12.47 0.31 (1.10) (0.79) (0.29) — (0.29)Year ended 12/31/2013 10.53 0.21 1.94 2.15 (0.21) — (0.21)
Legacy Class B SharesYear ended 12/31/2017 10.84 0.27 2.43 2.70 (0.31) — (0.31)Year ended 12/31/2016 11.09 0.20 (0.23) (0.03) (0.22) — (0.22)Year ended 12/31/2015 11.45 0.16 (0.38) (0.22) (0.14) — (0.14)Year ended 12/31/2014 12.53 0.27 (1.12) (0.85) (0.23) — (0.23)Year ended 12/31/2013 10.58 0.17 1.94 2.11 (0.16) — (0.16)
Institutional SharesYear ended 12/31/2017 10.81 0.29 2.42 2.71 (0.33) — (0.33)Year ended 12/31/2016 11.05 0.27 (0.21) 0.06 (0.30) — (0.30)Year ended 12/31/2015 11.42 0.24 (0.39) (0.15) (0.22) — (0.22)Year ended 12/31/2014 12.51 0.34 (1.11) (0.77) (0.32) — (0.32)Year ended 12/31/2013 10.57 0.24 1.94 2.18 (0.24) — (0.24)
Class R-1 SharesYear ended 12/31/2017 10.81 0.27 2.41 2.68 (0.30) — (0.30)Year ended 12/31/2016 11.05 0.21 (0.22) (0.01) (0.23) — (0.23)Year ended 12/31/2015 11.42 0.17 (0.39) (0.22) (0.15) — (0.15)Year ended 12/31/2014 12.50 0.28 (1.12) (0.84) (0.24) — (0.24)Year ended 12/31/2013 10.56 0.18 1.93 2.11 (0.17) — (0.17)
Class R-2 SharesYear ended 12/31/2017 10.77 0.27 2.41 2.68 (0.31) — (0.31)Year ended 12/31/2016 11.01 0.23 (0.22) 0.01 (0.25) — (0.25)Year ended 12/31/2015 11.38 0.19 (0.38) (0.19) (0.18) — (0.18)Year ended 12/31/2014 12.46 0.29 (1.09) (0.80) (0.28) — (0.28)Year ended 12/31/2013 10.53 0.19 1.94 2.13 (0.20) — (0.20)
Class R-3 SharesYear ended 12/31/2017 10.82 0.28 2.42 2.70 (0.32) — (0.32)Year ended 12/31/2016 11.06 0.26 (0.21) 0.05 (0.29) — (0.29)Year ended 12/31/2015 11.44 0.23 (0.40) (0.17) (0.21) — (0.21)Year ended 12/31/2014 12.52 0.34 (1.11) (0.77) (0.31) — (0.31)Year ended 12/31/2013 10.58 0.23 1.94 2.17 (0.23) — (0.23)
(a) Average shares outstanding for the period were used to calculate net investment income per share.(b) Total return does not reflect the effect of sales charge for Class A, Class B, Premier and Legacy Class B shares. All other classes do not have a sales charge.(c) The expense ratios include the effect of expense reduction changes.(d) Effective May 23, 2016, Legacy Class A shares were renamed Premier shares.
204 See accompanying notes to financial statements.

Ratios/supplemental data
Average Net Asset ratiosassuming expense reductions
Average Net Asset ratiosabsent expense reductions
Netasset value, end
of periodTotal
return(b)
Netassets, end of period
(millions) Expenses(c)Net investmentincome (loss) Expenses
Net investmentincome (loss)
Portfolioturnover rate
$13.17 24.99% $ 83.1 0.64% 2.32% 0.83% 2.13% 4%10.79 0.23 75.0 0.96 2.35 0.98 2.33 611.03 (1.67) 89.9 1.18 1.73 1.20 1.71 211.40 (6.33) 77.1 1.18 2.44 1.21 2.41 212.49 20.44 68.7 1.19 1.81 1.23 1.77 1
13.19 24.77 11.3 0.80 2.15 1.53 1.42 410.81 (0.52) 9.6 1.65 1.56 1.68 1.53 611.06 (2.28) 10.2 1.88 1.07 1.90 1.05 211.42 (6.93) 11.1 1.75 1.95 1.77 1.93 212.50 19.71 12.3 1.71 1.33 1.75 1.29 1
13.14 25.08 123.2 0.54 2.41 0.73 2.22 410.77 0.28 99.8 0.88 2.24 0.90 2.22 611.02 (1.63) 87.5 1.18 1.76 1.20 1.74 211.39 (6.39) 90.4 1.18 2.51 1.21 2.48 212.47 20.43 98.4 1.19 1.84 1.23 1.80 1
13.23 24.87 14.2 0.73 2.22 1.23 1.72 410.84 (0.22) 12.2 1.36 1.86 1.38 1.84 611.09 (2.06) 13.1 1.58 1.37 1.60 1.35 211.45 (6.71) 14.4 1.58 2.16 1.61 2.13 212.53 19.92 17.9 1.59 1.47 1.63 1.43 1
13.19 25.04 54.1 0.58 2.36 0.58 2.36 410.81 0.52 42.2 0.70 2.52 0.73 2.49 611.05 (1.45) 44.5 0.93 2.00 0.95 1.98 211.42 (6.11) 42.8 0.93 2.76 0.96 2.73 212.51 20.63 44.4 0.94 2.09 0.98 2.05 1
13.19 24.80 3.3 0.77 2.18 1.15 1.80 410.81 (0.04) 2.9 1.27 1.93 1.29 1.91 611.05 (2.05) 3.0 1.50 1.44 1.52 1.42 211.42 (6.65) 3.1 1.50 2.28 1.53 2.25 212.50 19.97 3.7 1.51 1.54 1.55 1.50 1
13.14 24.87 9.0 0.72 2.24 0.95 2.01 410.77 0.10 7.7 1.08 2.18 1.10 2.16 611.01 (1.72) 8.8 1.30 1.58 1.32 1.56 211.38 (6.49) 7.5 1.30 2.31 1.33 2.28 212.46 20.23 7.4 1.31 1.69 1.35 1.65 1
13.20 24.98 2.9 0.65 2.27 0.65 2.27 410.82 0.46 2.0 0.77 2.42 0.79 2.40 611.06 (1.53) 2.1 1.00 1.94 1.02 1.92 211.44 (6.18) 2.1 1.00 2.69 1.03 2.66 212.52 20.53 2.3 1.01 2.00 1.05 1.96 1
See accompanying notes to financial statements. 205
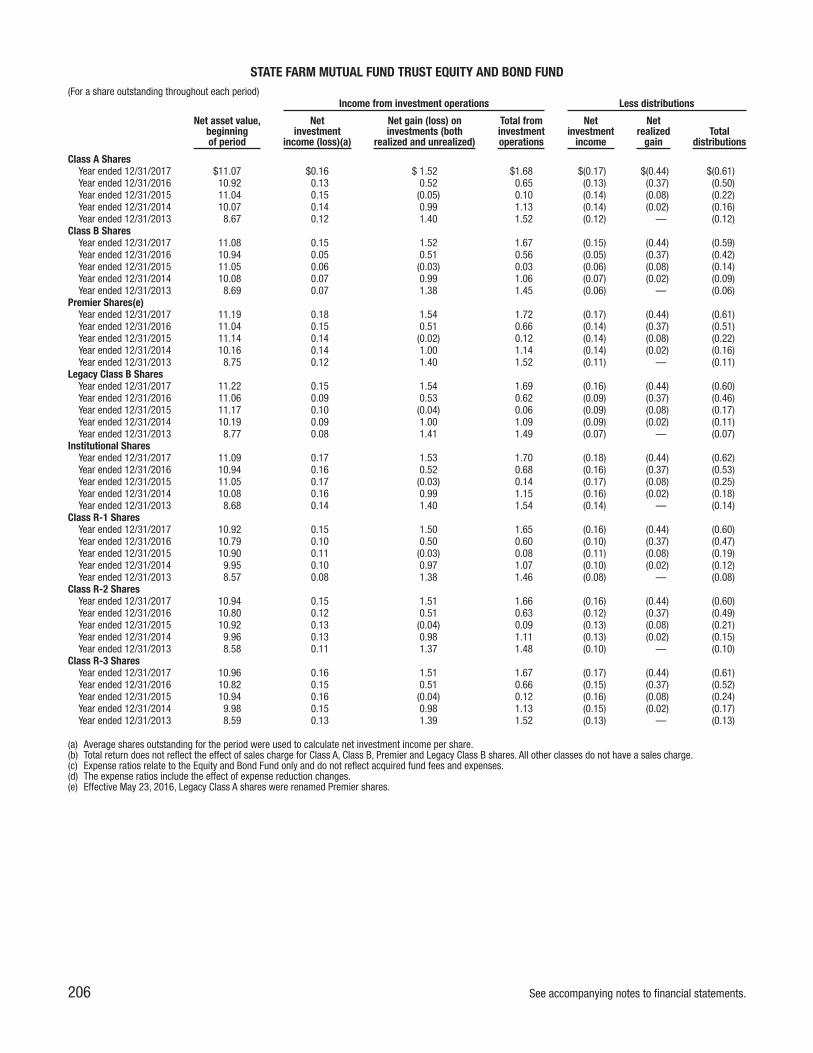
STATE FARM MUTUAL FUND TRUST EQUITY AND BOND FUND(For a share outstanding throughout each period)
Income from investment operations Less distributions
Net asset value,beginningof period
Netinvestment
income (loss)(a)
Net gain (loss) oninvestments (both
realized and unrealized)
Total frominvestmentoperations
Netinvestment
income
Netrealized
gainTotal
distributions
Class A SharesYear ended 12/31/2017 $11.07 $0.16 $ 1.52 $1.68 $(0.17) $(0.44) $(0.61)Year ended 12/31/2016 10.92 0.13 0.52 0.65 (0.13) (0.37) (0.50)Year ended 12/31/2015 11.04 0.15 (0.05) 0.10 (0.14) (0.08) (0.22)Year ended 12/31/2014 10.07 0.14 0.99 1.13 (0.14) (0.02) (0.16)Year ended 12/31/2013 8.67 0.12 1.40 1.52 (0.12) — (0.12)
Class B SharesYear ended 12/31/2017 11.08 0.15 1.52 1.67 (0.15) (0.44) (0.59)Year ended 12/31/2016 10.94 0.05 0.51 0.56 (0.05) (0.37) (0.42)Year ended 12/31/2015 11.05 0.06 (0.03) 0.03 (0.06) (0.08) (0.14)Year ended 12/31/2014 10.08 0.07 0.99 1.06 (0.07) (0.02) (0.09)Year ended 12/31/2013 8.69 0.07 1.38 1.45 (0.06) — (0.06)
Premier Shares(e)Year ended 12/31/2017 11.19 0.18 1.54 1.72 (0.17) (0.44) (0.61)Year ended 12/31/2016 11.04 0.15 0.51 0.66 (0.14) (0.37) (0.51)Year ended 12/31/2015 11.14 0.14 (0.02) 0.12 (0.14) (0.08) (0.22)Year ended 12/31/2014 10.16 0.14 1.00 1.14 (0.14) (0.02) (0.16)Year ended 12/31/2013 8.75 0.12 1.40 1.52 (0.11) — (0.11)
Legacy Class B SharesYear ended 12/31/2017 11.22 0.15 1.54 1.69 (0.16) (0.44) (0.60)Year ended 12/31/2016 11.06 0.09 0.53 0.62 (0.09) (0.37) (0.46)Year ended 12/31/2015 11.17 0.10 (0.04) 0.06 (0.09) (0.08) (0.17)Year ended 12/31/2014 10.19 0.09 1.00 1.09 (0.09) (0.02) (0.11)Year ended 12/31/2013 8.77 0.08 1.41 1.49 (0.07) — (0.07)
Institutional SharesYear ended 12/31/2017 11.09 0.17 1.53 1.70 (0.18) (0.44) (0.62)Year ended 12/31/2016 10.94 0.16 0.52 0.68 (0.16) (0.37) (0.53)Year ended 12/31/2015 11.05 0.17 (0.03) 0.14 (0.17) (0.08) (0.25)Year ended 12/31/2014 10.08 0.16 0.99 1.15 (0.16) (0.02) (0.18)Year ended 12/31/2013 8.68 0.14 1.40 1.54 (0.14) — (0.14)
Class R-1 SharesYear ended 12/31/2017 10.92 0.15 1.50 1.65 (0.16) (0.44) (0.60)Year ended 12/31/2016 10.79 0.10 0.50 0.60 (0.10) (0.37) (0.47)Year ended 12/31/2015 10.90 0.11 (0.03) 0.08 (0.11) (0.08) (0.19)Year ended 12/31/2014 9.95 0.10 0.97 1.07 (0.10) (0.02) (0.12)Year ended 12/31/2013 8.57 0.08 1.38 1.46 (0.08) — (0.08)
Class R-2 SharesYear ended 12/31/2017 10.94 0.15 1.51 1.66 (0.16) (0.44) (0.60)Year ended 12/31/2016 10.80 0.12 0.51 0.63 (0.12) (0.37) (0.49)Year ended 12/31/2015 10.92 0.13 (0.04) 0.09 (0.13) (0.08) (0.21)Year ended 12/31/2014 9.96 0.13 0.98 1.11 (0.13) (0.02) (0.15)Year ended 12/31/2013 8.58 0.11 1.37 1.48 (0.10) — (0.10)
Class R-3 SharesYear ended 12/31/2017 10.96 0.16 1.51 1.67 (0.17) (0.44) (0.61)Year ended 12/31/2016 10.82 0.15 0.51 0.66 (0.15) (0.37) (0.52)Year ended 12/31/2015 10.94 0.16 (0.04) 0.12 (0.16) (0.08) (0.24)Year ended 12/31/2014 9.98 0.15 0.98 1.13 (0.15) (0.02) (0.17)Year ended 12/31/2013 8.59 0.13 1.39 1.52 (0.13) — (0.13)
(a) Average shares outstanding for the period were used to calculate net investment income per share.(b) Total return does not reflect the effect of sales charge for Class A, Class B, Premier and Legacy Class B shares. All other classes do not have a sales charge.(c) Expense ratios relate to the Equity and Bond Fund only and do not reflect acquired fund fees and expenses.(d) The expense ratios include the effect of expense reduction changes.(e) Effective May 23, 2016, Legacy Class A shares were renamed Premier shares.
206 See accompanying notes to financial statements.

Ratios/supplemental data
Average Net Asset ratiosassuming expense reductions
Average Net Asset ratiosabsent expense reductions
Netasset value, end
of periodTotal
return(b)
Netassets, end of period
(millions) Expenses(c)(d)Net investmentincome (loss) Expenses(c)
Net investmentincome (loss)
Portfolioturnover rate
$12.14 15.20% $136.7 0.06% 1.38% 0.34% 1.10% 3%11.07 5.99 131.7 0.25 1.16 0.31 1.10 210.92 0.90 147.9 0.25 1.34 0.31 1.28 111.04 11.20 113.8 0.25 1.35 0.33 1.27 110.07 17.53 82.6 0.25 1.30 0.34 1.21 0
12.16 15.09 14.8 0.23 1.23 1.04 0.42 311.08 5.17 13.8 0.95 0.49 1.01 0.43 210.94 0.27 14.1 0.95 0.58 1.02 0.51 111.05 10.53 14.4 0.87 0.67 0.96 0.58 110.08 16.74 12.8 0.79 0.70 0.88 0.61 0
12.30 15.40 167.7 (0.04) 1.49 0.34 1.11 311.19 5.97 153.5 0.18 1.32 0.31 1.19 211.04 1.04 108.6 0.25 1.28 0.32 1.21 111.14 11.19 111.2 0.25 1.29 0.33 1.21 110.16 17.46 101.9 0.25 1.22 0.34 1.13 0
12.31 15.07 22.3 0.16 1.29 0.74 0.71 311.22 5.60 21.6 0.65 0.78 0.71 0.72 211.06 0.54 22.7 0.65 0.87 0.72 0.80 111.17 10.71 24.8 0.65 0.87 0.73 0.79 110.19 17.06 24.8 0.65 0.80 0.74 0.71 0
12.17 15.33 40.5 0.00 1.46 0.09 1.37 311.09 6.26 36.2 0.00 1.46 0.06 1.40 210.94 1.22 33.3 0.00 1.56 0.07 1.49 111.05 11.44 29.3 0.00 1.54 0.08 1.46 110.08 17.78 24.5 0.00 1.49 0.09 1.40 0
11.97 15.08 4.0 0.19 1.27 0.66 0.80 310.92 5.59 3.6 0.57 0.89 0.63 0.83 210.79 0.68 3.2 0.57 0.99 0.64 0.92 110.90 10.79 2.9 0.57 0.97 0.65 0.89 19.95 17.07 2.5 0.57 0.86 0.66 0.77 0
12.00 15.20 8.4 0.14 1.32 0.46 1.00 310.94 5.86 7.4 0.37 1.05 0.43 0.99 210.80 0.78 7.3 0.37 1.17 0.44 1.10 110.92 11.11 6.9 0.37 1.21 0.45 1.13 19.96 17.33 5.3 0.37 1.13 0.46 1.04 0
12.02 15.26 2.0 0.07 1.39 0.16 1.30 310.96 6.17 1.8 0.07 1.39 0.13 1.33 210.82 1.07 1.6 0.07 1.47 0.14 1.40 110.94 11.39 1.6 0.07 1.47 0.15 1.39 19.98 17.76 1.5 0.07 1.40 0.16 1.31 0
See accompanying notes to financial statements. 207

STATE FARM MUTUAL FUND TRUST BOND FUND(For a share outstanding throughout each period)
Income from investment operations Less distributions
Net asset value,beginningof period
Netinvestment
income (loss)
Net gain (loss) oninvestments (both
realized and unrealized)
Total frominvestmentoperations
Netinvestment
income
Netrealizedgain(a)
Totaldistributions
Class A SharesYear ended 12/31/2017 $11.18 $0.28 $ 0.04 $ 0.32 $(0.28) $(0.03) $(0.31)Year ended 12/31/2016 11.13 0.26 0.06 0.32 (0.26) (0.01) (0.27)Year ended 12/31/2015 11.32 0.28 (0.18) 0.10 (0.28) (0.01) (0.29)Year ended 12/31/2014 10.99 0.28 0.33 0.61 (0.28) — (0.28)Year ended 12/31/2013 11.78 0.29 (0.71) (0.42) (0.29) (0.08) (0.37)
Class B SharesYear ended 12/31/2017 11.17 0.27 0.04 0.31 (0.27) (0.03) (0.30)Year ended 12/31/2016 11.12 0.21 0.06 0.27 (0.21) (0.01) (0.22)Year ended 12/31/2015 11.31 0.23 (0.18) 0.05 (0.23) (0.01) (0.24)Year ended 12/31/2014 10.98 0.24 0.33 0.57 (0.24) — (0.24)Year ended 12/31/2013 11.78 0.24 (0.72) (0.48) (0.24) (0.08) (0.32)
Premier Shares(d)Year ended 12/31/2017 11.19 0.29 0.03 0.32 (0.29) (0.03) (0.32)Year ended 12/31/2016 11.14 0.27 0.06 0.33 (0.27) (0.01) (0.28)Year ended 12/31/2015 11.32 0.28 (0.17) 0.11 (0.28) (0.01) (0.29)Year ended 12/31/2014 11.00 0.28 0.32 0.60 (0.28) — (0.28)Year ended 12/31/2013 11.79 0.29 (0.71) (0.42) (0.29) (0.08) (0.37)
Legacy Class B SharesYear ended 12/31/2017 11.19 0.27 0.04 0.31 (0.27) (0.03) (0.30)Year ended 12/31/2016 11.15 0.21 0.05 0.26 (0.21) (0.01) (0.22)Year ended 12/31/2015 11.33 0.23 (0.17) 0.06 (0.23) (0.01) (0.24)Year ended 12/31/2014 11.00 0.24 0.33 0.57 (0.24) — (0.24)Year ended 12/31/2013 11.80 0.24 (0.72) (0.48) (0.24) (0.08) (0.32)
Institutional SharesYear ended 12/31/2017 11.17 0.28 0.04 0.32 (0.28) (0.03) (0.31)Year ended 12/31/2016 11.13 0.29 0.05 0.34 (0.29) (0.01) (0.30)Year ended 12/31/2015 11.31 0.30 (0.17) 0.13 (0.30) (0.01) (0.31)Year ended 12/31/2014 10.98 0.31 0.33 0.64 (0.31) — (0.31)Year ended 12/31/2013 11.78 0.32 (0.72) (0.40) (0.32) (0.08) (0.40)
Class R-1 SharesYear ended 12/31/2017 11.18 0.26 0.04 0.30 (0.26) (0.03) (0.29)Year ended 12/31/2016 11.13 0.22 0.06 0.28 (0.22) (0.01) (0.23)Year ended 12/31/2015 11.32 0.24 (0.18) 0.06 (0.24) (0.01) (0.25)Year ended 12/31/2014 10.99 0.25 0.33 0.58 (0.25) — (0.25)Year ended 12/31/2013 11.78 0.25 (0.71) (0.46) (0.25) (0.08) (0.33)
Class R-2 SharesYear ended 12/31/2017 11.17 0.27 0.03 0.30 (0.27) (0.03) (0.30)Year ended 12/31/2016 11.12 0.25 0.06 0.31 (0.25) (0.01) (0.26)Year ended 12/31/2015 11.30 0.26 (0.17) 0.09 (0.26) (0.01) (0.27)Year ended 12/31/2014 10.98 0.27 0.32 0.59 (0.27) — (0.27)Year ended 12/31/2013 11.77 0.27 (0.71) (0.44) (0.27) (0.08) (0.35)
Class R-3 SharesYear ended 12/31/2017 11.18 0.28 0.04 0.32 (0.28) (0.03) (0.31)Year ended 12/31/2016 11.14 0.28 0.05 0.33 (0.28) (0.01) (0.29)Year ended 12/31/2015 11.32 0.30 (0.17) 0.13 (0.30) (0.01) (0.31)Year ended 12/31/2014 10.99 0.30 0.33 0.63 (0.30) — (0.30)Year ended 12/31/2013 11.79 0.31 (0.72) (0.41) (0.31) (0.08) (0.39)
(a) Net realized gain distributions represent less than $0.01 per share for all classes in 2014.(b) Total return does not reflect the effect of sales charge for Class A, Class B, Premier and Legacy Class B shares. All other classes do not have a sales charge.(c) The expense ratios include the effect of expense reduction changes.(d) Effective May 23, 2016, Legacy Class A shares were renamed Premier shares.
208 See accompanying notes to financial statements.

Ratios/supplemental data
Average Net Asset ratiosassuming expense reductions
Average Net Asset ratiosabsent expense reductions
Netasset value, end
of periodTotal
return(b)
Netassets, end of period
(millions) Expenses(c)Net investmentincome (loss) Expenses
Net investmentincome (loss)
Portfolioturnover rate
$11.19 2.86% $183.1 0.47% 2.47% 0.65% 2.29% 17%11.18 2.81 205.5 0.65 2.28 0.65 2.28 511.13 0.81 406.0 0.65 2.43 0.65 2.43 911.32 5.64 356.5 0.66 2.51 0.66 2.51 1010.99 (3.61) 333.0 0.66 2.52 0.66 2.52 21
11.18 2.76 9.2 0.57 2.37 1.05 1.89 1711.17 2.40 10.1 1.05 1.87 1.05 1.87 511.12 0.41 10.8 1.05 2.03 1.05 2.03 911.31 5.22 11.8 1.06 2.11 1.06 2.11 1010.98 (4.08) 11.9 1.06 2.13 1.06 2.13 21
11.19 2.87 332.9 0.37 2.57 0.55 2.39 1711.19 2.87 364.6 0.57 2.33 0.57 2.33 511.14 0.90 124.1 0.65 2.44 0.65 2.44 911.32 5.54 128.8 0.66 2.51 0.66 2.51 1011.00 (3.60) 131.1 0.66 2.52 0.66 2.52 21
11.20 2.76 1.6 0.59 2.35 1.05 1.89 1711.19 2.31 2.4 1.05 1.87 1.05 1.87 511.15 0.50 3.4 1.05 2.04 1.05 2.04 911.33 5.22 4.9 1.06 2.12 1.06 2.12 1011.00 (4.07) 7.4 1.06 2.10 1.06 2.10 21
11.18 2.92 281.7 0.40 2.53 0.40 2.53 1711.17 2.97 263.8 0.40 2.52 0.40 2.52 511.13 1.15 239.3 0.40 2.68 0.40 2.68 911.31 5.91 212.9 0.41 2.76 0.41 2.76 1010.98 (3.45) 185.7 0.41 2.78 0.41 2.78 21
11.19 2.72 3.6 0.59 2.34 0.97 1.96 1711.18 2.48 3.8 0.97 1.95 0.97 1.95 511.13 0.49 3.4 0.97 2.12 0.97 2.12 911.32 5.30 3.5 0.98 2.19 0.98 2.19 1010.99 (3.91) 3.7 0.98 2.20 0.98 2.20 21
11.17 2.68 9.7 0.54 2.39 0.77 2.16 1711.17 2.69 9.6 0.77 2.15 0.77 2.15 511.12 0.78 9.7 0.77 2.32 0.77 2.32 911.30 5.42 8.0 0.78 2.39 0.78 2.39 1010.98 (3.73) 8.1 0.78 2.41 0.78 2.41 21
11.19 2.85 1.8 0.47 2.46 0.47 2.46 1711.18 2.90 1.7 0.47 2.44 0.47 2.44 511.14 1.08 1.9 0.47 2.62 0.47 2.62 911.32 5.83 1.9 0.48 2.69 0.48 2.69 1010.99 (3.51) 1.8 0.48 2.70 0.48 2.70 21
See accompanying notes to financial statements. 209

STATE FARM MUTUAL FUND TRUST TAX ADVANTAGED BOND FUND
(For a share outstanding throughout each period)Income from investment operations Less distributions
Net asset value,beginningof period
Netinvestment
income (loss)
Net gain (loss) oninvestments (both
realized and unrealized)
Total frominvestment
operations(a)
Netinvestment
income
Netrealized
gainTotal
distributions
Class A SharesYear ended 12/31/2017 $11.69 $0.30 $ 0.13 $ 0.43 $(0.30) $ — $(0.30)Year ended 12/31/2016 11.92 0.28 (0.23) 0.05 (0.28) — (0.28)Year ended 12/31/2015 11.88 0.29 0.04 0.33 (0.29) — (0.29)Year ended 12/31/2014 11.23 0.32 0.65 0.97 (0.32) — (0.32)Year ended 12/31/2013 11.95 0.31 (0.72) (0.41) (0.31) — (0.31)
Class B SharesYear ended 12/31/2017 11.69 0.29 0.13 0.42 (0.29) — (0.29)Year ended 12/31/2016 11.91 0.22 (0.22) — (0.22) — (0.22)Year ended 12/31/2015 11.87 0.24 0.04 0.28 (0.24) — (0.24)Year ended 12/31/2014 11.22 0.28 0.65 0.93 (0.28) — (0.28)Year ended 12/31/2013 11.95 0.26 (0.73) (0.47) (0.26) — (0.26)
Premier Shares(e)Year ended 12/31/2017 11.68 0.31 0.13 0.44 (0.31) — (0.31)Year ended 12/31/2016 11.90 0.28 (0.22) 0.06 (0.28) — (0.28)Year ended 12/31/2015 11.86 0.29 0.04 0.33 (0.29) — (0.29)Year ended 12/31/2014 11.21 0.32 0.65 0.97 (0.32) — (0.32)Year ended 12/31/2013 11.93 0.31 (0.72) (0.41) (0.31) — (0.31)
Legacy Class B SharesYear ended 12/31/2017 11.69 0.29 0.13 0.42 (0.29) — (0.29)Year ended 12/31/2016 11.90 0.22 (0.21) 0.01 (0.22) — (0.22)Year ended 12/31/2015 11.86 0.24 0.04 0.28 (0.24) — (0.24)Year ended 12/31/2014 11.21 0.28 0.65 0.93 (0.28) — (0.28)Year ended 12/31/2013 11.93 0.26 (0.72) (0.46) (0.26) — (0.26)
(a) Total from investment operations represents less than $0.01 per share for Class B shares in 2016.(b) Total return represents less than 0.005% per share for Class B shares in 2016.(c) Total return does not reflect the effect of sales charges.(d) The expense ratios include the effect of expense reduction changes.(e) Effective May 23, 2016, Legacy Class A shares were renamed Premier shares.
210 See accompanying notes to financial statements.
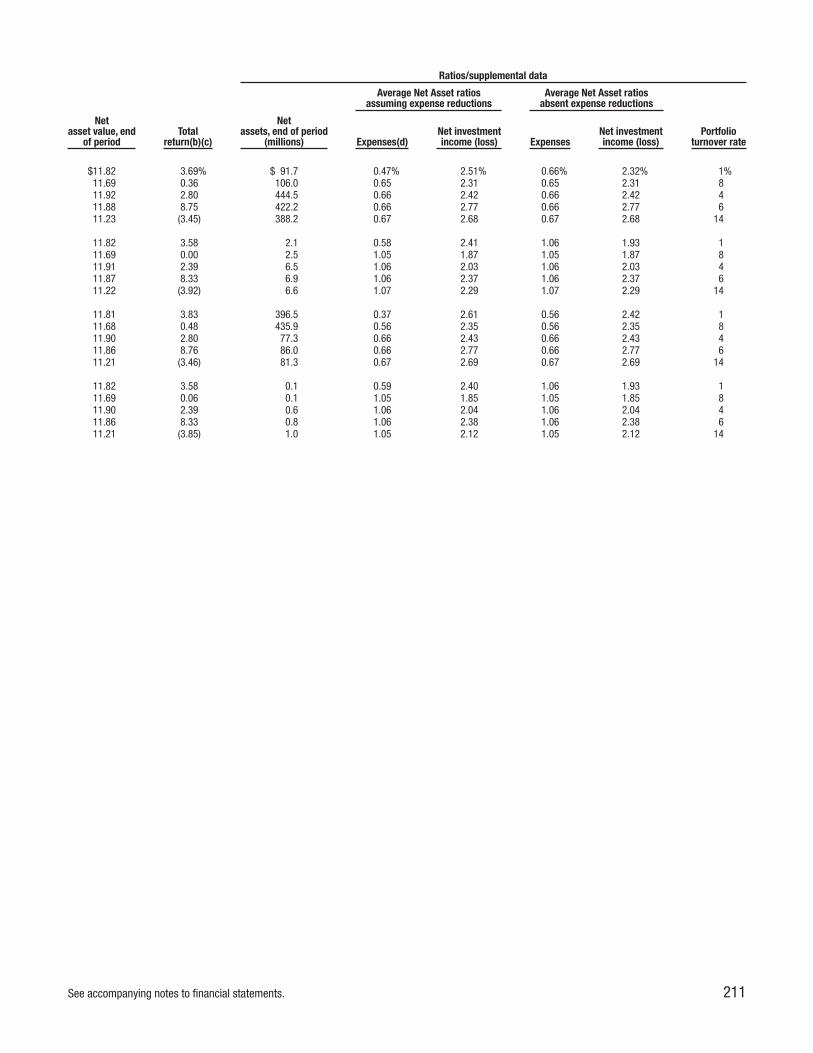
Ratios/supplemental data
Average Net Asset ratiosassuming expense reductions
Average Net Asset ratiosabsent expense reductions
Netasset value, end
of periodTotal
return(b)(c)
Netassets, end of period
(millions) Expenses(d)Net investmentincome (loss) Expenses
Net investmentincome (loss)
Portfolioturnover rate
$11.82 3.69% $ 91.7 0.47% 2.51% 0.66% 2.32% 1%11.69 0.36 106.0 0.65 2.31 0.65 2.31 811.92 2.80 444.5 0.66 2.42 0.66 2.42 411.88 8.75 422.2 0.66 2.77 0.66 2.77 611.23 (3.45) 388.2 0.67 2.68 0.67 2.68 14
11.82 3.58 2.1 0.58 2.41 1.06 1.93 111.69 0.00 2.5 1.05 1.87 1.05 1.87 811.91 2.39 6.5 1.06 2.03 1.06 2.03 411.87 8.33 6.9 1.06 2.37 1.06 2.37 611.22 (3.92) 6.6 1.07 2.29 1.07 2.29 14
11.81 3.83 396.5 0.37 2.61 0.56 2.42 111.68 0.48 435.9 0.56 2.35 0.56 2.35 811.90 2.80 77.3 0.66 2.43 0.66 2.43 411.86 8.76 86.0 0.66 2.77 0.66 2.77 611.21 (3.46) 81.3 0.67 2.69 0.67 2.69 14
11.82 3.58 0.1 0.59 2.40 1.06 1.93 111.69 0.06 0.1 1.05 1.85 1.05 1.85 811.90 2.39 0.6 1.06 2.04 1.06 2.04 411.86 8.33 0.8 1.06 2.38 1.06 2.38 611.21 (3.85) 1.0 1.05 2.12 1.05 2.12 14
See accompanying notes to financial statements. 211
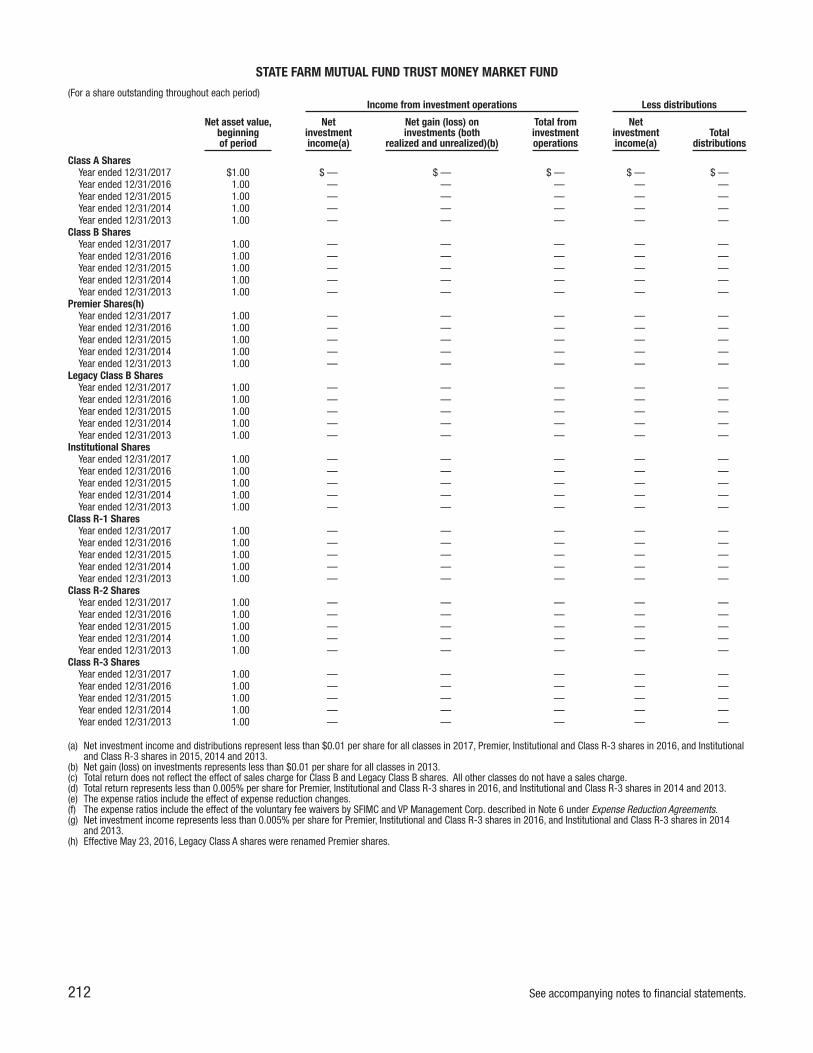
STATE FARM MUTUAL FUND TRUST MONEY MARKET FUND
(For a share outstanding throughout each period)Income from investment operations Less distributions
Net asset value,beginningof period
Netinvestmentincome(a)
Net gain (loss) oninvestments (both
realized and unrealized)(b)
Total frominvestmentoperations
Netinvestmentincome(a)
Totaldistributions
Class A SharesYear ended 12/31/2017 $1.00 $ — $ — $ — $ — $ —Year ended 12/31/2016 1.00 — — — — —Year ended 12/31/2015 1.00 — — — — —Year ended 12/31/2014 1.00 — — — — —Year ended 12/31/2013 1.00 — — — — —
Class B SharesYear ended 12/31/2017 1.00 — — — — —Year ended 12/31/2016 1.00 — — — — —Year ended 12/31/2015 1.00 — — — — —Year ended 12/31/2014 1.00 — — — — —Year ended 12/31/2013 1.00 — — — — —
Premier Shares(h)Year ended 12/31/2017 1.00 — — — — —Year ended 12/31/2016 1.00 — — — — —Year ended 12/31/2015 1.00 — — — — —Year ended 12/31/2014 1.00 — — — — —Year ended 12/31/2013 1.00 — — — — —
Legacy Class B SharesYear ended 12/31/2017 1.00 — — — — —Year ended 12/31/2016 1.00 — — — — —Year ended 12/31/2015 1.00 — — — — —Year ended 12/31/2014 1.00 — — — — —Year ended 12/31/2013 1.00 — — — — —
Institutional SharesYear ended 12/31/2017 1.00 — — — — —Year ended 12/31/2016 1.00 — — — — —Year ended 12/31/2015 1.00 — — — — —Year ended 12/31/2014 1.00 — — — — —Year ended 12/31/2013 1.00 — — — — —
Class R-1 SharesYear ended 12/31/2017 1.00 — — — — —Year ended 12/31/2016 1.00 — — — — —Year ended 12/31/2015 1.00 — — — — —Year ended 12/31/2014 1.00 — — — — —Year ended 12/31/2013 1.00 — — — — —
Class R-2 SharesYear ended 12/31/2017 1.00 — — — — —Year ended 12/31/2016 1.00 — — — — —Year ended 12/31/2015 1.00 — — — — —Year ended 12/31/2014 1.00 — — — — —Year ended 12/31/2013 1.00 — — — — —
Class R-3 SharesYear ended 12/31/2017 1.00 — — — — —Year ended 12/31/2016 1.00 — — — — —Year ended 12/31/2015 1.00 — — — — —Year ended 12/31/2014 1.00 — — — — —Year ended 12/31/2013 1.00 — — — — —
(a) Net investment income and distributions represent less than $0.01 per share for all classes in 2017, Premier, Institutional and Class R-3 shares in 2016, and Institutionaland Class R-3 shares in 2015, 2014 and 2013.
(b) Net gain (loss) on investments represents less than $0.01 per share for all classes in 2013.(c) Total return does not reflect the effect of sales charge for Class B and Legacy Class B shares. All other classes do not have a sales charge.(d) Total return represents less than 0.005% per share for Premier, Institutional and Class R-3 shares in 2016, and Institutional and Class R-3 shares in 2014 and 2013.(e) The expense ratios include the effect of expense reduction changes.(f) The expense ratios include the effect of the voluntary fee waivers by SFIMC and VP Management Corp. described in Note 6 under Expense Reduction Agreements.(g) Net investment income represents less than 0.005% per share for Premier, Institutional and Class R-3 shares in 2016, and Institutional and Class R-3 shares in 2014
and 2013.(h) Effective May 23, 2016, Legacy Class A shares were renamed Premier shares.
212 See accompanying notes to financial statements.
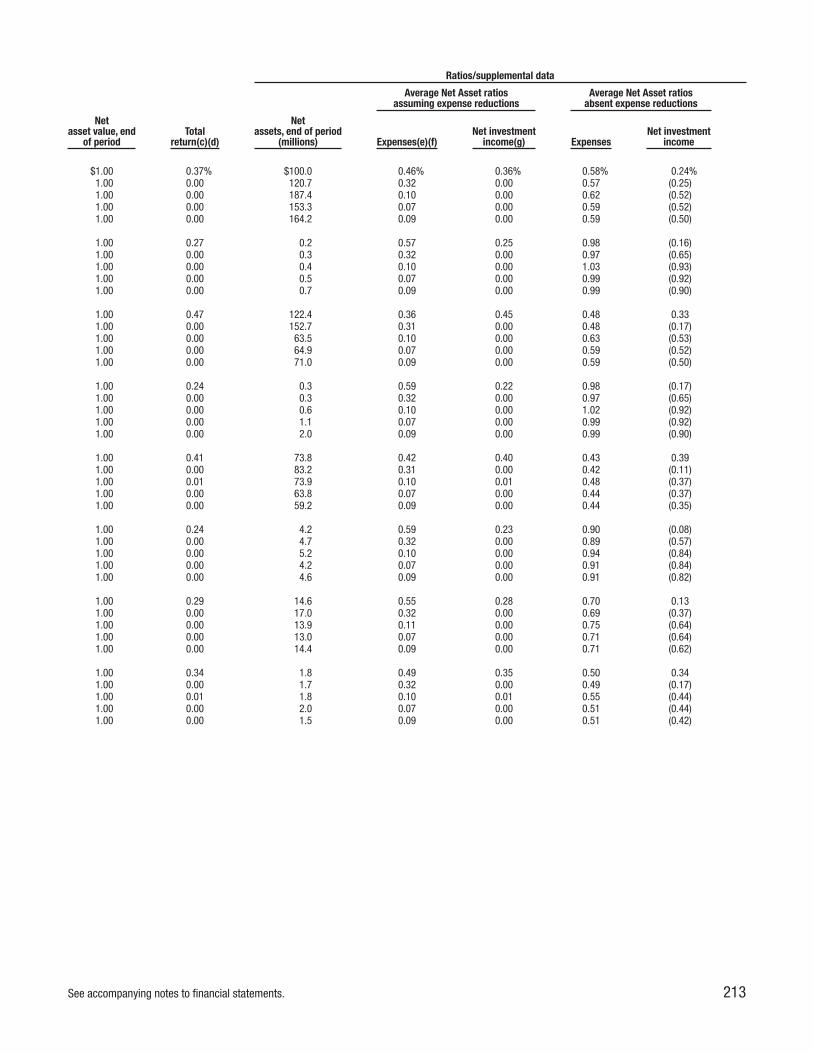
Ratios/supplemental data
Average Net Asset ratiosassuming expense reductions
Average Net Asset ratiosabsent expense reductions
Netasset value, end
of periodTotal
return(c)(d)
Netassets, end of period
(millions) Expenses(e)(f)Net investment
income(g) ExpensesNet investment
income
$1.00 0.37% $100.0 0.46% 0.36% 0.58% 0.24%1.00 0.00 120.7 0.32 0.00 0.57 (0.25)1.00 0.00 187.4 0.10 0.00 0.62 (0.52)1.00 0.00 153.3 0.07 0.00 0.59 (0.52)1.00 0.00 164.2 0.09 0.00 0.59 (0.50)
1.00 0.27 0.2 0.57 0.25 0.98 (0.16)1.00 0.00 0.3 0.32 0.00 0.97 (0.65)1.00 0.00 0.4 0.10 0.00 1.03 (0.93)1.00 0.00 0.5 0.07 0.00 0.99 (0.92)1.00 0.00 0.7 0.09 0.00 0.99 (0.90)
1.00 0.47 122.4 0.36 0.45 0.48 0.331.00 0.00 152.7 0.31 0.00 0.48 (0.17)1.00 0.00 63.5 0.10 0.00 0.63 (0.53)1.00 0.00 64.9 0.07 0.00 0.59 (0.52)1.00 0.00 71.0 0.09 0.00 0.59 (0.50)
1.00 0.24 0.3 0.59 0.22 0.98 (0.17)1.00 0.00 0.3 0.32 0.00 0.97 (0.65)1.00 0.00 0.6 0.10 0.00 1.02 (0.92)1.00 0.00 1.1 0.07 0.00 0.99 (0.92)1.00 0.00 2.0 0.09 0.00 0.99 (0.90)
1.00 0.41 73.8 0.42 0.40 0.43 0.391.00 0.00 83.2 0.31 0.00 0.42 (0.11)1.00 0.01 73.9 0.10 0.01 0.48 (0.37)1.00 0.00 63.8 0.07 0.00 0.44 (0.37)1.00 0.00 59.2 0.09 0.00 0.44 (0.35)
1.00 0.24 4.2 0.59 0.23 0.90 (0.08)1.00 0.00 4.7 0.32 0.00 0.89 (0.57)1.00 0.00 5.2 0.10 0.00 0.94 (0.84)1.00 0.00 4.2 0.07 0.00 0.91 (0.84)1.00 0.00 4.6 0.09 0.00 0.91 (0.82)
1.00 0.29 14.6 0.55 0.28 0.70 0.131.00 0.00 17.0 0.32 0.00 0.69 (0.37)1.00 0.00 13.9 0.11 0.00 0.75 (0.64)1.00 0.00 13.0 0.07 0.00 0.71 (0.64)1.00 0.00 14.4 0.09 0.00 0.71 (0.62)
1.00 0.34 1.8 0.49 0.35 0.50 0.341.00 0.00 1.7 0.32 0.00 0.49 (0.17)1.00 0.01 1.8 0.10 0.01 0.55 (0.44)1.00 0.00 2.0 0.07 0.00 0.51 (0.44)1.00 0.00 1.5 0.09 0.00 0.51 (0.42)
See accompanying notes to financial statements. 213

STATE FARM MUTUAL FUND TRUST LIFEPATH RETIREMENT FUND
(For a share outstanding throughout each period)Income from investment operations Less distributions
Net asset value,beginningof period
Netinvestment
income (loss)(a)(b)
Net gain (loss) oninvestments (both
realized and unrealized)
Total frominvestmentoperations
Netinvestment
income
Netrealized
gainTotal
distributions
Class A SharesYear ended 12/31/2017 $12.19 $0.20 $ 1.01 $ 1.21 $(0.25) $ — $(0.25)Year ended 12/31/2016 11.75 0.14 0.47 0.61 (0.17) — (0.17)Year ended 12/31/2015 12.15 0.17 (0.38) (0.21) (0.14) (0.05) (0.19)Year ended 12/31/2014 12.37 0.15 0.40 0.55 (0.15) (0.62) (0.77)Year ended 12/31/2013 12.20 0.13 0.57 0.70 (0.13) (0.40) (0.53)
Class B SharesYear ended 12/31/2017 12.27 0.17 1.02 1.19 (0.23) — (0.23)Year ended 12/31/2016 11.83 0.08 0.45 0.53 (0.09) — (0.09)Year ended 12/31/2015 12.23 0.08 (0.38) (0.30) (0.05) (0.05) (0.10)Year ended 12/31/2014 12.45 0.08 0.40 0.48 (0.08) (0.62) (0.70)Year ended 12/31/2013 12.27 0.09 0.58 0.67 (0.09) (0.40) (0.49)
Premier Shares(g)Year ended 12/31/2017 12.46 0.22 1.03 1.25 (0.26) — (0.26)Year ended 12/31/2016 12.02 0.22 0.41 0.63 (0.19) — (0.19)Year ended 12/31/2015 12.43 0.17 (0.39) (0.22) (0.14) (0.05) (0.19)Year ended 12/31/2014 12.64 0.16 0.40 0.56 (0.15) (0.62) (0.77)Year ended 12/31/2013 12.44 0.13 0.59 0.72 (0.12) (0.40) (0.52)
Legacy Class B SharesYear ended 12/31/2017 12.54 0.18 1.06 1.24 (0.23) — (0.23)Year ended 12/31/2016 12.09 0.12 0.45 0.57 (0.12) — (0.12)Year ended 12/31/2015 12.49 0.11 (0.38) (0.27) (0.08) (0.05) (0.13)Year ended 12/31/2014 12.69 0.10 0.41 0.51 (0.09) (0.62) (0.71)Year ended 12/31/2013 12.49 0.08 0.59 0.67 (0.07) (0.40) (0.47)
Institutional SharesYear ended 12/31/2017 12.47 0.21 1.03 1.24 (0.25) — (0.25)Year ended 12/31/2016 12.02 0.21 0.45 0.66 (0.21) — (0.21)Year ended 12/31/2015 12.43 0.20 (0.39) (0.19) (0.17) (0.05) (0.22)Year ended 12/31/2014 12.64 0.19 0.41 0.60 (0.19) (0.62) (0.81)Year ended 12/31/2013 12.44 0.16 0.59 0.75 (0.15) (0.40) (0.55)
Class R-1 SharesYear ended 12/31/2017 12.23 0.18 1.02 1.20 (0.23) — (0.23)Year ended 12/31/2016 11.80 0.13 0.44 0.57 (0.14) — (0.14)Year ended 12/31/2015 12.20 0.13 (0.38) (0.25) (0.10) (0.05) (0.15)Year ended 12/31/2014 12.42 0.11 0.40 0.51 (0.11) (0.62) (0.73)Year ended 12/31/2013 12.24 0.09 0.58 0.67 (0.09) (0.40) (0.49)
Class R-2 SharesYear ended 12/31/2017 12.50 0.19 1.05 1.24 (0.24) — (0.24)Year ended 12/31/2016 12.06 0.16 0.44 0.60 (0.16) — (0.16)Year ended 12/31/2015 12.46 0.16 (0.38) (0.22) (0.13) (0.05) (0.18)Year ended 12/31/2014 12.67 0.14 0.41 0.55 (0.14) (0.62) (0.76)Year ended 12/31/2013 12.48 0.11 0.59 0.70 (0.11) (0.40) (0.51)
Class R-3 SharesYear ended 12/31/2017 12.45 0.20 1.03 1.23 (0.24) — (0.24)Year ended 12/31/2016 12.01 0.20 0.44 0.64 (0.20) — (0.20)Year ended 12/31/2015 12.42 0.19 (0.38) (0.19) (0.17) (0.05) (0.22)Year ended 12/31/2014 12.63 0.18 0.40 0.58 (0.17) (0.62) (0.79)Year ended 12/31/2013 12.43 0.15 0.60 0.75 (0.15) (0.40) (0.55)
(a) Average shares outstanding for the period were used to calculate net investment income per share.(b) Through October 30, 2015, net amounts and ratios reflected the Fund’s proportionate share of income and expenses of the Master Portfolio and indirect proportionate
share of the expenses of the Active Stock Master Portfolio, Total International ex U.S. Index Master Portfolio, CoreAlpha Bond Master Portfolio, International Tilts MasterPortfolio, Master Small Cap Index Series and Large Cap Index Master Portfolio (collectively the “Underlying Master Portfolios”); but did not reflect indirect proportionateshare of the expenses of the other registered investment companies in which the Master Portfolio invested.
(c) Total return does not reflect the effect of sales charge for Class A, Class B, Premier and Legacy Class B shares. All other classes do not have a sales charge.(d) The expense ratios include the effect of expense reduction changes.(e) Effective October 31, 2015, expense ratios relate to the Fund only and do not reflect acquired fund fees and expenses.(f) The 2015 portfolio turnover rate reflects the period from November 2, 2015 to December 31, 2015 and excludes in-kind contribution of portfolio securities received after
the close of business on October 30, 2015. Through October 30, 2015, the LifePath Retirement Fund invested all of its assets in its corresponding Master Portfolio. Theportfolio turnover rate of the Master Portfolio for the period January 1, 2015 to October 30, 2015 was 16%.
(g) Effective May 23, 2016, Legacy Class A shares were renamed Premier shares.
214 See accompanying notes to financial statements.

Ratios/supplemental data
Average Net Asset ratiosassuming expense reductions
Average Net Asset ratiosabsent expense reductions
Netasset value, end
of periodTotal
return(c)
Netassets, end of period
(millions) Expenses(b)(d)(e)Net investmentincome (loss)(b) Expenses(b)(e)
Net investmentincome (loss)(b)
Portfolioturnover rate(f)
$13.15 9.95% $364.7 0.61% 1.56% 0.80% 1.37% 3%12.19 5.18 387.6 0.80 1.17 0.80 1.17 711.75 (1.67) 852.1 1.04 1.37 1.35 1.06 8312.15 4.53 780.7 1.07 1.21 1.46 0.82 1412.37 5.80 652.2 1.07 1.02 1.45 0.64 17
13.23 9.72 6.0 0.80 1.33 1.50 0.63 312.27 4.49 7.5 1.50 0.67 1.50 0.67 711.83 (2.40) 9.8 1.75 0.62 2.07 0.30 8312.23 3.87 12.7 1.66 0.61 2.05 0.22 1412.45 5.51 12.7 1.37 0.72 1.75 0.34 17
13.45 10.07 728.0 0.50 1.67 0.70 1.47 312.46 5.26 717.4 0.71 1.79 0.71 1.79 712.02 (1.74) 253.1 1.05 1.35 1.36 1.04 8312.43 4.48 277.5 1.07 1.21 1.46 0.82 1412.64 5.81 282.7 1.07 1.02 1.45 0.64 17
13.55 9.93 2.9 0.72 1.40 1.20 0.92 312.54 4.73 3.8 1.20 0.95 1.20 0.95 712.09 (2.10) 5.6 1.45 0.90 1.77 0.58 8312.49 4.07 9.0 1.47 0.80 1.85 0.42 1412.69 5.39 14.7 1.48 0.60 1.86 0.22 17
13.46 10.03 108.6 0.54 1.64 0.55 1.63 312.47 5.49 102.7 0.54 1.69 0.54 1.69 712.02 (1.49) 98.8 0.79 1.61 1.11 1.29 8312.43 4.76 96.7 0.82 1.46 1.21 1.07 1412.64 6.15 89.8 0.82 1.27 1.20 0.89 17
13.20 9.84 6.1 0.74 1.41 1.12 1.03 312.23 4.80 7.1 1.11 1.08 1.11 1.08 711.80 (1.99) 6.8 1.36 1.04 1.68 0.72 8312.20 4.16 6.6 1.39 0.89 1.78 0.50 1412.42 5.50 6.4 1.39 0.70 1.77 0.32 17
13.50 9.93 27.1 0.69 1.48 0.92 1.25 312.50 5.00 26.7 0.91 1.32 0.91 1.32 712.06 (1.84) 25.0 1.16 1.26 1.47 0.95 8312.46 4.44 23.6 1.19 1.09 1.58 0.70 1412.67 5.64 19.9 1.19 0.89 1.57 0.51 17
13.44 9.96 1.9 0.61 1.54 0.62 1.53 312.45 5.34 1.9 0.61 1.60 0.61 1.60 712.01 (1.55) 1.8 0.87 1.52 1.18 1.21 8312.42 4.68 1.8 0.89 1.39 1.28 1.00 1412.63 6.09 1.7 0.89 1.20 1.27 0.82 17
See accompanying notes to financial statements. 215

STATE FARM MUTUAL FUND TRUST LIFEPATH 2020 FUND
(For a share outstanding throughout each period)Income from investment operations Less distributions
Net asset value,beginningof period
Netinvestment
income (loss)(a)(b)
Net gain (loss) oninvestments (both
realized and unrealized)
Total frominvestmentoperations
Netinvestment
income
Netrealized
gainTotal
distributions
Class A SharesYear ended 12/31/2017 $13.79 $0.23 $ 1.35 $ 1.58 $(0.24) $(0.16) $(0.40)Year ended 12/31/2016 13.57 0.18 0.59 0.77 (0.26) (0.29) (0.55)Year ended 12/31/2015 14.06 0.20 (0.46) (0.26) (0.17) (0.06) (0.23)Year ended 12/31/2014 14.45 0.18 0.50 0.68 (0.17) (0.90) (1.07)Year ended 12/31/2013 13.91 0.17 1.13 1.30 (0.17) (0.59) (0.76)
Class B SharesYear ended 12/31/2017 13.72 0.20 1.34 1.54 (0.20) (0.16) (0.36)Year ended 12/31/2016 13.50 0.10 0.57 0.67 (0.16) (0.29) (0.45)Year ended 12/31/2015 13.97 0.09 (0.45) (0.36) (0.05) (0.06) (0.11)Year ended 12/31/2014 14.36 0.07 0.50 0.57 (0.06) (0.90) (0.96)Year ended 12/31/2013 13.82 0.07 1.13 1.20 (0.07) (0.59) (0.66)
Premier Shares(g)Year ended 12/31/2017 13.72 0.25 1.34 1.59 (0.26) (0.16) (0.42)Year ended 12/31/2016 13.53 0.25 0.53 0.78 (0.30) (0.29) (0.59)Year ended 12/31/2015 14.01 0.20 (0.45) (0.25) (0.17) (0.06) (0.23)Year ended 12/31/2014 14.40 0.18 0.49 0.67 (0.16) (0.90) (1.06)Year ended 12/31/2013 13.86 0.17 1.13 1.30 (0.17) (0.59) (0.76)
Legacy Class B SharesYear ended 12/31/2017 13.85 0.20 1.38 1.58 (0.21) (0.16) (0.37)Year ended 12/31/2016 13.63 0.14 0.56 0.70 (0.19) (0.29) (0.48)Year ended 12/31/2015 14.09 0.13 (0.44) (0.31) (0.09) (0.06) (0.15)Year ended 12/31/2014 14.45 0.12 0.50 0.62 (0.08) (0.90) (0.98)Year ended 12/31/2013 13.88 0.10 1.14 1.24 (0.08) (0.59) (0.67)
Institutional SharesYear ended 12/31/2017 13.82 0.24 1.35 1.59 (0.25) (0.16) (0.41)Year ended 12/31/2016 13.61 0.24 0.57 0.81 (0.31) (0.29) (0.60)Year ended 12/31/2015 14.10 0.23 (0.46) (0.23) (0.20) (0.06) (0.26)Year ended 12/31/2014 14.49 0.22 0.49 0.71 (0.20) (0.90) (1.10)Year ended 12/31/2013 13.93 0.20 1.15 1.35 (0.20) (0.59) (0.79)
Class R-1 SharesYear ended 12/31/2017 13.71 0.20 1.35 1.55 (0.21) (0.16) (0.37)Year ended 12/31/2016 13.51 0.16 0.56 0.72 (0.23) (0.29) (0.52)Year ended 12/31/2015 14.00 0.15 (0.46) (0.31) (0.12) (0.06) (0.18)Year ended 12/31/2014 14.39 0.13 0.50 0.63 (0.12) (0.90) (1.02)Year ended 12/31/2013 13.84 0.12 1.14 1.26 (0.12) (0.59) (0.71)
Class R-2 SharesYear ended 12/31/2017 13.72 0.22 1.34 1.56 (0.23) (0.16) (0.39)Year ended 12/31/2016 13.52 0.19 0.56 0.75 (0.26) (0.29) (0.55)Year ended 12/31/2015 14.00 0.18 (0.45) (0.27) (0.15) (0.06) (0.21)Year ended 12/31/2014 14.40 0.16 0.50 0.66 (0.16) (0.90) (1.06)Year ended 12/31/2013 13.86 0.15 1.13 1.28 (0.15) (0.59) (0.74)
Class R-3 SharesYear ended 12/31/2017 13.79 0.23 1.35 1.58 (0.24) (0.16) (0.40)Year ended 12/31/2016 13.59 0.23 0.56 0.79 (0.30) (0.29) (0.59)Year ended 12/31/2015 14.07 0.22 (0.45) (0.23) (0.19) (0.06) (0.25)Year ended 12/31/2014 14.46 0.21 0.49 0.70 (0.19) (0.90) (1.09)Year ended 12/31/2013 13.90 0.19 1.15 1.34 (0.19) (0.59) (0.78)
(a) Average shares outstanding for the period were used to calculate net investment income per share.(b) Through October 30, 2015, net amounts and ratios reflected the Fund’s proportionate share of income and expenses of the Master Portfolio and indirect proportionate
share of the expenses of the Active Stock Master Portfolio, Total International ex U.S. Index Master Portfolio, CoreAlpha Bond Master Portfolio, International Tilts MasterPortfolio, Master Small Cap Index Series and Large Cap Index Master Portfolio (collectively the “Underlying Master Portfolios”); but did not reflect indirect proportionateshare of the expenses of the other registered investment companies in which the Master Portfolio invested.
(c) Total return does not reflect the effect of sales charge for Class A, Class B, Premier and Legacy Class B shares. All other classes do not have a sales charge.(d) The expense ratios include the effect of expense reduction changes.(e) Effective October 31, 2015, expense ratios relate to the Fund only and do not reflect acquired fund fees and expenses.(f) The 2015 portfolio turnover rate reflects the period from November 2, 2015 to December 31, 2015 and excludes in-kind contribution of portfolio securities received after
the close of business on October 30, 2015. Through October 30, 2015, the LifePath 2020 Fund invested all of its assets in its corresponding Master Portfolio. Theportfolio turnover rate of the Master Portfolio for the period January 1, 2015 to October 30, 2015 was 14%.
(g) Effective May 23, 2016, Legacy Class A shares were renamed Premier shares.
216 See accompanying notes to financial statements.

Ratios/supplemental data
Average Net Asset ratiosassuming expense reductions
Average Net Asset ratiosabsent expense reductions
Netasset value, end
of periodTotal
return(c)
Netassets, end of period
(millions) Expenses(b)(d)(e)Net investmentincome (loss)(b) Expenses(b)(e)
Net investmentincome (loss)(b)
Portfolioturnover rate(f)
$14.97 11.42% $ 822.0 0.60% 1.58% 0.79% 1.39% 7%13.79 5.63 835.4 0.79 1.31 0.79 1.31 913.57 (1.86) 1,320.9 1.03 1.43 1.36 1.10 8114.06 4.73 1,212.0 1.05 1.21 1.46 0.80 2114.45 9.34 989.9 1.04 1.18 1.44 0.78 19
14.90 11.22 18.2 0.79 1.35 1.49 0.65 713.72 4.93 21.9 1.49 0.74 1.49 0.74 913.50 (2.57) 26.9 1.73 0.67 2.07 0.33 8113.97 3.97 32.9 1.75 0.51 2.16 0.10 2114.36 8.66 32.8 1.74 0.46 2.15 0.05 19
14.89 11.54 1022.7 0.50 1.70 0.69 1.51 713.72 5.74 956.6 0.71 1.82 0.71 1.82 913.53 (1.83) 425.8 1.03 1.40 1.37 1.06 8114.01 4.71 453.9 1.05 1.21 1.46 0.80 2114.40 9.32 434.3 1.04 1.16 1.45 0.75 19
15.06 11.38 8.5 0.72 1.40 1.19 0.93 713.85 5.16 11.7 1.19 1.01 1.19 1.01 913.63 (2.22) 16.1 1.43 0.95 1.78 0.60 8114.09 4.30 22.6 1.45 0.80 1.86 0.39 2114.45 8.90 33.6 1.45 0.71 1.85 0.31 19
15.00 11.48 217.9 0.54 1.66 0.54 1.66 713.82 5.93 204.2 0.54 1.75 0.54 1.75 913.61 (1.62) 196.4 0.78 1.66 1.12 1.32 8114.10 4.95 197.0 0.80 1.46 1.21 1.05 2114.49 9.69 171.4 0.79 1.41 1.20 1.00 19
14.89 11.29 17.2 0.74 1.41 1.11 1.04 713.71 5.29 20.2 1.11 1.15 1.11 1.15 913.51 (2.20) 19.9 1.35 1.09 1.68 0.76 8114.00 4.37 17.7 1.37 0.88 1.78 0.47 2114.39 9.07 17.5 1.36 0.83 1.77 0.42 19
14.89 11.32 62.0 0.68 1.50 0.91 1.27 713.72 5.51 61.3 0.91 1.38 0.91 1.38 913.52 (1.93) 57.0 1.15 1.28 1.49 0.94 8114.00 4.58 58.3 1.17 1.09 1.58 0.68 2114.40 9.21 45.2 1.16 1.03 1.57 0.62 19
14.97 11.43 3.2 0.61 1.55 0.61 1.55 713.79 5.79 3.5 0.61 1.67 0.61 1.67 913.59 (1.66) 3.3 0.85 1.55 1.19 1.21 8114.07 4.88 4.4 0.87 1.40 1.28 0.99 2114.46 9.58 2.9 0.87 1.34 1.27 0.94 19
See accompanying notes to financial statements. 217

STATE FARM MUTUAL FUND TRUST LIFEPATH 2030 FUND
(For a share outstanding throughout each period)Income from investment operations Less distributions
Net asset value,beginningof period
Netinvestment
income (loss)(a)(b)
Net gain (loss) oninvestments (both
realized and unrealized)
Total frominvestmentoperations
Netinvestment
income
Netrealized
gainTotal
distributions
Class A SharesYear ended 12/31/2017 $14.57 $0.25 $ 2.00 $ 2.25 $(0.26) $(0.13) $(0.39)Year ended 12/31/2016 14.20 0.21 0.74 0.95 (0.29) (0.29) (0.58)Year ended 12/31/2015 14.73 0.23 (0.52) (0.29) (0.17) (0.07) (0.24)Year ended 12/31/2014 15.27 0.19 0.57 0.76 (0.17) (1.13) (1.30)Year ended 12/31/2013 14.22 0.20 1.70 1.90 (0.21) (0.64) (0.85)
Class B SharesYear ended 12/31/2017 14.52 0.24 2.00 2.24 (0.25) (0.13) (0.38)Year ended 12/31/2016 14.15 0.19 0.73 0.92 (0.26) (0.29) (0.55)Year ended 12/31/2015 14.66 0.13 (0.51) (0.38) (0.06) (0.07) (0.13)Year ended 12/31/2014 15.20 0.08 0.56 0.64 (0.05) (1.13) (1.18)Year ended 12/31/2013 14.16 0.09 1.69 1.78 (0.10) (0.64) (0.74)
Premier Shares(g)Year ended 12/31/2017 14.58 0.27 2.00 2.27 (0.28) (0.13) (0.41)Year ended 12/31/2016 14.23 0.29 0.67 0.96 (0.32) (0.29) (0.61)Year ended 12/31/2015 14.76 0.22 (0.52) (0.30) (0.16) (0.07) (0.23)Year ended 12/31/2014 15.29 0.19 0.58 0.77 (0.17) (1.13) (1.30)Year ended 12/31/2013 14.23 0.20 1.70 1.90 (0.20) (0.64) (0.84)
Legacy Class B SharesYear ended 12/31/2017 14.67 0.22 2.03 2.25 (0.23) (0.13) (0.36)Year ended 12/31/2016 14.28 0.16 0.73 0.89 (0.21) (0.29) (0.50)Year ended 12/31/2015 14.79 0.15 (0.51) (0.36) (0.08) (0.07) (0.15)Year ended 12/31/2014 15.30 0.12 0.58 0.70 (0.08) (1.13) (1.21)Year ended 12/31/2013 14.21 0.12 1.72 1.84 (0.11) (0.64) (0.75)
Institutional SharesYear ended 12/31/2017 14.67 0.27 2.01 2.28 (0.28) (0.13) (0.41)Year ended 12/31/2016 14.30 0.27 0.72 0.99 (0.33) (0.29) (0.62)Year ended 12/31/2015 14.83 0.26 (0.52) (0.26) (0.20) (0.07) (0.27)Year ended 12/31/2014 15.36 0.23 0.58 0.81 (0.21) (1.13) (1.34)Year ended 12/31/2013 14.29 0.24 1.71 1.95 (0.24) (0.64) (0.88)
Class R-1 SharesYear ended 12/31/2017 14.48 0.23 1.99 2.22 (0.24) (0.13) (0.37)Year ended 12/31/2016 14.13 0.19 0.70 0.89 (0.25) (0.29) (0.54)Year ended 12/31/2015 14.66 0.18 (0.52) (0.34) (0.12) (0.07) (0.19)Year ended 12/31/2014 15.20 0.14 0.56 0.70 (0.11) (1.13) (1.24)Year ended 12/31/2013 14.16 0.15 1.69 1.84 (0.16) (0.64) (0.80)
Class R-2 SharesYear ended 12/31/2017 14.53 0.24 1.99 2.23 (0.25) (0.13) (0.38)Year ended 12/31/2016 14.18 0.22 0.70 0.92 (0.28) (0.29) (0.57)Year ended 12/31/2015 14.71 0.21 (0.52) (0.31) (0.15) (0.07) (0.22)Year ended 12/31/2014 15.26 0.17 0.57 0.74 (0.16) (1.13) (1.29)Year ended 12/31/2013 14.20 0.17 1.71 1.88 (0.18) (0.64) (0.82)
Class R-3 SharesYear ended 12/31/2017 14.68 0.26 2.01 2.27 (0.27) (0.13) (0.40)Year ended 12/31/2016 14.31 0.27 0.72 0.99 (0.33) (0.29) (0.62)Year ended 12/31/2015 14.84 0.24 (0.52) (0.28) (0.18) (0.07) (0.25)Year ended 12/31/2014 15.37 0.22 0.58 0.80 (0.20) (1.13) (1.33)Year ended 12/31/2013 14.29 0.22 1.72 1.94 (0.22) (0.64) (0.86)
(a) Average shares outstanding for the period were used to calculate net investment income per share.(b) Through October 30, 2015, net amounts and ratios reflected the Fund’s proportionate share of income and expenses of the Master Portfolio and indirect proportionate
share of the expenses of the Active Stock Master Portfolio, Total International ex U.S. Index Master Portfolio, CoreAlpha Bond Master Portfolio, International Tilts MasterPortfolio, Master Small Cap Index Series and Large Cap Index Master Portfolio (collectively the “Underlying Master Portfolios”); but did not reflect indirect proportionateshare of the expenses of the other registered investment companies in which the Master Portfolio invested.
(c) Total return does not reflect the effect of sales charge for Class A, Class B, Premier and Legacy Class B shares. All other classes do not have a sales charge.(d) The expense ratios include the effect of expense reduction changes.(e) Effective October 31, 2015, expense ratios relate to the Fund only and do not reflect acquired fund fees and expenses.(f) The 2015 portfolio turnover rate reflects the period from November 2, 2015 to December 31, 2015 and excludes in-kind contribution of portfolio securities received after
the close of business on October 30, 2015. Through October 30, 2015, the LifePath 2030 Fund invested all of its assets in its corresponding Master Portfolio. Theportfolio turnover rate of the Master Portfolio for the period January 1, 2015 to October 30, 2015 was 15%.
(g) Effective May 23, 2016, Legacy Class A shares were renamed Premier shares.
218 See accompanying notes to financial statements.

Ratios/supplemental data
Average Net Asset ratiosassuming expense reductions
Average Net Asset ratiosabsent expense reductions
Netasset value, end
of periodTotal
return(c)
Netassets, end of period
(millions) Expenses(b)(d)(e)Net investmentincome (loss)(b) Expenses(b)(e)
Net investmentincome (loss)(b)
Portfolioturnover rate(f)
$16.43 15.47% $1,059.2 0.61% 1.61% 0.80% 1.42% 6%14.57 6.65 1,011.2 0.79 1.46 0.79 1.46 714.20 (1.99) 1,323.7 1.00 1.52 1.36 1.16 8114.73 4.90 1,153.7 1.02 1.22 1.47 0.77 3315.27 13.40 927.4 1.02 1.34 1.45 0.91 22
16.38 15.43 26.5 0.66 1.51 1.00 1.17 614.52 6.46 29.7 0.99 1.34 0.99 1.34 714.15 (2.60) 35.3 1.59 0.86 1.96 0.49 8114.66 4.21 42.8 1.72 0.51 2.17 0.06 3315.20 12.58 41.8 1.73 0.62 2.16 0.19 22
16.44 15.59 964.8 0.50 1.74 0.70 1.54 614.58 6.75 820.7 0.71 2.00 0.71 2.00 714.23 (2.03) 347.7 1.00 1.48 1.37 1.11 8114.76 4.98 362.1 1.02 1.21 1.47 0.76 3315.29 13.34 341.8 1.03 1.31 1.46 0.88 22
16.56 15.36 9.0 0.72 1.40 1.20 0.92 614.67 6.25 11.7 1.19 1.11 1.19 1.11 714.28 (2.43) 15.6 1.41 1.03 1.78 0.66 8114.79 4.54 21.6 1.42 0.80 1.87 0.35 3315.30 12.91 30.5 1.43 0.82 1.86 0.39 22
16.54 15.51 296.0 0.54 1.69 0.55 1.68 614.67 6.94 253.5 0.54 1.87 0.54 1.87 714.30 (1.76) 230.7 0.75 1.75 1.11 1.39 8114.83 5.23 221.5 0.77 1.47 1.22 1.02 3315.36 13.63 191.9 0.78 1.57 1.21 1.14 22
16.33 15.32 33.0 0.74 1.44 1.12 1.06 614.48 6.29 34.3 1.11 1.29 1.11 1.29 714.13 (2.30) 31.4 1.32 1.20 1.68 0.84 8114.66 4.59 25.8 1.34 0.89 1.79 0.44 3315.20 12.99 24.9 1.34 1.01 1.77 0.58 22
16.38 15.37 80.2 0.68 1.56 0.92 1.32 614.53 6.50 69.9 0.91 1.52 0.91 1.52 714.18 (2.11) 59.2 1.12 1.40 1.48 1.04 8114.71 4.79 52.3 1.14 1.10 1.59 0.65 3315.26 13.23 41.7 1.15 1.15 1.58 0.72 22
16.55 15.44 5.2 0.62 1.63 0.62 1.63 614.68 6.90 4.4 0.61 1.87 0.61 1.87 714.31 (1.88) 3.4 0.83 1.62 1.19 1.26 8114.84 5.15 4.4 0.84 1.40 1.29 0.95 3315.37 13.56 3.7 0.85 1.47 1.28 1.04 22
See accompanying notes to financial statements. 219

STATE FARM MUTUAL FUND TRUST LIFEPATH 2040 FUND
(For a share outstanding throughout each period)Income from investment operations Less distributions
Net asset value,beginningof period
Netinvestment
income (loss)(a)(b)
Net gain (loss) oninvestments (both
realized and unrealized)
Total frominvestmentoperations
Netinvestment
income
Netrealized
gainTotal
distributions
Class A SharesYear ended 12/31/2017 $15.21 $0.27 $ 2.60 $ 2.87 $(0.28) $(0.10) $(0.38)Year ended 12/31/2016 14.68 0.25 0.85 1.10 (0.29) (0.28) (0.57)Year ended 12/31/2015 15.31 0.24 (0.58) (0.34) (0.21) (0.08) (0.29)Year ended 12/31/2014 15.99 0.20 0.62 0.82 (0.18) (1.32) (1.50)Year ended 12/31/2013 14.46 0.23 2.18 2.41 (0.23) (0.65) (0.88)
Class B SharesYear ended 12/31/2017 15.16 0.25 2.61 2.86 (0.27) (0.10) (0.37)Year ended 12/31/2016 14.62 0.21 0.85 1.06 (0.24) (0.28) (0.52)Year ended 12/31/2015 15.22 0.14 (0.56) (0.42) (0.10) (0.08) (0.18)Year ended 12/31/2014 15.90 0.08 0.62 0.70 (0.06) (1.32) (1.38)Year ended 12/31/2013 14.40 0.11 2.16 2.27 (0.12) (0.65) (0.77)
Premier Shares(g)Year ended 12/31/2017 15.27 0.30 2.61 2.91 (0.30) (0.10) (0.40)Year ended 12/31/2016 14.74 0.29 0.83 1.12 (0.31) (0.28) (0.59)Year ended 12/31/2015 15.36 0.24 (0.57) (0.33) (0.21) (0.08) (0.29)Year ended 12/31/2014 16.03 0.20 0.63 0.83 (0.18) (1.32) (1.50)Year ended 12/31/2013 14.50 0.22 2.18 2.40 (0.22) (0.65) (0.87)
Legacy Class B SharesYear ended 12/31/2017 15.36 0.23 2.67 2.90 (0.25) (0.10) (0.35)Year ended 12/31/2016 14.80 0.18 0.86 1.04 (0.20) (0.28) (0.48)Year ended 12/31/2015 15.41 0.17 (0.58) (0.41) (0.12) (0.08) (0.20)Year ended 12/31/2014 16.05 0.13 0.64 0.77 (0.09) (1.32) (1.41)Year ended 12/31/2013 14.50 0.14 2.20 2.34 (0.14) (0.65) (0.79)
Institutional SharesYear ended 12/31/2017 15.35 0.29 2.63 2.92 (0.30) (0.10) (0.40)Year ended 12/31/2016 14.81 0.30 0.85 1.15 (0.33) (0.28) (0.61)Year ended 12/31/2015 15.44 0.28 (0.59) (0.31) (0.24) (0.08) (0.32)Year ended 12/31/2014 16.11 0.24 0.63 0.87 (0.22) (1.32) (1.54)Year ended 12/31/2013 14.56 0.27 2.19 2.46 (0.26) (0.65) (0.91)
Class R-1 SharesYear ended 12/31/2017 15.14 0.25 2.60 2.85 (0.26) (0.10) (0.36)Year ended 12/31/2016 14.61 0.20 0.84 1.04 (0.23) (0.28) (0.51)Year ended 12/31/2015 15.25 0.20 (0.59) (0.39) (0.17) (0.08) (0.25)Year ended 12/31/2014 15.92 0.15 0.62 0.77 (0.12) (1.32) (1.44)Year ended 12/31/2013 14.41 0.17 2.17 2.34 (0.18) (0.65) (0.83)
Class R-2 SharesYear ended 12/31/2017 15.19 0.26 2.60 2.86 (0.27) (0.10) (0.37)Year ended 12/31/2016 14.68 0.25 0.82 1.07 (0.28) (0.28) (0.56)Year ended 12/31/2015 15.30 0.22 (0.57) (0.35) (0.19) (0.08) (0.27)Year ended 12/31/2014 15.99 0.18 0.62 0.80 (0.17) (1.32) (1.49)Year ended 12/31/2013 14.46 0.20 2.18 2.38 (0.20) (0.65) (0.85)
Class R-3 SharesYear ended 12/31/2017 15.52 0.28 2.65 2.93 (0.28) (0.10) (0.38)Year ended 12/31/2016 14.97 0.30 0.85 1.15 (0.32) (0.28) (0.60)Year ended 12/31/2015 15.60 0.28 (0.59) (0.31) (0.24) (0.08) (0.32)Year ended 12/31/2014 16.26 0.24 0.63 0.87 (0.21) (1.32) (1.53)Year ended 12/31/2013 14.70 0.25 2.21 2.46 (0.25) (0.65) (0.90)
(a) Average shares outstanding for the period were used to calculate net investment income per share.(b) Through October 30, 2015, net amounts and ratios reflected the Fund’s proportionate share of income and expenses of the Master Portfolio and indirect proportionate
share of the expenses of the Active Stock Master Portfolio, Total International ex U.S. Index Master Portfolio, CoreAlpha Bond Master Portfolio, International Tilts MasterPortfolio, Master Small Cap Index Series and Large Cap Index Master Portfolio (collectively the “Underlying Master Portfolios”); but did not reflect indirect proportionateshare of the expenses of the other registered investment companies in which the Master Portfolio invested.
(c) Total return does not reflect the effect of sales charge for Class A, Class B, Premier and Legacy Class B shares. All other classes do not have a sales charge.(d) The expense ratios include the effect of expense reduction changes.(e) Effective October 31, 2015, expense ratios relate to the Fund only and do not reflect acquired fund fees and expenses.(f) The 2015 portfolio turnover rate reflects the period from November 2, 2015 to December 31, 2015 and excludes in-kind contribution of portfolio securities received after
the close of business on October 30, 2015. Through October 30, 2015, the LifePath 2040 Fund invested all of its assets in its corresponding Master Portfolio. Theportfolio turnover rate of the Master Portfolio for the period January 1, 2015 to October 30, 2015 was 13%.
(g) Effective May 23, 2016, Legacy Class A shares were renamed Premier shares.
220 See accompanying notes to financial statements.

Ratios/supplemental data
Average Net Asset ratiosassuming expense reductions
Average Net Asset ratiosabsent expense reductions
Netasset value, end
of periodTotal
return(c)
Netassets, end of period
(millions) Expenses(b)(d)(e)Net investmentincome (loss)(b) Expenses(b)(e)
Net investmentincome (loss)(b)
Portfolioturnover rate(f)
$17.70 18.92% $914.4 0.60% 1.65% 0.79% 1.46% 6%15.21 7.47 827.8 0.80 1.68 0.80 1.68 614.68 (2.21) 816.4 0.98 1.58 1.36 1.20 8015.31 5.12 719.1 1.01 1.23 1.47 0.77 4215.99 16.65 579.2 1.01 1.47 1.46 1.02 26
17.65 18.89 27.7 0.66 1.52 0.99 1.19 615.16 7.29 30.3 1.00 1.42 1.00 1.42 614.62 (2.76) 36.4 1.57 0.91 1.96 0.52 8015.22 4.38 44.1 1.71 0.52 2.17 0.06 4215.90 15.75 41.7 1.72 0.73 2.17 0.28 26
17.78 19.12 484.2 0.50 1.79 0.69 1.60 615.27 7.58 375.9 0.72 1.93 0.72 1.93 614.74 (2.18) 258.8 0.99 1.54 1.37 1.16 8015.36 5.13 264.3 1.01 1.22 1.47 0.76 4216.03 16.56 249.1 1.02 1.43 1.47 0.98 26
17.91 18.91 9.0 0.72 1.40 1.19 0.93 615.36 7.04 11.6 1.20 1.18 1.20 1.18 614.80 (2.64) 15.2 1.39 1.07 1.78 0.68 8015.41 4.76 20.4 1.41 0.80 1.87 0.34 4216.05 16.09 28.1 1.42 0.93 1.87 0.48 26
17.87 19.02 385.4 0.54 1.73 0.54 1.73 615.35 7.75 319.8 0.54 1.98 0.54 1.98 614.81 (1.98) 282.3 0.73 1.81 1.11 1.43 8015.44 5.37 265.5 0.76 1.48 1.22 1.02 4216.11 16.90 221.4 0.77 1.69 1.22 1.24 26
17.63 18.85 26.7 0.73 1.49 1.11 1.11 615.14 7.14 25.2 1.11 1.33 1.11 1.33 614.61 (2.55) 24.0 1.30 1.29 1.68 0.91 8015.25 4.79 18.5 1.33 0.90 1.79 0.44 4215.92 16.27 18.4 1.34 1.11 1.79 0.66 26
17.68 18.93 64.5 0.68 1.58 0.91 1.35 615.19 7.29 56.5 0.91 1.66 0.91 1.66 614.68 (2.27) 45.9 1.10 1.44 1.48 1.06 8015.30 4.96 43.9 1.13 1.12 1.59 0.66 4215.99 16.48 33.9 1.14 1.28 1.58 0.84 26
18.07 18.93 7.8 0.61 1.66 0.61 1.66 615.52 7.68 6.4 0.61 1.96 0.61 1.96 614.97 (2.02) 5.0 0.80 1.76 1.18 1.38 8015.60 5.32 4.3 0.83 1.41 1.29 0.95 4216.26 16.71 3.5 0.84 1.61 1.29 1.16 26
See accompanying notes to financial statements. 221

STATE FARM MUTUAL FUND TRUST LIFEPATH 2050 FUND
(For a share outstanding throughout each period)Income from investment operations Less distributions
Net asset value,beginningof period
Netinvestment
income (loss)(a)(b)
Net gain (loss) oninvestments (both
realized and unrealized)
Total frominvestmentoperations
Netinvestment
income
Netrealized
gainTotal
distributions
Class A SharesYear ended 12/31/2017 $10.49 $0.19 $ 1.95 $ 2.14 $(0.20) $(0.03) $(0.23)Year ended 12/31/2016 10.06 0.17 0.62 0.79 (0.20) (0.16) (0.36)Year ended 12/31/2015 10.46 0.16 (0.40) (0.24) (0.12) (0.04) (0.16)Year ended 12/31/2014 10.79 0.13 0.46 0.59 (0.12) (0.80) (0.92)Year ended 12/31/2013 9.63 0.17 1.69 1.86 (0.15) (0.55) (0.70)
Premier SharesYear ended 12/31/2017 10.46 0.21 1.94 2.15 (0.21) (0.03) (0.24)Period ended 12/31/2016(g) 10.20 0.18 0.47 0.65 (0.23) (0.16) (0.39)
Class R-1 SharesYear ended 12/31/2017 10.51 0.18 1.94 2.12 (0.18) (0.03) (0.21)Year ended 12/31/2016 10.09 0.15 0.60 0.75 (0.17) (0.16) (0.33)Year ended 12/31/2015 10.49 0.13 (0.40) (0.27) (0.09) (0.04) (0.13)Year ended 12/31/2014 10.83 0.10 0.44 0.54 (0.08) (0.80) (0.88)Year ended 12/31/2013 9.66 0.13 1.70 1.83 (0.11) (0.55) (0.66)
Class R-2 SharesYear ended 12/31/2017 10.52 0.18 1.95 2.13 (0.19) (0.03) (0.22)Year ended 12/31/2016 10.10 0.17 0.60 0.77 (0.19) (0.16) (0.35)Year ended 12/31/2015 10.50 0.15 (0.40) (0.25) (0.11) (0.04) (0.15)Year ended 12/31/2014 10.84 0.12 0.45 0.57 (0.11) (0.80) (0.91)Year ended 12/31/2013 9.66 0.14 1.71 1.85 (0.12) (0.55) (0.67)
(a) Average shares outstanding for the period were used to calculate net investment income per share.(b) Through October 30, 2015, net amounts and ratios reflected the Fund’s proportionate share of income and expenses of the Master Portfolio and indirect proportionate
share of the expenses of the Active Stock Master Portfolio, Total International ex U.S. Index Master Portfolio, CoreAlpha Bond Master Portfolio, International Tilts MasterPortfolio, Master Small Cap Index Series and Large Cap Index Master Portfolio (collectively the “Underlying Master Portfolios”); but did not reflect indirect proportionateshare of the expenses of the other registered investment companies in which the Master Portfolio invested.
(c) Total return does not reflect the effect of sales charge for Class A and Premier shares. All other classes do not have a sales charge.(d) The expense ratios include the effect of expense reduction changes.(e) Effective October 31, 2015, expense ratios relate to the Fund only and do not reflect acquired fund fees and expenses.(f) The 2015 portfolio turnover rate reflects the period from November 2, 2015 to December 31, 2015 and excludes in-kind contribution of portfolio securities received after
the close of business on October 30, 2015. Through October 30, 2015, the LifePath 2050 Fund invested all of its assets in its corresponding Master Portfolio. Theportfolio turnover rate of the Master Portfolio for the period January 1, 2015 to October 30, 2015 was 26%.
(g) For all the data, except for the portfolio turnover rate which is for the entire year, the period is from commencement of investment operations May 16, 2016.
222 See accompanying notes to financial statements.
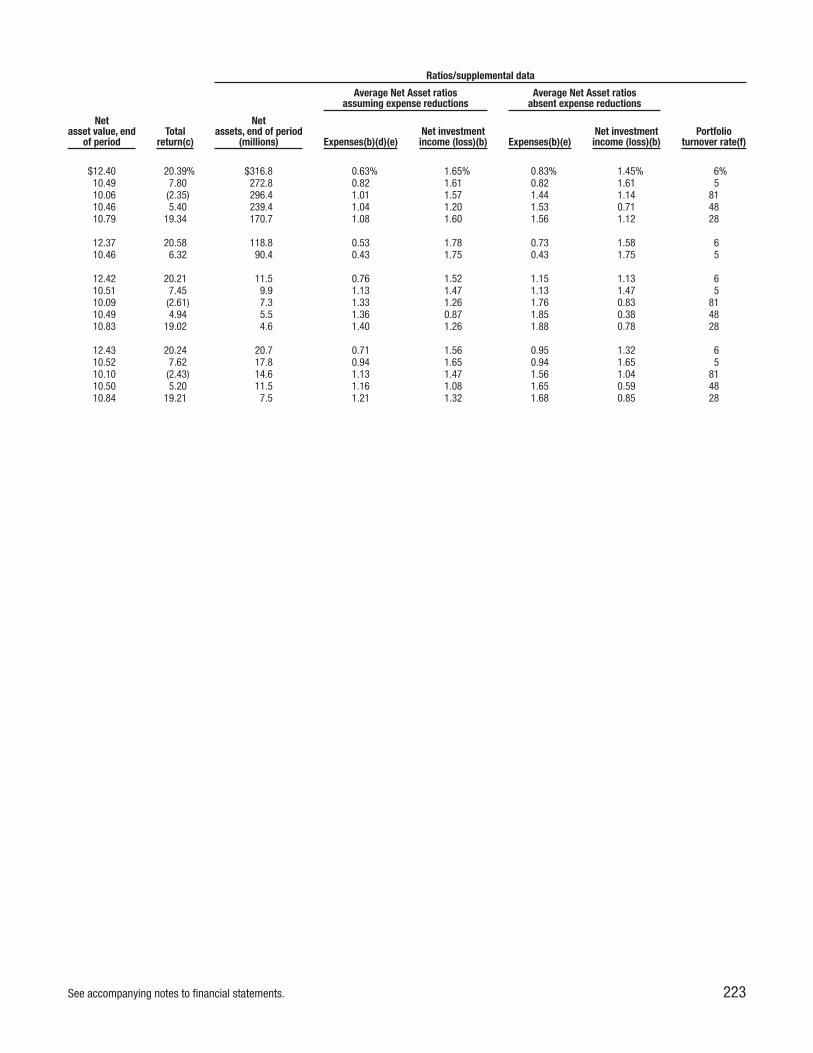
Ratios/supplemental data
Average Net Asset ratiosassuming expense reductions
Average Net Asset ratiosabsent expense reductions
Netasset value, end
of periodTotal
return(c)
Netassets, end of period
(millions) Expenses(b)(d)(e)Net investmentincome (loss)(b) Expenses(b)(e)
Net investmentincome (loss)(b)
Portfolioturnover rate(f)
$12.40 20.39% $316.8 0.63% 1.65% 0.83% 1.45% 6%10.49 7.80 272.8 0.82 1.61 0.82 1.61 510.06 (2.35) 296.4 1.01 1.57 1.44 1.14 8110.46 5.40 239.4 1.04 1.20 1.53 0.71 4810.79 19.34 170.7 1.08 1.60 1.56 1.12 28
12.37 20.58 118.8 0.53 1.78 0.73 1.58 610.46 6.32 90.4 0.43 1.75 0.43 1.75 5
12.42 20.21 11.5 0.76 1.52 1.15 1.13 610.51 7.45 9.9 1.13 1.47 1.13 1.47 510.09 (2.61) 7.3 1.33 1.26 1.76 0.83 8110.49 4.94 5.5 1.36 0.87 1.85 0.38 4810.83 19.02 4.6 1.40 1.26 1.88 0.78 28
12.43 20.24 20.7 0.71 1.56 0.95 1.32 610.52 7.62 17.8 0.94 1.65 0.94 1.65 510.10 (2.43) 14.6 1.13 1.47 1.56 1.04 8110.50 5.20 11.5 1.16 1.08 1.65 0.59 4810.84 19.21 7.5 1.21 1.32 1.68 0.85 28
See accompanying notes to financial statements. 223
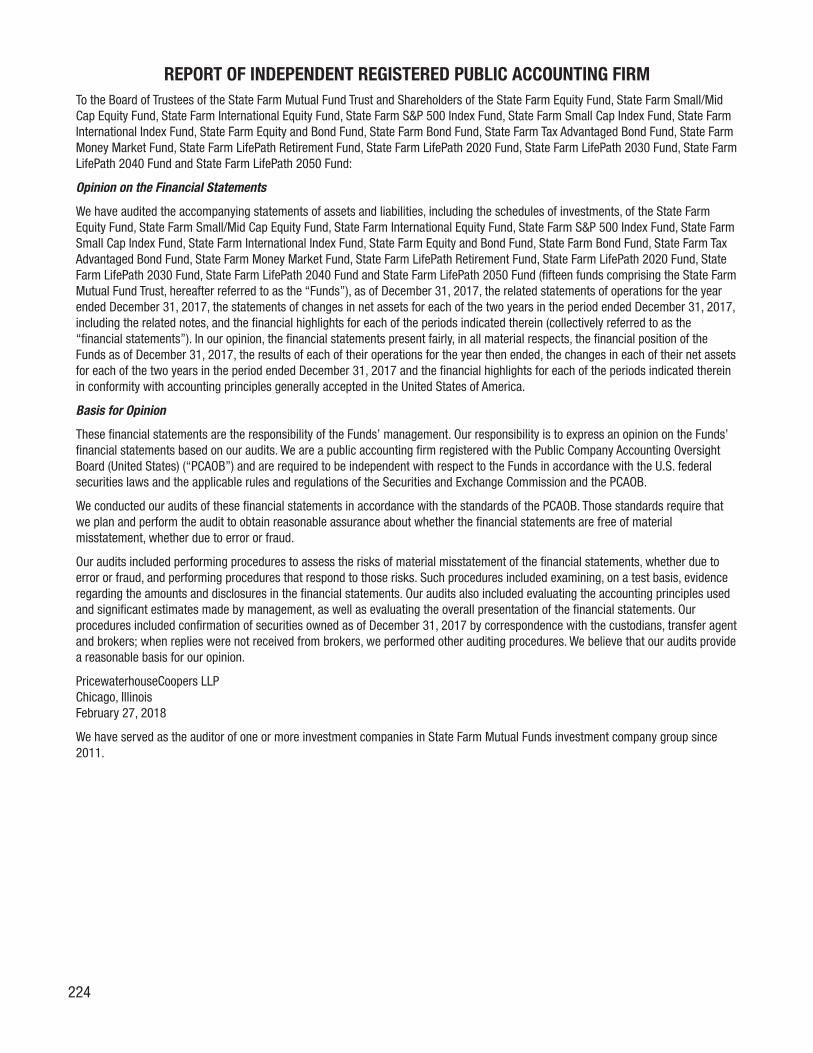
REPORT OF INDEPENDENT REGISTERED PUBLIC ACCOUNTING FIRMTo the Board of Trustees of the State Farm Mutual Fund Trust and Shareholders of the State Farm Equity Fund, State Farm Small/MidCap Equity Fund, State Farm International Equity Fund, State Farm S&P 500 Index Fund, State Farm Small Cap Index Fund, State FarmInternational Index Fund, State Farm Equity and Bond Fund, State Farm Bond Fund, State Farm Tax Advantaged Bond Fund, State FarmMoney Market Fund, State Farm LifePath Retirement Fund, State Farm LifePath 2020 Fund, State Farm LifePath 2030 Fund, State FarmLifePath 2040 Fund and State Farm LifePath 2050 Fund:
Opinion on the Financial Statements
We have audited the accompanying statements of assets and liabilities, including the schedules of investments, of the State FarmEquity Fund, State Farm Small/Mid Cap Equity Fund, State Farm International Equity Fund, State Farm S&P 500 Index Fund, State FarmSmall Cap Index Fund, State Farm International Index Fund, State Farm Equity and Bond Fund, State Farm Bond Fund, State Farm TaxAdvantaged Bond Fund, State Farm Money Market Fund, State Farm LifePath Retirement Fund, State Farm LifePath 2020 Fund, StateFarm LifePath 2030 Fund, State Farm LifePath 2040 Fund and State Farm LifePath 2050 Fund (fifteen funds comprising the State FarmMutual Fund Trust, hereafter referred to as the “Funds”), as of December 31, 2017, the related statements of operations for the yearended December 31, 2017, the statements of changes in net assets for each of the two years in the period ended December 31, 2017,including the related notes, and the financial highlights for each of the periods indicated therein (collectively referred to as the“financial statements”). In our opinion, the financial statements present fairly, in all material respects, the financial position of theFunds as of December 31, 2017, the results of each of their operations for the year then ended, the changes in each of their net assetsfor each of the two years in the period ended December 31, 2017 and the financial highlights for each of the periods indicated thereinin conformity with accounting principles generally accepted in the United States of America.
Basis for Opinion
These financial statements are the responsibility of the Funds’ management. Our responsibility is to express an opinion on the Funds’financial statements based on our audits. We are a public accounting firm registered with the Public Company Accounting OversightBoard (United States) (“PCAOB”) and are required to be independent with respect to the Funds in accordance with the U.S. federalsecurities laws and the applicable rules and regulations of the Securities and Exchange Commission and the PCAOB.
We conducted our audits of these financial statements in accordance with the standards of the PCAOB. Those standards require thatwe plan and perform the audit to obtain reasonable assurance about whether the financial statements are free of materialmisstatement, whether due to error or fraud.
Our audits included performing procedures to assess the risks of material misstatement of the financial statements, whether due toerror or fraud, and performing procedures that respond to those risks. Such procedures included examining, on a test basis, evidenceregarding the amounts and disclosures in the financial statements. Our audits also included evaluating the accounting principles usedand significant estimates made by management, as well as evaluating the overall presentation of the financial statements. Ourprocedures included confirmation of securities owned as of December 31, 2017 by correspondence with the custodians, transfer agentand brokers; when replies were not received from brokers, we performed other auditing procedures. We believe that our audits providea reasonable basis for our opinion.
PricewaterhouseCoopers LLPChicago, IllinoisFebruary 27, 2018
We have served as the auditor of one or more investment companies in State Farm Mutual Funds investment company group since2011.
224

FEDERAL INCOME TAX INFORMATION (unaudited)The following information is provided as required by the Internal Revenue Code for dividends paid by each Fund during the year endedDecember 31, 2017.
Fund
TotalCapital GainDistributed
Total QualifiedDividend Income
Distributed
Total DistributionsQualifying for the
Dividends-ReceivedDeduction
Total ForeignTaxes Paid
TotalForeignSourceIncome
TotalExempt
Interest Distributed
Equity Fund $32,212,654 $ 9,697,752 $ 9,305,817 — — —
Small Mid/Cap Equity Fund 24,830,969 3,381,028 2,975,326 — — —
International Equity Fund 3,375,841 704,152 318,844 210,768 2,242,954 —
S&P 500 Index Fund 11,078,105 27,376,697 26,871,960 — — —
Small Cap Index Fund 25,638,233 4,960,811 4,853,758 — — —
International Index Fund — 7,227,680 — 698,294 8,957,331 —
Equity and Bond Fund (a) 14,446,341 1,180,541 1,135,463 — — —
Bond Fund 2,102,349 — — — — —
Tax Advantaged Bond Fund — — — — — 13,343,737
Money Market Fund — — — — — —
LifePath Retirement Fund — 9,116,601 5,689,282 328,144 3,410,072 —
LifePath 2020 Fund 21,603,126 16,930,771 10,260,283 719,130 7,462,758 —
LifePath 2030 Fund 18,761,563 26,825,242 15,349,902 1,266,202 13,201,787 —
LifePath 2040 Fund 10,439,335 25,611,621 14,171,035 1,270,160 13,272,117 —
LifePath 2050 Fund 713,841 6,701,740 3,593,072 347,177 3,634,361 —
(a) Amounts include earnings and profits distributed to shareholders on redemption.
Shareholders are advised to consult their own tax advisor with respect to the tax consequences of their investment in the Funds.Individual shareholders should refer to their Form 1099 to determine the amounts to be included on their federal income tax return.
225

Management Information – State Farm Mutual Fund Trust, December 31, 2017 (unaudited)
I. Information about Non-Interested (Independent) Trustees of State Farm Mutual Fund Trust
Name, Address, and Age
Position(s)Held with
FundLength of Time Served
and Term of Office Principal Occupation(s) During the Past 5 years
Number ofPortfoliosin FundComplexOverseen
by Trustee
OtherDirectorships
Held byTrustee
During thePast 5 Years
Thomas M. MenglerOne State Farm PlazaBloomington, Illinois 61710Age 64
Trustee Began service in 2000and serves untilsuccessor is elected orappointed.
PRESIDENT – St. Mary’s University; TRUSTEE –State Farm Variable Product Trust, State FarmAssociates’ Funds Trust.
28 None
Victor J. BoschiniOne State Farm PlazaBloomington, Illinois 61710Age 61
Trustee Began service in 2000and serves untilsuccessor is elected orappointed.
CHANCELLOR – Texas Christian University;TRUSTEE – State Farm Variable Product Trust, StateFarm Associates’ Funds Trust.
28 None
David L. VanceOne State Farm PlazaBloomington, Illinois 61710Age 65
Trustee Began service in 2000and serves untilsuccessor is elected orappointed.
EXECUTIVE DIRECTOR – Center for TalentReporting, Inc. (nonprofit dedicated to improving themanagement of human capital); PRESIDENT/OWNER– Poudre River Press LLC (book publisher);CONSULTANT/PRESIDENT/OWNER – ManageLearning LLC (consults with organizations on learningstrategy, governance, measurement and evaluation);ADJUNCT FACULTY – Bellevue University andUniversity of Southern Mississippi; TRUSTEE – StateFarm Variable Product Trust, State Farm Associates’Funds Trust.
28 None
Alan R. LatshawOne State Farm PlazaBloomington, Illinois 61710Age 66
Trustee Began service in 2005and serves untilsuccessor is elected orappointed.
RETIRED; TRUSTEE – State Farm Variable ProductTrust, State Farm Associates’ Funds Trust.
28 TRUSTEE –MainStayFunds (83portfolios)
Anita M. NaglerOne State Farm PlazaBloomington, Illinois 61710Age 61
Trustee Began service in 2006and serves untilsuccessor is elected orappointed.
DIRECTOR – Baron Capital Group, Inc. (investmentadviser and distributor of mutual funds); PRIVATEINVESTOR; TRUSTEE – State Farm Variable ProductTrust, State Farm Associates’ Funds Trust.
28 None
Diane L. WallaceOne State Farm PlazaBloomington, Illinois 61710Age 59
Trustee Began service in 2013and serves untilsuccessor is elected orappointed.
RETIRED; TRUSTEE – State Farm Variable ProductTrust, State Farm Associates’ Funds Trust.
28 TRUSTEE –Janus
InvestmentFunds (65portfolios)
226
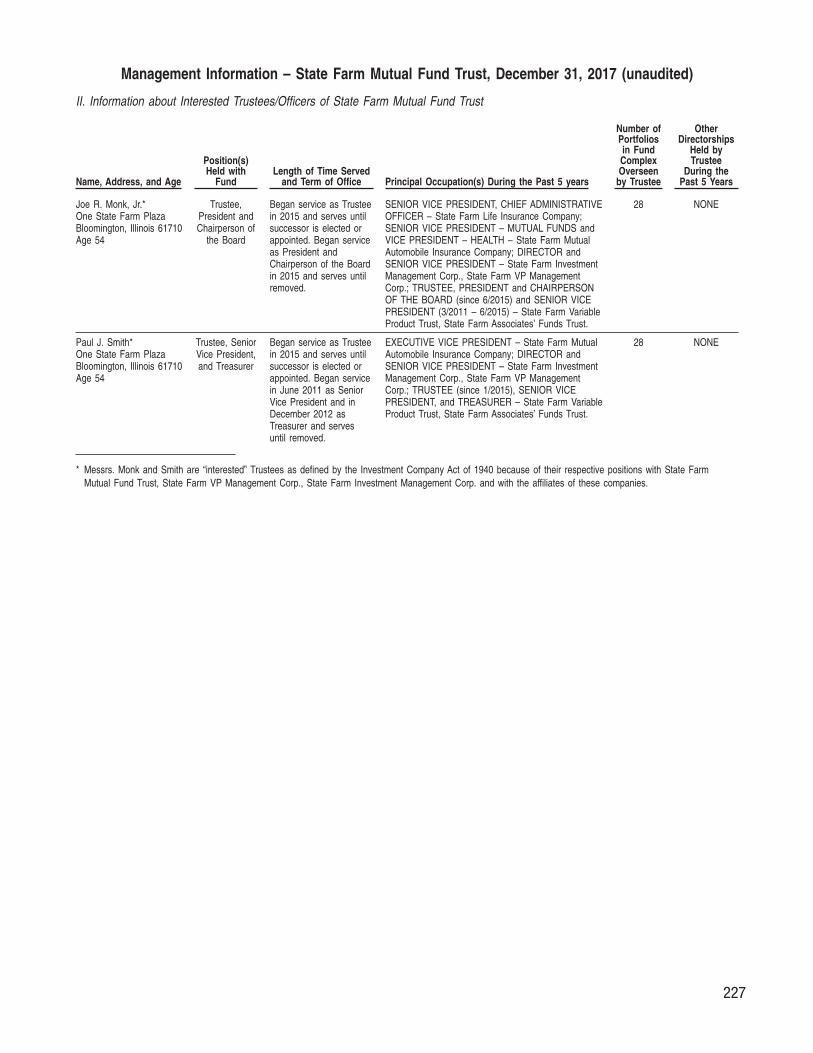
Management Information – State Farm Mutual Fund Trust, December 31, 2017 (unaudited)
II. Information about Interested Trustees/Officers of State Farm Mutual Fund Trust
Name, Address, and Age
Position(s)Held with
FundLength of Time Served
and Term of Office Principal Occupation(s) During the Past 5 years
Number ofPortfoliosin FundComplexOverseen
by Trustee
OtherDirectorships
Held byTrustee
During thePast 5 Years
Joe R. Monk, Jr.*One State Farm PlazaBloomington, Illinois 61710Age 54
Trustee,President andChairperson of
the Board
Began service as Trusteein 2015 and serves untilsuccessor is elected orappointed. Began serviceas President andChairperson of the Boardin 2015 and serves untilremoved.
SENIOR VICE PRESIDENT, CHIEF ADMINISTRATIVEOFFICER – State Farm Life Insurance Company;SENIOR VICE PRESIDENT – MUTUAL FUNDS andVICE PRESIDENT – HEALTH – State Farm MutualAutomobile Insurance Company; DIRECTOR andSENIOR VICE PRESIDENT – State Farm InvestmentManagement Corp., State Farm VP ManagementCorp.; TRUSTEE, PRESIDENT and CHAIRPERSONOF THE BOARD (since 6/2015) and SENIOR VICEPRESIDENT (3/2011 – 6/2015) – State Farm VariableProduct Trust, State Farm Associates’ Funds Trust.
28 NONE
Paul J. Smith*One State Farm PlazaBloomington, Illinois 61710Age 54
Trustee, SeniorVice President,and Treasurer
Began service as Trusteein 2015 and serves untilsuccessor is elected orappointed. Began servicein June 2011 as SeniorVice President and inDecember 2012 asTreasurer and servesuntil removed.
EXECUTIVE VICE PRESIDENT – State Farm MutualAutomobile Insurance Company; DIRECTOR andSENIOR VICE PRESIDENT – State Farm InvestmentManagement Corp., State Farm VP ManagementCorp.; TRUSTEE (since 1/2015), SENIOR VICEPRESIDENT, and TREASURER – State Farm VariableProduct Trust, State Farm Associates’ Funds Trust.
28 NONE
* Messrs. Monk and Smith are “interested” Trustees as defined by the Investment Company Act of 1940 because of their respective positions with State FarmMutual Fund Trust, State Farm VP Management Corp., State Farm Investment Management Corp. and with the affiliates of these companies.
227

Management Information – State Farm Mutual Fund Trust, December 31, 2017 (unaudited)
III. Information about Officers of State Farm Mutual Fund Trust
Name, Address, and Age
Position(s)Held with
FundLength of Time Served
and Term of Office Principal Occupation(s) During the Past 5 years
Lisa StewartOne State Farm PlazaBloomington, Illinois 61710Age 48
Vice President Began service inDecember 2015 andserves until removed.
VICE PRESIDENT – LIFE/HEALTH and MUTUAL FUNDS (since 10/2015), VICEPRESIDENT – AGENCY (1/2014 – 10/2015), VICE PRESIDENT AGENCY –CUSTOMER CARE CENTER (1/2013 – 1/2014) and VICE PRESIDENT OPERATIONS– ENTERPRISE SERVICES (9/2011 – 1/2013) – State Farm Mutual AutomobileInsurance Company; VICE PRESIDENT (since 12/2015) – State Farm InvestmentManagement Corp., State Farm VP Management Corp.; VICE PRESIDENT (since12/2015) – State Farm Variable Product Trust, State Farm Associates’ Funds Trust.
Mark D. MikelThree State Farm PlazaBloomington, Illinois 61791Age 47
Vice Presidentand Secretary
Began service inDecember 2012 andserves until removed.
ASSISTANT VICE PRESIDENT – MUTUAL FUNDS – State Farm Mutual AutomobileInsurance Company; VICE PRESIDENT – FINANCIAL AND SECRETARY (since 3/2013)and ASSISTANT SECRETARY-TREASURER (12/2007 – 3/2013) – State FarmInvestment Management Corp., State Farm VP Management Corp.; VICE PRESIDENTAND SECRETARY – State Farm Variable Product Trust, State Farm Associates’ FundsTrust.
David R. GrizzleThree State Farm PlazaBloomington, Illinois 61791Age 58
ChiefComplianceOfficer andAssistantSecretary-Treasurer
Began service asAssistant Secretary–Treasurer in 2001 and asChief Compliance Officerin 2006 and serves untilremoved.
CHIEF COMPLIANCE OFFICER and ASSISTANT SECRETARY-TREASURER – StateFarm Variable Product Trust, State Farm Associates’ Funds Trust; CHIEF COMPLIANCEOFFICER, TREASURER (since 3/2016), and ASSISTANT SECRETARY-TREASURER(3/2001 – 3/2016) – State Farm Investment Management Corp.; TREASURER (since3/2016) and ASSISTANT SECRETARY-TREASURER (3/2001 – 3/2016) – State FarmVP Management Corp.
Joseph P. YoungOne State Farm PlazaBloomington, Illinois 61710Age 54
Vice President Began service inDecember 2011 andserves until removed.
VICE PRESIDENT – FIXED INCOME – State Farm Mutual Automobile InsuranceCompany; VICE PRESIDENT – State Farm Investment Management Corp.; VICEPRESIDENT – State Farm Variable Product Trust, State Farm Associates’ Funds Trust.
The Trust’s Statement of Additional Information (“SAI”) includes additional information about the Trustees of the Trust, and the SAI is available without charge uponrequest. Call toll-free 1-800-447-4930 to request a copy of the SAI.
228

[THIS PAGE INTENTIONALLY LEFT BLANK]

[THIS PAGE INTENTIONALLY LEFT BLANK]


P.O. Box 219548Kansas City, MO 64121-9548
U.S. POSTAGE
PAIDLANCASTER, PAPERMIT NO. 1275
PRESORTED STANDARD
NotFDIC
Insured
• May Lose Value• No Bank Guarantee
There is no assurance that the Funds willachieve their investment objectives.Investment return and principal value willfluctuateandFundshares,whenredeemed,maybeworthmoreor lessthantheiroriginalcost. State Farm Mutual Funds are notinsurance products.
2-2018120-6345 a.17-CH AP2018/02/9813 Printed in U.S.A.


![Gazette News. (Daytona, Florida) 1902-01-25 [p ].ufdcimages.uflib.ufl.edu/UF/00/07/58/95/00420/00229.pdfSSSSSSSSSSSSSS ClassR-azors SUCCESSOR Liver 1rnetlles-xax Ry trill Natural YORK](https://static.fdocuments.in/doc/165x107/5f58b9ce892eea6ea02b85b9/gazette-news-daytona-florida-1902-01-25-p-ssssssssssssss-classr-azors-successor.jpg)
