Checkit in Financieel Dagblad: Bing kan in Nederland nog geen vuist maken in strijd tegen Google

State of Wind Energy in the United States Suzanne Tegen, Ph.D. June 9, 2017 Portland, Maine

2
National Renewable Energy Lab Portfolio

3
The U.S. Onshore and Offshore Wind Energy Resource

4
Wind Energy Installed Capacity in the United States
Source: American Wind Energy Association: http://www.awea.org/Resources/Content.aspx?ItemNumber=5059&navItemNumber=742
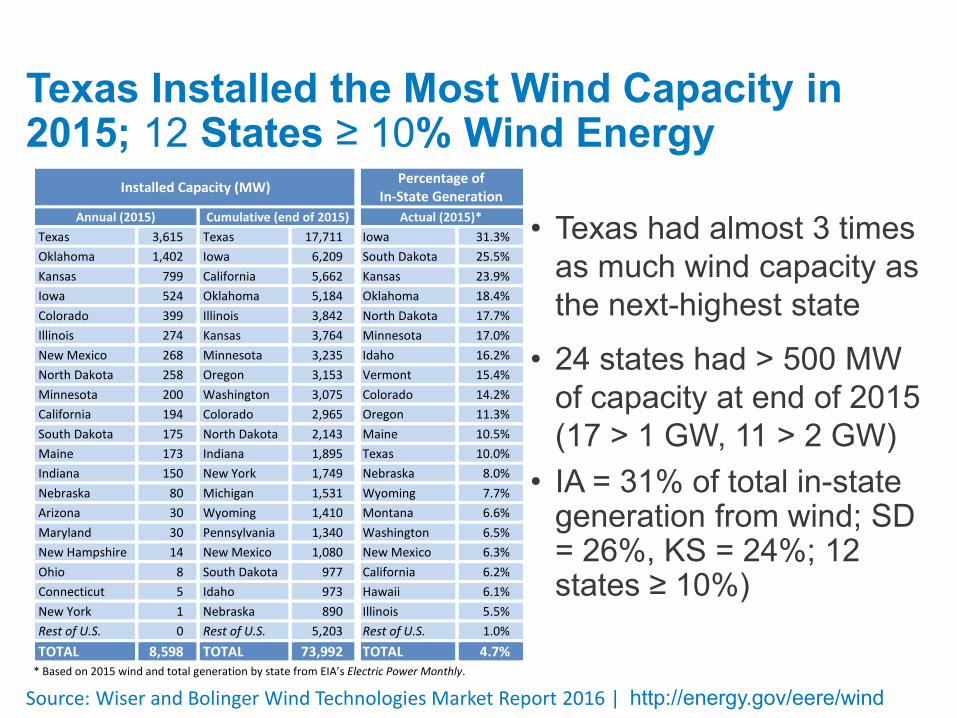
Texas Installed the Most Wind Capacity in 2015; 12 States ≥ 10% Wind Energy
• Texas had almost 3 times as much wind capacity as the next-highest state
• 24 states had > 500 MW of capacity at end of 2015 (17 > 1 GW, 11 > 2 GW)
• IA = 31% of total in-state generation from wind; SD = 26%, KS = 24%; 12 states ≥ 10%)
Installed Capacity (MW) Percentage of In-State Generation
Annual (2015) Cumulative (end of 2015) Actual (2015)* Texas 3,615 Texas 17,711 Iowa 31.3% Oklahoma 1,402 Iowa 6,209 South Dakota 25.5% Kansas 799 California 5,662 Kansas 23.9% Iowa 524 Oklahoma 5,184 Oklahoma 18.4% Colorado 399 Illinois 3,842 North Dakota 17.7% Illinois 274 Kansas 3,764 Minnesota 17.0% New Mexico 268 Minnesota 3,235 Idaho 16.2% North Dakota 258 Oregon 3,153 Vermont 15.4% Minnesota 200 Washington 3,075 Colorado 14.2% California 194 Colorado 2,965 Oregon 11.3% South Dakota 175 North Dakota 2,143 Maine 10.5% Maine 173 Indiana 1,895 Texas 10.0% Indiana 150 New York 1,749 Nebraska 8.0% Nebraska 80 Michigan 1,531 Wyoming 7.7% Arizona 30 Wyoming 1,410 Montana 6.6% Maryland 30 Pennsylvania 1,340 Washington 6.5% New Hampshire 14 New Mexico 1,080 New Mexico 6.3% Ohio 8 South Dakota 977 California 6.2% Connecticut 5 Idaho 973 Hawaii 6.1% New York 1 Nebraska 890 Illinois 5.5% Rest of U.S. 0 Rest of U.S. 5,203 Rest of U.S. 1.0% TOTAL 8,598 TOTAL 73,992 TOTAL 4.7%
* Based on 2015 wind and total generation by state from EIA’s Electric Power Monthly.
Source: Wiser and Bolinger Wind Technologies Market Report 2016 | http://energy.gov/eere/wind

6
Wind Energy-Related Policy: the Production Tax Credit (PTC)
PTC (Sec. 301): wind projects that started construction in 2015 and 2016 receive a full value PTC of 2.3 cents per kilowatt-hour. For projects that begin construction in 2017, the credit is at 80% of full value; in 2018, 60% PTC; and in 2019, 40% PTC. After that, the PTC is phased out.
Union of Concerned Scientists ucsusa.org

7
Renewable Energy Policy: Renewable Portfolio Standards

8
Turbines Are Getting Larger
Source: Wiser, Bolinger, Seel. 2017. Lawrence Berkeley National Laboratory. Wind Cost and Performance Improvements: Where Have We Been, Where Are We Going, and Why Does it Matter?

9
Wind Turbines Continue to Increase in Size
Source: Wiser et al., Lawrence Berkeley National Laboratory 2017

10
Capacity Factors Are Increasing Over Time
0%
10%
20%
30%
40%
50%
60%
1998-9923
894
2000-0126
1,750
2002-0334
1,979
2004-0527
3,634
200620
1,738
200737
5,282
200879
8,498
200996
9,578
201047
4,632
201169
5,904
2012121
13,731
20138
969
201435
4,964
201553
8,063
Weighted Average (by project vintage) Individual Project (by project vintage)
2016
Cap
acity
Fac
tor (
by p
roje
ct v
inta
ge)
Sample includes 675 projects totaling 71.6 GW
Vintage:# projects:
# MW:
Source: Wiser et al., Lawrence Berkeley National Laboratory 2017

11
Cost Reductions in Wind Energy Projects Over Time
0
1,000
2,000
3,000
4,000
5,000
6,000
1982
1983
1984
1985
1986
1987
1988
1989
1990
1991
1992
1993
1994
1995
1996
1997
1998
1999
2000
2001
2002
2003
2004
2005
2006
2007
2008
2009
2010
2011
2012
2013
2014
2015
2016
Inst
alle
d Pr
ojec
t Cos
t (20
16 $
/kW
)
Commercial Operation Date
Individual Project Cost (840 projects totaling 67,093 MW) Capacity-Weighted Average Project Cost EIA Capacity-Weighted Average (2013-2015 only)
2016 average: $1,580/kW; down from $2,360/kW in 2010
Source: Wiser et al., Lawrence Berkeley National Laboratory 2017

12
Wind Prices Remain Very Low, Especially in Interior (w/ PTC)
$0
$20
$40
$60
$80
$100
$120Ja
n-96
Jan-
97
Jan-
98
Jan-
99
Jan-
00
Jan-
01
Jan-
02
Jan-
03
Jan-
04
Jan-
05
Jan-
06
Jan-
07
Jan-
08
Jan-
09
Jan-
10
Jan-
11
Jan-
12
Jan-
13
Jan-
14
Jan-
15
Jan-
16
Jan-
17
PPA Execution Date
Interior (25,382 MW, 244 contracts) West (7,421 MW, 77 contracts) Great Lakes (4,104 MW, 51 contracts) Northeast (1,436 MW, 29 contracts) Southeast (476 MW, 7 contracts)
Leve
lized
PPA
Pri
ce (2
016
$/M
Wh)
25 MW
150 MW
50 MW
200 MW
Levelized 20-year EIA gas price projections (converted at 7.5 MMBtu/MWh)
2016 average: $21/MWh
Source: Wiser et al., Lawrence Berkeley National Laboratory 2017

13
Costs of Wind Energy Compared to Natural Gas
Source: Wiser and Bolinger, Wind Technologies Market Report 2016 | http://energy.gov/eere/wind

14
Wind Turbine Domestic Content
Source: Wiser and Bolinger, Wind Technologies Market Report 2016 | http://energy.gov/eere/wind

15
In 2016, Manufacturing Supply Chain Continued to Adjust to Swings in Domestic Demand
Note: Map not intended to be exhaustive
• Upswing in near- to medium-term expected growth, but strong competitive pressures and possible reduced demand over time as the PTC is phased down.
• 3 domestic manufacturing facility closures in 2015; 1 new opening.
• Many manufacturers remain: over last decade, manufacturers have localized and expanded U.S. presence; “Big 3” OEMs all have at least one facility.
• Wind-related jobs increased from 73,000 in 2014 to 88,000 in 2015.
Source: Wiser and Bolinger, Wind Technologies Market Report 2016 | http://energy.gov/eere/wind

The U.S. Onshore and Offshore Wind Energy Resource
Offshore Wind

17
Offshore Wind - Global
Global offshore wind project pipeline through 2020 (by country)
Preliminary data – Musial et al., forthcoming.

18
Offshore Wind Projects in the United States

19
Offshore Wind - Technical Energy Potential by State
-
200
400
600
800
1,000
1,200
Mas
sach
uset
tsFl
orid
aTe
xas
Loui
sian
aN
orth
Car
olin
aSo
uth
Caro
lina
Mai
neCa
lifor
nia
New
Yor
kN
ew Je
rsey
Ore
gon
Mic
higa
nVi
rgin
iaGe
orgi
aW
ashi
ngto
nH
awai
iM
aryl
and
Ohi
oRh
ode
Isla
ndAl
abam
aW
isco
nsin
Dela
war
eIll
inoi
sPe
nnsy
lvan
iaM
issi
ssip
piCo
nnec
ticut
New
…In
dian
aM
inne
sota
Net
Tech
nica
l Ene
rgy
Pote
ntia
l (T
Wh/
year
)
Series2
Series1
Water Depth > 60 m
Water Depth < 60 m
Musial, W. et al. 2016 Offshore Wind Energy Resource Assessment for the United States. NREL/TP-5000-66599. http://www.nrel.gov/docs/fy16osti/66599.pdf

20
Offshore Wind - Technical Energy Potential by State
-
200
400
600
800
1,000
1,200
Mas
sach
uset
tsFl
orid
aTe
xas
Loui
sian
aN
orth
Car
olin
aSo
uth
Caro
lina
Mai
neCa
lifor
nia
New
Yor
kN
ew Je
rsey
Ore
gon
Mic
higa
nVi
rgin
iaGe
orgi
aW
ashi
ngto
nH
awai
iM
aryl
and
Ohi
oRh
ode
Isla
ndAl
abam
aW
isco
nsin
Dela
war
eIll
inoi
sPe
nnsy
lvan
iaM
issi
ssip
piCo
nnec
ticut
New
…In
dian
aM
inne
sota
Net
Tech
nica
l Ene
rgy
Pote
ntia
l (T
Wh/
year
)
Series2
Series1
Water Depth > 60 m
Water Depth < 60 m
Musial, W. et al. 2016 Offshore Wind Energy Resource Assessment for the United States. NREL/TP-5000-66599. http://www.nrel.gov/docs/fy16osti/66599.pdf
21
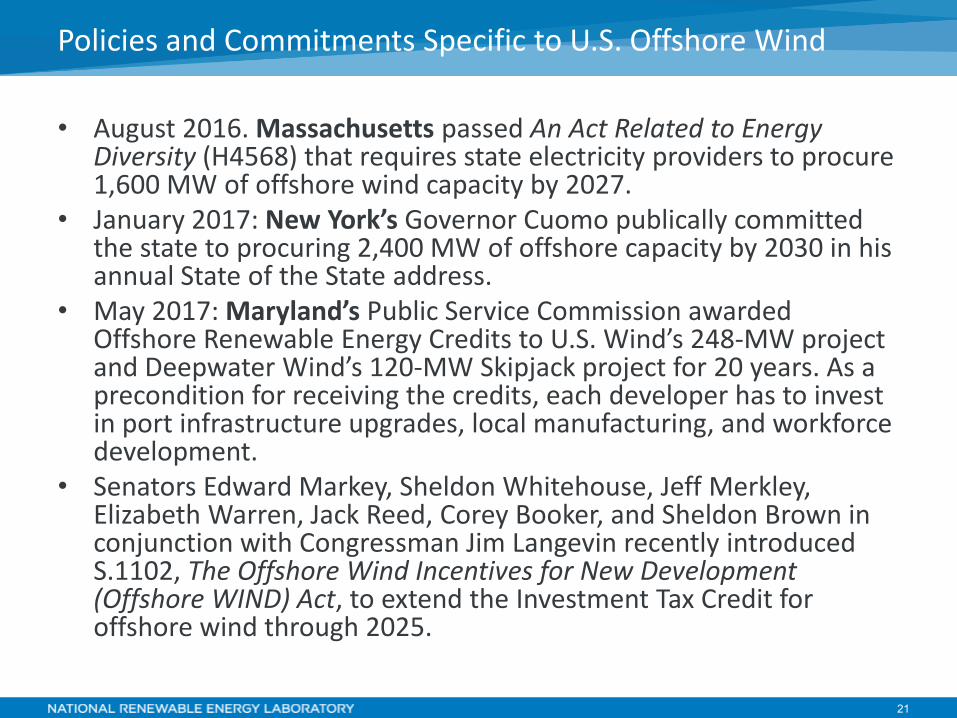
• August 2016. Massachusetts passed An Act Related to Energy Diversity (H4568) that requires state electricity providers to procure 1,600 MW of offshore wind capacity by 2027.
• January 2017: New York’s Governor Cuomo publically committed the state to procuring 2,400 MW of offshore capacity by 2030 in his annual State of the State address.
• May 2017: Maryland’s Public Service Commission awarded Offshore Renewable Energy Credits to U.S. Wind’s 248-MW project and Deepwater Wind’s 120-MW Skipjack project for 20 years. As a precondition for receiving the credits, each developer has to invest in port infrastructure upgrades, local manufacturing, and workforce development.
• Senators Edward Markey, Sheldon Whitehouse, Jeff Merkley, Elizabeth Warren, Jack Reed, Corey Booker, and Sheldon Brown in conjunction with Congressman Jim Langevin recently introduced S.1102, The Offshore Wind Incentives for New Development (Offshore WIND) Act, to extend the Investment Tax Credit for offshore wind through 2025.
Policies and Commitments Specific to U.S. Offshore Wind

Wind Energy Analysis and Modeling

23
DOE Wind Vision Modeled Wind to 2050 Offshore Deployment - 2050
Source: The Wind Vision http://energy.gov/eere/wind/downloads/wind-vision-new-era-wind-power-united-states
Stars represent approximations for where we are in 2017.

24
• Construction workers • Management • Administrative support • Cement truck drivers • Road crews • Maintenance workers • Legal and siting
Project Development & On-site Labor Impacts
Local Revenue, Turbine, & Supply Chain Impacts Induced Impacts
• Blades, towers, gearboxes Jobs and earnings that result from the spending supported by the project, including benefits to grocery store clerks, retail salespeople, and child-care providers
• Boom truck & management, gas and gas station workers; • Supporting businesses, such as bankers financing the construction, contractor, manufacturers, and equipment suppliers; • Utilities;
Jobs and Economic Impacts from the JEDI Model
Construction Phase = 1-2 years Operational Phase = 20+ years
JEDI Model Version W1.09.03e
• Hardware store purchases and workers, spare parts and their suppliers
Source: National Renewable Energy Laboratory
Economic Ripple Effect from Wind Energy

25
Trade workers 15%
Transportation/ logistics
11% Wind
Technicians 8%
7%
7%
6%
6%
6%
5%
3% 3%
2%
1% 1%
Subset of the Wind Energy Workforce We Captured (250 firms in 2016) Engineers
Trade workers (electricians, welders, etc.)
Transportation/logistics workers
Wind technicians
Construction laborers (other than skilled tradeworkers)Accountants/bookkeepers/finance
Sales/marketing
Admin/clerical
Product designers & design engineers
Attorneys
Assembly workers
Applied/field scientists (biologist, environmental,archaeologist, meteorologist, other)Professors/teachers
Programmers and computer scientists
Professional trainers/educators
Communications/PR
Engineers 18%
U.S. Wind Energy Workforce by Occupation
Initial Workforce Data – Report Forthcoming 2017
Source: Tegen 2017. NREL PR-5000-68542

26
Occupations with a Higher Representation of Select Groups
Women Minorities
(Ethnic/Racial) U.S. Veterans Average representation of this group within all occupations
28% 25% 11%
• Admin/clerical 83% • Accountants/
bookkeepers/finance 63% • Communications/PR 53% • Government/regulatory
50% • Applied/field scientists
45% • Engineer – civil 41% • Economists and policy
experts 33%
• Construction laborers
73% • Wind technicians 53% • Civil engineers 45% • Transportation/logistics
workers 45% • Assembly workers 38% • Resource assessors/
surveyors 37%
• Construction laborers
44% • Wind technicians 37%
Note: There is overlap in these groups. 51% of Americans are women; 38% are minorities; 7.5% are veterans. Initial Workforce Data – Report Forthcoming 2017

27
Do They Need Wind-Specific Education and Training? Overall, wind energy firms are more likely to want their employees to have education and/or professional certification related to their occupation (e.g., certified public accountants). However, for: • Professors, • Teachers, • Product designers, • Design engineers, and • Wind technicians, wind energy-specific professional certification is more important.
Initial Workforce Data – Report Forthcoming 2017
28
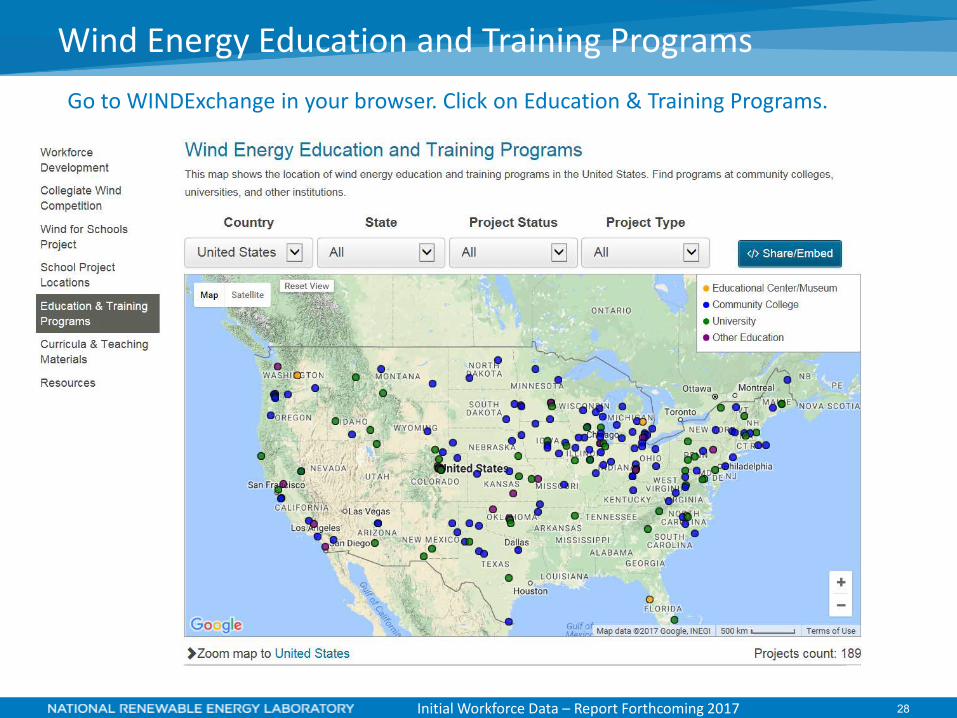
Map from WX If your institution is not on the map, please contact me: [email protected]
Wind Energy Education and Training Programs Go to WINDExchange in your browser. Click on Education & Training Programs.
Initial Workforce Data – Report Forthcoming 2017

29
Tools and Resources: • Wind Career Map • Jobs and Economic Development Impacts
(JEDI) Models www.nrel.gov/analysis/jedi • WINDExchange bi-weekly newsletter to
~16,000 subscribers
Initiatives: • Wind for Schools • Collegiate Wind Competition • North American Wind Energy Academy Partners: universities, community colleges, NGOs WRISE – Women in Renewable Industries and Sustainable Energy, Regional Resource Centers, AWEA Workforce Committee and many more. Engagement with academia, communities, and industry through research, webinars, trainings, symposia.
DOE/NREL Work to Help Inspire the Future Workforce
Initial Workforce Data – Report Forthcoming 2017

Thank you.
Subscribe to our WINDExchange Newsletter for news and events.
Suzanne Tegen [email protected]
303-384-6939

31
Reference Documents
http://energy.gov/eere/wind/downloads/wind-vision-new-era-wind-power-united-
states
http://energy.gov/sites/prod/files/2016/09/f33/
National-Offshore-Wind-Strategy-report-09082016.pdf
Full Report: https://emp.lbl.gov/iea-wind-
expert-survey

Radar impacts exist, but federal agency siting requirements address concerns. A variety of mitigation strategies have been developed to reduce impacts on radar. These include infill radars to restore a loss in radar coverage, replacement radars, and upgrading identified radar technology.* In addition, rigorous review processes and federal consultations address this issue.** *Karlson et al. Sandia National Laboratory. (September 2014). IFT&E Industry Report Wind Turbine-Radar Interference Test Summary. ** Federal Aviation Administration. DoD Preliminary Screening Tool.
Photo from NOAA