State of the Social Intranet - Prescient Digital Social Intranet Study... · tools are instant...
44
1 THE SOCIAL INTRANET STUDY State of the Social Intranet Results of 2012 Social Intranet Survey Toby Ward Prescient Digital Media January 2013
-
Upload
trinhduong -
Category
Documents
-
view
222 -
download
0
Transcript of State of the Social Intranet - Prescient Digital Social Intranet Study... · tools are instant...
1
THE SOCIAL INTRANET STUDY
State of the Social Intranet Results of 2012 Social Intranet Survey
Toby Ward Prescient Digital Media January 2013
2
THE SOCIAL INTRANET STUDY
Contents
Introduction .................................................................................................................................................. 3
Executive Summary ....................................................................................................................................... 5
Key Findings .................................................................................................................................................. 8
1. INTRANET AGE ...................................................................................................................................... 8
2. EMPLOYEE ACCESS ................................................................................................................................ 9
3. INTRANET USE ..................................................................................................................................... 10
4. INTRANET FUNCTIONS ........................................................................................................................ 11
5. TECHNOLOGY ...................................................................................................................................... 12
6. SOCIAL MEDIA TOOLS ......................................................................................................................... 13
7. TIMING ................................................................................................................................................ 14
8. EVALUATION TIME .............................................................................................................................. 15
9. PRODUCTS ........................................................................................................................................... 16
10. BUDGET ............................................................................................................................................. 17
11. DEGREE OF SOCIALITY ....................................................................................................................... 18
12. REASONS ........................................................................................................................................... 19
13. ACCESS .............................................................................................................................................. 20
14. EMPLOYEE CONTRIBUTION ............................................................................................................... 21
15. EXECUTIVE CONTRIBUTION .............................................................................................................. 22
16. SATISFACTION ................................................................................................................................... 23
17. RETURN ON INVESTMENT ................................................................................................................. 24
18. UPGRADING TOOLS ........................................................................................................................... 25
19. SOCIAL MEDIA TOOLS ....................................................................................................................... 26
20. INTRANET 2.0 PLANNING .................................................................................................................. 27
21. BARRIERS ........................................................................................................................................... 28
22. GOVERNANCE ................................................................................................................................... 29
23. DEDICATED STAFF ............................................................................................................................. 30
24. INDUSTRY .......................................................................................................................................... 31
25. REVENUE ........................................................................................................................................... 32
26. GEOGRAPHY ...................................................................................................................................... 33
Cross-Tabulation Results by Industry and Size ........................................................................................... 34
27. TECHNOLOGY PLATFORM VS. COMPANY SIZE .................................................................................. 35
28. TECHNOLOGY PLATFORM VS. INDUSTRY .......................................................................................... 36
29. BLOGS VS. COMPANY SIZE ................................................................................................................ 37
30. WIKIS VS. COMPANY SIZE.................................................................................................................. 38
31. BLOGS VS. INDUSTRY ........................................................................................................................ 39
32. WIKIS VS. INDUSTRY .......................................................................................................................... 40
Recommendations ...................................................................................................................................... 41
About Prescient Digital Media .................................................................................................................... 43
3
THE SOCIAL INTRANET STUDY
Introduction
The Social Intranet Study examines social media use on corporate intranets and the magnitude, use, and
popularity of social media by employees and executives. The study findings and analysis are based on
survey results collected in Fall 2012 by Toby Ward, Prescient Digital Media. These results reveal rapid
adoption of social media on the corporate intranet in the past year.
The Social Intranet Survey was completed by 651 participants in small, medium, and large organizations
in a variety of industries across the world.
Geographical representation
The majority of organizations’ head offices are located in North America and Europe:
32% of organizations are based in the United States.
24% of organizations are based in Europe.
15% of organizations are based in Canada.
Intranet size (employees with access)
The Social Intranet Survey sample consists of organization sizes from less than 100 intranet users to
more than 50,000:
34% of organizations have one to 999 employees with intranet access.
40% of organizations have 1,000 to 9,999 employees with intranet access.
27% of organizations have 10,000 to 50,000+ employees with intranet access
Intranet size (organization revenue)
The survey was completed by a strong, cross-representative sample of small, medium and large
organizations with revenues ranging from less than US$1 million to more than US $1 billion:
12% of organizations have revenues of less than US$1 million.
59% of organizations have revenues between US$1 million and US$1 billion.
30% of organizations have revenues of more than US$1 billion.
4
THE SOCIAL INTRANET STUDY
Intranet maturity
Most organizations have had an intranet for many years. In fact, 81% of organizations have had an
intranet for five or more years:
5% of organizations have had an intranet for less than 1 year.
49% of organizations have had an intranet for more than 10 years.
Organizations by industry
The following are the 10 most represented industries included in the study:
Consulting
Financial Services
Health Care/Medicine
Insurance
Education
Telecommunication equipment and services
Banking
Utility (water/power/energy)
Computer equipment and services
Media
In this report, the phrase “social media” and “intranet 2.0” are synonymous labels for describing
enterprise or intranet social media tools such as blogs, wikis, and social networking.
For more information on the Social Intranet Study, or for help identifying, planning and implementing
Intranet 2.0 tools, please contact Prescient Digital Media directly via the website
www.PrescientDigital.com or by phone at +1 416.926.8800.
Note: percentages may not total 100 due to rounding.
5
THE SOCIAL INTRANET STUDY
Executive Summary
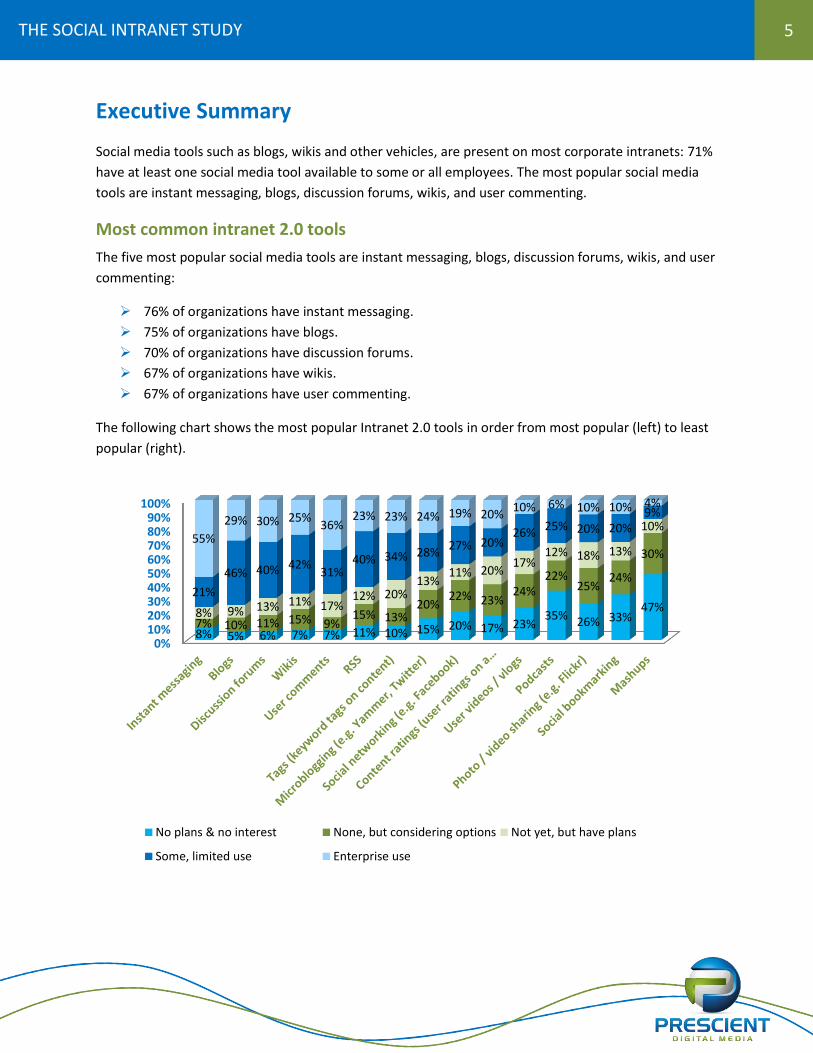
Social media tools such as blogs, wikis and other vehicles, are present on most corporate intranets: 71%
have at least one social media tool available to some or all employees. The most popular social media
tools are instant messaging, blogs, discussion forums, wikis, and user commenting.
Most common intranet 2.0 tools
The five most popular social media tools are instant messaging, blogs, discussion forums, wikis, and user
commenting:
76% of organizations have instant messaging.
75% of organizations have blogs.
70% of organizations have discussion forums.
67% of organizations have wikis.
67% of organizations have user commenting.
The following chart shows the most popular Intranet 2.0 tools in order from most popular (left) to least
popular (right).
0%10%20%30%40%50%60%70%80%90%
100%
8% 5% 6% 7% 7% 11% 10% 15% 20% 17% 23% 35% 26% 33%
47% 7% 10% 11% 15% 9%
15% 13% 20%
22% 23% 24%
22% 25%
24%
30%
8% 9% 13% 11% 17% 12% 20%
13% 11% 20%
17% 12% 18% 13%
10%
21%
46% 40% 42% 31%
40% 34% 28% 27% 20%
26% 25% 20% 20% 9%
55%
29% 30% 25% 36%
23% 23% 24% 19% 20% 10% 6% 10% 10% 4%
No plans & no interest None, but considering options Not yet, but have plans
Some, limited use Enterprise use

6
THE SOCIAL INTRANET STUDY
Technology platforms
Portal solutions (e.g. SharePoint or WebSphere) are the most popular technology platforms. Almost one
half of intranets are powered by a portal solution:
44% of organizations use a portal solution.
24% use a content management system (e.g. Interwoven or Ektron).
15% use a custom-built solution.
13% use a hybrid solution.
4% use a social media platform.
SharePoint and other Intranet 2.0 solutions
Microsoft continues to dominate the enterprise collaboration or intranet 2.0 market. For those
organizations that have deployed at least one Intranet 2.0 tool, about half (46%) have SharePoint (in
some shape or form). No other vendor is used in more than 15% of organizations (though some
organizations use multiple solutions).
46% of organizations with Intranet 2.0 tools are using Microsoft SharePoint (MOSS).
WordPress and Facebook (employee groups) are becoming popular Intranet 2.0 products and
are currently used in 13% and 10% of organizations, respectively.
Cost of social media
Most organizations spend little or nothing on their enterprise social media tools. Many organizations
that implement social media tools spend less than US$10,000:
47% have spent less than US$10,000.
30% have spent between US$10,000 and US$99,999.
23% have spent US$100,000 or more.
Satisfaction
Executives and employees alike are less than thrilled with their enterprise social media. A very small
percentage of organizations rate their Intranet 2.0 tools as good or very good:
29% of organizations rate their Intranet 2.0 tools’ ease of use as good or very good.
28% of organizations rate their Intranet 2.0 tools’ quality of content as good or very good.
26% of organizations rate their Intranet 2.0 tools’ functionality as good or very good.
22% of organizations rate employee satisfaction with Intranet 2.0 tools as good or very good.
17% of organizations rate executive satisfaction with Intranet 2.0 tools as good or very good.
Only 19% of organizations rate their overall satisfaction with their Intranet 2.0 tools as good or
very good.
7
THE SOCIAL INTRANET STUDY
Barriers to implementation
Without a proper plan and business case, many organizations will fail to properly implement Intranet 2.0
technologies. Those organizations that do not have 2.0 tools are not getting executive approval to
proceed as they do not have a proper plan or business case that convinces senior management of the
need.
The two greatest priorities continue to be lack of executive support and “other bigger priorities”:
22% cite lack of executive support as the primary barrier to implementation.
18% cite “other, bigger priorities” preventing them from implementation.
13% cite lack of interest as the greatest barrier to implementing social media tools.
8
THE SOCIAL INTRANET STUDY
Key Findings
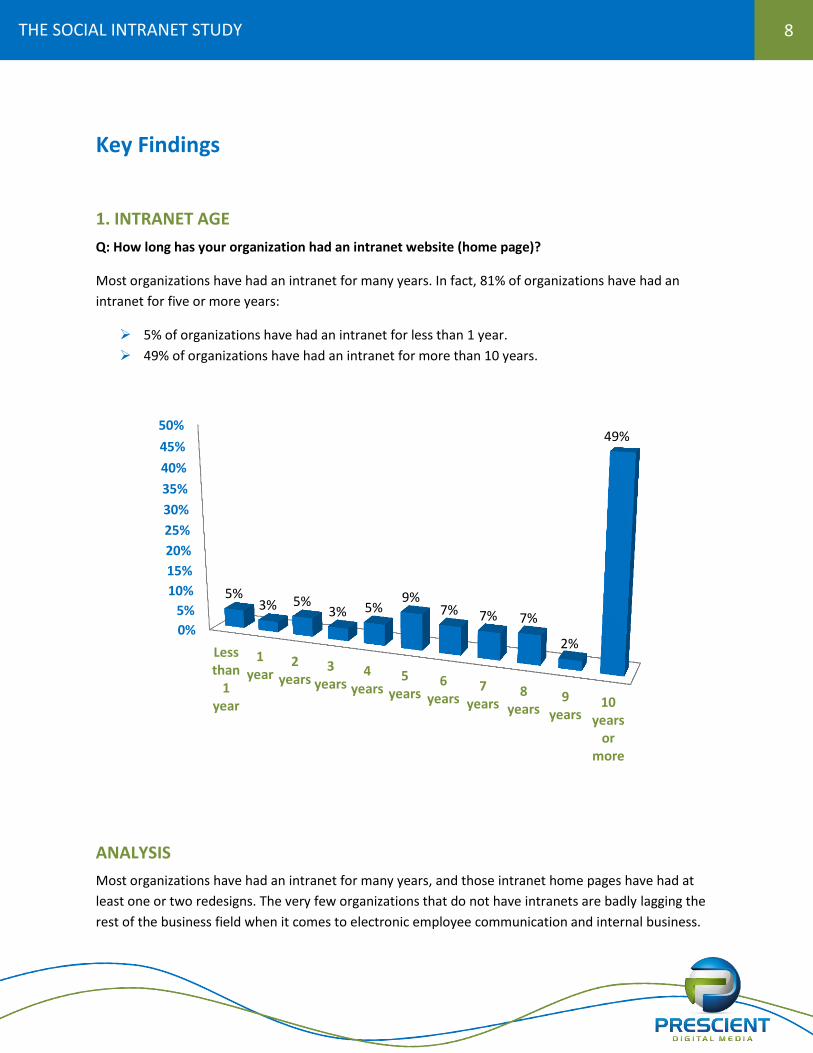
1. INTRANET AGE
Q: How long has your organization had an intranet website (home page)?
Most organizations have had an intranet for many years. In fact, 81% of organizations have had an
intranet for five or more years:
5% of organizations have had an intranet for less than 1 year.
49% of organizations have had an intranet for more than 10 years.
ANALYSIS
Most organizations have had an intranet for many years, and those intranet home pages have had at
least one or two redesigns. The very few organizations that do not have intranets are badly lagging the
rest of the business field when it comes to electronic employee communication and internal business.
0%
5%
10%
15%
20%
25%
30%
35%
40%
45%
50%
Lessthan
1year
1year
2years
3years
4years
5years
6years
7years
8years
9years
10years
ormore
5% 3% 5%
3% 5% 9%
7% 7% 7%
2%
49%
9
THE SOCIAL INTRANET STUDY
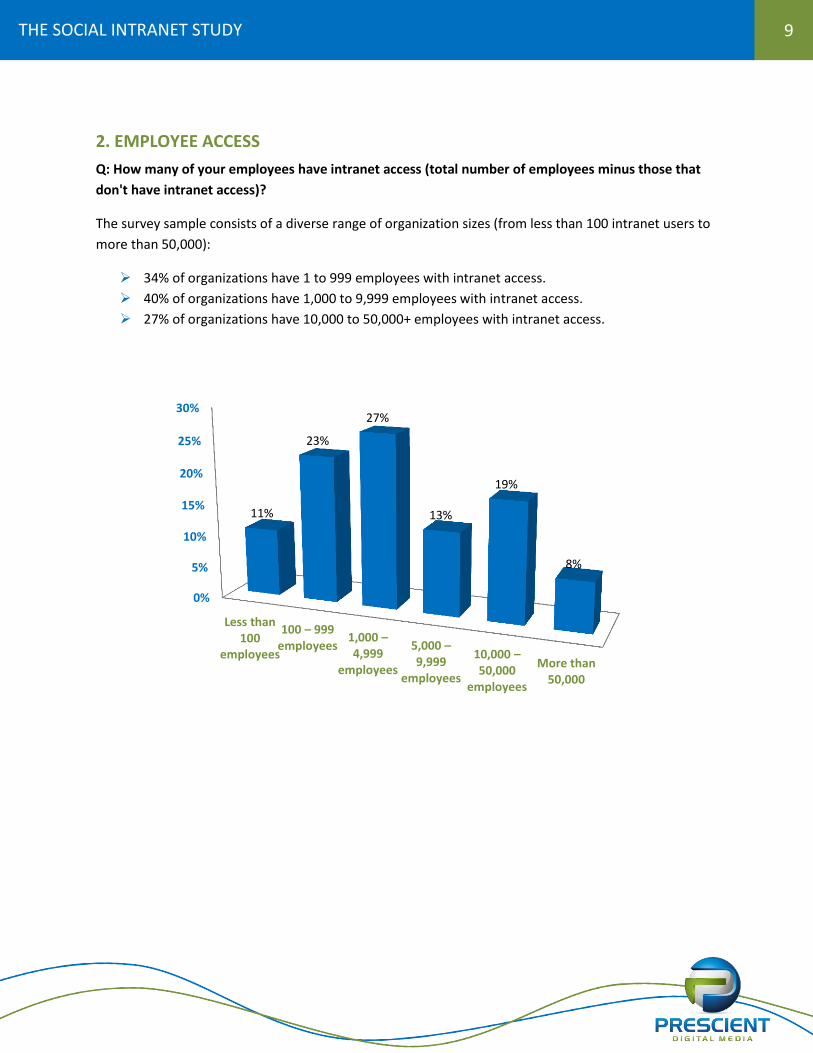
2. EMPLOYEE ACCESS
Q: How many of your employees have intranet access (total number of employees minus those that
don't have intranet access)?
The survey sample consists of a diverse range of organization sizes (from less than 100 intranet users to
more than 50,000):
34% of organizations have 1 to 999 employees with intranet access.
40% of organizations have 1,000 to 9,999 employees with intranet access.
27% of organizations have 10,000 to 50,000+ employees with intranet access.
0%
5%
10%
15%
20%
25%
30%
Less than100
employees
100 – 999 employees
1,000 – 4,999
employees
5,000 – 9,999
employees
10,000 – 50,000
employees
More than50,000
11%
23%
27%
13%
19%
8%
10
THE SOCIAL INTRANET STUDY
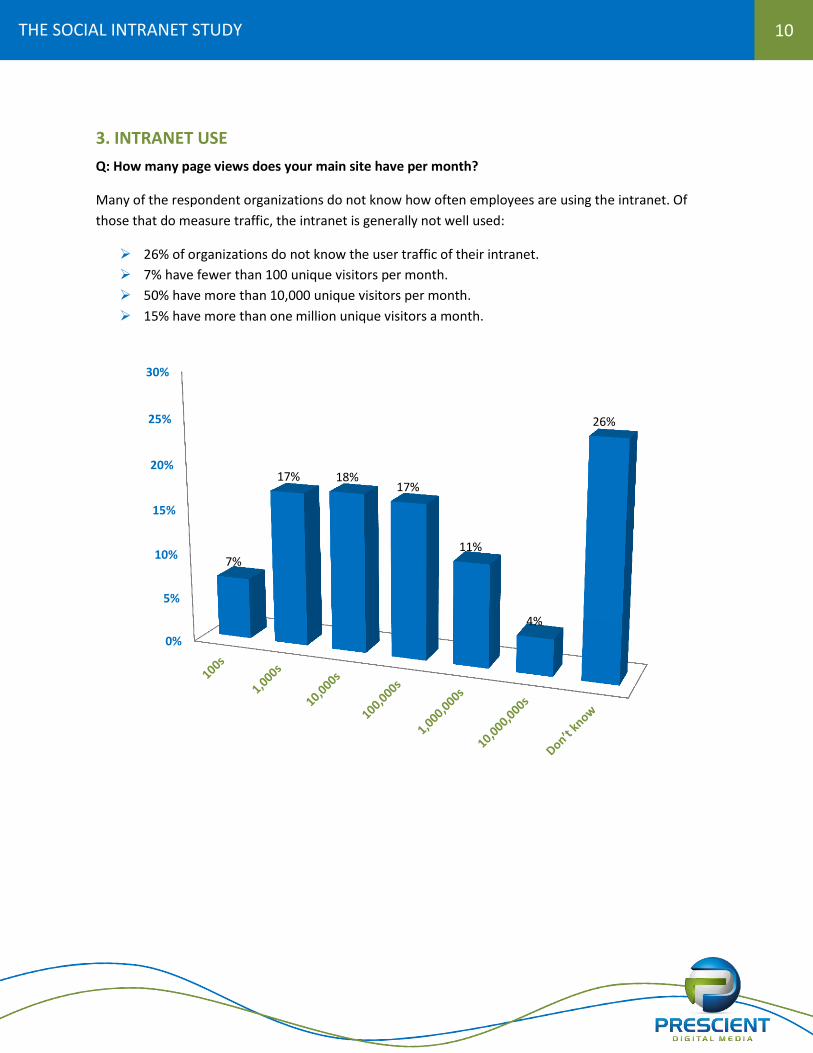
3. INTRANET USE
Q: How many page views does your main site have per month?
Many of the respondent organizations do not know how often employees are using the intranet. Of
those that do measure traffic, the intranet is generally not well used:
26% of organizations do not know the user traffic of their intranet.
7% have fewer than 100 unique visitors per month.
50% have more than 10,000 unique visitors per month.
15% have more than one million unique visitors a month.
0%
5%
10%
15%
20%
25%
30%
7%
17% 18% 17%
11%
4%
26%
11
THE SOCIAL INTRANET STUDY
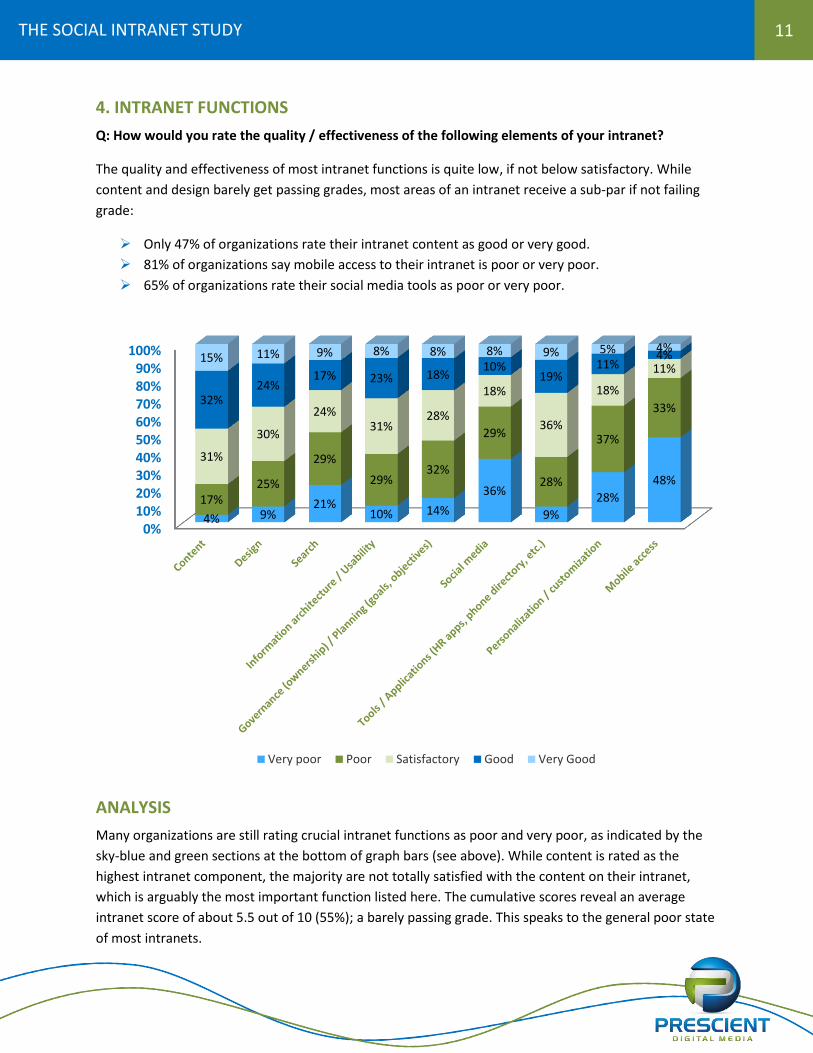
4. INTRANET FUNCTIONS
Q: How would you rate the quality / effectiveness of the following elements of your intranet?
The quality and effectiveness of most intranet functions is quite low, if not below satisfactory. While
content and design barely get passing grades, most areas of an intranet receive a sub-par if not failing
grade:
Only 47% of organizations rate their intranet content as good or very good.
81% of organizations say mobile access to their intranet is poor or very poor.
65% of organizations rate their social media tools as poor or very poor.
ANALYSIS
Many organizations are still rating crucial intranet functions as poor and very poor, as indicated by the
sky-blue and green sections at the bottom of graph bars (see above). While content is rated as the
highest intranet component, the majority are not totally satisfied with the content on their intranet,
which is arguably the most important function listed here. The cumulative scores reveal an average
intranet score of about 5.5 out of 10 (55%); a barely passing grade. This speaks to the general poor state
of most intranets.
0%10%20%30%40%50%60%70%80%90%
100%
4% 9% 21%
10% 14%
36%
9%
28%
48%
17% 25%
29%
29% 32%
29%
28%
37%
33%
31%
30%
24% 31%
28%
18%
36%
18%
11%
32% 24%
17% 23% 18% 10%
19% 11%
4% 15% 11% 9% 8% 8% 8% 9% 5% 4%
Very poor Poor Satisfactory Good Very Good
12
THE SOCIAL INTRANET STUDY
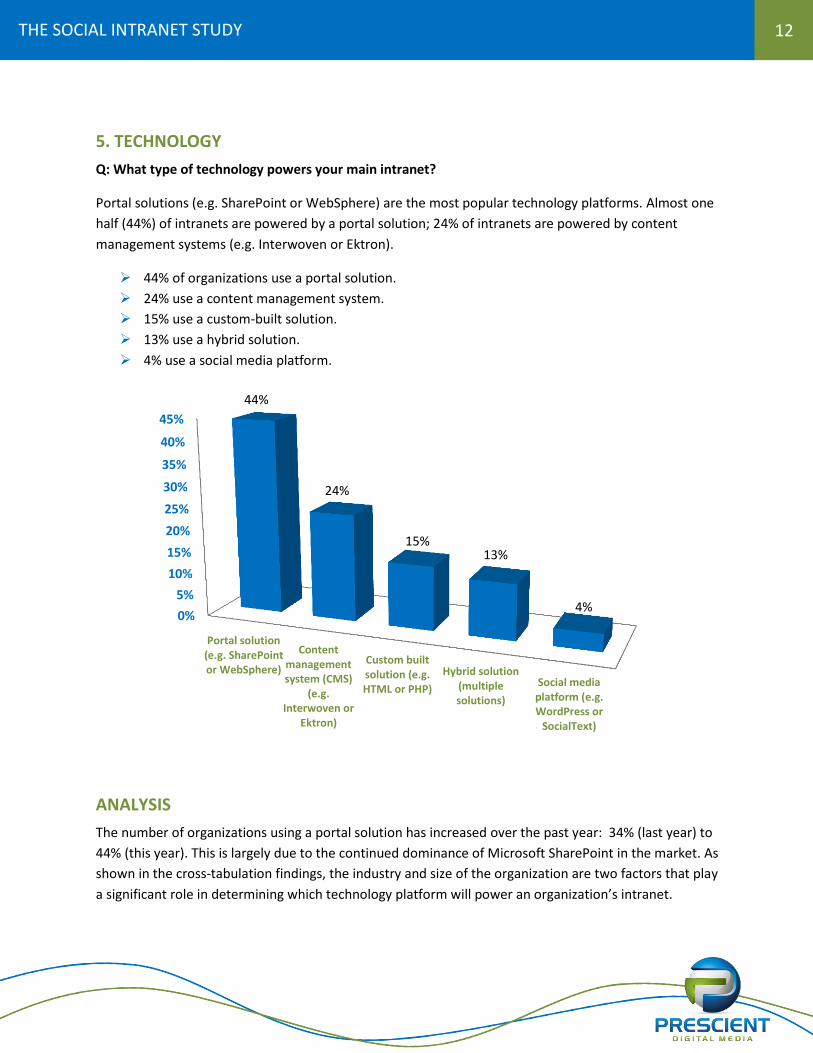
5. TECHNOLOGY
Q: What type of technology powers your main intranet?
Portal solutions (e.g. SharePoint or WebSphere) are the most popular technology platforms. Almost one
half (44%) of intranets are powered by a portal solution; 24% of intranets are powered by content
management systems (e.g. Interwoven or Ektron).
44% of organizations use a portal solution.
24% use a content management system.
15% use a custom-built solution.
13% use a hybrid solution.
4% use a social media platform.
ANALYSIS
The number of organizations using a portal solution has increased over the past year: 34% (last year) to
44% (this year). This is largely due to the continued dominance of Microsoft SharePoint in the market. As
shown in the cross-tabulation findings, the industry and size of the organization are two factors that play
a significant role in determining which technology platform will power an organization’s intranet.
0%
5%
10%
15%
20%
25%
30%
35%
40%
45%
Portal solution(e.g. SharePointor WebSphere)
Contentmanagementsystem (CMS)
(e.g.Interwoven or
Ektron)
Custom builtsolution (e.g.HTML or PHP)
Hybrid solution(multiplesolutions)
Social mediaplatform (e.g.WordPress or
SocialText)
44%
24%
15% 13%
4%
13
THE SOCIAL INTRANET STUDY
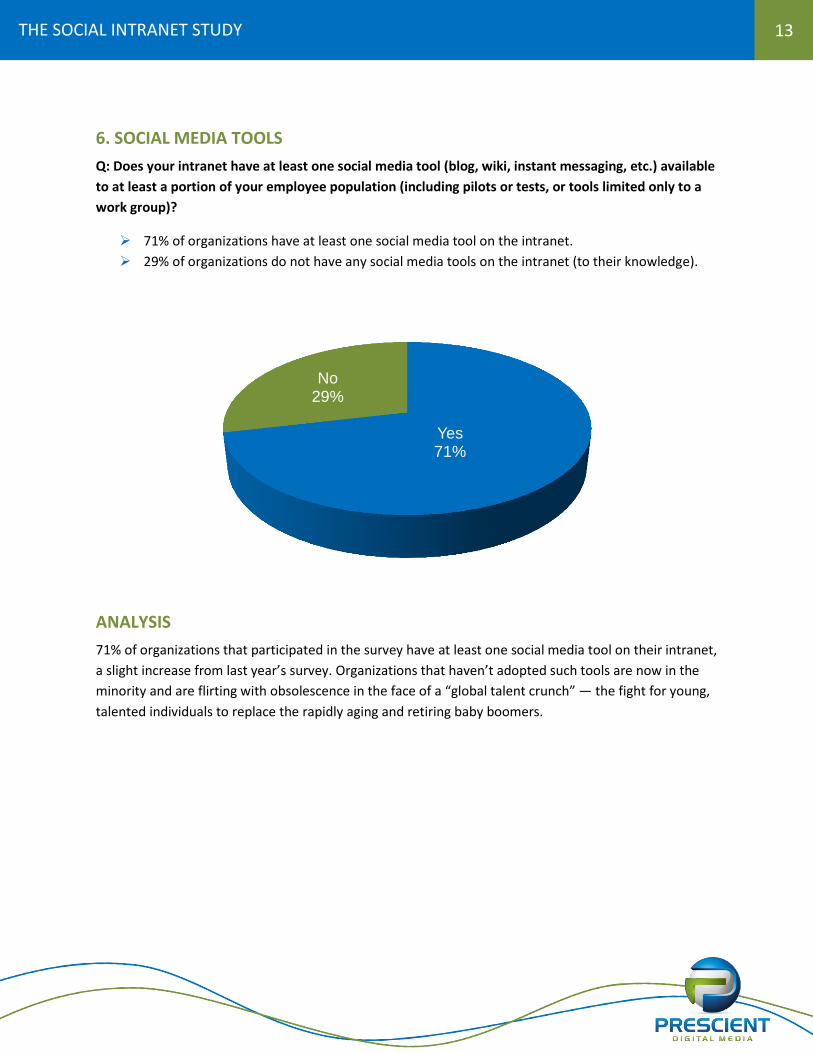
6. SOCIAL MEDIA TOOLS
Q: Does your intranet have at least one social media tool (blog, wiki, instant messaging, etc.) available
to at least a portion of your employee population (including pilots or tests, or tools limited only to a
work group)?
71% of organizations have at least one social media tool on the intranet.
29% of organizations do not have any social media tools on the intranet (to their knowledge).
ANALYSIS
71% of organizations that participated in the survey have at least one social media tool on their intranet,
a slight increase from last year’s survey. Organizations that haven’t adopted such tools are now in the
minority and are flirting with obsolescence in the face of a “global talent crunch” — the fight for young,
talented individuals to replace the rapidly aging and retiring baby boomers.
Yes 71%
No 29%
14
THE SOCIAL INTRANET STUDY
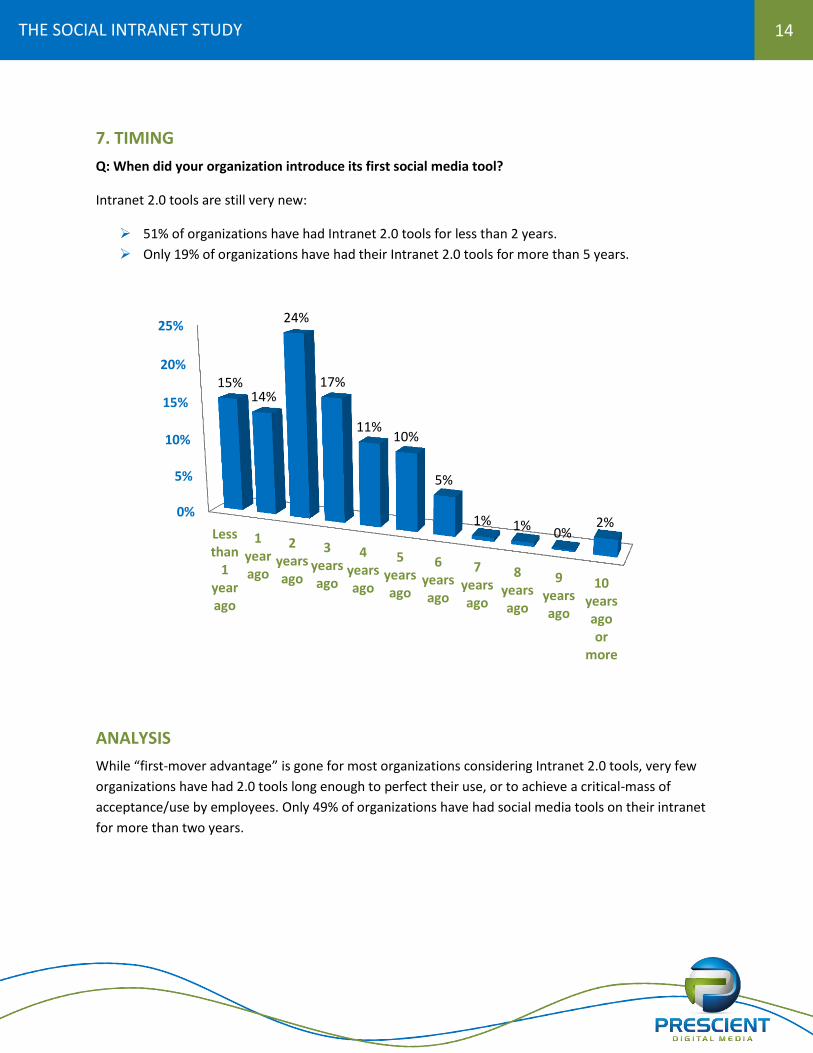
7. TIMING
Q: When did your organization introduce its first social media tool?
Intranet 2.0 tools are still very new:
51% of organizations have had Intranet 2.0 tools for less than 2 years.
Only 19% of organizations have had their Intranet 2.0 tools for more than 5 years.
ANALYSIS
While “first-mover advantage” is gone for most organizations considering Intranet 2.0 tools, very few
organizations have had 2.0 tools long enough to perfect their use, or to achieve a critical-mass of
acceptance/use by employees. Only 49% of organizations have had social media tools on their intranet
for more than two years.
0%
5%
10%
15%
20%
25%
Lessthan
1yearago
1yearago
2yearsago
3yearsago
4yearsago
5yearsago
6yearsago
7yearsago
8yearsago
9yearsago
10yearsagoor
more
15% 14%
24%
17%
11% 10%
5%
1% 1% 0%
2%
15
THE SOCIAL INTRANET STUDY
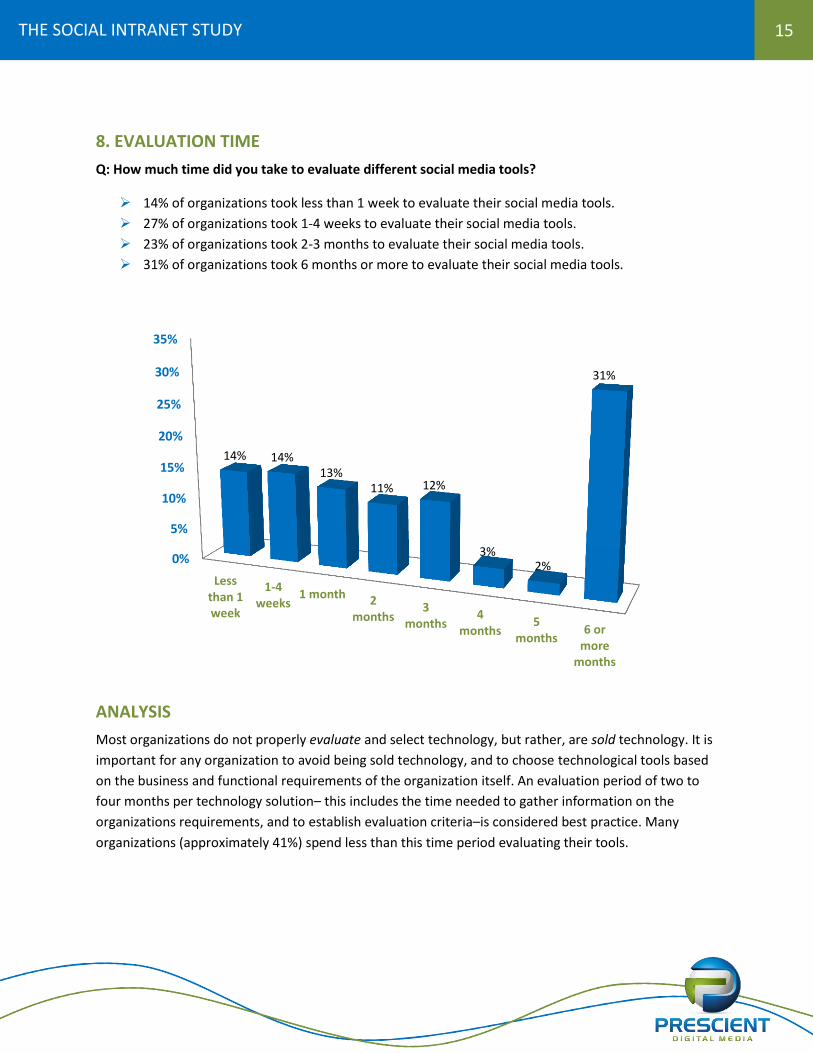
8. EVALUATION TIME
Q: How much time did you take to evaluate different social media tools?
14% of organizations took less than 1 week to evaluate their social media tools.
27% of organizations took 1-4 weeks to evaluate their social media tools.
23% of organizations took 2-3 months to evaluate their social media tools.
31% of organizations took 6 months or more to evaluate their social media tools.
ANALYSIS
Most organizations do not properly evaluate and select technology, but rather, are sold technology. It is
important for any organization to avoid being sold technology, and to choose technological tools based
on the business and functional requirements of the organization itself. An evaluation period of two to
four months per technology solution– this includes the time needed to gather information on the
organizations requirements, and to establish evaluation criteria–is considered best practice. Many
organizations (approximately 41%) spend less than this time period evaluating their tools.
0%
5%
10%
15%
20%
25%
30%
35%
Lessthan 1week
1-4weeks
1 month 2months
3months
4months
5months
6 ormore
months
14% 14% 13%
11% 12%
3% 2%
31%
16
THE SOCIAL INTRANET STUDY
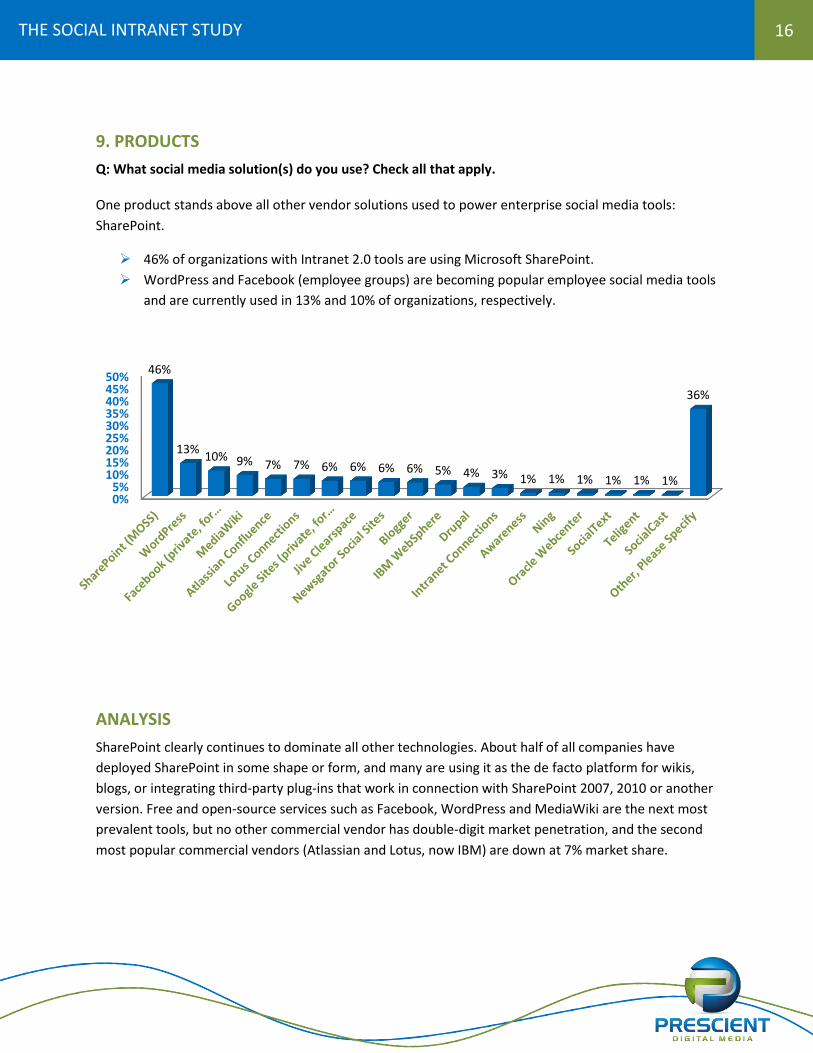
9. PRODUCTS
Q: What social media solution(s) do you use? Check all that apply. One product stands above all other vendor solutions used to power enterprise social media tools:
SharePoint.
46% of organizations with Intranet 2.0 tools are using Microsoft SharePoint.
WordPress and Facebook (employee groups) are becoming popular employee social media tools
and are currently used in 13% and 10% of organizations, respectively.
ANALYSIS
SharePoint clearly continues to dominate all other technologies. About half of all companies have
deployed SharePoint in some shape or form, and many are using it as the de facto platform for wikis,
blogs, or integrating third-party plug-ins that work in connection with SharePoint 2007, 2010 or another
version. Free and open-source services such as Facebook, WordPress and MediaWiki are the next most
prevalent tools, but no other commercial vendor has double-digit market penetration, and the second
most popular commercial vendors (Atlassian and Lotus, now IBM) are down at 7% market share.
0%5%
10%15%20%25%30%35%40%45%50%
46%
13% 10% 9% 7% 7% 6% 6% 6% 6% 5% 4% 3% 1% 1% 1% 1% 1% 1%
36%
17
THE SOCIAL INTRANET STUDY
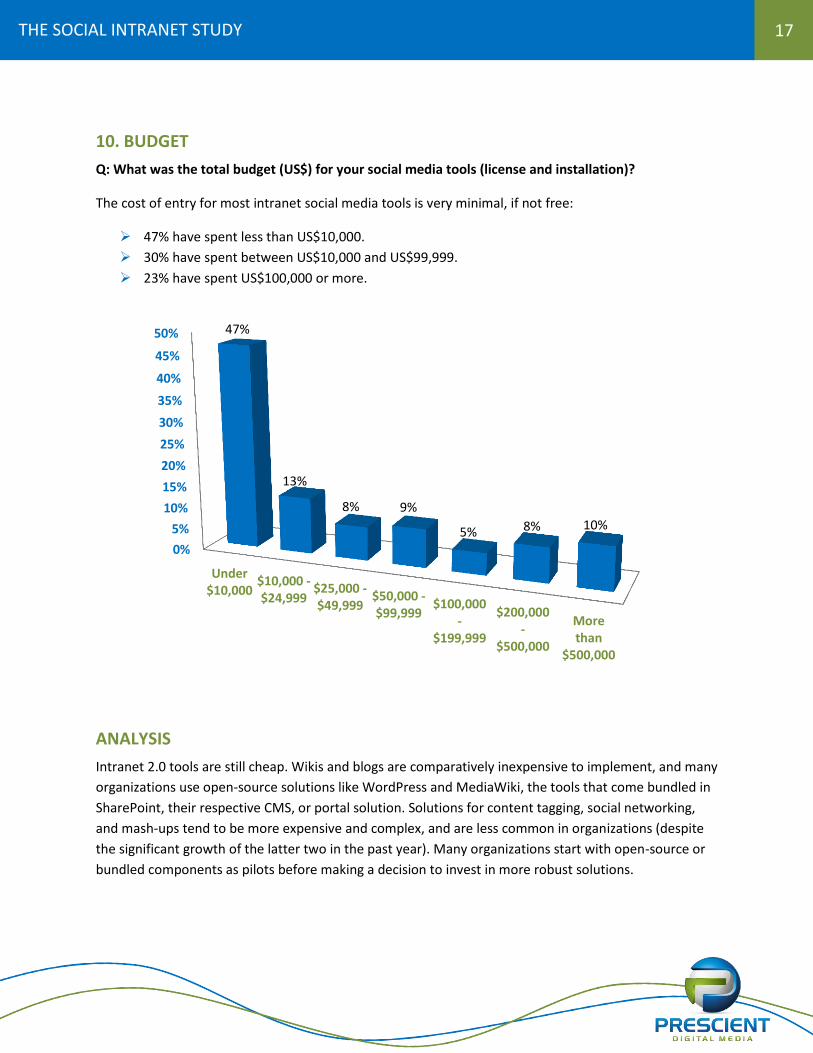
10. BUDGET
Q: What was the total budget (US$) for your social media tools (license and installation)?
The cost of entry for most intranet social media tools is very minimal, if not free:
47% have spent less than US$10,000.
30% have spent between US$10,000 and US$99,999.
23% have spent US$100,000 or more.
ANALYSIS
Intranet 2.0 tools are still cheap. Wikis and blogs are comparatively inexpensive to implement, and many
organizations use open-source solutions like WordPress and MediaWiki, the tools that come bundled in
SharePoint, their respective CMS, or portal solution. Solutions for content tagging, social networking,
and mash-ups tend to be more expensive and complex, and are less common in organizations (despite
the significant growth of the latter two in the past year). Many organizations start with open-source or
bundled components as pilots before making a decision to invest in more robust solutions.
0%
5%
10%
15%
20%
25%
30%
35%
40%
45%
50%
Under$10,000
$10,000 -$24,999
$25,000 -$49,999
$50,000 -$99,999
$100,000-
$199,999
$200,000-
$500,000
Morethan
$500,000
47%
13%
8% 9%
5% 8% 10%
18
THE SOCIAL INTRANET STUDY
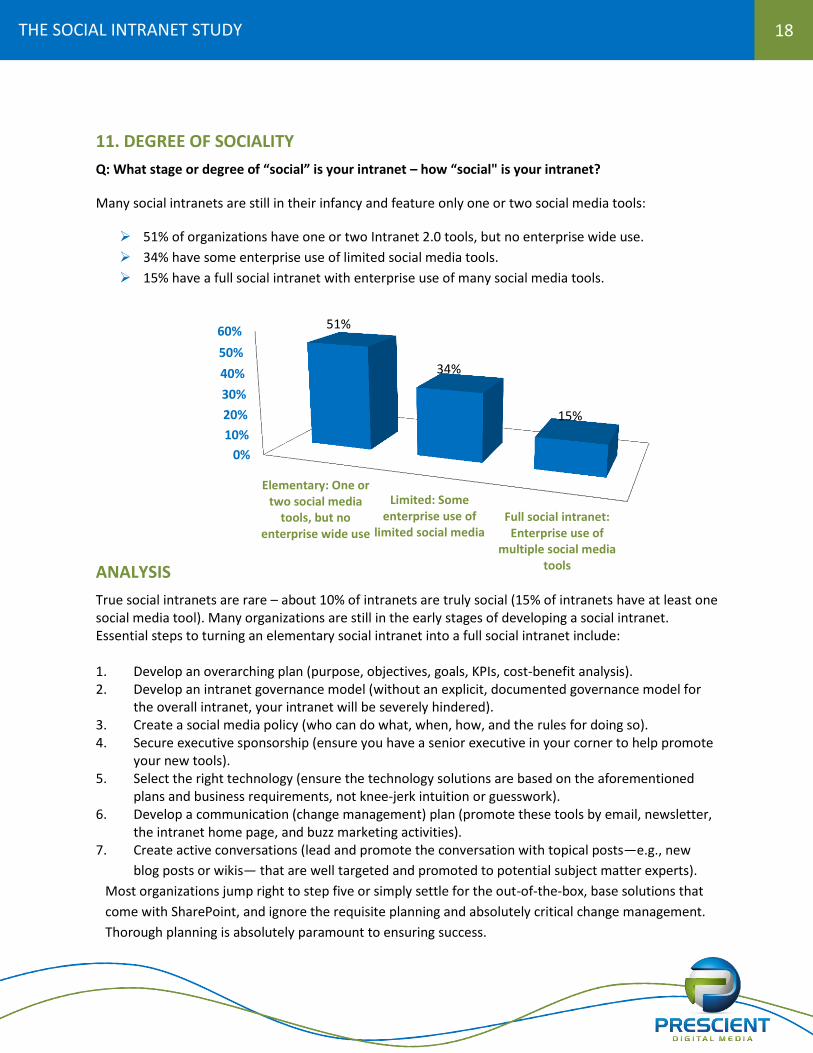
11. DEGREE OF SOCIALITY
Q: What stage or degree of “social” is your intranet – how “social" is your intranet?
Many social intranets are still in their infancy and feature only one or two social media tools:
51% of organizations have one or two Intranet 2.0 tools, but no enterprise wide use.
34% have some enterprise use of limited social media tools.
15% have a full social intranet with enterprise use of many social media tools.
ANALYSIS
True social intranets are rare – about 10% of intranets are truly social (15% of intranets have at least one social media tool). Many organizations are still in the early stages of developing a social intranet. Essential steps to turning an elementary social intranet into a full social intranet include: 1. Develop an overarching plan (purpose, objectives, goals, KPIs, cost-benefit analysis). 2. Develop an intranet governance model (without an explicit, documented governance model for
the overall intranet, your intranet will be severely hindered). 3. Create a social media policy (who can do what, when, how, and the rules for doing so). 4. Secure executive sponsorship (ensure you have a senior executive in your corner to help promote
your new tools). 5. Select the right technology (ensure the technology solutions are based on the aforementioned
plans and business requirements, not knee-jerk intuition or guesswork). 6. Develop a communication (change management) plan (promote these tools by email, newsletter,
the intranet home page, and buzz marketing activities). 7. Create active conversations (lead and promote the conversation with topical posts—e.g., new
blog posts or wikis— that are well targeted and promoted to potential subject matter experts).
Most organizations jump right to step five or simply settle for the out-of-the-box, base solutions that
come with SharePoint, and ignore the requisite planning and absolutely critical change management.
Thorough planning is absolutely paramount to ensuring success.
0%
10%
20%
30%
40%
50%
60%
Elementary: One ortwo social media
tools, but noenterprise wide use
Limited: Someenterprise use of
limited social mediaFull social intranet:
Enterprise use ofmultiple social media
tools
51%
34%
15%
19
THE SOCIAL INTRANET STUDY
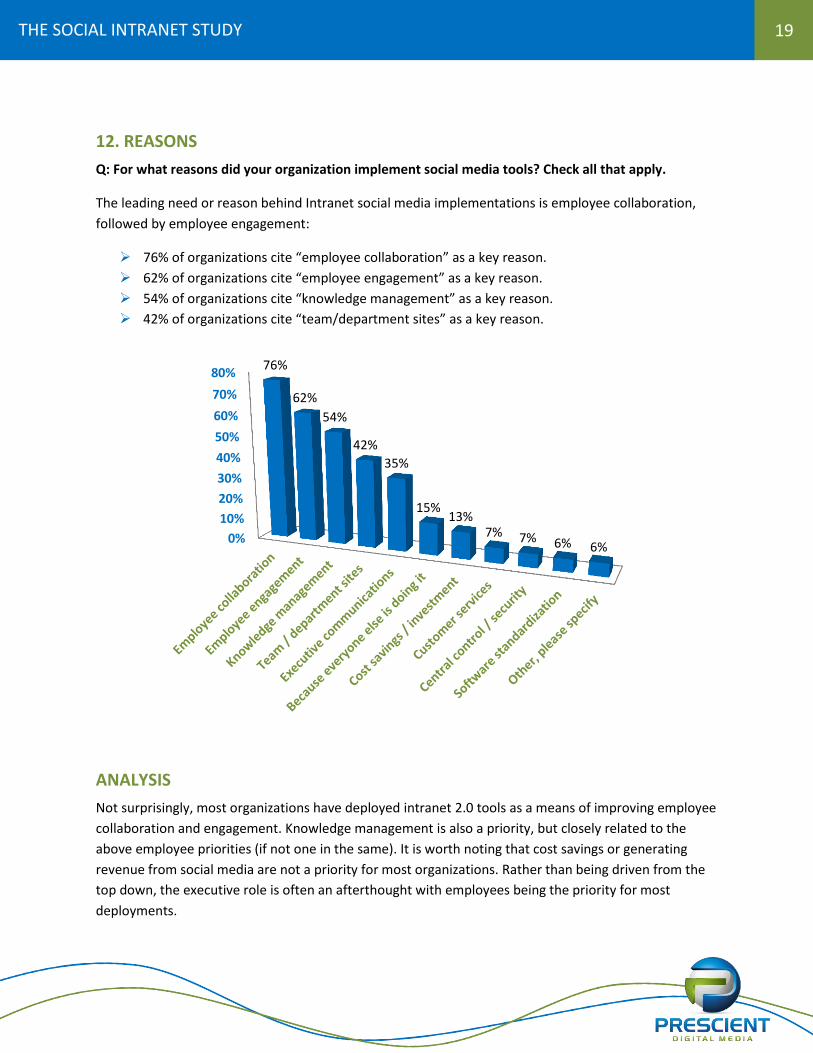
12. REASONS
Q: For what reasons did your organization implement social media tools? Check all that apply.
The leading need or reason behind Intranet social media implementations is employee collaboration,
followed by employee engagement:
76% of organizations cite “employee collaboration” as a key reason.
62% of organizations cite “employee engagement” as a key reason.
54% of organizations cite “knowledge management” as a key reason.
42% of organizations cite “team/department sites” as a key reason.
ANALYSIS
Not surprisingly, most organizations have deployed intranet 2.0 tools as a means of improving employee
collaboration and engagement. Knowledge management is also a priority, but closely related to the
above employee priorities (if not one in the same). It is worth noting that cost savings or generating
revenue from social media are not a priority for most organizations. Rather than being driven from the
top down, the executive role is often an afterthought with employees being the priority for most
deployments.
0%
10%
20%
30%
40%
50%
60%
70%
80%76%
62%
54%
42%
35%
15% 13%
7% 7% 6% 6%
20
THE SOCIAL INTRANET STUDY
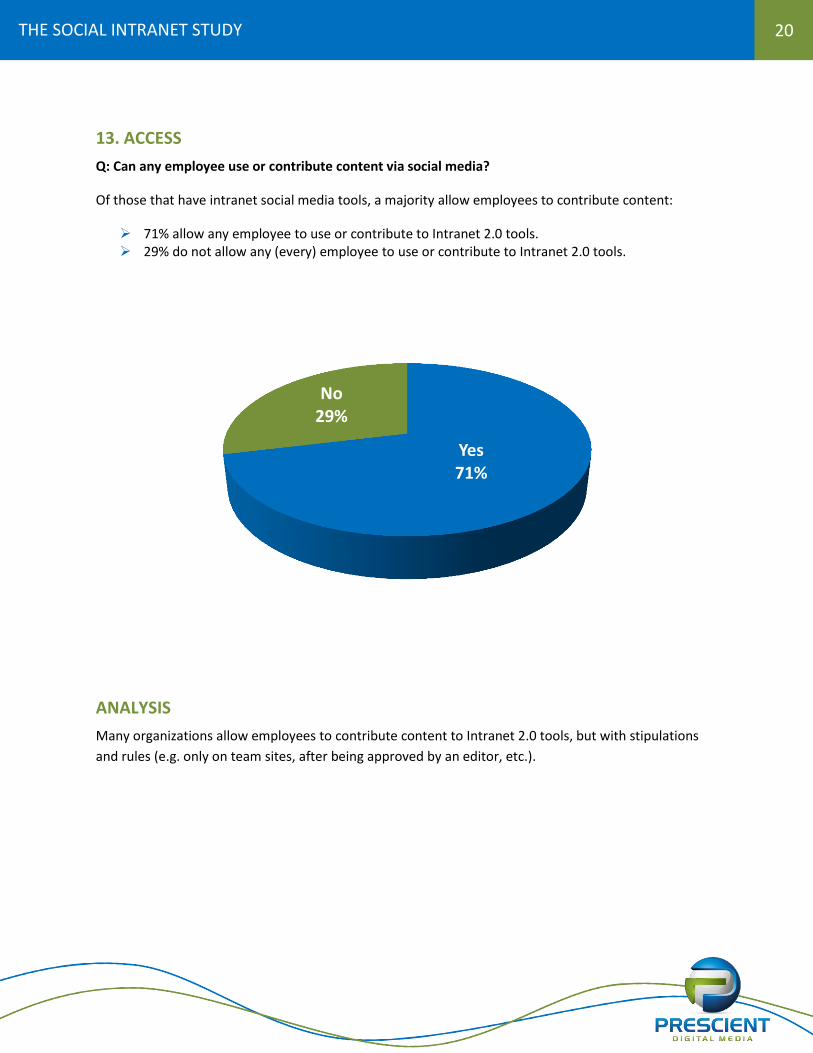
13. ACCESS
Q: Can any employee use or contribute content via social media?
Of those that have intranet social media tools, a majority allow employees to contribute content:
71% allow any employee to use or contribute to Intranet 2.0 tools. 29% do not allow any (every) employee to use or contribute to Intranet 2.0 tools.
ANALYSIS
Many organizations allow employees to contribute content to Intranet 2.0 tools, but with stipulations
and rules (e.g. only on team sites, after being approved by an editor, etc.).
Yes 71%
No 29%
21
THE SOCIAL INTRANET STUDY
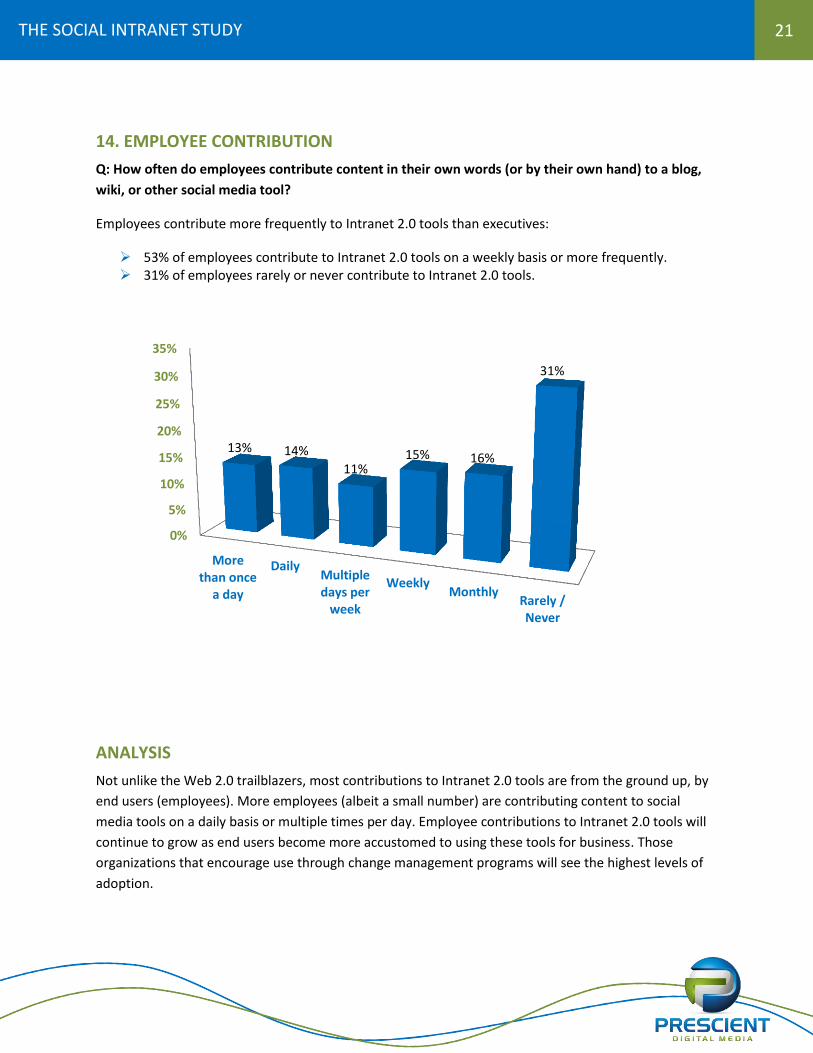
14. EMPLOYEE CONTRIBUTION
Q: How often do employees contribute content in their own words (or by their own hand) to a blog,
wiki, or other social media tool?
Employees contribute more frequently to Intranet 2.0 tools than executives:
53% of employees contribute to Intranet 2.0 tools on a weekly basis or more frequently. 31% of employees rarely or never contribute to Intranet 2.0 tools.
ANALYSIS
Not unlike the Web 2.0 trailblazers, most contributions to Intranet 2.0 tools are from the ground up, by
end users (employees). More employees (albeit a small number) are contributing content to social
media tools on a daily basis or multiple times per day. Employee contributions to Intranet 2.0 tools will
continue to grow as end users become more accustomed to using these tools for business. Those
organizations that encourage use through change management programs will see the highest levels of
adoption.
0%
5%
10%
15%
20%
25%
30%
35%
Morethan once
a day
DailyMultipledays per
week
WeeklyMonthly
Rarely /Never
13% 14%
11% 15% 16%
31%
22
THE SOCIAL INTRANET STUDY
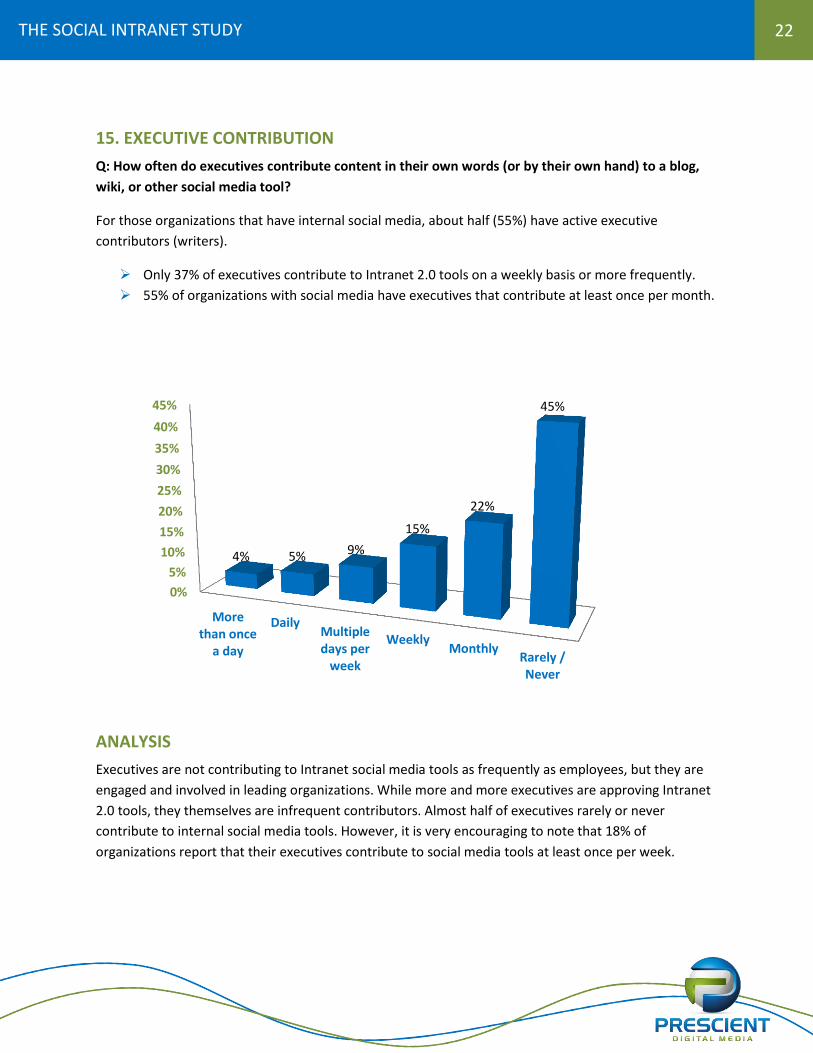
15. EXECUTIVE CONTRIBUTION
Q: How often do executives contribute content in their own words (or by their own hand) to a blog,
wiki, or other social media tool?
For those organizations that have internal social media, about half (55%) have active executive
contributors (writers).
Only 37% of executives contribute to Intranet 2.0 tools on a weekly basis or more frequently.
55% of organizations with social media have executives that contribute at least once per month.
ANALYSIS
Executives are not contributing to Intranet social media tools as frequently as employees, but they are
engaged and involved in leading organizations. While more and more executives are approving Intranet
2.0 tools, they themselves are infrequent contributors. Almost half of executives rarely or never
contribute to internal social media tools. However, it is very encouraging to note that 18% of
organizations report that their executives contribute to social media tools at least once per week.
0%
5%
10%
15%
20%
25%
30%
35%
40%
45%
Morethan once
a day
DailyMultipledays per
week
WeeklyMonthly
Rarely /Never
4% 5% 9%
15%
22%
45%
23
THE SOCIAL INTRANET STUDY
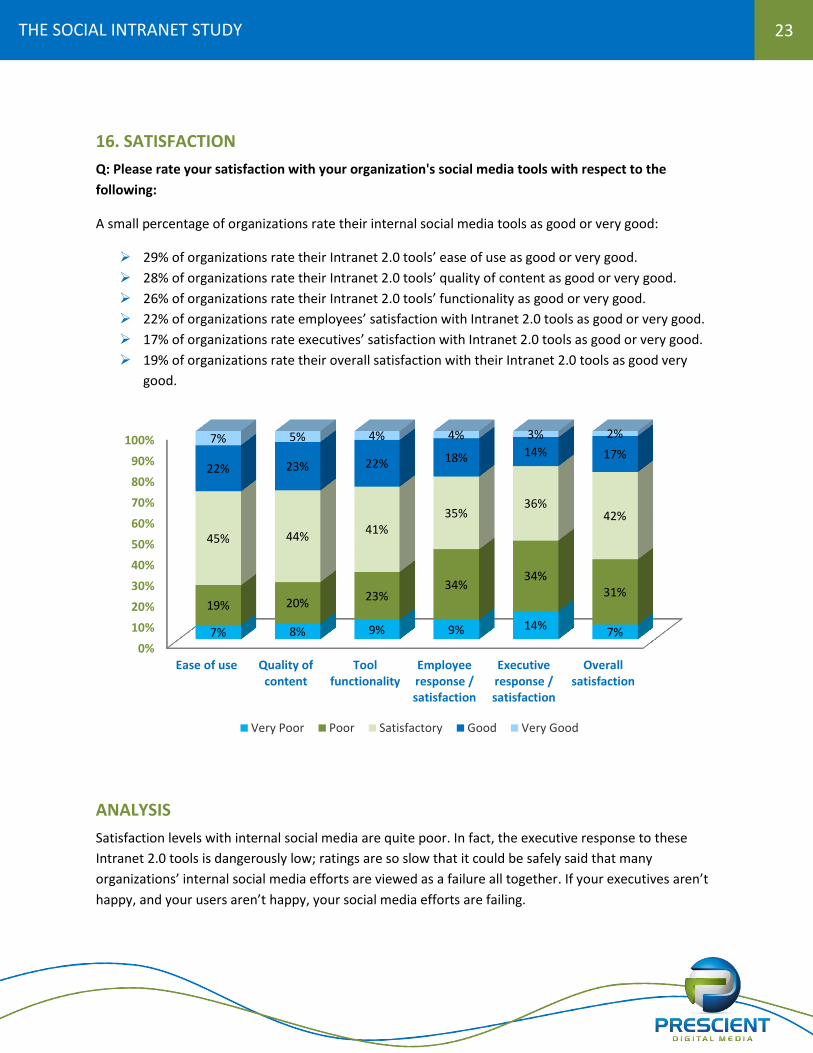
16. SATISFACTION
Q: Please rate your satisfaction with your organization's social media tools with respect to the
following:
A small percentage of organizations rate their internal social media tools as good or very good:
29% of organizations rate their Intranet 2.0 tools’ ease of use as good or very good.
28% of organizations rate their Intranet 2.0 tools’ quality of content as good or very good.
26% of organizations rate their Intranet 2.0 tools’ functionality as good or very good.
22% of organizations rate employees’ satisfaction with Intranet 2.0 tools as good or very good.
17% of organizations rate executives’ satisfaction with Intranet 2.0 tools as good or very good.
19% of organizations rate their overall satisfaction with their Intranet 2.0 tools as good very
good.
ANALYSIS
Satisfaction levels with internal social media are quite poor. In fact, the executive response to these
Intranet 2.0 tools is dangerously low; ratings are so slow that it could be safely said that many
organizations’ internal social media efforts are viewed as a failure all together. If your executives aren’t
happy, and your users aren’t happy, your social media efforts are failing.
0%
10%
20%
30%
40%
50%
60%
70%
80%
90%
100%
Ease of use Quality ofcontent
Toolfunctionality
Employeeresponse /satisfaction
Executiveresponse /satisfaction
Overallsatisfaction
7% 8% 9% 9% 14% 7%
19% 20% 23%
34% 34%
31%
45% 44% 41%
35% 36%
42%
22% 23% 22% 18% 14% 17% 7% 5% 4% 4% 3% 2%
Very Poor Poor Satisfactory Good Very Good
24
THE SOCIAL INTRANET STUDY
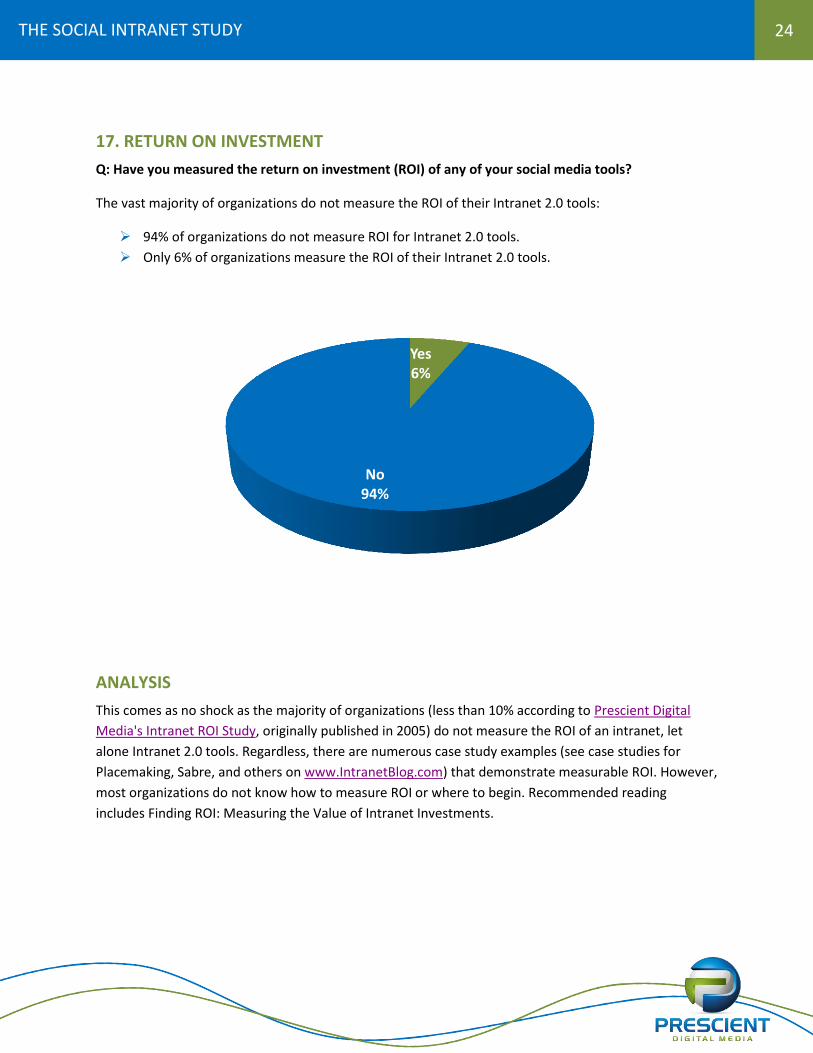
17. RETURN ON INVESTMENT
Q: Have you measured the return on investment (ROI) of any of your social media tools?
The vast majority of organizations do not measure the ROI of their Intranet 2.0 tools:
94% of organizations do not measure ROI for Intranet 2.0 tools.
Only 6% of organizations measure the ROI of their Intranet 2.0 tools.
ANALYSIS
This comes as no shock as the majority of organizations (less than 10% according to Prescient Digital
Media's Intranet ROI Study, originally published in 2005) do not measure the ROI of an intranet, let
alone Intranet 2.0 tools. Regardless, there are numerous case study examples (see case studies for
Placemaking, Sabre, and others on www.IntranetBlog.com) that demonstrate measurable ROI. However,
most organizations do not know how to measure ROI or where to begin. Recommended reading
includes Finding ROI: Measuring the Value of Intranet Investments.
Yes 6%
No 94%
25
THE SOCIAL INTRANET STUDY
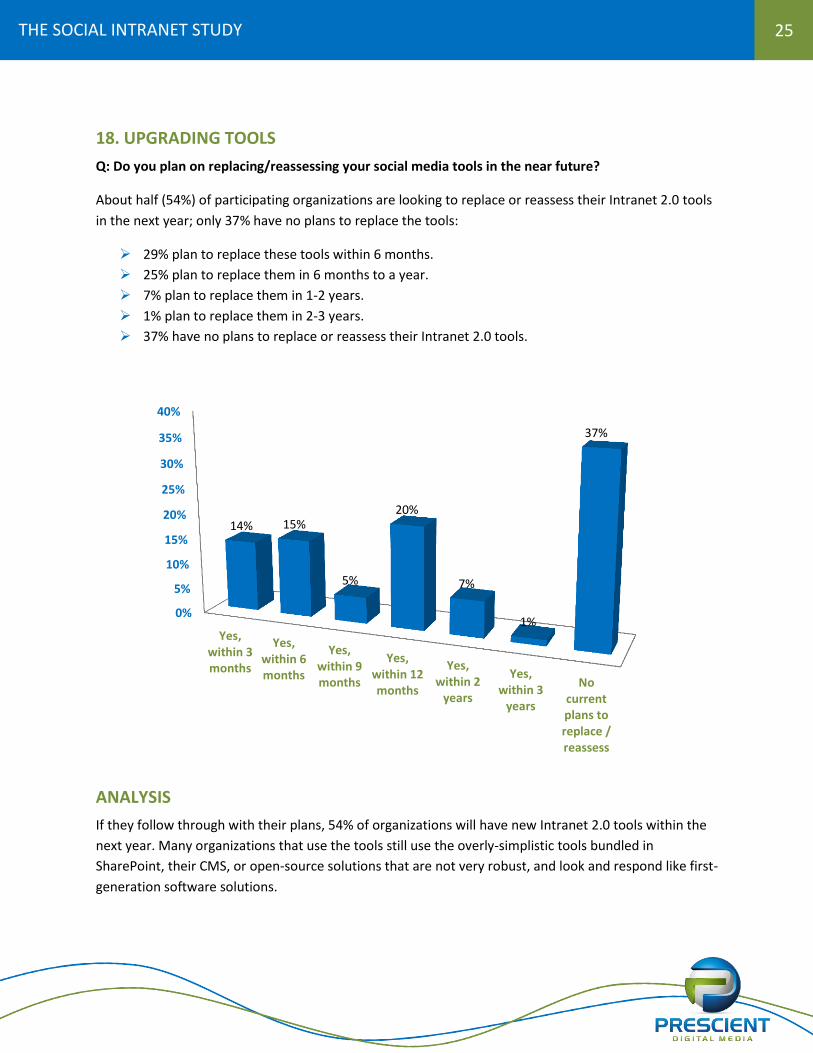
18. UPGRADING TOOLS
Q: Do you plan on replacing/reassessing your social media tools in the near future?
About half (54%) of participating organizations are looking to replace or reassess their Intranet 2.0 tools
in the next year; only 37% have no plans to replace the tools:
29% plan to replace these tools within 6 months.
25% plan to replace them in 6 months to a year.
7% plan to replace them in 1-2 years.
1% plan to replace them in 2-3 years.
37% have no plans to replace or reassess their Intranet 2.0 tools.
ANALYSIS
If they follow through with their plans, 54% of organizations will have new Intranet 2.0 tools within the
next year. Many organizations that use the tools still use the overly-simplistic tools bundled in
SharePoint, their CMS, or open-source solutions that are not very robust, and look and respond like first-
generation software solutions.
0%
5%
10%
15%
20%
25%
30%
35%
40%
Yes,within 3months
Yes,within 6months
Yes,within 9months
Yes,within 12months
Yes,within 2
years
Yes,within 3
years
Nocurrentplans toreplace /reassess
14% 15%
5%
20%
7%
1%
37%
26
THE SOCIAL INTRANET STUDY
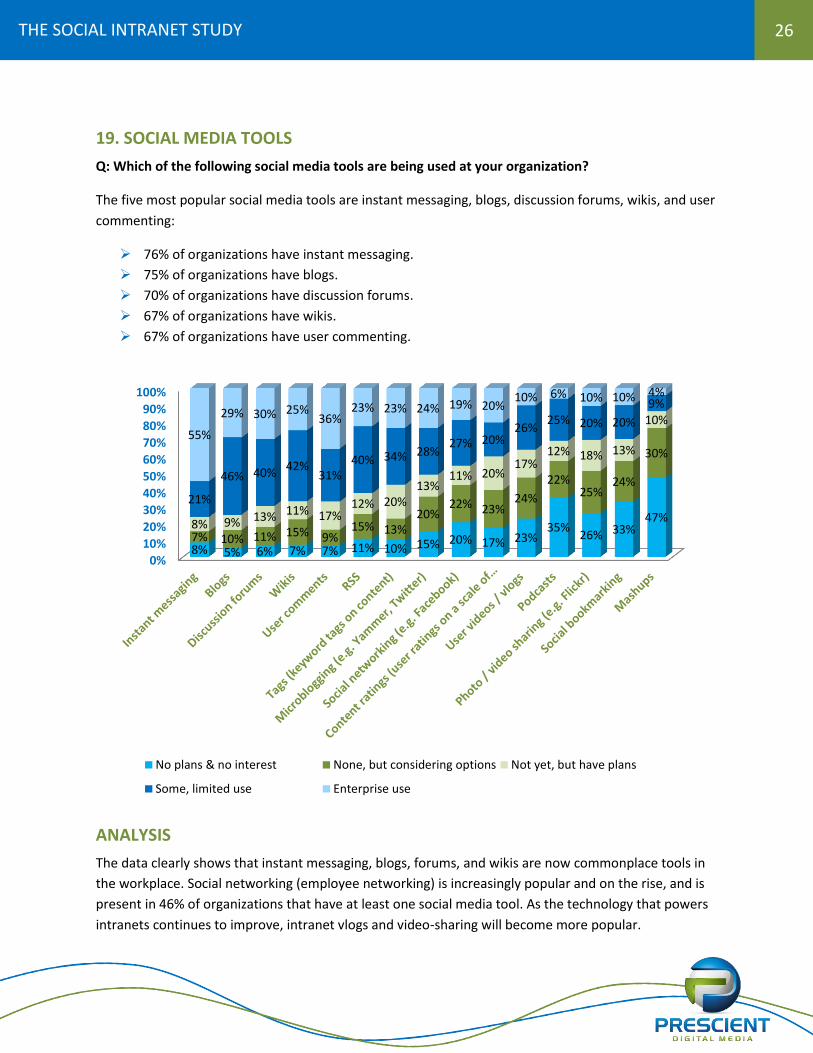
19. SOCIAL MEDIA TOOLS
Q: Which of the following social media tools are being used at your organization?
The five most popular social media tools are instant messaging, blogs, discussion forums, wikis, and user
commenting:
76% of organizations have instant messaging.
75% of organizations have blogs.
70% of organizations have discussion forums.
67% of organizations have wikis.
67% of organizations have user commenting.
ANALYSIS
The data clearly shows that instant messaging, blogs, forums, and wikis are now commonplace tools in
the workplace. Social networking (employee networking) is increasingly popular and on the rise, and is
present in 46% of organizations that have at least one social media tool. As the technology that powers
intranets continues to improve, intranet vlogs and video-sharing will become more popular.
0%
10%
20%
30%
40%
50%
60%
70%
80%
90%
100%
8% 5% 6% 7% 7% 11% 10% 15% 20% 17% 23% 35%
26% 33% 47%
7% 10% 11% 15% 9% 15% 13%
20% 22% 23%
24%
22% 25%
24%
30%
8% 9% 13% 11% 17% 12% 20%
13% 11% 20%
17% 12% 18% 13%
10%
21%
46% 40% 42%
31% 40% 34% 28%
27% 20% 26%
25% 20% 20%
9%
55%
29% 30% 25% 36%
23% 23% 24% 19% 20% 10% 6% 10% 10% 4%
No plans & no interest None, but considering options Not yet, but have plans
Some, limited use Enterprise use
27
THE SOCIAL INTRANET STUDY
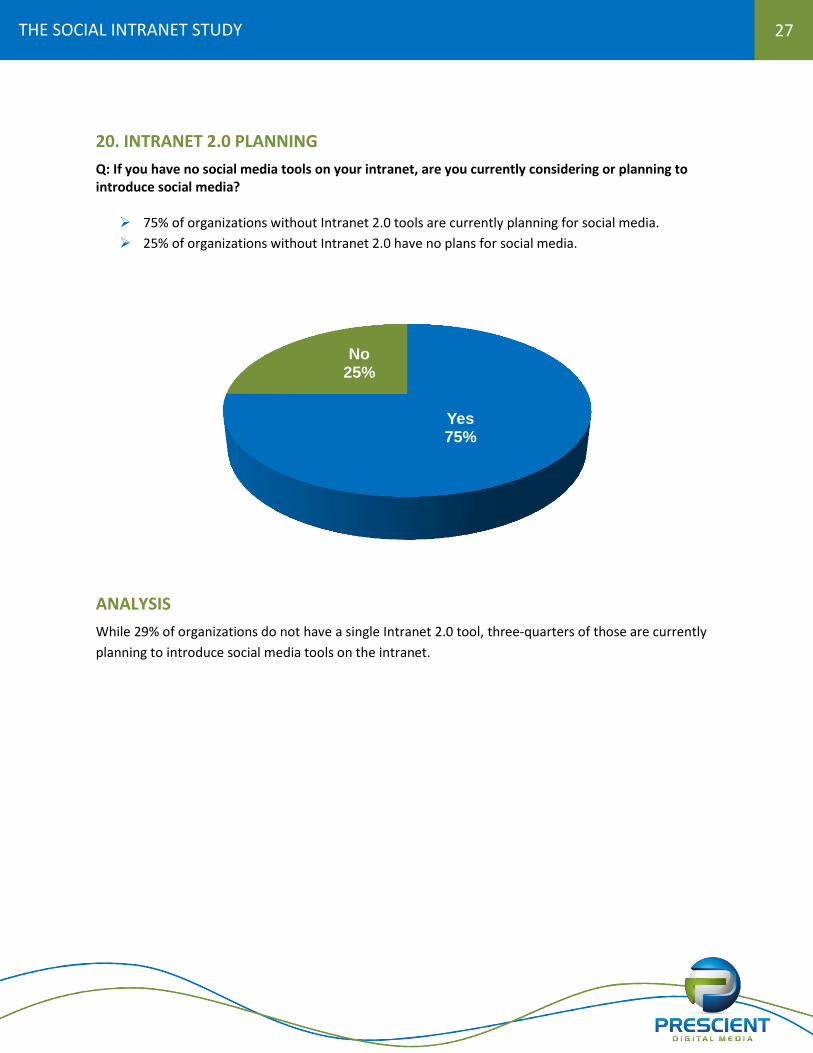
20. INTRANET 2.0 PLANNING
Q: If you have no social media tools on your intranet, are you currently considering or planning to introduce social media?
75% of organizations without Intranet 2.0 tools are currently planning for social media.
25% of organizations without Intranet 2.0 have no plans for social media.
ANALYSIS
While 29% of organizations do not have a single Intranet 2.0 tool, three-quarters of those are currently
planning to introduce social media tools on the intranet.
Yes 75%
No 25%
28
THE SOCIAL INTRANET STUDY
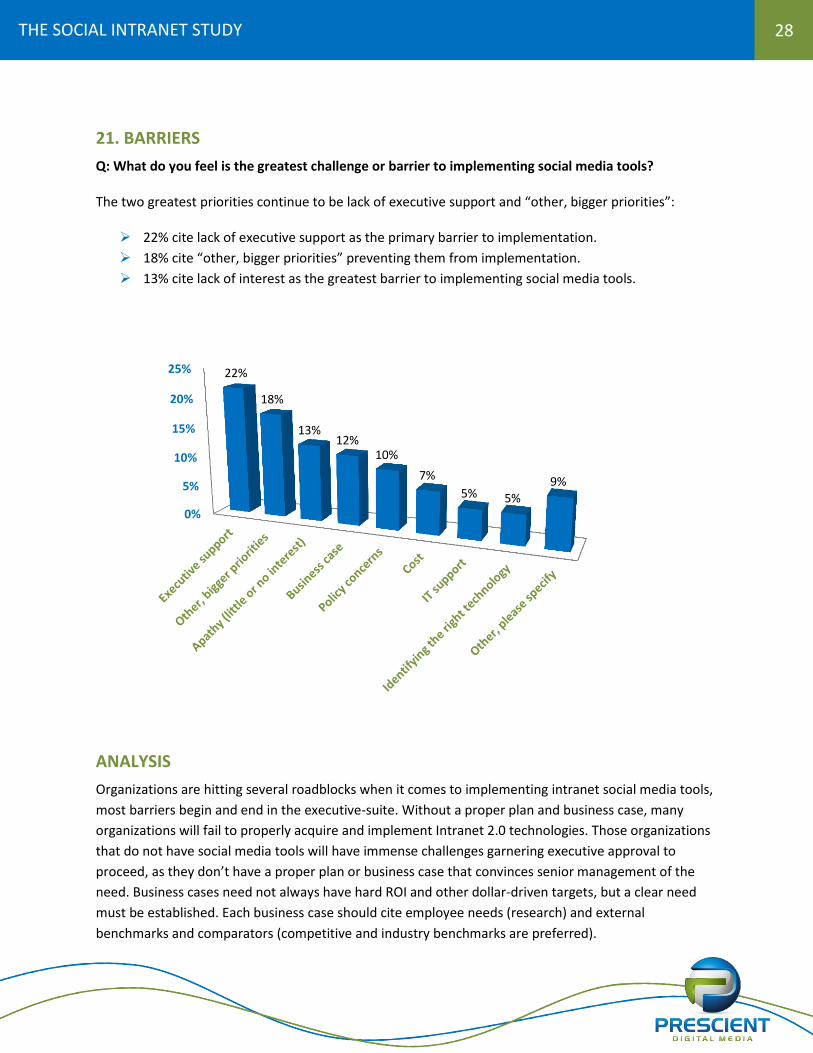
21. BARRIERS
Q: What do you feel is the greatest challenge or barrier to implementing social media tools? The two greatest priorities continue to be lack of executive support and “other, bigger priorities”:
22% cite lack of executive support as the primary barrier to implementation.
18% cite “other, bigger priorities” preventing them from implementation.
13% cite lack of interest as the greatest barrier to implementing social media tools.
ANALYSIS
Organizations are hitting several roadblocks when it comes to implementing intranet social media tools,
most barriers begin and end in the executive-suite. Without a proper plan and business case, many
organizations will fail to properly acquire and implement Intranet 2.0 technologies. Those organizations
that do not have social media tools will have immense challenges garnering executive approval to
proceed, as they don’t have a proper plan or business case that convinces senior management of the
need. Business cases need not always have hard ROI and other dollar-driven targets, but a clear need
must be established. Each business case should cite employee needs (research) and external
benchmarks and comparators (competitive and industry benchmarks are preferred).
0%
5%
10%
15%
20%
25% 22%
18%
13% 12%
10%
7%
5% 5%
9%
29
THE SOCIAL INTRANET STUDY
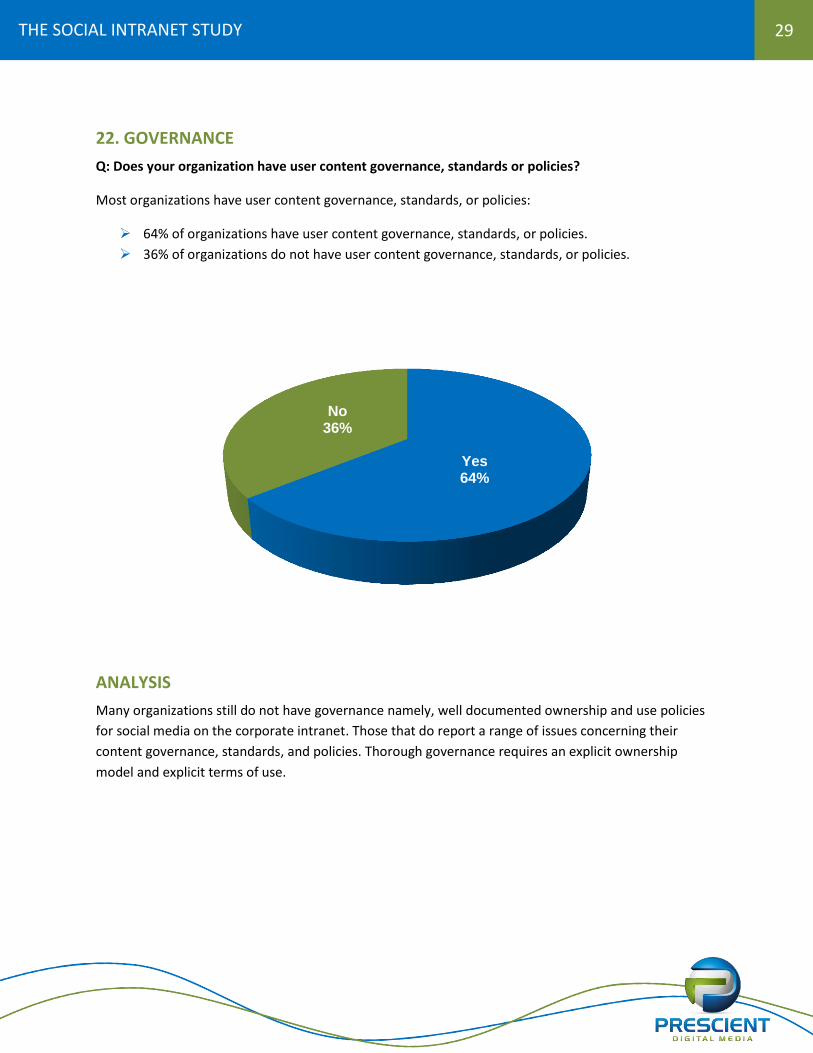
22. GOVERNANCE
Q: Does your organization have user content governance, standards or policies?
Most organizations have user content governance, standards, or policies:
64% of organizations have user content governance, standards, or policies.
36% of organizations do not have user content governance, standards, or policies.
ANALYSIS
Many organizations still do not have governance namely, well documented ownership and use policies
for social media on the corporate intranet. Those that do report a range of issues concerning their
content governance, standards, and policies. Thorough governance requires an explicit ownership
model and explicit terms of use.
Yes 64%
No 36%
30
THE SOCIAL INTRANET STUDY
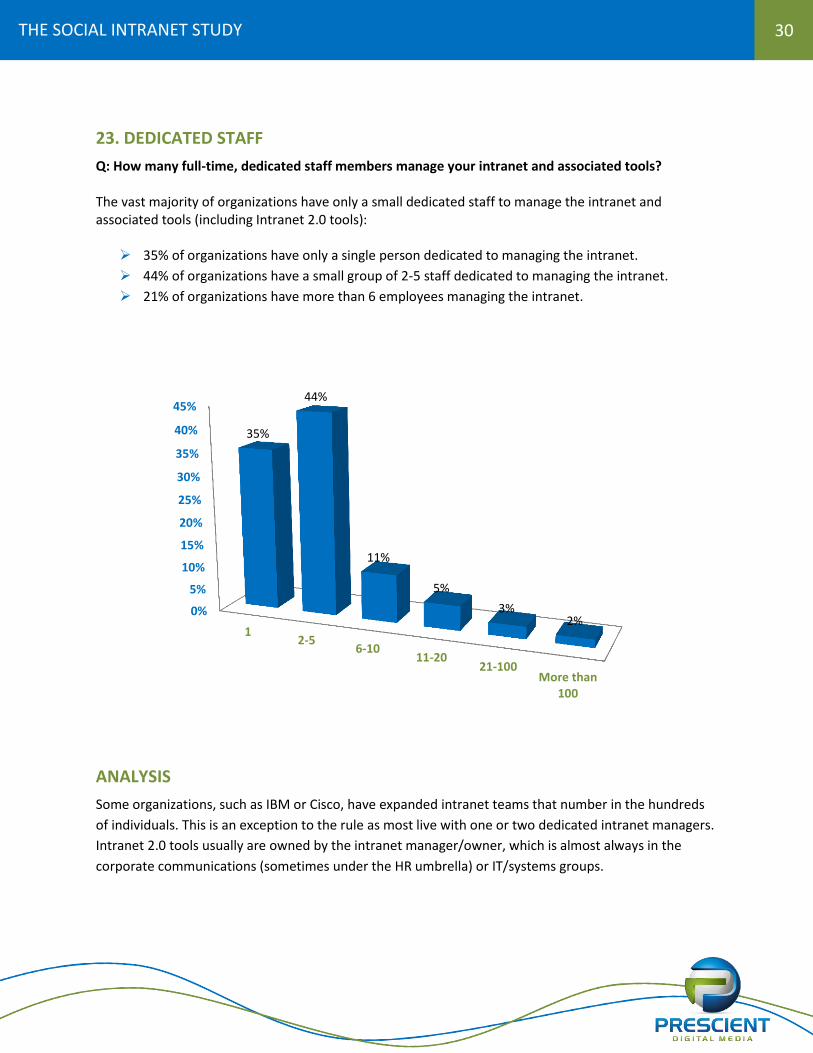
23. DEDICATED STAFF
Q: How many full-time, dedicated staff members manage your intranet and associated tools? The vast majority of organizations have only a small dedicated staff to manage the intranet and associated tools (including Intranet 2.0 tools):
35% of organizations have only a single person dedicated to managing the intranet.
44% of organizations have a small group of 2-5 staff dedicated to managing the intranet.
21% of organizations have more than 6 employees managing the intranet.
ANALYSIS
Some organizations, such as IBM or Cisco, have expanded intranet teams that number in the hundreds
of individuals. This is an exception to the rule as most live with one or two dedicated intranet managers.
Intranet 2.0 tools usually are owned by the intranet manager/owner, which is almost always in the
corporate communications (sometimes under the HR umbrella) or IT/systems groups.
0%
5%
10%
15%
20%
25%
30%
35%
40%
45%
12-5
6-1011-20
21-100More than
100
35%
44%
11%
5%
3% 2%
31
THE SOCIAL INTRANET STUDY
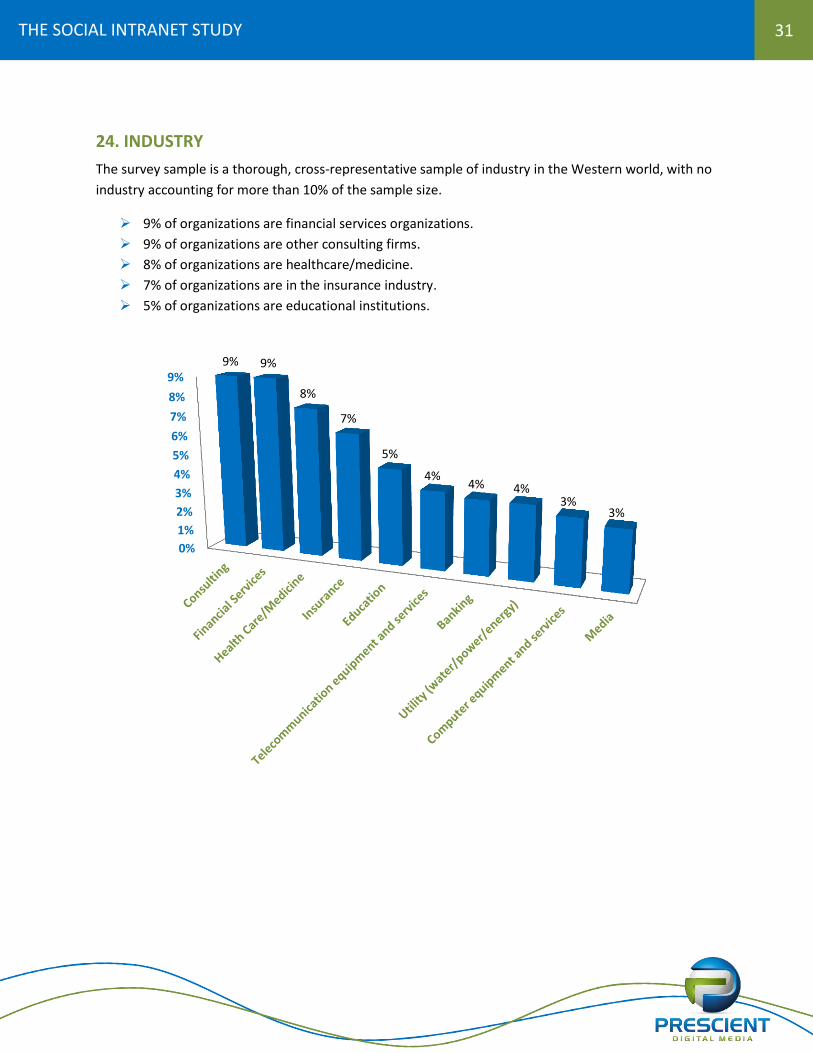
24. INDUSTRY
The survey sample is a thorough, cross-representative sample of industry in the Western world, with no
industry accounting for more than 10% of the sample size.
9% of organizations are financial services organizations.
9% of organizations are other consulting firms.
8% of organizations are healthcare/medicine.
7% of organizations are in the insurance industry.
5% of organizations are educational institutions.
0%
1%
2%
3%
4%
5%
6%
7%
8%
9%9% 9%
8%
7%
5%
4% 4% 4%
3% 3%
32
THE SOCIAL INTRANET STUDY
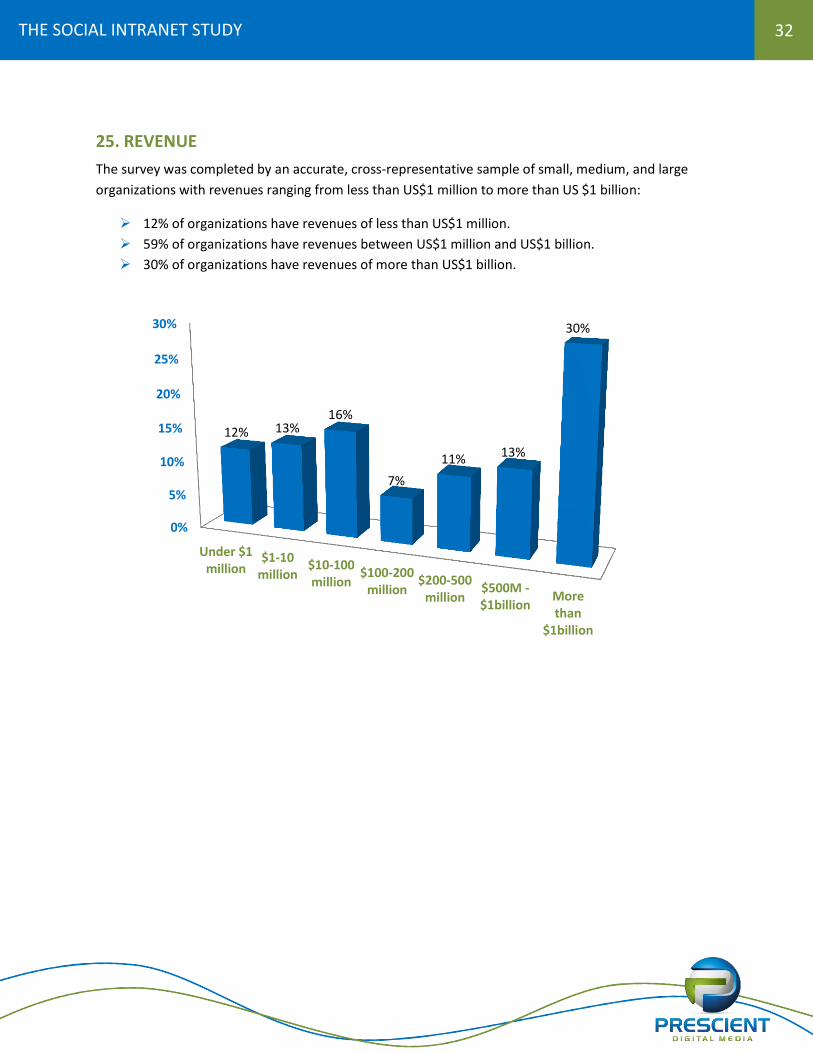
25. REVENUE
The survey was completed by an accurate, cross-representative sample of small, medium, and large
organizations with revenues ranging from less than US$1 million to more than US $1 billion:
12% of organizations have revenues of less than US$1 million.
59% of organizations have revenues between US$1 million and US$1 billion.
30% of organizations have revenues of more than US$1 billion.
0%
5%
10%
15%
20%
25%
30%
Under $1million
$1-10million
$10-100million
$100-200million
$200-500million
$500M -$1billion
Morethan
$1billion
12% 13% 16%
7%
11% 13%
30%
33
THE SOCIAL INTRANET STUDY
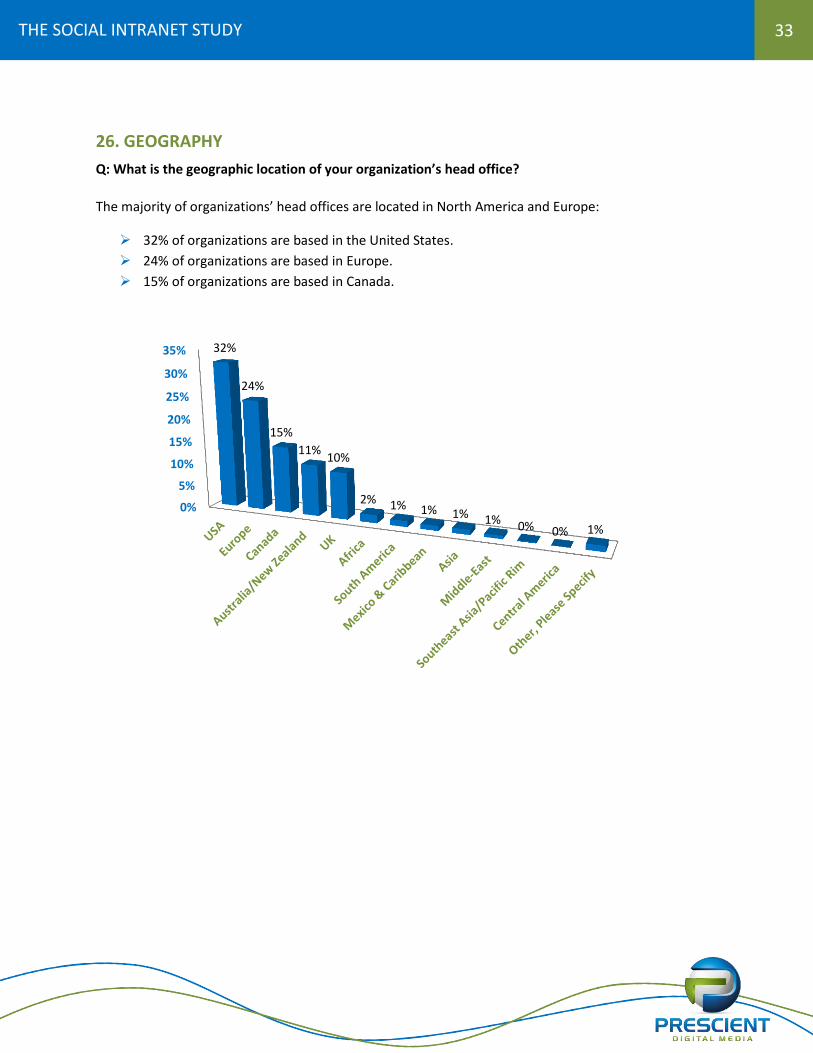
26. GEOGRAPHY
Q: What is the geographic location of your organization’s head office?
The majority of organizations’ head offices are located in North America and Europe:
32% of organizations are based in the United States.
24% of organizations are based in Europe.
15% of organizations are based in Canada.
0%
5%
10%
15%
20%
25%
30%
35% 32%
24%
15%
11% 10%
2% 1% 1% 1% 1% 0% 0% 1%
34
THE SOCIAL INTRANET STUDY
Cross-Tabulation Results by Industry and Size
Cross-tabulation results reveal the distribution of two or more variables (e.g. results by organization size
or industry). Cross-tabulated results are presented for a number of variables, but for the sake of brevity,
only a few variables have been analyzed in this section. More in-depth cross-tab results by geography,
revenue, and other variables are available by request (contact Prescient Digital Media at 416.926.8800
or via the website at www.PrescientDigital.com).
The 10 most represented industries in the survey are:
Consulting
Financial Services
Health Care/Medicine
Insurance
Education
Telecommunication equipment and services
Banking
Utility (water/power/energy)
Computer equipment and services
Media
35
THE SOCIAL INTRANET STUDY
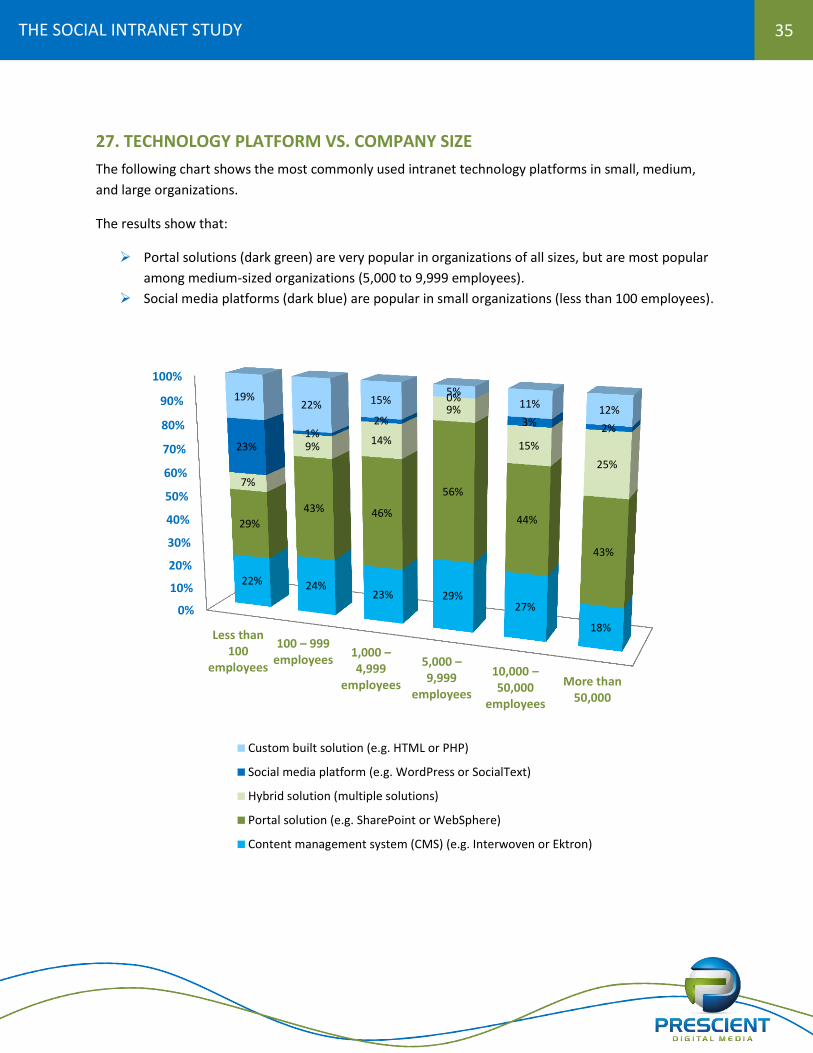
27. TECHNOLOGY PLATFORM VS. COMPANY SIZE
The following chart shows the most commonly used intranet technology platforms in small, medium,
and large organizations.
The results show that:
Portal solutions (dark green) are very popular in organizations of all sizes, but are most popular
among medium-sized organizations (5,000 to 9,999 employees).
Social media platforms (dark blue) are popular in small organizations (less than 100 employees).
0%
10%
20%
30%
40%
50%
60%
70%
80%
90%
100%
Less than100
employees
100 – 999 employees
1,000 – 4,999
employees
5,000 – 9,999
employees
10,000 – 50,000
employees
More than50,000
22% 24% 23% 29%
27%
18%
29%
43% 46%
56%
44%
43%
7%
9% 14%
9%
15%
25%
23% 1%
2%
0%
3% 2%
19% 22% 15%
5% 11%
12%
Custom built solution (e.g. HTML or PHP)
Social media platform (e.g. WordPress or SocialText)
Hybrid solution (multiple solutions)
Portal solution (e.g. SharePoint or WebSphere)
Content management system (CMS) (e.g. Interwoven or Ektron)
36
THE SOCIAL INTRANET STUDY
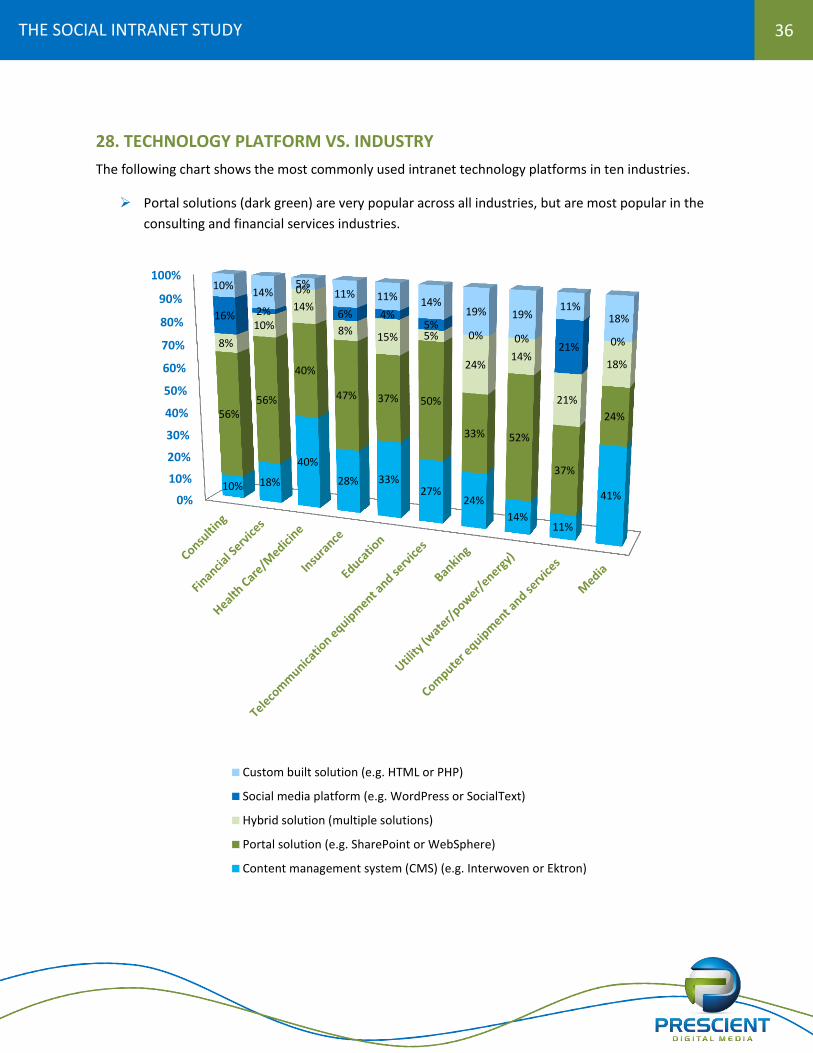
28. TECHNOLOGY PLATFORM VS. INDUSTRY
The following chart shows the most commonly used intranet technology platforms in ten industries.
Portal solutions (dark green) are very popular across all industries, but are most popular in the
consulting and financial services industries.
0%
10%
20%
30%
40%
50%
60%
70%
80%
90%
100%
10% 18%
40%
28% 33% 27%
24%
14% 11%
41%
56% 56%
40%
47% 37% 50%
33% 52%
37%
24%
8%
10%
14%
8% 15% 5%
24% 14%
21%
18%
16% 2%
0%
6% 4% 5%
0% 0% 21% 0%
10% 14%
5% 11% 11% 14%
19% 19% 11%
18%
Custom built solution (e.g. HTML or PHP)
Social media platform (e.g. WordPress or SocialText)
Hybrid solution (multiple solutions)
Portal solution (e.g. SharePoint or WebSphere)
Content management system (CMS) (e.g. Interwoven or Ektron)
37
THE SOCIAL INTRANET STUDY
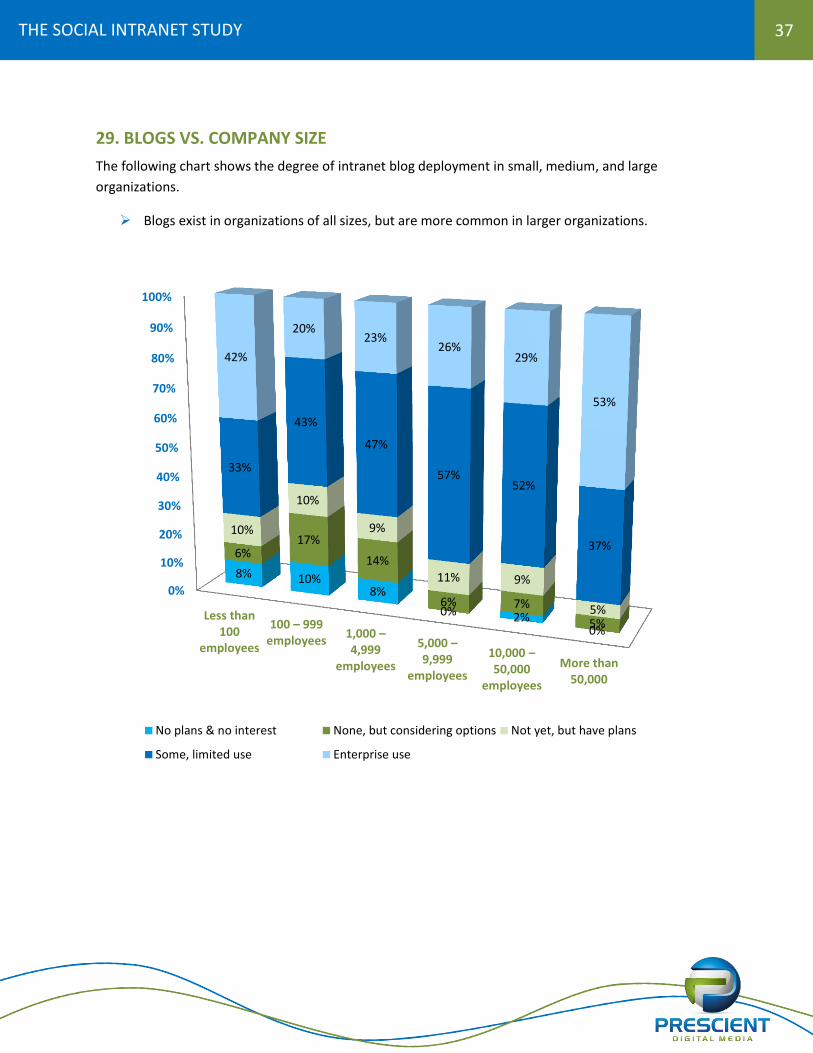
29. BLOGS VS. COMPANY SIZE
The following chart shows the degree of intranet blog deployment in small, medium, and large
organizations.
Blogs exist in organizations of all sizes, but are more common in larger organizations.
0%
10%
20%
30%
40%
50%
60%
70%
80%
90%
100%
Less than100
employees
100 – 999 employees
1,000 – 4,999
employees
5,000 – 9,999
employees
10,000 – 50,000
employees
More than50,000
8% 10% 8%
0% 2% 0%
6% 17%
14%
6% 7%
5%
10%
10%
9%
11% 9%
5%
33%
43%
47%
57% 52%
37%
42%
20% 23%
26% 29%
53%
No plans & no interest None, but considering options Not yet, but have plans
Some, limited use Enterprise use
38
THE SOCIAL INTRANET STUDY
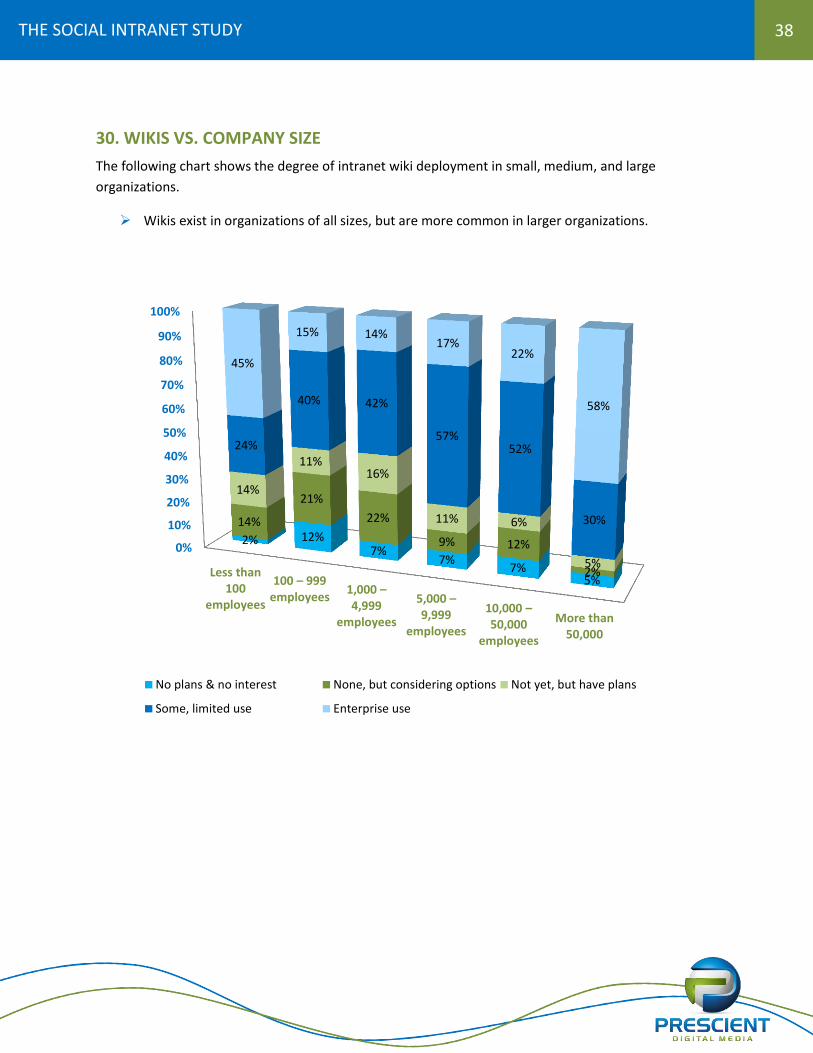
30. WIKIS VS. COMPANY SIZE
The following chart shows the degree of intranet wiki deployment in small, medium, and large
organizations.
Wikis exist in organizations of all sizes, but are more common in larger organizations.
0%
10%
20%
30%
40%
50%
60%
70%
80%
90%
100%
Less than100
employees
100 – 999 employees
1,000 – 4,999
employees
5,000 – 9,999
employees
10,000 – 50,000
employees
More than50,000
2% 12% 7%
7% 7%
5%
14%
21%
22%
9% 12%
2%
14%
11% 16%
11% 6%
5%
24%
40% 42%
57% 52%
30%
45%
15% 14% 17%
22%
58%
No plans & no interest None, but considering options Not yet, but have plans
Some, limited use Enterprise use
39
THE SOCIAL INTRANET STUDY
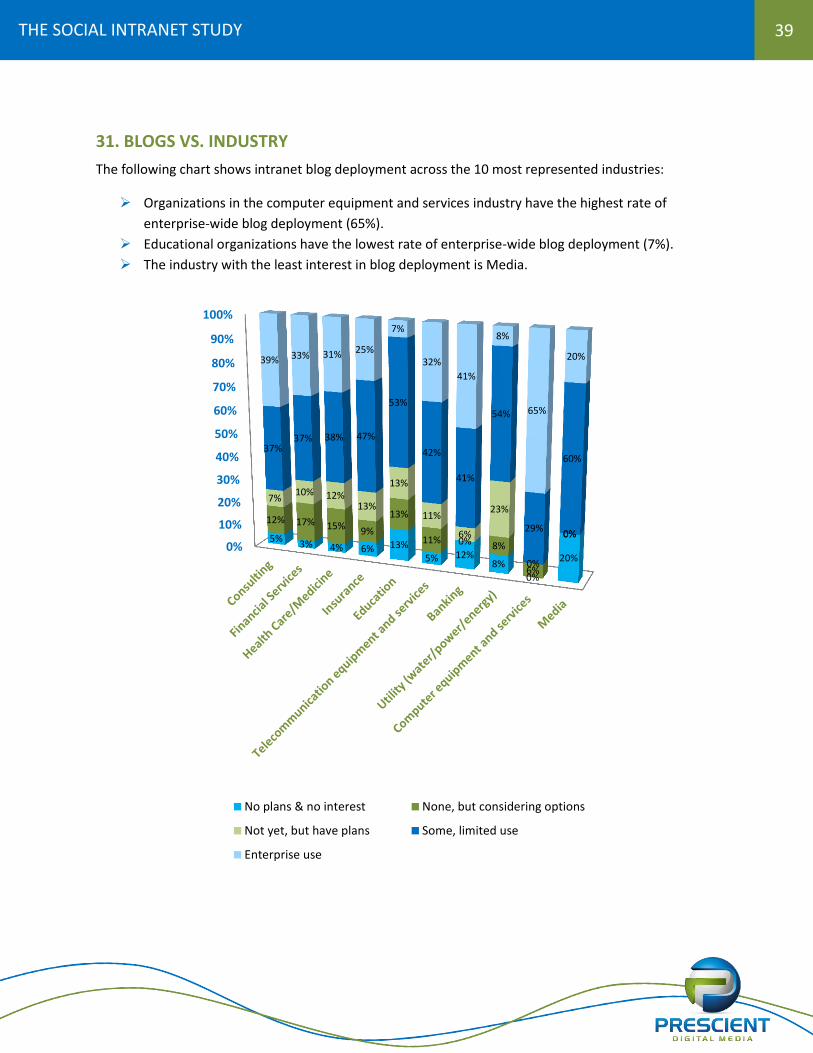
31. BLOGS VS. INDUSTRY
The following chart shows intranet blog deployment across the 10 most represented industries:
Organizations in the computer equipment and services industry have the highest rate of
enterprise-wide blog deployment (65%).
Educational organizations have the lowest rate of enterprise-wide blog deployment (7%).
The industry with the least interest in blog deployment is Media.
0%
10%
20%
30%
40%
50%
60%
70%
80%
90%
100%
5% 3% 4% 6% 13%
5% 12% 8%
0%
20%
12% 17% 15% 9%
13%
11% 0% 8%
6%
0%
7% 10% 12%
13%
13%
11%
6%
23%
0%
0%
37% 37% 38% 47%
53%
42%
41%
54%
29%
60%
39% 33% 31% 25%
7%
32%
41%
8%
65%
20%
No plans & no interest None, but considering options
Not yet, but have plans Some, limited use
Enterprise use
40
THE SOCIAL INTRANET STUDY
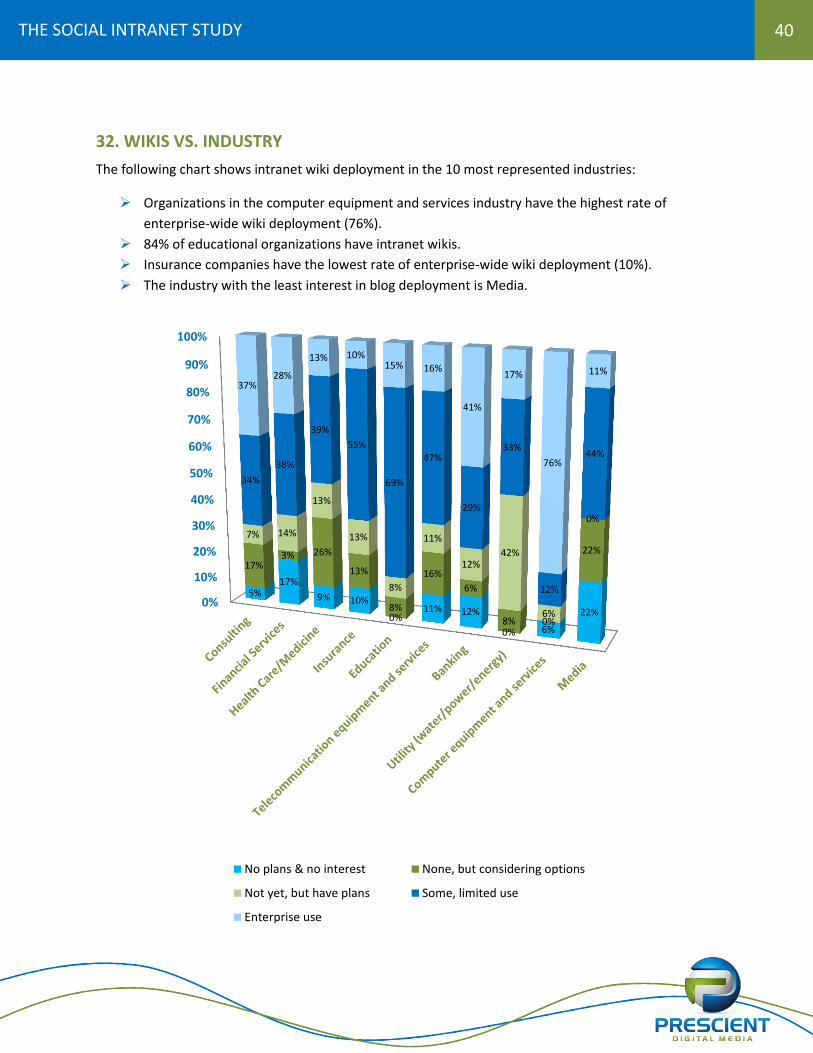
32. WIKIS VS. INDUSTRY
The following chart shows intranet wiki deployment in the 10 most represented industries:
Organizations in the computer equipment and services industry have the highest rate of
enterprise-wide wiki deployment (76%).
84% of educational organizations have intranet wikis.
Insurance companies have the lowest rate of enterprise-wide wiki deployment (10%).
The industry with the least interest in blog deployment is Media.
0%
10%
20%
30%
40%
50%
60%
70%
80%
90%
100%
5% 17%
9% 10%
0% 11% 12%
0% 6%
22%
17% 3% 26%
13%
8%
16%
6%
8% 0%
22%
7% 14%
13%
13%
8%
11%
12% 42%
6%
0%
34%
38%
39%
55%
69%
47%
29%
33%
12%
44%
37% 28%
13% 10% 15% 16%
41%
17%
76%
11%
No plans & no interest None, but considering options
Not yet, but have plans Some, limited use
Enterprise use
41
THE SOCIAL INTRANET STUDY
Recommendations
Successful deployment and use of Intranet 2.0 tools begins with proper planning, engaged and
supportive executives, and participatory employees:
Leadership: Senior management must set the tone; executives must lead the dialogue,
control the message, and actively promote social media.
Plan: Planning is essential for success; develop a plan that is based on a thorough assessment
and contains key performance indicators (KPIs).
Benchmark: Understand the ingredients of a good blog, wiki or podcast; watch and cherry-
pick from the leaders.
Engage: Gather input and feedback from employees early in the planning process; act quickly
on necessary changes.
Governance: Every tool needs an owner and supporting policies (terms of use) to govern use
and writing.
Technology: Don’t be sold a solution, evaluate and select a social media solution based on
business requirements and needs (evaluate several solutions via an RFP process).
Refresh: Keep your content and tools relevant and fresh, and ensure they cross-promote your
latest products, services, and key communications and HR messages.
Monitor: Ensure you are aware of which external 2.0 websites are popular, how they work,
and what users like/dislike about the features.
Measure: Document the link between social media and the business, and develop a set of
performance metrics with baselines that are regularly measured.
42
THE SOCIAL INTRANET STUDY
Final note
Consider an Intranet 2.0 undertaking as an evolution not a revolution. There’s no need to solve
everything on your first attempt; test and pilot solutions and enhance as necessary before trying to
conquer the world.
43
THE SOCIAL INTRANET STUDY
About Prescient Digital Media
Prescient Digital Media is a veteran web and intranet consulting firm with 10 years of rich history. We
provide strategic Internet and intranet consulting, planning, and communications services to many
Fortune 500 and big brand clients, as well small and medium-size leaders. We treat each client as
unique; we listen to their needs, goals and challenges; understand a client's requirements and potential;
and deliver highly effective and innovative website and intranet plans, designs and solutions. In short,
we are an intranet consulting firm for hire.
Prescient was founded in 2001 by Toby Ward with the premise that corporate websites and intranets
have business value, and should be planned and executed accordingly. Internet and intranet business
consulting was and remains our focus today. First and foremost, we are business management
consultants that have a superb knowledge of the technology, but we are technology neutral.
Prescient plans and builds highly effective websites and intranets that…
Are demonstrably better than the competition. Secure stakeholder engagement and support management objectives. Deliver measurable value by increasing business results and employee productivity.
Prescient’s web and intranet experience is wide-ranging and includes, for example: Planning, launching and managing all aspects of a consumer portal with more than 55 million
hits per year; Transforming an existing intranet (SMB) into a high-powered business system with a two-year
ROI of 700% ($1.5 million); and Transforming an enterprise’s intranet and website into highly functional, user-friendly portals
that prior to a redesign scored benchmarked ratings of 4 out of 10, and now score better than 8 out of 10, with many accolades from management and customers alike.
Prescient’s focus includes the assessment, planning, technology selection, content and launch of intranets, websites, and web-based tools for:
Financial services Health and life sciences Energy Government Manufacturing and High-Tech
Prescient services for intranet, Internet and e-Health include: Analysis (evaluation, business requirements, user research, benchmarking) Planning (strategic planning, functional specifications, information architecture) Technology (platform and application evaluation, selection, and implementation) Implementation (design, integration, content, tools) Marketing (communications, content management, operation, marketing, SEO)
44
THE SOCIAL INTRANET STUDY
Our clients include:
For more information or to contact the author: Toby Ward 416.986.2226 [email protected] www.PrescientDigital.com