State of the science of taxonomy in Australia: … report should be attributed as ‘State of the...
40
State of the science of taxonomy in Australia: results of the 2016 Survey of Taxonomic Capacity. Prepared by H.J. Weaver Australian Biological Resources Study November 2017
Transcript of State of the science of taxonomy in Australia: … report should be attributed as ‘State of the...

State of the science of taxonomy in Australia: results of the 2016 Survey of Taxonomic Capacity. Prepared by H.J. Weaver Australian Biological Resources Study
November 2017

© Copyright Commonwealth of Australia, 2017.
State of the science of taxonomy in Australia: results of the 2016 survey of taxonomic capacity is licensed by the Commonwealth of Australia for use under a Creative Commons Attribution 4.0 International licence with the exception of the Coat of Arms of the Commonwealth of Australia, the logo of the agency responsible for publishing the report, content supplied by third parties, and any images depicting people. For licence conditions see: https://creativecommons.org/licenses/by/4.0/
This report should be attributed as ‘State of the science of taxonomy in Australia: results of the 2016 survey of taxonomic capacity, Commonwealth of Australia 2017’.
The Commonwealth of Australia has made all reasonable efforts to identify content supplied by third parties using the following format ‘© Copyright, [name of third party] ’.
Disclaimer
The views and opinions expressed in this publication are those of the authors and do not necessarily reflect those of the Australian Government or the Minister for the Environment and Energy.
While reasonable efforts have been made to ensure that the contents of this publication are factually correct, the Commonwealth does not accept responsibility for the accuracy or completeness of the contents, and shall not be liable for any loss or damage that may be occasioned directly or indirectly through the use of, or reliance on, the contents of this publication.

Contents Abstract ................................................................................................................................................................................... 5
Introduction .......................................................................................................................................................................... 6
Methods .................................................................................................................................................................................. 7
Survey design ............................................................................................................................................................. 7
Data analysis .............................................................................................................................................................. 7
Terminology............................................................................................................................................................... 7
Results ..................................................................................................................................................................................... 8
Who is Australia’s taxonomic workforce, and what work do they do? .........................................................10
The tasks Australian taxonomists work on.........................................................................................................17
What taxa do Australian taxonomists work on? ................................................................................................20
Contribution by Australian taxonomists .............................................................................................................24
What issues matter to Australian taxonomists? .................................................................................................26
Discussion ........................................................................................................................................................................... 30
The Australian taxonomic research workforce ..................................................................................................30
The work and activities conducted by Australian taxonomists .......................................................................31
The research focus, constraints and concerns of Australian taxonomists.....................................................32
Does Australia have a ‘taxonomic impediment’? ...............................................................................................33
Conclusion .......................................................................................................................................................................... 35
Acknowledgements ........................................................................................................................................................ 36
References .......................................................................................................................................................................... 37
Appendix A ......................................................................................................................................................................... 38
Appendix B ......................................................................................................................................................................... 39

Photo credits
Top row (left to right): Red alga (Gibsmithia hawaiiensis) © Copyright, J.M. Huisman (CC BY NC ND); Imperial White butterfly (Delias harpalyce) © B. Kuchlmayr (CC BY); Spiked Andersonia (Andersonia simplex) © Copyright, R. Barrett (CC BY); and nymph of pentatomid bug © P. Anesbury (CC BY NC ND).
Bottom row (left to right): Southern Calamari Squid (Sepioteuthis australis) J. Finn © Copyright, Museum Victoria (CC BY); and hornwort (Phaeoceros sp.) C. Cargill © Copyright, CANBR (CC BY).

State of the science of taxonomy in Australia: results of the 2016 Survey of Taxonomic Capacity / 5
Abstract The Australian Biological Resources Study (ABRS) is committed to facilitating and supporting Australian researchers in the field of taxonomy and systematics. The ABRS has conducted surveys of taxonomic research capacity in 1975, 1991, 2003 and 2016. Here, we present the results of the most recent survey. We found that the number of researchers actively working in taxonomy and systematics has fallen over the years, but that proportionally more women are now working in the field. We also found that the field is supported substantially by retired or honorary researchers, with over a quarter of the workforce in unsalaried positions. This does enable a sustained level of productivity in the field, but masks the fact that there are fewer paid positions in the field. A consistent concern of researchers in the field is that of funding and job security/career opportunities, highlighted in surveys in 2016, 2003 and 1991. Newer concerns highlighted in 2016 were the lack of positions for postdoctoral researchers and beyond, and the way taxonomy is perceived — particularly in the context of bibliometrics. Australia has a good representation of researchers in the Arthropoda and Angiospermae, but there are many taxonomic groups for which we lack experts.

6 / State of the science of taxonomy in Australia: results of the 2016 Survey of Taxonomic Capacity
Introduction The Australian Biological Resources Study (ABRS) is a program of the Australian Department of the Environment and Energy that has been running continuously for over 40 years. The ABRS commenced in 1973 under an Interim Council, before being established in 1978 as an entity (Free and Ride 1978). One of the reasons for establishing a body for the specific task of acquiring and facilitating knowledge on taxonomy of Australian species was recognition that “[the] need for rapid acquisition and organisation of biological data has also become apparent through pressing requirements of new conservation programs and environmental assessments” (Free and Ride 1978). This is still true today it remains one of the most important functions of the work of the ABRS. Other core activities of the ABRS include supporting research via the National Taxonomy Research Grant Programme (NTRGP) and providing travel grants to students, facilitating capacity-building and training in the field, and producing publications and identification tools (e.g. web-accessible databases, online resources, monographs, taxonomic revisions, checklists, dichotomous keys etc.).
The ABRS sought to evaluate, using surveys, the workforce of taxonomists and systematists in Australia at several intervals: first in 1975, then 1991, 2003 and 2016. The longitudinal series of data produced from these surveys provides a valuable insight into the state of taxonomy for Australia. The purpose of the original survey was to determine the nature and extent of State and Commonwealth programs for taxonomic and systematics research and collections, in order for the ABRS to effectively support such work (Ride and McCusker 1978). This was the philosophy for commissioning surveys in 1991 and 2003; and the 2016 survey has the added benefit of providing information relevant for the Decadal Plan for Biosystematics and Taxonomy in Australasia. Surveys commissioned by the ABRS can be compared with similar surveys conducted in New Zealand (Nelson, et al. 2015) and Canada (Council of Canadian Academies 2010). The aim of this research was to gauge the current state of the science of taxonomy in Australia, compared over time, to better understand the requirements of and limitations for Australian taxonomists.

State of the science of taxonomy in Australia: results of the 2016 Survey of Taxonomic Capacity / 7
Methods
Survey design
We constructed and disseminated the survey using Google Forms. It was designed to match with the surveys conducted in previous years (2003, 1991), but also included new questions to better understand the structure and needs of the taxonomic research community. It was open from 5 September to 16 October 2016. We emailed the survey directly to contacts, or indirectly via the Council of Heads of Australian Faunal Collections (CHAFC) and CHAH mailing lists. For the direct emails from ABRS, we assembled our mailing lists based on known current contacts (i.e. active stakeholders, and from successful and unsuccessful research and capacity-building grant applicants. To ensure we reached as many relevant potential respondents as possible, we sent the survey to heads of institutions, departments, and/or research groups with the request that it be sent on to staff members, rather than emailing individuals directly. We also asked that the survey be passed on to anyone to whom it might be relevant. To estimate the minimum reach of the survey, because we did not have a definite number of known recipients, we requested that each person who forwarded the survey to staff or colleagues advise us of the number of people they sent it to in three categories: the number of ‘all staff’ on their mailing list, the number of associates (unpaid/non-staff positions), if different from ‘all staff’, and the number of external people who were also sent the survey.
Data analysis
Initial sorting and cleaning of the descriptive survey data was done using R (R: a language and environment for statistical computing, Vienna Austria). Several responses were omitted from the final data set including known duplicate responses (where respondents identified themselves, the second response was omitted). Surveys that were clearly incomplete and those that were completed to indicate the respondent is not currently working in Australia were also omitted. Data from this survey were compared with similar surveys conducted by ABRS in 2003 (www.environment.gov.au/node/13879), 1991 (Richardson and McKenzie 1991) and 1975 (Ride and McCusker 1978), using raw data where available, or interpreting from synthesis reports. For comparison, the numbers of respondents were 183 in 2003 and 408 in 1991. Data from 1975 were presented differently, and comparison numbers will be given for specific data categories.
Data on publications produced were collected using Web of Science (Thomson Reuters) searches for “n. sp.” and “sp. nov.” (and plurals thereof) for particular years and sorted by country using the ‘results analysis’ tool on the database.
Terminology
We used the term ‘taxonomy’ and ‘taxonomist’ to cover all aspects of the field of taxonomy, including alpha taxonomy, systematics, phylogenetics, specimen preparation etc., unless specifically indicated in the text.

8 / State of the science of taxonomy in Australia: results of the 2016 Survey of Taxonomic Capacity
Results We emailed the survey request directly to 194 recipients. The estimated minimum reach was calculated on the responses of laboratory heads/leaders of institutions, etc. advising us of how many people they forwarded the survey request to which in total, included 504 additional recipients. Given that we also received emails from laboratory heads/leaders of institutions advising us they had circulated the survey but did not provide numbers on how many people they circulated it to, and because we cannot be sure that people did not receive the survey only once (i.e. some recipients may have received the survey request from multiple contacts), we estimate that the survey request was seen by a minimum of around 700 individuals in total. We received 359 completed responses from taxonomists working in Australia, which was 51% of our estimated minimum reach.
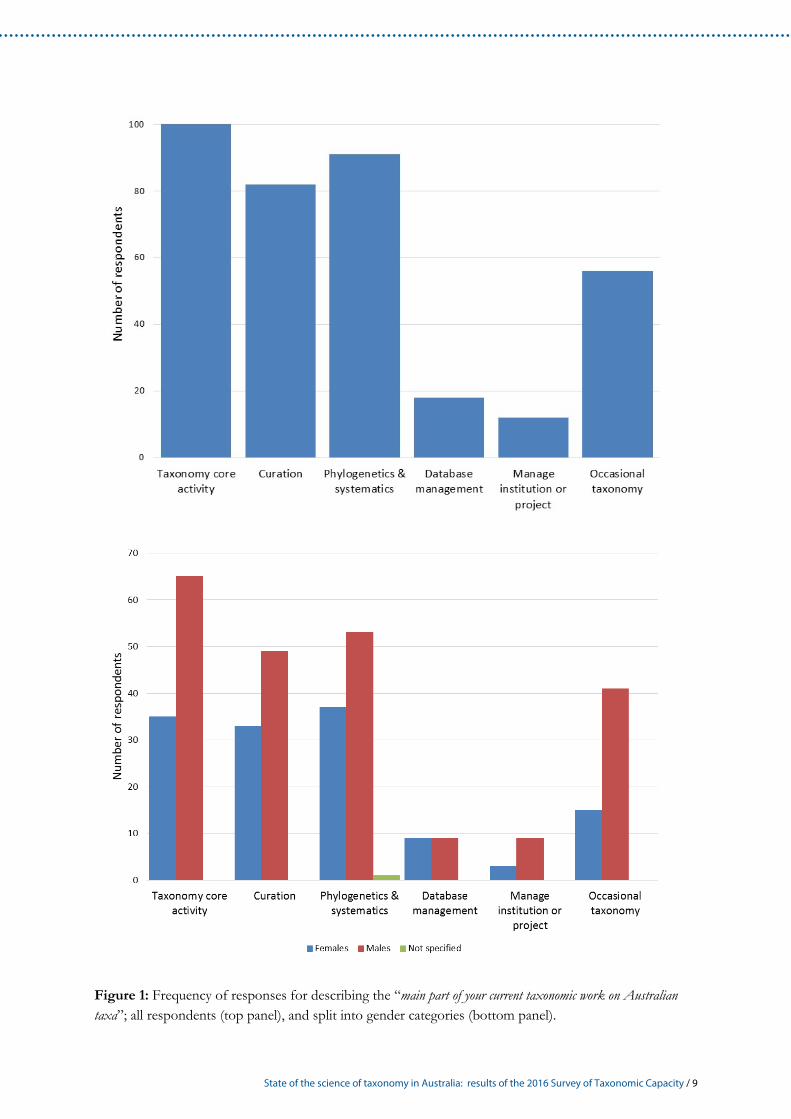
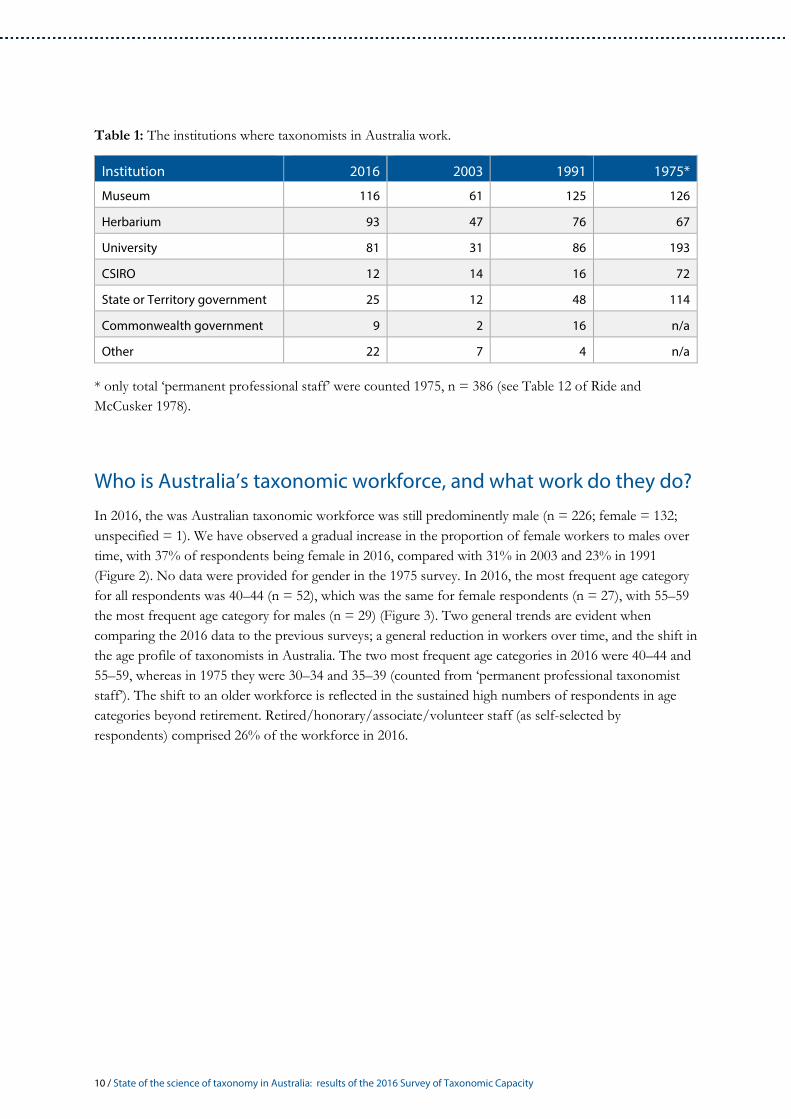
Of the 359 respondents, 100 identified ‘taxonomy as their core activity’ at their workplace, followed by 91 selecting ‘phylogenetics & systematics [research]’, and 83 respondents selecting ‘curation of specimens’ as their main work. Fifty-six respondents selected ‘occasionally doing taxonomic research’ as ancillary to their main paid work (Figure 1). Overall, 51% of respondents selected performing taxonomic research and curation as their main work. The activity of taxonomy and curatorial work was aggregated in the 2003 survey, with a yes/no answer. The rate of taxonomic and curatorial work as a main activity in 2016 is similar to the proportion of respondents who selected those categories in 2003 and 1991, where 65% and 56% of respondents respectively selected ‘yes’ to the question of whether curatorial and/or taxonomic work was their major responsibility. The proportion of males to females working across each activity was relatively even, although the most frequent activity listed by males as their core activity was taxonomy, whereas the most frequent activity for females was phylogenetics and systematics (Figure 1). Taxonomists in Australia are employed mainly at museums (n = 116), herbaria (n = 93) and universities (n = 81) (Table 1). The proportions of workers at the main institutions has remained relatively steady over the time period available, but it is important to note that it is not clear whether the scope of surveys in previous years included technical workers, managers, curatorial staff or retired/honorary positions in these questions.
State of the science of taxonomy in Australia: results of the 2016 Survey of Taxonomic Capacity / 9
Figure 1: Frequency of responses for describing the “main part of your current taxonomic work on Australian taxa”; all respondents (top panel), and split into gender categories (bottom panel).
10 / State of the science of taxonomy in Australia: results of the 2016 Survey of Taxonomic Capacity
Table 1: The institutions where taxonomists in Australia work.
Institution 2016 2003 1991 1975*
Museum 116 61 125 126
Herbarium 93 47 76 67
University 81 31 86 193
CSIRO 12 14 16 72
State or Territory government 25 12 48 114
Commonwealth government 9 2 16 n/a
Other 22 7 4 n/a
* only total ‘permanent professional staff’ were counted 1975, n = 386 (see Table 12 of Ride andMcCusker 1978).
Who is Australia’s taxonomic workforce, and what work do they do?
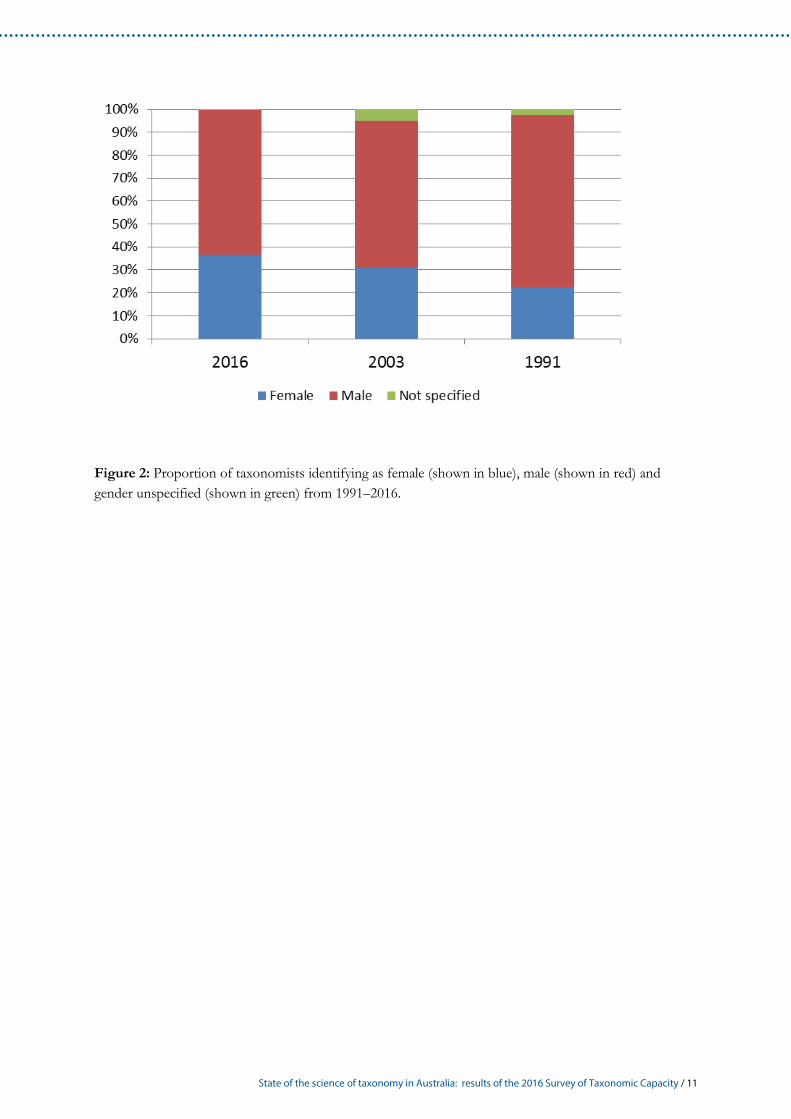
In 2016, the was Australian taxonomic workforce was still predominently male (n = 226; female = 132; unspecified = 1). We have observed a gradual increase in the proportion of female workers to males over time, with 37% of respondents being female in 2016, compared with 31% in 2003 and 23% in 1991 (Figure 2). No data were provided for gender in the 1975 survey. In 2016, the most frequent age category for all respondents was 40–44 (n = 52), which was the same for female respondents (n = 27), with 55–59 the most frequent age category for males (n = 29) (Figure 3). Two general trends are evident when comparing the 2016 data to the previous surveys; a general reduction in workers over time, and the shift in the age profile of taxonomists in Australia. The two most frequent age categories in 2016 were 40–44 and 55–59, whereas in 1975 they were 30–34 and 35–39 (counted from ‘permanent professional taxonomist staff’). The shift to an older workforce is reflected in the sustained high numbers of respondents in age categories beyond retirement. Retired/honorary/associate/volunteer staff (as self-selected by respondents) comprised 26% of the workforce in 2016.
State of the science of taxonomy in Australia: results of the 2016 Survey of Taxonomic Capacity / 11
Figure 2: Proportion of taxonomists identifying as female (shown in blue), male (shown in red) and gender unspecified (shown in green) from 1991–2016.

12 / State of the science of taxonomy in Australia: results of the 2016 Survey of Taxonomic Capacity
Figure 3: Age profiles of Australian taxonomists with numbers of respondents on the y axis, showing all years (top), females only (middle) and males only (bottom). Note that the 1975 and 2003 surveys final age category was 60+. Data for 1975 were for ‘permanent professional’ taxonomists only (n = 386).

State of the science of taxonomy in Australia: results of the 2016 Survey of Taxonomic Capacity / 13
Half of respondents surveyed (n = 156) were currently employed in full-time permanent (ongoing) positions, while the second most frequently selected employment category was ‘unpaid professional’ (n = 91), which was the aggregate of the honorary/volunteer/associate category and any ‘retired’ or ‘emeritus’ selected in the “other” category (Figure 4). Casual positions and students were not considered in previous surveys. The proportions of people employed in each of the employment categories was similar to previous years, with the majority working full-time permanent positions, and lower numbers of people employed on a part-time or full-time fixed term basis. However, over time there has been a trend toward more fixed-term positions, and more part-time permanent positions. For comparison, in 1975, the ‘professional taxonomist’ workforce in State museums and herbaria comprised 63% permanent full-time workers, with 18% in ‘temporary’ positions (defined as those working part-time, or employed via grants or other soft money), and 19% were honorary or unpaid positions. The 1975 data in Figure 4 are incomplete because the survey only included the employment categories of professional biologists at State museums and herbaria (n = 193; FT(perm) = 122, PT/temp = 34, honorary = 37). Further, the part-time and temporary positions were lumped together and therefore excluded because they could not be split into the current categories. While the most common employment category is the full-time permanent position for both men and women (Figure 5), more women than men worked in full-time fixed-term, both permanent and fixed-term part-time, and in casual positions in 2016. Women consistently outnumbered men in part-time categories in all survey years where these categories were offered.
Within their work as taxonomists, and excluding the 91 respondents for the unpaid categories, the most frequently selected job category or position description was research scientist (n = 80), followed by collection manager/curatorial (n = 56), graduate student (n = 31) and academic staff (n = 27). More women than men worked as research assistants/technical support, and as graduate students (Figure 6). Questions on job/position description were not asked in previous surveys, so it is not known how the results in 2016 compare with other years.
A large proportion of respondents have worked for less than 10 years in their current workplace (<5 years + 5–9 years n = 169) (Figure 7). Time spent at work for both males and females has decreased substantially since 1991, when 42% of respondents at that time worked more than 60 hours per week. In 2016, respondents (n = 344) most frequently spent 31–40 hours per week at work (35% of total), followed by 41–50 hours at work per week (23%). No respondents worked less than five hours per week, and 5% worked more than 60 hours per week (Figure 8).

14 / State of the science of taxonomy in Australia: results of the 2016 Survey of Taxonomic Capacity
Figure 4: Employment status of Australian taxonomists surveyed for the years 1975, 1991, 2003 and 2016.

State of the science of taxonomy in Australia: results of the 2016 Survey of Taxonomic Capacity / 15
Figure 5: Employment status as reported by Australian male and female taxonomists in 2016, 2003 and 1991. Only those who disclosed their gender are counted in this graph.

16 / State of the science of taxonomy in Australia: results of the 2016 Survey of Taxonomic Capacity
Figure 6: Position/job description of Australian taxonomists surveyed in 2016.
Figure 7: Years spent working in the field of taxonomy, and years spent at current workplace for Australian taxonomists in 2016.

State of the science of taxonomy in Australia: results of the 2016 Survey of Taxonomic Capacity / 17
Figure 8: Typical hours worked per week as nominated by Australian taxonomists in 2016, 2003 and 1991.
The tasks Australian taxonomists work on
Australian taxonomists perform a range of tasks as part of their regular work. We asked survey respondents to indicate the percentage of their time over the past year spent on a selection of tasks (Figure 9). Very few respondents (n = 18) perform research only for 80% or more of their work time. The most frequent time percentage spent on research was 41–60%, followed by 21–40%. Most frequently, respondents spent small amounts of time across a broad range of tasks. For previous survey years, respondents were asked to show how much of their time was consumed by specified tasks that added up to 100% (as opposed to the 2016 survey where total time spent on all tasks could be greater than 100%). In 2003, respondents spent 15% of their time on research tasks, compared with 17% in 1991 and 29% in 1975.
In addition to the specified tasks, we sought to examine how much fieldwork taxonomists were doing, and the sources of funding for this work during the previous year. In 2015, 6,033 total days of fieldwork were undertaken by survey respondents, compare with 3,051 days in 2002 and 6,957 days in 1990. On average in 2015, workers spent three days on institution-funded fieldwork, seven days on project/grant-funded, and eight days on unfunded/privately funded fieldwork (= average of 18 days of fieldwork), compared with an average of 20 days per year recorded in the 1991 data set. However, in 2015 the employment category of workers had a large bearing on how much fieldwork was done, and how it was paid for. As seen in Figure 10, workers in the ‘other’ work category (comprising one respondent, who identified their work category as ‘self-employed’) did almost equal amounts of paid and unpaid fieldwork across all categories. Full-time workers performed most project-funded fieldwork, with less institution-funded and

18 / State of the science of taxonomy in Australia: results of the 2016 Survey of Taxonomic Capacity
unpaid fieldwork. However, the unpaid professionals in 2016 (i.e. retired, voluntary, emeritus, honorary) contributed just over two weeks’ unpaid fieldwork on average, with very little paid fieldwork. There is a definite trend toward more unpaid fieldwork. In the 2003 survey, the majority of fieldwork for 2001–2002 was project-funded (around 46%), and the rest was relatively evenly spread between institution-funded and unfunded fieldwork. Further, in the 2001–2002 data, the majority of fieldwork was conducted by full-time researchers, with unpaid/honorary workers contributing only 17% of all fieldwork.
For the first time, the survey included questions on whether respondents had received ABRS NTRGP funding for their work. We also asked if they had been employed as part of an NTRGP grant. Of the 334 respondents for this question, 46% had received NTRGP funding; and 29% of respondents had been employed on a project that was funded through NTRGP.

State of the science of taxonomy in A
ustralia: results of the 2016 Survey of Taxonomic Capacity / 19
Figure 9: The percent time spent on tasks, by Australian taxonomists.

20 / State of the science of taxonomy in Australia: results of the 2016 Survey of Taxonomic Capacity
Figure 10: Average number of days of fieldwork performed by taxonomists of various employment categories.
What taxa do Australian taxonomists work on?
Respondents self-selected the level of expertise for taxa they work with, from a choice of three categories: ‘recognised experts’, ‘work on group but not expert’, and ‘curation/collection management’. It is important to note, however, that there were no limits on the number of taxa that could be selected by respondents. Several respondents were responsible for curating/managing numerous different taxa, and many respondents selected multiple taxa that they work on and/or were expert in. The results show that Australia’s taxonomic expertise (i.e. the ‘recognised expert’ category) is most highly concentrated across arthropods, angiosperms, molluscs and fish (Figure 11). The phylum Arthropoda was presented in three categories: insects, crustaceans and other arthropods. When split into these three options, the number of people identifying as an expert in insects was 35, which is more than for any other taxa except for angiosperms. The 14 experts in crustaceans and 15 experts in other arthropods ranks them higher than for fish (n = 12). Overall, with the exception of Cephalochordata, all taxa listed had at least one person working on in the group who is not an expert in that taxon, and many people curating collections. For ‘other’ taxa, respondents selected Brachiopoda (expert), brachiopods (work in the group), cyanobacteria (work in the group), Xenoturbella (expert), marine invertebrates not listed (manager/curator), Bryozoa (manager/curator), Acanthocephala (two respondents who work in the group), nemerteans and other protostome worms (manager/curator), Onychophora (expert).

State of the science of taxonomy in A
ustralia: results of the 2016 Survey of Taxonomic Capacity / 21
Figure 11: The groups Australian taxonomists work on. Respondents could select more than one taxon, but could only select one ‘expertise’ ranking per taxon.

22 / State of the science of taxonomy in Australia: results of the 2016 Survey of Taxonomic Capacity
Using the numbers of respondents who identified as being experts in their taxa, plus species estimates from Chapman (2009), we plotted research capacity against the number of estimated Australian species for each taxon (Figure 12). Species estimates were based on the compilation of published literature describing species, and other published works that took into account estimates of species richness (from within research collections and in estimating ‘yet to be discovered’ taxa), see Chapman (2009) for additional information on the formulation of estimates of species richness. We included fungi in the non-vascular plants, as per the estimated number of species. We found the highest number of expert researchers in the vascular flora, despite a relatively low number of estimated species in Australia. The research capacity for Arthropoda will always be low relative to the number of estimated species, given the abundance of the group.
Respondents were also asked to select one main taxonomic group they worked on (‘please nominate your main taxonomic group from the list’, with a limit of one response) but with no requirement to qualify the kind of work they do in the group (for example, whether they were an expert taxonomist or worked in the group occasionally and did not consider themselves expert). Of the 339 respondents, 129 selected non-chordate groups and 116 selected vascular flora groups (Figure 13). For the remaining groups, 49 respondents selected chordate groups, 35 selected non-vascular flora groups, two selected protists, one selected viruses and seven selected ‘other’. There was no text option to elaborate on what the ‘other’ taxonomic groups were. Non-chordates have always attracted the highest number of workers in each survey year, followed by vascular flora, except for 2003 when there were more people nominating chordates than vascular flora as their main group. Data for 1975 only included taxonomists working at State museums and herbaria.

State of the science of taxonomy in Australia: results of the 2016 Survey of Taxonomic Capacity / 23
Figure 12: Number of taxonomic experts relative to estimated number of species in Australia. Fungi are included with non-vascular flora.
Figure 13: Numbers of taxonomists working in each main aggregate taxa from 1975 to 2016.

24 / State of the science of taxonomy in Australia: results of the 2016 Survey of Taxonomic Capacity
Contribution by Australian taxonomists
Globally, there is more taxonomic research occurring now than ever before. Methods and techniques to understand species concepts and the relationships between taxa (e.g. scanning electron microscopy, molecular analysis techniques, phylogenetic inference analyses, etc.) are the most sophisticated we have ever known, and these techniques are continuing to improve and be refined. The extent to which systematics can be quantified is difficult because revisions are being constantly made. We can evaluate the amount of alpha taxonomy (i.e. species descriptions) being done by searching for the signifying markers (‘n. sp.’ or ‘sp. nov.’ and plurals thereof) of new species in literature, which are requirements of the relevant nomenclature Codes. Using searches on the Web of Science, we found that Australian publications for new species reached an all-time high in 2016, with 385 recorded, equating to just over 4% of the total global taxonomic publications (n = 9075). Australia ranked 12th overall for publications outputs. Using 2010 as a comparison, and the previous survey years of 2003 and 1991, we have seen increases in the overall number of taxonomic papers published from Australia, at a consistent 4–5% of the total number of papers published globally for those years (Table 2). For reference, it is estimated that there are 570,000 species in Australia of which approximately 148,000 are described; and 11,000,000 species estimated globally of which 1,900,000 are described (Chapman 2009).

State of the science of taxonomy in Australia: results of the 2016 Survey of Taxonomic Capacity / 25
Table 2: Top countries for publications of new species for selected years.
2016 N = 9075 2010 N = 6005
Country N % Country N %
People’s Republic of China 2027 22 USA 1206 21
USA 1612 18 People’s Republic of China 917 15
Germany 743 8 Germany 574 10
Brazil 695 8 Japan 465 8
Japan 611 7 Brazil 387 6
South Korea 491 5 France 374 6
Russia 484 5 Spain 312 5
France 480 5 Russia 289 5
India 452 5 England 274 5
Spain 407 4 South Korea 271 4
England 394 4 Australia 255 4
Australia 385 4 India 226 4
2003 N = 3177 1991 N = 1632
Country N % Country N %
USA 776 24 USA 431 26
Germany 330 10 USSR 161 10
Japan 317 10 Germany 138 8
France 247 8 England 123 7
People’s Republic of China 202 6 Japan 117 7
England 200 6 France 105 6
Russia 181 6 Canada 85 5
Australia 178 6 Australia 74 5
Spain 173 5 Sweden 44 3
Canada 136 4 Czechoslovakia 40 2
Brazil 116 4 Spain 39 2
Belgium 109 3 Netherlands 39 2

26 / State of the science of taxonomy in Australia: results of the 2016 Survey of Taxonomic Capacity
What issues matter to Australian taxonomists?
We asked several questions of the taxonomic research community, to understand what they value and what kinds of things they need to perform their research. For the question “which of the following would increase your productivity or that of your institution?”, we offered several options, with the ability to select a response of ‘significant increase’, ‘moderate increase’, ‘slight increase’, or ‘no increase’ for each. This question was not asked in previous surveys. The results are summarised in Figure 14. The top three things that respondents consider would provide a ‘significant increase’ to personal or institutional productivity were ‘more external funding’ (78% of respondents selecting ‘significant increase’ needed), followed by ‘more research staff’ (61%) and ‘more technical support staff’ (58%). Conversely, the survey respondents placed the least importance on ‘more GIS support (11% of respondents selecting ‘significant increase’ needed), ‘easier access to taxonomic specimens’ (15%), and ‘more travel to other institutions or conferences’, ‘more national collaborations’ and ‘easier access to taxonomic literature’ (all 16%). Respondents considered more postdoctoral fellowships as more useful than more postgraduate students, with 54% respondents selecting ‘significant increase’ needed for postdoctoral fellowships as opposed to 28% for postgraduate students. Respondents were also able to select ‘other’ and detail what they thought would increase productivity. ‘Other’ responses to improve productivity included more job opportunities, more administrative and technical support and more volunteers to assist with tasks, greater availability of training courses (e.g. for using montage software), and more grant funding. A full list of responses can be seen in Appendix A.
We also asked the question “in your view, how much do the following factors impact on the taxonomic workforce?”, which had been asked in the 2003 survey. We provided a list of factors with the opportunity to select from the options of ‘ a lot’, ‘a little’, or ‘none at all’ for each (Figure 15, top panel). Respondents selected lack of career opportunities (92%), limited ability to attract external funding (85%), lack of security of tenure (83%), and limited opportunities for younger taxonomists (82%) as the factors that affect the workforce most. Compared with 2003 data (Figure 15, bottom panel), the main issues largely remain the same. The issue that most respondents in 2003 thought had the largest impact on the workforce was a lack of career opportunities (91%), followed by the ability to attract funding (90%), and limited opportunities for younger taxonomists (83%). However, the number of respondents who considered job security to have a large impact on the field was lower in 2003 than in 2016. In the 2016 survey, respondents were also able to select ‘other’ factors they thought affected the taxonomic workforce. ‘Other’ responses included concern over the measure of impact factors and bibliometrics that are biased against taxonomy because of low citation rates, limited career opportunities/lack of positions (permanent or otherwise), lack of funding for taxonomic research and few opportunities to apply for grants, and a lack of recognition of the fundamental role of taxonomy in biodiversity and biological science. A full list of responses can be seen in Appendix B.
We also asked questions regarding employment expectations. Respondents (n = 339 for 12 months; n = 334 for five years, Figure 16) had optimism that they would be working in the field of taxonomy, systematics or collections management in 12 months’ time, with 62% (n = 231) confident they would continue to work in the field in 12 months’ time, but less so for in five years’ time, with only 40% (n = 132) confident they would stay in the field. Respondents had higher uncertainty regarding whether they will work in the field in five years’ time, with 52% (n = 174) uncertain. The uncertainty does not come from likelihood of retirement, however. Of the 334 respondents who answered whether they were likely to retire in the next five years, 67% selected ‘no’, with 22% indicating they were already retired. When asked about whether workers expected to remain in the field (n = 303), most respondents indicated it was highly likely they would be there in five years (78%) if it were up to them. When taking account of external factors, they were less certain, with 33% considering it highly likely, followed by 30% with maybe and 28% with likely that they would remain in the field (Figure 17).

State of the science of taxonomy in A
ustralia: results of the 2016 Survey of Taxonomic Capacity / 27
Figure 14: Responses to the question “which of the following would increase your productivity or that of your institution?”

28 / State of the science of taxonomy in Australia: results of the 2016 Survey of Taxonomic Capacity
Figure 15: Responses to the question “please indicate how much you think these issues impact on the taxonomic workforce”. Top panel shows responses for the 2016 survey, bottom panel shows responses from the 2003 survey.

State of the science of taxonomy in Australia: results of the 2016 Survey of Taxonomic Capacity / 29
Figure 16: Responses to the question whether respondents expect to be working in the field in 12 months and in five years.
Figure 17: Responses to the question whether respondents expect to be working in the field in five years, based on whether it is completely up to the respondent or reliant on external factors.

30 / State of the science of taxonomy in Australia: results of the 2016 Survey of Taxonomic Capacity
Discussion
The Australian taxonomic research workforce
Australia has a small but strong research community in the field of taxonomy and systematics. Fifty-one percent of respondents selected taxonomy or curation as their core work in the field (28% and 23% respectively), which, while accounting for just over half of the workforce, is lower than the 66% of respondents working mainly in taxonomic work and specimen curation for the 2003 survey. Despite the difference in actual numbers of respondents for each survey year, with 2003 having a markedly lower response rate than all other survey years, the proportions for many survey questions were quite similar across years. For 2016, our estimated reach was double that of the number of people who responded to the survey. We cannot know whether the other 49% of people who potentially received the survey did not complete it because they did not consider themselves taxonomists or systematists. We can only assume the number of respondents in 2016 is a reasonable representation of the number of taxonomy and systematics practitioners in Australia, given the survey was voluntary. A trend of relatively stable numbers of taxonomists over time actually represents a decline in real terms. Australia’s population nearly doubled between 1975 (13.8 million people) and 2016 (24.1 million) (data from Australian Bureau of Statistics www.abs.gov.au). There was no commensurate increase in practitioners in the field as a proportion of the population.
There was little change demonstrated in the main work categories, employment categories and types of employment reported across survey years. Similarly, the proportions of staff employed at the main research institutions has remained relatively stable over time (Table 1). The number of taxonomists in full-time employment (both ongoing/permanent and fixed-term) was 55% in 2016, which is slightly higher than 2003 at 54% but lower than 1991 at 73%. The increase in full-time workers may be the result of including more categories for workers who practice taxonomy as part of their work. In the 2016 survey, we sought to identify more taxonomy practitioners than in previous surveys by including phylogenetics/systematics research, project and database management as core activities, and by actively seeking out respondents from universities/academia, rather than restricting the survey to State museums, herbaria and the collections within the CSIRO. The addition of these categories helped us to understand the work that taxonomists do, and the proportions of workers who perform these tasks in a taxonomic context.
Over time, the age profile of Australian taxonomists has changed, with larger numbers of people staying on as active taxonomists after reaching retirement age. In 1975, the most frequent age category for survey respondents was 30–34, compared with 45–49 in 1991, and 40 –44 in both 2003 and 2016. However, in 2016, over a quarter of the active taxonomic workforce identified as being retired/honorary/volunteer positions, compared with 19% of professional taxonomists in State museums and herbaria in 1975. The ‘unpaid professional’ (i.e. retired, honorary, associate or volunteer) employment status was the second-most frequently selected status after full-time permanent positions. While a sustained contribution to taxonomy over several decades and extending beyond retirement age means that more research can be produced and published, it does have important implications for the structure of the workforce, and for capacity-building within the field. It may be attractive to institutions to retain enthusiastic staff as unpaid honorary research fellows following their retirement from paid employment, but it means that a large proportion of the research produced by Australian taxonomists is the result of unpaid work. There are also concerns around knowledge transfer and capacity-building in the field of taxonomy, because the gaps in research capacity for certain taxa are masked by the unpaid workforce continuing to conduct research. The results did indicate that there was some succession occurring within the field, with 48% of

State of the science of taxonomy in Australia: results of the 2016 Survey of Taxonomic Capacity / 31
respondents reporting to have worked in taxonomy for 19 years or less (with 12% having been in the field for less than five years). We also found evidence of workforce mobility, with 47% of respondents working for nine years or less in their current workplaces (28% for less than five years).
The profile of job categories occupied by taxonomists is also changing over time. In 2016, we recorded the highest response rates for full-time fixed-term and part-time (both permanent and fixed-term) positions since 1991. This indicates that institutions and employers are continuing to offer jobs that require taxonomic skills in some form, but that there may be fewer full-time ongoing/permanent positions on offer. Job security is an increasing concern to people in the field. A greater proportion of respondents in 2016 considered it to have a large impact on the taxonomic workforce than in the 2003 survey. Unemployment of taxonomists is difficult to assess. None of the ABRS surveys have adequately captured data on unemployed taxonomists. In 2016, we only recorded unemployed taxonomists if they self-identified as such. Only two respondents selected ‘other’ as their employment category and specified they were unemployed at the time. The survey questions assume that taxonomists are working, but the other tasks unemployed taxonomists perform can also mask their true employment status. For example, an unemployed taxonomist who volunteers at an institution may have selected ‘volunteer’ as their employment category.
The issue of gender balance for women working in science, technology, engineering and mathematics (STEM) affects many disciplines in Australia and globally. The survey results in 2016 recorded the highest number of women working in the field than in any previous year. Respondents identifying as female increased from 23% in 1991 to 37% in 2016, showing a definite trend towards more female taxonomists working in Australia. The current proportion of female taxonomists in Australia is consistent with both New Zealand (36%) and Canada (30%)female representation in recent surveys (Council of Canadian Academies 2010; Nelson, et al. 2015). In Australia, female taxonomists are younger than males, with the most frequent age categories being 40–44 and 55–59. There were more females than males in the 40–44 age category, which was the only age category where women outnumbered men. Importantly, this was also the first time any age category has shown more female respondents than males since gender data were included in the surveys in 1991. Although there are more females working in the field than ever before, there is still disparity with regard to the categories of employment for women. Proportionally more males are employed as research scientists, academics or collection curators than females, while males outnumber females in full-time permanent positions. The only employment categories with more females than males were the research assistant/technical and graduate student categories. Moreover, females outnumbered males in all part-time work, and in full-time fixed term positions.
The work and activities conducted by Australian taxonomists
In 2016, a greater proportion of taxonomists worked less than 30 hours per week, reflecting the increase in part-time work and unpaid (honorary, etc.) positions compared with previous survey years. This indicates a trend towards increasing casualisation of the workforce, which is evident across academia and the private sector more generally. The work activities that the highest number of respondents spent the least amount of time on were answering queries (both for organisations and the public), collecting specimens and providing identification services. A problem with this estimate of work time was that the respondents could select a percentage range for each work activity, meaning that many people indicated that they spent more than 100% of their work hours doing these activities. Consequently, the results should be considered only as as indicative of the work Australian taxonomists perform.
Fieldwork was included in the survey to gauge not only how much was being done, but also how it was being funded. Collecting of specimens for study is integral to the field of taxonomy and systematics.

32 / State of the science of taxonomy in Australia: results of the 2016 Survey of Taxonomic Capacity
In 2016, the majority of fieldwork performed was funded through external project funding (i.e. grants), but a large proportion of fieldwork was also unfunded, and carried out by unpaid/honorary researchers. The average amount of fieldwork performed in 2015 was similar to that of 1990, but dropped from the average of 29 days recorded in the 1975 survey. This reduction over time may be partially explained by the increased number of specimens collected and housed at research institutions that are now available for study, but is more likely to be attributed to a combination of shrinking budgets for research at institution level, reduced numbers of scientists able to go out and do fieldwork, and their increasing workloads of additional tasks (see Figure 9).
The research focus, constraints and concerns of Australian taxonomists
The ability of respondents to select more than one taxon that they work on allowed us to see where Australia’s taxonomic expertise is concentrated. Asking respondents to rank whether they were recognised experts, or confident workers but not experts, allowed us to determine which taxa are well represented in research. Similarly, we can gauge the relative importance institutions place of the collections of those taxa, based on the number of people engaged to curate them. Of the taxa listed in the survey, only Cephalochordata did not have anyone actively working in the field either as an expert or a confident worker. Arthropods and angiosperms were the most frequently studied taxa, with 64 and 59 taxonomic experts respectively. This trend has been consistent across all survey years since 1975. In 2016, there were more people who worked in the Arthropoda that did not consider themselves experts than those who were considered experts (72), whereas in the Angiospermae there were more experts than non-experts (59 and 42 respectively). The difference in self-reported level of expertise may be explained by the vast diversity of arthropods, since the greatest disparity of non-experts to experts was in the ‘other arthropods’ category and people may work across several orders or families. Alternately, it could be because Australia simply lacks expertise in particular groups.
The bias towards expertise in vascular flora is apparent when numbers of experts are plotted against the estimated numbers of species for the main aggregated taxa in Australia (Figure 12). The high number of vascular plant taxonomists (n = 65) working on an estimated 21,000 species is in stark contrast to the similar number of arthropod taxonomists (n= 64, of which 35 identified as being experts in insects), who are working towards identifying and classifying over 215,000 species (estimated species numbers from Chapman 2009). This taxonomic bias has been consistent over time, despite fewer workers being recorded for all groups in 2016 compared with 1991. The most frequently-studied taxa in 1991 were angiosperms (84), insects (77), vertebrates (58), non-insect arthropods (49) and molluscs (24) (Richardson & McKenzie 1991). These trends on research focus for target taxa observed in Australia are consistent with those elsewhere in the world, where similar taxonomic biases exist. In Canada, the highest numbers of experts work on insects, followed by angiosperms (dicotyledons), fish, other arthropods and algae (Council of Canadian Academies 2010). The trend was similar for New Zealand, where the highest concentration of taxonomic experts was for insects, followed by vascular plants, algae, molluscs and other arthropods (excluding crustaceans) (Nelson et al. 2015).
The largest concern for the productivity of taxonomists in 2016 was in regard to external funding. Most scientists indicated that increases in funding were required for them to become more productive. Attracting external research funding for taxonomy is often difficult, with the ABRS NTRGP providing the only taxonomy and systematics-specific funding opportunity in Australia. There are many reasons for the apparent difficulty this field experiences in attracting funding, but it is frequently ascribed to the wider public perception of the science of taxonomy and systematics in combination with the negative perception

State of the science of taxonomy in Australia: results of the 2016 Survey of Taxonomic Capacity / 33
of low research impact, generated by measures based on citation rates where taxonomic literature often cites slowly. Funding also has an influence on the other most-frequently selected concern for taxonomists – employment opportunities for research staff, technical staff and postdoctoral fellowships. The opportunity for PhD students to transition to a postdoctoral position in their field, and then secure employment as independent researchers seems unlikely to many early career researchers. Established researchers are also impacted by the same constraints in attracting funding for projects, and are coping with reduced budgets at their institutions.
The focus has shifted in the major concerns for productivity for taxonomists since 1975, when technical support and funding for travel were identified as the most important limitations, with over half the respondents stressing a need for more technical support (Richardson and McKenzie 1991). Survey respondents in 2016 identified a lack of career opportunities, followed by a limited ability to attract external funding, and lack of job security and opportunities for younger scientists as the main limiting factors for taxonomic productivity in Australia. These concerns are very similar to those expressed in 2003, where lack of career opportunities in general and for younger scientists, plus limited opportunities for funding were considered to be most important to taxonomists. Many respondents to the 2016 survey listed the metrics used in science (e.g. journal impact factors) as being a major impediment to the discipline (see Appendices A and B). This was the first time metrics were flagged as a concern by the taxonomic research community. Taxonomic works are often published in minor journals that often cite poorly, due to the nature of the work. Another major concern was the lack of public image and the perceived lesser importance of taxonomy compared with other disciplines of biology and life sciences, by funding bodies and policy agencies in Australia.
Australian taxonomists were also concerned about the future likelihood of their continuing to work in the field. As seen in Figures 16 and 17, respondents were confident they would remain in the field for the forthcoming year, but were less confident about their employment prospects in five years’ time. Similarly, when asked if they would be working in the field in five years’ time, they indicated that it was highly likely if it were entirely up to them, but were far more pragmatic about the likelihood of this when external factors were taken into account.
Does Australia have a ‘taxonomic impediment’?
The ‘taxonomic impediment’ is a term used widely to embody a range of factors impacting on this scientific discipline, which can include not enough taxonomists in a particular group, insufficient funding for adequate research, a lack of capacity building within the field, and an unreliable supply of resources for end-users (cf. Ebach, et al. 2011). What are the impediments to taxonomy in Australia?
Table 2 demonstrates that Australia’s contribution to the global publication of alpha taxonomy has been fairly consistent (between 4–6%) from 1991 to 2016. It is important to note that this consistency has been achieved with ever-increasing rates of publication, from 74 papers in 1991 to 385 papers published by Australian researchers in 2016. Using the estimates of Australian species diversity of Chapman (2009), and making an extremely conservative estimate that only one species was described per paper (which is most often not the case) we see that 385 new species for 2016 represents approximately 0.09% of the total estimated species still to be discovered for Australia. Hence, Australia’s biodiversity is being described at a comparable rate to that globally, where the 9,075 new species described in 2016 represented approximately 0.10% of total remaining species to be discovered. While there is a long way to go, this demonstrates that Australian taxonomists (and others who describe Australian species) are very productive.

34 / State of the science of taxonomy in Australia: results of the 2016 Survey of Taxonomic Capacity
The proportion of taxonomists working in the Federal, State and Territory museums and herbaria (as shown in Table 1) appears to have been relatively stable between 1991 and 2016, considering the differing numbers of respondents for each survey. Therefore, it would appear that Australian taxonomists have become more efficient at their work, given that overall numbers of publications of new species have been increasing, while the proportion of publications contributed by Australian scientists has remained stable. However, there is a marked concern from the research community that taxonomists are disadvantaged in bibliometrics because of low citation rates for much of the taxonomic literature.
Trends in the taxa Australian taxonomists work on have been relatively stable over time. There has been a sustained focus on arthropods and angiosperms since 1975, suggesting knowledge transfer and turnover of taxonomists for those two taxa. however, these surveys do not adequately capture the fine-scale information on groups within the broad categories. For example, within the Arthropoda, we know how many people are experts in insects but do not know (a) which orders and families of insects are being studied, or (b) if capacity is being built by more people training in the taxonomy of little-studied groups, or whether the capacity is only being sustained in groups for which there are already workers.
In Australia in 2016, 46% of respondents had received research funding from the ABRS at some point in the past. The success rates for ABRS NTRGP grants have been steadily declining, reflecting an increasing pool of applicants for the available funding offered each year. However, the largest impediment to productivity was identified as limited external research funding, indicating that funding is a concern even for those who receive ABRS NTRGP grants. Funding is used to employ research and technical staff, and postdoctoral researchers to work on projects. A large impediment to the continued ability of Australian taxonomists to do their work effectively is the ability to employ staff, particularly at postdoctoral level and beyond. Knowledge transfer and capacity-building in postgraduate students is not beneficial to the field of taxonomy if those students are unable to find ongoing employment in which to apply their skills.

State of the science of taxonomy in Australia: results of the 2016 Survey of Taxonomic Capacity / 35
Conclusion The challenges facing the taxonomic research community today are remarkably similar to those outlined in previous surveys. It is clear that while some aspects of the field are changing in a positive way (e.g. gender balance, and the rise of more flexible working conditions), many other aspects are changing in a negative way (e.g. the ageing profile of researchers, and reliance of taxonomic productivity on an increasing number of post-retirement researchers). Limited funding for research and support staff is still a key concern for the taxonomic research community, as it has been throughout all previous surveys. While the proportion of alpha taxonomy research contributed by Australian taxonomists has remained steady over time, fewer people are doing taxonomy as their core business now than in previous years. There are many reasons for this, but it can be linked to a reduced number of research-only positions, and increased expectations for researchers to do other work (e.g. manage collections, teach, perform administrative tasks, etc.). The increased productivity of a workforce that has reduced in size over time is an interesting result, given the steadily increasing rates of publication of alpha taxonomy works. More study of the factors contributing to the success of productive taxonomic researchers may provide insights into how the field can be supported to provide more opportunities to taxonomists, and ensure Australia retains and builds its taxonomic research capacity.

36 / State of the science of taxonomy in Australia: results of the 2016 Survey of Taxonomic Capacity
Acknowledgements The ABRS would like to thank Kevin Thiele and Katharina Nargar (née Schulte) for their guidance in designing the survey.

State of the science of taxonomy in Australia: results of the 2016 Survey of Taxonomic Capacity / 37
References Chapman, A. (2009) Numbers of Living Species in Australia and the World (2nd edition). Australian Biological
Resources Study, Canberra.
Council of Canadian Academies (2010) Canadian taxonomy: exploring biodiversity, creating opportunity. The Council of Canadian Academies, Ottowa.
Ebach, M., Valdecasas, A., and Wheeler, Q. (2011) Impediments to taxonomy and users of taxonomy: acessibility and impact evaluation. Cladistics 27: 550–557.
Free, P., and Ride, W. (1978) Australian Biological Resources Study (ABRS). In ‘Australian Biological Resources Study 1973–78’. (Ed. Department of Science) pp. 1–10. (Australian Government Publishing Service: Canberra).
Nelson, W., Breitwieser, I., Fordyce, E., Bradford-Grieve, J., Penman, D., Roskruge, N., Trnski, T., Waugh, S., and Webb, C. (2015) National taxonomic collections in New Zealand. Royal Society of New Zealand, Wellington.
Richardson, B., and McKenzie, A. (1991) Australia’s taxonomists and taxonomic collections. Australian National Parks and Wildlife Service, Canberra.
Ride, W., and McCusker, A. (1978) The extent and nature of programs in biological survey conducted primarily by State museums and herbaria. In ‘Australian Biological Resources Study 1973–78’. (Ed. Department of Science) pp. 49–71. (Australian Government Publishing Service: Canberra).

38 / State of the science of taxonomy in Australia: results of the 2016 Survey of Taxonomic Capacity
Appendix A ‘Other’ responses for the question “which of the following would increase your productivity or that of your institution?”
• Funding Increase for others would be enough
• Processing and publishing huge, important, historical existing collections remain significant challengesfor Australasian museums (the bulk of the circa 80 million specimens), on top of expectations toacquire new collections suitable for biotech analyses for which the former category is largely notsuitable (eg transcriptomes)
• More field assistance
• lack of career opportunities
• courses on best use of technology (e.g automontaging software/camera software - but these courseswould need to be affordable
• more administrative support, both for teaching and research-related paperwork
• Researchers should not be restricted by their institutions or faculties to publishing in high-impactjournals. There are many journals that have moderate impact-factors but excellent editorial standardsand contents.
• Less governance, nanny state
• More specific grants for taxonomy in all research institutions and universities. More job opportunities
• more volunteers
• More care in preparation and documentation of specimens by research staff and other submitters
• I am presently self-funded, so any financial help would be much appreciated.
• DNA/EMS funds for Research Associates
• More government funding
• dedicated specimen databasing staff (not used at NSW)
• more funding/staff for processing (including databasing & storage) of research specimens / easierways to keep on top of taxonomic updates and feed through to databases
• Time (many of us are capable of taxonomic work but are our time is engulfed in admin, managementor other work.
• greater recognition of taxonomy in metrics
• Other responsibilities reduced
• various workshops on bioinformatics, genetical, morphological analyses
• Data capture / update staff
• Administrative support
• a paid position
• permanent job for expert taxonomists at museums and universities, recognition of expertise

State of the science of taxonomy in Australia: results of the 2016 Survey of Taxonomic Capacity / 39
Appendix B ‘Other’ responses for the question “in your view, how much do the following factors impact on the taxonomic workforce?”
• Taxonomic journals have extremely low impact factors which affects young researchers' chances toobtain fellowships/positions
• Lack of independent funding that does not involve co-funding for salary for post docs
• limited career opportunities
• The lack of any funding, not just externally, is a major issue and prevents institutions from employingmore researchers. There is so much to let the world know about but not many paid positions forpeople to do this.
• insufficient exposure at an earlier stage (undergrad degree, high school); more volunteer opportunitiesfor undergrads and easier admin processes to take on volunteers or summer students; greaterrecognition of important of taxonomy, systematics at a political level
• Irrelevant Journal impact factor
• more volunteers
• Lack of technical support; too many irrelevant bureaucratic requirements from parent organisations
• Professional entomology in Australia has been the target of funding cuts, especially pure taxonomyand field work, and is currently grossly underfunded and under-resourced.
• Poor image of taxonomy including lack of recognition in standard impact measures
• Taxonomists being imported in from other countries, when there are adequate (unemployed)taxonomists here in Australia, and plenty of them!
• impact measures
• Recognition of the fundamental role of taxonomy
• Perception that taxonomy is 'not science'
• The problem of taxonomic literature being poorly cited
• Lack of public investment
• Government cutbacks
• I believe productivity in the taxonomic workforce would be significantly improved if grants wereoffered that didn't have a co-funding requirement. I appreciate that there are restrictions on howmuch money there is to go around and that is why institutions need to help out, but I would be veryinterested in any grants that were for much less and didn't have a co-funding requirement and I amsure that I am not the only graduate that would prefer to work on a smaller salary if it meant beingable to work in their area of interest and expertise.

environment.gov.au/abrs
BIO
598.
1117