STATE OF CONNECTICUT DEPARTMENT OF TRANSPORTATION · STATE OF CONNECTICUT DEPARTMENT OF ......
31
STATE OF CONNECTICUT DEPARTMENT OF TRANSPORTATION TRANSPORTATION FAST FACTS 2008 Revised 8/01/08
Transcript of STATE OF CONNECTICUT DEPARTMENT OF TRANSPORTATION · STATE OF CONNECTICUT DEPARTMENT OF ......

STATE OF CONNECTICUT DEPARTMENT OF TRANSPORTATION
TRANSPORTATION FAST FACTS
2008
Revised 8/01/08

2
Prepared by: The Connecticut Department of Transportation 2800 Berlin Turnpike P.O. Box 317546 Newington, CT 06131-7546
In cooperation with: The U.S. Department of Transportation, The Federal Highway Administration and The Federal Transit Administration
Inquires regarding the Transportation Fast Fact Booklet should be directed to the Division of Systems Information at (860) 594-2014

3
TABLE OF CONTENTS
Drivers and Vehicles………………………………………………….. 4
Miles of Roads and Travel……………….…………………….…… 5
Commuting to Work …………………………………………………. 6
States in Rank Order by Commuting Time ....……………... 7
Connecticut Interstate Statistics …………………………...….. 8
Traffic and Congestion …………………………………...…….….. 9
State Gasoline Tax Rate ………………………………...…..….. 10
Bridges and Tunnels …………………………………………...… 11
State and Town Bridge Conditions …………………....…….. 12
Special Transportation Fund (STF) ………….………..……… 13
Funding Capital Program Funding 2007….….………………. 14
2007 Federal Highway and Transit Funds ………………..… 15
Bus and Rail Services ………………………..………………….… 16
Public Transportation Assets ………..…………..…………….. 17
Public Transportation Operating Budget………... ………... 18
Statewide Rail System……………………………………..………. 19
Connecticut Commuter Rails ……………………………………. 20
Statewide Bus System ……………………………….….……….. 21
Statewide Aviation …………..…………………………..……….. 22
Aviation and Waterway Services ……………………………….. 23
Accident Statistics/Incident Management ……………….. 24
Regional Planning and Coordination ………………..... 25– 27
Public Transportation Providers ………………….……….…… 28
State and Federal Contacts ………………….............. 29 – 30

4
Sources: 1 – 2006 American Community Survey (Census) 2 – CT DMV 3 – FHWA 4 – HPMS
DRIVERS AND VEHICLES
Average Annual Miles of Travel per Driver CT—11,166 (2006)2,4 US—14,909 (2005)3
VEHICLES REGISTERED VEHICLES CT – 3.0 Million (2006) 2 US – 241.2 Million (2005)3 (includes private, commercial, and publicly owned vehicles)
Average Number of Vehicles per CT Household1
0 8.19% (108,609) 1 31.54% (417,989) 2 39.42% (522,470) 3 14.62% (193,764) 4 or more 6.23% (82,611)
Annual Miles of Travel per Vehicle CT – 10,536 (2006)2, 4 US – 12,396 (2005)3
POPULATION1
CT—3.5 Million (2006) US—299 Million (2006)
DRIVERS 2.8 Million Licensed Drivers in CT (2006)2
200.5 Million Licensed Drivers in the US (2005)3

5
MILES OF ROADS AND TRAVEL
*Includes State Routes, State Roads and State Maintained National Highway System Road
Mileages Only.
Source: ConnDOT, Bureau of Policy and Planning * * ConnDOT Travel Model Series 28E
MILES OF ROADS CT (2007) US (2006) Public Roads 21,295 4,016,734 State Roads* 3,716 779,074 National Highway System Roads 963 163,065 Interstate Roads 346 46,628 MILES OF TRAVEL CT (2006) US (2005) Annual 31.7 Billion 2.99 Trillion Average Daily (DVMT) 86.9 Million 8.19 Billion DAILY VEHICLE MILES TRAVELED IN CT (DVMT) Year Miles Change
1999 81,630,000 2000 83,366,000 +2.13% 2001 84,279,000 +1.10% 2002 85,339,000 +1.26% 2003 85,874,000 +0.63% 2004 86,229,000 +0.41% 2005 86,568,000 +0.39% 2006 86,922,000 +0.41%
AVERAGE DAILY TRIPS** CT (2006) US (2001 NPTS) Total Vehicle 10.5 Million 643 Million Total Person 11.9 Million 1+ Billion
6
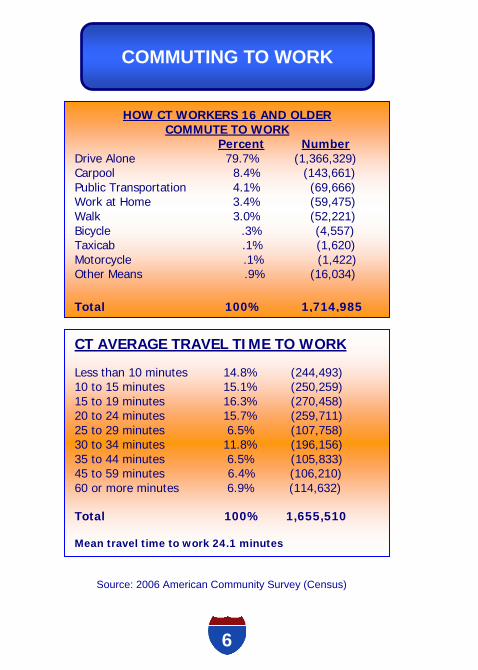
COMMUTING TO WORK
Source: 2006 American Community Survey (Census)
HOW CT WORKERS 16 AND OLDER COMMUTE TO WORK
Percent Number Drive Alone 79.7% (1,366,329) Carpool 8.4% (143,661) Public Transportation 4.1% (69,666) Work at Home 3.4% (59,475) Walk 3.0% (52,221) Bicycle .3% (4,557) Taxicab .1% (1,620) Motorcycle .1% (1,422) Other Means .9% (16,034) Total 100% 1,714,985
CT AVERAGE TRAVEL TIME TO WORK Less than 10 minutes 14.8% (244,493) 10 to 15 minutes 15.1% (250,259) 15 to 19 minutes 16.3% (270,458) 20 to 24 minutes 15.7% (259,711) 25 to 29 minutes 6.5% (107,758) 30 to 34 minutes 11.8% (196,156) 35 to 44 minutes 6.5% (105,833) 45 to 59 minutes 6.4% (106,210) 60 or more minutes 6.9% (114,632) Total 100% 1,655,510 Mean travel time to work 24.1 minutes

7
STATES IN RANK ORDER, BY COMMUTING TIME
Rank
State
Commute Time
Rank
State
Commute Time
1 New York 30.9 26 North Carolina 23.4 2 Maryland 30.6 28 Missouri 22.9 3 District of Col. 29.2 28 South Carolina 22.9 4 New Jersey 29.1 30 Kentucky 22.4 5 Illinois 27.9 31 Indiana 22.3 6 Georgia 27.3 31 Maine 22.3 7 Virginia 26.9 31 Rhode Island 22.3 8 California 26.8 34 Ohio 22.1 9 Massachusetts 26.6 35 Minnesota 22.0 10 Florida 25.9 36 Oregon 21.8 11 West Virginia 25.6 37 Vermont 21.2 12 Hawaii 25.5 38 New Mexico 20.9 13 Washington 25.2 39 Utah 20.8 14 Louisiana 25.1 39 Wisconsin 20.8 15 Arizona 25.0 41 Arkansas 20.7 15 Pennsylvania 25.0 42 Idaho 20.1 17 New Hampshire 24.6 43 Oklahoma 20.0 17 Texas 24.6 44 Kansas 18.5 19 Nevada 24.2 45 Iowa 18.2 20 Connecticut 24.1 46 Wyoming 17.9 21 Mississippi 24.0 47 Alaska 17.7 22 Colorado 23.9 47 Nebraska 17.7 23 Alabama 23.6 49 Montana 17.6 23 Delaware 23.6 50 South Dakota 15.9 25 Tennessee 23.5 51 North Dakota 15.5 26 Michigan 23.4
Source: 2006 American Community Survey (Census)

8
CONNECTICUT INTERSTATE STATISTICS
Total Daily Vehicle Users in 2005 I-95…………….………..…………….. 1,122,106 I-84……………………………………. 1,005,524 I-91……………………….…………… 717,992 Average Trip Length in 2005 I-95…………………….……………………19.1 miles I-84………………………………………… 20.5 miles I-91……………………………………….... 21.0 miles Percentage of Through State Vehicles I-95 in Greenwich……………………..…… 17% I-95 in North Stonington…………….……. 36% I-84 in Danbury……………………………. 25% I-84 in Union……………………………….. 39% I-91 in Enfield……………………………… 14% Percentage of Trucks US Interstate System in CT………………13.4% I-91 Hartford………………………….……. 10% I-84 Rte 195 to Mass State Line…………. 22% I-95 NY State Line to US 7 in Norwalk…... 15% I-95 US 7 to Milford……………………….. 14% I-84 NY Stateline to US 7 in Danbury……..16% I-84 US 7 to US 6 Southbury……….….…… 9% I-91 in Enfield………………………..………12%
Source: ConnDOT, Bureau of Policy and Planning, 2006Series 28E Travel Model

9
TRAFFIC AND CONGESTION
CT’s Highest Average Daily Traffic Volumes (2006) Merritt Parkway (Rt. 15)..………… 84,200 -- Trumbull Route 84 ……………..……………..…… 187,900 -- Hartford Route 91 …………..…………………….. 149,400 -- Hartford Route 95 ………..……………………..… 157,700 -- Darien Growth in Average Daily Traffic in CT (ADT) 1990 – 2004 …………………………….……………………… 20% Projected to year 2025 …………………….……..………. 25% Growth in State Route Lane Mileage in CT 1990 – 2006…………………………….……………………... 2.2% Percentage of Vehicle Miles of Travel (VMT) On CT State Maintained (2006)………….………………………………………. 76% National Percentage on State Maintained (2005)………………………. 64% On CT Limited Access (2006) ………………………………………………..... 47% National Percentage on Limited Access (2005)…………………………. 39% On CT Interstate System (2006)……………………………………………….. 32% On US Interstate System (2005)…………………………………………....… 24% Congestion on Highways On CT State Maintained (2006)………….…………….. 14% On CT Limited Access (2006) ………………………….. 30% On US Limited Access (1998)……………………….… 7% Traffic Trends on I-95 in CT Southwest Corridor Average Daily Traffic (ADT) 1959 …………………………….………………............... 20,000 Today ………………….……….…………….………………. 140,000 +
Growth per Year 1996 to 2006 …………………………………….1.2% 1959 to 1996 ……………..…………………..… 2% 1980’s ………………………….…..….exceeded 8%
Source: ConnDOT, Bureau of Policy & Planning

10
STATE GASOLINE TAX RATE EFFECTIVE JULY 2005
State Cents State Cents Per Per
Gallon Gallon
Washington 31 Texas 20 Pennsylvania 30 Vermont 20 Rhode Island 30 New Hampshire 19.5 Wisconsin 29.9 Illinois 19 Ohio 28 Michigan 19 Montana 27.75 New Mexico 18.88 North Carolina 27.1 Kentucky 18.5 West Virginia 27 Mississippi 18.4 Maine 26 Alabama 18 Nebraska 25.3 Arizona 18 Connecticut 25 California 18 Idaho 25 Indiana 18 Nevada 24.8 Virginia 17.5 Utah 24.5 Missouri 17 Kansas 24 Oklahoma 17 Oregon 24 Hawaii 16 Maryland 23.5 South Carolina 16 New York 23.25 Florida 14.5 Delaware 23 Wyoming 14 North Dakota 23 New Jersey 10.5 Colorado 22 Alaska 8 South Dakota 22 Georgia 7.5 Arkansas 21.7 Tennessee 21.4 m m Massachusetts 21 m m Iowa 20.7 m m Dist. Of Col. 20 m m Louisiana 20 m m Minnesota 20 m m
Our Neighbors Rhode Island …………. 30 New York …………....... 23.25 Massachusetts ……….. 21 Mean ………………….... 24.75
Source: Federal Highway Administration
11
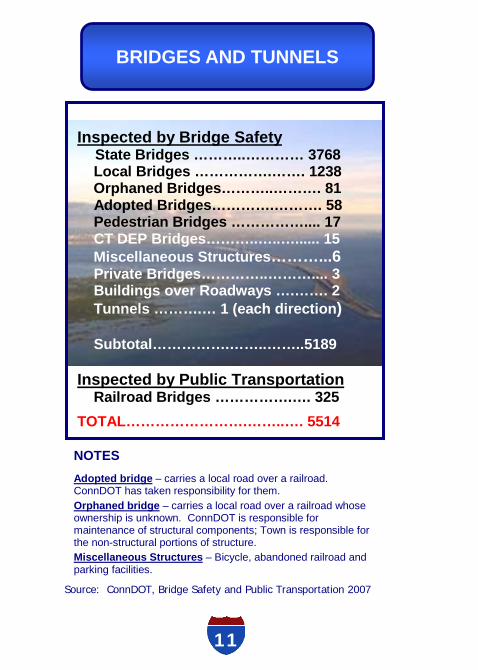
BRIDGES AND TUNNELS
8
NOTES Adopted bridge – carries a local road over a railroad. ConnDOT has taken responsibility for them. Orphaned bridge – carries a local road over a railroad whose ownership is unknown. ConnDOT is responsible for maintenance of structural components; Town is responsible for the non-structural portions of structure. Miscellaneous Structures – Bicycle, abandoned railroad and parking facilities.
Source: ConnDOT, Bridge Safety and Public Transportation 2007
Inspected by Bridge Safety State Bridges ………..………… 3768 Local Bridges …………….……. 1238 Orphaned Bridges………..………. 81 Adopted Bridges………….………. 58 Pedestrian Bridges …………….... 17 CT DEP Bridges………..…..…...... 15 Miscellaneous Structures………...6 Private Bridges…………..……….... 3 Buildings over Roadways ….……. 2 Tunnels ……….… 1 (each direction) Subtotal…………….……..……..5189 Inspected by Public Transportation Railroad Bridges …………….…. 325
TOTAL…………………….……..…. 5514

12
STATE AND TOWN BRIDGE CONDITIONS
21%Functionally
Obsolete (1082)
70%Good(3618)
9%Structurally
Deficient (489)
Total Number of State and Town Bridges Inspected by Bridge Safety – 5189*
Notes: Structurally Deficient Bridge – has at least one major structural component (deck, superstructure, or substructure) rated in poor or worse condition or is not capable of carrying all legal loads. Functionally Obsolete Bridge – does not meet current functionality criteria (ex: substandard vertical or lateral clearances). *The number of bridges listed as inspected above differs from the total number of bridges as listed on page 11 as the railroad bridges are now inspected by the Bureau Public Transportation
Source: ConnDOT, Bridge Safety 2007 The number of bridges in the inventory is subject to periodic
changes.

13
SPECIAL TRANSPORTATION FUND (STF) - 2007
STF REVENUES -- $1,109.1 million* Motor Fuels Tax --------------------$478.3 million Motor Vehicle Receipts ------------$224.7 million Licenses, Permits, and Fees ------$170.5 million Sales Tax (DMV) ---------------------$67.9 million Interest Income ----------------------$46.0 million Various Other**--------------$121.7 (Net) million *Values may not add up do to rounding. ** Total reflects a $20.3 million deduction that was transferred from STF to other funds
STF EXPENDITURES -- $1,038.8 million Debt Service ------------------------$416.3 million ConnDOT ----------------------------$423.1 million DMV ------------------------------------$59.1 million Various Other -----------------------$140.3 million
Source: ConnDOT Official Statement: STOB 2007 Series A

14
Federal65%
Appropriations2%
State Bonds33%
CAPITAL PROGRAM FUNDING SFY2009
Funding for Capital Projects SFY2009 Budget (SFY2009) Total = $960 Million
Source: Bureau of Finance & Administration. Data based on State Fiscal Year. These figures do not include the Governors Transportation Initiatives of 2005 & 2006. Graphic revised as of August 2008
State

15
2007 FEDERAL HIGHWAY AND TRANSIT FUNDS
HIGHWAY (Federal Highway Administration “FHWA”)Bridge Rehabilitation & Replacement …. $148,829,355 Congestion Mitigation & Air Quality .….. $43,436,932 High Priority Projects ……………………….. $37,717,760 Interstate Maintenance …………..…….….. $63,138,272 National Highway System……….……..….. $58,534,611 Recreational Trails……………………………. $600,000 Surface Transportation Program ……….. $73,647,512 Safe Routes To School …………………..... $1,332,573 Subtotal – Published Categories…. $427,237,015 Subtotal – Other Categories……….. $90,942,841 Total ……………………………….. $518,179,856 TRANSIT (Federal Transit Administration “FTA”) Sec. 5307 Capital ……………………………… $74,624,442 Sec. 5309 Fixed Guideway (Federal)……… $44,235,684 Sec. 5309 New Starts …………………………… $15,681,600 Sec. 5310 Capital ………………………………… $1,320,000 Sec. 5311 Capital & Operating ……………… $2,466,986 Sec. 5316 Job Access & Reverse Commute.. $1,182,172* Sec. 5317 New Freedom……………………….... $971,833*
Total …………………………….. $140,482,717 *Sections 5316 and 5317 are now apportioned by urbanized area as shown in the table below. Urbanizes Area 5316 5317 Bridgeport/Stamford $274,601 $237,663 Hartford $331,675 $246,950 New Haven $211,127 $150,505 Less than 200,000 $294,526 $263,340 Less than 50,000 $70,243 $73,375
Source: ConnDOT, Bureaus of Policy and Planning and
Public Transportation

16
RAIL AND BUS SERVICES
CONNECTICUT’S BUS AND RAIL TRANSPORTATION SYSTEM CONSISTS OF: RAIL SERVICE Two Commuter Rail Lines: Shore Line East
New Haven Line (also includes 3 branch lines -- New Canaan, Danbury, and Waterbury).
Intercity Passenger Rail Service: Amtrak LOCAL BUS SERVICE CTTRANSIT – State-owned and the largest bus transit operation in CT. CTTRANSIT’s Eight Bus Divisions:
Hartford, New Haven, Stamford, Waterbury, New Britain, Bristol, Meriden, and Wallingford.
PARATRANSIT SERVICES Mandated by the Americans with Disabilities Act of 1990 (ADA.) Provided in all areas with fixed route services. COMMUTER EXPRESS BUS SERVICES Services provided by CTTRANSIT, Peter Pan, DATTCO, Post Road States, and Kelly Transportation. RIDESHARING ConnDOT provides employer and employee support for alternatives to driving alone – including Easy Street vanpools, NuRide carpools, Telecommute Connecticut, statewide bus and rail information, and the Commuter Tax Benefit.

17
PUBLIC TRANSPORTATION ASSETS
Rail Assets 267 - Passenger Rail Cars 24 - Locomotives 42 - Rail Stations 2 - Rail Maintenance Facilities Bus Assets 651 - Transit Buses 9 - Bus Maintenance Facilities Commuter Assets 183 - Commuter Parking lots representing 16,500 parking spaces (151 State Owned, 32 Leased by State)

18
PUBLIC TRANSPORTION STATE OPERATING BUDGET
Bus52.58%
$96,368,964
Rail36.70%
$66,394,027
ADA9.90%
$17,970,257 Dial-A-Ride0.32%
$576,361
Dialysis0.5%
$70,530
Source: ConnDOT, Bureau of Public Transportation
Fiscal Year 2007 Operating Appropriations -- $181,380,139
19
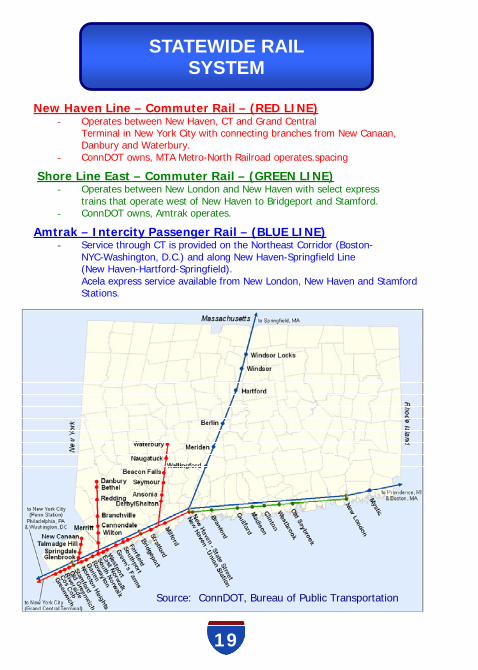
STATEWIDE RAIL SYSTEM
Source: ConnDOT, Bureau of Public Transportation
New Haven Line – Commuter Rail – (RED LINE) - Operates between New Haven, CT and Grand Central
Terminal in New York City with connecting branches from New Canaan, Danbury and Waterbury.
- ConnDOT owns, MTA Metro-North Railroad operates.spacing
Shore Line East – Commuter Rail – (GREEN LINE) - Operates between New London and New Haven with select express
trains that operate west of New Haven to Bridgeport and Stamford. - ConnDOT owns, Amtrak operates.
Amtrak – Intercity Passenger Rail – (BLUE LINE) - Service through CT is provided on the Northeast Corridor (Boston-
NYC-Washington, D.C.) and along New Haven-Springfield Line (New Haven-Hartford-Springfield). Acela express service available from New London, New Haven and Stamford Stations.

20
SHORE LINE EAST
Annual Passenger Trips……………….……….483,700 Expenses …………..………..…………….. $10,915,499 Revenue (farebox & other)…………………..$1,342,213 Net Deficit (expenses minus revenue) …... $9,573,286 ConnDOT Share …………………….…..…. $9,573,286 Cost Per Passenger ………………….……..……$23.40 Deficit Per Passenger …………………...……. $20.53 Operating Ratio (total revenue/total expenses)…12.30% Service Summary: 24 push-pull coaches, 8 locomotives serving 9 CT stations in 8 towns; 21 weekday trains.
Annual Passenger Trips……………………36,300,000 Expenses ……………………..…………. $328,268,346 Revenue (fare box & other)………..……...$240,851,822 Net Deficit (expenses minus revenue) ….…$87,416,524 ConnDOT Share ………………………..….$55,833,350 NY Share ………………………………..…$31,583,174 Cost Per Passenger …………..………………..….$9.25 Deficit Per Passenger …….…….………………...$2.46 Operating Ratio (total revenue/total expenses) .….73.37% Service Summary: 344 Multiple-Unit Electric Cars (185 CT owned), 36 push-pull coaches, 10 locomotives serving 36 CT stations in 22 towns; 266 weekday trains, 169 Saturday trains, 139 Sunday and holiday trains.
NEW HAVEN LINE
CONNECTICUT COMMUTER RAILS

21
STATEWIDE BUS SYSTEM
TOTAL BUS TRANSIT* Annual Passenger trips ……………… 36,886,811 Expenses ……………………………..... $160,636,840 Revenue ………………………......……. $39,712,477 Net Deficit (expenses minus revenue) . $120,924,363 ConnDOT's Share ………………......... $114,986,112 Cost per passenger……………………. $4.35 Deficit per passenger ………………… $3.28 Operating Ratio ……………………..… 24.72%
.
* Includes: CTTransit, Express Bus, Transit Districts, ADA, Dial-a-Ride, and Shuttle Services.
Source: ConnDOT, Bureau of Public Transportation

22
STATEWIDE AVIATION
BRADLEY INTERNATIONAL AIRPORT - ConnDOT’s Bureau of Aviation and Ports responsible for operations of the Airport. - Second largest airport in New England. - Includes 15 airlines, including 2 low fare carriers - Occupies 2,358 acres of land. - 34th busiest airport in the United States for cargo. - On-airport air cargo warehouse space totals 446,000 sq. ft. - 39 nonstop destinations, 119 daily departures, 11,801 daily departure seats (2007). - Ranked 51st* busiest airport in United States for passenger travel. - There are 30,000 General Aviation aircraft operations each year. - There are 2 FBO’s & two Military Facilities located on the airport. - Approximately 6,000 military operations each year. - 80 Based corporate & General Aviation aircraft (28 jets) *Ranked by ACI – Airports Council International Passenger Statistics for 2007: Enplanements: 3,264,387 Deplanements: 3,254,794 Total: 6,519,181 Mail and Freight for 2006: 168,575 metric tons
Source: ConnDOT, Bureau of Aviation and Ports

23
AVIATION AND WATERWAY SERVICES
Source: ConnDOT, Bureau of Aviation and Ports
STATE-OWNED HISTORIC RIVER FERRIES Chester-Hadlyme Ferry – The Selden III Ferry began service in 1769 and provides a convenient, direct link between Chester & Hadlyme at Route 148 across the Connecticut River. Rocky Hill-Glastonbury Ferry – The nation’s oldest continually operating ferry service began in 1655 across the Connecticut River between Rocky Hill and Glastonbury. MAJOR MUNICIPAL AIRPORTS Tweed – New Haven Airport - Commercial and General Aviation Danbury – Municipal Airport – General Aviation Meriden – Markham Municipal Airport –General Aviation Sikorsky Memorial Airport – General Aviation
STATE AIRPORTS Bradley International Airport - State’s Primary air carrier facility. Commercial & General Aviation. Danielson Airport – General Aviation. Groton – New London Airport – Commercial & General Aviation. Hartford – Brainard Airport – General Aviation. Waterbury – Oxford Airport – General Aviation. Windham Airport – General Aviation. DEEP WATER PORTS New London State Port Complex - Located in New London Harbor. Two 1,000-foot long cargo piers operated by ConnDOT. Port of Bridgeport Port of New Haven

24
ACCIDENT STATISTICS INCIDENT MANAGEMENT
CONNECTICUT ACCIDENT STATISTICS (2006)
Causes of Accident: • Following too close (34.1%) • Failure to yield the right-of-way (18.3%) • Speed too fast for conditions (10.8%) • Driver lost control (9.6%) Economic Cost for Crashes on Highways: • Over $2 billion or $616 per CT resident. Work Zone Crashes: 747 Motor Vehicle Traffic Fatalities: • 311 motor vehicle traffic fatalities in the State. • 43% of fatalities were estimated to be alcohol related. • 36% of fatalities were estimated to have a high blood alcohol
level (BAC) of .08% or higher in the crash.
INCIDENT MANAGEMENT
CT Highway Assistance Motorist Patrol – (CHAMP)
Existing: • 9 Service Patrol Vehicle Routes • Coverage areas: I-95 Greenwich to North Stonington, I-91
Middletown to Windsor Locks, I-84 Farmington to Vernon. • $2.43 million – Estimated Annual Operating Cost
Planned: • 6 additional Service Patrol Vehicle Routes • Coverage areas: I-395 East Lyme to Norwich, I-84 Danbury
to Waterbury, Route 15 Greenwich to Stratford • $1.62 million – Estimated Annual Operating Cost
Current DOT Assistance Calls (existing service patrols) 620 average per month – Newington Operations Center 900 average per month – Bridgeport Operations Center

25
REGIONAL PLANNING AND COORDINATION
Capitol Region Council of Governments 241 Main Street, Fourth Floor Hartford, CT 06106 Phone: 860-522-2217; Fax: 860-724-1274; www.crcog.org Serving: Andover, Avon, Bloomfield, Bolton, Canton, East Granby, East Hartford, East Windsor, Ellington, Enfield, Farmington, Glastonbury, Granby, Hartford, Hebron, Manchester, Marlborough, Newington, Rocky Hill, Simsbury, Somers, South Windsor, Suffield, Tolland, Vernon, West Hartford, Wethersfield, Windsor, and Windsor Locks. Central Connecticut Regional Planning Agency 225 North Main Street, Suite 304 Bristol, CT 06010-4993 Telephone: 860-589-7820; Fax: 860-589-6950; www.ccrpa.org Serving: Berlin, Bristol, Burlington, New Britain, Plainville, Plymouth, and Southington. Connecticut River Estuary Regional Planning Agency 455 Boston Post Road, P.O. Box 778 Old Saybrook, CT 06475 Telephone: 860-388-3497; Fax: 860-395-1404; www.crerpa.org Serving: Chester, Clinton, Deep River, Essex, Killingworth, Lyme, Old Lyme, Old Saybrook, and Westbrook. Council of Governments of the Central Naugatuck Valley 60 North Main Street, Third Floor Waterbury, CT 06702-1403 Telephone: 203-757-0535; Fax: 203-756-7688; www.cogcnv.org Serving: Beacon Falls, Bethlehem, Cheshire, Middlebury, Naugatuck, Oxford, Prospect, Southbury, Thomaston, Waterbury, Watertown, Wolcott, and Woodbury. Greater Bridgeport Regional Planning Agency Bridgeport Transportation Center 525 Water Street Bridgeport, CT 06604-4902 Telephone: 203-366-5405; Fax: 203-366-8437; www.gbrpa.org Serving: Bridgeport, Easton, Fairfield, Monroe, Stratford, and Trumbull.

26
REGIONAL PLANNING AND COORDINATION
Housatonic Valley Council of Elected Officials Old Town Hall 162 Whisconier Road Brookfield, CT 06804 Telephone: 203-775-6256; Fax: 203-740-9167; www.hvceo.org Serving: Bethel, Bridgewater, Brookfield, Danbury, New Fairfield, New Milford, Newtown, Redding, Ridgefield, and Sherman. Litchfield Hills Council of Elected Officials 42 North Street, P.O. Box 187 Goshen, CT 06756 Telephone: 860-491-9884; Fax: 860-491-3729; [email protected] Serving: Barkhamsted, Colebrook, Goshen, Hartland, Harwinton, Litchfield, Morris, New Hartford, Norfolk, Torrington, and Winchester. MidState Regional Planning Agency 100 DeKoven Drive, P.O. Box 139 Middletown, CT 06457 Telephone: 860-347-7214; Fax: 860-347-6109; www.midstaterpa.org Serving: Cromwell, Durham, East Haddam, East Hampton Haddam, Middlefield, Middletown, and Portland. Northeastern Connecticut Council of Governments 125 Putnam Pike (Route 12) P.O. Box 759 Dayville, CT 06241-0759 Telephone: 860-774-1253; Fax: 860-779-2056; [email protected] Serving: Brooklyn, Canterbury, Eastford, Killingly, Plainfield, Pomfret, Putnam, Sterling, Thompson, Union, and Woodstock. Northwestern Connecticut Council of Governments 17 Sackett Hill Road Warren, CT 06754 Telephone: 860-868-7341; Fax: 860-868-1195; [email protected] Serving: Canaan, Cornwall, Kent, North Canaan, Roxbury, Salisbury, Sharon, Warren, and Washington.

27
REGIONAL PLANNING AND COORDINATION
South Central Regional Council of Governments 127 Washington Avenue, 4th Floor West North Haven, CT 06473-1715 Telephone: 203-234-7555; Fax: 203-234-9850; www.scrcog.org Serving: Bethany, Branford, East Haven, Guilford, Hamden, Madison, Meriden, Milford, New Haven, North Branford, North Haven, Orange, Wallingford, West Haven, and Woodbridge. Southeastern Connecticut Council of Governments 5 Connecticut Avenue Norwich, CT 06360-4592 Telephone: 860-889-2324; Fax: 860-889-1222 www.seccog.org Serving: Bozrah, Colchester, East Lyme, Franklin, Griswold, Groton, Ledyard, Lisbon, Montville, New London, North Stonington, Norwich, Preston, Salem, Sprague, Stonington, Voluntown, and Waterford. South Western Regional Planning Agency 888 Washington Boulevard – 3rd Floor Stamford, CT 06901 Telephone: 203-316-5190; Fax: 203-316-4995; www.swrpa.org Serving: Darien, Greenwich, New Canaan, Norwalk, Stamford, Weston, Westport, and Wilton. Valley Council of Governments Derby Railroad Station 12 Main Street Derby, CT 06418 Telephone: 203-735-8688; Fax: 203-735-8680; www.valleycog.org Serving: Ansonia, Derby, Seymour, and Shelton. Windham Region Council of Governments 700 Main Street Willimantic, CT 06226-2310 Telephone: (860) 456-2221, Fax: (860) 456-1235 www.wincog.org Serving: Ashford, Chaplin, Columbia, Coventry, Hampton, Lebanon, Mansfield, Scotland, Willington, and Windham.
28
PUBLIC TRANSPORTATION PROVIDERS
For General Information: www.ctrides.com CTTransit - www.cttransit.com Hartford 860-525-9181 New Haven 203-624-0151 Stamford 203-327-7433 Waterbury 800-753-2538 New Britain/Bristol 860-828-0511 Meriden/Wallingford 800-704-3113 DATTCO 800-229-4878 CTTransit Commuter Express 860-525-9181 TRANSIT DISTRICTS: Estuary Transit District; www.estuarytransit.org Telephone: 860-395-0891 Greater Bridgeport Transit Authority; www.gbtabus.com Telephone: 203-333-3031; Paratransit: 203-579-7777 Greater Hartford Transit District; www.hartfordtransit.org Telephone: 860-247-5329, Paratransit Ext. 3011 Greater New Haven Transit District; www.gnhtd.org Telephone: 203-288-6282 Greater Waterbury Transit District; www.gwtd.org Telephone: 203-573-8627 Housatonic Area Regional Transit (HART); www.hartct.org Telephone: 203-748-2034; Paratransit: 203-748-2511 Middletown Area Transit District (MAT); www.middletownareatransit.org Telephone: 860-346-0212; Paratransit: 860-347-7657 Milford Transit District; www.milfordtransit.com Telephone: 203-874-4507; Paratransit: 203-874-4507, Ext. 2 Northeastern Connecticut Transit District Telephone: 860-774-3902 Northwestern Connecticut Transit District; www.nwcttransit.org Telephone: 860-489-2535 Norwalk Transit District; www.norwalktransit.com Telephone: 203-852-0000; Paratransit: 203-299-5180 Southeast Area Transit District (SEAT); www.seatbus.com Telephone: 860-886-2631; Paratransit: 860-439-1207 Valley Transit District (VTD); www.invalley.org/vtd Telephone: 203-735-6824; Paratransit: 203-735-6824 Windham Region Transit District (WRTD); www.wrtd.net Telephone: 860-456-2223; Paratransit: 860-456-1462
29
STATE AND FEDERAL CONTACTS
Connecticut Department of Transportation 2800 Berlin Turnpike Newington, CT 06131-7546 Telephone: 860-594-2000; Fax: 860-594-3008 www.ct.gov/dot U.S. Department of Transportation/CT Federal Highway Administration (FHWA) 628-2 Hebron Avenue, Suite 303 Glastonbury, CT 06033-5007 Telephone: 860-659-6703, Ext. 3009; Fax: 860-659-6724 www.fhwa.dot.gov Federal Transit Administration (FTA)/CT - Region 1 55 Broadway, Suite 920 Cambridge, MA 02142 Telephone: 617-494-2055; Fax 617-494-2865 www.fta.dot.gov Federal Transit Administration (FTA)/CT - Region 2 One Bowling Green – Rm 429 New York, NY 10004-1415 Telephone: (212) 668-2170 Fax: (212) 668-2136 www.fta.dot.gov Federal Railroad Administration (FRA)/CT 1120 Vermont Avenue, N.W. Washington, D.C. 20590 Telephone: 202-493-6000; www.fra.dot.gov Department of Motor Vehicles 60 State Street Wethersfield, CT 06161 Telephone: 800-842-8222; www.ct.gov/dmv Bradley International Airport Schoephoester Road Windsor Locks, CT 06096 Telephone: 888 624-1533; www.bradleyairport.com Metro-North Railroad Telephone: 800-METRO-INFO; www.mta.info/mnr Shore Line East Railroad Telephone: 800-ALL-RIDE; www.shorelineeast.com AMTRAK Telephone: 800-USA-RAIL (1-800-872-7245) www.amtrak.com

30
STATE AND FEDERAL CONTACTS
Danielson Airport Department of Transportation P.O. Box 317546 Newington, CT 06131 Attention: Matthew J. Kelly Telephone: 860-594-2534
Groton-New London Airport 155 Tower Avenue Groton, CT 06340 Telephone: 860-445-8549; www.grotonnewlondonairport.com Hartford-Brainard Airport (HFD) 233 Maxim Road Hartford, CT 06114 Telephone: 860-566-7037 Waterbury-Oxford Airport (OXC) 300 Christian Street Oxford, CT 06483 Telephone: 203-264-8010 Windham Airport (IJD) Department of Transportation P.O. Box 317546 Newington, CT 06131 Attention: Matthew J. Kelly Telephone: 860-594-2534 ConnDot Commuter Services In Fairfield County: Telephone: 1-800-FIND-RIDE In Greater New Haven and Waterbury Telephone: 1-800-ALL-RIDE In Greater Hartford and New London Telephone:1- 800-972-EASY www.ctrides.com Park & Ride Lots; www.ct.gov/dot/cpw Bike to Work (Capitol Region); www.crcog.org/Bicycle.htm