STATE EDUCATION SECTOR STRATEGIC PLAN (SESP) 2013 – 2022 · CBO Community Based Organization ....
182
1 FEDERAL REPUBLIC OF NIGERIA JIGAWA STATE STATE EDUCATION SECTOR STRATEGIC PLAN (SESP) 2013 – 2022 May 2013
Transcript of STATE EDUCATION SECTOR STRATEGIC PLAN (SESP) 2013 – 2022 · CBO Community Based Organization ....

1
FEDERAL REPUBLIC OF NIGERIA JIGAWA STATE
STATE EDUCATION SECTOR STRATEGIC PLAN (SESP)
2013 – 2022
May 2013

2
CONTENTS CONTENTS ............................................................................................................................................ 2
PREAMBLE ............................................................................................................................................ 4
ACRONYMS AND ABBREVIATIONS ............................................................................................... 5
EXCUTIVE SUMMARY ....................................................................................................................... 7
SECTION ONE ....................................................................................................................................... 9
INTRODUCTION .............................................................................................................................................. 9 1.1 Purpose of SESP ........................................................................................................................................... 9 1.2 Process of SESP ......................................................................................................................................... 10 1.3 Structure and Content of SESP................................................................................................................... 11
SECTION TWO .................................................................................................................................... 12
JIGAWA STATE: BACKGROUND INFORMATION/EDUCATION SECTOR HIGHLIGHTS ..... 12
2.1 Political, Economic and Social Context ..................................................................................................... 12 2.1.1. Geography ......................................................................................................................................... 12 2.1.2. The People ......................................................................................................................................... 13 2.1.3. Political and Administrative Structure ............................................................................................... 15 2.1.4. Economy and Socio-economic Development Goals .......................................................................... 16
2.2 Education Policy Environment ................................................................................................................... 17 2.2.1. Education Policy Development Framework ...................................................................................... 17 2.2.2. Structure and Management of Educational System ........................................................................... 18 2.2.3. On-going Education Policy Initiatives ............................................................................................... 21
2.3 Education Sector Highlights ....................................................................................................................... 24 2.3.1. Access and Equity ............................................................................................................................. 25 2.3.2. Quality and Relevance ....................................................................................................................... 36 2.3.3 Partnerships and Private Sector Participation ................................................................................ 42 2.3.4. Infrastructural Facilities................................................................................................................. 42 2.3.5. Higher Education ............................................................................................................................... 43 2.3.6.Cost and Financing ............................................................................................................................. 45
SECTION THREE: POLICY AND STRATEGIC FRAMEWORK .................................................... 54
3.1 Key Policy Directions ................................................................................................................... 54
SECTION FOUR: MANAGEMENT AND IMPLEMENTATION FRAMEWORK .................................... 70
4.1 Performance Target and Indicators ................................................................................................ 70 4.2 Implementation and Coordination ................................................................................................. 79 4.3 Implementation of SESP intails implications which implied gains & challenges ............................ 80 4.4 RISKS AND CHALLENGES OF IMPLEMENTING SESP ........................................................ 80 4.5 CONSTRAINTS AND CHALLENGES IN ACHIEVING THE DESIRED OBJECTIVES .................................... 81 4.6 MITIGATION OF RISKS, CHALLENGES AND CONSTRAINTS ........................................... 82 4.7 EXPECTATIONS FROM JIGAWA STATE COLLEGE OF EDUCATION .............................. 87 4.8 FUNCTIONS OF STATE EDUC. INSPEC. & MON. UNIT FOR QA ...................................... 88 4.9 ROLES OF FME IN IMPLEMENTATION SESP ...................................................................... 89 4.10 COST AND FINANCIAL IMPLICATIONS ................................................................................ 89

3
ANNEXES ............................................................................................................................................ 96
Annex A: State Education Statistics ....................................................................................................... 96
Annex B Epssim Simulation Result .................................................................................................... 103
Annex C GLOSSARY OF SELECTED TERMS USED IN THIS DOCUMENT ............................................. 180

4
PREAMBLE The State Education Sector Strategic Plan (SESP) is an attempt to articulate the Education Vision of the State Government. It helps to give some tangible and concrete directions to Government’s determination to address the challenges posed by the current uninspiring state of the education sector and education service delivery. The programme was developed through a participatory process effectively led by the Government and people of the State. It was a process that involved the active participation of multiple stakeholder groups, all of whom contributed to rigorously analysing the present state of education and in charting the course of future developments. These future developments emphasize strategic targets to be met in a 10-year perspective: 2012-2022 – the SESP, which is anchored on four major pillars, called ‘Policy Objectives’, namely Policy Objective 1: Improving Access and Opportunities Policy Objective 2: Ensuring Quality and Relevance of Educational Provision Policy Objective 3: Improving Educational Planning and Management Policy Objective 4:Ensuring Sustainable Funding and Improved Financial Management. Coming along with this is a more detailed three-year State Education Sector Operational Plan (SESOP). This outlines plan implementation directions for 2014-2016, with cost implications. The plan is the result of fruitful collaboration efforts between the State Government, UNICEF and the Department for International Development (DFID) of the British Government. Field work and plan development activities were coordinated by the SESP/SESOP Development Team in conjunction with consultancy support on staff capacity building and advice advise. UNESCO lent valuable technical/professional support in the process. Above all, with the emergence of SESP and SESOP, the State Government now has a well thought-out road map for its continuing vigorous pursuit of educational development for the next decade. Both documents are expected to be integrated into the overall planning and budget activities of the State. It can also provide a valuable framework for policy dialogues with the populace as well as for negotiations with development partners

5
ACRONYMS AND ABBREVIATIONS ABU, Zaria Ahmadu Bello University, Zaria AEO Access and Expanding Opportunity AEO Access and Expanding Opportunity AME Agency of Mass Education ANE Agency for Nomadic Education BUK Bayero University, Kano CBN Central Bank of Nigeria CBO Community Based Organization CCT Conditional Cash Transfers CLIS College of Legal and Islamic Studies COA College of Agriculture COE College of Education CPA Certificate in Public Administration CPAA Certificate in Auditing and Accounting CSC Civil Service Commission DFID Department for International Development (UK) DPA Diploma in Public Administration DPAA Diploma in Public Accounting and Administration DPRS Director of Planning Research and Statistics ECCC Early Child Care Centres ECCD Early Child Care Development EDF Education Funding EDSI Education Strategy International EFA Education for All EMIS Education Management and Information System ETF Education Trust Fund FBOs Faith Based Organization FME Federal Ministry of Education GEP Girls Education Project GPE Global Partnership for Education HND Higher National Diploma ICT Information and Communication Technology IDPs International Development Partners IEB Islamic Education Bureau IQTE Integrated Qur’anic Tsangaya Education JAMB Joint Admission and Matriculation Board JERD Jigawa Educational Resource Department JSCILS Junior State College of Islamic and Legal Studies JSEEDS Jigawa State Economic Empowerment and Development Strategy JSS Junior Secondary School JSSB Jigawa State Scholarships Board LGCs Local Government Councils LGEAs Local Government Education Authorities MOEST Ministry of Education Science and Technology MOHSW Ministry of Health and Social Welfare MOW & U Ministry of Works MOWA Ministry of Women Affairs NABTEB National Business and Technical Examination Board

6
NBTE National Board for Technical Education NCCE National Commission for Colleges of Education NCE National Certificate of Education ND National Diploma NECO National Examination Council NERDC National Education Research and Development Council NFE Non Formal Education NGOs Non Governmental Organizations NIEPA National Institute for Educational Planning and Administration NUT National Union of Teachers NYSC National Youth Service Corp PME Planning and Management of Education PRS Planning Research and Statistics PTA Parents Teachers Association QTR Quality and Relevance of education provision SBMCs School Based Management Committees SEIMU State Educational Inspectorate and Monitoring SSCE Senior Secondary Certificate Examination SSG Secretary to the State Government SSS Senior Secondary School STSB Science and Technical Schools Board SUBEB State Universal Basic Education Board TIA Teaching Inducement Allowance UBEC Universal Basic Education Commission UNESCO United Nations Educational, Scientific and Cultural Organization UNICEF United Nations Children’s Fund UNIMAID University of Maidugiri WAEC West African Examination Council WASCE West African School Certificate Examination ZEO Zonal Education Office

7
EXCUTIVE SUMMARY From the date of the state inception 1991 to date, the Education sector runs through some hurdles of which the whole agencies under the MoEST play significant role to meet the desired goals. Before the coming of the present government (2007 to date), the sector has been rated as having poor educational indicators, condition of infrastructure and facilities, inadequate funding to the sector, poor learning outcomes, inadequate schools supervisors to monitor learning achievements and limited capacity to the state tertiary institutions just to mention but few. Consequently, the sector has needed to develop and adopt a distinctive approach to a very good plan/policy making. This was made by the sector collaboration i.e. DFID/UNICEF in conjunction with the State Government to revitalize the sector to another step forward in transforming local system budgeting into the new system which is transparent and result-based. This education sector plan has categorically spelt the distinctive measure of approach to the existing problems in finding the remedy.
A) In section one, the context analysis identified:- i. The state background which explained:-
The location and topography of the state; The population rate of the state; The socio-cultural situation of the state; Human development indicators and poverty situation; The government itself; Trading and commercial activities of the people; Traditional institution; Economy Micro economy/fiscal profile.
ii. Also it shows the State policy Framework: The education policy of the state effected by national and international environments such as Millennium Development Goals MDGs, NEED, EFA, CDF as well as SEEDS all these organs were partner in collaboration with the state education policy.
iii. Analysis of cost and finance to enable and expand education coverage, especially for disadvantage group and where possible needed.
iv. Education system`s performance: the challenges facing the education sector are daunting and demand careful planning with limited resources available.
B) This section significantly hints the policy priorities, the strategies and planned target. Under this, we have:- The state vision and mission statement; Education sector policy environment Strategic framework for MOEST and SUBEB; Local Government education authority planned; Education Management: This issue talks on free education for Girls at all
levels, Free Education for the Physically Challenged, Free Medical Treatment For all Boarding Student, Increase Boarding Students` Feeding Rate Teaching Inducement Allowance, Recruitment of Qualified Teachers, Capacity Building, Increase of Scholarship Allowance, Decongesting Classrooms, Enhancing

8
Quality Assurance and Evaluation functions through State Educational Inspectorate and Monitoring Unit (SEIMU); zonal Education Offices, payment of Examination Frees, purchase of Instructional Materials to mention just a few.
C) The Third section explained the programme design in the sector. This action goes along with:-
Suggested solution to constrains highlighted; Reform programmes; Integrated school development; School Improvement programme (SIP); Access and equity programme; School Based Management Committee (SBMC) role; LGA/MDG programme; Decentralization of budgetary functions for school and the role of the LGEAs Education Management Information Systems. Annual School Census Data Management Process D) The Fourth section gives details on the implementation Arrangement and Capacity,
under which:- Organisation Structure of Education; funding Status of Education Sector MDAs; financial Management System which spelt out the general Expenditure, Recurrent
Expenditure, General Financial Reporting, General Financial Reporting, Stores, Internal Audit and Pay Roll. Furthermore, the forthsection granted the whole information of fund flow situation and how the fund had been utilized in financial education activities. Under this umbrella, we have:- Source of funding from this State and Local Government; Budget Implementation; Education Expenditure by Sub-sectors; Finally, to ensure the success and attainment of ESP programme, all stakeholders must put hand on deck to achieve the desired goals.

9
SECTION ONE
INTRODUCTION
1.1 Purpose of SESP Jigawa state was created in 1991 from the least developed part of the then Kano State on a weak economic and infrastructural foundation. According to the 2006 Census, Jigawa State has a population of 4.35m people, majority of which live in rural areas with subsistence agriculture as their main occupation. The 2006 Central Bank of Nigeria (CBN) Report ranked the state as having the highest severity of poverty in the country, with 90% of its people living below poverty line i.e. on less than one US dollar per day. Paucity stands out clearly as the major challenge to all sectors of the state. Educationally, the state is among those referred to as ‘educationally disadvantaged’ states in the Federation. Against this backdrop successive governments’ efforts have been geared towards poverty alleviation through pro-poor socio-economic empowerment reforms. The Jigawa State Economic Empowerment and Development Strategy (J-SEEDS) 2004 has been the main policy document of the government and placed high premium on people through pursuit of policies and programmes centred on human capital development. In the J-SEEDS education is identified as the number one pillar or backbone to the socio-economic development of the State. This is based on the conviction that there is strong correlation between educational attainment of individuals and per-capita formation. The resolve to accord the education sector the highest priority is informed by this reality. Deliberate efforts were made to widen access and equity as well as to improve the quality of schooling at all levels of education in the state. With education made free at all levels for the female and the physically challenged, it is envisaged that enrolment of these two categories of learners will drastically improve. Other measures like increasing both boarding students feeding rate and tertiary students’ allowances by 100% will, in the long run, have positive impact on quality of teaching-learning. The re-establishment of nine Zonal Education Offices and the existence of fully-equipped autonomous Parastatals of the Ministry would strengthen the management of education. In spite of the efforts made by various governments, problems still abound in almost all the areas of the state’s education services. The deplorable state has been attributed mainly to the following reasons: The economic situation of its population is poor with the highest severity and poverty
status in the country as cited above. The State is one of the most educationally backward states in the Federation. There has never been any existing and foolproof strategic plan for education in the
state. The Government has invested so much human and financial resources in the education
sector without much positive results.
Therefore the decision to review the 10-year State Education Sector Strategic Plan (SESP) and 3-year Operational Plans (SESOP) at this point in time is well sought-after. This document provides an Education Sector Plan for Jigawa state for the period 2013 to 2022, together with an operational plan covering the first phase of three years 2014-2016. This sector-wide plan is intended to demonstrate Jigawa state’s commitment and endeavour

10
towards achieving the Education for All (goals) by 2016 and to serve as a base document which will guide the Ministry of Education, Science and Technology’s strategy, programme and budget formulation.
1.2 Process of SESP The SESP process started in April 2008 at Gumel where the programme was formally launched with key stakeholders in attendance. SWOT Analysis of the education sector was carried out as a way of establishing consensus to the strengths, weaknesses, opportunities and threats facing the sector. This plan was developed through participatory process. It was developed with full participation of people in the state as stakeholders. There was also a high level committee headed by the Secretary to the State Government (SSG), and a core Technical Committee and co-opted members. The plan preparation was further supported by Federal Ministry of Education (FME), National Institute for Educational Planning and Administration (NIEPA), Education Strategy International (EDSI), UK Department for International Development (DFID), UNICEF and UNESCO. The SWOT analysis was used to examine the sector under the sub-headings of Policy Environment; Access and Equity; Quality and Relevance; Teaching and Learning; Infrastructure and Facility; Management and Efficiency; Resources and Financing. The result of the SWOT analysis led to the carrying out of the studies on 11 thematic areas, which were assigned to 11 study groups, improving the knowledge and information gaps. The result of the exercise together with the findings of State Education Sector Analysis (ESA) and profile of the State Education Sector Statistics, were later presented to another set of stakeholder consultations. The eleven studies conducted included: (i) On-going Government Initiatives; (ii) Externally Supported Interventions; (iii) Institutional Assessment; (iv) Curriculum Teaching and Learning Achievements; (v) Non Formal Education; (vi) Islamiyya Education; (vii) Private Sector Provision and Contribution; (viii) Educational Costing and Financing; (ix) Up-dating State EMIS; (x) Educational Infrastructure and Facilities; (xi) Special Education Needs. The ESA was carried out, building on these studies on eleven areas, the findings from field visits, working sessions in small and larger groups, the compilation of available statistical data (mainly EMIS), and a concise draft write-up on major highlights of education in the State. The ESA aimed to identify the strengths and possible shortcomings of the state education system, to discuss policy options and strategies and to appraise the resource implications of each strategy so as to adjust the targets accordingly. Through a series of stakeholder consultations, the findings of the field reports and studies were analysed and this led to the identification of priority areas to be tackled in the education sector. Technical workshops on educational planning, policy simulation and resource projections were held to discuss and devise on the policy options, priorities, strategies, resource implications and implementation frameworks for SESP and SESOP. The present document is the result of these participatory and technical processes. Many difficulties aroused in the course of these review processes, however contributing to increased ownership and capacity building of the state team in the field of education planning and management.This document is updated with current data to reflect the achievements of the first operational plan 2009-2012 and upon which further improvement will be built

11
1.3 Structure and Content of SESP This document, Jigawa State Education Strategic Plan (SESP) 2009-2018 now 2013 – 2022, is presented in three parts. The first part is an introductory that contains a Preamble which is an executive summary that also rationalizes the necessity of SESP and the methodology adopted for its development. A presentation of Acronyms, Abbreviations and Glossary of Selected Terms used in this document completes the first part. The second part is the main body of the document that has four sections, delineated as follows:
1. Section One: Introduction 2. Section Two: Jigawa State: Background Information and Sector Highlights 3. Section Three: Policy and Strategic Framework 4. Section Four: Management and Implementation Framework
The third and concluding part is the Annexure that contains annexes of relevant tables. Section one which is the Introduction to the main body of the document begins with a sub-section titled Purpose of SESP. It explains the necessity for the development and diligent implementation of Jigawa State SESP. It expresses the commitment of the state to SESP for the revamp of the education system to meet the challenges of its development goals and objectives. The next sub-section details the methodology and processes followed in SESP development. It stresses that the methodology and process followed emphasized wide stakeholders’ consultations and active participation to ensure that the people of the state can truly claim ownership and identify with SESP as actually people-developed and owned. Section Two gives background information on Jigawa state and explains the education policy environment, structure and management of the state’s education system. It describes the geography, people, economy, political system and administrative structure of the state. This section is concluded with the highlights of the state education sector. Backed with statistics from the state EMIS, it presents an analysis of main features, prevailing status, key issues and challenges. The analysis covered access and equity, quality and relevance of education provision, higher education, infrastructural facilities, partnerships, cost and financing of education. Section Three presents the policy and strategic framework of the Jigawa State Education Strategic Plan (SESP) 2013 – 2022. The section is introduced with the overall education policy thrust and a summation of the key policy directions of the state. The policy and strategic framework itself specifies the priority policy objectives, specific targets for each objective, strategies for achieving the set targets and the agencies responsible for delivering on the targets. It is presented in a matrix arranged in four policy objectives groups, namely:
Policy Objective 1: Improving Access and Expanding Opportunities Policy Objective 2: Ensuring Quality and Relevance of Education Provision Policy Objective 3: Improving Educational Planning and Management Policy Objective 4: Ensuring Sustainable Funding and Improved Financial Management.
Section Four is a presentation of the Management and Implementation Framework of SESP. The section specifies the performance targets and indicators as well as the monitoring and evaluation framework for assessing progress in the implementation of SESP. It also details the institutional arrangement to ensure effective coordination of the activities of responsible government Ministries, agencies, other stakeholders and partners in the implementation and monitoring of SESP. Finally, the section details the costs and financial implications of SESPs implementation.

12
SECTION TWO
JIGAWA STATE: BACKGROUND INFORMATION AND EDUCATION SECTOR HIGHLIGHTS
2.1 Political, Economic and Social Context
2.1.1. Geography Jigawa state is one of the thirty-six states that constitute the Federal Republic of Nigeria. The State was carved out from the least developed part of the former Kano State, on 27th August, 1991. The area is 23,154 square kilometres. It is situated in the north-western part of the country. Kano and Katsina states border Jigawa to the west, Bauchi state to the east and Yobe state to the northeast. To the north, Jigawa shares an international border with Republic of Niger, which is a unique opportunity for cross-border trading activities. The Government readily took advantage of this by initiating and establishing a free-trade zone at the border town of Maigatari (see Figure 2.1).
Most parts of Jigawa State lie within the Sudan Savannah with elements of Guinea Savannah in the southern part. Total forest in the State is very much below national average of 14.8%. Due to both natural and human factors, forest cover is being depleted, making northern parts of the State highly vulnerable to desert encroachment. The State enjoys vast fertile arable land to which almost all tropical crops could adapt, thus constituting one of its highly prized natural resources. The Sudan Savannah vegetation zone is also made up of vast grazing lands suitable for livestock production.
The main rivers are Hadejia, Kafin Hausa and Iggi Rivers with a number of tributaries feeding extensive marshlands in north-eastern part of the State. The Hadejia-Kafin Hausa River traverses the State from west to east through the Hadejia-Nguru wetlands and empties into Lake Chad Basin.
Figure 2.1: The Federal Republic of Nigeria

13
2.1.2. The People
According to the 2006 Census figures Jigawa State has a population 4,346,472, which ranks it to be the eighth in the country. The annual population growth is 2.8%. Life expectancy in Jigawa State as at 2001 was about 52 years with a total fertility rate of about 6.2 children per woman of childbearing age (a little above the national average). The population of the State is predominantly rural (90%) and the distribution in terms of sex is almost equal between male (50%) and female (49%). This pattern of population distribution is same across various constituencies in the State and between urban and rural areas. In terms of age distribution, the 2002 Core Welfare Indicators Questionnaire (CWIQ) Survey indicates that 45.2% of the population was made up of young people below the age of 15; 49.0% between the ages of 15 and 59, while 5.8% were people aged 60 and above.
Overall the age structure is typical of a developing country with a wide base and a very narrow top. The pyramid shows a very strong dependency ratio of 88.5%, that is, the relationship of the populations below 15 or above 64 to the productive population aged between 15 and 64.
Figure 2.2: Age Pyramid, 2006, Jigawa State
400,000 300,000 200,000 100,000 0 100,000 200,000 300,000 400,000
0 - 45 - 9
10 - 1415 - 1920 - 2425 - 2930 - 3435 - 3940 - 4445 - 4950 - 5455 - 5960 - 6465 - 6970 - 74
75+FemaleMale
Source: 2006 Population Census
Table 2.1 presents the aggregate numbers of school-age population; it also shows that males outnumber the female population.
Table 2.1: School-age population in Jigawa State, 2012 Male Female Total % Female Pre-Primary (4-5) 187,911 169,868 357,779 47.5% Primary (6-11) 452,057 419,505 871,562 48.1% JSS (12-14) 173,698 171,669 345,367 49.7% SSS (15-17) 145,332 167,743 313,075 53.6% HEIs (18-21) 161,818 214,419 376,237 57.0% Total 1,120,816 1,143,204 2,264,020 43.0%
Source: Adapted from 2006 (projected population figure) Nigeria Population Census

14
Figure 2.3: Jigawa Projected School Age Population to 2011
Average household size is about 6.7, almost all of which are headed by males. About 60% of household heads are self-employed with agriculture as their main occupation, and nearly two-thirds of these households are polygamous families. The overall literacy rate in any language is about 39.5% in 2006 (20.1% for women and 58.9% for men) according to CWIQ 2006. This rate is well below the national average 65.7% (56.8% for women and 74.6% for men). If the literacy rate is measured in English, this rate is only 11.1% (5.2% for women and 17% for men) in Jigawa state.

15
Figure 2.3: Poverty Incidence in Nigerian States, 2004 (%)
0
10
20
30
40
50
60
70
80
90
100B
enue
Kog
iK
war
aN
assa
raw
aN
iger
Plat
eau
FCT
Ada
maw
aB
auch
iB
orno
Gom
beTa
raba
Yob
eJi
gaw
aK
adun
aK
ano
Kat
sina
Keb
biSo
koto
Zam
fara
Abi
aA
nam
bra
Ebon
yiEn
ugu
Imo
Akw
a Ib
omB
ayel
saC
ross
Riv
erD
elta
Edo
Riv
ers
Ekiti
Lago
sO
gun
Ond
oO
sun
Oyo
North Central North East North West South East South South South West
Source: Poverty Profile for Nigeria, NLSS The socio-cultural situation in Jigawa State could be described as homogeneous. It is mostly dominated by Hausa/Fulani, who could be found in all parts of the State. Kanuri are largely found in Hadejia Emirate, with some traces of Badawa mainly in its north-eastern parts. Even though each of the three dominant tribes has continued to maintain its ethnic identity, Islam and a long history of inter-marriages have continued to bind them together. There are no precise figures available on household income. However, we can use the findings of the 2004 Nigeria Living Standard Study (NLSS1). According to NLSS 2004, Jigawa State has the highest incidence of poverty in Nigeria. Jigawa State counted, in 2004, 95% of poverty incidence when the national average percentage was of 54.4%. The worrying fact is that in 1996, the poverty incidence was reported as 71%; 8 years later poverty increased by 24 percentage points. Figure 2.3 shows poverty head count for all of the Nigerian States, grouped by geopolitical zones. We can see that Jigawa State clearly had the highest poverty incidence, not only within the North-West Zone, but in Nigeria.
2.1.3. Political and Administrative Structure Jigawa State is one of the thirty seven states and the Federal Capital Territory that form the Federal Republic of Nigeria. The state has twenty seven Local Government Areas (LGAs). The 27 LGAs are divided into 30 State Constituencies and grouped into 11 Federal Constituencies, and three Senatorial Districts. The State is governed by an Executive Council, with an elected Governor as the Chairman. The Executive Council is made up of the Governor, the Deputy Governor, the Commissioners
1 National Bureau of Statistics, Poverty Profile for Nigeria, 2005

16
of the fifteen Ministries and the Secretary to the State Government. Each of the twenty-seven Local Government Councils in the State is governed by a Local Government Executive Council with the Local Government Chairman as the head. Other members of the Executive Council include the Vice Chairman, four Supervisory Councillors and the Secretary of the local government who also serves as the Secretary to the Council. With the current presidential system of government which emphasizes the separation of powers between the three arms, the Legislative arm is headed by the Speaker as the chief executive. There are also the Deputy Speaker, the Majority and Minority leaders, Chief whips of both parties and other honourable members. The legislative structure is also extended to the local government level, where the legislature is headed by the leader of the House. The third arm of government is the Judiciary, which is headed by Chief Judge who is also the chairman of the Judicial Service Committee, a body which is responsible for the appointment, promotion and discipline of judicial officers.
2.1.4. Economy and Socio-economic Development Goals The economy of Jigawa State is largely characterized by informal sector activities, with agriculture as the major economic activity. Over 80% of the population is engaged in subsistence farming and animal husbandry. Trade and commerce are undertaken on small and medium scale, especially in agriculture livestock and other consumer goods. Other informal sector activities include blacksmithing, leather-works, tailoring services, auto repairs and many others. The formal sector activities like those of the Rice Mill at Hadejia and Flour Mill at Gumel are yet to make any impact on the economy of the state as they have been out of production for long. The overall development objectives and priorities of the State Government are contained in the J-SEEDS 2004 which is in line with the National Economic Empowerment and Development Strategy (NEEDS, 2004). The document emphasizes improving the standard of living of the people by pursuing pro-poor economic growth and social development policies. Specifically, these include: • The pursuit of poverty reduction through promotion of agricultural production and active
support for small and medium scale enterprises (SMEs), micro-enterprises and other income generating activities for self-employment and ultimate economic empowerment;
• Building a conducive investment climate in terms of institutions and infrastructure. This would involve massive resuscitation of dysfunctional infrastructure and the building of new ones particularly roads, power supply and others;
• Pursuing information and communication technology, and market infrastructure. This would also involve institutional reforms with focus on good governance and for effective and efficient institutions and processes;
• Exploiting human resources and social development involving the development of formal and non-formal education, provision of effective health, delivery water and sanitation.
The role of education in socio-economic development: Studies have indicated that there is a direct causal relationship between education and socio-economic development in any society. The objective of Jigawa State Government on education is to empower the entire population through improved and non-discriminate access to quality education, which will enable

17
everyone to be productive member of the society and to contribute to social transformation. Therefore, Jigawa State Government believes that, improving the quality of education at all levels is the fastest way to human capital formation and sustainable development.
2.2 Education Policy Environment
2.2.1. Education Policy Development Framework According to the constitutional provisions, the Federal government is in charge of the overall policy formulation, co-ordination and monitoring in education. Direct control by the Federal government is preponderantly at the tertiary level. Only a handful of institutions at the secondary level (such as the Unity Schools) are under federal direct control. The bulk of secondary schools in the state are under the control of the state government. Local governments have statutory managerial responsibility for primary education, with the federal and state governments exercising appropriate oversight functions. The key objective of the current National Educational Policy is the attainment of universal basic education by 2015 in line with the international Millennium Development Goals. The Federal Constitution of 1999 stipulates that the government should provide free education for all citizens as soon as possible. Education is a core ‘pillar’ of the 2004 National Economic Empowerment and Development Strategy (NEEDS), which is Nigeria’s own Strategy for Poverty Reduction. The new civilian government introduced the Universal Basic Education Programme in 1999 and the Federal government passed the Universal Basic Education (UBE) Act in 2004. Education being on the concurrent Legislative List in the Constitutions, Jigawa State Government is also empowered to make educational policies. Responsibility for policy in education in any other sector for that matter is either initiated by Executive, Legislature, LGAs, Communities or Civil Societies. The Executive The Executive normally has greater muscle in initiating plans and policies which are in turn sent to legislature for it to be enacted into law. There is therefore an inter relationship between the Executive, the Legislature, the LGAs, the CSO and community elders in policy formulation and development. It is with this constitutional provision in mind that the State Government initiated series of policies that are aimed at improving the educational system of the State. The Commissioner of Education also often initiates policies and passes them to the State Executive Council for approval. The Legislature Like in any state of the country the main function of the legislature in Jigawa Sate is to enact laws. The power to enact laws in the State rests with the 30-member elected House of Assembly. The House Committee on Education is particularly responsible for ensuring that issues to do with education receive the necessary legislative backing. At Local Government levels policies to do with education are also developed and laws are enacted to provide the necessary support for their implementation.
18
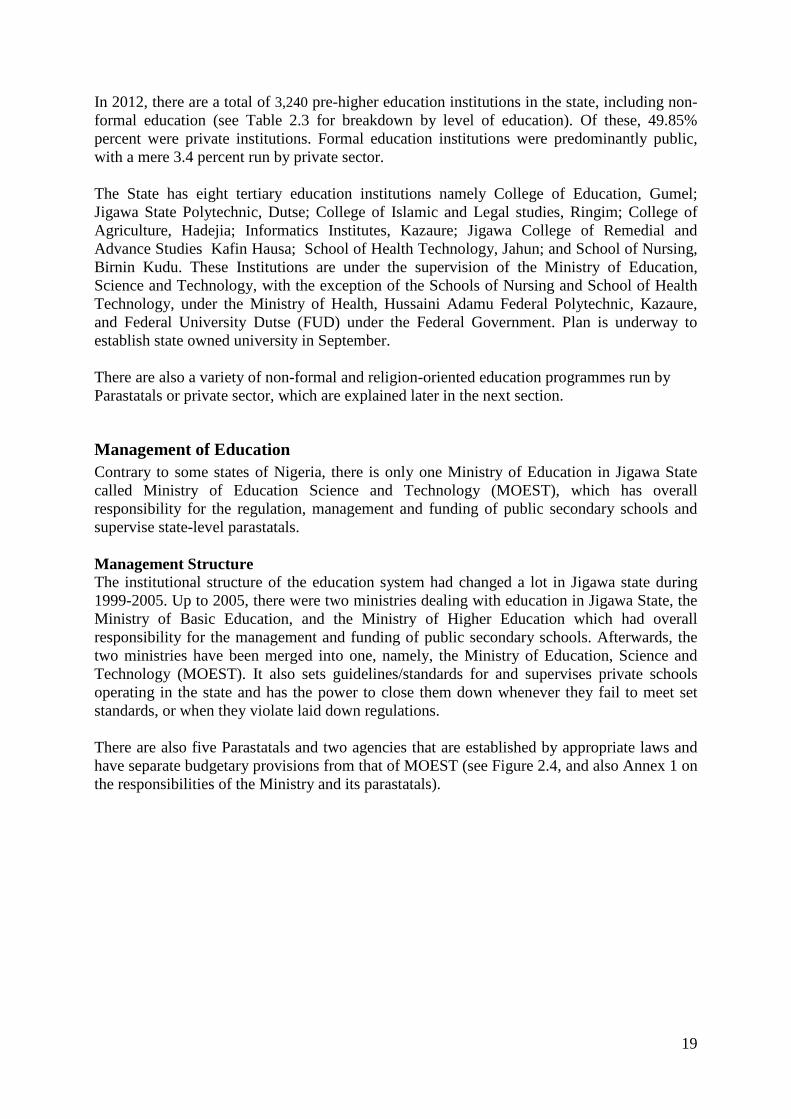
Local Government Authorities At local government level, educational policies affecting the local governments are also developed and laws enacted to provide the necessary support for their implementation Communities and Civil Society The role of communities and civil societies in education service delivery cannot be over-emphasized especially in a democratic dispensation like that obtained in Jigawa State. The formation and formal inauguration of School-Based Management Committees (SBMC) for all primary schools, JSS and SSS in the state marked the beginning of the journey towards full participation of communities in the management of schools.
2.2.2. Structure and Management of Educational System The National Policy on Education (2004) stipulates a 6-3-3-4 structure offering six years of primary, three years of junior secondary, three years of senior secondary and four years of higher education. The key objective of the current National Educational Policy is the attainment of universal basic education by 2015 in line with the international Millennium Development Goals. Figure 2.5: Formal Education System in Jigawa State Ages
0 1 2 3 4 5 6 7 8 9 10 11 12 13 14 15 16 17 18 19 20 21 22 23 24
Universal Basic Education5B 5B 5B 5B
0 0 0 1 1 1 1 1 1 2A 2A 2A 3A 3A 3A 5A 5A 5A 5A 6 6 6
3B 3B 3B 4A 4A
2C 2C 2C 4B 4B 4B 4B
0 Pre-primary education 4A Pre-degree programmes1 Primary education: Primary Leaving Certificate 4B Monotechnics
2A Junior secondary : Junior Secondary Certificate 5B Polytechnics2C Vocational training : Cert.. of Proficiency Colleges of Education3A Senior secondary : WASSC, NESC 5A University Degree Programmes : Bachelor's and Master's3B Technical colleges : NETC, ANTC 6 Doctor, Doctor of philosophy
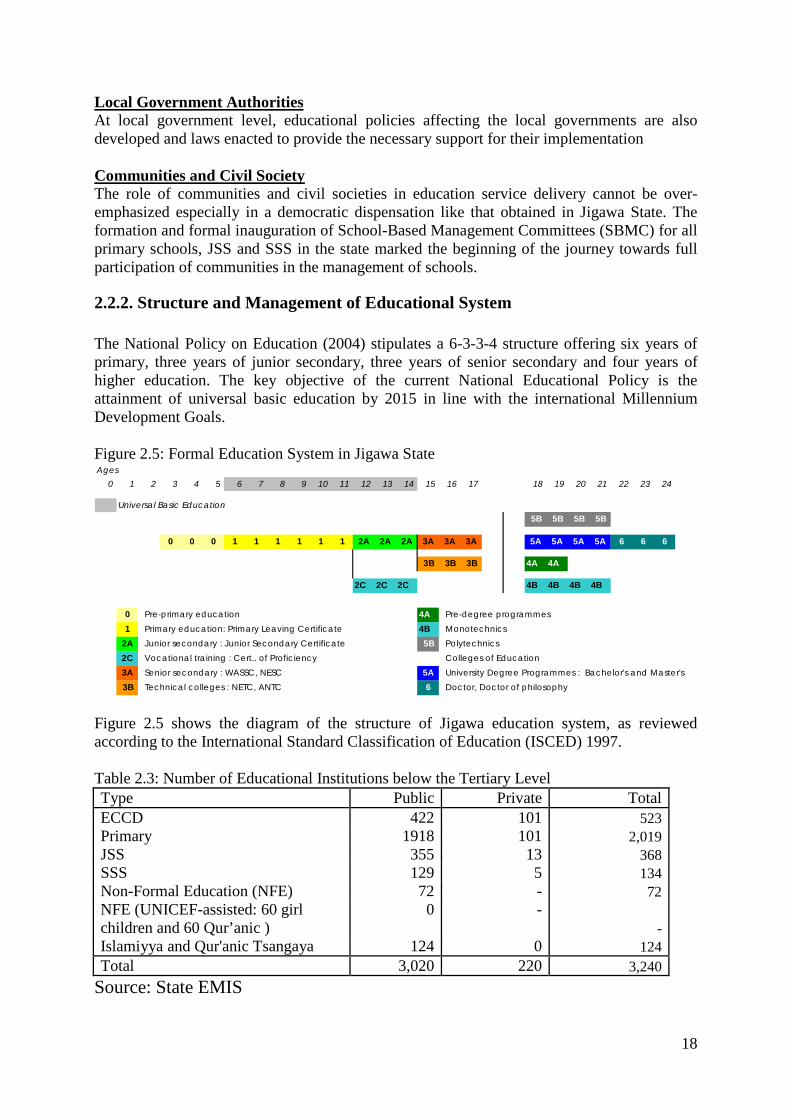
Figure 2.5 shows the diagram of the structure of Jigawa education system, as reviewed according to the International Standard Classification of Education (ISCED) 1997. Table 2.3: Number of Educational Institutions below the Tertiary Level Type Public Private Total ECCD 422 101 523 Primary 1918 101 2,019 JSS 355 13 368 SSS 129 5 134 Non-Formal Education (NFE) 72 - 72 NFE (UNICEF-assisted: 60 girl children and 60 Qur’anic )
0 - -
Islamiyya and Qur'anic Tsangaya 124 0 124 Total 3,020 220 3,240
Source: State EMIS
19
In 2012, there are a total of 3,240 pre-higher education institutions in the state, including non-formal education (see Table 2.3 for breakdown by level of education). Of these, 49.85% percent were private institutions. Formal education institutions were predominantly public, with a mere 3.4 percent run by private sector. The State has eight tertiary education institutions namely College of Education, Gumel; Jigawa State Polytechnic, Dutse; College of Islamic and Legal studies, Ringim; College of Agriculture, Hadejia; Informatics Institutes, Kazaure; Jigawa College of Remedial and Advance Studies Kafin Hausa; School of Health Technology, Jahun; and School of Nursing, Birnin Kudu. These Institutions are under the supervision of the Ministry of Education, Science and Technology, with the exception of the Schools of Nursing and School of Health Technology, under the Ministry of Health, Hussaini Adamu Federal Polytechnic, Kazaure, and Federal University Dutse (FUD) under the Federal Government. Plan is underway to establish state owned university in September. There are also a variety of non-formal and religion-oriented education programmes run by Parastatals or private sector, which are explained later in the next section.
Management of Education Contrary to some states of Nigeria, there is only one Ministry of Education in Jigawa State called Ministry of Education Science and Technology (MOEST), which has overall responsibility for the regulation, management and funding of public secondary schools and supervise state-level parastatals. Management Structure The institutional structure of the education system had changed a lot in Jigawa state during 1999-2005. Up to 2005, there were two ministries dealing with education in Jigawa State, the Ministry of Basic Education, and the Ministry of Higher Education which had overall responsibility for the management and funding of public secondary schools. Afterwards, the two ministries have been merged into one, namely, the Ministry of Education, Science and Technology (MOEST). It also sets guidelines/standards for and supervises private schools operating in the state and has the power to close them down whenever they fail to meet set standards, or when they violate laid down regulations. There are also five Parastatals and two agencies that are established by appropriate laws and have separate budgetary provisions from that of MOEST (see Figure 2.4, and also Annex 1 on the responsibilities of the Ministry and its parastatals).

20
Figure 2.4: Organogramme of the MOEST and its Parastatals
The Parastatals have Governing Boards or Board of Governors, and only refer to the mother Ministry on policy matters. These are supervised by the Ministry under the Permanent Secretary. The Parastatals and agencies each of which is headed by a Chairman and an Executive Secretary are:
• Science and Technical Education Board (STEB), • Islamic Education Bureau (IEB), • Jigawa State Scholarship Board (JSSB), • State Universal Basic Education Board (SUBEB), and • Library Board. • Agency for Nomadic Education. • Agency for Mass Education • State Educational Inspectorate and Monitoring Unit
Local Government Education Authorities (LGEAs) are responsible for primary schools, but are supported and monitored by the State Universal Basic Education Board, which is a semi-autonomous agency under the Ministry of Education. Local Government Councils pay the salaries of primary school teachers and staff of the LGEAs. Ministry of Women Affairs and Ministry of Health and Social Welfare Development are also involved in the running of Kafin Hausa Reformatory Centre, which though has limited capacity and resources for operation. The establishment of School Based Management Committees (SBMCs) for all primary, junior and senior secondary schools in the state is aimed at full participation of local communities in the management of schools. Involving civil societies as well is a main concern to government. Deliberate efforts are made to create awareness among the civil societies on the role and responsibilities of government especially in education service delivery so as to allow for full
Science and Technical Education Board (STEB)
State Universal Basic Education Board (SUBEB)
Library Board
Islamic Education Bureau (IEB) Jigawa State Scholarship Board (JSSB)
Permanent Secretary
Honourable Commissioner
Parastatals Agencies
Administration & Finance
Planning Research & Statistics
Private Schools
Works
Tertiary Education
Educational Resource
School Services
Departments
Agency for Mass Education (AME)
State Agency for Nomadic Education (SANE)
State Educational Inspectorate & Monitoring Unit (SEIMU)

21
participation. The Jigawa People’s Congress (JPC) was created in 1999 to serve as forum for interaction between NGOs, CBOs and government. Radio programmes (Radio link) has also been introduced to enable the general public to ask policy makers questions on issues that have to do with the education of their children.
2.2.3. On-going Education Policy Initiatives Jigawa State Government has developed its own policy goal in J-SEEDS, in line with the Federal Ministry of Education’s directions and policy framework, which is “to empower people through improved and non-discriminatory access to quality education. This will enable people to be productive members of society and positively contribute to social transformation. Provision of quality education is perhaps the surest and fastest way to human capital formation, which is sine-qua-non for a sustained development.” (J-SEEDS, 2004) The same document set three specific policy targets to be achieved by 2016 for reaching quality education for all. The present education sector diagnosis is a good opportunity to review the current situation against the objectives defined in 2012 and monitor, whether or not, they have been achieved. “Raise school enrolment from the current level of 55% to 70% for Primary, 26% to
43% for JSS and 23% to 25% SSS by 2022 with particular emphasis on the enrolment and retention of girls;
Increase literate population from 52% to600% by 2022; Achieve a 40:1 pupil/teacher ratio and pupil-classroom of 40:1 by 2022”
The policy targets as expressed in the J-SEEDS have been optimistic. There is yet the question if the feasibility of such objectives and targets has been appraised. Another issue is the impreciseness of the targets: it is not clear if school enrolment meant the net or gross enrolment ratio. An increase of more than 20 percentage points within a period of four to five years has been an ambitious objective. The third target does not specify the level of education concerned nor the baseline PTR and PCR. In spite of the efforts made, these targets were not met. With a view to accelerating the progress towards the Education for All goals, National educational objectives and the targets set by State Government, Jigawa State has taken a number of educational initiatives, which are briefly described below: 1. Free education for girls at all levels: Jigawa Government has abolished all kinds of fees
and levies for female students in secondary schools and provides sponsorship for female students of Jigawa State origin into higher education institutions anywhere in the country.
2. Free education for the people with special needs: This programme aims to give equal
opportunities for all citizens to acquire education, to empower the people with special needs with relevant quality education for gainful employment, to reduce the number of beggars (some of these beggars are people with special needs) along the streets of the state and to improve the living conditions and status of the physically challenged. All forms of fees and levies have been abolished in the special education schools for the deaf and mentally retarded children
3. Free medical treatment for all boarding students: The aim is to ensure and sustain good
health among boarding students, to relieve parents of the burden of medical care, to

22
promote good healthcare in schools and to provide medical treatment for all boarding students in the state.
4. Improvement in school feeding system: The objectives are to improve the feeding
condition in boarding schools, enhance the nutritional status of school children, promote good health among schoolchildren; and enhance academic performance, learning achievement and outcomes of school children in the state. Government doubled the daily feeding allowance of boarding students from N30 to N90 per student per day.
5. Teaching Inducement Allowance: The initiative is aimed at providing an incentive for
greater commitment and improved performance of teachers in the state. It is also to reduce teacher attrition and encourage more people to enlist in the teaching profession to address the persisting teacher shortage in the state. 100% of the basic salary of senior secondary teachers monthly is paid as teaching inducement allowance (TIA) while teachers at basic level are receiving 47.5% of their basic salary as Professional Teacher Allowance (PTA – 20%) and (TIA-27.5%). The allowances are paid regularly together with monthly salaries.
6. Recruitment of new teachers: 1,352 additional teachers were recruited and posted to
basic and senior secondary schools across the state. 7. Payment of scholarship allowance: The objective is to enable more qualified and willing
students to further their education. In 2011/12 academic year, the state government spent N289,018,520.00 as scholarship allowance to 17,697 state indigenes, out of which 2,798 are female. These beneficiaries were already pursuing various programmes and courses in tertiary educational institutions.
8. Foreign Scholarship to Best 100 Science Students: The State introduced foreign
scholarship to students who excel in science subjects who scores not less than nine credits in WAEC or NECO to encourage best practices, in 2012, 49 students were sponsored to study abroad. This the total sum of N443,876,252.20.
9. Construction/Renovation of School Structures: In 2011/2012 Fiscal year, Government
has spent well over N7.8 billion on construction and renovation of structures in the education sector. This covers Basic Education, Senior Secondary Education, Tertiary Education and Other Education MDAs.
DFID/ESSPIN have contributed towards constructions of classrooms blocks and blocks of VIP toilets to the tune of N242,085,058.24 in 9 sellected LGEAs across the state.
10. Establishment of State Educational Inspectorate and Monitoring Unit (SEIMU): A
fully equipped Educational Inspectorate and Monitoring Unit (SEIMU), under the Honourable Commissioners (MOEST), was established for the purpose of improving monitoring of schools as well as ensuring delivery of quality teaching and learning and supervision of on-going projects in the state.
11. Re-establishment of Zonal Education Offices: The objective was to decentralize
authority and responsibility from the ministry to the zones, to enhance communication and contact as well as accelerate feedback among the ministry, LGAs and schools, and to improve the frequency and strengthen schools’ supervision and monitoring in the state.

23
Nine Zonal Education Offices were established each at Post Basic and Basic Education levels respectively. It is within the mandate of the Zonal Offices to pay staff salaries, supervise examinations and carry out host of other activities that were hitherto the sole responsibility of the Headquarters.
12. Payment of examination fees: The rationale of this initiative is to ease the financial
burden of the payment of examination fees on parents, to provide assistance to qualified indigent candidates, to provide incentives for candidates to perform well and to boost the number of candidates from the state transiting to tertiary educational institutions. Government pays the registration fees of WAEC and NECO examinations for qualified candidates and also supplies free JAMB Forms to final year students capable of meeting University requirements.
13. Re-introduction of MOCK-SSCE Examination: The initiative aimed at discovering
strengths and weaknesses of the final year students in various subjects in order to take the necessary remedial measures before the main examinations.
14. Training of teachers for effective teaching and learning in basic education: The
objective is to improve the teaching-learning process and to attain effective learning outcome. Capacity of teachers was build in various areas:
• 2004 teachers were trained on effective implementation of teaching literacy and
numeracy in schools. • 435 Science and Mathematics teachers received training on strengthening
Mathematics and Science Education. • 210 teachers were beneficiaries of TKT Training conducted by British Council. • 501 School Head enjoys capacity building on effective school management. • 112 School Support Officers (SSO) were trainend on school governance and literacy
implementation support and monitoring. • 129 Senior Secondary School Principals enjoy capacity building on Effective
teaching and Financial Management.
15. Inauguration of visitation panel for all higher institutions: The objectives are to look into the quality of the leadership of the institutions, to check the financial management of the institutions, to examine the law establishing the institutions and to examine the academic performance of the institutions. The government has established a governing council which was headed by chairman governing council to administer the institutions.
16. Purchase of instructional materials aiming at massive purchase of science laboratory
equipments and textbooks for basic and post basic institutions. 17. Increment of overhead cost for girls secondary schools: The initiative aims to ensure
smooth running of schools affairs, ensure adequate stationeries and other school supplies, improve school environments and make them more conducive for learning.
Overall, the above programmes and initiatives indicate that Jigawa State has been concentrating its efforts on education sub-sectors both in terms of access and quality. This is in the context that there are still enormous challenges ahead in achieving EFA goals.

24
Efforts to increase the access of girls to education are appreciable. Yet, how the diverse initiatives are taken and fit within the overall framework of sector-wide education development is to be demonstrated. Efforts for improving the management, governance, monitoring and evaluation of the state programmes need to be sustained. Reliable data and information are key to quantify the number of beneficiaries and to monitor the progress. For instance, the programme for people with special needs was launched before setting an adequate database that would have provided data on the potential beneficiaries, in order to fast-track their intake into and retention at schools. The newly-established SEIMU could have been more carefully designed in light of the role and responsibilities of other existing monitoring and inspection services, in order to optimize its impact and to avoid any possible duplication.
2.3 Education Sector Highlights The peculiarities of the state have made the education sector perform at a high level of difficulty. The education sector is known to be performing at a relatively low-level efficiency. In order to overcome the past shortcomings and to develop a credible strategy, one needs to have a clear picture of the current situation, along with its strengths, weaknesses, opportunities and threats. SWOT analysis was carried out to facilitate a shared understanding of the problems and the possible solutions. To fill in the information gaps, further investigations were conducted on eleven areas that deemed critical for educational development in the state. Stakeholder consultations were organized to share the findings and to discuss the future directions for improving the education services in the state. Particular difficulty in this process has been in obtaining reliable data and information. In Nigeria in general, school-based data on school participation has been difficult to capture. Efforts have been made to improve the situation, starting with the 2012 baseline and improving the education database through an improved National Education Management Information System (NEMIS). Particularly thanks to the annual school census of school year 2011/12, the NEMIS now better captures school data, taking into account the totality of public schools, whether schools did return or not the census forms. Additionally, the national population census, conducted in 2006, made it easier to recalculate and improve education indicators. Despite these advances, there still are a number of weaknesses and even inconsistencies in some of the EMIS data because of the few number of schools that didn’t return census forms and the insufficient commitment to data accuracy on the part of some of the respondents. It is however reported that in the years 2012, “Approximately over 95% of schools returned the school census form. Less than 5% of the schools did not return the census form, however there are more challenges ahead. The most notable is the dealing with the twin challenges of over-reporting of enrolments and under-reporting of population.” (2012 ASC report). The official formula for the distribution of the Federal Account resources among states and LGAs has a portion (2.4%) based on total primary school enrolment: in general, this might have become an “incentive” for some states and LGAs to inflate enrolment in order to receive more resources. While the estimation methods, used by NEMIS team, may have helped to calculate plausible indicators, they carry their own inconsistencies, namely between total enrolments, school-age enrolments, school-age population and net enrolment ratios. Another important limitation to the EMIS source is the possible under-estimation of the size of the private sector enrolments though they may be an important avenue of school education

25
in Jigawa State. For many reasons the recording of these schools is still very challenging as many proprietors have not registered their schools. A second possible source of information on education coverage is the CWIQ (Core Welfare Indicator Questionnaire) survey of 2006 mentioned above. In the CWIQ survey, 100 housing units were sampled in each of the 27 LGAs. An obvious advantage of the CWIQ source compared to EMIS in estimating school participation indicators is that both the school going children and the reference population were under statistical control in CWIQ whereas school-based census controlled only the school enrolment. Enrolment indicators therefore tend to be more accurate from CWIQ. This does not mean that the CWIQ survey did not carry its own inaccuracies, especially given the greater sensitivity due to the small sample size. In CWIQ, enrolment meant the school attendance, which is a different indicator from the one calculated with NEMIS data. As said earlier, for the sake of this education sector analysis, some data and information were collected by means of eleven background studies. Various ad hoc instruments for data collection were employed such as check-lists, questionnaires, structured interviews and observations. Challenges remain if these data contradict those of NEMIS or other sources. In this chapter, one or the other of these data sources are used depending on the concrete situation being described. Necessary references are given in regard to their sources. To the extent possible, analyses are carried out by level of education, including cross-cutting issues such as gender, disparities, special needs, etc. The following levels and forms of education were distinguished for analytical purpose, as well as they conform to the official directions taken by both the federal government and Jigawa state:
i) Basic education, including pre-primary, primary and junior secondary levels ii) Senior secondary level, including both general and technical education iii) Higher education, and iv) Non-formal education.
2.3.1. Access and Equity Formal basic education is defined in Jigawa state as nine-year schooling, in line with the national education policy. Meanwhile, there is also a cautious, although yet embryonic, move towards conceiving pre-primary education as part of the formal basic education as illustrated by the UBE intervention fund which supports funding for this level of education. As for post-basic education, there is senior secondary level with two types of schools (general and technical) and higher education level, with different types of institutions. Higher education institutions are analysed in a separate section. Non formal and other educational opportunities are offered in various environments as explained below:
26
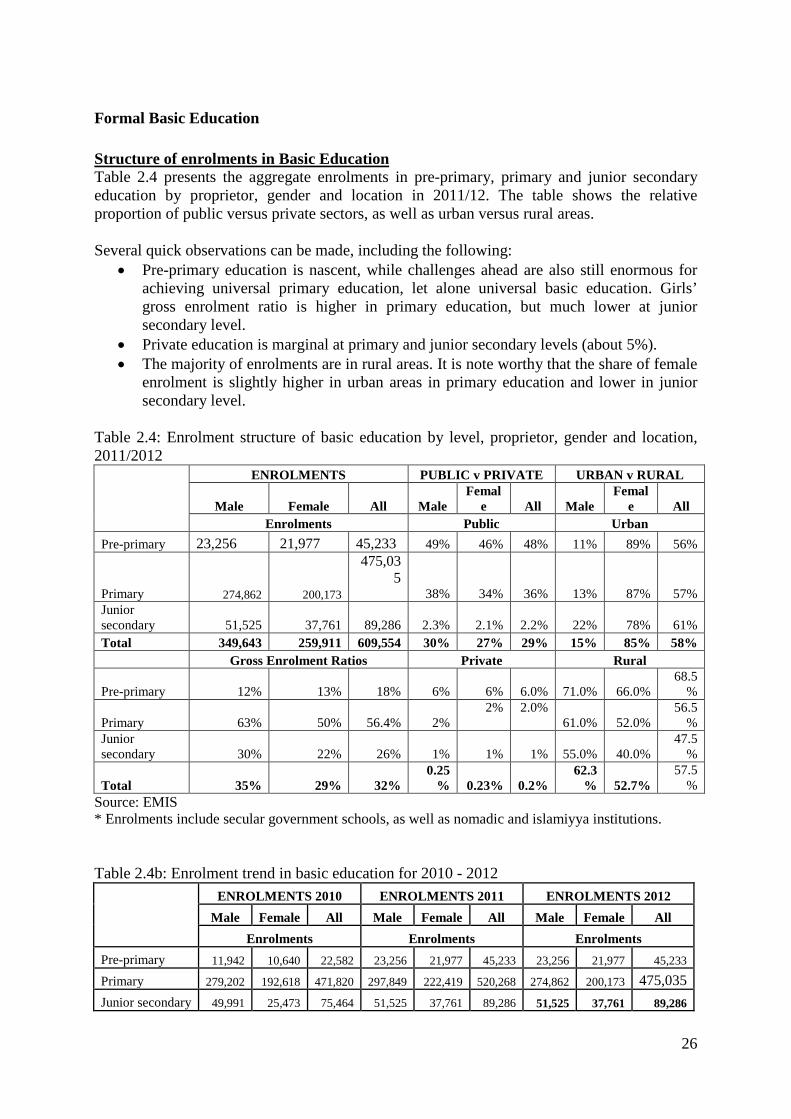
Formal Basic Education Structure of enrolments in Basic Education Table 2.4 presents the aggregate enrolments in pre-primary, primary and junior secondary education by proprietor, gender and location in 2011/12. The table shows the relative proportion of public versus private sectors, as well as urban versus rural areas. Several quick observations can be made, including the following:
• Pre-primary education is nascent, while challenges ahead are also still enormous for achieving universal primary education, let alone universal basic education. Girls’ gross enrolment ratio is higher in primary education, but much lower at junior secondary level.
• Private education is marginal at primary and junior secondary levels (about 5%). • The majority of enrolments are in rural areas. It is note worthy that the share of female
enrolment is slightly higher in urban areas in primary education and lower in junior secondary level.
Table 2.4: Enrolment structure of basic education by level, proprietor, gender and location, 2011/2012
ENROLMENTS PUBLIC v PRIVATE URBAN v RURAL
Male Female All Male Femal
e All Male Femal
e All Enrolments Public Urban Pre-primary 23,256 21,977 45,233 49% 46% 48% 11% 89% 56%
Primary 274,862 200,173
475,035
38% 34% 36% 13% 87% 57% Junior secondary 51,525 37,761 89,286 2.3% 2.1% 2.2% 22% 78% 61% Total 349,643 259,911 609,554 30% 27% 29% 15% 85% 58% Gross Enrolment Ratios Private Rural
Pre-primary 12% 13% 18% 6% 6% 6.0% 71.0% 66.0% 68.5
%
Primary 63% 50% 56.4% 2% 2% 2.0%
61.0% 52.0% 56.5
% Junior secondary 30% 22% 26% 1% 1% 1% 55.0% 40.0%
47.5%
Total 35% 29% 32% 0.25
% 0.23% 0.2% 62.3
% 52.7% 57.5
% Source: EMIS * Enrolments include secular government schools, as well as nomadic and islamiyya institutions. Table 2.4b: Enrolment trend in basic education for 2010 - 2012 ENROLMENTS 2010 ENROLMENTS 2011 ENROLMENTS 2012 Male Female All Male Female All Male Female All Enrolments Enrolments Enrolments Pre-primary 11,942 10,640 22,582 23,256 21,977 45,233 23,256 21,977 45,233
Primary 279,202 192,618 471,820 297,849 222,419 520,268 274,862 200,173 475,035
Junior secondary 49,991 25,473 75,464 51,525 37,761 89,286 51,525 37,761 89,286

27
Total 341,135 228,731 569,866 372,630 282,157 654,787 349,643 259,911 609,554 Figure 2.5 (chart)
Table 2.4, Table 2.4b and Figure 2.5 portrays the enrolled trend in basic education i.e Pre-primary, primary and JSS covering 2010 to 2012. It would be interesting to compare how Jigawa state performs in comparison with the other Nigerian states. However, because of the limitation of the data (including NEMIS), it appeared to be rather difficult to carry out such comparison. Meanwhile, Figure 2.6 compares the GER of Jigawa primary education with those of some selected African countries, based on the statistics of the EFA Global Monitoring (GMR) Report. Primary GER in Jigawa state which was 10% point lower than Nigerian average and Jigawa State (2005) it has now in (2012) been improved by 3%. among the fourteen states covered in this figure, only eighth. If only secular schools are taken into consideration in the comparison, the state takes the second last position, before the Republic of Niger.

28
Figure 2.6: Gross enrolment ratios in primary education in selected sub-Saharan African countries, 2005
20
30
40
50
60
70
80
90
100
110
120
Niger JigawaState*
JigawaState**
BurkinaFaso
Mali Chad Senegal Guinea Ghana Benin NigeriaTanzaniaZambia Kenya SSAaverage
Prim
ary g
ross
enro
lmen
t rat
io (%
)
Source: EFA Global Monitoring Report 2008, and State EMIS for Jigawa state * Enrolments in secular schools only, Jigawa State ** Enrolments in secular, nomadic and islamiyya schools, Jigawa State Figure 2.7: Gross enrolment ratios in junior secondary education in selected sub-Saharan African countries, 2005
0
10
20
30
40
50
60
70
80
90
100
Niger BurkinaFaso
Chad JigawaState
Senegal Mali Guinea Nigeria Benin Zambia Ghana Kenya SSA average
Junio
r sec
onda
ry gro
ss en
rolme
nt rat
io (%
)
Source: EFA Global Monitoring Report 2008, and State EMIS for Jigawa state Figure 2.7 shows the GERs of junior secondary education in some selected African countries. The junior secondary GER in Jigawa state which was less than 20% (2005), has now (2012) improved to 26% however, lower than Nigerian average and Jigawa State is tenth in the selected thirteen countries. Senior Secondary Education As said earlier, senior secondary level is comprised of two types of schools (general and technical). Table 2.5 shows the enrolment structure and status of senior secondary schools by type of education in both public and private senior secondary schools.

29
Table 2.5: Enrolments in senior secondary education, 2011/2012 Public Private Total
Male Female M+F Male Femal
e M+F Male Female M+F General 46,884 13,662 60,546 319 179 498 47,203 13,841 61,044
GER 25.80% 11.00% 18.70% 0.11
% 0.04% 0.08
% 25.90% 11.10% 18.80% Technical 3488 2115 5603 0 0 0 3488 2115 5603
GER 1.50% 1.10% 1.30% 0.00
% 0.00% 0.00
% 1.50% 1.10% 1.30% Total 50,372 15,777 66,149 319 179 498 50,691 15,956 66,647
GER 27.30% 12.10% 20.00% 0.11
% 0.04% 0.08
% 27.50% 12.20% 20.10% Source: State EMIS Table 2.5b: Enrolments Trend in senior secondary education, 2010 to 2012 ENROLMENTS 2010 ENROLMENTS 2011 ENROLMENTS 2012 Male Female All Male Female All Male Female All Enrolments Enrolments Enrolments Senior Secondary School 37,421 20,775 58,196 39,553 15390 54943 50,372 15,777 66,149 Source: State EMIS Figure 2.8: Enrolment Trend in Senior Secondary Schools

30
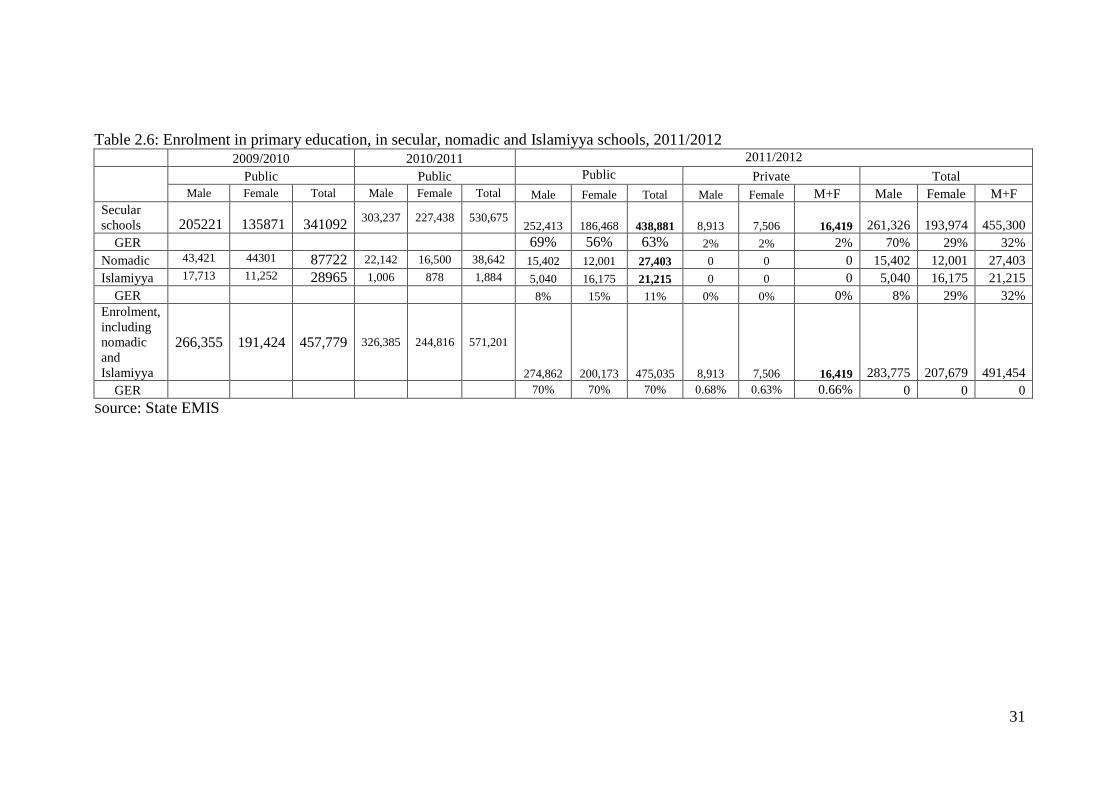
Source: State EMIS Gross enrolment ratio is very low at senior secondary level. Once again, there are very wide differences in enrolments between male and female to the disadvantage of the latter. GPI is 0.25, meaning, even though the ratio is less than 1 female student to 2 male but there is about 50% improvement as compared to 0.45(in the previous 2005 base line data) counterparts at senior secondary schools. Technical and vocational education is under-developed with, on average, a mere 10% of total senior secondary enrolments (7.0% for male and 1.9% for female) but has improved particularly that of female. It is also note worthy that all technical and commercial schools are run by the public sector. Major Issues and Challenges The major issue in Jigawa state is the low enrolment profile at all levels of education. As can be seen in Table 2.4, enrolment is weak at all levels of basic education, especially at pre-primary and junior secondary levels. Primary GER stands at 55%, including enrolments at nomadic and islamiyya schools. Later in this section, the status, type and purpose of islamiyya and Qur'anic schools are explained in more detail. Table 2.6 gives disaggregated information on primary school enrolments according to the type of schools. The table shows the importance and potential contribution of islamiyya schools in providing primary education in Jigawa state.
31
Table 2.6: Enrolment in primary education, in secular, nomadic and Islamiyya schools, 2011/2012
2009/2010 2010/2011 2011/2012 Public Public Public Private Total Male Female Total Male Female Total Male Female Total Male Female M+F Male Female M+F Secular schools 205221 135871 341092 303,237 227,438 530,675
252,413 186,468 438,881 8,913 7,506 16,419 261,326 193,974 455,300 GER 69% 56% 63% 2% 2% 2% 70% 29% 32%
Nomadic 43,421 44301 87722 22,142 16,500 38,642 15,402 12,001 27,403 0 0 0 15,402 12,001 27,403 Islamiyya 17,713 11,252 28965 1,006 878 1,884 5,040 16,175 21,215 0 0 0 5,040 16,175 21,215
GER 8% 15% 11% 0% 0% 0% 8% 29% 32% Enrolment, including nomadic and Islamiyya
266,355 191,424 457,779 326,385 244,816 571,201
274,862 200,173 475,035 8,913 7,506 16,419 283,775 207,679 491,454 GER 70% 70% 70% 0.68% 0.63% 0.66% 0 0 0
Source: State EMIS

32
The increasing population of primary and junior secondary school aged children who are out of school creates enormous pressures and constraints in achieving universal access to basic education. Gender disparity in education has been found to be at the disadvantage of the girl-child in both secular primary and secondary enrolment. Primary GER at secular schools is around 69% only, with gender parity index (GPI) of 0.8 (see Table 2.6). In other words, female students are a minority compared to their male counterparts in secular primary schools. Girls are again disadvantaged at junior secondary education level, with low GPI (0.7), only second after Chad (0.36) from the end of the list of selected countries (Figure 2.7). What’s more, the GER of female students, in secular schools, drastically decreases from primary to junior secondary, from 55.0% down to 2.0%. (urban) and 52.0% to 40.0% (rural). The GPI at islamiyya schools is 1.1, which shows the role played by this type of schools for female population: girls are massively enrolled at islamiyya schools, rather than at secular schools. Although it is proven that the presence of female teachers has a certain impact on narrowing down the gender disparity in enrolment, the share of female teachers is incredibly low across all levels of education. This phenomenon is particularly more flagrant in public than in private schools, which calls for a special attention on the part of the Government (see Table A.10 in Annex 2). Gender disparity in teaching and non teaching staff is strong as well in higher education institutions, whereby female teachers are only 5% of total teaching force and 16% of non teaching staff (see Table A.11 in Annex 2). Low gross enrolment ratios for both primary and secondary education in Jigawa State are closely linked to poverty (see Table 2.7). Whereas only around one-third of children from the poorest 30 percent of households attend primary school, over three-quarters of children from the richest 90 percent of households are enrolled. This enrolment differential is even more acute for secondary education, which probably due to the considerably higher direct and indirect costs of secondary education,

33
Table 2.7: Gross enrolment ratios by type of school, gender and household welfare quintile, Jigawa State, 2006 (percentages) 1 2 3 4 5 PRIMARY
Male 29 39 52 86 84 Female 23 25 42 65 71
JSS Male 23 27 47 62 125 Female 6 9 8 40 47
SSS Male 9 15 30 64 69 Female 1 9 16 33 59
Source: CWIQ Other serious issues include:
• Poor conditions of infrastructure and physical facilities, with about 43 percent of the classrooms out of 21,819 in the state being in poor conditions.
• Majority of the schools lacking recreational facilities. • Many of the school facilities, in the rural areas, under-utilised, while those at the urban
centres reportedly over-croded. Provision and renovation of physical infrastructures and facilities in Jigawa state are mainly done by the government for the public schools. Private individuals take care of the private schools infrastructures and facilities. The state also receives assistance from international development partners (IDPs) mainly in the provision of instructional materials, furniture, sometimes sanitation materials, teachers’ capacity building and construction of new classrooms. These infrastructure-related issues will be described in detail later in this section.
Non Formal Education and Other Learning Opportunities Besides the public and private formal sectors of schooling, there are a number of other forms of educational programmes targeted to specific population groups, such as: Islamiyyah schools, Qur’anic schools and adult literacy centres. The Agency for Mass Education (AME), formally a department under SUBEB, has now become an autonomous body, in charge of non-formal education, adult literacy, Qur'anic-Tsangaya and girls child centres. Islamiyya and Qur’anic Tsangaya Education Jigawa state counts a preponderance of community or privately-owned Islamiyya schools, which when integrated with the formal educational system will improve access to education as well as enhance community participation. Islamiyya education covers all parts of the state. It is even more widely spread than the secular schools. Islamiyya schools consist of all categories of people (male and female, young and adult). It is also made up of primary and secondary school-age students, graduates from secondary and tertiary school students. Aged persons including housewives are also enrolled into Islamiyya schools. This section has 124 registed schools.
34
Forms of Islamiyya: Based on the investigation, there are four main types of Islamiyya namely: (i) Islamiyya Primary Schools; (ii) Islamiyya Secondary Schools; (iii) Women Islamiyya Schools; (iv) Adult Men Islamiyya Schools.
• Islamiyya Primary & Secondary Schools: These schools are mainly controlled by
the local or state government. Students are enrolled based on the guild lines and directive of local education authorities (LEAs). The schools use the curriculum approved by the state or federal government. The duration is six years like any other primary school. Certificates are awarded to the graduates at the end of their studies. The schools operate mainly in the morning. Head-teacher, teachers and other supporting staff are posted from LEAs to the Islamiyya primary schools. Their salaries and other payments are paid by the LEAs.
• Women Islamiyya Schools: These are Islamiyya schools for married women, widows, divorced or any other female Muslim who cannot be enrolled in Islamiyya schools for one reason or another. The school operates mainly in the night and weekends. The teachers are paid by the students.
• Adult Men Islamiyya Schools: These are Islamiyya schools for adult men muslims who cannot be enrolled in Islamiyya schools for one reason or another. The school operates mainly in the night and weekends. The teachers are paid by the students.
Contribution to meeting the goals of EFA: Some Islamiyya teachers teach English, mathematics, sciences and social studies apart from the Arabic Courses. These widen the chances of the students to acquire more and different knowledge. In some Islamiyya, certificates are awarded to the students. These enable them to further their education to secondary schools, tertiary institutions and universities to acquire high education and obtain certificates of higher learning such as Higher Islamic Certificates (HIS), Diplomas, National Certificate of Education (NCE), Degrees, Masters and PhD in Arabic. Special Needs Education Special education refers to the education of children and adults who have learning difficulties due to their social, physical and mental needs. Special needs education in the state covers primary, JSS and SSS levels, catering for the educational needs of the hearing impaired, visual impaired, intellectual disabled, physically impaired and those with behavioural disorder. There are special education classes at Nasoro Primary School, Gumel; School for the Mentally Retarded Children at Kazaure; Reformatory Centre, Kafin Hausa; School for the Deaf Children, Hadeja. All categories of children with special learning needs are the major beneficiaries. These are drawn from across the state. At present, there are 3,402, out of which 2,452 were males and 950 were females. However, early child care development (ECCD) classes not in existence in all the special education schools. Non Formal Education Non formal education (NFE) comprises of 6,640 learners with a teaching staff of 2,166. NFE includes adult literacy, continuing education and girl-child education. The providers of NFE programme in the state include: State government, LGA councils, National Mass Education Commission (NMEC), international development partners (IDPs), NGOs/CBOs and private individuals. This education is offered in the form of adult literacy, girl-child education programme, etc.
35
Agency for Mass Education in Jigawa state was established in April 2008 by the present administration. It covers educational provision made to create opportunities for those who are not opportuned to benefit from the secular school system. It is set to achieve ambitious objectives in line with EFA and MDG goals which talks about:
• Provision of Universal Basic Education, • Eradication of extreme poverty and hunger, and • Promotion of gender equality and empowering women
The Agency, in 2011/2012 has 27 women education centres, about 50% of which are in need of, renovation as well as equipments and learning materials for full operation; it also has 9 Television viewing centres at different locations in the state but facing with problems of social infrastructure like lite, satellite and communication net work etc fo function effectively as for NFE programmes. The agency operates the following programmes:
• Basic literacy programme state sponsored (9 months - 1 year) • Local government sponsored basic literacy (9 months – 1 year) • Post literacy programme (18 months) • Continuing education programme (3 years) • Voluntary literacy programme (9 – 18 months) • NYSC functional literacy programme (18 months) • Functional literacy/ vocational skills acquisition (18 months) • Women education centres/vocational skills programmes (9 – 18 months)
NFE beneficiaries are: adult population; Qur’anic Tsangaya; hawking girls. The education is delivered through: Non-Formal Education Centres for the adult population, integration method for the Qur’anic Tsangaya, and open air and schools for the hawking girls. There are six core subjects such as: English Language, Mathematics, Social Studies, Primary Science, Hausa, and Islamic Religious Knowledge. Some issues and challenges in non-formal and other educational programmes: Non formal education is also going through numerous difficulties, some of which are:
• Inadequate qualified instructors/facilitators and weak capacity status of more about 40% of the Agency staff
• Inadequate specialists, teaching and non-teaching staff at the special education centres/schools
• Inadequate special teaching materials e.g. Tylus frame, pathfinder and white cane for the blind, hearing aids for the deaf, toys for mentally retarded and wheel chairs for physically disabled etc.
• Land acquisition, uncertainty in continuity and problem of unqualified teachers in respect of the private schools.

36
Table 2.8: Various Non Formal Education Programmes in Jigawa State, 2012 Institutions Enrolments Staff /classes Male Female Total /Malam Post literacy programme - State sponsored 2,029 962 2,991 3,382 2,029 Prison inmates Basic education 3 131 0 131 6 Remediation Programme 27 1970 1153 3127 131 Indiginous NGOs Basic Literacy 2 212 808 1,019 41 Individuals continuing education 3 317 1,166 1,484 55 Individuals Basic Literacy 2 164 628 792 24
Source: Agency for Mass Education (AME) Currently, various non formal education institutions run the following programmes:
• Basic literacy programme. • Post literacy classes. • Prison inmates basic literacy programme. • Girls Child programme. • Continuing education programme • Skills acquisition centre. • Basic Literacy and Continuing Education Programmes run by Indiginous NGO and
Individuals
2.3.2. Quality and Relevance This section reviews issues relating to the qualitative aspects of education in Jigawa State. As the Dakar Framework for Action makes it clear, education is not simply about increasing enrolments and graduates, but also delivering a quality service to individuals and to the community as a whole. There is of course a need to define what is to be considered a quality education service. This section analyses the aspects of the quality of the inputs to education, learning conditions, evidence of learning achievements, and indicators of internal efficiency in Jigawa State education system. Although quality of an educational service can be looked at from several points of view, three dimensions have been privileged in this report: learning/teaching conditions, learning achievements and internal efficiency. A student is expected to acquire certain knowledge and cognitive skills, mostly as a result of the learning environment offered while progressing through the school system.
Learning Conditions One of the aspects of quality in education relates to the learning and teaching conditions in schools. These conditions have importance not only as a major factor for improved learning achievement, but also in and of themselves. Children attending school spend a very large amount of time there. Therefore, providing them with enjoyable physical conditions and intellectual quality is an important part of improving their living standards. Similarly, the teachers can do their best only if provided with acceptable working conditions including adequate buildings and furniture, textbooks and professional support. The teaching conditions in the school will also directly impact on the learning outcomes the school is meant to transfer to its students.

37
Table 2.9 gives a snapshot of the learning conditions in public pre-primary, primary, junior and senior secondary schools in Jigawa state. Table 2.9: Learning conditions for public primary and secondary schools, Jigawa State, 2012
PTR Class size % Qualified
Teachers Textbook / pupil ratio
Pupil / classroom ratio
Pre-primary* 65 61 58% N/A 61 Primary 38 48 52% N/A 48 JSS 24 65 84% N/A 65 SSS 24 50 62% N/A 50 Technical 2 40 90% N/A 40
Source: Jigawa Simulation Model The development of basic education is seen as a key priority to proper development in Jigawa State. Government has shown considerable commitment towards the attainment of MDG and EFA Goals. Presently there are 1,918 primary, 355 junior secondary and 129 senior secondary schools across the state. Generally, infrastructural facilities are grossly inadequate. For instance, at the pre-primary and primary levels, there are 3,578 functional, 2,575 non-functional classrooms; the additional number required is 3,559. There are 523 ECCDE centres across the state, out of which 422 operate as public schools while 101 are owned by private proprietors with total enrolment of 66,163 pupils, out of which 45,233 are enrolled in public schools. There are 1,390 teachers for ECCD centres across the State, out of which 693 (350 male; 54 female) service the public schools. The number of primary schools is 2,019 out of which 1,918 are public and 101 are private schools. Out of the 368 junior secondary schools that exist in the State, 355 are public. There are 134 senior secondary schools in the State out of which 129 are public. Teachers: As can be seen in Table 2.9, the pupil/teacher ratios (PTR) are still far beyond the national norms (38 for primary and 24 for secondary schools). Another serious issue is the insufficient number of qualified teachers. For example, as at the 2011/12 session, there were 11,62315,703 (13,156 male; 2,547 female) teachers in public primary schools, out of which 7,853 (6,662 male; 1,201 female) were qualified, while 7,840 (6,494 male; 1,46 female) were unqualified teachers in pre-primary and primary. However, efforts has been intensified towards improvement of qualified teachers at the basic public schools by employing only qualified teachers. In terms of number of teachers, gender disparity appears worrisome, in that only 15% of the teachers in all primary schools in the state are females. In the junior secondary schools, female teachers constitute 7% of the teaching staff, while 16% of the teachers in senior secondary schools are females.

38
Learning Achievement and Outcomes Measuring learning achievements at different levels of the education system aims at evaluating the extent to which the pupils/students actually reach the level of knowledge and skills that they are expected to master. Expected levels of knowledge are clear enough according to official curricula with skills clearly identified in the different subject areas and different grades. The notion of quality applies not only to school factors, but also to family and community ones. In general, those schools where a large number of students acquire the prescribed skills can be described as good quality schools. At the same time, however, the family background plays a certain role in the level of learning achievement, partly due to the expenses that richer families could allocate for the education of their children, as regards learning materials, private tutoring, etc. Curriculum: As elsewhere in Nigeria, the curriculum implemented in Jigawa state schools is in consonance with the National curriculum. The national policy on education (2004) enumerates the curriculum of the 6-3-3-4 system of education in the country. The six years of the primary school level and 3 years of the junior secondary level are merged to make up 9-year basic education. It is in view of this development that the curriculum of the 6-3-3-4 educational system has been reviewed with the production of current revised national curriculum. The Nigeria Education Research and Development Council (NERDC) have developed various curricula for the primary, junior and senior secondary schools for use in the Federation. Pre-primary curricula are not yet released. The 9-year basic education curriculum has 3 levels as shown on the table below: Table 2.10: Number of subjects by level, basic education Basic education No. of core
subjects No. of elective
subjects Total no. of
subjects Lower basic (Primary 1-3) 10 3 13 Middle basic (Primary 4-6) 11 3 14 Upper basic (JSS 1-3) 12 4 16
Source: State MOEST As for senior secondary education, there are three types of curriculum applied in the state.
a) Nigeria Education Research Development council (NERDC) curriculum, which is examined by both WAEC and NECO.
b) National Business and technical Education Board (NABTED) curriculum, catering for the National Board for Technical Education and National Board for Business Education (NBBE) respectively.
c) National Board for Arabic and Islamic studies (NBAIS) curriculum, catering for Arabic based schools and examined by the institute for education, Ahmadu Bello University Zaria.
Student performance: At the basic level of education, although there should be 100% transition from primary level to junior secondary level, the placement examination results determine transition into senior secondary schools. The result of the placement examination is about showing 92% transition into senior secondary schools.

39
Overall, learning is perceived weak in Jigawa state. The learning achievement in 2012 from external examination bodies is generally poor. The table below illustrates the percentage of students who score five credits and above in different examinations at post-basic levels of education in 2012. The percentage of those who fail these examinations is more than 70% (excerpt for SSCE/NECO). Those who pass with 5 credits and above represent a mere 12% (excerpt SSCE/NECO). Table 2.11: Post-basic examination results 2011 to 2012 2010 2011 2012 Examination bodies
Total sat
5 credits and above
% of Credit
s
Total sat
5 credits and above
% of Credit
s
Total 5 credits and above
% of Credit
s
WASSCE/WAEC
11,836 3,234 27%
15,049 4,304 29%
16,194 3,570 22%
SSCE/NECO 10,247 2,018 20%
14,892 745 5%
16,870 5,547 33%
NABTEB/NTC N/A N/A N/A N/A N/A N/A 233 11 5% SISCE/(ABU) & STQE(ABU) N/A N/A N/A N/A N/A N/A 3,094 2909 94% Source: State MOEST Different factors can be accounted for the low performance, including inadequate motivation /incentives, preponderance of unqualified teachers to the tune of 42% and 8% at the basic and secondary levels of education respectively, and inadequate teaching and learning materials. The need for doubling effort by the school heads and teachers has become very necessary. The present administration has started showing interest and commitment to the challenge through capacity building of teachers as well as the administrative staff, recruitment of new staff and prompt release of targeted budgetary provisions. The State Government established a State Educational Inspectorate and Monitoring Unit (SEIMU). Nine Zonal Education Offices were re- established for grass root monitoring and inspections of schools.
Internal Efficiency This section presents data on internal efficiency situation with particular reference to promotion, repetition and dropout in respect of enrolment figures. In order to achieve the universal basic education, it is sine qua non that all eligible children should enter the first grade of primary education and complete the full cycle of basic education. This means that once they are enrolled into Grade 1 of Primary, pupils should remain through the end of the cycle without leaving (dropping out from) it if the completion rate is to be 100 percent. Cohort analysis enables the computation of flows from lower to higher class and from lower to a higher level of education. The results are used as indicators to measure the internal efficiency as well as proxy indicators on the quality of education. It has been observed that at present, a portion of children who enrolled in schools, especially in primary education, were leaving the system, without completing it, thus affecting the internal efficiency of Jigawa education sector (low survival rate, low coefficient of efficiency and high level of wastage).

40
The left-side figures of Table 2.12 show that, under the current flow rates (promotion, repetition and dropout rates), out of 1000 pupils who are assumed to have entered the first grade of primary education in Jigawa, 852 of this cohort would be able to complete the primary cycle. In other words, even if all 6-year old children entered the schools, 15 percent of them would not complete grade 6 of primary education if the present flow rates continued. From an economic point of view, the “coefficient of
internal efficiency” is used as a measure of what proportion of resources reaches their intended targets, as opposed to being spent on children who either are repeating or will drop out before completion. Calculations of the “coefficient of internal efficiency” result in values of 0.86. These values mean that 16% (i.e. 100% minus 86%) of all resources spent on teachers’ salaries, infrastructure, overhead etc. are wasted, being spent on pupils either repeating (i.e. not gaining new skills) or who will drop out before completion (i.e. not consolidating the skills being gained into the prescribed level). Figure 2.8 shows the trend for intake and completion rate for Primary and Junior Secondary school respectively. The trend depict that intake is reasonably high but completion rate is very low. Perhaps, this could be due to mass dropout and repeatation at the upper primary level going to JSS.
Table 2.12: Internal efficiency indicators, Primary education, Jigawa State, 2012
Basic efficiency indicators Average duration of study (years):
Total Actual Input: 8,303 per graduate: 9.18
Total Actual Output: 381 per drop-out: 6.07
Ideal I/O ratio: 8.00 for the cohort: 6.36 Actual I/O ratio: 21.79
Wastage Ratio: 1.72 Survival rates: Coefficient of efficiency: 0.37 To Grade 2
102.9%
To Grade 3
101.4% Pupil-years wasted To Grade 4
97.7%
Due to repeaters
1,498 To Grade 5
86.0%
Due to drop-outs
3,756 To Grade 6
74.0%
Total Pupil-years wasted
5,254 To Grade 7
62.3% Proportion of wastage: To Grade 8
56.1%
due to repeaters 28.5%
due to drop-outs 71.5%

41
Figure 2.8: Intake and completion rates through Jigawa school system, 2012
Source: 2012 Jigawa SESP Simulation Model According to Figure 2.9, even though above 90% of eligible children had theoretically entered the first grade of primary education (including nomadic and islamiyya schools), about 75% of them would complete the primary education cycle. Those who would continue with junior and senior secondary education represent less than 30% of eligible population: however the proportion of females is fare. Figure 2.9: Survival rate in public primary and JSS in Jigawa state, 2012
Source: 2012 Jigawa SESP Simulation Model

42
Of the two problems impacting on internal efficiency, grade repetition is less of a problem. Dropouts appear to be a more serious problem. Figure 2.9 shows a step decline in the surviving cohort through the grades within the primary level, but more importantly between primary and junior secondary levels: out of the initial cohort of pupils entering into primary grade 1, only 28% of the boys and 24% of the girls continue through secondary schools. It is hoped that enforcing the rule game of the Universal Basic Education Programme (meaning automatic transfer from primary to junior secondary levels) could drastically reduce the number of those to discontinue education after primary cycle. However, one should be alerted on the implications in terms of resources required to cater for the increasing candidates for secondary education, in light of the difficult learning conditions already prevailing in both primary and secondary schools. 2.3.3 Partnerships and Private Sector Participation Contributions are made by various private sectors of the society to education in Jigawa State such as banks, individuals, ETF, NGOs and CBOs. The banks contribute in renovation of schools, building of new blocks of classrooms, labs, libraries and supply of generators to boarding primaries and boarding senior secondary schools. Indigenes (individually or by group, as well as some non indigenes, have built schools ranging from nursery, primary, junior secondary and senior secondary schools. Some CBOs provided Islamiyya schools. The teachers are either voluntary or paid meagre amount. The spread of the private schools are mostly in urban areas and a few larger communities. This scarcity of private schools in rural areas is due to few children and uninterested parents. However, strategies are in place to undertake wide scope advocacy and sensitisation in order to attract improved private sector participation.
2.3.4. Infrastructural Facilities There are 9,332 classrooms in pre-primary and primary schools. However, 23% of these are in need of major repairs. In junior secondary schools, there are 1,382 classrooms while 14% need repairs. The senior secondary schools have a total 1,161 classrooms with 3% needing repairs. Despite the huge investment of the state government on education, there are still number of schools that do not have sufficient teaching/learning materials (for example, recommended textbooks), laboratory equipment/specimen, furniture and ICT Labs etc. The policy is that every primary school student should have exclusive use of the four core textbooks for mathematics, English, science and social studies i.e. a textbook/student ratio of 4 to 1. Table 2.9 shows, however, that the ratio in primary schools is 0.30:1 (instead of 4:1), which means that only 7.8 percent of the prescribed core textbooks are available. The situation is similar in secondary schools: the student-textbook ratio is 0.25:1 in JSS and 1.3:1 in SSS. Generally, about 45% of the school environment is deplorable, with most of the infrastructures needing repairs. The general observation is that there are many dilapidated structures in some of the schools in the state. However, lesthan 50% of the schools are in poor condition in terms of physical infrastructure and facilities. Examples of these state of affair is

43
that in pre-primary/primary schools in the state, 23% of the total classrooms are needing major repairs while 38% of the total classrooms have insufficient pupils/students’ furniture. In terms of accommodation for teachers, the boarding primary/JSS and SSS, there is less problem. However, plan for construction of more staff quarters and students hostels are in place. The ratio of boarding schools’ students to hostel is 1:112. Some staff quarters are in bad shape and need rehabilitation/renovation. The existence of State Educational Inspectorate and Monitoring Unit (SEIMU) responsible for quality assurance in basic and secondary education system, and the re-establishment of nine Zonal Education Offices for grass root monitoring and inspections of schools has greately improve the quality of teaching/learning process – this led to punctuality and preparedness of the teachers as well as using curriculum and giving class and home work to students etc. In addition, the state government has distributed such items as core textbooks, maps, charts and audio-visual aids to some secondary schools in the state for improve learning achievement.
2.3.5. Higher Education Higher education is constitutionally the responsibility of the Federal government. However, most states, like Jigawa state, established their own higher education institutions. Students can apply for entry either in federal or state institutions. The State has ten tertiary Institutions, of which eight are state-owned namely:
• College of Education, Gumel; • Jigawa State Polytechnic, Dutse; • College of Islamic and Legal studies, Ringim; • Binyaminu Usman College of Agriculture, Hadejia; • Informatics Institutes, Kazaure; • Jigawa College of Arts, Science & Remedial Studies • School of Nursing, Birnin Kudu; • School of Health Technology, Jahun, and; • Hussaini Adamu Federal Polytechnic Kazaure; • Federal University Dutse (FUD)
All these state institutions are under the supervision of the Ministry of Education, Science and Technology, with the exception of the Schools of Nursing and School of Health Technology, which are under the Ministry of Health, then Hussaini Adamu Federal Polytechnic, Kazaure and Federal University Dutse, which are under the Federal Government.

44
Table 2.13: Higher education statistics, 2012
Enrolment Teaching Staff Student/
M F T M F T Teacher Ratio
College of Education, Gumel 2,872 1,861 4,733 198 11 209 23 Jigawa State Polytechnic, Dutse 1,243 127 1,370 94 5 99 14
Binyaminu UsmanCollege of Agriculture, Hadejia 1532 95 1,627 46 3 49 33
College of Islamic & Legal Studies, Ringim 2,668 1,438 4,106 82 9 91 45
Informatics Institute, Kazaure 1,478 91 1,569 27 0 27 58
Jigawa College of Arts, Science & Remedial Studies 482 33 515 38 2 40 13
Total 10,275 3,645 13,920 485 30 515 27 Source: State MOEST The issue of what balance needs to be struck between tertiary and other levels of education, is the subject of international debate. A report argues that “it will be difficult to sustain rates of expansion in African tertiary education at current pace and costs and there is a call for urgent reforms in order to safeguard the quality of the education service.”2 The report calls for a control of pupils/students flows after basic education and for consideration of alternative modes of providing educational services at this level. Another important issue is about increasing the proportion of tertiary students enrolled in scientific and technical programmes. Promotion of science teaching is an urgent matter with strong effects in many related areas. All the institutions in Jigawa state have a very low staffing and enrolment situation, suggesting they are not operating at full capacity to the higher educational needs of the state. Apart from the college of education, with staff strength of 220, the rest of the tertiary institutions have between 9 to 46 teaching staff. Although the general staff students ratio stand as 1:21 that of school of nursing is too low with 1:2. This raises the issues of economy scale and cost-efficiency of state-level higher education institutions. Enrolment increases have been steady over the recent past years (see Table 2.14). It is reported that seven tertiary institutions in the state are not operating at targeted capacity due to inadequate facilities. For example, during the 2004/05 academic year, data available indicated that only 50% of the applicants were offered admission into College of Education, 30% into State Polytechnic, 25% into School of Nursing, 25% into School of Health Technology, 40% into the College of Islamic and Legal Studies and 65% into Informatics Institute.
2 “Dakar + 7 Report”, UNESCO/BREDA.

45
Table 2.14: Enrolments at HEIs, 2011/12-2013/14, Jigawa State
Year
Base Line Data Projected data per Simulation Model
2011/2012 2012/2013 2013/2014
Male Female Total Male Female Total Male Female Total
College of Education, Gumel 2,872 1,861 4,733 3,352 2,111 5,462 3,903 2,370 6,273
Jigawa State Polytechnic, Dutse 1,243 127 1,370 1,652 207 1,859 2,195 338 2,533
Binyaminu UsmanCollege of Agriculture, Hadejia 1,532 95 1,627 1,469 110 1,579 1,40
0 128 1,528
College of Islamic Legal Studies, Ringim 2,668 1,438 4,106 4,029 2,500 6,529 3,92
6 2,317 6,243
Informatics Institute, Kazaure 1,478 91 1,569 1,425 112 1,537 1,367 138 1,505
Jigawa College of Arts, Science & Remedial Studies 482 33 515 461 43 504 438 55 493
Source: State MOEST and Simulation Model Despite recent drive of female enrolment, females represent slightly over 10% of total enrolments at HEIs. Those few are mainly concentrated in some occupational areas, notably teaching and nursing, which are traditionally female dominated. Students from the richest households account for a disproportionately large share of all HEIs enrolments in Jigawa State. Nearly two-thirds of HEI students came from the richest 40 percent of households in 2006 (see Table 2.14) Table 2.14: Current enrolments at polytechnic/professional and university by household consumption quintile, 2006, Jigawa State
QUINTILE % 1 0.0 2 11.1 3 24.1 4 24.1 5 40.7
Source: NLSS All the tertiary institutions in the state are mainly funded by the state government and partly the Education Trust Fund (ETF).
2.3.6.Cost and Financing As elsewhere in Nigeria, the Jigawa State Government (JSG) annual budget is based on incremental budgeting. Budget implementation has been poor with large divergences between approved budgets and actual expenditures in most years, particularly with respect to capital expenditure. However, there is increased commitment by the new government to 100% release of budgetary provisions. There is also a renewed emphasis on accountability and transparency.
46
Funding Sources: The identified funding sources are:
i. Federal Government: (a) UBEC matching grant; (b) FTS monthly allowance; (c) ETF intervention; (d) Self help projects funds.
ii. State government with: (a) monthly salaries and allowances; (b) capital projects; (c) running costs; (d) provision of teaching and learning materials; (e) provision of scholarships to tertiary institutions students.
iii. 27 local government areas with: (a) payment of salaries to primary schools teachers; (b) assistance to LGEAs; (c) provision of uniform and other items for new intakes into junior secondary schools; (d) conveyance to and from schools of students etc.
iv. International development partners, including UNICEF, UNESCO, DFID, and the World Bank
v. Private donations, given by individuals towards the upliftment of education in the state.
vi. Philanthropic organizations, including (a) Ta’Annabi Foundation; (b) Sule Udi Memorial Foundation
Jigawa State Government is the main source of public funding for tertiary and secondary education and it provides the state matching grant to access UBE Intervention Funds. The salaries of the teaching and non-teaching staff at government primary schools are the responsibility of Local Government Education Authorities (see Table 2.15). In 2007, State and LGAs education budgets, taken together, represent 95 percent of all domestic public resources (42 percent by the state and 53 percent by LGAs). Federal direct funding (UBEC matching grant, Self help project and ETF) represented 5 percent. International development partners’ financial support has been marginal in the order of less than 1 percent of resources.
Financial Allocations and Expenditures Budget implementation was poor though based on incremental model. There was wide disparity between approved budget and actual release. The share of education in the State Government budget was 29.2% in 2012. However, 34% of the total allocation was not released, which represents the share of educational expenditure of 11.4%, that is far less than half of the approved total budget. There is increased commitment by the new government to 100% release of budgetary provisions with renewed emphasis on accountability and transparency for the year 2008 to 2012. In the Fiscal Year 2012, there has been a tremendous contribution from other sources outside the State Government. The resource envelope available from non-governmental sources in 2005 indicated the following: ETF – N37m; donor agencies – N15m; external loans – N338m for UBE; and private/community contributions (mainly in kind). Sub-sectoral budget allocations tend to be based on rolling projections on previous years rather than strategic priorities. The total allocation to Education in 2012 was approximately N11.8b. The breakdown was as follows:
• Basic education (including primary, JSS, ANFE, vocational, nomadic, moral education) - 22.3%;

47
• Post-basic education including senior secondary and tertiary – 28.5% Table 2.16 proportional allocation to different sectors, Jigawa State Ministry of Education, Science and Technology, 2008 -2012
Details 2008 2009 2010 2011 2012 Total state allocation to Primary schools
6,551,948,750
9,677,852,439
10,304,148,724
4,112,071,000
4,839,404,999
Total state allocation to JSS 1,154,726,250
1,688,603,372
1,818,379,187
1,912,953,000
1,289,575,552
Total State allocation to SSS 6,025,873,000
1,701,960,000
4,932,180,410
5,109,592,002
4,394,627,314
Total state allocation to Higher education
1,243,913,000 286,489,225 1,621,523,21
2 1,528,389,55
8 2,008,492,94
2 Total state allocation to other agencies 140,758,000 700,814,458 986,564,782 54,541,018 2,816,143,79
4 UBEC-IF N/A N/A N/A N/A N/A ETF N/A N/A N/A N/A N/A MDG N/A N/A N/A N/A N/A Local Government allocation to education
4,800,000,000
7,000,000,000
7,272,000,000
10,520,000,000
12,498,289,700
School fees collected N/A N/A N/A N/A N/A Donor funding N/A N/A N/A 177,071,445 126,905,000 others (specify) N/A N/A N/A N/A
TOTAL 19,917,219,000
21,055,719,494
26,934,796,314
23,414,618,023
27,973,439,300
Source: State MOEST Government allocated N8.7 Billion to Ministry of Education Science and Technology and its Parastatals in 2008. To address the issue of inadequate funding of education, the sector will require substantial investments. Table 2.17 Sub-sector allocation of Jigawa State Ministry of Education, Science and Technology, 2008 -2012
MDA 2008 2009 2010 2011 2012
Ministry of Education 4,749,000,0
00 5,035,079,00
0 3,461,999,93
1 4,112,071,00
0 9,879,325,8
96 Agency for Nomadic Education 8,500,000 109,100,000 252,360,714 291,140,007 543,217,000
SUBEB 7,698,175,0
00 11,257,355,8
11 12,122,527,9
10 12,753,020,0
03 7,592,212,6
24 Education Inspectorate Unit 7,901,000 30,325,929 30,735,593 27,812,010 46,875,872 Agency for Mass Education 111,080,916 147,374,069 160,778,001 271,659,828 State Library Board 54,985,229 62,893,904 57,865,000 151,267,178 Science and Technical Schools Board 669,773,000 794,740,000 769,900,051 739,685,008
1,630,622,478
College of Agric 152,510,000 184,889,225 175,899,615 244,261,000 392,875,977
Scholarship Board 132,857,000 504,422,384 493,200,502 420,664,008 1,458,891,3
26 Informatics Institute 42,000,000 414,454,226 388,783,528 386,675,542 663,887,573
Islamic Education Bureau 607,100,000 721,960,000 700,280,428 997,521,002 1,887,025,8
38

48
State Polytechnic 282,546,000 236,001,716 258,921,013 303,990,007 1,097,677,4
10 Islamic Legal Studies 158,257,000 195,490,288 184,719,037 239,505,000 504,465,406
College of Education 608,600,000 769,019,000 613,200,019 947,858,009 1,853,434,8
93
TOTAL 15,117,219,0
00 20,418,903,72
4 19,662,796,31
4 21,682,845,59
7 27,973,441,3
12 Source: State MOEST What emerges from the above tables is that the state is investing disproportionately in favour of senior secondary education. In 2007, the salaries for teachers of basic education schools (including pre-primary, primary, junior secondary, nomadic education) were N4.5 billion, while the salaries for senior secondary school teachers alone were N3.58 billion. The total staff salary for Science and Technical Schools Board in the year 2007 was N162.2 million. It is noted that a senior secondary school teacher earns a wage, which is 80% higher than his/her counterpart elsewhere in the country. It raises the question of the sustainability of such measure in view of the enormous challenge to further increase the enrolments, therefore teaching staff at senior secondary level. The costs of feeding in the year 2007 were N43 million for boarding primary schools, N25.9 million for junior secondary schools, N25.4 million for senior secondary schools and N90.2 million for Science and Technical Schools Board. In terms of capital costs, the data for pre-primary and junior secondary schools is not available for the year 2007. However, the total sum of capital project for senior secondary schools was N1.93 billion in 2006 and N666.5 million in 2007. The State Government has allocated the sum of N306 million for tertiary institutions in the State in the year 2007.
The state has not allocated resources for staff training and development. The priority was given to staff salary and other constructional investments. It was only in 2008 that sum of N468 million was allocated to train teachers in various categories in both the Ministry of Education and SUBEB. Unit Costs In 2012, unit costs of education per child per annum for all levels were as follows: Primary/Basic (N25,146); Senior Secondary (N208,586); Tertiary (N893,412). Relative costs to Parents and Government are as follows: Primary/Basic (Government, N6,600; Parents, N1,200); Senior Secondary (Government, N22,470, Parents, N4,000); Tertiary (Government N17,367; parents N8,000. According to the parents’ questionnaire administered during the education sector analysis (2008), it was found that the burden on parents was weighty considering the economic situation. The average social costs at all the levels were reported as follows: Pre-Primary - N20,000; Primary - N30,000; Secondary -N30,000; Tertiary - N50,000. The above unit cost data show that, probably except for secondary education, parents pay several times much more than the government for the education of their children.

49
State Finance As stated in J-SEEDS, Jigawa State mainly benefits from two sources of revenue, namely, the Internal Revenue, and the Federal Transfer that is statutory allocation from the Federation Account and Added Tax on which Jigawa is highly dependant (about 95% of total State revenue in 2005, see table 2.2). Internally generated revenue (IGR) accounted only for 5%, which makes the state highly vulnerable to the instability in the nation’s economy, in particular the oil.

50
Table 2.2: State government resources by income sources, 2008 – 2012 Jigawa (N million rounded) Details 20008 2009 2010 2011 2012 Statutory Allocation from Federal Government 25,000,000,000 27,000,000,000 24,570,000,000 30,000,000,000 36,154,744,000 Excess Crude Oil from Federal Government 17,000,000,000 5,000,000,000 7,960,000,000 8,600,000,000 633,823,000 Value Added Tax 4,000,000,000 5,000,000,000 6,465,000,000 7,500,000,000 8,270,790,000
Local Govt Resources
19,847,097,850
17,729,399,150
18,509,620,000
22,677,468,350
31,337,234,435 Internally generated revenue 2,364,305,000 2,955,295,000 3,246,500,000 4,018,455,000
4,607,000,000
Other Revenue 476,500,000 962,000,000 512,500,000 652,000,000
2,716,480,000 TOTAL 68,687,902,850 58,646,694,150 61,263,620,000 73,447,923,350 83,720,071,435 Sources: MOEST, Directorate of Budget and Economic Planning, Min of Finance and Ministry for Local Government.

51
The State finances are also completed by some grants and loans from the Federal Government and various international partners mostly used in the execution of agricultural, rural development programmes and water rehabilitation projects (J-SEEDS). One can note the Federal allocation to the State increased from N12.4 billion in 2002 to N18.5 billion in 2005, mainly to due to the increasing oil price. The State government has been instituting measures to improve its revenue drive in order to minimize its dependence on federation account allocation and borrowing, the objective being to generate enough internal revenue to pay salaries and overhead by 2010 and leave a surplus. In 2002, Jigawa State Government engaged itself in a process of strengthening the Public Expenditure Management (PEM), technically supported by DFID, “to promote a disciplined budget formulation and implementation, check arbitrariness in resource allocation, eliminate or curtail the incidence of extra budgetary expenditure and put a cap in public debt charges” (J-SEEDS). In the year 2012, LGAs has spent the sum of N12,498,289,727 as its support to education in the state. This amount reflects approximately 40% of the total state education budget. While the state has expended the sum of N15, 925,370,744 reflecting 52% of the education budget for the year. The remaining 8% was a contribution from othe stake holders (UBEC-IF, MDG, ETF and Donor Agencies). The chart below signifies the level of support accordingly. Figure 2.4A: State Education Budget and Sources of fund as a % of total expenditure
Source 2012 Actual Budget Expenditure

52
Figure 2.4B: State education budget utilisation 2012 among selected ESSPIN States Source: State Education Public Expenditure Reviews, 2007. Use updated figures

53
Conclusions of Section 2: Major Challenges to Educational Service Delivery • Enrolment trends in primary education, as it includes integrated islamiyya and nomadic
primary schools, are improving but there is still considerable inequality across LGAs and between boys and girls.
• Gender disparity in education has been found to be at the disadvantage of girl-child in both primary and secondary enrolment, except in islamiyya schools.
• In terms of teachers, gender disparity appears to be worse, in that only 13% of the teachers in all primary schools in the state are females. In the junior secondary schools female teachers constitute 8% of the teaching staff, around 14% in senior secondary and 6% in higher education institutions.
• Shortage of teachers in both the required quantity and quality, especially at basic education level. This particularly affects the sciences, technical subjects and English language.
• There is substantial infrastructural deficiency. The pupil/classroom ratio for basic education is currently 1:48. There are also problems with sanitation and water supplies. This indicates overcrowded classrooms, mostly in urban schools. As a result, many children are unable to have adequate learning access due to lack of facilities.
• Limited resources: this limitation incapacitates government from meeting the ever increasing educational needs of the population.
• Low private sector participation: the contribution of private sector to the educational pursuit of the state is very negligible. This leads to overwhelming dependence on the limited resources at the disposal of government amidst other competing demands.
• Low income among parents or stakeholders. This leads to inability of parents to meet the educational needs of their children. This also, along with other socio-cultural factors, act as constraining factors in raising enrolment and decreasing transition rates as parents would rather have their children go to farms and/or attend to some chores than be in schools.
• The high and increasing population of primary and junior secondary school age children who are out of school and which create enormous pressures and constraints in expanding equitable access to basic education.
• The integration of islamiya schools has greately improve access to education as well as enhance community participation in formal education system.

54
SECTION THREE: POLICY AND STRATEGIC FRAMEWORK
3.1 Key Policy Directions Jigawa State Government has developed its own policy goal in J-SEEDS, in line with the Federal Ministry of Education’s directions and policy framework, which is “to empower people through improved and non-discriminatory access to quality education. This will enable people to be productive members of society and positively contribute to social transformation. Provision of quality education is perhaps the surest and fastest way to human capital formation, which is sine-qua-non for a sustained development.” (J-SEEDS, 2004) The same document set ten specific policy targets to be achieved by 2022 for reaching quality education for all. The present education sector diagnosis is a good opportunity to review the current situation against the objectives defined in 2012 and monitor, whether or not, they have been achieved. “ “Raise school enrolment from the current level of 55% to 70% for Primary, 26% to
43% for JSS and 23% to 25% SSS by 2022 with particular emphasis on the enrolment and retention of girls;
Increase literate population from 52% to 60% by 2022; Achieve a 40:1 pupil/teacher ratio and pupil-classroom of 40:1 by 2022”
The policy targets as expressed in the J-SEEDS have been optimistic. There is yet the question of the feasibility of such objectives and targets has been appraised. However renewed and genuine efforts are made by the current administration to: I, Improve Access: through the introduction of free education for the female and the physically challenged, re-established the Agency for Mass Education and the Agency for Nomadic Education and set machinery in motion for the mainstreaming of Quranic-Tsangaya to into the formal education. ii. Improve Quality of Education at all levels by establishing SEIMU, re-establishment of Zonal Education Offices, recruited 788 teachers for senior secondary school contracted NTI / COE Gumel to train unqualified and under qualified teachers of pre-tertiary level and instituted Visitation Panels for the past time ever for the tertiary education etc iii. Improve the learning environment by means of renovating school buildings at all levels and constructing additional ones, supply of instructional materials The policy objective of education is contained in Government vision statement as follows:- To empower people through improved and non-discriminatory access to quality education and enable them to be productive members of the society In the light of the above consistent with the International Development Goals and the new Education For All (EFA) initiative to which Nigeria is committed to as per the year 2000 Dakar Declaration, specific goals of Jigawa State Education Sector are to:
• “Raise school enrolment from the current level of 55% to 70% for Primary, 26% to 43% for JSS and 23% to 25% SSS by 2022 with particular emphasis on the enrolment and retention of girls;
• Increase literate population from 52% to60% by 2022;

55
• Achieve a 40:1 pupil/teacher ratio and pupil-classroom of 40:1 by 2022”
ASC 2012 shows that primary enrolment is 475,035 out of which 200,173 are female, while JSS is 89,286 out of which 37,761 are female. The data shows the targets have been achieved and hence further targets can be set to improve further. The overall development objectives and priorities of the State Government are contained in the J-SEEDS 2004 which in line with the National Economic Empowerment and Development Strategy (NEEDS, 2004). The document emphasizes improving the standard of living of the people by pursuing pro-poor economic growth and social development policies. Specifically, these include: • The pursuit of poverty reduction through promotion of agricultural production and active
support for small and medium scale enterprises (SMEs), micro-enterprises and other income generating activities for self-employment and ultimate economic empowerment;
• Building a conducive investment climate in terms of institutions and infrastructure. This would involve massive resuscitation of dysfunctional infrastructure and the building of new ones particularly roads, power supply and others;
• Pursuing information and communication technology, and market infrastructure. This would also involve institutional reforms with focus on good governance and for effective and efficient institutions and processes;
Exploiting human resources and social development involving the development of formal and non-formal education, provision of effective health, delivery water and sanitation.

56
Policy Objective 1: Improving Access and Expanding Opportunities Policy Priorities
Specific Targets Key Strategies Activities
AEO1: Increase ECCDE Enrolment
• To increase ECCDE gross enrolment rate from 18% baseline in 2012 to 58% by 2022
• Reproduce and distribute 1,496 copies of ECCDE policy guidelines by 2022
• MOEST • SUBEB • LEAs • Schools • SBMCs • Sensitization and advocacy for
stakeholders’ participation in ECCDE Programm
• Establish ECCDE centers in 1,496 primary schools
• Encourage community/private support to ECCDE development to increase GER from 6% baseline 2012 to 10% by 2022.
• To reduce Pupil-Teacher ratio
from 65:1 baseline in 2012 to 40:1 by 2022.
AEO 2: To continue implementing free and compulsory universal basic education
• Increase gross intake rate from 53% and 38% in (2012) to 66% & 75% by 2022in Primary and JSS respectively.
• Conduct needs assessment for the establishment of more basic education schools
• Promote communities and SBMCs participation in sighting, constructing and managing schools especially in the underserved geographical areas
• Encourage private sector contribution in the establishment and management of primary and JSS schools
• Carry out regular media (radio, television and print) activities on enrolment into primary and JSS
AEO 3: Improve Gender parity index
• Improve GPI from 0.79 & 0.74 in 2012 to 0.99 &
• Intensify advocacy and sensitization of stakeholders on the needs and benefits for
•
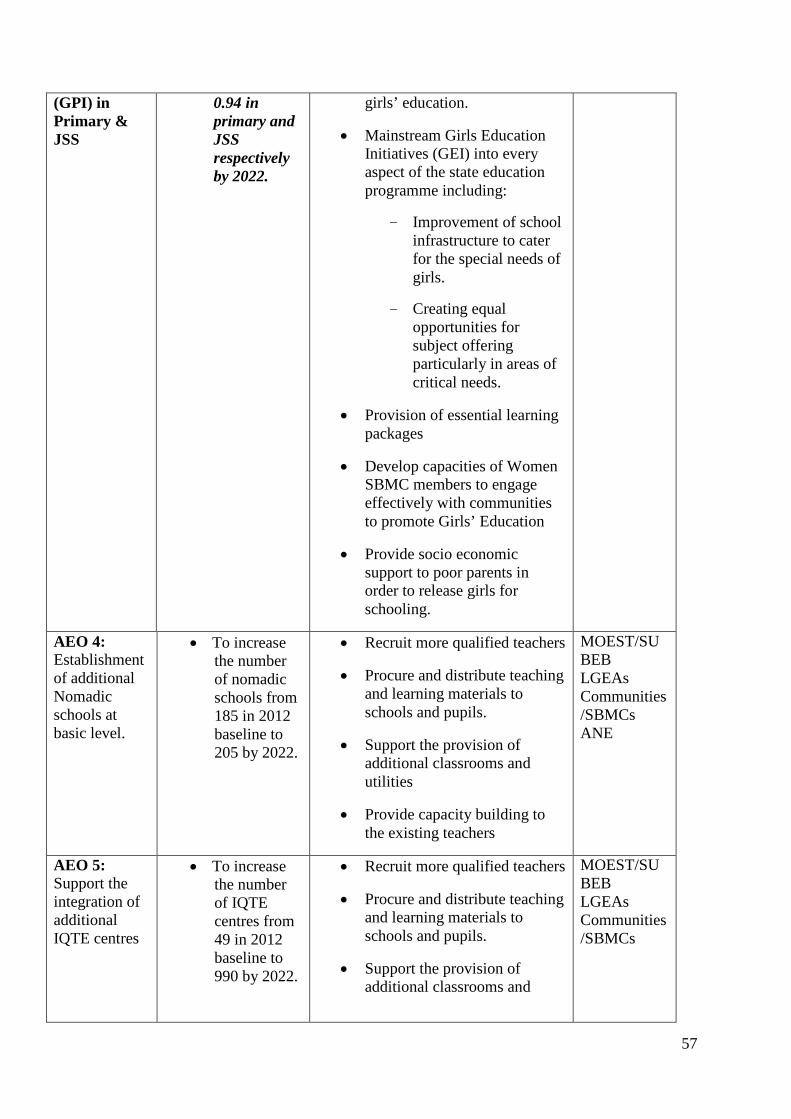
57
(GPI) in Primary & JSS
0.94 in primary and JSS respectively by 2022.
girls’ education.
• Mainstream Girls Education Initiatives (GEI) into every aspect of the state education programme including:
- Improvement of school infrastructure to cater for the special needs of girls.
- Creating equal opportunities for subject offering particularly in areas of critical needs.
• Provision of essential learning packages
• Develop capacities of Women SBMC members to engage effectively with communities to promote Girls’ Education
• Provide socio economic support to poor parents in order to release girls for schooling.
AEO 4: Establishment of additional Nomadic schools at basic level.
• To increase the number of nomadic schools from 185 in 2012 baseline to 205 by 2022.
• Recruit more qualified teachers
• Procure and distribute teaching and learning materials to schools and pupils.
• Support the provision of additional classrooms and utilities
• Provide capacity building to the existing teachers
MOEST/SUBEB LGEAs Communities/SBMCs ANE
AEO 5: Support the integration of additional IQTE centres
• To increase the number of IQTE centres from 49 in 2012 baseline to 990 by 2022.
• Recruit more qualified teachers
• Procure and distribute teaching and learning materials to schools and pupils.
• Support the provision of additional classrooms and
MOEST/SUBEB LGEAs Communities/SBMCs

58
utilities
• Provide capacity building to the existing teachers
AEO 6: Promote access to quality education for special needs children in the state
• To increase GER of children with special needs from 1%, 5% and 4% (2012) to 2.2%, 7% and 6% by 2022 for primary, JSS and SSS respectively.
• Improve enrolment drive campaigns at State, LGA and community levels.
• Recruit additional qualified teachers
• Procure and distribute teaching and learning materials
• Construct additional classrooms
• Provide water facilities
• Provide toilet facilities
AEO 7: improve classroom /pupil ratio in Basic Education and Senior Secondary Schools.
• To achieve student classroom ratio from 48:1, 65:1 and 55:1 in 2012 baseline to 40:1, 60:1 and 50:1 by 2022 in primary, JSS and SSS respectively.
• Construct 1000, 83, 85 and 51 classrooms in regular primary, Nomadic primary, Islamiyya primary and IQTE respectively by 2022
• Construct 194, 416 and 34 classrooms for regular JSS, Vocational JSS and Islamiyya JSS respectively by 2022
• Renovate 23% and 14% of classrooms with major repairs in primary and JSS by 2022
SUBEB, STEB, ANE, LGEAs MoEST, STEB and IEB
• Construct 627, 65 and 46 additional classrooms by 2022in regular SSS, Science/Vocational and SSS Islamiyya respectively.
• Provide additional student furniture to accommodate 104,314 students by 2022.
• Renovate 3% of classrooms in SSS by 2022
AEO 8: expand access to Science,
• To increase Science; Technical
• Establish more science; technical and vocational schools.
• Construct 50 additional
MOEST
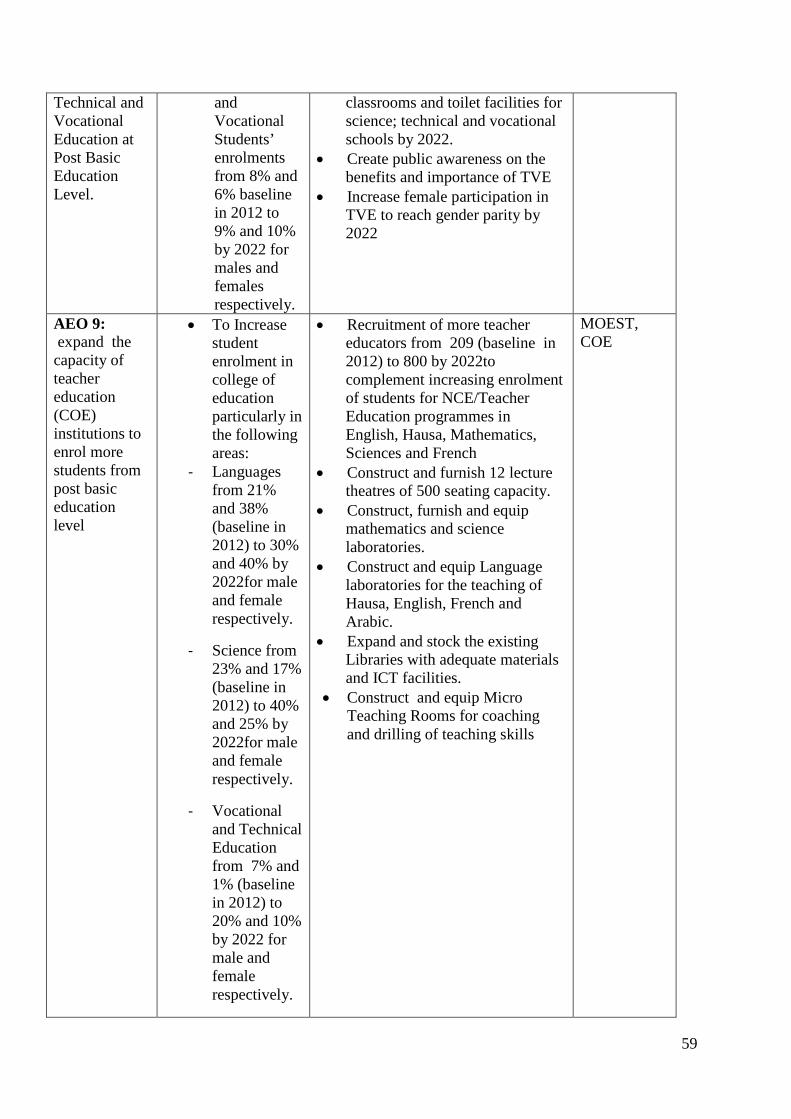
59
Technical and Vocational Education at Post Basic Education Level.
and Vocational Students’ enrolments from 8% and 6% baseline in 2012 to 9% and 10% by 2022 for males and females respectively.
classrooms and toilet facilities for science; technical and vocational schools by 2022.
• Create public awareness on the benefits and importance of TVE
• Increase female participation in TVE to reach gender parity by 2022
AEO 9: expand the capacity of teacher education (COE) institutions to enrol more students from post basic education level
• To Increase student enrolment in college of education particularly in the following areas:
- Languages from 21% and 38% (baseline in 2012) to 30% and 40% by 2022for male and female respectively.
- Science from 23% and 17% (baseline in 2012) to 40% and 25% by 2022for male and female respectively.
- Vocational and Technical Education from 7% and 1% (baseline in 2012) to 20% and 10% by 2022 for male and female respectively.
• Recruitment of more teacher educators from 209 (baseline in 2012) to 800 by 2022to complement increasing enrolment of students for NCE/Teacher Education programmes in English, Hausa, Mathematics, Sciences and French
• Construct and furnish 12 lecture theatres of 500 seating capacity.
• Construct, furnish and equip mathematics and science laboratories.
• Construct and equip Language laboratories for the teaching of Hausa, English, French and Arabic.
• Expand and stock the existing Libraries with adequate materials and ICT facilities.
• Construct and equip Micro Teaching Rooms for coaching and drilling of teaching skills
MOEST, COE

60
- Art/Social Sc. & from 48% and 42% (baseline in 2012) to 49% and 43% by 2022for male and female respectively.
• Increase enrolment of persons with special needs by 25% at COE by 2022
• Introduce courses for various special need education
• Provide facilities and equipment for persons with special needs.
AEO 10: To expand admission capacity of Polytechnics and Monotechnics to enrol more students.
• To increase Enrolment capacity in Polytechnic from
12% and 3.5% (2012) to 20% and 5% by 2022 for male and females respectively
• To increase Enrolment capacity in Monotechnics from 60% and 45.5% (2012) to 65% and 50% by 2022for male and females respectively
• Recruit additional 523 lecturers for Polytechnic and Monotechnics by 2022
• Construct and furnish 12 additional Classrooms of 120 seating capacity.
• Construct, furnish and equip science laboratories.
MOEST, Polytechnic and Monotechnics
AEO 11: Improve enrolment rate into adult Literacy with focus on women
• To achieve adult literacy rate from the baseline of 66% and 51% in 2012 to 88% and 73.8% by 2022for men and women respectively
• To increase the enrolment of adult learners in basic literacy programme from the baseline of 38,901 in 2012 to 49,797 by 2022
• Provide primers and relevant learning materials for adult learners.
• Improved the monthly allowances for Facilitators and Instructors.
• Establish forums for collaboration between State, LGAs and CBOs
MOEST and AME

61
to monitor the continuation of NFE programmes.
Policy Objective 2: Ensuring Quality and Relevance of Education Provision
2. Priorities Specific Targets Key Strategies/Options Responsible Agencies
QTR1: Improve ECCDE services
• To train 1500 teachers in public and 220 in private schools on implementation of Pre-primary curriculum by 2022
• To provide 226,530 instructional materials for ECCDE by 2022
• Retrain 99% of pre-primary teachers by 2022
• Provide Instructional materials for
ECCDE
• SUBEB
QTR2: Enhanced the use and application of curriculum at all levels of basic education
• To make available all the relevant curriculums to 3,454 Primary and JSS by 2022.
• Procure and distribute National Curriculum for all subjects
• Train teachers on how to use the National Curriculum, while improving teachers capacity to adopt the National curriculum to suit state peculiarities
• SUBEB, LGEAs
• Improve internal efficiency
• Improve flow rates to an average of 97 %, 2% and 1% as promotion, repetition and dropout rates respectively in all grades by 2022in basic education
• Attain 63% and 78% increase of completion rate by 2022over the 62,427 and 21,604 in 2012 for graduates of primary and JSS.
• Employ a range of community and school-based mechanisms to reduce dropouts, especially girls’ dropouts
• Enhance the teaching and learning of Hausa Language in Primary 1 – 3
• Provide fund for direct schools funding
• MOEST
• SUBEB
• SIEMU
• JERD
• Zonal inspectorate
• A sustainable policy on textbook and teaching-learning materials
• Establish policy on textbooks and teaching-learning materials
• Provision of 4 core textbooks to 100% of the students by
MOEST SUBEB LGEAs

62
2. Priorities Specific Targets Key Strategies/Options Responsible Agencies
utilisation 2022(lifespan: 3 years for textbooks and 4 years for teacher guides)
• Professional and pedagogical upgrading of teachers
• Train 100% of each of the 42%, 10% and 8% unqualified teachers for primary, JSS and SSS respectively by 2022
• Ensure teachers register with TRCN
• In liaison with COEs and National Teachers’ Institute, provide professional capacity building to teachers on regular basis.
MOEST SUBEB
• Improving school management capacities
• Organize training and workshops at State and Zonal levels for supervisory inspectors, PTA & SBMC members (250 supervisors and Inspectors to be trained continuously in school management through 2022
• Continuous training for all school head and principals
MOEST COE SUBEB SEIMU
• Development of sustainable quality assurance mechanisms
• Conduct regular employment of qualified teachers through intensive screening, aptitude test and interviewing the applicants to ascertain capable teachers.
• Ensure total coverage of the syllabus
• Provide instructional materials to support teachers
MOEST CSC SUBEB
• Intensify the monitoring of learning achievement
• Strengthen the organ responsible for MLA
• Conduct MLA Test tri–annually: training of teachers, inspectors on the MLA techniques, employ the utilisation of results in decision making as well as it’s periodic publication for public consumption
MOEST SUBEB LGEAs SEIMU
QTR3: Improve the quality and relevance of senior secondary
• Ensuring total coverage of the syllabus, especially English Language, Mathematics and Science Subjects
• Attract and retain English Language, Mathematics and Science teachers
• Increase the percentage of students passing with 5 credits or more to 70% by 2022.
• MOEST
• SIEMU
• SUBE

63
2. Priorities Specific Targets Key Strategies/Options Responsible Agencies
education • Mobilise and encourage students to study sciencce subjects
• implement policy for minimum standards for science facilities (labs, equipment, etc) by 2022.
B
• Increased private sector contribution to SSS development
• Be firm to the guidelines for establishment of private schools.
• Provide incentives to encourage private sector participation
• MOEST
QTR4: Improve the quality and relevance of special education at COE
• Improve learning condition for 5% and 2% enrolment by 2022 over the 2% and 2% in 2012 for male and female persons with special need
• Provide enabling environment for special need education
• Provide incentive packages for persons with special needs
MOEST
QTR 5: To enhance the quality of teaching/learning in college of Education.
• To increase the number of qualified teachers graduating from College of Education, from the base line of 2,539 in 2012 to 9,521 by 2022.
• Improved the capacity of teachers (168 by 2022) in the effective application of the following methods of teaching : Child Centred Approach. Activity Based Approach to
Teaching & Learning. Group Dynamics in Teaching. Development and use of
instructional materials. Micro Teaching Techniques. Demonstration Techniques. Effectiveness of Field
trips/excursion/surveys in teaching.
Problem Solving Approach in Teaching and Learning.
The use of Action Research in Teaching and Learning.
MOEST, COE
• Improved the capacity of 230 teachers by 2022 in the effective application of the following methods of teaching to improve the literacy level of English Language learners.
*Child Centred Approach. *Activity Based Approach to Teaching & Learning. * Group Dynamics in Teaching. * Drilling of teachers in

64
2. Priorities Specific Targets Key Strategies/Options Responsible Agencies
communicative competence teaching methodology. * Use of dramatization, role plays, simulation and games in the teaching of English language. * Drilling and coaching of English language teachers in the use of jolly phonics as a technique to improve the listening, speaking and reading skills of English language learners. * Development and use of instructional materials. Micro Teaching Techniques. * Demonstration Techniques. Effectiveness of Field trips and excursions in teaching. * Problem Solving Approach in Teaching and Learning. * The use of Action Research in Teaching and Learning. • * Improving the capacity of
teachers to develop bench marks for English language teaching across the levels of basic education (lower, middle and upper basic education levels)

65
2. Priorities Specific Targets Key Strategies/Options Responsible Agencies
• Provision of Instructional Materials to cater for the increasing number of students learning Hausa, English, French, Mathematics and Sciences.
*Provision of stationery materials (charts, diagrams, pictures, drawings, maps, etc) for the teaching of English, Hausa, French, Mathematics and Sciences. *Provision of teaching and learning equipments such as projectors, computers, TV sets, cameras, DVD, CDs, Radios e.t.c. for the teaching of Hausa, English, French, Mathematics and Sciences. • Provision of Science teaching
equipment and consumables.
QTR 6: To enhance the quality of teaching/learning in Polytechnic and Monotechnics.
• To increase the number of graduating enrolment from Polytechnic and Monotechnics, from the base line of 18,591 and 1,784 in 2012 to 27,194 and 3\7,772 by 2022 for males and females respectively.
• Improved the 99% capacity of 1,238 teachers by 2022 in order to enhances performances in breading efficient workforce and economic administrators to the state.
MOEST, Polytechnic & CILS, COA, Informatics & JICORAS
• Provision of Science teaching equipment and consumables
QTR 7: Improve adult literacy Pass Rates, with a focus on continuing education and remedial studies.
To attain adult literacy Pass Rate of 70% and 70% by 2022 from the base line of 68% and 0% in 2012 for continuing education and remedial studies respectively.
• Increase the availability of relevant and ‘easy to read’ literature for new literates
• Motivate facilitators /instructors with adequate monthly remunerations
• Induce international development partners into NFE programmes, especially mass literacy programmes
• MOEST • AME

66
Policy Objective 3: Improving Educational Planning and Management (PME) 4. Priorities
Specific Targets
Key Strategies/Options Responsible Agency
PME1: Functional EMIS
• Capacity building/development on ICT Application and Data Analysis for EMIS personnel.
• Regular systematic training on various aspects of educational data work at all levels of operation (data collection, storage, processing, retrieval, analysis, report development and generating key-performance indicators)
• Provision of ICT to support e-learning and e-working environment in the MOEST, MDAs and SUBEB.
• Provision of computers, laptops, printers, photocopiers, projectors and scanners.
• Full-scale maintenance and updating of ICT tools (as an integral part of the overall ICT strategy) by competent personnel at all levels.
MOEST, MDAs, SUBEB & LGEAs.
• Institutionalizing the use of EMIS data in decision making.
• Ensuring efficient record keeping • Generating reliable data for
meaningful decision making by 2022
MOEST, MDAs & SUBEB
PME2: Planning and management capacities strengthened at all levels
• Personnel re-skilling
• Intensive, short term, job-demand-driven, hands-on training on a regular basis, predicted on systematic needs assessment
• Resource Planning and management-related training and continuous retraining for: directors, education officers, admin and technical personnel and LGEAs Education Secretaries, inspectors, head teachers & classroom teachers etc.
• Attaining computer literacy and fluency by 2022
• Attaining data analysis capability with aid of computer by 2022
MOEST, MDAs & SUBEB

67
4. Priorities
Specific Targets
Key Strategies/Options Responsible Agency
• Decentralization of authorities for Educational Management
• Streamlining responsibilities among different units and agencies of the Ministry through regular inter-departmental and inter-Agency dialogues
• Effective devolution of decision making and action to Local Governments Education Authorities, Educational Institution and Management Committees in respects of staff, student/pupil discipline, school maintenance etc
MOEST, MDAs & SUBEB
• Continuous update of the Institutionalized 3-year ESOP
• Annual review of SESOP to ensure that SESOP remains responsive to the changing educational needs and aspirations of the State and to build SESOP into the monitoring and evaluation activities of the sector (see PME3)
• Application of participatory methodologies in the development of SESOP, including regular consultations with stakeholders as well asselection and training of competent personnel in developing SESOP
• Holding evaluation meeting on the process of SESP & SESOP
MOEST, LGEAs and SEIMU
PME3: Empowering monitoring and evaluation
• Establishment of appropriate reporting and dissemination mechanisms
• Strengthen monitoring and evaluation activities into the structure of Education MDAs, Zonal Offices & LGEAs, etc)
• Integration of training and re-training on monitoring, evaluation, reporting and dissemination of information into all management-related training programmes
• Establishment of monitoring indicators and benchmarks at all levels as a prelude to sector performance report
• Tasks and schedules properly spelt out
• MOEST, MDAs, SUBEB, SEIMU, Zonal Offices & LGEAs, etc)
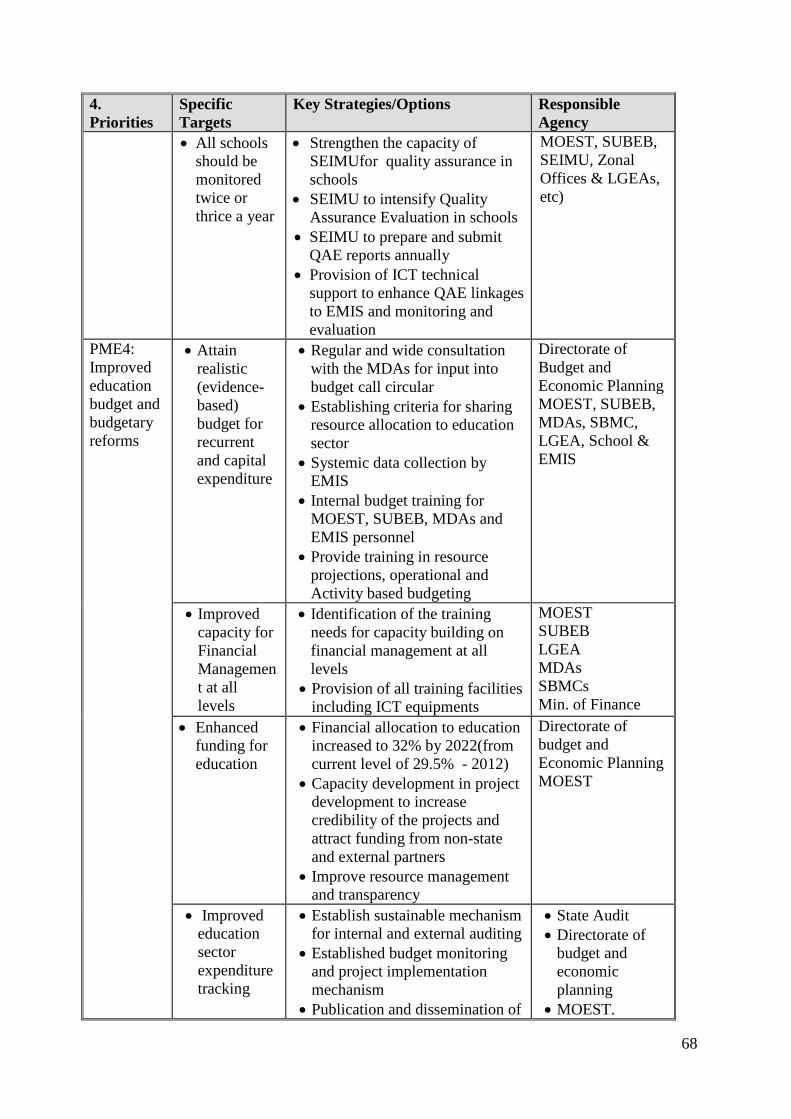
68
4. Priorities
Specific Targets
Key Strategies/Options Responsible Agency
• All schools should be monitored twice or thrice a year
• Strengthen the capacity of SEIMUfor quality assurance in schools
• SEIMU to intensify Quality Assurance Evaluation in schools
• SEIMU to prepare and submit QAE reports annually
• Provision of ICT technical support to enhance QAE linkages to EMIS and monitoring and evaluation
MOEST, SUBEB, SEIMU, Zonal Offices & LGEAs, etc)
PME4: Improved education budget and budgetary reforms
• Attain realistic (evidence-based) budget for recurrent and capital expenditure
• Regular and wide consultation with the MDAs for input into budget call circular
• Establishing criteria for sharing resource allocation to education sector
• Systemic data collection by EMIS
• Internal budget training for MOEST, SUBEB, MDAs and EMIS personnel
• Provide training in resource projections, operational and Activity based budgeting
Directorate of Budget and Economic Planning MOEST, SUBEB, MDAs, SBMC, LGEA, School & EMIS
• Improved capacity for Financial Management at all levels
• Identification of the training needs for capacity building on financial management at all levels
• Provision of all training facilities including ICT equipments
MOEST SUBEB LGEA MDAs SBMCs Min. of Finance
• Enhanced funding for education
• Financial allocation to education increased to 32% by 2022(from current level of 29.5% - 2012)
• Capacity development in project development to increase credibility of the projects and attract funding from non-state and external partners
• Improve resource management and transparency
Directorate of budget and Economic Planning MOEST
• Improved education sector expenditure tracking
• Establish sustainable mechanism for internal and external auditing
• Established budget monitoring and project implementation mechanism
• Publication and dissemination of
• State Audit • Directorate of
budget and economic planning
• MOEST.
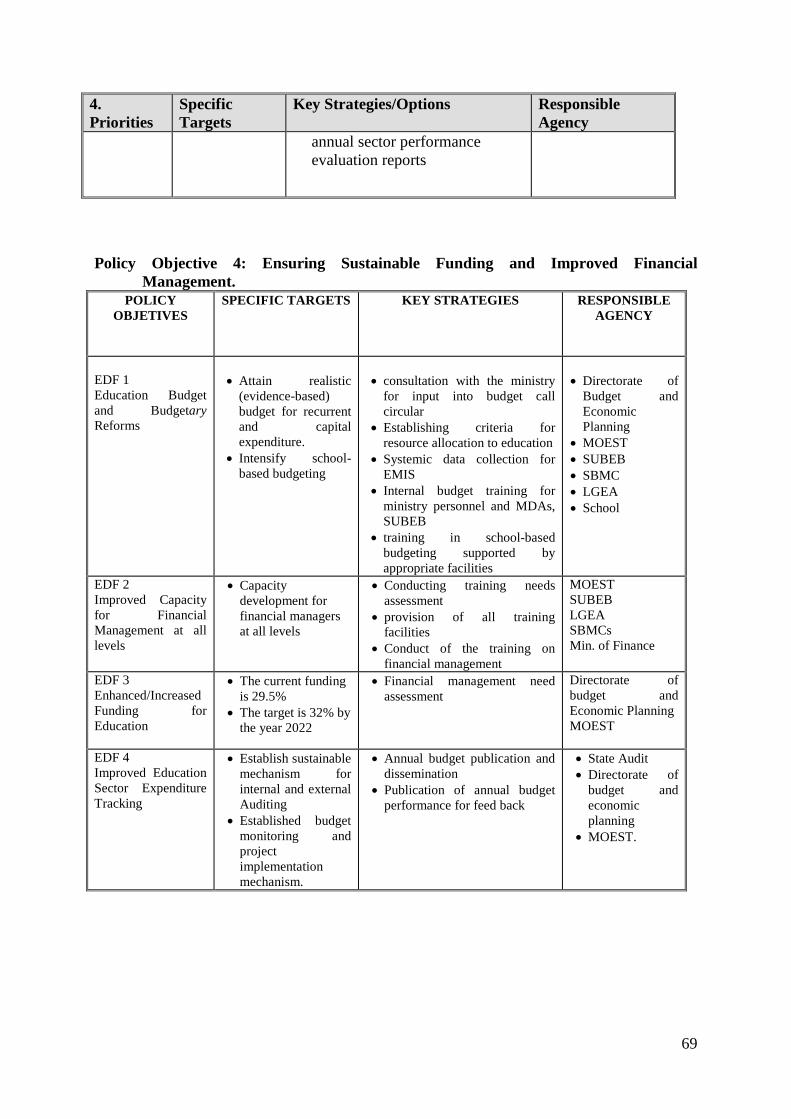
69
4. Priorities
Specific Targets
Key Strategies/Options Responsible Agency
annual sector performance evaluation reports
Policy Objective 4: Ensuring Sustainable Funding and Improved Financial
Management. POLICY
OBJETIVES SPECIFIC TARGETS KEY STRATEGIES RESPONSIBLE
AGENCY
EDF 1 Education Budget and Budgetary Reforms
• Attain realistic
(evidence-based) budget for recurrent and capital expenditure.
• Intensify school-based budgeting
• consultation with the ministry
for input into budget call circular
• Establishing criteria for resource allocation to education
• Systemic data collection for EMIS
• Internal budget training for ministry personnel and MDAs, SUBEB
• training in school-based budgeting supported by appropriate facilities
• Directorate of
Budget and Economic Planning
• MOEST • SUBEB • SBMC • LGEA • School
EDF 2 Improved Capacity for Financial Management at all levels
• Capacity development for financial managers at all levels
• Conducting training needs assessment
• provision of all training facilities
• Conduct of the training on financial management
MOEST SUBEB LGEA SBMCs Min. of Finance
EDF 3 Enhanced/Increased Funding for Education
• The current funding is 29.5%
• The target is 32% by the year 2022
• Financial management need assessment
Directorate of budget and Economic Planning MOEST
EDF 4 Improved Education Sector Expenditure Tracking
• Establish sustainable mechanism for internal and external Auditing
• Established budget monitoring and project implementation mechanism.
• Annual budget publication and dissemination
• Publication of annual budget performance for feed back
• State Audit • Directorate of
budget and economic planning
• MOEST.

70
SECTION FOUR: MANAGEMENT AND IMPLEMENTATION FRAMEWORK
4.1 Performance Target and Indicators Performance indicators are key component of the implementation and monitoring process. Quantitative and qualitative data will guide the planning and management process, inform sector performance assessment and, as a result, any subsequent decision-making relating to the implementation of the SESP and the rolling, medium-term SESOP. Such implementation and monitoring system is aimed at ensuring a comprehensive management and evaluation framework which will yield timely, relevant and evidence-based information for decision-making and necessary adjustment. The performance monitoring system will address the following needs for ensuring sector performance:
a) The need to have a holistic and comprehensive grasp of the status of implementation in relation to SESP and SESOP targets Policy makers and decision makers, including managers of implementing agencies and other stakeholders at all levels, will be informed about the issues, challenges, successes and progress in the sector so that evidence-based analyses are made and appropriate decisions are taken that support commitment to the relevant issues.
b) The need to maintain focus on problem areas, key issues, critical concerns and priorities There should be provision for special and possibly unforeseen policy directions which may need particular monitoring. The tracking of indicators will provide an early warning of unexpected circumstances. The different policy options and scenario, which were thought out during the SESP process, will be reviewed and employed to help cope with new developments.
c) The need to generate support for educational interventions
Specific interventions will be necessary in order to correct possible shortcomings and to increase the probability of the successful implementation of SESP and SESOP. This may call for a revision of targets, options and indicators, especially during annual sector reviews and at the stage of the preparation of a new SESOP.
d) The need to provide feedback to all stakeholders The monitoring system should assist in providing clear and unambiguous feedback to stakeholders through periodic reporting procedures. It involves the communication and information on the achievements by means of indicators, and more importantly a solid technical work to analyze the prevailing problems as well as the ways and means for improving the sector performance. Such indicator-feedback system will encourage an effectively participatory approach in educational development.

71
Table 5.1 Equitable Access EDUCATIONAL INDICATORS BASELINE PROJECTION RESULTS EXPENDITURE FRAMEWORK 2011 2012 2013 2014 2015 2016 2017 2018 2019 2020 2021
UNIT COSTS 2012 2013 2014 2015 2016 2017 2018 2019 2020 2021 2022
ACCESS AND EQUITY
Literacy rates (16 +) 98% 98% 98% 100% 98% 96% 94% 92% 91% 90% 88% Male 123% 123% 124% 126% 123% 121% 118% 116% 113% 111% 110%
Female 73% 73% 74% 75% 74% 73% 72% 71% 70% 69% 68%
Gender parity index 0.59 0.59 0.60 0.60 0.60 0.60 0.61 0.61 0.62 0.62 0.62
Gross enrolment ratios (GER) Pre-primary 18% 22% 26% 30% 34% 38% 42% 46% 50% 54% 58%
Male 18% 22% 26% 30% 34% 38% 42% 46% 50% 54% 58%
Female 19% 23% 27% 31% 35% 39% 43% 47% 51% 55% 59%
Gender parity index 1.04 1.04 1.03 1.03 1.03 1.02 1.02 1.02 1.02 1.02 1.02
Share of private education 32% 28% 25% 23% 22% 21% 20% 19% 18% 18% 17%
Primary 56% 56% 56% 57% 59% 60% 62% 65% 68% 71% 74% Male 63% 62% 63% 65% 67% 69% 71% 73% 76% 79% 81%
Female 50% 48% 48% 49% 50% 51% 53% 56% 60% 63% 67%
Gender parity index 0.79 0.77 0.76 0.75 0.74 0.74 0.75 0.77 0.79 0.81 0.82
Share of private education 3% 4% 5% 6% 6% 6% 6% 6% 6% 5% 5%
Junior Secondary 26% 24% 23% 23% 24% 26% 29% 32% 35% 38% 43% Male 30% 29% 28% 28% 29% 31% 35% 40% 44% 49% 54%
Female 22% 20% 18% 17% 18% 20% 22% 23% 25% 27% 31%
Gender parity index 0.74 0.69 0.64 0.63 0.64 0.65 0.62 0.59 0.56 0.56 0.57
Share of private education 2% 3% 5% 6% 6% 7% 7% 7% 7% 7% 8%
Senior Secondary 23% 22% 22% 20% 19% 19% 19% 20% 22% 26% 29% Male 38% 36% 36% 34% 32% 31% 31% 33% 36% 41% 46%
Female 10% 9% 9% 8% 8% 8% 8% 9% 11% 13% 14%
Gender parity index 0.25 0.26 0.25 0.25 0.25 0.25 0.26 0.28 0.31 0.31 0.31

72
Share of private education 1% 1% 1% 1% 1% 1% 1% 2% 2% 2% 2%
Higher 4% 4% 5% 5% 6% 6% 7% 8% 8% 9% 10% Male 6% 7% 8% 8% 9% 10% 11% 12% 13% 14% 15%
Female 2% 2% 2% 2% 3% 3% 3% 4% 4% 4% 5%
Gender parity index 0.26 0.36 0.36 0.37 0.37 0.38 0.38 0.39 0.40 0.40 0.41
Registration rates to: Junior Secondary Male 39% 43% 47% 51% 56% 60% 64% 68% 72% 76% 80%
Female 39% 42% 45% 48% 50% 53% 56% 59% 61% 64% 67%
Senior Secondary Male 100% 100% 100% 100% 100% 100% 100% 101% 101% 101% 101%
Female 30% 33% 35% 38% 41% 44% 47% 50% 52% 55% 58% Source: Jigawa State simulation model

73
Table 5:2 Quality and Efficiency (Public School) QUALITY AND EFFICIENCY BASELINE PROJECTION RESULTS
2011 2012 2013 2014 2015 2016 2017 2018 2019 2020 2021
2012 2013 2014 2015 2016 2017 2018 2019 2020 2021 2022
Basic education
Survival rate M 27.5% 31.2% 35.2% 39.3% 43.6% 48.2% 52.9% 57.9% 63.2% 68.6% 74.4%
Survival rate F 23.5% 26.4% 29.4% 32.7% 36.1% 39.9% 43.8% 48.0% 52.5% 57.2% 62.3%
Wastage rate M 168.6% 141.9% 119.9% 101.4% 85.8% 72.3% 60.6% 50.3% 41.3% 33.2% 26.0%
Wastage rate F 221.3% 191.6% 165.9% 143.7% 124.2% 107.1% 92.0% 78.5% 66.5% 55.7% 46.0%
Coefficient of efficiency M 37.2% 41.3% 45.5% 49.6% 53.8% 58.0% 62.3% 66.5% 70.8% 75.1% 79.3%
Coefficient of efficiency F 31.1% 34.3% 37.6% 41.0% 44.6% 48.3% 52.1% 56.0% 60.1% 64.2% 68.5%
Pupil/teacher ratios Pre-primary
Public 65.3 62.7 60.2 57.7 55.2 52.6 50.1 47.6 45.1 42.5 40.0
Private 30.0 30.0 30.0 30.0 30.0 30.0 30.0 30.0 30.0 30.0 30.0
Primary Public 37.8 38.0 38.2 38.4 38.6 38.9 39.1 39.3 39.5 39.8 40.0
Private 14.0 14.0 14.0 14.0 14.0 14.0 14.0 14.0 14.0 14.0 14.0
Junior Secondary Public 23.7 19.9 14.5 10.5 7.6 5.5 4.0 2.9 2.1 1.5 1.1
Private 12.8 12.8 12.7 12.7 12.7 12.7 12.6 12.6 12.6 12.6 12.5
Senior Secondary Public 22.5 17.0 12.8 9.7 7.3 5.5 4.1 3.1 2.3 1.7 1.3
Private 9.4 9.4 9.3 9.3 9.2 9.2 9.1 9.1 9.1 9.0 9.0
Pupil/classroom ratios Pre-primary
Public 60.9 58.8 56.7 54.6 52.5 50.4 48.4 46.3 44.2 42.1 40.0
Private 32.0 32.0 32.0 32.0 32.0 32.0 32.0 32.0 32.0 32.0 32.0
Primary Public 50.9 49.3 48.6 48.0 47.4 46.8 46.2 45.7 45.1 44.5 44.0

74
Private 42.6 42.7 42.7 42.8 42.8 42.8 42.9 42.9 42.9 43.0 43.0
Junior Secondary Public 64.6 74.1 73.4 72.6 71.9 71.1 70.4 69.7 69.1 68.3 67.6
Private 17.3 17.3 17.3 17.2 17.2 17.2 17.1 17.1 17.1 17.0 17.0
Senior Secondary Public 52.0 292.7 302.7 274.3 236.8 196.4 156.8 121.4 91.4 67.2 48.3
Private 7.3 7.3 7.3 7.2 7.2 7.2 7.1 7.1 7.1 7.0 7.0 Source: Jigawa State simulation model

75
Table 5.3 Resource Mobilization (N000) BUDGETARY AND FINANCING FRAMEWORKS (000 NAIRA) BASELINE PROJECTION RESULTS
2011 2012 2013 2014 2015 2016 2017 2018 2019 2020 2021 2012 2013 2014 2015 2016 2017 2018 2019 2020 2021 2022
Pre-primary education (public) 1,123,611 1,330,376 1,612,864 1,941,483 2,324,637 2,772,563 3,297,816 3,915,920 4,646,243 5,513,194 4,554,608
Recurrent costs 407,913 521,061 697,636 906,056 1,152,331 1,443,790 1,789,430 2,200,384 2,690,551 3,277,457 3,983,466 Construction & other investments 715,699 809,314 915,228 1,035,427 1,172,306 1,328,774 1,508,387 1,715,536 1,955,692 2,235,737 571,142 Unit cost 25 22 22 21 22 22 23 24 25 27 20 Salaries as % of recurrent total 65% 73% 74% 75% 76% 77% 78% 79% 80% 81% 82% Recurrent as % of total 36% 39% 43% 47% 50% 52% 54% 56% 58% 59% 87%
Primary education (public) 10,349,287 9,492,359 10,515,205 11,766,150 12,798,518 14,117,139 15,826,427 17,491,972 19,304,055 21,305,652 22,578,222
Recurrent costs 8,934,696 8,023,759 8,456,749 9,061,181 9,859,189 10,740,064 11,765,621 13,013,458 14,411,671 15,964,208 17,687,181 Construction & other investments 1,414,592 1,468,600 2,058,457 2,704,969 2,939,329 3,377,074 4,060,805 4,478,514 4,892,384 5,341,444 4,891,042 Unit cost 22 20 22 23 24 25 26 27 28 28 28 Salaries as % of recurrent total 64% 76% 76% 76% 76% 76% 76% 76% 76% 75% 75% Recurrent as % of total 86% 85% 80% 77% 77% 76% 74% 74% 75% 75% 78%
Junior Secondary (public) 3,779,944 3,559,460 4,713,764 6,855,948 10,267,807 15,860,846 24,922,919 39,153,714 61,592,467 97,812,668 158,161,857
Recurrent costs 3,725,393 3,507,539 4,579,563 6,462,695 9,621,238 14,996,190 23,987,459 38,144,387 60,423,172 96,300,490 156,709,569 Construction & other investments 54,551 51,921 134,201 393,253 646,569 864,656 935,460 1,009,327 1,169,295 1,512,179 1,452,288 Unit cost 42 43 60 86 121 167 229 317 444 625 880 Salaries as % of recurrent total 70% 82% 86% 88% 90% 92% 93% 93% 94% 95% 95% Recurrent as % of total 99% 99% 97% 94% 94% 95% 96% 97% 98% 98% 99%
Senior Secondary (public) 3,713,469 3,365,548 4,319,835 5,464,171 7,138,016 9,550,298 13,578,930 20,265,151 31,659,780 51,135,818 78,846,950
Recurrent costs 3,707,754 3,360,995 4,302,253 5,386,758 6,996,955 9,288,079 13,118,534 19,441,872 30,158,642 48,571,597 77,865,660 Constructions & other investments 5,715 4,553 17,582 77,413 141,062 262,219 460,396 823,278 1,501,138 2,564,221 981,290 Unit cost 58 54 69 92 123 166 225 308 423 580 767 Salaries as % of recurrent total 59% 75% 81% 84% 87% 89% 90% 91% 92% 93% 94%
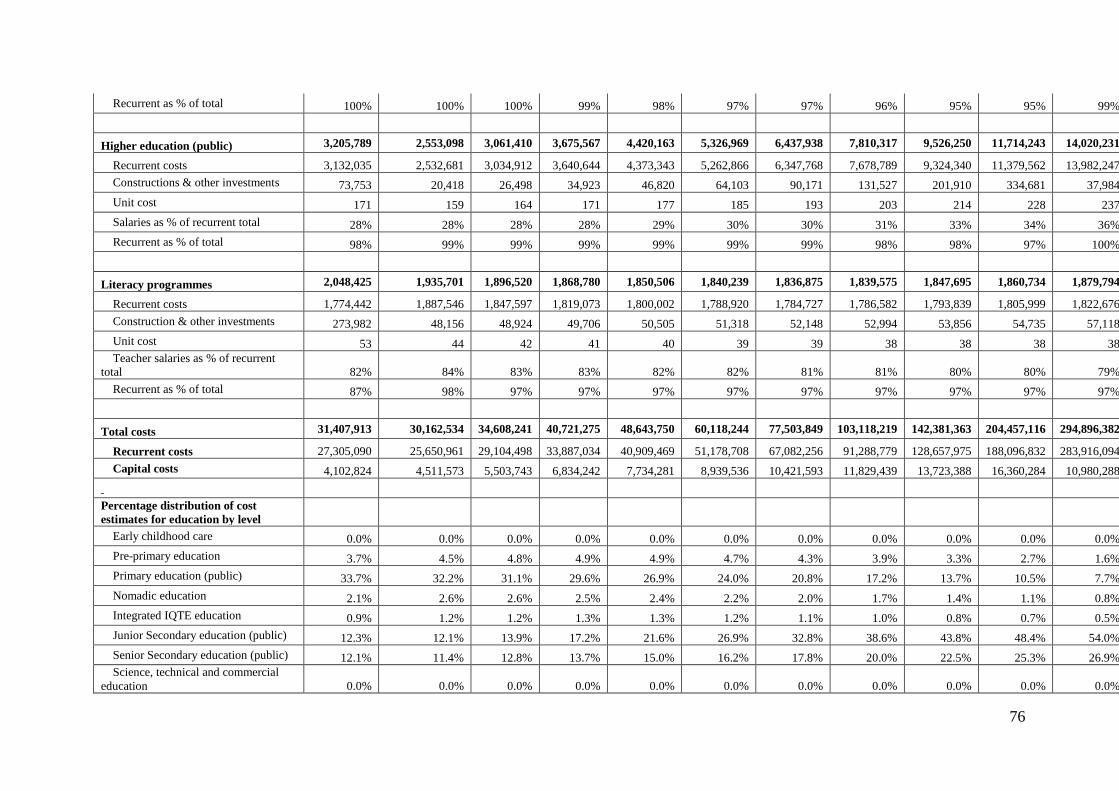
76
Recurrent as % of total 100% 100% 100% 99% 98% 97% 97% 96% 95% 95% 99%
Higher education (public) 3,205,789 2,553,098 3,061,410 3,675,567 4,420,163 5,326,969 6,437,938 7,810,317 9,526,250 11,714,243 14,020,231
Recurrent costs 3,132,035 2,532,681 3,034,912 3,640,644 4,373,343 5,262,866 6,347,768 7,678,789 9,324,340 11,379,562 13,982,247 Constructions & other investments 73,753 20,418 26,498 34,923 46,820 64,103 90,171 131,527 201,910 334,681 37,984 Unit cost 171 159 164 171 177 185 193 203 214 228 237 Salaries as % of recurrent total 28% 28% 28% 28% 29% 30% 30% 31% 33% 34% 36% Recurrent as % of total 98% 99% 99% 99% 99% 99% 99% 98% 98% 97% 100%
Literacy programmes 2,048,425 1,935,701 1,896,520 1,868,780 1,850,506 1,840,239 1,836,875 1,839,575 1,847,695 1,860,734 1,879,794
Recurrent costs 1,774,442 1,887,546 1,847,597 1,819,073 1,800,002 1,788,920 1,784,727 1,786,582 1,793,839 1,805,999 1,822,676 Construction & other investments 273,982 48,156 48,924 49,706 50,505 51,318 52,148 52,994 53,856 54,735 57,118 Unit cost 53 44 42 41 40 39 39 38 38 38 38 Teacher salaries as % of recurrent
total 82% 84% 83% 83% 82% 82% 81% 81% 80% 80% 79% Recurrent as % of total 87% 98% 97% 97% 97% 97% 97% 97% 97% 97% 97%
Total costs 31,407,913 30,162,534 34,608,241 40,721,275 48,643,750 60,118,244 77,503,849 103,118,219 142,381,363 204,457,116 294,896,382
Recurrent costs 27,305,090 25,650,961 29,104,498 33,887,034 40,909,469 51,178,708 67,082,256 91,288,779 128,657,975 188,096,832 283,916,094 Capital costs 4,102,824 4,511,573 5,503,743 6,834,242 7,734,281 8,939,536 10,421,593 11,829,439 13,723,388 16,360,284 10,980,288
Percentage distribution of cost estimates for education by level
Early childhood care 0.0% 0.0% 0.0% 0.0% 0.0% 0.0% 0.0% 0.0% 0.0% 0.0% 0.0% Pre-primary education 3.7% 4.5% 4.8% 4.9% 4.9% 4.7% 4.3% 3.9% 3.3% 2.7% 1.6% Primary education (public) 33.7% 32.2% 31.1% 29.6% 26.9% 24.0% 20.8% 17.2% 13.7% 10.5% 7.7% Nomadic education 2.1% 2.6% 2.6% 2.5% 2.4% 2.2% 2.0% 1.7% 1.4% 1.1% 0.8% Integrated IQTE education 0.9% 1.2% 1.2% 1.3% 1.3% 1.2% 1.1% 1.0% 0.8% 0.7% 0.5% Junior Secondary education (public) 12.3% 12.1% 13.9% 17.2% 21.6% 26.9% 32.8% 38.6% 43.8% 48.4% 54.0% Senior Secondary education (public) 12.1% 11.4% 12.8% 13.7% 15.0% 16.2% 17.8% 20.0% 22.5% 25.3% 26.9% Science, technical and commercial
education 0.0% 0.0% 0.0% 0.0% 0.0% 0.0% 0.0% 0.0% 0.0% 0.0% 0.0%

77
Higher education (public) 12.0% 11.7% 12.0% 12.1% 12.0% 11.5% 10.7% 9.6% 8.4% 7.1% 5.5% Mass Literacy 6.7% 6.6% 5.6% 4.7% 3.9% 3.1% 2.4% 1.8% 1.3% 0.9% 0.6% Other non formal programmes 0.3% 0.3% 0.3% 0.2% 0.2% 0.2% 0.1% 0.1% 0.1% 0.0% 0.0% Continuing education 0.0% 0.0% 0.0% 0.0% 0.0% 0.0% 0.0% 0.0% 0.0% 0.0% 0.0% Cross-cutting expenditures 16.0% 17.2% 15.5% 13.5% 11.7% 9.7% 7.7% 6.0% 4.4% 3.2% 2.3% Total 99.8% 99.8% 99.8% 99.7% 99.8% 99.8% 99.8% 99.8% 99.9% 99.9% 99.9%
Distribution of cost estimates for education by level (N000)
Early childhood care 0 0 0 0 0 0 0 0 0 0 0 Preschool education 1,123,611 1,330,376 1,612,864 1,941,483 2,324,637 2,772,563 3,297,816 3,915,920 4,646,243 5,513,194 4,554,608 Primary education (public) 10,349,287 9,492,359 10,515,205 11,766,150 12,798,518 14,117,139 15,826,427 17,491,972 19,304,055 21,305,652 22,578,222 Nomadic education 649,963 770,242 874,831 1,004,653 1,133,152 1,289,743 1,485,697 1,694,989 1,929,631 2,194,385 2,279,288 Integrated IQTE education 285,042 343,259 421,604 513,959 610,145 722,243 859,578 1,009,372 1,177,649 1,367,610 1,328,784 Junior Secondary education (public) 3,779,944 3,559,460 4,713,764 6,855,948 10,267,807 15,860,846 24,922,919 39,153,714 61,592,467 97,812,668 158,161,857 Senior Secondary education (public) 3,713,469 3,365,548 4,319,835 5,464,171 7,138,016 9,550,298 13,578,930 20,265,151 31,659,780 51,135,818 78,846,950 Science, technical and commercial
education 0 0 0 0 0 0 0 0 0 0 0 Higher education (public) 3,701,510 3,440,357 4,055,708 4,800,353 5,700,722 6,792,056 8,120,884 9,750,089 11,768,631 14,313,182 16,031,240 Mass Literacy 2,048,425 1,935,701 1,896,520 1,868,780 1,850,506 1,840,239 1,836,875 1,839,575 1,847,695 1,860,734 1,879,794 Other non formal programmes 102,415 97,952 96,836 96,246 96,088 96,296 96,818 97,616 98,661 99,930 101,395 Continuing education 14,118 9,144 9,372 9,676 10,077 10,598 11,274 12,159 13,342 15,015 17,902 Cross-cutting expenditures (MOE) 4,929,952 5,078,469 5,231,474 5,389,100 5,551,490 5,718,787 5,891,141 6,068,705 6,251,637 6,440,101 6,634,264 Cross-cutting expenditures (Other
ministries) 0 0 0 0 0 0 0 0 0 0 0 Total 30,755,236 29,492,717 33,831,876 39,810,966 47,596,680 58,903,237 76,083,133 101,477,786 140,495,573 202,295,589 292,684,311
Total State/LGA resources 83,720,071 87,906,075 92,301,379 96,916,448 101,762,270 106,850,384 112,192,903 117,802,548 123,692,675 129,877,309 136,371,175 Public expenditure on education as % of total state expenditure 33.4% 33.7% 34.1% 34.4% 34.7% 35.1% 35.4% 35.7% 36.1% 36.4% 36.7% Public expenditure on education 27,973,439 29,662,486 31,450,504 33,343,168 35,346,471 37,466,747 39,710,685 42,085,349 44,598,203 47,257,129 50,070,452
Pre-primary education 5.0% 5.0% 5.0% 5.0% 5.0% 5.0% 5.0% 5.0% 5.0% 5.0% 5.0%

78
Primary education 12.3% 12.3% 12.3% 12.3% 12.3% 12.3% 12.3% 12.3% 12.3% 12.3% 12.3% Nomadic education 0.0% 0.0% 0.0% 0.0% 0.0% 0.0% 0.0% 0.0% 0.0% 0.0% 0.0% Integrated IQTE education 0.0% 0.0% 0.0% 0.0% 0.0% 0.0% 0.0% 0.0% 0.0% 0.0% 0.0% Junior Secondary 4.6% 4.6% 4.6% 4.6% 4.6% 4.6% 4.6% 4.6% 4.6% 4.6% 4.6% Senior Secondary 15.7% 15.7% 15.7% 15.7% 15.7% 15.7% 15.7% 15.7% 15.7% 15.7% 15.7% Science, technical and commercial
education 0.0% 0.0% 0.0% 0.0% 0.0% 0.0% 0.0% 0.0% 0.0% 0.0% 0.0% Higher 7.2% 7.2% 7.2% 7.2% 7.2% 7.2% 7.2% 7.2% 7.2% 7.2% 7.2% Other education programmes 0.4% 0.4% 0.4% 0.4% 0.4% 0.4% 0.4% 0.4% 0.4% 0.4% 0.4% Other cross-cutting expenditures 5.6% 54.8% 54.8% 54.8% 54.8% 54.8% 54.8% 54.8% 54.8% 54.8% 54.8%
Source: Jigawa State simulation model

79
4.2 Implementation and Coordination
The implementation of SESP over the ten-year period will require full mobilisation of all available resources and high sense of commitment on the part of the education managers to ensure proper supervision and constant monitoring for the desired results to materialize. Therefore, a structure needs to be set up to ensure timely implementation and proper co-ordination by responsible agencies The structure to be setup is in form of a committee directly under the chairmanship of the Honourable Commissioner of Education. The composition of the committee cuts across all Parastatals of the Ministry, Local Education Authorities down to school level as indicated in the following Organogramme. The committee should have the following term of reference:
- Formulation of policy guidelines for successful execution of SESP in the state. - Provide political support to ensure discharge of responsibility in terms of
logistic and funding. - Mobilise stakeholders to support and participate in the implementation and
coordination.
ORGANIZATIONAL STRUCTURE FOR THE IMPLEMENTATION OF SESP / SESOP IN JIGAWA STATE
CHAIRMAN CO-ORDINATION IMPLEMENTATIN AND
MONITORING COMMITTEE (HONOURABLE COMMISSIONER OF
EDUCATION)
CO-ORDINATOR IMPLEMENTATION SUB-COMMITTEE (DPRS – MOEST)
CO-ORDINATOR MONITORING SUB-COMMITTEE (EXECUTIVE CHAIRMAN SUBEB )
MEMBERS IMPLEMENTATION SUB- COMMITTTEE All Directors of Planning of MOEST and Parastatals; Budget Directorate, Ministry of Finanace
CO-ORDINATOR MONITORING COMMITTEE MEMBERS: (All Deputy Directors of Planning of MOEST and Parastatals, )
CHAIRMAN, CO-ORDINATION SUB-COMMITTEE (Permanent Secretary
MEMBERS CO=ORDINATION SUB=COMMITTEE; All State SESPS Technical Committee Members:
GRASSROOT-LEVEL Co-ORDINATION, IMPLEMENTATION AND MONITORING COMMITTEES: Education Secretaries, Zonal Education Officers, Principals, Head Masters, SBMCs
80
4.3 The implementation of SESP intails implications which implied gains and challenges Some of the implications for the implementation of SESP in Jigawa State include the
following :
i. Involment of other MDAs outside the education circle to provide a multisectoral appraoach towards solving educational problems in the state.
ii. Provision of incentives to motivate and induce committment and support from stakeholders for growth and development of education to meet various educational policies (e.g. Vision 2020, EFA etc).
iii. Provide sense of direction for policy makers and management of education in the state.
iv. Improves standard of education in the state which in turn increases educational development generally.
v. It attracts national and international development partners in the state which willpromote quality of teaching and learning.
4.4 RISKS AND CHALLENGES OF IMPLEMENTING SESP There are many risks and challenges that are bound to inhibit the implementation of SESP in Jigawa state. These can be classified as general and objectives specified • Fear of inadequate funding and low political will on the importance of the continuation of
the SESP implementation by the incoming government before the ending of the target year.
• Continued apathy of parents towards western education and rapid increasing rate of primary and Junior Secondary school age children who are out of school create enormous pressures and constraints in expanding equitable access to Basic Education.
• Fear of full sustainability of the programme due to the ESSPIN expiring period of supporting the programme. Government may decide to adjust the plan for funding reasons.
• Low private sector participation: the contribution of private sector to the educational pursuit of the state is very negligible. This leads to overwhelming dependence on the limited resources at the disposal of government amidst other competing demands.
• Fear of scarcity of qualified science teachers more especially at basic and secondary school level. The number of the qualified science teachers the State College of education is producing is negligible compared to the state need.
1. Favourable Climatic Conditions : Jigawa State is characterized by seasonal rainfalls which are associated with windstorms that damage school buildings. This constitute unforseen expenses. 2. Funding : This is perhaps the most serious challenge for the smooth implementation of SESP in the state considering the huge financial implication of the plan, on one hand and the fact the state relies on Federal Allocations for over 95% of its finances, on the other hand.

81
Any shortfall in the Federal Allocation is therefore bound to have serious repercussion on the available resources to implement SESP. 3. Inflation : closely tied to funding is inflation of market prices of goods and services required to implement the plan. The prices of building materials, for example have under gone dramatic increases over the years and the tendancy for further increase is eminent. 4. ICT Deficit : Majority of the key officers in the implementation of SESP are deficient ICT manipulation that will ease analysis of input, output and outcomes to ascertain attainment of objectives.
4.5 CONSTRAINTS AND CHALLENGES IN ACHIEVING THE DESIRED OBJECTIVES The following are the major constraints to the delivery of Educational Services in the State in achieving the desired objectives:
Policy Objective 1: Improving Access and Expanding Opportunities. • Low income among parents or Stakeholders. This leads to inability of parents to meet the
educational needs of their children. This also, along with other socio-cultural factors, act as constraints in raising enrolment and decreasing transition rates as parents would rather have their children go to farms and/or attend to some chores than to be in schools.
• The high and increasing population of primary and Junior Secondary school age children who are out of school create enormous pressures and constraints in expanding equitable access to Basic Education.
• Gender disparity in education has been found to be the disadvantage of girl-child education in both primary and secondary enrolment. This coupled with the shortage of female teachers at pre-primary, primary and senior secondary schools who could serve as role models or facilitate girls’ attendance, retention, completion and learning outcomes constitutes hindrance to achieving the objective on access.
• There are problems of inadequate sanitation facilities and water supplies. As a result, many children are unable to have adequate learning access due to lack of these facilities.
• Distance and difficult terrain. Villages are scattered and schools be located to about three kilometre distance which often prevent parents from allowing their children to attend such schools. Thus, neighbourhood schools that are supposed to cater for such children are not available due to inadequate funds.
• Religion beliefs and ignorance of value of education. A cursory look at the trend of low enrolment shows that parents religion beliefs that education is associated to changing children religious faith constitutes to apathy to enrolment. Low enrolment is more prevalent in Muslim dominated areas than other religions.
• Ignorance on the value of education by parents. Similarly, increasing rate of unemployment serve as disincentive to children enrolment or completion.
Policy Objective 2: Ensuring Quality and Relevance of Education Provision

82
• Shortage of qualified teachers in both the required quantity and quality, especially at basic education level. This particularly affects the Sciences, Technical subjects and English Language.
• In terms of number of teachers, gender disparity appears to be worse in that only 10% of the teachers in all primary schools in the state are females. In the Junior secondary schools female teachers constitute 5% of the Teaching staff while 8% of the Teachers in Senior Secondary Schools are females.
• Quality of learning outcomes is a big challenge. Studies have found that learning achievements in literacy, numeracy and life skills is relatively low compared to some states or national achievement.
• Shortage of provision of instructional materials to facilitate teaching and learning. • Prevalence of unconducive learning environment in schools. • Inadequate quality control of teaching learning processes by school heads and quality
assurance officers. • Insufficient modern quality assurance skills by school inspectors and supervisors. Policy Objective 3: Improving Educational Planning and Management (PME) • Non-challant attitude of planning officers and managers towards discharging their duties:
this leads to falsification of data at all levels of education. • Low capacity of planning officers on data management: manipulation of data based soft
ware become difficult for the incapacitated planning officers, thus unreliable information is established. Low planning skills of education planners.
• Low capacity of education data management officers. • Insufficient ICT facilities for data management.
Policy Objective 4: Ensuring Sustainable Funding and Improved Financial Management. • Limited resources. This incapacitates government from meeting the ever increasing
educational needs of the populace • Low private sector participation: the contribution of private sector to the educational
pursuit of the state is very negligible. This leads to overwhelming dependence on the limited resources at the disposal government amidst other competing demands.
• General poverty level of parents limits parents contributions through private costs, contributions by PTA, individual philanthropists, etc.
4.6 MITIGATION OF RISKS, CHALLENGES AND CONSTRAINTS • Enactment of law for the implementation of SESP in the state. The implementation of the
SESP to the target year needs to have legislative backing to ensure the continuity of funding and other supports by the government to the target periods.
• Involvement of private sector in educational service delivery: the contribution of private sector to the educational pursuit of the state is very important. This allows the government to attain other competing demands.
83
• Priority on science courses: This makes Jigawa State College of Education to adjust mode of admission to science studies and recruit more qualified science teachers.
STRATEGIES
• Advocacy/sensitization to House of Assembly members on the enforcement of a law on the implementation of SESP in the state.
• Meeting with private partners for collaborative agreement on educational service delivery.
• Provision of science biased infrastructures, equipment and other materials to the State college of education to facilitate science studies.
PRIVATE SCHOOL PROPRIETORS Expectations from the private schools proprietors In ensuring the objective of improving access to school is achieved, the private school service providers will be expected to:
• Contribute towards development of education in Jigawa state. • Facilitate in promoting hygiene and sanitation in schools. • Spread private schools to the rural areas and make the schools fees affordable to the
children of the poor in the state. On the part of the government, necessary support will be given to the private service providers in the following areas:
• Tax relief for proprietors. • Provision of land at subsidise cost or free of charge. • Encouragement of communities to build and own schools. • Render termly monitoring services to their schools for quality assurance and
involve them to attain achievements and standard at their schools or organizations.
In order to address the challenges of achieving the objectives of the SESP, the contributions of the stakeholders will be harnessed and improved upon. Objective 1: Improving Access and Expanding Opportunities. Philanthropists Philanthropists either individual or group will be encouraged be SMoE and SUBEB through commendations and advocacy to:
• Increase provision of school uniforms to enhance access to school • Intensify efforts in provision of classrooms, repairs of classrooms, provision of toilets,
learning aids, portable water, etc. • Provision of access roads/repair of access roads to schools.

84
Non Governmental Organisations (NGOs) • Promote hygiene and sanitation activities in schools to increase enrolment, attendance
and retention especially for girls. Banks
• Renovate of classrooms to improve pupils/class ratio • Supplement government effort in providing additional infrastructure and • Supply of generator, etc. • Provision of scholarships and sponsorships to deserving pupils and students.
Ministry of Water Resources
• Provide water and sanitation facilities in schools to encourage hygienic habits and boost enrolment and attendance.
Ministry of Women Affairs
• Improve enrolment and retention, through facilitating annual children’s day. • Sponsor children parliament to encourage social interaction. • Provision of sponsorship to orphans and vulnerable children. • Organise advocacy on importance of education to women and girls. • Collaborate with other women organisations such as FOMWAN in organising
enrolment drive campaign. Ministry of Health
• Provide free health services in schools to enhance access and retention to school. • Organise health talks in schools.
Ministry of Environment
• Support in Erosion and desertification control in schools to provide good learning environment.
• Support in environmental protection of schools and planting of plants to make schools conducive.
Ministry of Information
• Support in enrolment awareness campaign through print and non print media to increase enrolment.
• Promote education programmes regularly. • Provide information during emergencies such as flood, windstorm and communal
conflicts Universal Basic Education Commission
• Provide more instructional materials, new physical infrastructures and renovate existing infrastructures to increase access to school.
• Provide Self help projects funds for physical structures to increase conducive learning environment.

85
• Provide Special education funds to carter for the education of children with special needs to increase access to schools for the physically challenged Children.
• Support Integrate Qur’an and Tsangaya Education to increase access to school for Almajiri.
Community Based Organisations (CBOs)
• Aid enrolment in schools through enlightenment to their communities. • Provide support to schools in areas of funding, renovation of schools, maintenance of
roads leading to schools, etc. Education Task Funds (ETF)
• Construct classroom blocks, library, laboratories, and toilet blocks in schools to improve learning condition.
• Supply of furniture to create conducive atmosphere. • Provide equipped science laboratories to schools.
Japanese International Children Aids (JICA)
• Encourage JICA to increase support for education in the state to: • Supply more science equipments to promote science activities in schools. • Provide instructional materials.
United Nation Children Education Funds (UNICEF)
• Promote hygiene and sanitation in schools and Supply of instructional materials to encourage enrolment in schools.
• Provide support to schools during emergencies. ESPIN
• Give more financial assistance to children through conditional cash transfer programme to encourage more children to enrol and complete basic education.
• Increase provision of incentives such as uniforms and other relevant materials to aid enrolment and retention rate particularly girls.
Objective 2: Ensuring Quality and Relevance of Education Provision Non Governmental Organisations (NGOs)
• Support the conduct of SBMC Trainings in promoting effective learning activities in schools.
Community Based Organisations (CBOs)
• Provide Voluntary services in schools to enhance quality education, and • Text books (Instructional materials) to support learning
Universal Basic Education Commission
• Support conduct of trainings for teachers to promote effective teaching and learning activities in schools.
86
• Coordinate Federal Teacher Scheme to enhance teaching and learning in schools. • Increase monitoring of primary schools by school inspectors at LGEAs and SUBEB.
Japanese International Children Aids (JICA)
• Increase in support for the conduct of training on Strengthen Mathematics and Science Education (SMASE) for science teachers to improve teaching of science and mathematics in schools.
United Nation Children’s Funds (UNICEF)
• Capacity building of teachers and school managers on pedagogy and leadership to facilitate learning and teaching activities.
Education Task Funds (ETF)
• Provide Library materials to facilitate teaching and learning activities in schools. ESPIN
• Increase training of SBMC members to enhance their partnership in school management.
• Increase training of school heads in school management.
Objective 3: Improving Educational Planning and Management (PME) Directorate of Budget and Economic Planning
• Provide training of PRS personnel to build capacity of officers for good planning and management.
Education Task Funds (ETF) • Provide computer sets to promote data management.
UNICEF • Fund and facilitate training of EMIS personnel to make them more efficient in data
analysis, storage and retrieval. DFID/ESSPIN
• Fund and facilitate Education Planning and review processes. • Provide capacity building of education planners and managers to enhance their
efficiency. • Provide technical support in developing MTSS.
World Bank • Facilitate the development of Global Partnership for Education documents and process
to increase service delivery to education. Objective 4: Ensure Sustainable Funding and Improved Financial. Directorate of Budget and Economic Planning
• Support in the annual review of Medium Term Sector Strategy (MTSS) to assess achievements of the MTSS implementation.

87
• Provide professional advice on Budget implementation to increase efficiencies of the officers on budget planning
Philanthropists
• Provide land for the establishment of more additional schools to sustain government responsibility to the community.
• Provide donations to schools and individuals.
Community Based Organisations (CBOs)
• Manage community schools (primary and Islamiyyah) education privately to reduce burden on government for the community.
4.7 EXPECTATIONS FROM JIGAWA STATE COLLEGE OF EDUCATION In ensuring the objective of Quality and Relevance of Education Provision in the state, the activities of Jigawa State college of Education need to be adjusted for vital reforms in order to meet the teacher needs and safeguard the quality of education service delivery to accommodate students’ flows, after post basic education for the consideration of alternative modes of providing educational services at the college. Another focus area the college should look at is about the increasing proportion of the students that will be admitted in the area of priority especially science and technical, see the table below:
Year
Base line Data Projected data per Simulation Model 2011 2012 2013 2014 2015 2016 2017 2018 2019 2020 2021 2012 2013 2014 2015 2016 2017 2018 2019 2020 2021 2022
Male 2,87
2 3,217 3,604 4,038 4,524 5,068 5,677 6,360 7,125 7,982 8,942 Femal
e 1,86
1 2,131 2,440 2,794 3,200 3,664 4,196 4,805 5,502 6,300 7,215
Source: State MOEST and Simulation Model In this regard the college is expected to: Ensure increase in the number of qualified teachers graduating from College, from the base line of 2,539 in 2012 to 9,521 by 2022. • Increase students admission into the college in the following areas:
Languages from 21% and 38% (baseline in 2012) to 38% and 40% by 2022 for male and female respectively.
Science from 23% and 17% (baseline in 2012) to 40% and 25% by 2022 for male and female respectively.
Vocational and Technical Education from 7% and 1% (baseline in 2022) to 20% and 5% by 2016 for male and female respectively.
Art/Social Sc. & from 43% and 43% (baseline in 2012) to 43% and 43% by 2022 for male and female respectively
88
• Ensure recruitment of more lecturers to meet the increasing and moreover to enhance quality learning.
• Expand the capacity of teachers to meet the increase of students flow • Increase the number of admission of persons with special needs • Initiate courses to meet the state’ future teacher needs. • Supply facilities and equipment for persons with special needs. • Provide adequate language labs, science laboratories and libraries, to facilitate teaching
and learning process. • Provide instructional materials that will prepare the mind of student teachers on the new
method of teaching (e.g. charts, diagrams, pictures, drawings, maps, etc) of English, Hausa, French, Mathematics and Sciences.
• Supply new devices to support teaching and learning process such as projectors, computers, TV sets, cameras, DVD, CDs, Radio and other relevant materials for teaching of Hausa, English, French, Mathematics and Sciences.
• Supply of consumable teaching and learning materials for Science, languages and equipments for technical education to enhance quality teacher production.
.
4.8 FUNCTIONS OF STATE EDUCATIONALs INSPECTORATE AND MONITORING UNIT (SEIMU) FOR QUALITY STANDARD Quality Assurance in school is an approach of assessing quality standard of education of the state in term of many variables available for teaching and learning, the state government regards this aspect of quality process as an important aspect in measuring the quality of education. State Educational Inspectorate and Monitoring Unit which was formally under the Governor’s office is now a full autonomous Inspectorate body under the ministry of education, science and technology with a view to improving monitoring of teaching/learning activities as well the supervision of on-going projects in schools. The unit is fully equipped to enable it discharge its responsibilities efficiently. The existence of the Unit (SEIMU) is responsible for quality assurance in basic and post basic institutions, this lead to teacher’s attitudinal change in punctuality, lesson preparedness, and implementation of curriculum, class work and home work to students in almost all the schools in State. The unit works harmoniously with Jigawa Educational Resource Department (JERD), State Universal Basic Education Board (SUBEB) and other quality assurance officers in the 9 zonal inspectorate offices within the state, institutionalising the framework of collaboration to ensure that good sustainable school monitoring and evaluation is maintained for planning and policy decision making. The nine (9) zonal inspectorates are also responsible for the payment of teacher’s salaries, supervision of examinations and carry out a host of other activities that were hitherto the sole responsibility of the headquarter, this measure will further enhance decentralization and devolution of educational administration in the state. The unit undertakes capacity building of quality assurance officers/stakeholders:
Inspectors at SUBEB, Zonal officers Local Government Education Authorities (LGEAs), Principals and Head teachers Parent Teachers Association (PTA), and
89
School Based Management Committees (SBMC) Reports and activities of the unit are properly kept, stored for dissemination to stakeholders and authorities for action and utilisation in the production of quality assurance evaluation report which is prepared quarterly and annually. The feedbacks from the agency will be useful in tracking progress in the basic and post basic institutions with a view to enhancing quality and transparency in the education sub-sector. The unit monitors preparation and implementation of School Development Plan (SDP) and offers professional advice to school heads. This serves as check on abuse of funds apart from guidance for judicious utilisation of funds (small school grants).
4.9 ROLES OF FEDERAL MINISTRY OF EDUCATION IN IMPLEMENTATION OF SESP
Nigeria achieved independence from the United Kingdom in 1960. The current administrative system is divided into the Federal Capital Territory and 36 states with 774 local governments. Nigeria is playing many roles for the sustainability and survival of the lives of its people. But taking Education sector in particular, the management of education in Nigeria is based on federal system, so that while basic educational policy regarding structure, curriculum and school year is centrally determined, some powers over educational delivery are devolved to state and local government. The major roles of the Federal government towards Educational service delivery include:-
• Formulating a national policy on education. • Collecting and collating data for purposes of educational planning and financing • Maintaining uniform standards of education throughout the country. • Controlling the quality of education in the country through the supervisory role of the
Inspectorate Services Department within the Ministry. • . Harmonizing educational policies and procedures of all the states of the federation
through the instrumentality of the National Council on Education. • Effecting co-operation in educational matters on an international scale. • Developing curricula and syllabuses at the national level in conjunction with other
bodies.
Apart from the major roles, the Federal Ministry of Education owns and runs twenty-five universities, thirteen polytechnics, fifteen technical colleges, twenty colleges of education and sixty-six secondary schools. The remaining tertiary institutions are owned and funded by state governments, while other secondary schools are owned and funded by state governments, communities and private organisations. The administration and management of state government-owned secondary schools falls under the remit of state Ministries of Education. The administration of public primary schools falls under the local education authorities.
4.10 Cost and Financial Implications
Education Simulations

90
In light of the findings of the sector diagnosis, a finance simulation modelling exercise was carried out to support strategic planning in the education sector. After the initial situation analysis of the education sector in the baseline year, the simulation model was used to simulate two scenarios, with varying targets for service delivery and educational outcomes, and showing the corresponding cost and financing implications. The first scenario, also called “baseline” scenario, was based on the policy objectives and targets delineated in the initial Jigawa 10-Year Education Strategic Plan (SESP): 2009 – 2018 to assess the feasibility of this plan. The second scenario was developed to assess the applicability of some EFA benchmarks, in support of the State Government policy through to 2015, the year by which the EFA goals should be achieved, according to the commitment of the international community. These two scenarios were used to assess the desirability and viability of some policy objectives and options a(see Annex 3 for the conscensus Scenarios). The scenario selected by the state is explained below, together with some of the options and targets. In estimating the resource requirements and financing gaps, the following assumptions were made:
• The average annual increase of National GDP will be 4% • State and LGA revenues (Federation Account, VAT, etc.) will increase, on average,
by 5% annually • Increase of the education budget as % of total State government expenditure from
23.3% in 2006 to 25% in 2015; LGAs’ expenditure on education will change from 33.6% in 2006 to 25% in 2015
• The share of recurrent budget in State and LGAs educational expenditures will increase from 40% in 2006 to 60% by 2011 and to 70% by 2019.
The following paragraphs describe the assumptions made within each subsector to derive the resource and cost implications, as well as the financing gaps. Pre-primary education will expand from GER of 18% (2011/12) to 58% in 2021/22 for the children of age 4-5. Enrolments in public and private schools. In primary education, the gross intake rate (GIR) into Grade 1 will increase from 53% (2012) to 75% by 2022. The same will occur with the GER in public schools that will be increasing very quickly from 55% in 2012 to 75% (2022).. The flow (promotion, repetition and dropout) rates will be improved (promotion rate raised to 95% and repetition rate lowered to 3%), and the average pupil/teacher ratio and class size reduced to 40 and 40 respectively by 2022. The ratio of qualified teachers is expected to improve from 599% (2012) to 62% by 2022; the proportion of female teachers will increase to 20% as a means of narrowing down the gender disparity in enrolment. As regards the textbooks, the state policy is to provide the textbooks for four core subjects free of charge, with a life span of three years by 2016. The percentage of double shifting classes will decrease to 0%. In junior secondary education, the transition rate into JS1 will reach 68% by 2022. 17% of pupils will register in Science and Technical education by 2022. Public schools will account for around 55% of total enrolment by 2022 while private education will account for 5% of total enrolment. The repetition and dropout rates are assumed to reach 1% each by 2022. The number of weekly teaching periods will be maintainedat 24 by 2022 and these are maintained afterwards. The average class size will reach 40 by 2022. The ratio of qualified teachers will increase from 78% in 2012 to 90% by 2022. The share of female teachers will increase from
91
6 to 10%. The core textbook/pupil ratio would follow the same pattern as in primary. The proportion of double shift will be around 2% by 2022. In senior secondary education (including science and TVET sub-sector), the transition rate into SS1 of 90% through 2022 (80% in general secondary schools and 10% in Science and Technical Education). While no technical and commercial education was provided by the private sector in 2012, its contribution will be encouraged to cater for 25% of registration by 2022. The share of the private sector in terms of GER (including general and technical) will increase from 1%in 2012 to 2% in 2022 while public education will account for 46% of GER by 2022. The repetition and dropout rates will be reduced to 1% each respectively; the number of weekly learning and teaching periods will be 30 each by 2022.The average class size will decrease from 69 to 40 in general schools and from 51 to 40 in technical and commercial ones. The ratio of qualified teachers in general education will increase from 80 to 95% and the proportion of female teachers will increase from 5 to 7% by 2022. As for technical and commercial education, the proportion of qualified teachers will increase from 20% to 38%, and the proportion of female teachers from 8% to 21%. . Higher education (state institutions) gross enrolment ratio will improve from 4% (2012) to 10% in 2022. The student/teacher ratio will be harmonized to 70:1 in all institutions, excluding College of Nurse where it will increase from a 2:1 to 20:1. Teacher wages are assumed to increase incrementally by 3% each year. NFE teacher allowances will be increased as well. At all levels (including higher education), the classroom renovation cost is set to an equivalent of 45% of the cost for a new classroom construction, meaning that if all renovation costs were used for complete reconstructions, 45% equivalent of all exiting classrooms would be renewed each year. For other unit costs, please refer to (table 12 on costs).

92
Table 6.3 cost requirements and funding gaps by government tier, 2012 -2020 (000 Naira)
BASELINE PROJECTION RESULTS
2011 2012 2013 2014 2015 2016 2017 2018 2019 2020 2021 2012 2013 2014 2015 2016 2017 2018 2019 2020 2021 2022 FUNDING GAPS PER GOVERNMENT TIER
LGAs LGA revenue for education 12,498,290 13,278,406
14,105,289
14,981,664
15,910,413
16,894,583
17,937,394 19,042,250 20,212,748 21,452,689 22,766,094
Recurrent 12,498,290 13,278,406 14,105,28
9 14,981,66
4 15,910,41
3 16,894,58
3 17,937,39
4 19,042,250 20,212,748 21,452,689 22,766,094 Capital 0 0 0 0 0 0 0 0 0 0 0
Cost requirements for education
Pre-primary education 401,831 513,722 682,441 876,799 1,101,001 1,360,099 1,671,854 2,041,880 2,482,537 3,009,412 3,443,061 Recurrent 387,517 484,587 634,849 806,390 1,002,528 1,227,221 1,521,015 1,870,326 2,286,968 2,785,839 3,385,946 Capital 14,314 29,135 47,592 70,409 98,474 132,877 150,839 171,554 195,569 223,574 57,114
Primary education 8,516,253 7,514,965 7,802,681 8,248,389 8,824,398 9,466,762 10,406,85
8 11,509,290 12,739,159 14,103,721 15,523,208
Recurrent 8,487,961 7,462,096 7,695,641 8,064,451 8,577,495 9,129,055 10,000,77
8 11,061,439 12,249,920 13,569,577 15,034,104 Capital 28,292 52,870 107,040 183,938 246,904 337,707 406,081 447,851 489,238 534,144 489,104
Total 8,918,084 8,028,688 8,485,122 9,125,187 9,925,400 10,826,86
1 12,078,71
3 13,551,170 15,221,696 17,113,134 18,966,268
Recurrent 8,875,478 7,946,683 8,330,490 8,870,840 9,580,022 10,356,27
6 11,521,79
3 12,931,765 14,536,889 16,355,415 18,420,050 Capital 42,606 82,005 154,632 254,347 345,377 470,585 556,919 619,405 684,808 757,718 546,218
Approximate share of LGAs (primary & pre-primary) 78% 74% 70% 67% 66% 64% 63% 63% 64% 64% 70%
Recurrent 95% 93% 91% 89% 87% 85% 85% 85% 85% 85% 85% Capital 2% 4% 5% 7% 8% 10% 10% 10% 10% 10% 10%
State Government State Government revenue for education 15,475,150 16,384,080
17,345,215
18,361,503
19,436,058
20,572,164
21,773,290 23,043,099 24,385,456 25,804,440 27,304,359
Recurrent 8,873,487 9,438,248 10,038,05 10,675,04 11,351,46 12,069,71 12,832,32 13,641,992 14,501,554 15,414,030 16,382,615

93
6 1 3 3 7
Capital 6,601,662 6,945,832 7,307,159 7,686,462 8,084,595 8,502,451 8,940,963 9,401,107 9,883,901 10,390,410 10,921,744 Cost requirements for education 22,489,829 22,133,846
26,123,119
31,596,088
38,718,350
49,291,383
65,425,136 89,567,048
127,159,667
187,343,983
275,930,113
Recurrent 18,429,612 17,704,278 20,774,00
8 25,016,19
4 31,329,44
7 40,822,43
2 55,560,46
3 78,357,014 114,121,08
7 171,741,41
6 265,496,04
4 Capital 4,060,218 4,429,568 5,349,111 6,579,895 7,388,903 8,468,951 9,864,674 11,210,034 13,038,581 15,602,566 10,434,070
Financing Gaps (+ gap - surplus)
LGAs -3,580,206 -5,249,719 -
5,620,167 -
5,856,477 -
5,985,014 -
6,067,723 -
5,858,682 -5,491,079 -4,991,051 -4,339,556 -3,799,825
Recurrent -3,622,812 -5,331,723 -
5,774,799 -
6,110,824 -
6,330,391 -
6,538,307 -
6,415,601 -6,110,484 -5,675,859 -5,097,274 -4,346,043 Capital 42,606 82,005 154,632 254,347 345,377 470,585 556,919 619,405 684,808 757,718 546,218
State Government 7,014,680 5,749,766 8,777,904 13,234,58
5 19,282,29
2 28,719,21
9 43,651,84
6 66,523,949 102,774,21
1 161,539,54
3 248,625,75
4
Recurrent 9,556,124 8,266,030 10,735,95
2 14,341,15
2 19,977,98
4 28,752,71
9 42,728,13
6 64,715,022 99,619,532 156,327,38
6 249,113,42
8
Capital -2,541,444 -2,516,264 -
1,958,048 -
1,106,568 -695,692 -33,500 923,710 1,808,927 3,154,679 5,212,157 -487,674
Total 3,434,474 500,048 3,157,737 7,378,108 13,297,27
9 22,651,49
6 37,793,16
4 61,032,870 97,783,160 157,199,98
7 244,825,92
9
Recurrent 5,933,313 2,934,307 4,961,153 8,230,328 13,647,59
3 22,214,41
2 36,312,53
5 58,604,537 93,943,673 151,230,11
2 244,767,38
5
Capital -2,498,839 -2,434,259 -
1,803,417 -852,221 -350,315 437,085 1,480,629 2,428,332 3,839,487 5,969,875 58,545 FUNDING GAPS (CUMMULATIVE PER STATE) Total Resources 27,973,439 29,662,486
31,450,504
33,343,168
35,346,471
37,466,747
39,710,685 42,085,349 44,598,203 47,257,129 50,070,452
Recurrent costs 21,371,777 22,716,654 24,143,34
5 25,656,70
5 27,261,87
6 28,964,29
6 30,769,72
1 32,684,242 34,714,302 36,866,720 39,148,709 Capital costs 6,601,662 6,945,832 7,307,159 7,686,462 8,084,595 8,502,451 8,940,963 9,401,107 9,883,901 10,390,410 10,921,744
Total Requirements 31,407,913 30,162,534 34,608,24
1 40,721,27
5 48,643,75
0 60,118,24
4 77,503,84
9 103,118,21
9 142,381,36
3 204,457,11
6 294,896,38
2
Recurrent costs 27,305,090 25,650,961 29,104,49
8 33,887,03
4 40,909,46
9 51,178,70
8 67,082,25
6 91,288,779 128,657,97
5 188,096,83
2 283,916,09
4
Capital costs 4,102,824 4,511,573 5,503,743 6,834,242 7,734,281 8,939,536 10,421,59
3 11,829,439 13,723,388 16,360,284 10,980,288 Financing gaps in % 9.9% -0.6% 7.6% 19.4% 34.7% 57.2% 91.6% 141.1% 215.0% 328.1% 484.5%

94
Recurrent costs 27.8% 12.9% 20.5% 32.1% 50.1% 76.7% 118.0% 179.3% 270.6% 410.2% 625.2% Capital costs -37.9% -35.0% -24.7% -11.1% -4.3% 5.1% 16.6% 25.8% 38.8% 57.5% 0.5%
Source: Jigawa State simulation model

95
The funding gap could be bridged in the short term. Each rolling SESOP will have to make tough decisions about priorities in relation to policies and the availability of financial and human resources. The first option to narrow the funding gaps could be by increasing allocations to education and/or reducing some costs. Inviting international development partners and local communities to provide increased support to the sector could be another option. Definitely, there is need for increased contribution of the private sector to educational development.

96
ANNEXES
Annex A: State Education Statistics Table 1: Equitable Access Indicators Baseline Data
2012 Baseline in % as Cal on
EPSSim Target 2022
All Female All Female All Female Enrolment and Gross Enrolment rates in the Public schools
ECCD GER 45,233 21,977 18% 13% 58% 49% Primary GER 475,035 200,173 55% 48% 99% 97% JSS GER 89,286 37,761 26% 22% 86% 90% SSS GER 71,336 15,995 23% 10% 72% 75% Completion rates Primary gross completion rate 38,834 27,567 94% 88% 98% 98% JSS/Basic gross completion rate 16,531 12,769 94% 93% 96% 57% SSS gross completion rate 15,858 3,179 95% 93% 97% 98% Registration rates Primary gross intake rate 87,708 33394 53% 42% 57% 49% Registration rate JS1 23,476 8,908 37% 36% 50% 49% Registration rate SS1 20,203 3,840 67% 32% 65% 38% Reg. Science, Technical and Vocational (SS) 2,115 679 8% 6% 9% 8%
Reg. Private (SS) 132 22 0.6% 0.2% 2% 2% % of pupils in Nomadic Schools (Primary) 4,573 1,803 3% 2% 6% 6% % of pupils in integrated Islammiya Schools (Primary) 3,328 2,404 2% 3% 4% 8%
% of Students in private sector per level Primary 16,419 7,506 3.2% 3.4% 4% 4% JSS 1,958 792 2.2% 2.1% 2% 2% SSS 498 179 0.8% 1.1% 0.4% 0.3% No of students in Adult Education Programme 38,901 2,316 1.35% 0.25% 1% 1%
Qur'anic 153,776 21,860 5.6% 2.3% 2% 0% Tertialy instituonss College of Education, Gumel 2872 1861 1.77% 0.87% 52% 57% Jigawa State Polytechnic, Dutse 1243 127 0.77% 0.06% 100% 100% Binyaminu Usman College of Agriculture, Hadejia 1532 95 0.95% 0.04% 22% 6%
College of Islamic Legal Studies, Ringim 2668 1438 1.65% 0.67% 54% 87% Informatics Institute, Kazaure 1,478 91 0.91% 0.04% 20% 6% Jigawa College of Arts, Science & Remedial Studies 482 33 0.30% 0.02% 6% 2%

97
Table 2: Quality and Efficiency of Education Services Delivery Indicators Baseline Data
2012 Baseline in % as Cal
Target 2022
Student Learning Outcomes % of pupils passing primary leaving exam N/A N/A 95% % of students achieving 5 credits at JSCE N/A N/A % of students achieving 5 credits (including English and Mathematics) at SSCE (NECO) 5,547 33% 63%
% of students achieving 5 credits (including English and Mathematics) at SSCE (WAEC) 3,570 22% 44%
Instructional Hours and Teachers Loads Average pupils’ instructional hours per week (Primary) 25 hrs 25 hrs 25 hrs Average students’ instructional hours per week (JSS) 30hrs 30hrs 30hrs Average students’ instructional hours per week (SSS) 30hrs 30hrs 30hrs Annual instructional hours for pupils Primary 1275 hrs 1275 hrs 1275 hrs JSS 1530 hrs 1530 hrs 1530 hrs SSS 1530 hrs 1530 hrs 1530 hrs Average teachers’ teaching load per week (hours) Primary 48.6 hrs 48.6 hrs 70 hrs JSS 54 hrs 54 hrs 135 hrs SSS 54 hrs 54 hrs 135 hrs % of Qualified Teachers Primary 6,593 79% 85% JSS 3,172 28% 30% SSS 2,423 24% 40% Pupil-Teacher Ratio Pupil –Qualified Teacher Ratio (Primary) 6,593 79% 89%
Pupil-Teacher Ratio (Primary) 13,143 45% 60% Student-Qualified Teacher Ratio (JSS) 3,172 28% 30% Student- Teacher Ratio (JSS) 3,773 24% 40% Student-Qualified Teacher Ratio (SSS) 2,423 24% 40% Student-Teacher Ratio (SSS) 2,624 22% 40% Pupil-Textbook Ratio Pupil Core Textbook Ratio (Primary) 0.6 60% 70% Student Core Textbook Ratio (JSS) 0.8 80% 85% Student Core Textbook Ratio (SSS) 0.9 90% 100%
Table 3 : Domestic Resource Mobilization - Financing, Resources and Distribution of Education Budget
Indicator Baseline 2012
Baseline 2012 in
% Target 2022 %
Domestic Resource Mobilization
Education % share of consolidated resource available at State level (Federal contribution +State + Local Government ) 30,755,236 33.40%
50,070,452 72%

98
Financing Arrangements
- State level (Education share of State Budget) 15,475,149.60 29.50% 27,304,358 73% - Local level (Education share of State Budget) 12,498,289.70 39.90%
22,766,094 85%
Education Sub-sectoral budget share from State Budget
Preschool education 1,123,611 3.7% 4,554,608 1.6% Primary education (public) 10,349,287 33.7% 22,578,222 7.7% Nomadic education 649,963 2.1% 2,279,288 0.8% Integrated IQTE education 285,042 0.9% 1,328,784 0.5% SENs 57,500 0.2% 270,006 0.1% Junior Secondary education (public) 3,779,944 12.3% 158,161,857 54.0% Senior Secondary education (public) 3,713,469 12.1% 78,846,950 26.9% Higher education (public) 3,701,510 12.0% 16,031,240 5.5% Mass Literacy 2,048,425 6.7% 1,879,794 0.6% Other non formal programmes 102,415 0.3% 101,395 0.0% Continuing education 14,118 0.0% 17,902 0.0% Cross-cutting expenditures (MOE) 4,929,952 16.0% 6,634,264 2.3% Total 30,755,236 100.0% 292,684,311 100.0%
Source: Jigawa State Budget 2012 & Simulation Model A.2 SUMMARY OF EDUCATION SECTOR STATISTICS: 2011/2012 Table 1: Type and Number of Educational Institutions below the Tertiary Level. S/N TYPE PUBLIC PRIVATE TOTAL 1 2 3 4 5 6 7
ECCD Primary JSS SSS Non-Formal Education (NFE) NFE(Unicef-Assiste-60-Girl-Child and60 Qur;anic ) Islamiyya and Quranic Tsangaya
422 1,918 355 129 72 - 124
101 101 13 5 - - =
523 2,019 368 134 72 - 124
TABLE 2 A : ENROLMENT IN NON-FORMAL EDUCATION
Year
ADULT LITERACY GIRL-CHILD
Male Female Male Female
2011/2012 24,405 1.6% 14,496 1.5% N/A N/A 1350 0.1%
2012/2013 43,411 2.9% 24,727 2.6% N/A N/A 6215 0.7%
2013/2014
47,752 3.2%
24,727 2.6% N/A N/A 11080 1.2%
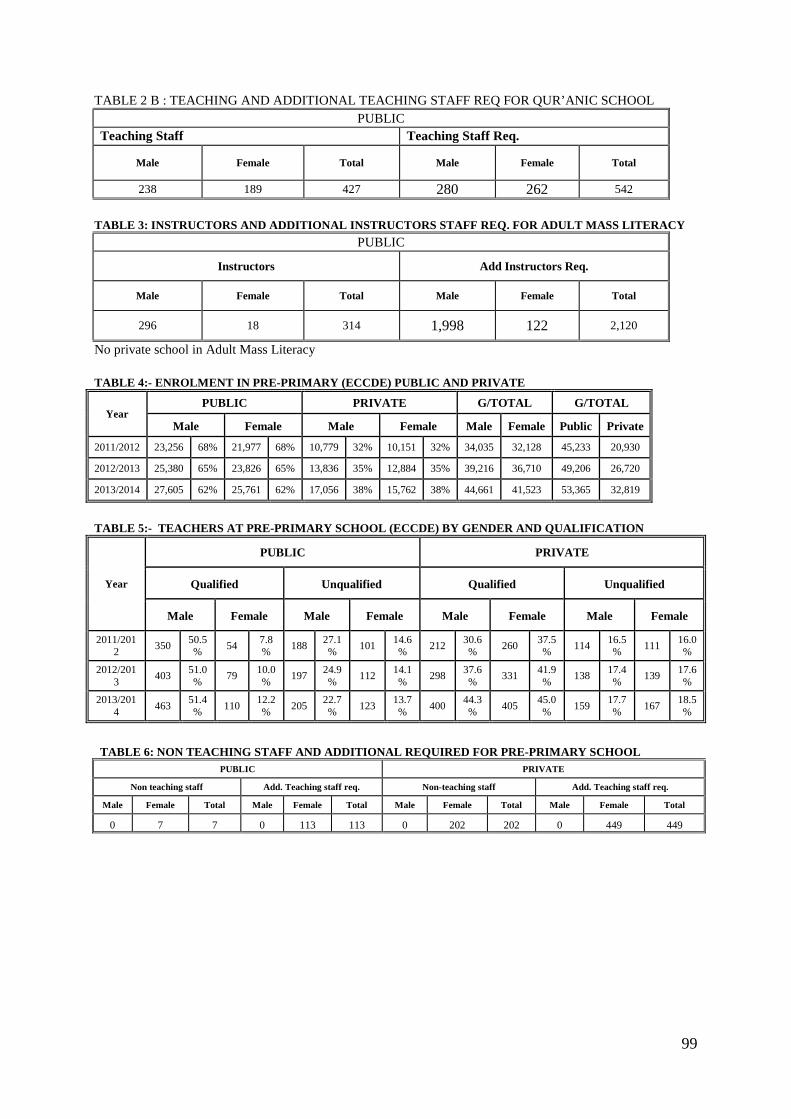
99
TABLE 2 B : TEACHING AND ADDITIONAL TEACHING STAFF REQ FOR QUR’ANIC SCHOOL PUBLIC
Teaching Staff Teaching Staff Req.
Male Female Total Male Female Total
238 189 427 280 262 542
TABLE 3: INSTRUCTORS AND ADDITIONAL INSTRUCTORS STAFF REQ. FOR ADULT MASS LITERACY
PUBLIC
Instructors Add Instructors Req.
Male Female Total Male Female Total
296 18 314 1,998 122 2,120
No private school in Adult Mass Literacy TABLE 4:- ENROLMENT IN PRE-PRIMARY (ECCDE) PUBLIC AND PRIVATE
Year PUBLIC PRIVATE G/TOTAL G/TOTAL
Male Female Male Female Male Female Public Private
2011/2012 23,256 68% 21,977 68% 10,779 32% 10,151 32% 34,035 32,128 45,233 20,930
2012/2013 25,380 65% 23,826 65% 13,836 35% 12,884 35% 39,216 36,710 49,206 26,720
2013/2014 27,605 62% 25,761 62% 17,056 38% 15,762 38% 44,661 41,523 53,365 32,819
TABLE 5:- TEACHERS AT PRE-PRIMARY SCHOOL (ECCDE) BY GENDER AND QUALIFICATION
Year
PUBLIC PRIVATE
Qualified Unqualified Qualified Unqualified
Male Female Male Female Male Female Male Female
2011/2012 350 50.5
% 54 7.8% 188 27.1
% 101 14.6% 212 30.6
% 260 37.5% 114 16.5
% 111 16.0%
2012/2013 403 51.0
% 79 10.0% 197 24.9
% 112 14.1% 298 37.6
% 331 41.9% 138 17.4
% 139 17.6%
2013/2014 463 51.4
% 110 12.2% 205 22.7
% 123 13.7% 400 44.3
% 405 45.0% 159 17.7
% 167 18.5%
TABLE 6: NON TEACHING STAFF AND ADDITIONAL REQUIRED FOR PRE-PRIMARY SCHOOL
PUBLIC PRIVATE
Non teaching staff Add. Teaching staff req. Non-teaching staff Add. Teaching staff req.
Male Female Total Male Female Total Male Female Total Male Female Total
0 7 7 0 113 113 0 202 202 0 449 449

100
TABLE 7: ENROLMENTS IN PRIMARY PUBLIC AND PRIVATE
Year
PUBLIC PRIVATE G/TOTAL G/TOTAL
Male Female Male Female Male Female Public Private
2011/2012 302,444 57.5% 223,173 42.5% 8,913 1.7% 7,506 1.4% 311,357 230,679 525,617 16,419
2012/2013 304,278 58.1% 219,361 41.9% 11,720 2.2% 10,070 1.9% 315,998 229,431 523,639 21,790
2013/2014 308,434 58.4% 219,303 41.6% 14,840 2.8% 12,858 2.4% 323,274 232,161 527,737 27,698
TABLE 8: TEACHERS AT PRIMARY SCHOOL BY GENDER AND QUALIFICATION
Year
PUBLIC PRIVATE
Qualified Unqualified Qualified Unqualified
Male Female Male Female Male Female Male Female
2011/2012 5,868 44.7% 725 5.5% 5,759 43.8% 790 6.0% 492 3.7% 264 2.0% 173 1.3% 242 1.8%
2012/2013 5,999 45.2% 925 7.0% 5,303 39.9% 1,050 7.9% 599 4.5% 319 2.4% 193 1.5% 288 2.2%
2013/2014 6,095 45.7% 1,122 8.4% 4,807 36.1% 1,308 9.8% 699 5.2% 369 2.8% 205 1.5% 329 2.5%
TABLE 9: NON TEACHING STAFF AND ADDITIONAL REQUIRED FOR PRIMARY SCHOOL
PUBLIC PRIVATE
Non Teaching Staff Add. Non Teaching Staff Req. Add Non Teaching Staff Req Add. Teaching Staff Req.
Male Female Total Male Female Total Male Female Total Male Female Total
1554 176 1730 342 39 381 44 26 70 28 16 44 The teacher ratio for current session 2011/2012 is 1.45. However 6,549 (49.8%) are unqualified teachers and should be trained. TABLE 10: ENROLMENTS IN JUNIOR SECONDARY - SCHOOL - PUBLIC AND PRIVATE SCHOOLS
Year PUBLIC PRIVATE G/TOTAL G/TOTAL
Male Female Male Female Male Female Public Private
2011/2012 51,525 57.7% 37,761 42.3% 1,166 1.3% 792 0.9% 52,691 38,553 89,286 1,958
2012/2013 48,908 59.3% 33,595 40.7% 1,524 1.8% 1,384 1.7% 50,433 34,979 82,503 2,908
2013/2014 63,384 68.0% 29,885 32.0% 2,456 2.6% 1,994 2.1% 65,840 31,879 93,270 4,449
TABLE 11: TEACHERS AT JUNIOR SECONDARY SCHOOL BY GENER AND QUALIFICATION
Year
PUBLIC PRIVATE
Qualified Unqualified Qualified Unqualified
Male Female Male Female Male Female Male Female
2011/2012 2,947 78.1% 225 6.0% 561 14.9% 40 1.1% 118 3.1% 11 0.3% 22 0.6% 2 0.1%
2012/2013 2,214 76.3% 257 8.9% 403 13.9% 28 1.0% 153 5.3% 20 0.7% 27 0.9% 2 0.1%
2013/2014 2,348 74.5% 371 11.8% 407 12.9% 27 0.8% 204 6.5% 35 1.1% 35 1.1% 3 0.1%

101
TABLE 12: NON-TEACHING AND ADDITIONAL REQUIRED FOR JUNIOR SECONDARY SCHOOL
PUBLIC PRIVATE
Non Teaching Staff Add. Non Teaching Staff Req. Add Non Teaching Staff Req Add. Teaching Staff Req.
Male Female Total Male Female Total Male Female Total Male Female Total
1619 111 1730 1158 572 1730 5 0 5 7 16 23
TABLE 13: ENROLMENTS IN SENIOR SECONDARY SCHOOLS - PUBLIC AND PRIVATE
Year
PUBLIC PRIVATE G/TOTAL G/TOTAL
Male Female Male Female Male Female Public Private
2011/2012 56,948 77.7% 16,339 22.3% 319 0.4% 179 0.2% 57,267 16,518 73,287 498
2012/2013 54,893 77.0% 16,440 23.0% 399 0.6% 215 0.3% 55,293 16,655 71,333 614
2013/2014 55,261 76.8% 16,708 23.2% 567 0.8% 366 0.5% 55,828 17,074 71,969 933
TABLE 14: TEACHERS AT SENIOR SECONDARY SCHOOL BY GENER AND QUALIFICATION
Year
PUBLIC PRIVATE
Qualified Unqualified Qualified Unqualified
Male Female Male Female Male Female Male Female
2011/2012 2,131 81.2% 292 11.1% 173 6.6% 28 1.1% 20 0.8% 11 0.4% 12 0.5% 10 0.4%
2012/2013 1,922 79.1% 328 13.5% 156 6.4% 23 1.0% 22 0.9% 12 0.5% 13 0.6% 10 0.4%
2013/2014 1,809 77.0% 374 15.9% 147 6.3% 20 0.9% 31 1.3% 16 0.7% 18 0.8% 12 0.5%
TABLE 15: ADDITIONAL NON-TEACHING STAFF REQUIRED FOR SENIOR SECONDARY SCHOOL
PUBLIC PRIVATE
Non Teaching Staff Add. Non Teaching Staff Req. Non Teaching Staff Req Add. Teaching Staff Req.
Male Female Total Male Female Total Male Female Total Male Female Total
798 572 1370 920 309 1229 8 5 13 19 10 29

102
TABLE 16: - ENROLMENT IN HIGHER (TERTIARY) EDUCATION
Year
2011/2012 2012/2013 2013/2014
Male Female Male Female Male Female
College of Education, Gumel 2872 60.7% 1861 39.3% 3,352 61.4% 2,111 38.6% 3,903 62.2% 2,370 37.8%
Jigawa State Polytechnic, Dutse 1243 90.7% 127 9.3% 1,652 88.9% 207 11.1% 2,195 86.7% 338 13.3%
Binyaminu UsmanCollege of Agriculture, Hadejia 1532 94.2% 95 5.8% 1,469 93.0% 110 7.0% 1,400 91.6% 128 8.4%
College of Islamic Legal Studies, Ringim 2668 65.0% 1438 35.0% 4,029 61.7% 2,500 38.3% 3,926 62.9% 2,317 37.1%
Informatics Institute, Kazaure 1478 94.2% 91 5.8% 1,425 92.7% 112 7.3% 1,367 90.9% 138 9.1%
Jigawa College of Arts, Science & Remedial Studies 482 93.6% 33 6.4% 461 91.5% 43 8.5% 438 88.8% 55 11.2%
TABLE 17: TEACHING AND NON-TEACHING STAFF FOR HIGHER (TERTIARY) EDUCATION.
Institution
No of teaching Add teaching staff req. No of non-teaching Add. Non-teaching req.
Male Female Total Male Female Total Male Female Total Male Female Total
College of Education, Gumel 198 11 209 7 3 10 300 24 324 137 10 147
Jigawa State Polytechnic, Dutse 94 5 99 29 8 37 66 4 70 3 2 5
Binyaminu UsmanCollege of Agriculture, Hadejia 46 3 49 4 2 6 88 4 92 12 10 22
College of Islamic Legal Studies, Ringim 82 9 91 4 2 6 48 9 57 20 13 33
Informatics Institute, Kazaure 27 0 27 4 2 6 104 3 107 14 8 22
Jigawa College of Arts, Science & Remedial Studies
38 2 40 4 2 6 79 8 87 16 11 27

103
Annex B
Epssim Simulation Results - .
1. Ministry of Education, Science and Technology, and parastatals Main responsibilities of Ministry of Education, Science and Technology (MOEST):
• Provision of access to quality education for all children. • Provision of conducive learning environment in schools in terms of adequate
infrastructure, instructional materials, facilities and equipment. • Provision of qualified teachers and their continuous training and re-training. • Ensuring that schools are child-friendly in terms of availability of sporting and
recreational facilities, healthcare, water and sanitation. • Constant supervising, inspecting and monitoring of schools and the entire education
system for quality assurance. • Ensuring that curricula at all levels are comprehensive and relevant individual and
societal needs and aspirations. Seven Departments of MOEST:
• Department of Administration and Finance, responsible for: general administration of the Ministry; all staff matters concerning recruitments, appointments, formalization of appointments, training, postings and transfers, discipline and promotion; promotion of Junior Staff GL 01-06; recommendation of promotion of senior staff GL 07-16; advancement of staff that under-went relevant professional courses; recommendation of removal of contract appointments; formalization of appointments of staff with the Civil Service Commission (CSC); discipline of erring staff; postings and transfers of all Academic and Administrative staff of the Ministry.
• Department of School Services, responsible for: general administration of senior secondary schools, postings/transfer of students/teachers, vice-principals and principals, provision of adequate teaching staff; staff and students’ discipline.
• Department of Planning, Research and Statistics, responsible for: planning the general activities of the Ministry, such as vision, mission, targets, admission/placement; school calendar, construction, renovation works; preparing annual budgets; collecting, collating, storing and analyzing data; coordinating the Student Exchange Programme (Unity Schools Program among the Northern States); serving as the secretariat for Management meetings, Tenders’ Board, Joint Consultative Committee on Education (JCCE) and National Council on Education (NCE); coordinating interventions into the Ministry by ETF, UNICEF and others.
• Tertiary Education Department. The Department is responsible for: Liaising activities between Tertiary institutions and the Ministry; representing the Ministry at the Board meetings of the Tertiary Institutions; conveying all approvals and any other correspondence from the Ministry to the Institutions.
• Works Department. The Department is responsible for: Construction and renovation of school structures; Maintenance of school structures; Purchase and maintenance of schools equipment like generators, ITT equipment and many others; Purchase and
104
maintenance of Ministerial vehicles; Supervision of ETF projects, which include renovation, construction works and supplies;
• Educational Resource Department. The Department is responsible for: Preparation and conduct of examinations; Inspection of schools; All the necessary procedures for the establishment of new school by the state government; Recommendation of applicants seeking for teaching profession; Recommendation for the establishment of private schools; Inspection of private schools; Preparation and conduct of schools sports; Organizing seminars, workshops and conferences for teachers, Vice Principals and Principals; Recommendation for up-grading of schools; Keeping records of Exams WAEC, NECO, NABTEB and NBAIS.
• Science and Technology Department. The Department is responsible for the ICT component of the Ministry’s mandate. It is also responsible for: The Computer Training Centres in the State; Development and teaching of ICT in Senior Secondary Schools; Liaising between the Informatics Institute Kazaure and the Ministry.
• Special Duties Department. The Department is responsible for: Coordinating the activities of Higher Education Development Committees established in each Senior Secondary School; Coordinating the activities of PTAs; Carrying out any ad hoc programme of the Ministry; Special assignment of any matter that may arise in any school and other departments; Any duty that may be assigned by the Hon. Commissioner or Permanent Secretary.
Parastatals
• State Universal Basic Education Board (SUBEB), in-charge of Pre-Primary, Primary and Junior Secondary Education in the State.
• Science and Technical Schools Board (STSB), responsible for Science and Technical Education in the state. It has eight Senior Secondary Schools under its supervision (two Science Secondary Schools for Boys, two Girls’ Science Secondary Schools, one Girls’ Computer Secondary School, three Technical Colleges and three Junior Science Secondary Schools – out of which one is for girls only)
• Islamic Education Bureau (IEB), responsible for Arabic and Islamic Education. It has twenty one schools under its supervision, four are boarding (one for Boys, three for Girls) and the remaining 17 are Day Schools.
• Agency for Mass Education, responsible for Adult and Non Formal Education. • State Library Board, responsible for library services in the state. • Agency for Nomadic Education: It is responsible for establishment and maintenance
of Nomadic Schools, there are 185 schools under this Agency. • Jigawa State Scholarships Board (JSSB). The Department is responsible for: The
award of scholarships to candidates of Jigawa State Origin who obtain admission into Tertiary Institutions in Nigeria; To select and submit to the Government, candidates of Jigawa State origin who satisfy the conditions for the award of Scholarships Overseas; To formulate and review policies and initiate programmes on the award of scholarships; To offer such assistance, either alone or in cooperation with any person or institution of higher learning; To advice the Government on any matter relating to the award of Scholarships.
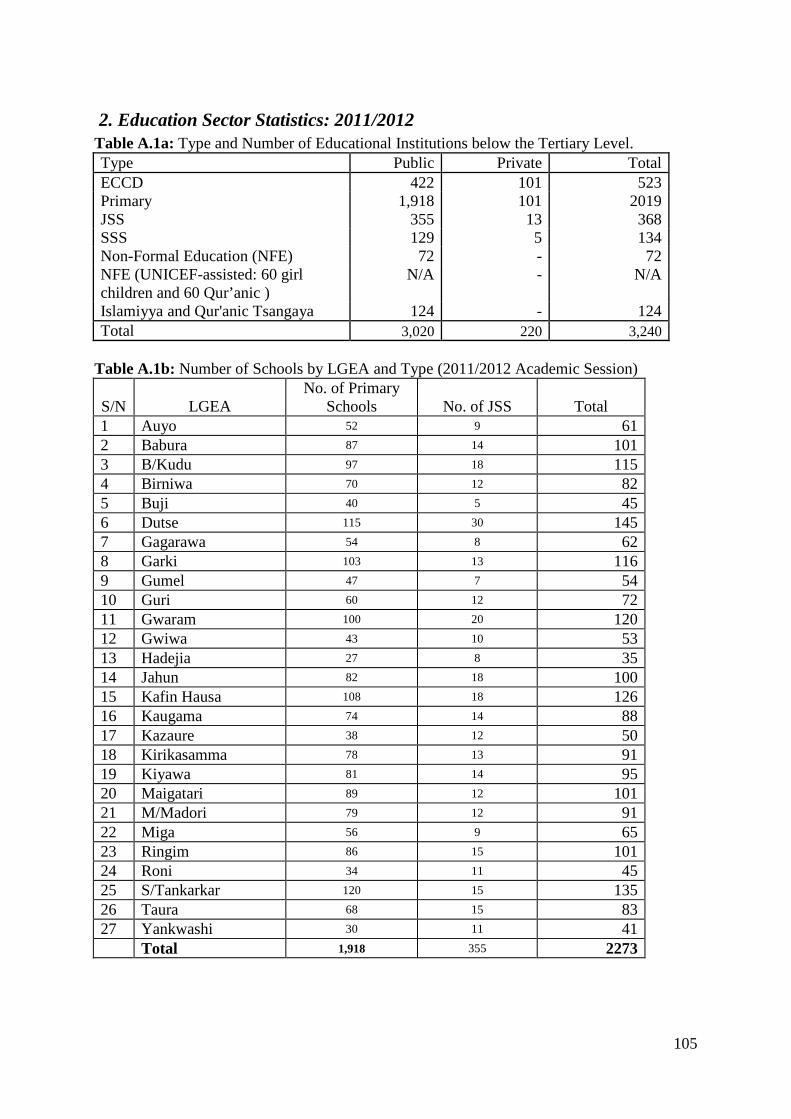
105
2. Education Sector Statistics: 2011/2012 Table A.1a: Type and Number of Educational Institutions below the Tertiary Level. Type Public Private Total ECCD 422 101 523 Primary 1,918 101 2019 JSS 355 13 368 SSS 129 5 134 Non-Formal Education (NFE) 72 - 72 NFE (UNICEF-assisted: 60 girl children and 60 Qur’anic )
N/A - N/A
Islamiyya and Qur'anic Tsangaya 124 - 124 Total 3,020 220 3,240
Table A.1b: Number of Schools by LGEA and Type (2011/2012 Academic Session)
S/N LGEA No. of Primary
Schools No. of JSS Total 1 Auyo 52 9 61 2 Babura 87 14 101 3 B/Kudu 97 18 115 4 Birniwa 70 12 82 5 Buji 40 5 45 6 Dutse 115 30 145 7 Gagarawa 54 8 62 8 Garki 103 13 116 9 Gumel 47 7 54 10 Guri 60 12 72 11 Gwaram 100 20 120 12 Gwiwa 43 10 53 13 Hadejia 27 8 35 14 Jahun 82 18 100 15 Kafin Hausa 108 18 126 16 Kaugama 74 14 88 17 Kazaure 38 12 50 18 Kirikasamma 78 13 91 19 Kiyawa 81 14 95 20 Maigatari 89 12 101 21 M/Madori 79 12 91 22 Miga 56 9 65 23 Ringim 86 15 101 24 Roni 34 11 45 25 S/Tankarkar 120 15 135 26 Taura 68 15 83 27 Yankwashi 30 11 41 Total 1,918 355 2273

106
Table A.2: Public and private school enrolments, including nomadic and islamiyya schools, 2011/12
Pre-Primary Primary Schools Secondary Schools TVE Schools Male Female Male Female Male Female Male Female
Public PR1 57,185 39,726 JS1 17,552 11,276 N/A N/A KG1 PR2 50,371 37,791 JS2 17,606 13,842 N/A N/A KG2 PR3 44,684 33,117 JS3 16,367 12,643 N/A N/A
NS1 23256 21977 PR4 42,071 32,352 SS1 16,697 3,879 SS
1 1,496 789
NS2 PR5 41,717 29,620 SS2 14,880 3,937 SS
2 1,026 643
NS3 PR6 38,834 27,567 SS3 15,858 3,179 SS3 966 683
S/total 23256 21977 274,862
200,173 98,960 48,756 3,488
2,115
Private PR1 3,937 2,554 JS1 261 311
KG1 PR2 2,207 2,113 JS2 657 271 KG2 PR3 1,412 1,528 JS3 248 210
NS1 11,346 10,150 PR4 684 672 SS1 124 24 SS
1 N/A N/A
NS2 N/A N/A PR5 442 412 SS2 95 72 SS
2 N/A N/A
NS3 N/A N/A PR6 231 227 SS3 100 83 SS
3 N/A N/A
S/total 11,346 10,150 8,913 7,506 1485 971 N/A N/A Total PR1 61,122 42,280 JS1 17,813 11,587
KG1 PR2 52,578 39,904 JS2 18,263 14,113 KG2 PR3 46,096 34,645 JS3 16,615 12,853
NS1 34,602 32,127 PR4 42,755 33,024 SS1 16,821 3,903
SS1 1,496 789
NS2 N/A N/A PR5 42,159 30,032 SS2 14,975 4,009
SS2 1,026 643
NS3 N/A N/A PR6 39,065 27,794 SS3 15,958 3,262
SS3 966 683
S/total 34,602 32,127 283,775 207,679 100,445 49,727 3,488 2,115 Table A.3a: Flow rates in primary schools, 2011/12
Public Private
Promotion Repetition Dropout Promotion Repetition Dropout M F M F M F M F M F F F PRIM 1 95% 90% 1% 4% 4% 6% 90% 94% 1.0% 2.0% 9.0% 4.0%
PRIM 2 95% 94% 1% 1% 4% 5% 94% 95% 5.0% 3.0% 1.0% 2.0%
PRIM 3 90% 94% 1% 2% 9% 4% 94% 94% 6.0% 1.0% 0.0% 5.0% PRIM 4 92% 88% 1% 1% 7% 11% 95% 96% 5.0% 2.0% 0.0% 2.0%
PRIM 5 91% 85% 2% 6% 7% 9% 99% 98% 1.0% 1.0% 0.0% 1.0% PRIM 6 98% 88% 1% 4% 1% 11% 98% 96% 1.0% 2.0% 1.0% 2.0%
Table A.3b: Flow rates in secondary schools, 2011/12 Public Private
Promotion Repetition Dropout Promotion Repetition Dropout M F M F F F M F M F F F JS 1 92% 98% 2% 0% 6% 2% 95% 97% 1% 2% 4% 1% JS 2 95% 95% 2% 0% 3% 5% 93% 91% 7% 8% 0% 1% JS 3 97% 94% 1% 0% 2% 6% 97% 93% 2% 6% 1% 1% SS 1 93% 91% 4% 5% 3% 4% 98% 99% 2% 1% 0% 0% SS 2 96% 94% 2% 4% 2% 2% 97% 93% 2% 4% 1% 3% SS 3 92% 95% 5% 4% 3% 1% 97% 94% 2% 6% 1% 0%

107
Table A.4: Enrolment structure in basic education, by level of education, proprietor, gender and location, 2011/12
ENROLMENTS Of which: RURAL GROSS ENROLMENT RATIOS
Male+Private Female+Private All+Private Male Female All Male Female All
All All All
Pre-primary 34,035 32,128 66,163 49% 42% 18% 12% 12% 12%
Primary 283,775 86,722 370,497 51% 49% 14% 69% 55% 62%
JSS 52,691 38,553 91,244 42% 32% 1% 30% 22% 26%
Total 370,501 157,403 527,904 47% 41% 11% 43% 35% 40%
Public Public Public
Pre-primary 23,256 21,977 45,233 89% 77% 12% 8% 8% 8%
Primary 274,862 79,216 354,078 87% 85% 9% 67% 53% 60%
JSS 51,525 37,761 89,286 78% 61% 1% 30% 22% 26%
Total 349,643 138,954 488,597 85% 74% 7% 41% 33% 37%
Private Private Projected School Age Population to 2012
Pre-primary 10,779 10,151 20,930 9% 7% 24% 290,987 261,206 552,193
Primary 8,913 7,506 16,419 15% 12% 18% 452,057 419,505 871,563
JSS 1,166 792 1,958 6% 2% 1% 173,698 171,669 345,367
Total 20,858 18,449 39,307 10% 7% 14% 916,742 852,380 1,769,123
Table A.5: Teachers in pre-primary, primary and secondary schools, 2011/12
Public Private
Pre-primary Schools (3-5 years) M F T M F T
Qualified 350 54 404 212 260 472 Unqualified 188 101 289 114 111 225 S/Total 538 155 693 326 371 697
Primary Schools Qualified 5,368 706 6,074 492 264 756 Unqualified 4,759 790 5,549 173 242 415 S/Total 10,127 1,496 11,623 665 506 1,171
JSS Qualified 2,947 225 3,172 118 11 129 Unqualified 561 40 601 22 2 24 S/Total 3,508 265 3,773 140 13 153
SSS Qualified 2,131 292 2,423 20 11 31 Unqualified 173 28 201 12 10 22 S/Total 2,304 320 2,624 32 21 53
SSS Technical Qualified 116 24 140 - - - Unqualified 80 5 85 - - - S/Total 196 29 225 - - -
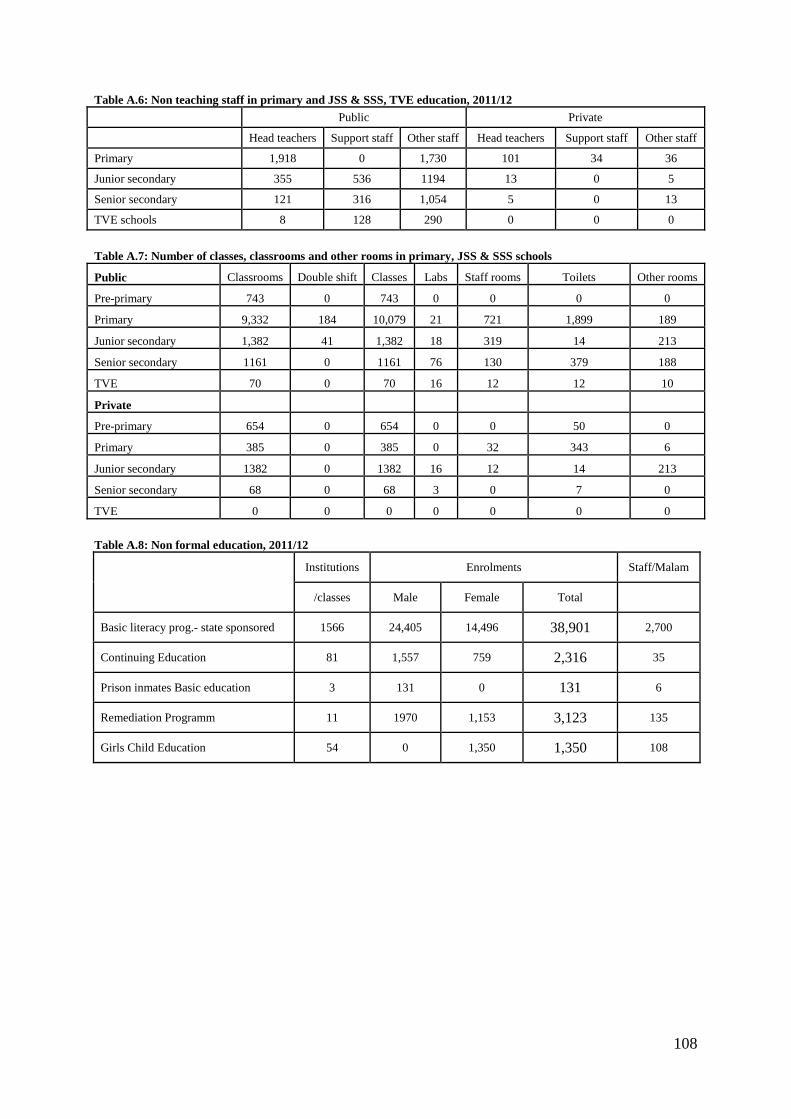
108
Table A.6: Non teaching staff in primary and JSS & SSS, TVE education, 2011/12 Public Private
Head teachers Support staff Other staff Head teachers Support staff Other staff
Primary 1,918 0 1,730 101 34 36
Junior secondary 355 536 1194 13 0 5
Senior secondary 121 316 1,054 5 0 13
TVE schools 8 128 290 0 0 0
Table A.7: Number of classes, classrooms and other rooms in primary, JSS & SSS schools Public Classrooms Double shift Classes Labs Staff rooms Toilets Other rooms
Pre-primary 743 0 743 0 0 0 0
Primary 9,332 184 10,079 21 721 1,899 189
Junior secondary 1,382 41 1,382 18 319 14 213
Senior secondary 1161 0 1161 76 130 379 188
TVE 70 0 70 16 12 12 10
Private Pre-primary 654 0 654 0 0 50 0
Primary 385 0 385 0 32 343 6
Junior secondary 1382 0 1382 16 12 14 213
Senior secondary 68 0 68 3 0 7 0
TVE 0 0 0 0 0 0 0 Table A.8: Non formal education, 2011/12
Institutions Enrolments Staff/Malam
/classes Male Female Total
Basic literacy prog.- state sponsored 1566 24,405 14,496 38,901 2,700
Continuing Education 81 1,557 759 2,316 35
Prison inmates Basic education 3 131 0 131 6
Remediation Programm 11 1970 1,153 3,123 135
Girls Child Education 54 0 1,350 1,350 108

109
Table A.9 High Education institutions, 2011.2012
College of Education, Gumel
College of Agriculture
College of Islamic & Legal Studies
College of Arts, Science & Remedial Studies
Informatics Institute
Polytechnic
Enrolment 4733 1627 4106 515 1569 1370 Male 2872 1532 2668 482 1478 1243 Female 1861 95 1438 33 91 127 Teachers 209 49 91 40 27 99 Non Teaching staff 324 92 57 87 107 70 Senior 97 22 30 19 43 31 Junior 227 26 27 170 64 39 Infrastructure Classroom 309 12 78 8 5 30 Labs & special Rooms 14 9 35 6 3 29 Others 10 2 31 0 2 8
Table A.10: Teachers at Primary and Junior Secondary Schools by Gender and Qualification (%)
PUBLIC PRIVATE
2011/12 2012/13 2013/14 2011/12 2012/13 2013/14
M F M F M F M F M F M F Primary Qualified 5,368 706 5,999 925 6,095 1,122 492 264 599 319 699 369
Unqualified 4,759 790 5,303 1,050 4,807 1,308 173 242 193 288 205 329 Junior Secondary
Qualified 2,947 225 2,214 257 2,348 371 118 11 153 20 204 35 Unqualified 561 40 403 28 407 27 22 2 27 2 35 3
Senior Secondary Qualified 2,131 292 1,922 328 1,809 374 20 11 22 12 31 16
Unqualified 173 28 156 23 147 20 12 10 13 10 18 12 Table A.11: Teachers and Non Teaching Staff at Higher Education Institutions by Gender (%) Institution No of teaching No of non-teaching Male Female Male Female
College of Education, Gumel 95% 5% 84% 16%
Jigawa State Polytechnic, Dutse 92.9% 7.1% 89.2% 16.9%
Binyaminu UsmanCollege of Agriculture, Hadejia 98.0% 2.0% 98.9% 4.5%
College of Islamic Legal Studies, Ringim 90.1% 9.9% 84.2% 7.0%
Informatics Institute, Kazaure 100.0% 0.0% 100.0% 2.9%
Jigawa College of Arts, Science & Remedial Studies 95.0% 5.0% 97.5% 9.9%

110
Table 12. Unit costs by level of education (Pre-primary, Primary, Secondary education) 20012 (N000)
Recurrent costs Pre- Primary Primary JSS SSS
Teachers (Wage, etc.) Qualified 120,998 4,263,126 1,791,882 1,316,238 UnQualified 77,799 2,112,537 267,180 155,001 Head Teachers 0 1,336,199 183,658 69,046 Incentive rural location 0 814,389 0 0
Other Staff Costs 935 0 212,120 281,598 Support personnel 935 261,230 4,526 79,980 Other non teaching staff 0 0 207,594 201,618
Learning/Teaching guides 36,775 261,230 190,909 255,276 Textbooks 36,186 779,815 181,805 246,626 Teaching guides 589 760,056 9,104 8,650
Other running costs 5,481 19,759 53,243 42,243 Training & staff development
support 3,995 108,947 49,097 36,438 School feeding (per pupil) 0 90,487 0 0 Other support, per student 0 0 0 0 Other support, per class 1,486 0 4,146 5,805
Total Recurrent 241,987 18,460 2,698,992 2,119,401 Total Constructions & other
investments 6,007,521 5,413,118 34,508 34,173 New constructions (incl.
Separate water/sanitation facilities) 5,918,413 1,333,319 0 0
New equipment (incl. furniture) 1,228 917,820 0 0
Reconstruction (incl. Separate water/sanitation facilities) 87,880 56,198 34,508 34,173
Table 13. Unit Costs in high education institution, 2012 (N000)
State College of Education Polytechnic Monotechnics
Recurrent costs 1,248.14 1,191.88 166.26 4.1 Teachers (Wage, etc.) 378,248 171,095 52,313
Category 1 378,248 90,490 14,478 Category 2 0 80,605 37,835
4.2 Other staff costs 158,315 40,174 194,168 Senior staff 82,043 17,762 97,267 Junior staff 76,272 13,108 55,457
4.4 Other running costs 26,231 19,225 56,430 Training & staff development support 10,731 4,225 4,930 School feeding (per pupil) 0 0 0 Other support, per student 0 0 0 Other support, per class 15,500 15,000 51,500
Total Recurrent 562,794 230,494 302,911 Total Constructions & other investments 82,936 54,373 0
New constructions 77,602 0 0 New equipment (incl. furniture) 4,351 0 0 Renovation and maintenance 983 54,373 0

111
Table 14 Domestic resources (0000) in 2012, Jigawa State
State resources 52,382,837 Federation account 36,154,744 Value Added Tax 8,270,790 Internally generated revenue/excess crude 5,240,823 Donour Funding (ESSPIN) 126,905 Education trust fund 320,000 UBE intervention fund 1,238,477 Others (MDGs, School Fees, Tender) 1,031,098
Education as % of total state revenue 29.5% Allocation to Education (MOE, MOST, Health) 15,475,149.6
Of which Recurrent 57.3% Recurrent 8,873,487.4 Capital 6,601,662.2
LGA resources 31,337,234.4 Federal allocations 31,337,234.4 Internally generated revenue 0.0
Education as % of total LGA revenue 39.9% Allocation to Education 12,498,289.7
Of which Recurrent 12,498,289.7 Recurrent 12,498,289.7 Capital 0.0
Total allocation to Education 27,973,439 Recurrent 76.4% Capital 23.6% As % of total state & LGA expenditure 33.4%
3. Key Targets and Indicators to 2022 under Different Scenarios
2011 2014 2017 2020 2021
2012 2015 2018 2021 2022
Pre-Primary education Gross enrolment ratio (incl.Private) 18% 30% 42% 54% 58% Total Teachers 693 1567 2855 4800 5663 No of classrooms 743 1655 2959 4850 5663
Primary education
Gross intake rate 53% 62% 69% 77% 79% Gross enrolment ratio (incl.Private) 56% 57% 62% 71% 74% GPI GER 0.79 0.75 0.75 0.81 0.82 Students/teacher ratio 38 38 39 40 40 Student enrolments 475,035 538,434 642,277 795,250 854,685 Total Teachers 11,623 14,143 16,743 20,643 22,142 No of classrooms 10,027 11,606 14,641 19,257 21,106
Junior secondary education Registration rate 39% 51% 64% 76% 80%

112
GPI GER 0.74 0.63 0.62 0.56 0.57 Gross enrolment ratio (incl.Private) 26% 23% 29% 38% 43% Student enrolments 91,244 84,427 116,999 169,225 194,582 Total Teachers 3,773 7,958 27,740 102,849 162,226 No of classrooms 1,436 1,571 2,846 4,804 5,749 No of Labs 26 85 212 400 489
Senior secondary education Registration rate 65% 69% 74% 78% 80% Gross enrolment ratio (incl.Private) 23% 20% 19% 26% 29% GPI GER 0.74 0.64 0.63 0.64 0.65 Student enrolments 71,336 67,791 68,985 101,349 118,224 Total Teachers 2,624 6,134 14,659 50,792 79,208 No of Labs 92 31 47 130 198
Higher education
Gross enrolment ratio (incl.Private) 4% 5% 7% 9% 10% GPI GER 0.27 0.29 0.29 0.29 0.33 Student enrolments 18,776 18,631 21,546 24,911 28,795 Total Teachers 525 634 1,045 1,887 877 No of classrooms 133 66 119 251 347 No of Labs 96 39 55 81 93
Expenditures
Recurrent costs 27,305,090 33,887,034 67,082,256 188,096,832 283,916,09
4
Primary education 10,193,219 10,809,672 14,519,353 20,303,830 22,706,882
Junior secondary education 3,725,393 6,462,695 23,987,459 96,300,490 156,709,569
Senior secondary education 3,707,754 5,386,758 13,118,534 48,571,597 77,865,660 Higher education 3,532,268 4,190,853 7,176,815 12,696,198 15,530,659 ECCE 407,913 906,056 1,789,430 3,277,457 3,983,466 Non formal education 1,890,025 1,924,052 1,891,804 1,919,858 1,940,885
Investments 4,102,824 6,834,242 10,421,593 16,360,284 10,980,288 Primary education 1,414,592 2,704,969 4,060,805 5,341,444 4,891,042 Junior secondary education 54,551 393,253 935,460 1,512,179 1,452,288 Senior secondary education 5,715 77,413 460,396 2,564,221 981,290 Higher education 169,242 609,500 944,069 1,616,984 500,581 ECCE 715,699 1,035,427 1,508,387 2,235,737 571,142 Non formal education 274,932 50,649 53,163 55,822 58,205
Available domestic resources 27,973,439 33,343,168 39,710,685 47,257,129 50,070,452
Simulation Costs 31,407,913 40,721,275 77,503,849 204,457,116 294,896,38
2 GAP Budget/Simulation costs 10% 19% 92% 328% 485%
Source: Jigawa State simulation model

113
4. Concensus Simulation Results
A. ENROLMENTS BASELINE
POLICY OBJECTIVES PROJECTION RESULTS
B. EDUCATIONAL STAFF 2011 Targets/ 2011 2012 2013 2014 2015 2016 2017 2018 2019 2020 2021 C. MATERIALS 2012 Options 2012 2013 2014 2015 2016 2017 2018 2019 2020 2021 2022 D. INFRASTRUCTURE PRE-PRIMARY EDUCATION (AGE 4-5) A. ENROLMENTS
Gross enrolment ratio 18% 22% 26% 30% 34% 38% 42% 46% 50% 54% 58% Preschool enrolments
Public 45,23
3 59,51
8 74,56
7 90,41
2 107,086 124,623 143,058 162,427 182,769 204,123 226,530
Male 23,25
6 30,70
6 38,55
4 46,81
8 55,514 64,661 74,277 84,380 94,991 106,129 117,817
Nursery 1 13,95
4 17,87
3 22,00
1 26,34
6 30,916 35,723 40,774 46,079 51,651 57,497 63,631
Nursery 2 9,302 12,832
16,553
20,472 24,598 28,939 33,503 38,300 43,340 48,632 54,186
Female 21,97
7 28,81
2 36,01
3 43,59
4 51,571 59,962 68,781 78,047 87,779 97,994 108,712
Nursery 1 13,18
6 16,75
1 20,50
5 24,45
7 28,614 32,984 37,577 42,400 47,465 52,780 58,356
Nursery 2 8,791 12,061
15,507
19,137 22,958 26,978 31,204 35,647 40,314 45,214 50,357
Private 20,93
0 23,04
2 25,25
7 27,57
7 30,007 32,552 35,216 38,003 40,919 43,969 47,157
Male 10,77
9 11,90
4 13,08
4 14,32
1 15,617 16,974 18,395 19,882 21,438 23,066 24,768
Nursery 1 5,673 6,241 6,837 7,461 8,115 8,799 9,515 10,265 11,049 11,869 12,726 Nursery 2 5,106 5,663 6,248 6,860 7,503 8,175 8,880 9,617 10,389 11,197 12,041
Female 10,15
1 11,13
8 12,17
2 13,25
6 14,390 15,578 16,821 18,121 19,481 20,903 22,389
Nursery 1 6,395 6,809 7,241 7,692 8,163 8,654 9,166 9,700 10,257 10,837 11,442 Nursery 2 3,756 4,329 4,931 5,563 6,227 6,924 7,655 8,421 9,224 10,066 10,947
B. TEACHING AND NON

114
A. ENROLMENTS BASELINE
POLICY OBJECTIVES PROJECTION RESULTS
B. EDUCATIONAL STAFF 2011 Targets/ 2011 2012 2013 2014 2015 2016 2017 2018 2019 2020 2021 C. MATERIALS 2012 Options 2012 2013 2014 2015 2016 2017 2018 2019 2020 2021 2022 D. INFRASTRUCTURE TEACHING STAFF
Public Some indicators
Pupil/teacher ratio 40.0 65 63 60 58 55 53 50 48 45 43 40 Total classes 743 743 1,012 1,315 1,655 2,039 2,471 2,959 3,511 4,137 4,850 5,663 Pupil/class ratio 40.0 61 59 57 55 53 50 48 46 44 42 40
New teachers 3% 0 284 327 376 432 497 573 661 765 887 1,033 Total teachers 693 693 949 1,238 1,567 1,941 2,368 2,855 3,414 4,057 4,800 5,663
Qualified M 350 350 480 627 794 984 1,202 1,450 1,736 2,065 2,446 2,888 Qualified F 54 54 85 127 180 246 329 432 558 712 901 1,133 Unqualified M 188 188 250 316 387 464 546 635 732 837 951 1,076 Unqualified F 101 101 134 169 207 247 291 338 388 443 502 566
Ratio Qualified M 51.0% 51% 51% 51% 51% 51% 51% 51% 51% 51% 51% 51% Ratio Qualified F 20.0% 8% 9% 10% 11% 13% 14% 15% 16% 18% 19% 20% Ratio Unqualified M 19.0% 27% 26% 26% 25% 24% 23% 22% 21% 21% 20% 19% Ratio Unqualified F 10.0% 15% 14% 14% 13% 13% 12% 12% 11% 11% 10% 10%
Head Teachers 0 0 0 0 0 0 0 0 0 0 0 0 Teacher/Head Teachers
ratio 0.0 0.0 0.0 0.0 0.0 0.0 0.0 0.0 0.0 0.0 0.0 0.0
New non-teaching staff 3% 0 3 4 5 7 8 10 13 17 22 29 Total non-teaching staff 7 10 14 19 24 32 41 53 68 87 113
Caregivers 7 7 10 14 19 24 32 41 53 68 87 113 Other non teaching staff 0 0 0 0 0 0 0 0 0 0 0 0
Teacher/Caregivers ratio 50.0 99.0 94.1 89.2 84.3 79.4 74.5 69.6 64.7 59.8 54.9 50.0 Teacher/Other non teaching
staff ratio 0.0 0.0 0.0 0.0 0.0 0.0 0.0 0.0 0.0 0.0 0.0 0.0
Private
Some indicators Pupil/teacher ratio 30 30 30 30 30 30 30 30 30 30 30 30 Total classes 654 654 720 789 862 938 1,017 1,100 1,188 1,279 1,374 1,474 Pupil/class ratio 32 32 32 32 32 32 32 32 32 32 32 32
New teachers 3% 0 93 99 105 111 117 124 131 138 146 154 Total teachers 697 <= 697 767 841 919 1,000 1,085 1,173 1,266 1,364 1,465 1,572
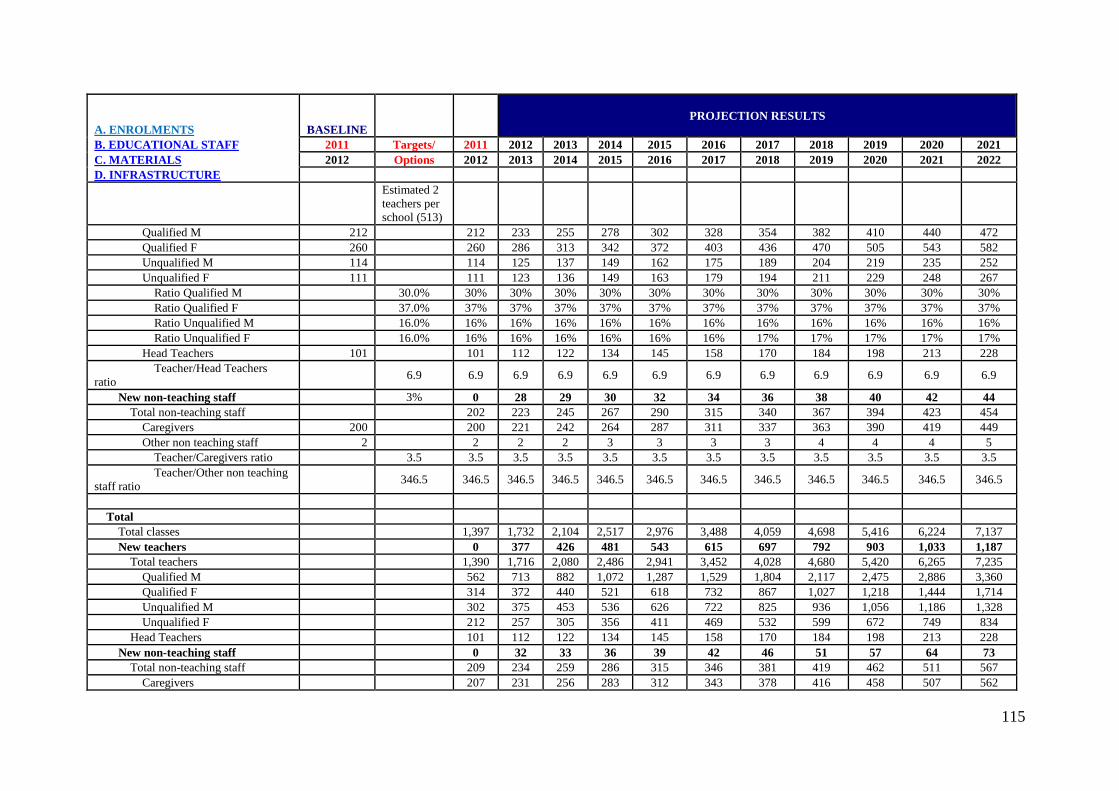
115
A. ENROLMENTS BASELINE
POLICY OBJECTIVES PROJECTION RESULTS
B. EDUCATIONAL STAFF 2011 Targets/ 2011 2012 2013 2014 2015 2016 2017 2018 2019 2020 2021 C. MATERIALS 2012 Options 2012 2013 2014 2015 2016 2017 2018 2019 2020 2021 2022 D. INFRASTRUCTURE Estimated 2
teachers per school (513)
Qualified M 212 212 233 255 278 302 328 354 382 410 440 472 Qualified F 260 260 286 313 342 372 403 436 470 505 543 582 Unqualified M 114 114 125 137 149 162 175 189 204 219 235 252 Unqualified F 111 111 123 136 149 163 179 194 211 229 248 267
Ratio Qualified M 30.0% 30% 30% 30% 30% 30% 30% 30% 30% 30% 30% 30% Ratio Qualified F 37.0% 37% 37% 37% 37% 37% 37% 37% 37% 37% 37% 37% Ratio Unqualified M 16.0% 16% 16% 16% 16% 16% 16% 16% 16% 16% 16% 16% Ratio Unqualified F 16.0% 16% 16% 16% 16% 16% 16% 17% 17% 17% 17% 17%
Head Teachers 101 101 112 122 134 145 158 170 184 198 213 228 Teacher/Head Teachers
ratio 6.9 6.9 6.9 6.9 6.9 6.9 6.9 6.9 6.9 6.9 6.9 6.9
New non-teaching staff 3% 0 28 29 30 32 34 36 38 40 42 44 Total non-teaching staff 202 223 245 267 290 315 340 367 394 423 454
Caregivers 200 200 221 242 264 287 311 337 363 390 419 449 Other non teaching staff 2 2 2 2 3 3 3 3 4 4 4 5
Teacher/Caregivers ratio 3.5 3.5 3.5 3.5 3.5 3.5 3.5 3.5 3.5 3.5 3.5 3.5 Teacher/Other non teaching
staff ratio 346.5 346.5 346.5 346.5 346.5 346.5 346.5 346.5 346.5 346.5 346.5 346.5
Total
Total classes 1,397 1,732 2,104 2,517 2,976 3,488 4,059 4,698 5,416 6,224 7,137 New teachers 0 377 426 481 543 615 697 792 903 1,033 1,187
Total teachers 1,390 1,716 2,080 2,486 2,941 3,452 4,028 4,680 5,420 6,265 7,235 Qualified M 562 713 882 1,072 1,287 1,529 1,804 2,117 2,475 2,886 3,360 Qualified F 314 372 440 521 618 732 867 1,027 1,218 1,444 1,714 Unqualified M 302 375 453 536 626 722 825 936 1,056 1,186 1,328 Unqualified F 212 257 305 356 411 469 532 599 672 749 834
Head Teachers 101 112 122 134 145 158 170 184 198 213 228 New non-teaching staff 0 32 33 36 39 42 46 51 57 64 73
Total non-teaching staff 209 234 259 286 315 346 381 419 462 511 567 Caregivers 207 231 256 283 312 343 378 416 458 507 562

116
A. ENROLMENTS BASELINE
POLICY OBJECTIVES PROJECTION RESULTS
B. EDUCATIONAL STAFF 2011 Targets/ 2011 2012 2013 2014 2015 2016 2017 2018 2019 2020 2021 C. MATERIALS 2012 Options 2012 2013 2014 2015 2016 2017 2018 2019 2020 2021 2022 D. INFRASTRUCTURE Other non teaching staff 2 2 2 3 3 3 3 4 4 4 5 C. TEXTBOOKS AND TEACHER GUIDES
Public
Books 2011 2014 90,46
6 59,51
8 74,56
7 90,41
2 107,086 124,623 143,058 162,427 182,769 204,123 226,530
Books per pupil 2 2 2.0 2.0 2.0 2.0 2.0 2.0 2.0 2.0 2.0 2.0 2.0
# Books 90,46
6 59,51
8 74,56
7 90,41
2 107,086 124,623 143,058 162,427 182,769 204,123 226,530
Teaching guides 2011 2014 693 348 429 520 621 735 863 1,007 1,170 1,355 1,566 Books per teacher 1 1 1.0 1.0 1.0 1.0 1.0 1.0 1.0 1.0 1.0 1.0 1.0 # Teaching guides 693 348 429 520 621 735 863 1,007 1,170 1,355 1,566
Private
Books 2011 2014 0 5,121 11,225
18,385 20,005 21,701 23,477 25,336 27,280 29,313 31,438
Books per pupil 0 2 0.0 0.7 1.3 2.0 2.0 2.0 2.0 2.0 2.0 2.0 2.0
# Books 0 5,121 11,225
18,385 20,005 21,701 23,477 25,336 27,280 29,313 31,438
Teaching guides 2011 2014 697 341 467 612 666 723 782 844 909 977 1,048 Books per teacher 1 2 1.0 1.3 1.7 2.0 2.0 2.0 2.0 2.0 2.0 2.0 2.0 # Teaching guides 697 341 467 612 666 723 782 844 909 977 1,048
Total
Books 90,46
6 64,63
8 85,79
2 108,7
96 127,091 146,324 166,535 187,763 210,049 233,436 257,968
Teaching guides 1,390 689 896 1,132 1,288 1,458 1,645 1,851 2,079 2,332 2,614 D. CLASSROOMS AND OTHER ROOMS
Public Class/classroom ratio 1.0 1.0 1.0 1.0 1.0 1.0 1.0 1.0 1.0 1.0 1.0 1.0 Total classrooms 743 743 1,012 1,315 1,655 2,039 2,471 2,959 3,511 4,137 4,850 5,663
Classrooms to build by year 0 269 303 340 383 432 488 552 626 713 813

117
A. ENROLMENTS BASELINE
POLICY OBJECTIVES PROJECTION RESULTS
B. EDUCATIONAL STAFF 2011 Targets/ 2011 2012 2013 2014 2015 2016 2017 2018 2019 2020 2021 C. MATERIALS 2012 Options 2012 2013 2014 2015 2016 2017 2018 2019 2020 2021 2022 D. INFRASTRUCTURE
Private Class/classroom ratio 1.0 1.0 1.0 1.0 1.0 1.0 1.0 1.0 1.0 1.0 1.0 1.0 Total classrooms 654 654 720 789 862 938 1,017 1,100 1,188 1,279 1,374 1,474
Classrooms to build by year 0 66 69 73 76 80 83 87 91 95 100
PRIMARY A. ENROLMENTS 0 0 0 0 0 0 0 0 0 0 0
Intakes at Primary 1 0 0 0 0 0 0 0 0 0 0 0
Children of school intake age 165,6
16 170,2
53 175,0
21 179,9
21 184,959 190,138 195,462 200,935 206,561 212,344 218,290
Male 86,40
1 88,82
0 91,30
7 93,86
3 96,492 99,193 101,971 104,826 107,761 110,778 113,880
Female 79,21
6 81,43
4 83,71
4 86,05
8 88,467 90,944 93,491 96,109 98,800 101,566 104,410
Gross intake rates (%)
Public 87,708 53% 55% 57% 59% 61% 63% 65% 68% 70% 73% 75% Male 54,314 80% 63% 64% 66% 68% 69% 71% 73% 74% 76% 78% 80% Female 33,394 70% 42% 44% 47% 49% 52% 54% 57% 60% 63% 67% 70%
Private 5,649 3% 3% 4% 4% 4% 4% 4% 4% 4% 4% 4% Male 3,004 4% 3% 4% 4% 4% 4% 4% 4% 4% 4% 4% 4% Female 2,645 4% 3% 3% 3% 4% 4% 4% 4% 4% 4% 4% 4%
Total 93,357 56.4% 58% 60% 62% 64% 66.7% 69% 71% 74% 77% 79%
Male 66% 68% 70% 71% 73% 75% 76% 78% 80% 82% 84% Female 45% 48% 50% 53% 55% 58% 61% 64% 67% 70% 74%
Gross enrolment ratios
Public 55% 53% 53% 54% 55% 57% 59% 61% 64% 67% 70% Male 61% 60% 60% 61% 63% 65% 67% 70% 72% 75% 77% Female 48% 46% 45% 45% 46% 48% 50% 53% 56% 59% 63%
Private 2% 2% 3% 3% 3% 4% 4% 4% 4% 4% 4%

118
A. ENROLMENTS BASELINE
POLICY OBJECTIVES PROJECTION RESULTS
B. EDUCATIONAL STAFF 2011 Targets/ 2011 2012 2013 2014 2015 2016 2017 2018 2019 2020 2021 C. MATERIALS 2012 Options 2012 2013 2014 2015 2016 2017 2018 2019 2020 2021 2022 D. INFRASTRUCTURE Male 2% 2% 3% 3% 4% 4% 4% 4% 4% 4% 4%
Female 2% 2% 3% 3% 3% 3% 4% 4% 4% 4% 4% Of which: SENs 13 0% 0% 0% 0% 0% 0% 0% 0% 0% 0% 0%
Male 11 0% 0% 0% 0% 0% 0% 0% 0% 0% 0% 0% 0% Female 2 0% 0% 0% 0% 0% 0% 0% 0% 0% 0% 0% 0%
Enrolment Total 491,4
54 497,9
68 513,9
92 538,4
34 570,797 604,548 642,277 688,997 740,109 795,250 854,685
Public 475,0
35 476,7
44 488,0
45 507,9
22 536,807 568,011 604,432 649,403 698,602 751,729 809,051
Male 274,8
62 278,8
53 287,1
35 300,9
91 319,586 338,853 358,537 381,517 406,136 432,368 460,313
Female 200,1
73 197,8
91 200,9
10 206,9
31 217,221 229,158 245,895 267,886 292,466 319,361 348,738
Of which: Regular Government
438,881
447,235
455,776
472,194 496,776 523,247 554,233 592,713 634,655 679,736 728,146
Male 252,4
13 262,0
01 268,5
21 280,1
55 296,058 312,417 328,988 348,397 369,093 391,032 414,282
Female 186,4
68 185,2
34 187,2
56 192,0
39 200,718 210,831 225,244 244,315 265,562 288,704 313,864
Of which: Nomadic 27,40
3 29,50
8 32,26
9 35,72
8 40,031 44,764 50,199 56,690 63,947 71,993 80,905
Male 15,40
2 16,85
2 18,61
4 20,83
6 23,528 26,437 29,549 33,120 37,042 41,336 46,031
Female 12,00
1 12,65
7 13,65
4 14,89
2 16,503 18,327 20,651 23,570 26,904 30,657 34,874
Of which: Islamiyyah 21,21
5 22,63
8 25,90
8 29,77
6 34,465 39,653 45,650 52,749 60,667 69,423 79,092
Male 5,040 6,944 9,309 12,001 15,100 18,485 22,152 26,304 30,881 35,910 41,428
Female 16,17
5 15,69
4 16,59
9 17,77
6 19,366 21,168 23,498 26,445 29,786 33,513 37,664
Of which: IQTE 5,349 7,727 10,302
13,210 16,580 20,304 24,528 29,491 35,111 41,436 48,543
Male 4,595 5,869 7,286 8,940 10,876 12,998 15,305 17,937 20,852 24,071 27,619

119
A. ENROLMENTS BASELINE
POLICY OBJECTIVES PROJECTION RESULTS
B. EDUCATIONAL STAFF 2011 Targets/ 2011 2012 2013 2014 2015 2016 2017 2018 2019 2020 2021 C. MATERIALS 2012 Options 2012 2013 2014 2015 2016 2017 2018 2019 2020 2021 2022 D. INFRASTRUCTURE Female 754 1,858 3,016 4,270 5,704 7,306 9,223 11,554 14,259 17,366 20,924
Of which: SENs 3,402 3,664 4,008 4,450 4,996 5,591 6,232 6,962 7,755 8,611 9,533 Male 2,452 2,858 3,324 3,884 4,549 5,273 6,056 6,951 7,939 9,026 10,221 Female 950 806 684 565 447 318 176 12 -184 -415 -688
Private 16,41
9 21,22
4 25,94
7 30,51
2 33,990 36,537 37,845 39,594 41,507 43,521 45,633
Male 8,913 11,420
13,913
16,344 18,289 19,689 19,990 20,817 21,784 22,807 23,879
Female 7,506 9,805 12,034
14,168 15,701 16,848 17,855 18,777 19,723 20,714 21,754
B. TEACHING AND NON TEACHING STAFF
Regular Government Some indicators
Pupil/teacher ratio 40.0 38 38 38 38 39 39 39 39 40 40 40
Nb of classes (streams) 9,230 9,230 9,570 9,923 10,459 11,196 11,998 12,930 14,069 15,327 16,702 18,204
Student/class (streams) ratio (class size) 40.0 48 47 46 45 44 44 43 42 41 41 40
Nb of multigrade classes 0 0 0 0 0 0 0 0 0 0 0 0 % of multigrade classes 0% 0% 0% 0% 0% 0% 0% 0% 0% 0% 0% 0%
New teaching staff 3% 0 506 514 727 951 1,011 1,141 1,350 1,456 1,554 1,658
Total teaching staff 11,623 11,62
3 11,77
6 11,93
2 12,29
1 12,856 13,464 14,179 15,076 16,050 17,092 18,204
Qualified M 5,368 5,368 5,437 5,506 5,670 5,928 6,206 6,533 6,943 7,389 7,865 8,374 Qualified F 706 706 785 866 965 1,086 1,217 1,365 1,541 1,736 1,950 2,184 Unqualified M 4,759 4,759 4,822 4,887 5,034 5,267 5,516 5,810 6,179 6,579 7,007 7,463 Unqualified F 790 790 732 673 622 576 525 471 413 347 270 182
Ratio Qualified M 46.0% 46% 46% 46% 46% 46% 46% 46% 46% 46% 46% 46% Ratio Qualified F 12.0% 6% 7% 7% 8% 8% 9% 10% 10% 11% 11% 12% Ratio Unqualified M 41.0% 41% 41% 41% 41% 41% 41% 41% 41% 41% 41% 41% Ratio Unqualified F 1.0% 7% 6% 6% 5% 4% 4% 3% 3% 2% 2% 1%
Head Teachers 1,981 1,981 2,003 2,025 2,081 2,172 2,269 2,384 2,530 2,687 2,855 3,034

120
A. ENROLMENTS BASELINE
POLICY OBJECTIVES PROJECTION RESULTS
B. EDUCATIONAL STAFF 2011 Targets/ 2011 2012 2013 2014 2015 2016 2017 2018 2019 2020 2021 C. MATERIALS 2012 Options 2012 2013 2014 2015 2016 2017 2018 2019 2020 2021 2022 D. INFRASTRUCTURE Teacher/Head Teachers ratio 6.0 5.9 5.9 5.9 5.9 5.9 5.9 5.9 6.0 6.0 6.0 6.0
New non-teaching staff requirements 3% 0 76 77 109 142 151 171 202 218 233 248
Total non-teaching staff 1,730 1,753 1,777 1,831 1,916 2,007 2,114 2,248 2,394 2,550 2,717 Support Staff 0 0 0 0 0 0 0 0 0 0 0 0 Non teaching staff in schools 1,730 1,730 1,753 1,777 1,831 1,916 2,007 2,114 2,248 2,394 2,550 2,717
Teacher/Support Staff ratio 0.0 0.0 0.0 0.0 0.0 0.0 0.0 0.0 0.0 0.0 0.0 0.0 Teacher/Non teaching staff
in schools ratio 6.7 6.7 6.7 6.7 6.7 6.7 6.7 6.7 6.7 6.7 6.7 6.7
Private
Some indicators Pupil/teacher ratio 14 14 14 14 14 14 14 14 14 14 14 14 Nb of classes 385 385 497 607 714 794 853 883 923 967 1,013 1,061 Student/class ratio 43 43 43 43 43 43 43 43 43 43 43 43 Nb of multigrade classes 0 0 0 0 0 0 0 0 0 0 0 0 % of multigrade classes 0% 0% 0% 0% 0% 0% 0% 0% 0% 0% 0% 0%
New teaching staff 3% 0 388 393 391 321 260 175 210 226 238 249 Total teaching staff 1,171 1,171 1,514 1,851 2,177 2,426 2,608 2,702 2,827 2,964 3,108 3,260
Qualified M 492 492 636 778 915 1,019 1,095 1,135 1,187 1,245 1,305 1,369 Qualified F 264 264 342 419 494 551 594 616 646 679 713 750 Unqualified M 173 173 224 274 323 361 388 403 422 443 466 489 Unqualified F 242 242 312 380 446 495 530 548 571 597 624 652
Ratio Qualified M 42.0% 42% 42% 42% 42% 42% 42% 42% 42% 42% 42% 42% Ratio Qualified F 23.0% 23% 23% 23% 23% 23% 23% 23% 23% 23% 23% 23% Ratio Unqualified M 15.0% 15% 15% 15% 15% 15% 15% 15% 15% 15% 15% 15% Ratio Unqualified F 21.0% 21% 21% 21% 20% 20% 20% 20% 20% 20% 20% 20%
Head Teachers 101 101 131 160 188 209 225 233 244 256 268 281 Teacher/Head Teachers
ratio 11.6 11.6 11.6 11.6 11.6 11.6 11.6 11.6 11.6 11.6 11.6 11.6
New non-teaching staff requirements 3% 0 23 23 23 19 16 10 13 14 14 15
Total non-teaching staff 70 91 111 130 145 156 162 169 177 186 195

121
A. ENROLMENTS BASELINE
POLICY OBJECTIVES PROJECTION RESULTS
B. EDUCATIONAL STAFF 2011 Targets/ 2011 2012 2013 2014 2015 2016 2017 2018 2019 2020 2021 C. MATERIALS 2012 Options 2012 2013 2014 2015 2016 2017 2018 2019 2020 2021 2022 D. INFRASTRUCTURE Support Staff 34 34 44 54 63 70 76 78 82 86 90 95
Non teaching staff in schools 36 36 47 57 67 75 80 83 87 91 96 100 Teacher/Support Staff ratio 34.4 34.4 34.4 34.4 34.4 34.4 34.4 34.4 34.4 34.4 34.4 34.4 Teacher/Non teaching staff
in schools ratio 32.5 32.5 32.5 32.5 32.5 32.5 32.5 32.5 32.5 32.5 32.5 32.5
Total
Nb of classes 9,615 10,067
10,530
11,173 11,990 12,851 13,813 14,992 16,294 17,715 19,265
Nb of multigrade classes 0 0 0 0 0 0 0 0 0 0 0 New teacher requirements 0 895 907 1,119 1,273 1,272 1,316 1,560 1,682 1,792 1,907
Total teacher requirements 12,79
4 13,29
0 13,78
3 14,46
8 15,282 16,071 16,881 17,903 19,014 20,200 21,463
Qualified M 5,860 6,073 6,284 6,584 6,947 7,301 7,668 8,131 8,634 9,171 9,743 Qualified F 970 1,127 1,285 1,459 1,637 1,811 1,982 2,187 2,415 2,663 2,934 Unqualified M 4,932 5,046 5,161 5,358 5,627 5,905 6,213 6,601 7,022 7,472 7,952 Unqualified F 1,032 1,044 1,053 1,067 1,071 1,055 1,018 984 943 894 834 Head Teachers 2,082 2,133 2,184 2,268 2,381 2,494 2,617 2,773 2,942 3,123 3,315
New non-teaching staff requirements 0 99 101 132 161 167 181 214 231 247 263
Total non-teaching staff 1,800 1,844 1,888 1,961 2,061 2,163 2,276 2,417 2,572 2,736 2,912 Support personnel 34 44 54 63 70 76 78 82 86 90 95 Non teaching staff in schools 1,766 1,800 1,834 1,898 1,990 2,087 2,197 2,335 2,485 2,646 2,817
C. TEXTBOOKS AND TEACHER GUIDES
Regular Government
Core textbooks 2011 2013 2,375,
175 794,5
73 813,4
09 846,5
37 894,679 946,685 1,007,386
1,082,338
1,164,336
1,252,882
1,348,419
Core subject books per pupil 5.00 5.0 5.0 5.0 5.0 5.0 5.0 5.0 5.0 5.0 5.0 5.0 5.0
# Textbooks 2,375,175
794,573
813,409
846,537 894,679 946,685 1,007,3
86 1,082,3
38 1,164,3
36 1,252,88
2 1,348,4
19
Teaching guides 2011 2012 11,62
3 2,355 2,386 2,458 2,571 2,693 2,836 3,015 3,210 3,418 3,641

122
A. ENROLMENTS BASELINE
POLICY OBJECTIVES PROJECTION RESULTS
B. EDUCATIONAL STAFF 2011 Targets/ 2011 2012 2013 2014 2015 2016 2017 2018 2019 2020 2021 C. MATERIALS 2012 Options 2012 2013 2014 2015 2016 2017 2018 2019 2020 2021 2022 D. INFRASTRUCTURE Books per teacher 1.00 1.0 1.0 1.0 1.0 1.0 1.0 1.0 1.0 1.0 1.0 1.0 1.0
# Teaching guides 11,62
3 2,355 2,386 2,458 2,571 2,693 2,836 3,015 3,210 3,418 3,641
Private
Core textbooks 2011 2014 16,41
9 5,306 6,487 7,628 8,497 9,134 9,461 9,899 10,377 10,880 11,408
Core subject books per pupil 1.00 1.0 1.00 1.0 1.0 1.0 1.0 1.0 1.0 1.0 1.0 1.0 1.0
# Textbooks 16,419 5,306 6,487 7,628 8,497 9,134 9,461 9,899 10,377 10,880 11,408
Teaching guides 2011 2014 293 378 463 544 606 652 675 707 741 777 815 Books per teacher 1.00 1.0 1.00 1.0 1.0 1.0 1.0 1.0 1.0 1.0 1.0 1.0 1.0 # Teaching guides 293 378 463 544 606 652 675 707 741 777 815
Total
Textbooks 2,391,
594 799,8
79 819,8
95 854,1
65 903,176 955,820 1,016,848
1,092,236
1,174,713
1,263,762
1,359,827
Teaching guides 11,91
6 2,734 2,849 3,002 3,178 3,345 3,511 3,722 3,951 4,195 4,456
D. CLASSROOMS AND OTHER ROOMS
Regular Government % of double shift classes (classes) -1.1% -1% -1% -1% -1% -1% -1% -1% -1% -1% -1% -1%
Total classrooms 9,332 9,332 9,675 10,032
10,575 11,319 12,130 13,073 14,224 15,497 16,887 18,405
Classrooms to build by year 0 343 357 543 745 811 942 1,151 1,272 1,390 1,518 # Staff rooms (incl. Office and
store) 721 721 748 776 818 876 939 1,012 1,102 1,200 1,309 1,427
Staff rooms to build by year 0 27 28 42 58 63 73 90 99 108 118 Classroom/staff room ratio 12.9 12.9 12.9 12.9 12.9 12.9 12.9 12.9 12.9 12.9 12.9 12.9
# Block of 2 VIP toilets 1,899 1,899 1,969 2,043 2,154 2,306 2,472 2,665 2,900 3,161 3,445 3,756 Block of 2 VIP toilets to build
each year 0 70 73 111 152 166 193 236 260 285 311
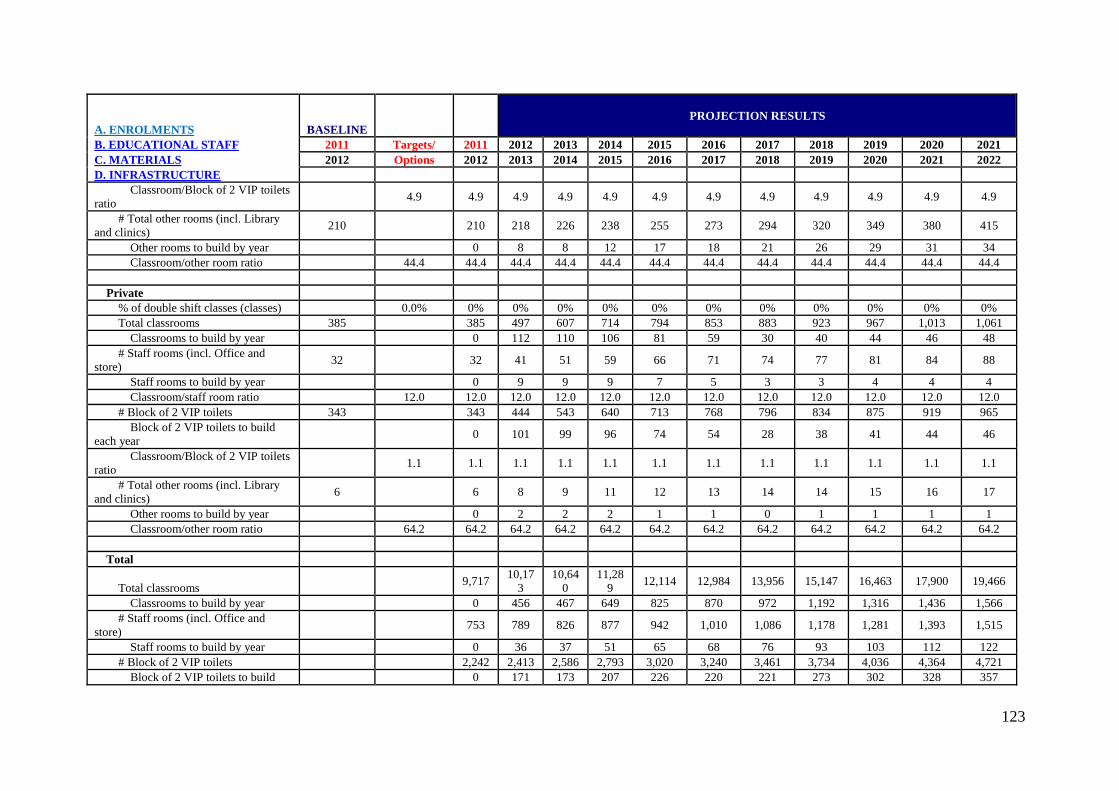
123
A. ENROLMENTS BASELINE
POLICY OBJECTIVES PROJECTION RESULTS
B. EDUCATIONAL STAFF 2011 Targets/ 2011 2012 2013 2014 2015 2016 2017 2018 2019 2020 2021 C. MATERIALS 2012 Options 2012 2013 2014 2015 2016 2017 2018 2019 2020 2021 2022 D. INFRASTRUCTURE Classroom/Block of 2 VIP toilets ratio 4.9 4.9 4.9 4.9 4.9 4.9 4.9 4.9 4.9 4.9 4.9 4.9
# Total other rooms (incl. Library and clinics) 210 210 218 226 238 255 273 294 320 349 380 415
Other rooms to build by year 0 8 8 12 17 18 21 26 29 31 34 Classroom/other room ratio 44.4 44.4 44.4 44.4 44.4 44.4 44.4 44.4 44.4 44.4 44.4 44.4
Private % of double shift classes (classes) 0.0% 0% 0% 0% 0% 0% 0% 0% 0% 0% 0% 0% Total classrooms 385 385 497 607 714 794 853 883 923 967 1,013 1,061
Classrooms to build by year 0 112 110 106 81 59 30 40 44 46 48 # Staff rooms (incl. Office and
store) 32 32 41 51 59 66 71 74 77 81 84 88
Staff rooms to build by year 0 9 9 9 7 5 3 3 4 4 4 Classroom/staff room ratio 12.0 12.0 12.0 12.0 12.0 12.0 12.0 12.0 12.0 12.0 12.0 12.0
# Block of 2 VIP toilets 343 343 444 543 640 713 768 796 834 875 919 965 Block of 2 VIP toilets to build
each year 0 101 99 96 74 54 28 38 41 44 46
Classroom/Block of 2 VIP toilets ratio 1.1 1.1 1.1 1.1 1.1 1.1 1.1 1.1 1.1 1.1 1.1 1.1
# Total other rooms (incl. Library and clinics) 6 6 8 9 11 12 13 14 14 15 16 17
Other rooms to build by year 0 2 2 2 1 1 0 1 1 1 1 Classroom/other room ratio 64.2 64.2 64.2 64.2 64.2 64.2 64.2 64.2 64.2 64.2 64.2 64.2
Total
Total classrooms 9,717 10,173
10,640
11,289 12,114 12,984 13,956 15,147 16,463 17,900 19,466
Classrooms to build by year 0 456 467 649 825 870 972 1,192 1,316 1,436 1,566 # Staff rooms (incl. Office and
store) 753 789 826 877 942 1,010 1,086 1,178 1,281 1,393 1,515
Staff rooms to build by year 0 36 37 51 65 68 76 93 103 112 122 # Block of 2 VIP toilets 2,242 2,413 2,586 2,793 3,020 3,240 3,461 3,734 4,036 4,364 4,721
Block of 2 VIP toilets to build 0 171 173 207 226 220 221 273 302 328 357

124
A. ENROLMENTS BASELINE
POLICY OBJECTIVES PROJECTION RESULTS
B. EDUCATIONAL STAFF 2011 Targets/ 2011 2012 2013 2014 2015 2016 2017 2018 2019 2020 2021 C. MATERIALS 2012 Options 2012 2013 2014 2015 2016 2017 2018 2019 2020 2021 2022 D. INFRASTRUCTURE each year
# Total other rooms (incl. Library and clinics) 216 225 235 249 267 286 308 335 364 396 431
Other rooms (incl. Main store, clinics) to build by year 0 9 10 14 18 19 22 27 29 32 35
NOMADIC EDUCATION A. ENROLMENTS
Number of children receiving Nomadic Education
27,403
29,508
32,269
35,728 40,031 44,764 50,199 56,690 63,947 71,993 80,905
Male 15,40
2 16,85
2 18,61
4 20,83
6 23,528 26,437 29,549 33,120 37,042 41,336 46,031
Female 12,00
1 12,65
7 13,65
4 14,89
2 16,503 18,327 20,651 23,570 26,904 30,657 34,874
B. TEACHING AND NON TEACHING STAFF
Pupil/teacher ratio 40 34 34 35 35 36 37 37 38 39 39 40 New trainers 3% 0 257 91 111 134 146 164 192 212 232 254
Total teaching staff 817 1,105 1,175 1,266 1,382 1,507 1,649 1,819 2,005 2,207 2,427 Teachers 632 632 863 926 1,007 1,108 1,217 1,342 1,489 1,652 1,829 2,023 Head Teachers 185 185 241 248 259 274 289 307 329 353 378 405
Teacher/Head Teachers ratio 5.0 3.4 3.6 3.7 3.9 4.0 4.2 4.4 4.5 4.7 4.8 5.0 New non-teaching staff required 3% 0 16 5 6 8 9 10 11 12 14 15
Total non teaching staff 41 55 59 64 69 76 83 91 101 111 122 Other non teaching staff 41 41 55 59 64 69 76 83 91 101 111 122
Teacher/Other non teaching staff ratio 19.9 19.9 19.9 19.9 19.9 19.9 19.9 19.9 19.9 19.9 19.9 19.9
C. TEXTBOOKS AND TEACHER GUIDES
Core textbooks 2011 2013 137,0
15 49,18
0 53,78
1 59,54
7 66,718 74,606 83,665 94,483 106,578 119,988 134,842

125
A. ENROLMENTS BASELINE
POLICY OBJECTIVES PROJECTION RESULTS
B. EDUCATIONAL STAFF 2011 Targets/ 2011 2012 2013 2014 2015 2016 2017 2018 2019 2020 2021 C. MATERIALS 2012 Options 2012 2013 2014 2015 2016 2017 2018 2019 2020 2021 2022 D. INFRASTRUCTURE Core subject books per pupil 5.00 5 5.0 5.0 5.0 5.0 5.0 5.0 5.0 5.0 5.0 5.0 5.0
# Textbooks 137,015
49,180
53,781
59,547 66,718 74,606 83,665 94,483 106,578 119,988 134,842
Teaching guides 2011 2013 632 276 294 316 345 377 412 455 501 552 607 Books per teacher 1.00 1 1.0 1.0 1.0 1.0 1.0 1.0 1.0 1.0 1.0 1.0 1.0 # Teaching guides 632 276 294 316 345 377 412 455 501 552 607
D. CLASSROOMS AND other rooms (incl. Main store, clinics)
Classrooms 548 590 645 715 801 895 1,004 1,134 1,279 1,440 1,618 Mobile 50 548 590 645 715 801 895 1,004 1,134 1,279 1,440 1,618 Permanent 0 0 0 0 0 0 0 0 0 0 0 0
Other rooms 0 0 0 0 0 0 0 0 0 0 0 Rooms 1 0 0 0 0 0 0 0 0 0 0 0 0 Rooms 2 0 0 0 0 0 0 0 0 0 0 0 0
Total 548 590 645 715 801 895 1,004 1,134 1,279 1,440 1,618 Classrooms 548 590 645 715 801 895 1,004 1,134 1,279 1,440 1,618 0ther rooms 0 0 0 0 0 0 0 0 0 0 0 Rooms to build by year 0 42 55 69 86 95 109 130 145 161 178
ISLAMIYYAH EDUCATION A. ENROLMENTS
Number of children receiving Islamiyyah Education
21,215
22,638
25,908
29,776 34,465 39,653 45,650 52,749 60,667 69,423 79,092
Male 5,040 6,944 9,309 12,001 15,100 18,485 22,152 26,304 30,881 35,910 41,428
Female 16,17
5 15,69
4 16,59
9 17,77
6 19,366 21,168 23,498 26,445 29,786 33,513 37,664
B. TEACHING AND NON TEACHING STAFF
Pupil/teacher ratio 40 29 30 31 32 33 35 36 37 38 39 40 New trainers 3% 0 118 103 119 141 152 172 198 216 234 253

126
A. ENROLMENTS BASELINE
POLICY OBJECTIVES PROJECTION RESULTS
B. EDUCATIONAL STAFF 2011 Targets/ 2011 2012 2013 2014 2015 2016 2017 2018 2019 2020 2021 C. MATERIALS 2012 Options 2012 2013 2014 2015 2016 2017 2018 2019 2020 2021 2022 D. INFRASTRUCTURE Total teaching staff 728 851 937 1,039 1,161 1,292 1,440 1,613 1,800 2,002 2,218
Teachers 653 653 749 827 919 1,029 1,147 1,280 1,436 1,604 1,784 1,977 Head Teachers 75 75 102 110 120 132 145 160 177 197 218 241
Teacher/Head Teachers ratio 8.4 8.4 8.4 8.4 8.4 8.4 8.4 8.4 8.4 8.4 8.4 8.4 New non-teaching staff required 3% 0 4 1 2 2 2 3 3 3 4 4
Total non teaching staff 11 15 16 17 19 20 22 24 27 30 33 Other non teaching staff 11 11 15 16 17 19 20 22 24 27 30 33
Teacher/Other non teaching staff ratio 74.3 74.3 74.3 74.3 74.3 74.3 74.3 74.3 74.3 74.3 74.3 74.3
C. TEXTBOOKS AND TEACHER GUIDES
Core textbooks 2011 2013 106,0
75 37,72
9 43,18
1 49,62
7 57,442 66,088 76,084 87,916 101,111 115,705 131,820
Core subject books per pupil 5.00 5 5.0 5.0 5.0 5.0 5.0 5.0 5.0 5.0 5.0 5.0 5.0
# Textbooks 106,075
37,729
43,181
49,627 57,442 66,088 76,084 87,916 101,111 115,705 131,820
Teaching guides 2011 2013 653 213 234 260 290 323 360 403 450 500 555 Books per teacher 1.00 1 1.0 1.0 1.0 1.0 1.0 1.0 1.0 1.0 1.0 1.0 1.0 # Teaching guides 653 213 234 260 290 323 360 403 450 500 555
D. CLASSROOMS AND other rooms (incl. Main store, clinics)
Classrooms 424 453 518 596 689 793 913 1,055 1,213 1,388 1,582 Mobile 0% 0 0 0 0 0 0 0 0 0 0 0 Permanent 50 424 453 518 596 689 793 913 1,055 1,213 1,388 1,582
Other rooms 0 0 0 0 0 0 0 0 0 0 0 Rooms 1 0 0 0 0 0 0 0 0 0 0 0 0 Rooms 2 0 0 0 0 0 0 0 0 0 0 0 0
Total 424 453 518 596 689 793 913 1,055 1,213 1,388 1,582 Classrooms 424 453 518 596 689 793 913 1,055 1,213 1,388 1,582 0ther rooms 0 0 0 0 0 0 0 0 0 0 0 Rooms to build by year 0 28 65 77 94 104 120 142 158 175 193
INTEGRATED IQTE EDUCATION

127
A. ENROLMENTS BASELINE
POLICY OBJECTIVES PROJECTION RESULTS
B. EDUCATIONAL STAFF 2011 Targets/ 2011 2012 2013 2014 2015 2016 2017 2018 2019 2020 2021 C. MATERIALS 2012 Options 2012 2013 2014 2015 2016 2017 2018 2019 2020 2021 2022 D. INFRASTRUCTURE A. ENROLMENTS
Number of children receiving Integragted Education 5,349 7,727 10,30
2 13,21
0 16,580 20,304 24,528 29,491 35,111 41,436 48,543
Male 4,595 5,869 7,286 8,940 10,876 12,998 15,305 17,937 20,852 24,071 27,619 Female 754 1,858 3,016 4,270 5,704 7,306 9,223 11,554 14,259 17,366 20,924
B. TEACHING AND NON TEACHING STAFF
Pupil/teacher ratio 40 22 24 26 28 29 31 33 35 36 38 40 New trainers 3% 0 140 90 94 103 107 116 131 142 154 167
Total teaching staff 238 344 427 513 606 700 801 915 1,037 1,167 1,308 Secular teachers 189 189 319 397 476 562 650 743 849 962 1,083 1,214 Head Teachers 49 49 25 31 37 44 50 58 66 75 84 94
Teacher/Head Teachers ratio 12.9 12.9 12.9 12.9 12.9 12.9 12.9 12.9 12.9 12.9 12.9 12.9 New non-teaching staff required 3% 0 24 20 21 22 23 25 28 30 32 35
Total non teaching staff 50 72 89 106 125 144 163 186 209 235 262 Other non teaching staff 50 50 72 89 106 125 144 163 186 209 235 262
Teacher/Other non teaching staff ratio 5.0 4.8 4.8 4.8 4.8 4.9 4.9 4.9 4.9 5.0 5.0 5.0
C. TEXTBOOKS AND TEACHER GUIDES
Core textbooks 2011 2013 26,74
5 12,87
8 17,17
0 22,01
7 27,633 33,841 40,879 49,152 58,519 69,061 80,905
Core subject books per pupil 5.00 5 5.0 5.0 5.0 5.0 5.0 5.0 5.0 5.0 5.0 5.0 5.0
# Textbooks 26,745
12,878
17,170
22,017 27,633 33,841 40,879 49,152 58,519 69,061 80,905
Teaching guides 2011 2013 238 0 0 0 0 0 0 0 0 0 0 Books per teacher 1.00 1 1.0 1.0 1.0 1.0 1.0 1.0 1.0 1.0 1.0 1.0 1.0 # Teaching guides 238 0 0 0 0 0 0 0 0 0 0
D. CLASSROOMS AND OTHER ROOMS

128
A. ENROLMENTS BASELINE
POLICY OBJECTIVES PROJECTION RESULTS
B. EDUCATIONAL STAFF 2011 Targets/ 2011 2012 2013 2014 2015 2016 2017 2018 2019 2020 2021 C. MATERIALS 2012 Options 2012 2013 2014 2015 2016 2017 2018 2019 2020 2021 2022 D. INFRASTRUCTURE
Classrooms 107 155 206 264 332 406 491 590 702 829 971 Total classrooms 50 107 155 206 264 332 406 491 590 702 829 971 Classrooms to build 0 48 52 58 67 74 84 99 112 127 142
Other rooms 5 8 10 13 17 20 25 29 35 41 49 Blocks of 2 VIP toilets 20 5 8 10 13 17 20 25 29 35 41 49
Block of 2 VIP toilets to build each year 0 2 3 3 3 4 4 5 6 6 7
Total 112 162 216 277 348 426 515 619 737 870 1,019 Classrooms 107 155 206 264 332 406 491 590 702 829 971 0ther rooms 5 8 10 13 17 20 25 29 35 41 49 Rooms to build by year 0 50 54 61 71 78 89 104 118 133 149
SENs (children with special education needs) A. ENROLMENTS
Number of children receiving SENs 3,415 3,679 4,024 4,466 5,012 5,606 6,244 6,972 7,761 8,614 9,533 Public 3,402 3,664 4,008 4,450 4,996 5,591 6,232 6,962 7,755 8,611 9,533
Male 2,452 2,858 3,324 3,884 4,549 5,273 6,056 6,951 7,939 9,026 10,221 Female 950 806 684 565 447 318 176 12 -184 -415 -688
Private 13 15 16 17 16 14 12 9 6 3 0 Male 11 13 14 14 14 12 10 8 5 3 0 Female 2 2 3 3 3 2 2 2 1 1 0
B. TEACHING AND NON TEACHING STAFF
Public Pupil/teacher ratio 50 71 69 67 65 63 60 58 56 54 52 50 New trainers 3% 0 10 9 11 13 15 17 21 24 27 31
Total Teaching Staff 48 57 64 73 85 99 114 132 153 176 203 Special Education teachers 45 45 53 60 69 80 93 107 124 143 165 191 Head Teachers 3 3 4 4 5 5 6 7 8 10 11 13 Teacher/Head Teachers ratio 15.0 15.0 15.0 15.0 15.0 15.0 15.0 15.0 15.0 15.0 15.0 15.0
New non-teaching staff required 3% 0 4 5 6 7 9 10 11 13 15 17

129
A. ENROLMENTS BASELINE
POLICY OBJECTIVES PROJECTION RESULTS
B. EDUCATIONAL STAFF 2011 Targets/ 2011 2012 2013 2014 2015 2016 2017 2018 2019 2020 2021 C. MATERIALS 2012 Options 2012 2013 2014 2015 2016 2017 2018 2019 2020 2021 2022 D. INFRASTRUCTURE Total non teaching staff 27 30 34 39 45 52 60 69 80 92 106
Other non teaching staff 27 27 30 34 39 45 52 60 69 80 92 106 Teacher/Other non teaching
staff ratio 1.8 1.8 1.8 1.8 1.8 1.8 1.8 1.8 1.8 1.8 1.8 1.8
Private
Pupil/teacher ratio 0 0 0 0 0 0 0 0 0 0 0 0 New trainers 0% 0 0 0 0 0 0 0 0 0 0 0
Total Teaching Staff 0 0 0 0 0 0 0 0 0 0 0 Special Education teachers 0 0 0 0 0 0 0 0 0 0 0 0 Head Teachers 0 0 0 0 0 0 0 0 0 0 0 0 Teacher/Head Teachers ratio 0.0 0.0 0.0 0.0 0.0 0.0 0.0 0.0 0.0 0.0 0.0 0.0
New non-teaching staff required 0% 0 0 0 0 0 0 0 0 0 0 0 Total non teaching staff 0 0 0 0 0 0 0 0 0 0 0
Other non teaching staff 0 0 0 0 0 0 0 0 0 0 0 0 Teacher/Other non teaching
staff ratio 0.0 0.0 0.0 0.0 0.0 0.0 0.0 0.0 0.0 0.0 0.0 0.0
C. TEXTBOOKS AND TEACHER GUIDES
Public Core textbooks 2011 2013 5,670 6,107 6,680 7,416 8,327 9,319 10,386 11,604 12,925 14,351 15,888
Core subject books per pupil 5.00 5 5.0 5.0 5.0 5.0 5.0 5.0 5.0 5.0 5.0 5.0 5.0 # Textbooks 5,670 6,107 6,680 7,416 8,327 9,319 10,386 11,604 12,925 14,351 15,888
Teaching guides 2011 2013 10 11 13 15 17 20 23 26 31 35 41 Books per teacher 1.00 1 1.0 1.0 1.0 1.0 1.0 1.0 1.0 1.0 1.0 1.0 1.0 # Teaching guides 10 11 13 15 17 20 23 26 31 35 41
Private Core textbooks 2011 2013 0 0 0 0 0 0 0 0 0 0 0
Core subject books per pupil 2.00 2 2.0 2.0 2.0 2.0 2.0 2.0 2.0 2.0 2.0 2.0 2.0 # Textbooks 0 0 0 0 0 0 0 0 0 0 0
Teaching guides 2011 2013 0 5 4 5 7 8 9 10 12 14 16 Books per teacher 2.00 2 2.0 2.0 2.0 2.0 2.0 2.0 2.0 2.0 2.0 2.0 2.0 # Teaching guides 0 5 4 5 7 8 9 10 12 14 16

130
A. ENROLMENTS BASELINE
POLICY OBJECTIVES PROJECTION RESULTS
B. EDUCATIONAL STAFF 2011 Targets/ 2011 2012 2013 2014 2015 2016 2017 2018 2019 2020 2021 C. MATERIALS 2012 Options 2012 2013 2014 2015 2016 2017 2018 2019 2020 2021 2022 D. INFRASTRUCTURE D. CLASSROOMS AND OTHER ROOMS
Public Total 106 114 125 138 155 174 194 216 241 268 296 Classrooms
Total classrooms 85 40 43 47 52 59 66 73 82 91 101 112 Classrooms to build 0 3 4 5 6 7 8 9 9 10 11
Toilets Blocks of 2 VIP toilets 7 6 6 7 7 8 9 10 12 13 14 16
Block of 2 VIP toilets to build each year 0 0 1 1 1 1 1 1 1 1 2
Specialized rooms Specialized rooms 2 20 22 24 26 29 33 37 41 46 51 56
Specialized rooms to build each year 0 2 2 3 3 3 4 4 5 5 5
Other rooms Other rooms 1 40 43 47 52 59 66 73 82 91 101 112
Other rooms to build each year 0 3 4 5 6 7 8 9 9 10 11
Private Total 0 0 0 0 0 0 0 0 0 0 0 Classrooms
Total classrooms 0 0 0 0 0 0 0 0 0 0 0 0 Classrooms to build 0 0 0 0 0 0 0 0 0 0 0
Toilets Blocks of 2 VIP toilets 0 0 0 0 0 0 0 0 0 0 0 0
Block of 2 VIP toilets to build each year 0 0 0 0 0 0 0 0 0 0 0
Specialized rooms Specialized rooms 0 0 0 0 0 0 0 0 0 0 0 0
Specialized rooms to build each year 0 0 0 0 0 0 0 0 0 0 0
Other rooms Other rooms 0 0 0 0 0 0 0 0 0 0 0 0
Other rooms to build each year 0 0 0 0 0 0 0 0 0 0 0

131
A. ENROLMENTS BASELINE
POLICY OBJECTIVES PROJECTION RESULTS
B. EDUCATIONAL STAFF 2011 Targets/ 2011 2012 2013 2014 2015 2016 2017 2018 2019 2020 2021 C. MATERIALS 2012 Options 2012 2013 2014 2015 2016 2017 2018 2019 2020 2021 2022 D. INFRASTRUCTURE
Total 106 114 125 138 155 174 194 216 241 268 296
JUNIOR SECONDARY SCHOOLS (JSS) A. ENROLMENTS
Registration rates Total 24,692 39% 43% 46% 50% 53% 56% 60% 63% 67% 70% 74%
Male
15,038 100% 39% 43% 47% 51% 56% 60% 64% 68% 72% 76% 80%
Female
9,654 82% 39% 42% 45% 48% 50% 53% 56% 59% 61% 64% 67%
Gross Enrolment Ratios 26% 24% 23% 23% 24% 26% 29% 32% 35% 38% 43%
Student enrolments 91,24
4 86,35
0 82,36
5 84,42
7 90,807 101,945 116,999 132,934 149,802 169,225 194,582
Public 89,28
6 83,39
2 78,61
9 79,38
5 84,957 95,032 108,814 123,421 138,853 156,570 179,712
Male 51,52
5 49,67
4 48,94
3 49,91
5 53,160 58,910 68,590 79,333 90,693 102,255 116,546
Female 37,76
1 33,71
8 29,67
6 29,47
0 31,797 36,122 40,225 44,088 48,160 54,315 63,166
Of which: Regular Government
77,123
72,194
68,200
69,051 74,117 83,159 95,466 108,556 122,449 138,470 159,410
Male 43,87
1 42,43
7 41,95
2 42,92
8 45,870 51,000 59,576 69,134 79,292 89,692 102,561
Female 33,25
2 29,75
7 26,24
8 26,12
3 28,247 32,159 35,890 39,423 43,157 48,778 56,849
Of which: Vocational/Technical 892 1,167 1,415 1,746 2,208 2,851 3,699 4,690 5,832 7,202 8,986
Male 515 695 881 1,098 1,382 1,767 2,332 3,015 3,809 4,704 5,827 Female 377 472 534 648 826 1,083 1,367 1,675 2,023 2,498 3,158
Of which: Islamiyyah/IQTE 8,929 8,607 8,355 8,680 9,557 10,996 12,911 14,996 17,263 19,942 23,460 Male 5,153 5,067 5,090 5,291 5,742 6,480 7,682 9,044 10,521 12,066 13,986

132
A. ENROLMENTS BASELINE
POLICY OBJECTIVES PROJECTION RESULTS
B. EDUCATIONAL STAFF 2011 Targets/ 2011 2012 2013 2014 2015 2016 2017 2018 2019 2020 2021 C. MATERIALS 2012 Options 2012 2013 2014 2015 2016 2017 2018 2019 2020 2021 2022 D. INFRASTRUCTURE Female 3,776 3,540 3,264 3,389 3,816 4,515 5,229 5,952 6,742 7,876 9,475
Of which: SENs 2,342 2,325 2,341 2,467 2,727 3,140 3,750 4,436 5,188 6,024 7,091 Male 1,986 1,972 1,999 2,096 2,293 2,608 3,115 3,694 4,327 4,996 5,827 Female 356 354 343 371 434 531 634 742 861 1,029 1,263
Private 1,958 2,958 3,745 5,042 5,850 6,913 8,184 9,513 10,949 12,656 14,870 Male 1,166 1,524 1,657 2,211 2,612 3,124 3,860 4,674 5,557 6,481 7,599 Female 792 1,433 2,088 2,831 3,238 3,789 4,325 4,839 5,392 6,174 7,271
Total 91,24
4 86,35
0 82,36
5 84,42
7 90,807 101,945 116,999 132,934 149,802 169,225 194,582
Male 52,69
1 51,19
8 50,60
0 52,12
6 55,773 62,034 72,449 84,007 96,249 108,736 124,145
Female 38,55
3 35,15
1 31,76
4 32,30
1 35,035 39,911 44,549 48,928 53,552 60,489 70,437
B. TEACHING AND NON TEACHING STAFF
Regular Government Some indicators Nb of classes 1,382 1382 1,382 1,126 1,071 1,093 1,182 1,336 1,545 1,770 2,011 2,291 2,657 Weekly teacher workloads 24 24 24 24 24 24 24 24 24 24 24 24 24 Student/class ratio (class size) 60 65 64 64 63 63 62 62 61 61 60 60
Teacher utilization rate 95% 2109
% 1547
% 1135
% 832% 610% 448% 328% 241% 177% 130% 95%
New teaching staff required 3% 0 543 1,410 2,351 3,922 6,549 10,724 16,494 25,214 39,332 64,031 Total teaching staff 3,773 3,773 4,190 5,437 7,562 11,149 17,182 27,093 42,318 65,565 101,842 161,041
Qualified M 2,947 2,947 3,281 4,268 5,949 8,793 13,583 21,470 33,614 52,204 81,281 128,833 Qualified F 225 225 267 368 543 845 1,371 2,272 3,719 6,027 9,773 16,104 Unqualified M 561 561 598 745 991 1,396 2,051 3,074 4,554 6,670 9,763 14,494 Unqualified F 40 40 44 57 79 116 177 277 431 664 1,025 1,610
Ratio Qualified M 80.0% 78% 78% 78% 79% 79% 79% 79% 79% 80% 80% 80% Ratio Qualified F 10.0% 6% 6% 7% 7% 8% 8% 8% 9% 9% 10% 10% Ratio Unqualified M 9.0% 15% 14% 14% 13% 13% 12% 11% 11% 10% 10% 9% Ratio Unqualified F 1.0% 1% 1% 1% 1% 1% 1% 1% 1% 1% 1% 1%
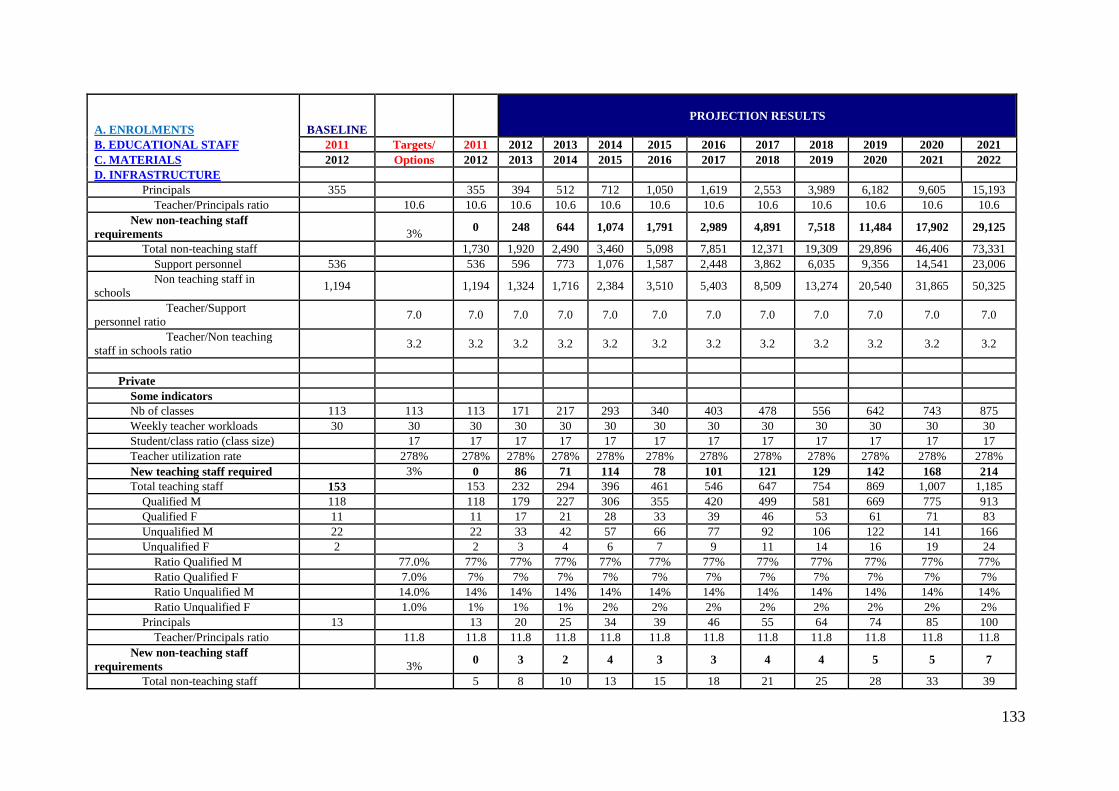
133
A. ENROLMENTS BASELINE
POLICY OBJECTIVES PROJECTION RESULTS
B. EDUCATIONAL STAFF 2011 Targets/ 2011 2012 2013 2014 2015 2016 2017 2018 2019 2020 2021 C. MATERIALS 2012 Options 2012 2013 2014 2015 2016 2017 2018 2019 2020 2021 2022 D. INFRASTRUCTURE Principals 355 355 394 512 712 1,050 1,619 2,553 3,989 6,182 9,605 15,193
Teacher/Principals ratio 10.6 10.6 10.6 10.6 10.6 10.6 10.6 10.6 10.6 10.6 10.6 10.6 New non-teaching staff
requirements 3% 0 248 644 1,074 1,791 2,989 4,891 7,518 11,484 17,902 29,125
Total non-teaching staff 1,730 1,920 2,490 3,460 5,098 7,851 12,371 19,309 29,896 46,406 73,331 Support personnel 536 536 596 773 1,076 1,587 2,448 3,862 6,035 9,356 14,541 23,006 Non teaching staff in
schools 1,194 1,194 1,324 1,716 2,384 3,510 5,403 8,509 13,274 20,540 31,865 50,325
Teacher/Support personnel ratio 7.0 7.0 7.0 7.0 7.0 7.0 7.0 7.0 7.0 7.0 7.0 7.0
Teacher/Non teaching staff in schools ratio 3.2 3.2 3.2 3.2 3.2 3.2 3.2 3.2 3.2 3.2 3.2 3.2
Private
Some indicators Nb of classes 113 113 113 171 217 293 340 403 478 556 642 743 875 Weekly teacher workloads 30 30 30 30 30 30 30 30 30 30 30 30 30 Student/class ratio (class size) 17 17 17 17 17 17 17 17 17 17 17 17 Teacher utilization rate 278% 278% 278% 278% 278% 278% 278% 278% 278% 278% 278% 278% New teaching staff required 3% 0 86 71 114 78 101 121 129 142 168 214 Total teaching staff 153 153 232 294 396 461 546 647 754 869 1,007 1,185
Qualified M 118 118 179 227 306 355 420 499 581 669 775 913 Qualified F 11 11 17 21 28 33 39 46 53 61 71 83 Unqualified M 22 22 33 42 57 66 77 92 106 122 141 166 Unqualified F 2 2 3 4 6 7 9 11 14 16 19 24
Ratio Qualified M 77.0% 77% 77% 77% 77% 77% 77% 77% 77% 77% 77% 77% Ratio Qualified F 7.0% 7% 7% 7% 7% 7% 7% 7% 7% 7% 7% 7% Ratio Unqualified M 14.0% 14% 14% 14% 14% 14% 14% 14% 14% 14% 14% 14% Ratio Unqualified F 1.0% 1% 1% 1% 2% 2% 2% 2% 2% 2% 2% 2%
Principals 13 13 20 25 34 39 46 55 64 74 85 100 Teacher/Principals ratio 11.8 11.8 11.8 11.8 11.8 11.8 11.8 11.8 11.8 11.8 11.8 11.8
New non-teaching staff requirements 3% 0 3 2 4 3 3 4 4 5 5 7
Total non-teaching staff 5 8 10 13 15 18 21 25 28 33 39

134
A. ENROLMENTS BASELINE
POLICY OBJECTIVES PROJECTION RESULTS
B. EDUCATIONAL STAFF 2011 Targets/ 2011 2012 2013 2014 2015 2016 2017 2018 2019 2020 2021 C. MATERIALS 2012 Options 2012 2013 2014 2015 2016 2017 2018 2019 2020 2021 2022 D. INFRASTRUCTURE Support personnel 0 0 0 0 0 0 0 0 0 0 0 0
Non teaching staff in schools 5 5 8 10 13 15 18 21 25 28 33 39
Teacher/Support personnel ratio 0.0 0.0 0.0 0.0 0.0 0.0 0.0 0.0 0.0 0.0 0.0 0.0
Teacher/Non teaching staff in schools ratio 30.6 30.6 30.6 30.6 30.6 30.6 30.6 30.6 30.6 30.6 30.6 30.6
S/Total
Some indicators Nb of classes 1,495 1,297 1,288 1,385 1,522 1,738 2,022 2,326 2,652 3,034 3,532 New teaching staff required 0 629 1,481 2,466 4,000 6,650 10,845 16,623 25,356 39,500 64,245 Total teaching staff 3,926 4,422 5,731 7,958 11,610 17,728 27,740 43,071 66,434 102,849 162,226
Qualified M 3,065 3,460 4,494 6,255 9,148 14,003 21,968 34,195 52,873 82,056 129,746 Qualified F 236 283 389 571 878 1,410 2,318 3,773 6,088 9,844 16,187 Unqualified M 583 632 787 1,048 1,462 2,128 3,166 4,660 6,793 9,905 14,660 Unqualified F 42 47 61 85 123 186 289 444 680 1,044 1,634 Total Principals 368 414 537 746 1,089 1,665 2,608 4,053 6,256 9,691 15,293
New other staff required 0 250 647 1,078 1,793 2,992 4,895 7,522 11,489 17,907 29,132 Total other staff 1,735 1,928 2,499 3,473 5,113 7,869 12,392 19,334 29,925 46,439 73,370
Total support staff 536 596 773 1,076 1,587 2,448 3,862 6,035 9,356 14,541 23,006 Non teaching staff in schools 1,199 1,332 1,726 2,397 3,525 5,421 8,530 13,299 20,569 31,898 50,364
C. TEXTBOOKS AND TEACHER GUIDES
Regular Government
Core textbooks 2011 2013 714,2
88 222,3
78 209,6
52 211,6
94 226,553 253,419 290,172 329,124 370,274 417,519 479,232
Core subject books per student 8.00 8.0 8.0 8.0 8.0 8.0 8.0 8.0 8.0 8.0 8.0 8.0 8.0
# Textbooks 714,2
88 222,3
78 209,6
52 211,6
94 226,553 253,419 290,172 329,124 370,274 417,519 479,232
Teaching guides 2011 2013 7,546 2,095 2,719 3,781 5,574 8,591 13,547 21,159 32,783 50,921 80,521 Books per teacher 2.00 2.0 2.0 2.0 2.0 2.0 2.0 2.0 2.0 2.0 2.0 2.0 2.0 # Teaching guides 7,546 2,095 2,719 3,781 5,574 8,591 13,547 21,159 32,783 50,921 80,521

135
A. ENROLMENTS BASELINE
POLICY OBJECTIVES PROJECTION RESULTS
B. EDUCATIONAL STAFF 2011 Targets/ 2011 2012 2013 2014 2015 2016 2017 2018 2019 2020 2021 C. MATERIALS 2012 Options 2012 2013 2014 2015 2016 2017 2018 2019 2020 2021 2022 D. INFRASTRUCTURE
Private Core textbooks 2011 2019 979 1,479 1,873 2,521 2,925 3,456 4,092 4,757 5,474 6,328 7,435
Core subject books per pupil 2.00 2.0 2.0 2.0 2.0 2.0 2.0 2.0 2.0 2.0 2.0 2.0 2.0 # Textbooks 979 1,479 1,873 2,521 2,925 3,456 4,092 4,757 5,474 6,328 7,435
Teaching guides 2011 2013 306 116 147 198 230 273 324 377 435 503 593 Books per teacher 2.00 2.0 2.0 2.0 2.0 2.0 2.0 2.0 2.0 2.0 2.0 2.0 2.0 # Teaching guides 306 116 147 198 230 273 324 377 435 503 593
Total
Textbooks 715,267
223,857
211,524
214,215 229,478 256,875 294,264 333,880 375,748 423,847 486,667
Teaching guides 7,852 2,211 2,866 3,979 5,805 8,864 13,870 21,536 33,217 51,424 81,113 D. CLASSROOMS AND OTHER ROOMS
Regular Government % of double shift classes 0.0% 0% 0% 0% 0% 0% 0% 0% 0% 0% 0% 0% Total classrooms 1,382 1,382 1,126 1,071 1,093 1,182 1,336 1,545 1,770 2,011 2,291 2,657
Classrooms to build by year 2% 0 0 0 21 89 154 209 225 241 280 366 # Laboratories 18 18 15 14 14 15 17 20 23 26 30 35
Labs to build by year 0 0 0 0 1 2 3 3 3 4 5 Classroom/labs ratio 76.8 76.8 76.8 76.8 76.8 76.8 76.8 76.8 76.8 76.8 76.8 76.8
# Staff rooms (incl. Office and store) 319 319 260 248 253 274 309 358 411 467 532 618
Staff rooms to build by year 0 0 0 5 21 36 49 52 56 65 86 Classroom/staff room ratio 4.3 4.3 4.3 4.3 4.3 4.3 4.3 4.3 4.3 4.3 4.3 4.3
# Block of 2 VIP toilets 14 14 11 11 11 12 14 16 18 20 23 27 Block of 2 VIP toilets to build
each year 0 0 0 0 1 2 2 2 2 3 4
Classroom/Block of 2 VIP toilets ratio 98.7 98.7 98.7 98.7 98.7 98.7 98.7 98.7 98.7 98.7 98.7 98.7
# Total other rooms (incl. Library and clinics) 213 213 173 165 168 182 206 238 272 309 352 409

136
A. ENROLMENTS BASELINE
POLICY OBJECTIVES PROJECTION RESULTS
B. EDUCATIONAL STAFF 2011 Targets/ 2011 2012 2013 2014 2015 2016 2017 2018 2019 2020 2021 C. MATERIALS 2012 Options 2012 2013 2014 2015 2016 2017 2018 2019 2020 2021 2022 D. INFRASTRUCTURE Other rooms to build by year 0 0 0 3 14 24 32 35 37 43 56
Classroom/other room ratio 6.5 6.5 6.5 6.5 6.5 6.5 6.5 6.5 6.5 6.5 6.5 6.5
Private % of double shift classes 0.0% 0% 0% 0% 0% 0% 0% 0% 0% 0% 0% 0% Total classrooms 113 113 171 217 293 340 403 478 556 642 743 875
Classrooms to build by year 2% 0 58 46 76 48 63 75 79 85 101 132 # Laboratories 3 3 5 6 8 9 11 13 15 17 20 23
Labs to build by year 0 2 1 2 1 2 2 2 2 3 3 Classroom/labs ratio 37.7 37.7 37.7 37.7 37.7 37.7 37.7 37.7 37.7 37.7 37.7 37.7
# Staff rooms (incl. Office and store) 5 5 8 10 13 15 18 21 25 28 33 39
Staff rooms to build by year 0 3 2 3 2 3 3 3 4 4 6 Classroom/staff room ratio 22.6 22.6 22.6 22.6 22.6 22.6 22.6 22.6 22.6 22.6 22.6 22.6
# Block of 2 VIP toilets 18 18 27 35 47 54 64 76 88 102 118 139 Block of 2 VIP toilets to build
each year 0 9 7 12 8 10 12 12 14 16 21
Classroom/Block of 2 VIP toilets ratio 6.3 6.3 6.3 6.3 6.3 6.3 6.3 6.3 6.3 6.3 6.3 6.3
# Total other rooms (incl. Library and clinics) 4 4 6 8 10 12 14 17 20 23 26 31
Other rooms to build by year 0 2 2 3 2 2 3 3 3 4 5 Classroom/other room ratio 28.3 28.3 28.3 28.3 28.3 28.3 28.3 28.3 28.3 28.3 28.3 28.3
S/Total Total classrooms 1,495 1,297 1,288 1,385 1,522 1,738 2,022 2,326 2,652 3,034 3,532
Classrooms to build by year 0 58 46 97 136 217 284 303 326 381 498 # Laboratories 21 19 20 22 24 28 33 38 43 50 58
Staff rooms to build by year 0 2 1 2 2 4 5 5 5 6 8 # Staff rooms (incl. Office and
store) 324 268 257 266 289 327 379 435 495 565 657
Staff rooms to build by year 0 3 2 8 23 39 52 56 60 70 91 # Block of 2 VIP toilets 32 39 45 58 66 78 92 106 122 141 166
Block of 2 VIP toilets to build 0 9 7 12 8 11 14 15 16 19 25

137
A. ENROLMENTS BASELINE
POLICY OBJECTIVES PROJECTION RESULTS
B. EDUCATIONAL STAFF 2011 Targets/ 2011 2012 2013 2014 2015 2016 2017 2018 2019 2020 2021 C. MATERIALS 2012 Options 2012 2013 2014 2015 2016 2017 2018 2019 2020 2021 2022 D. INFRASTRUCTURE each year
# Total other rooms (incl. Library and clinics) 217 180 173 179 194 220 255 292 332 379 440
Other rooms to build by year 0 2 2 6 15 26 35 37 40 47 61
JSS VOCATIONAL /TECHNICAL EDUCATION B. TEACHING AND NON TEACHING STAFF
Regular Government Some indicators Nb of classes 78 78 78 184 387 690 1,009 1,404 1,877 2,384 2,955 3,621 4,453 Weekly teacher workloads 24 24 24 24 24 24 24 24 24 24 24 24 24 Student/class ratio (class size) 11 11 11 11 11 11 11 11 11 11 11 11 Teacher utilization rate 746% 746% 746% 746% 746% 746% 746% 746% 746% 746% 746% 746% New teaching staff required 3% 0 49 93 141 152 190 230 252 287 337 421 Total teaching staff 34 34 80 169 301 440 612 818 1,039 1,287 1,577 1,940
Qualified M 21 21 50 104 186 272 379 506 643 798 978 1,203 Qualified F 4 4 9 20 36 52 73 97 124 154 189 233 Unqualified M 8 8 19 40 71 104 145 195 248 308 378 466 Unqualified F 1 1 2 5 8 11 15 19 24 28 33 39
Ratio Qualified M 62.0% 62% 62% 62% 62% 62% 62% 62% 62% 62% 62% 62% Ratio Qualified F 12.0% 12% 12% 12% 12% 12% 12% 12% 12% 12% 12% 12% Ratio Unqualified M 24.0% 24% 24% 24% 24% 24% 24% 24% 24% 24% 24% 24% Ratio Unqualified F 3.0% 3% 3% 3% 3% 3% 2% 2% 2% 2% 2% 2%
Principals 8 8 0 0 1 1 2 2 3 3 4 5 Teacher/Principals ratio 368.4 368.4 368.4 368.4 368.4 368.4 368.4 368.4 368.4 368.4 368.4 368.4
New non-teaching staff requirements 3% 0 212 400 595 630 775 924 995 1,115 1,293 1,599
Total non-teaching staff 151 352 730 1,287 1,861 2,559 3,382 4,249 5,207 6,311 7,680 Support personnel 21 21 50 104 186 273 380 509 647 803 985 1,213 Non teaching staff in
schools 130 130 303 626 1,101 1,588 2,179 2,873 3,602 4,405 5,326 6,467
Teacher/Support 1.6 1.6 1.6 1.6 1.6 1.6 1.6 1.6 1.6 1.6 1.6 1.6

138
A. ENROLMENTS BASELINE
POLICY OBJECTIVES PROJECTION RESULTS
B. EDUCATIONAL STAFF 2011 Targets/ 2011 2012 2013 2014 2015 2016 2017 2018 2019 2020 2021 C. MATERIALS 2012 Options 2012 2013 2014 2015 2016 2017 2018 2019 2020 2021 2022 D. INFRASTRUCTURE personnel ratio
Teacher/Non teaching staff in schools ratio 0.3 0.3 0.3 0.3 0.3 0.3 0.3 0.3 0.3 0.3 0.3 0.3
S/Total
Some indicators Nb of classes 78 184 387 690 1,009 1,404 1,877 2,384 2,955 3,621 4,453 New teaching staff required 0 49 93 141 152 190 230 252 287 337 421 Total teaching staff 34 80 169 301 440 612 818 1,039 1,287 1,577 1,940
Qualified M 21 50 104 186 272 379 506 643 798 978 1,203 Qualified F 4 9 20 36 52 73 97 124 154 189 233 Unqualified M 8 19 40 71 104 145 195 248 308 378 466 Unqualified F 1 2 5 8 11 15 19 24 28 33 39 Total Principals 8 0 0 1 1 2 2 3 3 4 5
New other staff required 0 212 400 595 630 775 924 995 1,115 1,293 1,599 Total other staff 151 352 730 1,287 1,861 2,559 3,382 4,249 5,207 6,311 7,680
Total support staff 21 50 104 186 273 380 509 647 803 985 1,213 Non teaching staff in schools 130 303 626 1,101 1,588 2,179 2,873 3,602 4,405 5,326 6,467
C. TEXTBOOKS AND TEACHER GUIDES
Regular Government
Core textbooks 2011 2013 7,136 5,598 11,699
20,786 30,294 41,992 55,907 70,764 87,354 106,620 130,632
Core subject books per pupil 8.00 8.0 8.0 8.0 8.0 8.0 8.0 8.0 8.0 8.0 8.0 8.0 8.0
# Textbooks 7,136 5,598 11,699
20,786 30,294 41,992 55,907 70,764 87,354 106,620 130,632
Teaching guides 2011 2013 68 40 84 150 220 306 409 519 644 789 970 Books per teacher 2.00 2.0 2.0 2.0 2.0 2.0 2.0 2.0 2.0 2.0 2.0 2.0 2.0 # Teaching guides 68 40 84 150 220 306 409 519 644 789 970
Total
Textbooks 7,136 5,598 11,699
20,786 30,294 41,992 55,907 70,764 87,354 106,620 130,632
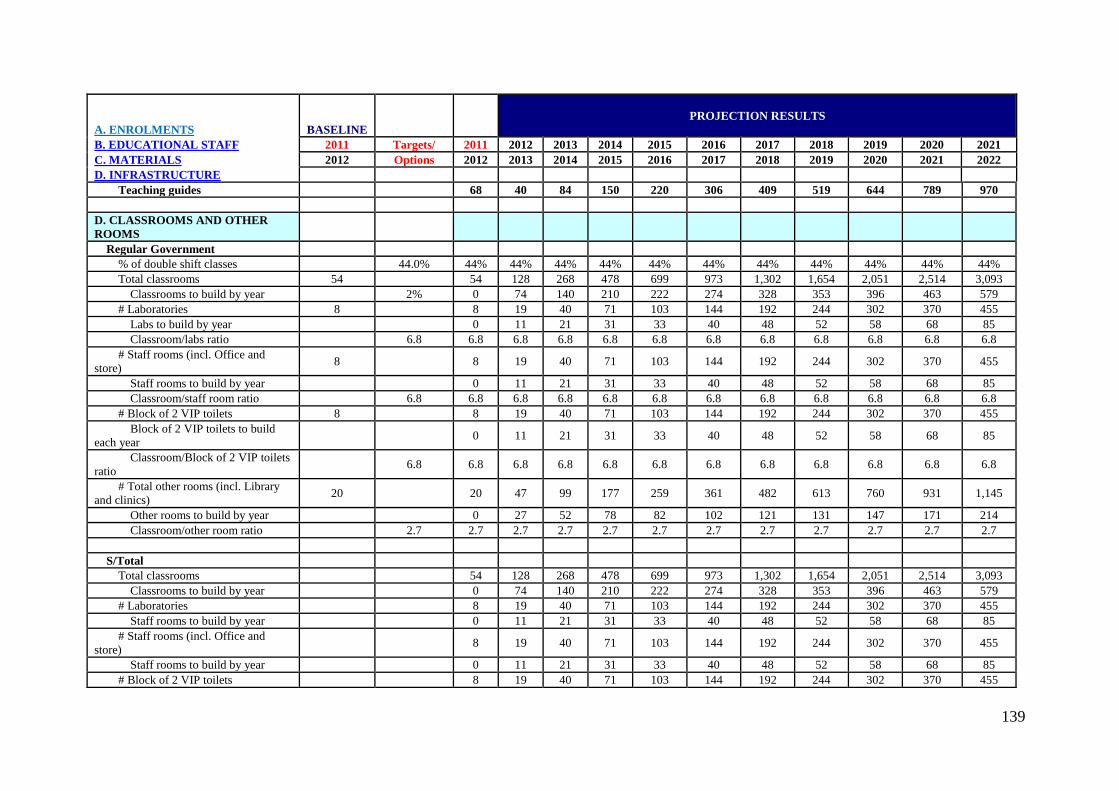
139
A. ENROLMENTS BASELINE
POLICY OBJECTIVES PROJECTION RESULTS
B. EDUCATIONAL STAFF 2011 Targets/ 2011 2012 2013 2014 2015 2016 2017 2018 2019 2020 2021 C. MATERIALS 2012 Options 2012 2013 2014 2015 2016 2017 2018 2019 2020 2021 2022 D. INFRASTRUCTURE
Teaching guides 68 40 84 150 220 306 409 519 644 789 970 D. CLASSROOMS AND OTHER ROOMS
Regular Government % of double shift classes 44.0% 44% 44% 44% 44% 44% 44% 44% 44% 44% 44% 44% Total classrooms 54 54 128 268 478 699 973 1,302 1,654 2,051 2,514 3,093
Classrooms to build by year 2% 0 74 140 210 222 274 328 353 396 463 579 # Laboratories 8 8 19 40 71 103 144 192 244 302 370 455
Labs to build by year 0 11 21 31 33 40 48 52 58 68 85 Classroom/labs ratio 6.8 6.8 6.8 6.8 6.8 6.8 6.8 6.8 6.8 6.8 6.8 6.8
# Staff rooms (incl. Office and store) 8 8 19 40 71 103 144 192 244 302 370 455
Staff rooms to build by year 0 11 21 31 33 40 48 52 58 68 85 Classroom/staff room ratio 6.8 6.8 6.8 6.8 6.8 6.8 6.8 6.8 6.8 6.8 6.8 6.8
# Block of 2 VIP toilets 8 8 19 40 71 103 144 192 244 302 370 455 Block of 2 VIP toilets to build
each year 0 11 21 31 33 40 48 52 58 68 85
Classroom/Block of 2 VIP toilets ratio 6.8 6.8 6.8 6.8 6.8 6.8 6.8 6.8 6.8 6.8 6.8 6.8
# Total other rooms (incl. Library and clinics) 20 20 47 99 177 259 361 482 613 760 931 1,145
Other rooms to build by year 0 27 52 78 82 102 121 131 147 171 214 Classroom/other room ratio 2.7 2.7 2.7 2.7 2.7 2.7 2.7 2.7 2.7 2.7 2.7 2.7
S/Total Total classrooms 54 128 268 478 699 973 1,302 1,654 2,051 2,514 3,093
Classrooms to build by year 0 74 140 210 222 274 328 353 396 463 579 # Laboratories 8 19 40 71 103 144 192 244 302 370 455
Staff rooms to build by year 0 11 21 31 33 40 48 52 58 68 85 # Staff rooms (incl. Office and
store) 8 19 40 71 103 144 192 244 302 370 455
Staff rooms to build by year 0 11 21 31 33 40 48 52 58 68 85 # Block of 2 VIP toilets 8 19 40 71 103 144 192 244 302 370 455

140
A. ENROLMENTS BASELINE
POLICY OBJECTIVES PROJECTION RESULTS
B. EDUCATIONAL STAFF 2011 Targets/ 2011 2012 2013 2014 2015 2016 2017 2018 2019 2020 2021 C. MATERIALS 2012 Options 2012 2013 2014 2015 2016 2017 2018 2019 2020 2021 2022 D. INFRASTRUCTURE Block of 2 VIP toilets to build each year 0 11 21 31 33 40 48 52 58 68 85
# Total other rooms (incl. Library and clinics) 20 47 99 177 259 361 482 613 760 931 1,145
Other rooms to build by year 0 27 52 78 82 102 121 131 147 171 214 ISLAMIYAH/IQTE JSS B. TEACHING AND NON TEACHING STAFF
Pupil/teacher ratio 40 17 20 22 24 26 29 31 33 35 38 40 New trainers 3% 0 0 0 0 5 15 30 32 33 33 40
Total teaching staff 518 278 251 236 234 243 267 292 318 343 375 Secular teachers 483 483 260 234 220 218 226 249 273 297 320 350 Head Teachers 35 35 19 17 16 16 16 18 20 22 23 25
Teacher/Head Teachers ratio 13.8 13.8 13.8 13.8 13.8 13.8 13.8 13.8 13.8 13.8 13.8 13.8 New non-teaching staff required 3% 0 0 0 0 0 0 1 1 1 1 1
Total non teaching staff 15 8 7 7 7 7 8 8 9 10 11 Other non teaching staff 15 15 8 7 7 7 7 8 8 9 10 11
Teacher/Other non teaching staff ratio 34.5 34.5 34.5 34.5 34.5 34.5 34.5 34.5 34.5 34.5 34.5 34.5
C. TEXTBOOKS AND TEACHER GUIDES
Core textbooks 2011 2013 41,22
4 13,51
2 13,57
5 14,11
0 15,311 17,281 20,486 24,118 28,055 32,176 37,295
Core subject books per pupil 8.00 8 8.0 8.0 8.0 8.0 8.0 8.0 8.0 8.0 8.0 8.0 8.0
# Textbooks 41,224
13,512
13,575
14,110 15,311 17,281 20,486 24,118 28,055 32,176 37,295
Teaching guides 2011 2013 1,036 104 93 88 87 91 99 109 119 128 140 Books per teacher 2.00 2 2.0 2.0 2.0 2.0 2.0 2.0 2.0 2.0 2.0 2.0 2.0 # Teaching guides 1,036 104 93 88 87 91 99 109 119 128 140
D. CLASSROOMS AND OTHER ROOMS

141
A. ENROLMENTS BASELINE
POLICY OBJECTIVES PROJECTION RESULTS
B. EDUCATIONAL STAFF 2011 Targets/ 2011 2012 2013 2014 2015 2016 2017 2018 2019 2020 2021 C. MATERIALS 2012 Options 2012 2013 2014 2015 2016 2017 2018 2019 2020 2021 2022 D. INFRASTRUCTURE
Classrooms 198 191 186 193 212 244 287 333 384 443 521 Total classrooms 45 198 191 186 193 212 244 287 333 384 443 521 Classrooms to build 0 0 0 7 19 32 43 46 50 60 78
Other rooms 6 6 6 6 6 7 9 10 12 13 16 Blocks of 2 VIP toilets 33 6 6 6 6 6 7 9 10 12 13 16
Block of 2 VIP toilets to build each year 0 0 0 0 1 1 1 1 2 2 2
Total 204 197 191 199 219 252 296 343 395 457 537 Classrooms 198 191 186 193 212 244 287 333 384 443 521 0ther rooms 6 6 6 6 6 7 9 10 12 13 16 Rooms to build by year 0 0 0 7 20 33 44 48 52 61 81
SENs JSS A. ENROLMENTS
Number of children receiving SENs 2,342 2,325 2,341 2,467 2,727 3,140 3,750 4,436 5,188 6,024 7,091 Male 1,986 1,972 1,999 2,096 2,293 2,608 3,115 3,694 4,327 4,996 5,827 Female 356 354 343 371 434 531 634 742 861 1,029 1,263
B. TEACHING AND NON TEACHING STAFF
Pupil/teacher ratio 234 234 234 234 234 234 234 234 234 234 234 234 New trainers 3% 0 0 0 0 0 0 1 1 1 1 1
Total teaching staff 10 2 2 2 3 3 4 5 5 6 8 Secular teachers 7 7 2 1 2 2 2 3 3 4 4 5 Head Teachers 3 3 1 1 1 1 1 1 1 2 2 2
Teacher/Head Teachers ratio 2.3 2.3 2.3 2.3 2.3 2.3 2.3 2.3 2.3 2.3 2.3 2.3 New non-teaching staff required 3% 0 0 0 0 0 0 0 0 0 1 1
Total non teaching staff 5 1 1 1 1 2 2 2 3 3 4 Other non teaching staff 5 5 1 1 1 1 2 2 2 3 3 4
Teacher/Other non teaching staff ratio 2.0 2.0 2.0 2.0 2.0 2.0 2.0 2.0 2.0 2.0 2.0 2.0
C. TEXTBOOKS AND TEACHER GUIDES
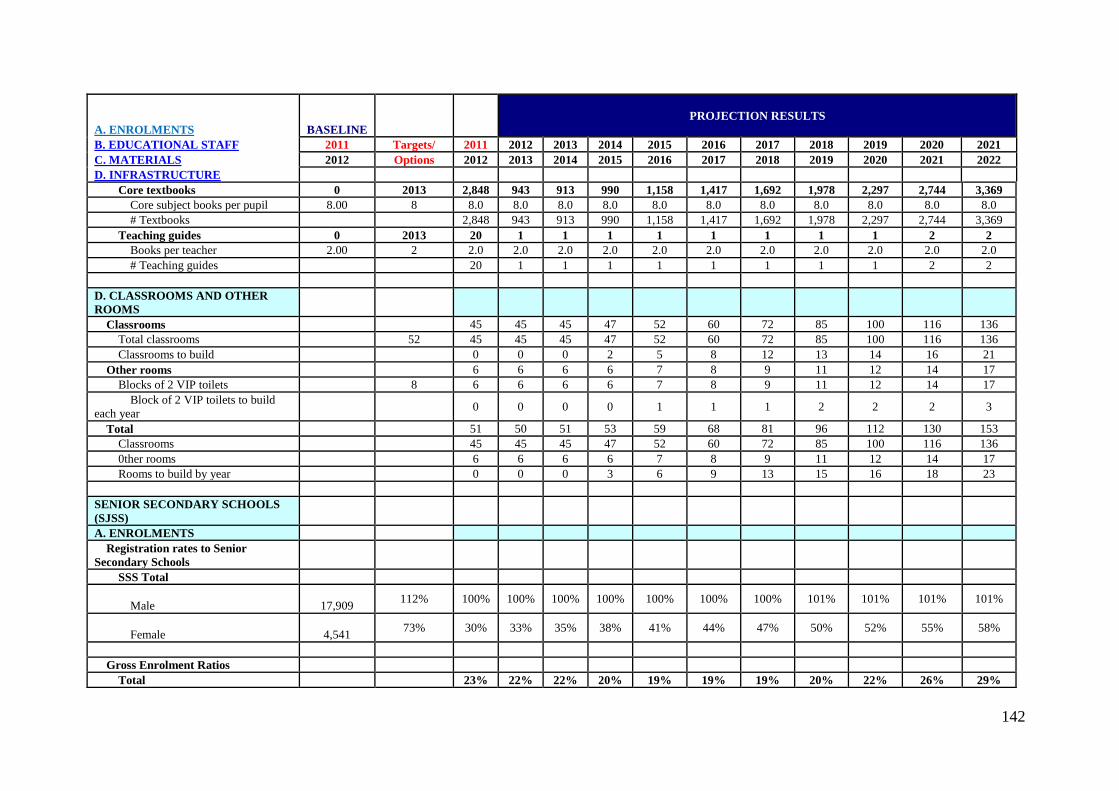
142
A. ENROLMENTS BASELINE
POLICY OBJECTIVES PROJECTION RESULTS
B. EDUCATIONAL STAFF 2011 Targets/ 2011 2012 2013 2014 2015 2016 2017 2018 2019 2020 2021 C. MATERIALS 2012 Options 2012 2013 2014 2015 2016 2017 2018 2019 2020 2021 2022 D. INFRASTRUCTURE
Core textbooks 0 2013 2,848 943 913 990 1,158 1,417 1,692 1,978 2,297 2,744 3,369 Core subject books per pupil 8.00 8 8.0 8.0 8.0 8.0 8.0 8.0 8.0 8.0 8.0 8.0 8.0 # Textbooks 2,848 943 913 990 1,158 1,417 1,692 1,978 2,297 2,744 3,369
Teaching guides 0 2013 20 1 1 1 1 1 1 1 1 2 2 Books per teacher 2.00 2 2.0 2.0 2.0 2.0 2.0 2.0 2.0 2.0 2.0 2.0 2.0 # Teaching guides 20 1 1 1 1 1 1 1 1 2 2
D. CLASSROOMS AND OTHER ROOMS
Classrooms 45 45 45 47 52 60 72 85 100 116 136 Total classrooms 52 45 45 45 47 52 60 72 85 100 116 136 Classrooms to build 0 0 0 2 5 8 12 13 14 16 21
Other rooms 6 6 6 6 7 8 9 11 12 14 17 Blocks of 2 VIP toilets 8 6 6 6 6 7 8 9 11 12 14 17
Block of 2 VIP toilets to build each year 0 0 0 0 1 1 1 2 2 2 3
Total 51 50 51 53 59 68 81 96 112 130 153 Classrooms 45 45 45 47 52 60 72 85 100 116 136 0ther rooms 6 6 6 6 7 8 9 11 12 14 17 Rooms to build by year 0 0 0 3 6 9 13 15 16 18 23
SENIOR SECONDARY SCHOOLS (SJSS) A. ENROLMENTS
Registration rates to Senior Secondary Schools
SSS Total
Male
17,909 112% 100% 100% 100% 100% 100% 100% 100% 101% 101% 101% 101%
Female
4,541 73% 30% 33% 35% 38% 41% 44% 47% 50% 52% 55% 58%
Gross Enrolment Ratios
Total 23% 22% 22% 20% 19% 19% 19% 20% 22% 26% 29%

143
A. ENROLMENTS BASELINE
POLICY OBJECTIVES PROJECTION RESULTS
B. EDUCATIONAL STAFF 2011 Targets/ 2011 2012 2013 2014 2015 2016 2017 2018 2019 2020 2021 C. MATERIALS 2012 Options 2012 2013 2014 2015 2016 2017 2018 2019 2020 2021 2022 D. INFRASTRUCTURE Male 38% 36% 36% 34% 32% 31% 31% 33% 36% 41% 46%
Female 10% 9% 9% 8% 8% 8% 8% 9% 11% 13% 14%
Student enrolments 71,83
4 70,08
6 71,15
8 68,41
6 67,077 66,578 69,886 76,583 87,491 103,042 120,287
Public 71,33
6 69,59
7 70,61
0 67,79
1 66,379 65,804 68,985 75,497 86,134 101,349 118,224
Male 55,34
1 53,70
8 54,90
6 52,94
4 51,754 51,408 53,218 57,213 63,913 74,974 87,545
Female 15,99
5 15,88
9 15,70
4 14,84
7 14,625 14,395 15,766 18,284 22,221 26,375 30,678
Of which: Regular Public 51,33
0 50,79
6 52,34
8 51,01
7 50,661 50,943 54,077 59,888 69,118 82,406 97,422
Male 41,33
5 40,66
9 42,14
2 41,18
2 40,790 41,047 43,041 46,862 53,008 62,955 74,414
Female 9,995 10,127
10,206 9,835 9,871 9,896 11,036 13,027 16,110 19,451 23,009
Of which: Science/Technical 5,603 5,605 5,779 5,649 5,651 5,708 6,149 6,931 8,150 9,780 11,605 Male 3,488 3,476 3,647 3,607 3,613 3,676 3,896 4,286 4,896 5,871 7,004 Female 2,115 2,129 2,132 2,042 2,038 2,031 2,253 2,645 3,254 3,909 4,602
Of which: IQTE/ Islamiyyah 7,799 8,165 8,751 8,873 9,193 9,588 10,660 12,378 14,965 18,400 22,335 Male 4,373 4,625 5,118 5,311 5,559 5,887 6,472 7,364 8,680 10,714 13,132 Female 3,426 3,540 3,633 3,562 3,634 3,701 4,189 5,014 6,285 7,686 9,203
Of which: SENs 1,417 1,543 1,735 1,827 1,944 2,084 2,333 2,706 3,251 4,048 4,991 Male 1,176 1,296 1,482 1,582 1,695 1,831 2,049 2,367 2,828 3,533 4,377 Female 241 247 252 246 249 252 284 339 422 514 614
Private 498 489 548 625 698 774 902 1,086 1,358 1,693 2,064 Male 319 335 367 369 375 387 415 462 534 648 780 Female 179 155 180 256 323 387 486 624 823 1,045 1,284
Total 71,83
4 70,08
6 71,15
8 68,41
6 67,077 66,578 69,886 76,583 87,491 103,042 120,287
Male 55,66
0 54,04
3 55,27
3 53,31
3 52,129 51,795 53,634 57,675 64,447 75,622 88,325
Female 16,17 16,04 15,88 15,10 14,948 14,782 16,252 18,908 23,044 27,420 31,962
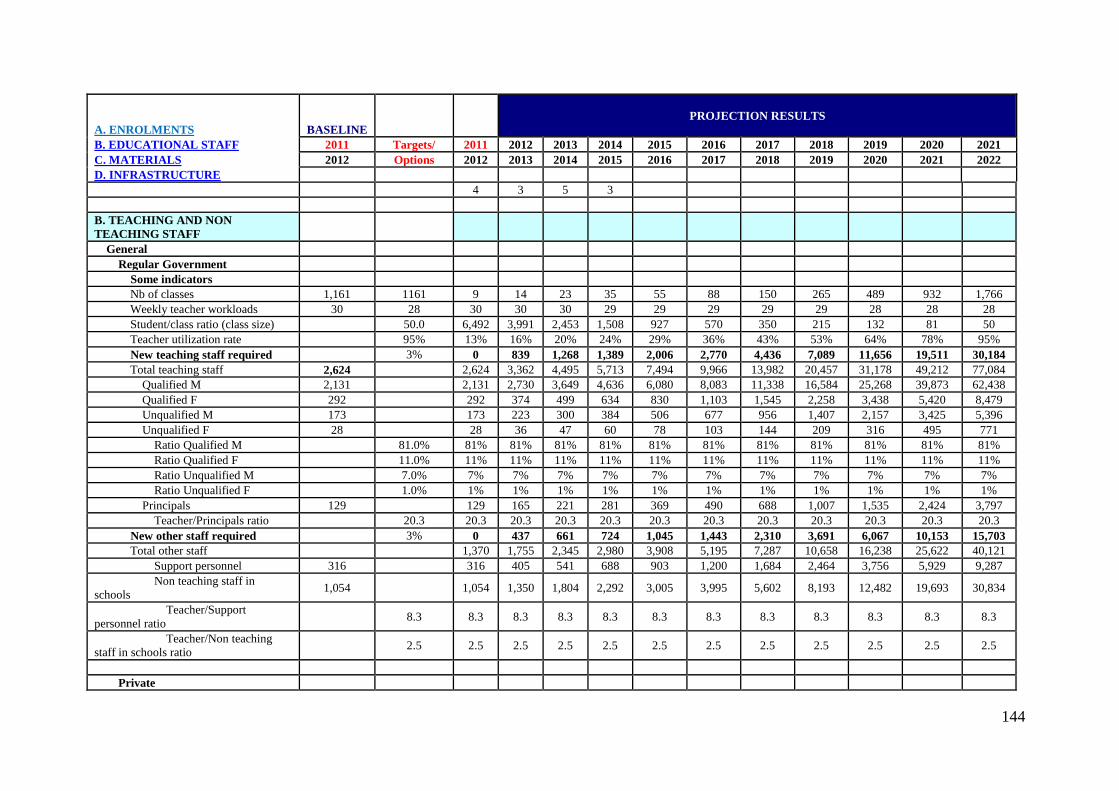
144
A. ENROLMENTS BASELINE
POLICY OBJECTIVES PROJECTION RESULTS
B. EDUCATIONAL STAFF 2011 Targets/ 2011 2012 2013 2014 2015 2016 2017 2018 2019 2020 2021 C. MATERIALS 2012 Options 2012 2013 2014 2015 2016 2017 2018 2019 2020 2021 2022 D. INFRASTRUCTURE 4 3 5 3
B. TEACHING AND NON TEACHING STAFF
General Regular Government
Some indicators Nb of classes 1,161 1161 9 14 23 35 55 88 150 265 489 932 1,766 Weekly teacher workloads 30 28 30 30 30 29 29 29 29 29 28 28 28 Student/class ratio (class size) 50.0 6,492 3,991 2,453 1,508 927 570 350 215 132 81 50 Teacher utilization rate 95% 13% 16% 20% 24% 29% 36% 43% 53% 64% 78% 95% New teaching staff required 3% 0 839 1,268 1,389 2,006 2,770 4,436 7,089 11,656 19,511 30,184 Total teaching staff 2,624 2,624 3,362 4,495 5,713 7,494 9,966 13,982 20,457 31,178 49,212 77,084
Qualified M 2,131 2,131 2,730 3,649 4,636 6,080 8,083 11,338 16,584 25,268 39,873 62,438 Qualified F 292 292 374 499 634 830 1,103 1,545 2,258 3,438 5,420 8,479 Unqualified M 173 173 223 300 384 506 677 956 1,407 2,157 3,425 5,396 Unqualified F 28 28 36 47 60 78 103 144 209 316 495 771
Ratio Qualified M 81.0% 81% 81% 81% 81% 81% 81% 81% 81% 81% 81% 81% Ratio Qualified F 11.0% 11% 11% 11% 11% 11% 11% 11% 11% 11% 11% 11% Ratio Unqualified M 7.0% 7% 7% 7% 7% 7% 7% 7% 7% 7% 7% 7% Ratio Unqualified F 1.0% 1% 1% 1% 1% 1% 1% 1% 1% 1% 1% 1%
Principals 129 129 165 221 281 369 490 688 1,007 1,535 2,424 3,797 Teacher/Principals ratio 20.3 20.3 20.3 20.3 20.3 20.3 20.3 20.3 20.3 20.3 20.3 20.3
New other staff required 3% 0 437 661 724 1,045 1,443 2,310 3,691 6,067 10,153 15,703 Total other staff 1,370 1,755 2,345 2,980 3,908 5,195 7,287 10,658 16,238 25,622 40,121
Support personnel 316 316 405 541 688 903 1,200 1,684 2,464 3,756 5,929 9,287 Non teaching staff in
schools 1,054 1,054 1,350 1,804 2,292 3,005 3,995 5,602 8,193 12,482 19,693 30,834
Teacher/Support personnel ratio 8.3 8.3 8.3 8.3 8.3 8.3 8.3 8.3 8.3 8.3 8.3 8.3
Teacher/Non teaching staff in schools ratio 2.5 2.5 2.5 2.5 2.5 2.5 2.5 2.5 2.5 2.5 2.5 2.5
Private

145
A. ENROLMENTS BASELINE
POLICY OBJECTIVES PROJECTION RESULTS
B. EDUCATIONAL STAFF 2011 Targets/ 2011 2012 2013 2014 2015 2016 2017 2018 2019 2020 2021 C. MATERIALS 2012 Options 2012 2013 2014 2015 2016 2017 2018 2019 2020 2021 2022 D. INFRASTRUCTURE
Some indicators Nb of classes 68 68 68 67 75 87 97 108 127 153 192 241 295 Weekly teacher workloads 30 30 30 30 30 30 30 30 30 30 30 30 30 Student/class ratio (class size) 7 7 7 7 7 7 7 7 7 7 7 7 Teacher utilization rate 291% 291% 291% 291% 291% 291% 291% 291% 291% 291% 291% 291% New teaching staff required 3% 0 1 8 11 10 11 17 24 35 43 49 Total teaching staff 53 53 52 59 67 76 84 99 119 150 188 230
Qualified M 20 20 20 22 26 29 32 37 45 57 71 87 Qualified F 11 11 11 12 14 16 18 21 25 31 39 48 Unqualified M 12 12 12 13 15 17 19 23 27 34 43 53 Unqualified F 10 10 10 11 13 14 16 18 22 27 34 41
Ratio Qualified M 38.0% 38% 38% 38% 38% 38% 38% 38% 38% 38% 38% 38% Ratio Qualified F 21.0% 21% 21% 21% 21% 21% 21% 21% 21% 21% 21% 21% Ratio Unqualified M 23.0% 23% 23% 23% 23% 23% 23% 23% 23% 23% 23% 23% Ratio Unqualified F 19.0% 19% 19% 19% 19% 19% 18% 18% 18% 18% 18% 18%
Principals 5 5 5 6 6 7 8 9 11 14 18 22 Teacher/Principals ratio 10.6 10.6 10.6 10.6 10.6 10.6 10.6 10.6 10.6 10.6 10.6 10.6
New other staff required 3% 0 0 2 3 3 3 4 6 9 11 12 Total other staff 13 13 14 17 19 21 24 29 37 46 56
Support personnel 0 0 0 0 0 0 0 0 0 0 0 0 Non teaching staff in
schools 13 13 13 14 17 19 21 24 29 37 46 56
Teacher/Support personnel ratio 0.0 0.0 0.0 0.0 0.0 0.0 0.0 0.0 0.0 0.0 0.0 0.0
Teacher/Non teaching staff in schools ratio 4.1 4.1 4.1 4.1 4.1 4.1 4.1 4.1 4.1 4.1 4.1 4.1
S/Total
Some indicators Nb of classes 77 81 98 121 152 196 276 418 681 1,173 2,061 New teaching staff required 0 840 1,276 1,400 2,016 2,782 4,453 7,113 11,691 19,554 30,234 Total teaching staff 2,677 3,414 4,554 5,781 7,570 10,050 14,081 20,577 31,328 49,400 77,314
Qualified M 2,151 2,749 3,671 4,662 6,109 8,115 11,375 16,629 25,324 39,944 62,526 Qualified F 303 385 511 648 846 1,120 1,566 2,283 3,469 5,459 8,528

146
A. ENROLMENTS BASELINE
POLICY OBJECTIVES PROJECTION RESULTS
B. EDUCATIONAL STAFF 2011 Targets/ 2011 2012 2013 2014 2015 2016 2017 2018 2019 2020 2021 C. MATERIALS 2012 Options 2012 2013 2014 2015 2016 2017 2018 2019 2020 2021 2022 D. INFRASTRUCTURE Unqualified M 185 235 313 399 524 697 979 1,434 2,191 3,468 5,449
Unqualified F 38 45 58 72 92 119 162 230 343 529 812 Principals 134 170 227 287 376 498 698 1,018 1,549 2,441 3,819
New other staff required 0 438 663 727 1,048 1,446 2,314 3,697 6,076 10,164 15,714 Total other staff 1,370 1,768 2,360 2,997 3,926 5,216 7,311 10,687 16,274 25,668 40,177
Support personnel 316 405 541 688 903 1,200 1,684 2,464 3,756 5,929 9,287 Other non teaching staff 1,067 1,363 1,819 2,308 3,024 4,015 5,626 8,222 12,518 19,739 30,890
C. TEXTBOOKS AND TEACHER GUIDES
General Regular Government
Core textbooks 2011 2012 525,8
70 166,9
20 165,8
86 156,6
99 152,779 151,000 157,465 171,233 193,965 227,552 264,915
Core subject books per students 9.00 9.0 9.0 9.0 9.0 9.0 9.0 9.0 9.0 9.0 9.0 9.0 9.0
# Textbooks 525,8
70 166,9
20 165,8
86 156,6
99 152,779 151,000 157,465 171,233 193,965 227,552 264,915
Teaching guides 2011 2012 2,624 840 1,124 1,428 1,874 2,491 3,496 5,114 7,795 12,303 19,271 Books per teacher 1.00 1.0 1.0 1.0 1.0 1.0 1.0 1.0 1.0 1.0 1.0 1.0 1.0 # Teaching guides 2,624 840 1,124 1,428 1,874 2,491 3,496 5,114 7,795 12,303 19,271
Private
Core textbooks 2011 2012 996 245 274 313 349 387 451 543 679 846 1,032 Core subject books per pupil 2.00 2.0 2.0 2.0 2.0 2.0 2.0 2.0 2.0 2.0 2.0 2.0 2.0 # Textbooks 996 245 274 313 349 387 451 543 679 846 1,032
Teaching guides 2011 2012 106 26 29 34 38 42 49 60 75 94 115 Books per teacher 2.00 2.0 2.0 2.0 2.0 2.0 2.0 2.0 2.0 2.0 2.0 2.0 2.0 # Teaching guides 106 26 29 34 38 42 49 60 75 94 115
S/Total
Textbooks 526,866
167,165
166,160
157,012 153,128 151,387 157,916 171,777 194,644 228,398 265,947
Teaching guides 2,730 867 1,153 1,462 1,911 2,534 3,545 5,174 7,869 12,397 19,386
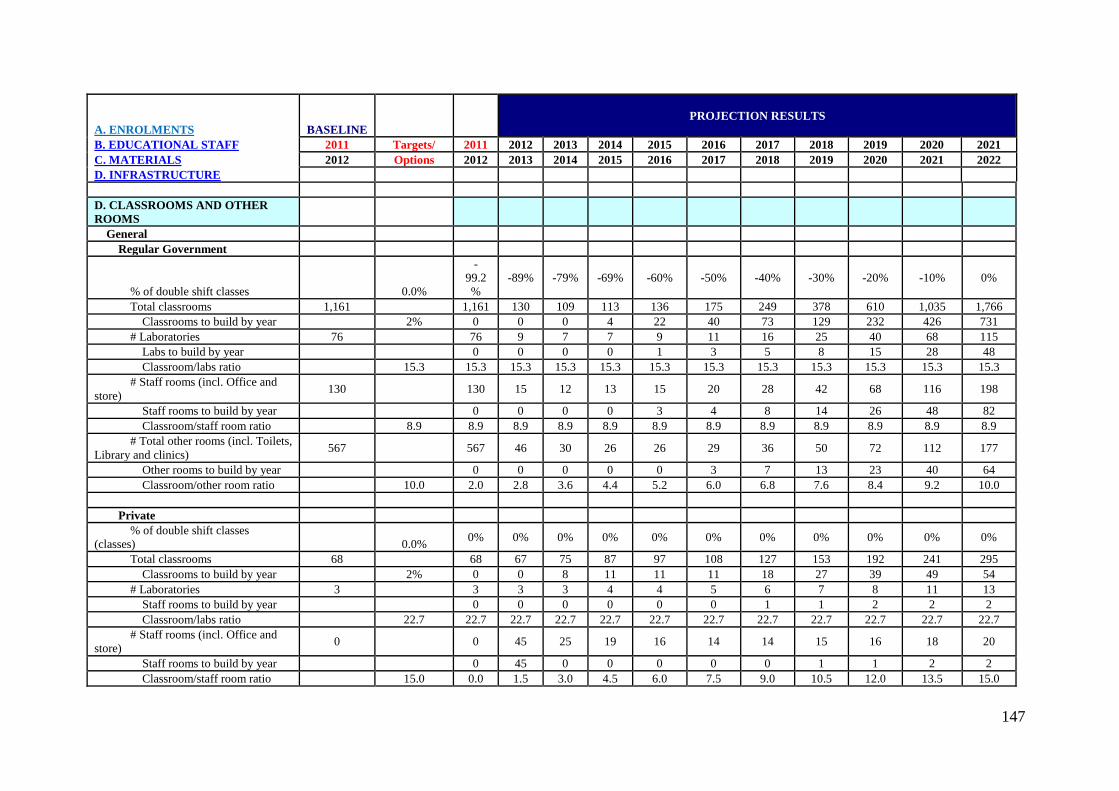
147
A. ENROLMENTS BASELINE
POLICY OBJECTIVES PROJECTION RESULTS
B. EDUCATIONAL STAFF 2011 Targets/ 2011 2012 2013 2014 2015 2016 2017 2018 2019 2020 2021 C. MATERIALS 2012 Options 2012 2013 2014 2015 2016 2017 2018 2019 2020 2021 2022 D. INFRASTRUCTURE D. CLASSROOMS AND OTHER ROOMS
General Regular Government
% of double shift classes
0.0%
-99.2%
-89% -79% -69% -60% -50% -40% -30% -20% -10% 0%
Total classrooms 1,161 1,161 130 109 113 136 175 249 378 610 1,035 1,766 Classrooms to build by year 2% 0 0 0 4 22 40 73 129 232 426 731
# Laboratories 76 76 9 7 7 9 11 16 25 40 68 115 Labs to build by year 0 0 0 0 1 3 5 8 15 28 48 Classroom/labs ratio 15.3 15.3 15.3 15.3 15.3 15.3 15.3 15.3 15.3 15.3 15.3 15.3
# Staff rooms (incl. Office and store) 130 130 15 12 13 15 20 28 42 68 116 198
Staff rooms to build by year 0 0 0 0 3 4 8 14 26 48 82 Classroom/staff room ratio 8.9 8.9 8.9 8.9 8.9 8.9 8.9 8.9 8.9 8.9 8.9 8.9
# Total other rooms (incl. Toilets, Library and clinics) 567 567 46 30 26 26 29 36 50 72 112 177
Other rooms to build by year 0 0 0 0 0 3 7 13 23 40 64 Classroom/other room ratio 10.0 2.0 2.8 3.6 4.4 5.2 6.0 6.8 7.6 8.4 9.2 10.0
Private % of double shift classes
(classes) 0.0% 0% 0% 0% 0% 0% 0% 0% 0% 0% 0% 0%
Total classrooms 68 68 67 75 87 97 108 127 153 192 241 295 Classrooms to build by year 2% 0 0 8 11 11 11 18 27 39 49 54
# Laboratories 3 3 3 3 4 4 5 6 7 8 11 13 Staff rooms to build by year 0 0 0 0 0 0 1 1 2 2 2 Classroom/labs ratio 22.7 22.7 22.7 22.7 22.7 22.7 22.7 22.7 22.7 22.7 22.7 22.7
# Staff rooms (incl. Office and store) 0 0 45 25 19 16 14 14 15 16 18 20
Staff rooms to build by year 0 45 0 0 0 0 0 1 1 2 2 Classroom/staff room ratio 15.0 0.0 1.5 3.0 4.5 6.0 7.5 9.0 10.5 12.0 13.5 15.0

148
A. ENROLMENTS BASELINE
POLICY OBJECTIVES PROJECTION RESULTS
B. EDUCATIONAL STAFF 2011 Targets/ 2011 2012 2013 2014 2015 2016 2017 2018 2019 2020 2021 C. MATERIALS 2012 Options 2012 2013 2014 2015 2016 2017 2018 2019 2020 2021 2022 D. INFRASTRUCTURE # Total other rooms (incl. Toilets, Library and clinics) 0 0 34 19 14 12 11 11 11 12 13 15
Other rooms to build by year 0 34 0 0 0 0 0 0 1 1 1 Classroom/other room ratio 20.0 0.0 2.0 4.0 6.0 8.0 10.0 12.0 14.0 16.0 18.0 20.0
S/Total Total classrooms 1,229 197 185 200 233 283 375 531 802 1,276 2,061
Classrooms to build by year 0 0 8 15 33 51 92 156 271 474 785 # Laboratories 79 11 10 11 13 16 22 31 48 78 128
Staff rooms to build by year 0 0 0 1 2 3 6 10 17 30 50 # Staff rooms (incl. Office and
store) 130 59 37 32 31 34 42 57 84 134 218
Staff rooms to build by year 0 45 0 0 3 4 8 15 28 50 84 # Total other rooms (incl. Toilets,
Library and clinics) 567 79 49 40 38 40 47 61 84 126 191
Other rooms to build by year 0 34 0 0 0 3 7 14 24 41 66 SCIENCE/TECHNICAL EDUCATION A. ENROLMENTS
Student enrolments 5,603 6,186 7,027 7,100 7,122 7,194 7,745 8,728 10,261 12,266 14,481 Public 5,603 6,186 7,027 7,100 7,122 7,194 7,745 8,728 10,261 12,266 14,481
Male 3,488 3,971 4,496 4,468 4,416 4,423 4,623 5,021 5,660 6,703 7,904 Female 2,115 2,215 2,531 2,631 2,706 2,771 3,122 3,707 4,601 5,564 6,577
B. TEACHING AND NON TEACHING STAFF
Public Some indicators Nb of classes 156 156 156 170 191 191 190 190 202 225 262 310 362 Weekly teacher workloads 24 28 24 24 25 25 26 26 26 27 27 28 28 Student/class ratio (class size) 40 36 36 37 37 37 38 38 39 39 40 40 Teacher utilization rate 95% 451% 386% 330% 282% 242% 207% 177% 152% 130% 111% 95% New teaching staff required 3% 0 66 94 67 74 89 145 217 328 466 607
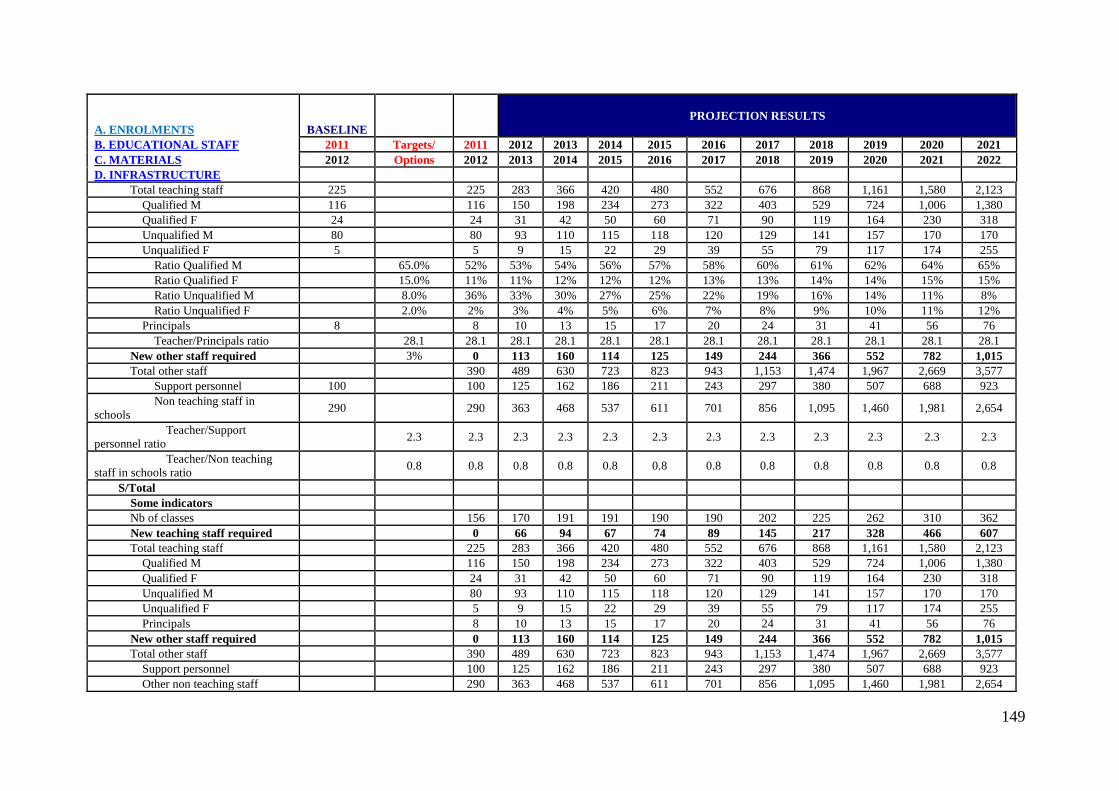
149
A. ENROLMENTS BASELINE
POLICY OBJECTIVES PROJECTION RESULTS
B. EDUCATIONAL STAFF 2011 Targets/ 2011 2012 2013 2014 2015 2016 2017 2018 2019 2020 2021 C. MATERIALS 2012 Options 2012 2013 2014 2015 2016 2017 2018 2019 2020 2021 2022 D. INFRASTRUCTURE Total teaching staff 225 225 283 366 420 480 552 676 868 1,161 1,580 2,123
Qualified M 116 116 150 198 234 273 322 403 529 724 1,006 1,380 Qualified F 24 24 31 42 50 60 71 90 119 164 230 318 Unqualified M 80 80 93 110 115 118 120 129 141 157 170 170 Unqualified F 5 5 9 15 22 29 39 55 79 117 174 255
Ratio Qualified M 65.0% 52% 53% 54% 56% 57% 58% 60% 61% 62% 64% 65% Ratio Qualified F 15.0% 11% 11% 12% 12% 12% 13% 13% 14% 14% 15% 15% Ratio Unqualified M 8.0% 36% 33% 30% 27% 25% 22% 19% 16% 14% 11% 8% Ratio Unqualified F 2.0% 2% 3% 4% 5% 6% 7% 8% 9% 10% 11% 12%
Principals 8 8 10 13 15 17 20 24 31 41 56 76 Teacher/Principals ratio 28.1 28.1 28.1 28.1 28.1 28.1 28.1 28.1 28.1 28.1 28.1 28.1
New other staff required 3% 0 113 160 114 125 149 244 366 552 782 1,015 Total other staff 390 489 630 723 823 943 1,153 1,474 1,967 2,669 3,577
Support personnel 100 100 125 162 186 211 243 297 380 507 688 923 Non teaching staff in
schools 290 290 363 468 537 611 701 856 1,095 1,460 1,981 2,654
Teacher/Support personnel ratio 2.3 2.3 2.3 2.3 2.3 2.3 2.3 2.3 2.3 2.3 2.3 2.3
Teacher/Non teaching staff in schools ratio 0.8 0.8 0.8 0.8 0.8 0.8 0.8 0.8 0.8 0.8 0.8 0.8
S/Total Some indicators Nb of classes 156 170 191 191 190 190 202 225 262 310 362 New teaching staff required 0 66 94 67 74 89 145 217 328 466 607 Total teaching staff 225 283 366 420 480 552 676 868 1,161 1,580 2,123
Qualified M 116 150 198 234 273 322 403 529 724 1,006 1,380 Qualified F 24 31 42 50 60 71 90 119 164 230 318 Unqualified M 80 93 110 115 118 120 129 141 157 170 170 Unqualified F 5 9 15 22 29 39 55 79 117 174 255 Principals 8 10 13 15 17 20 24 31 41 56 76
New other staff required 0 113 160 114 125 149 244 366 552 782 1,015 Total other staff 390 489 630 723 823 943 1,153 1,474 1,967 2,669 3,577
Support personnel 100 125 162 186 211 243 297 380 507 688 923 Other non teaching staff 290 363 468 537 611 701 856 1,095 1,460 1,981 2,654

150
A. ENROLMENTS BASELINE
POLICY OBJECTIVES PROJECTION RESULTS
B. EDUCATIONAL STAFF 2011 Targets/ 2011 2012 2013 2014 2015 2016 2017 2018 2019 2020 2021 C. MATERIALS 2012 Options 2012 2013 2014 2015 2016 2017 2018 2019 2020 2021 2022 D. INFRASTRUCTURE C. TEXTBOOKS AND TEACHER GUIDES
Public
Core textbooks 2011 2012 16,80
9 18,55
8 21,08
1 21,29
9 21,365 21,582 23,236 26,185 30,782 36,798 43,442
Core subject books per pupil 9.00 9.0 9.0 9.0 9.0 9.0 9.0 9.0 9.0 9.0 9.0 9.0 9.0
# Textbooks 16,80
9 18,55
8 21,08
1 21,29
9 21,365 21,582 23,236 26,185 30,782 36,798 43,442
Teaching guides 2011 2012 56 71 91 105 120 138 169 217 290 395 531 Books per teacher 1.00 1.0 1.0 1.0 1.0 1.0 1.0 1.0 1.0 1.0 1.0 1.0 1.0 # Teaching guides 56 71 91 105 120 138 169 217 290 395 531
S/Total
Textbooks 16,818
18,567
21,090
21,308 21,374 21,591 23,245 26,194 30,791 36,807 43,451
Core subjects 9 9 9 9 9 9 9 9 9 9 9
Non core subjects 16,80
9 18,55
8 21,08
1 21,29
9 21,365 21,582 23,236 26,185 30,782 36,798 43,442
Teaching guides 57 72 92 106 121 139 170 218 291 396 532 Core subjects 1 1 1 1 1 1 1 1 1 1 1 Non core subjects 56 71 91 105 120 138 169 217 290 395 531
D. CLASSROOMS AND OTHER ROOMS
Public % of double shift classes 0.0% 123% 111% 98% 86% 74% 61% 49% 37% 25% 12% 0% Total classrooms 70 70 81 97 103 109 118 136 165 210 276 362
Classrooms to build by year 2% 0 11 16 6 6 8 18 29 46 66 86 # Laboratories & workshops 16 16 18 22 23 25 27 31 37 48 63 82
Laboratories & workshops to build by year 0 2 4 1 1 2 4 7 10 15 20
Classroom/labs ratio 4.4 4.4 4.4 4.4 4.4 4.4 4.4 4.4 4.4 4.4 4.4 4.4 # Staff rooms (incl. Office and 12 12 14 17 18 19 20 23 28 36 48 62

151
A. ENROLMENTS BASELINE
POLICY OBJECTIVES PROJECTION RESULTS
B. EDUCATIONAL STAFF 2011 Targets/ 2011 2012 2013 2014 2015 2016 2017 2018 2019 2020 2021 C. MATERIALS 2012 Options 2012 2013 2014 2015 2016 2017 2018 2019 2020 2021 2022 D. INFRASTRUCTURE store)
Staff rooms to build by year 0 2 3 1 1 1 3 5 8 11 15 Classroom/staff room ratio 5.8 5.8 5.8 5.8 5.8 5.8 5.8 5.8 5.8 5.8 5.8 5.8
# Total other rooms (incl. Library and clinics) 22 22 25 30 32 34 37 42 52 66 86 113
Other rooms to build by year 0 3 5 2 2 3 6 9 14 20 27 Classroom/other room ratio 3.2 3.2 3.2 3.2 3.2 3.2 3.2 3.2 3.2 3.2 3.2 3.2
IQTE/ISLAMIYYAH EDUCATION A. ENROLMENTS
Student enrolments 7,303 7,771 8,288 8,458 8,331 8,276 8,751 9,691 11,218 13,232 15,438 Public 7,303 7,771 8,288 8,458 8,331 8,276 8,751 9,691 11,218 13,232 15,438
Male 4,418 4,684 5,050 5,333 5,249 5,222 5,398 5,796 6,472 7,581 8,848 Female 2,885 3,086 3,238 3,125 3,083 3,055 3,353 3,895 4,746 5,651 6,590
B. TEACHING AND NON TEACHING STAFF
Public Some indicators Nb of classes 70 70 70 80 92 101 107 115 130 155 194 246 309 Weekly teacher workloads 24 28 24 24 25 25 26 26 26 27 27 28 28 Student/class ratio (class size) 50 104 97 90 84 78 72 67 62 58 54 50 Teacher utilization rate 95% 25% 29% 33% 37% 43% 49% 56% 64% 73% 83% 95% New teaching staff required 3% 0 14 16 0 0 0 7 36 68 87 86 Total teaching staff 812 812 802 793 751 687 633 621 638 686 751 813
Qualified M 559 559 196 256 297 342 397 491 635 857 1,175 1,592 Qualified F 112 112 41 55 66 78 93 119 157 218 306 425 Unqualified M 120 120 38 45 47 48 49 52 57 62 66 64 Unqualified F 21 21 7 9 10 11 13 15 19 25 33 42
Ratio Qualified M 75.0% 69% 69% 70% 71% 71% 72% 73% 73% 74% 74% 75% Ratio Qualified F 20.0% 14% 14% 15% 16% 16% 17% 18% 18% 19% 19% 20% Ratio Unqualified M 3.0% 15% 14% 12% 11% 10% 9% 8% 7% 5% 4% 3% Ratio Unqualified F 2.0% 3% 3% 2% 2% 2% 2% 2% 2% 2% 2% 2%
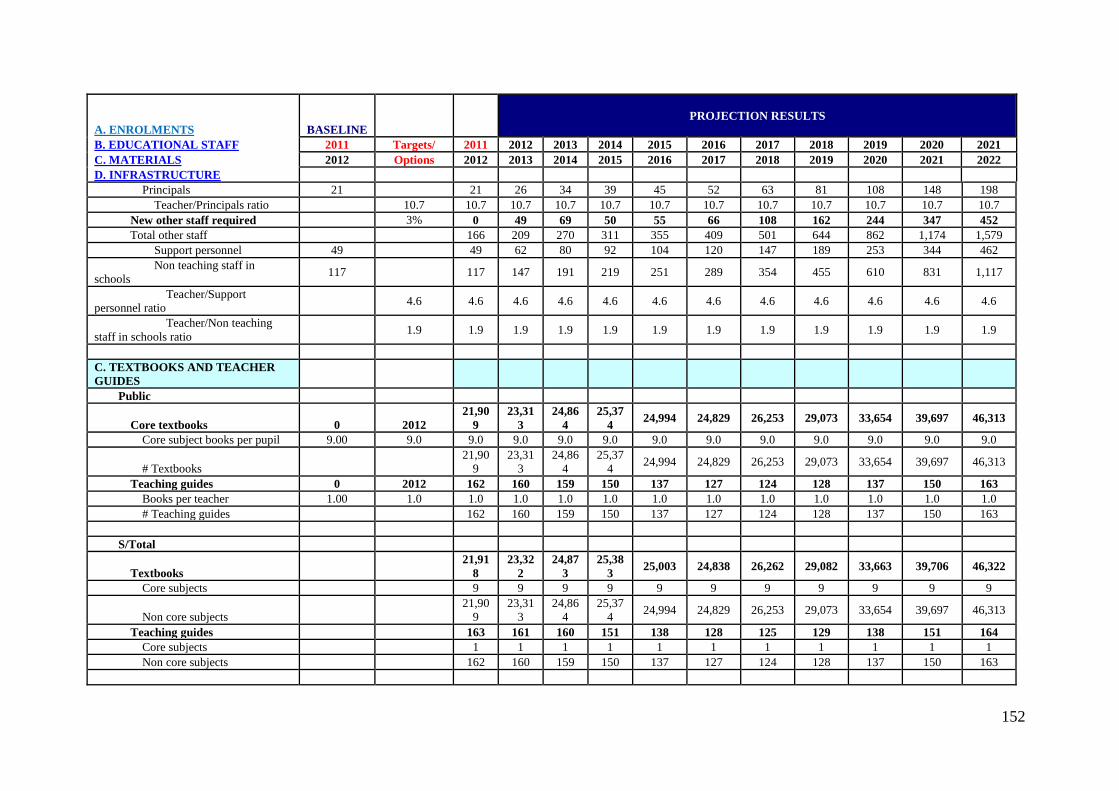
152
A. ENROLMENTS BASELINE
POLICY OBJECTIVES PROJECTION RESULTS
B. EDUCATIONAL STAFF 2011 Targets/ 2011 2012 2013 2014 2015 2016 2017 2018 2019 2020 2021 C. MATERIALS 2012 Options 2012 2013 2014 2015 2016 2017 2018 2019 2020 2021 2022 D. INFRASTRUCTURE Principals 21 21 26 34 39 45 52 63 81 108 148 198
Teacher/Principals ratio 10.7 10.7 10.7 10.7 10.7 10.7 10.7 10.7 10.7 10.7 10.7 10.7 New other staff required 3% 0 49 69 50 55 66 108 162 244 347 452 Total other staff 166 209 270 311 355 409 501 644 862 1,174 1,579
Support personnel 49 49 62 80 92 104 120 147 189 253 344 462 Non teaching staff in
schools 117 117 147 191 219 251 289 354 455 610 831 1,117
Teacher/Support personnel ratio 4.6 4.6 4.6 4.6 4.6 4.6 4.6 4.6 4.6 4.6 4.6 4.6
Teacher/Non teaching staff in schools ratio 1.9 1.9 1.9 1.9 1.9 1.9 1.9 1.9 1.9 1.9 1.9 1.9
C. TEXTBOOKS AND TEACHER GUIDES
Public
Core textbooks 0 2012 21,90
9 23,31
3 24,86
4 25,37
4 24,994 24,829 26,253 29,073 33,654 39,697 46,313
Core subject books per pupil 9.00 9.0 9.0 9.0 9.0 9.0 9.0 9.0 9.0 9.0 9.0 9.0 9.0
# Textbooks 21,90
9 23,31
3 24,86
4 25,37
4 24,994 24,829 26,253 29,073 33,654 39,697 46,313
Teaching guides 0 2012 162 160 159 150 137 127 124 128 137 150 163 Books per teacher 1.00 1.0 1.0 1.0 1.0 1.0 1.0 1.0 1.0 1.0 1.0 1.0 1.0 # Teaching guides 162 160 159 150 137 127 124 128 137 150 163
S/Total
Textbooks 21,918
23,322
24,873
25,383 25,003 24,838 26,262 29,082 33,663 39,706 46,322
Core subjects 9 9 9 9 9 9 9 9 9 9 9
Non core subjects 21,90
9 23,31
3 24,86
4 25,37
4 24,994 24,829 26,253 29,073 33,654 39,697 46,313
Teaching guides 163 161 160 151 138 128 125 129 138 151 164 Core subjects 1 1 1 1 1 1 1 1 1 1 1 Non core subjects 162 160 159 150 137 127 124 128 137 150 163

153
A. ENROLMENTS BASELINE
POLICY OBJECTIVES PROJECTION RESULTS
B. EDUCATIONAL STAFF 2011 Targets/ 2011 2012 2013 2014 2015 2016 2017 2018 2019 2020 2021 C. MATERIALS 2012 Options 2012 2013 2014 2015 2016 2017 2018 2019 2020 2021 2022 D. INFRASTRUCTURE D. CLASSROOMS AND OTHER ROOMS
Public % of double shift classes 0.0% 0% 0% 0% 0% 0% 0% 0% 0% 0% 0% 0% Total classrooms 70 70 80 92 101 107 115 130 155 194 246 309
Classrooms to build by year 2% 0 10 12 9 6 7 16 25 38 52 63 # Laboratories & workshops 0 0 401 230 168 134 115 109 111 121 137 154
Laboratories & workshops to build by year 0 401 0 0 0 0 0 2 10 16 18
Classroom/labs ratio 2.0 0.0 0.2 0.4 0.6 0.8 1.0 1.2 1.4 1.6 1.8 2.0 # Staff rooms (incl. Office and
store) 15 15 17 20 22 23 24 28 33 41 52 66
Staff rooms to build by year 0 2 3 2 1 2 3 5 8 11 13 Classroom/staff room ratio 4.7 4.7 4.7 4.7 4.7 4.7 4.7 4.7 4.7 4.7 4.7 4.7
# Total other rooms (incl. Library and clinics) 31 31 27 25 22 20 19 20 21 25 30 36
Other rooms to build by year 0 0 0 0 0 0 0 2 3 5 6 Classroom/other room ratio 10.0 2.3 3.0 3.8 4.6 5.4 6.1 6.9 7.7 8.5 9.2 10.0
TEACHER EDUCATION DEVELOPMENT (TED) A. ENROLMENTS
Gross enrolment ratio to Colleges of Education
4,733
(As % or tertiary==>)
Male
2,872 27.95% 28.0%
28.0%
28.0%
28.0% 28.0% 28.0% 28.0% 28.0% 28.0% 28.0% 28.0%
Female
1,861 51.06% 51.1%
51.1%
51.1%
51.1% 51.1% 51.1% 51.1% 51.1% 51.1% 51.1% 51.1%
Of which State Colleges of Education
4,733
Male
2,872 100% 100.0
% 100.0
% 100.0
% 100.0
% 100.0% 100.0% 100.0% 100.0% 100.0% 100.0% 100.0%
Female
1,861 100% 100.0
% 100.0
% 100.0
% 100.0
% 100.0% 100.0% 100.0% 100.0% 100.0% 100.0% 100.0%
Of which private

154
A. ENROLMENTS BASELINE
POLICY OBJECTIVES PROJECTION RESULTS
B. EDUCATIONAL STAFF 2011 Targets/ 2011 2012 2013 2014 2015 2016 2017 2018 2019 2020 2021 C. MATERIALS 2012 Options 2012 2013 2014 2015 2016 2017 2018 2019 2020 2021 2022 D. INFRASTRUCTURE Male 0 0% 0.0% 0.0% 0.0% 0.0% 0.0% 0.0% 0.0% 0.0% 0.0% 0.0% 0.0%
Female 0 0% 0.0% 0.0% 0.0% 0.0% 0.0% 0.0% 0.0% 0.0% 0.0% 0.0% 0.0%
Enrolments at Colleges of Education 4,733 5,348 6,045 6,832 7,724 8,732 9,873 11,165 12,627 14,283 16,157
Male 2,872 3,217 3,604 4,038 4,524 5,068 5,677 6,360 7,125 7,982 8,942 Female 1,861 2,131 2,440 2,794 3,200 3,664 4,196 4,805 5,502 6,300 7,215
Of which State Colleges of Education 4,733 5,348 6,045 6,832 7,724 8,732 9,873 11,165 12,627 14,283 16,157
Male 2,872 3,217 3,604 4,038 4,524 5,068 5,677 6,360 7,125 7,982 8,942 Female 1,861 2,131 2,440 2,794 3,200 3,664 4,196 4,805 5,502 6,300 7,215
New Teacher requirements For Primary 895 907 1,119 1,273 1,272 1,316 1,560 1,682 1,792 1,907 2,177
Male 738 748 945 1,094 1,098 1,144 1,354 1,454 1,543 1,636 1,982 Female 157 158 174 178 174 171 206 227 248 271 195
For Junior Secondary 629 1,481 2,466 4,000 6,650 10,845 16,623 25,356 39,500 64,245 26,643 Male 581 1,375 2,284 3,693 6,117 9,938 15,168 23,040 35,744 57,901 24,534 Female 47 106 182 307 532 908 1,455 2,316 3,755 6,343 2,109
Total Basic Education ((Primary & JSS) 1,523 2,388 3,584 5,272 7,921 12,161 18,183 27,037 41,291 66,152 28,819
Male 1,319 2,124 3,229 4,787 7,215 11,082 16,522 24,494 37,288 59,538 26,515 Female 205 264 355 485 706 1,079 1,660 2,543 4,004 6,614 2,304
Graduates from teacher training
institutions 2,539 1,502 1,878 2,334 2,887 3,554 4,358 5,323 6,481 7,866 9,521
Male 2,098 1,021 1,281 1,597 1,980 2,441 2,996 3,662 4,458 5,409 6,541 Female 441 481 597 737 907 1,113 1,361 1,662 2,023 2,458 2,980
B. Teaching and other staff State Colleges of Education
Some indicators Student/teacher ratio 70.0 46 48 50 52 54 57 59 62 64 67 70 Nb of classes 31 31 20 27 36 48 64 85 113 150 198 263

155
A. ENROLMENTS BASELINE
POLICY OBJECTIVES PROJECTION RESULTS
B. EDUCATIONAL STAFF 2011 Targets/ 2011 2012 2013 2014 2015 2016 2017 2018 2019 2020 2021 C. MATERIALS 2012 Options 2012 2013 2014 2015 2016 2017 2018 2019 2020 2021 2022 D. INFRASTRUCTURE Student/class ratio 80.0 309 270 236 206 180 157 137 120 105 92 80
New teacher requirements 3% 0 0 17 19 21 23 26 29 32 35 39 Total teacher requirements 209 209 115 129 143 160 178 198 220 244 271 300
New other staff required 0 0 27 30 33 37 41 45 50 55 61 # non teaching staff 324 324 179 200 223 248 277 308 343 381 423 470
Senior staff 97 97 53 59 66 73 82 91 100 111 123 136 Junior staff 227 227 125 140 157 175 195 218 242 270 300 334
Teacher/Senior staff ratio 2.2 2.2 2.2 2.2 2.2 2.2 2.2 2.2 2.2 2.2 2.2 2.2 Teacher/Junior staff ratio 0.9 0.9 0.9 0.9 0.9 0.9 0.9 0.9 0.9 0.9 0.9 0.9
D. Classrooms and other rooms
State Colleges of Education Student/classroom ratio 309 80 309 286 263 240 217 195 172 149 126 103 80 Total classroom requirements 0 0 19 24 31 40 52 68 91 125 176 263
Classrooms to build by year 0 19 5 7 9 12 16 23 34 52 86 # Laboratories & other
specialized rooms 14 14 6 4 3 3 3 4 4 5 7 9
Labs and specialized rooms to build by year 0 0 0 0 0 0 0 1 1 1 2
Classroom/labs ratio 30.0 0.0 3.0 6.0 9.0 12.0 15.0 18.0 21.0 24.0 27.0 30.0 # Total other rooms 10 10 6 4 3 3 3 4 4 5 7 9
Other rooms to build by year 0 0 0 0 0 0 0 1 1 1 2 Classroom/other room ratio 30.0 0.0 3.0 6.0 9.0 12.0 15.0 18.0 21.0 24.0 27.0 30.0
HIGHER EDUCATION INSTITUTION (HEI) A. ENROLMENTS
Gross Enrolment ratio in Higher Education 13,920 4% 4% 5% 5% 6% 6% 7% 8% 8% 9% 10%
Male 10,275 15.00% 6% 7% 8% 8% 9% 10% 11% 12% 13% 14% 15% Female 3,645 5.00% 2% 2% 2% 2% 3% 3% 3% 4% 4% 4% 5%
Total Enrolments 13,92
0 15,68
5 17,67
5 19,92
0 22,451 25,308 28,530 32,165 36,268 40,898 46,123

156
A. ENROLMENTS BASELINE
POLICY OBJECTIVES PROJECTION RESULTS
B. EDUCATIONAL STAFF 2011 Targets/ 2011 2012 2013 2014 2015 2016 2017 2018 2019 2020 2021 C. MATERIALS 2012 Options 2012 2013 2014 2015 2016 2017 2018 2019 2020 2021 2022 D. INFRASTRUCTURE
Male 10,27
5 11,51
1 12,89
5 14,44
6 16,184 18,131 20,312 22,755 25,492 28,558 31,993
Female 3,645 4,174 4,780 5,473 6,267 7,177 8,218 9,411 10,776 12,340 14,131 Teacher education 4,733 5,375 6,105 6,934 7,877 8,948 10,166 11,550 13,123 14,912 16,946
Male 2,872 3,240 3,656 4,125 4,653 5,250 5,923 6,683 7,540 8,507 9,598 Female 1,861 2,135 2,449 2,810 3,223 3,698 4,242 4,867 5,583 6,405 7,348
Polytechnics 1,370 1,615 1,904 2,245 2,646 3,120 3,678 4,336 5,112 6,027 7,105 Male 1,243 1,464 1,725 2,032 2,394 2,820 3,322 3,914 4,611 5,431 6,399 Female 127 151 179 213 252 300 356 422 501 595 707
Monotechnics 7,817 8,873 10,072
11,434 12,981 14,740 16,738 19,009 21,590 24,525 27,861
Male 6,160 6,957 7,857 8,874 10,022 11,318 12,782 14,436 16,304 18,413 20,795 Female 1,657 1,916 2,215 2,560 2,960 3,422 3,956 4,573 5,287 6,112 7,065
Enrolments by type and
specialization
Teacher education 9,589 5,514 6,419 7,464 8,672 10,068 11,680 13,540 15,687 18,162 21,015 Male 7,466 3,343 3,886 4,510 5,229 6,056 7,006 8,097 9,348 10,784 12,430 Female 2,123 2,172 2,533 2,954 3,443 4,012 4,674 5,444 6,338 7,378 8,585
Public 9,589 5,514 6,419 7,464 8,672 10,068 11,680 13,540 15,687 18,162 21,015 Male 7,466 3,343 3,886 4,510 5,229 6,056 7,006 8,097 9,348 10,784 12,430 Female 2,123 2,172 2,533 2,954 3,443 4,012 4,674 5,444 6,338 7,378 8,585
Polytechnic 1,370 1,615 1,904 2,245 2,646 3,120 3,678 4,336 5,112 6,027 7,105 Male 1,243 1,464 1,725 2,032 2,394 2,820 3,322 3,914 4,611 5,431 6,399 Female 127 151 179 213 252 300 356 422 501 595 707
Monotechnics 7,817 8,873 10,072
11,434 12,981 14,740 16,738 19,009 21,590 24,525 27,861
Of which: College of Agriculture 1,627 1,884 2,181 2,523 2,918 3,374 3,900 4,507 5,207 6,015 6,945
Male 1,532 1,766 2,035 2,343 2,698 3,105 3,572 4,109 4,724 5,429 6,239 Female 95 118 146 180 220 269 328 399 484 585 707
College of Islamic & Legal Studies 4,106 4,728 5,444 6,268 7,215 8,305 9,558 11,000 12,658 14,564 16,756

157
A. ENROLMENTS BASELINE
POLICY OBJECTIVES PROJECTION RESULTS
B. EDUCATIONAL STAFF 2011 Targets/ 2011 2012 2013 2014 2015 2016 2017 2018 2019 2020 2021 C. MATERIALS 2012 Options 2012 2013 2014 2015 2016 2017 2018 2019 2020 2021 2022 D. INFRASTRUCTURE Male 2,668 3,060 3,508 4,021 4,609 5,281 6,049 6,928 7,934 9,083 10,398
Female 1,438 1,669 1,936 2,246 2,607 3,024 3,509 4,071 4,724 5,481 6,359 College of Arts, Science & Remedial
Studies 515 540 563 583 598 607 609 600 579 543 487
Male 482 504 523 539 551 556 553 541 516 476 416 Female 33 36 40 43 47 51 55 59 63 67 71
Informatics Institute 1,569 1,825 2,121 2,464 2,861 3,321 3,852 4,466 5,176 5,997 6,945 Male 1,478 1,711 1,980 2,289 2,645 3,056 3,528 4,071 4,695 5,413 6,239 Female 91 114 142 175 216 265 324 395 481 584 707
B. TEACHING AND NON TEACHING STAFF
Polytechnic
Public Some indicators Student Nb of sections 30 30 30 34 38 42 48 54 61 69 78 89 102 Student/section ratio (class size) 70 46 48 51 53 55 58 60 63 65 68 70 Teacher utilization rate 95% 41% 47% 52% 57% 63% 68% 74% 79% 84% 90% 95% New teaching staff required 3% 0 2 4 5 6 7 9 10 11 13 14 Total teaching staff 99 99 98 99 101 104 108 113 120 127 136 146
Senior Lecturers & above 50 50 50 50 51 53 55 57 61 65 69 74 Lecturer 1 & below 49 49 48 49 50 51 53 56 59 62 67 71 Category 3 0 0 0 0 0 0 0 0 0 0 0 0 Category 4 0 0 0 0 0 0 0 0 0 0 0 0 Senior Lecturers & above 51.0% 51% 51% 51% 51% 51% 51% 51% 51% 51% 51% 51% Lecturer 1 & below 49.0% 49% 49% 49% 49% 49% 49% 49% 49% 49% 49% 49%
Ratio Category 3 0.0% 0% 0% 0% 0% 0% 0% 0% 0% 0% 0% 0% Ratio Category 4 0.0% 0% 0% 0% 0% 0% 0% 0% 0% 0% 0% 0%
New other staff required 0 2 3 4 5 5 6 7 8 9 10 Total other staff 71 70 71 72 75 78 82 86 92 98 105
Total technical assistants 11 11 11 11 11 12 12 13 13 14 15 16 Total supervisory staff 21 21 21 21 21 22 23 24 25 27 29 31 Total workers and other staff 39 39 39 39 40 41 43 45 48 51 54 58

158
A. ENROLMENTS BASELINE
POLICY OBJECTIVES PROJECTION RESULTS
B. EDUCATIONAL STAFF 2011 Targets/ 2011 2012 2013 2014 2015 2016 2017 2018 2019 2020 2021 C. MATERIALS 2012 Options 2012 2013 2014 2015 2016 2017 2018 2019 2020 2021 2022 D. INFRASTRUCTURE Ratio Teacher/Technical assistants 9.0 9.0 9.0 9.0 9.0 9.0 9.0 9.0 9.0 9.0 9.0 9.0
Ratio Teacher/Supervisory staff 4.7 4.7 4.7 4.7 4.7 4.7 4.7 4.7 4.7 4.7 4.7 4.7
Ratio Teacher/Workers and others 2.5 2.5 2.5 2.5 2.5 2.5 2.5 2.5 2.5 2.5 2.5 2.5
Monotechnics
Some indicators Student Nb of sections 103 103 103 118 134 153 175 200 229 261 298 341 389 Student/section ratio (class size) 80 76 76 77 77 78 78 78 79 79 80 80 Teacher utilization rate 95% 222% 210% 197% 184% 171% 159% 146% 133% 120% 108% 95% New teaching staff required 3% 0 54 66 82 103 130 165 212 276 366 495 Total teaching staff 217 217 263 320 390 479 591 734 918 1,160 1,481 1,918
Chief Lecturers 8 8 10 12 15 18 23 28 36 46 59 77 Principal & Senior Lecturers 23 23 28 34 42 52 64 80 100 127 162 211 Lecturers 1 & 2 112 112 136 165 202 248 306 380 476 602 769 997 Lecturers 3 & Graduate Assts 74 74 89 108 132 161 198 245 306 385 490 633 Chief Lecturers 4.0% 4% 4% 4% 4% 4% 4% 4% 4% 4% 4% 4% Principal & Senior Lecturers 11.0% 11% 11% 11% 11% 11% 11% 11% 11% 11% 11% 11% Lecturers 1 & 2 52.0% 52% 52% 52% 52% 52% 52% 52% 52% 52% 52% 52% Lecturers 3 & Graduate Assts 34.0% 34% 34% 34% 34% 34% 34% 33% 33% 33% 33% 33%
New other staff required 0 82 101 125 157 197 251 323 421 557 754 Total other staff 329 399 485 593 728 898 1,116 1,397 1,764 2,254 2,921
Total technical assistants 49 49 59 72 88 108 134 166 208 263 336 436 Total supervisory staff 115 115 139 169 206 253 312 387 484 611 780 1,009 Total workers and other staff 165 165 200 244 298 366 452 562 704 890 1,138 1,475
Ratio Teacher/Technical assistants 4.4 4.4 4.4 4.4 4.4 4.4 4.4 4.4 4.4 4.4 4.4 4.4
Ratio Teacher/Supervisory staff 1.9 1.9 1.9 1.9 1.9 1.9 1.9 1.9 1.9 1.9 1.9 1.9
Ratio Teacher/Workers and others 1.3 1.3 1.3 1.3 1.3 1.3 1.3 1.3 1.3 1.3 1.3 1.3
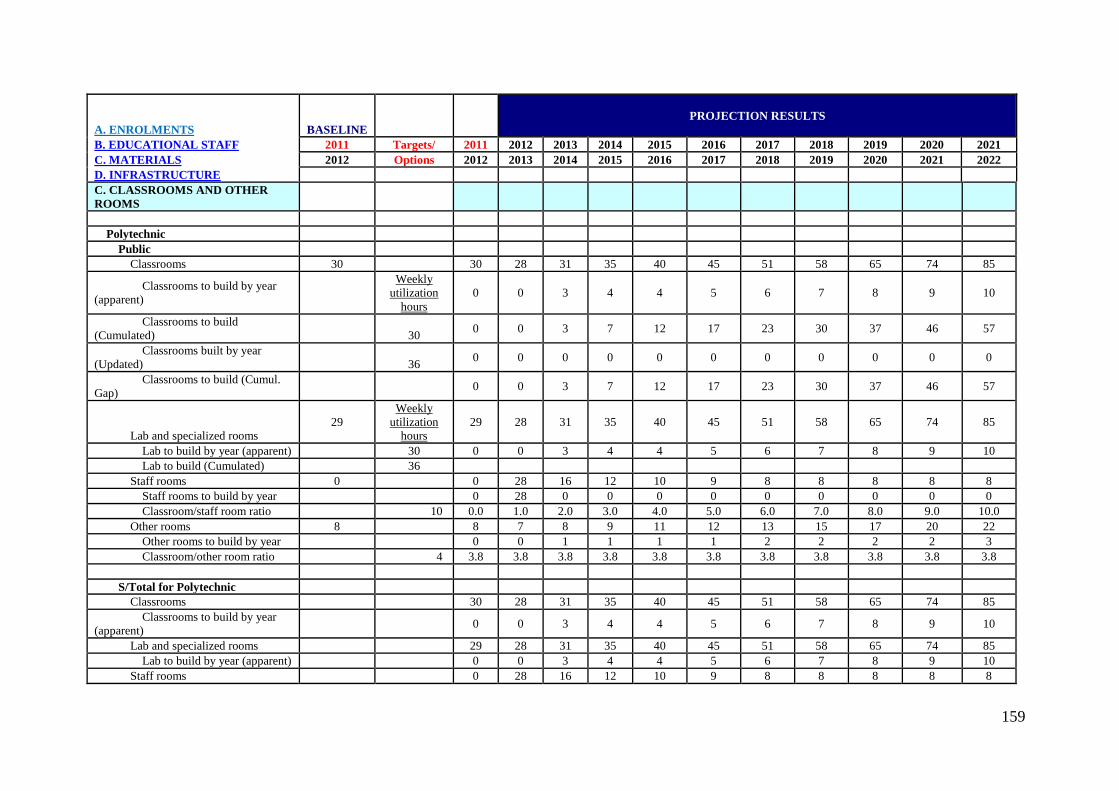
159
A. ENROLMENTS BASELINE
POLICY OBJECTIVES PROJECTION RESULTS
B. EDUCATIONAL STAFF 2011 Targets/ 2011 2012 2013 2014 2015 2016 2017 2018 2019 2020 2021 C. MATERIALS 2012 Options 2012 2013 2014 2015 2016 2017 2018 2019 2020 2021 2022 D. INFRASTRUCTURE C. CLASSROOMS AND OTHER ROOMS
Polytechnic Public
Classrooms 30 30 28 31 35 40 45 51 58 65 74 85
Classrooms to build by year (apparent)
Weekly utilization
hours 0 0 3 4 4 5 6 7 8 9 10
Classrooms to build (Cumulated) 30 0 0 3 7 12 17 23 30 37 46 57
Classrooms built by year (Updated) 36 0 0 0 0 0 0 0 0 0 0 0
Classrooms to build (Cumul. Gap) 0 0 3 7 12 17 23 30 37 46 57
Lab and specialized rooms 29
Weekly utilization
hours 29 28 31 35 40 45 51 58 65 74 85
Lab to build by year (apparent) 30 0 0 3 4 4 5 6 7 8 9 10 Lab to build (Cumulated) 36
Staff rooms 0 0 28 16 12 10 9 8 8 8 8 8 Staff rooms to build by year 0 28 0 0 0 0 0 0 0 0 0 Classroom/staff room ratio 10 0.0 1.0 2.0 3.0 4.0 5.0 6.0 7.0 8.0 9.0 10.0
Other rooms 8 8 7 8 9 11 12 13 15 17 20 22 Other rooms to build by year 0 0 1 1 1 1 2 2 2 2 3 Classroom/other room ratio 4 3.8 3.8 3.8 3.8 3.8 3.8 3.8 3.8 3.8 3.8 3.8
S/Total for Polytechnic
Classrooms 30 28 31 35 40 45 51 58 65 74 85 Classrooms to build by year
(apparent) 0 0 3 4 4 5 6 7 8 9 10
Lab and specialized rooms 29 28 31 35 40 45 51 58 65 74 85 Lab to build by year (apparent) 0 0 3 4 4 5 6 7 8 9 10
Staff rooms 0 28 16 12 10 9 8 8 8 8 8

160
A. ENROLMENTS BASELINE
POLICY OBJECTIVES PROJECTION RESULTS
B. EDUCATIONAL STAFF 2011 Targets/ 2011 2012 2013 2014 2015 2016 2017 2018 2019 2020 2021 C. MATERIALS 2012 Options 2012 2013 2014 2015 2016 2017 2018 2019 2020 2021 2022 D. INFRASTRUCTURE Staff rooms to build by year 0 28 0 0 0 0 0 0 0 0 0
Other rooms 8 7 8 9 11 12 13 15 17 20 22 Other rooms to build by year 0 0 1 1 1 1 2 2 2 2 3
Monotechnics Classrooms 103 103 0 0 0 0 0 0 0 0 0 0
Classrooms to build by year (apparent)
Weekly utilization
hours 0 0 0 0 0 0 0 0 0 0 0
Classrooms to build (Cumulated) 30 0 0 0 0 0 0 0 0 0 0 0
Classrooms built by year (Updated) 36 0 0 0 0 0 0 0 0 0 0 0
Classrooms to build (Cumul. Gap) 0 0 0 0 0 0 0 0 0 0 0
Lab and specialized rooms 53
Weekly utilization
hours 53 0 0 0 0 0 0 0 0 0 0
Lab to build by year (apparent) 30 0 0 0 0 0 0 0 0 0 0 0 Lab to build (Cumulated) 36
Staff rooms 0 0 0 0 0 0 0 0 0 0 0 0 Staff rooms to build by year 0 0 0 0 0 0 0 0 0 0 0 Classroom/staff room ratio 10 0.0 1.0 2.0 3.0 4.0 5.0 6.0 7.0 8.0 9.0 10.0
Other rooms 35 35 0 0 0 0 0 0 0 0 0 0 Other rooms to build by year 0 0 0 0 0 0 0 0 0 0 0 Classroom/other room ratio 3 2.9 2.9 2.9 2.9 2.9 2.9 2.9 2.9 2.9 2.9 2.9
NON FORMAL EDUCATION (NFE) MASS LITERACY A. ENROLMENTS
Literate population 2,433,899 2,433,
899 2,503,
366 2,589,
293 2,696,
153 2,721,6
84 2,746,1
58 2,770,1
43 2,794,5
49 2,826,3
66 2,863,46
4 2,901,2
50 Male 1,494,992 1,494, 1,536, 1,587, 1,651, 1,663,7 1,675,9 1,686,5 1,696,6 1,710,9 1,730,22 1,750,3

161
A. ENROLMENTS BASELINE
POLICY OBJECTIVES PROJECTION RESULTS
B. EDUCATIONAL STAFF 2011 Targets/ 2011 2012 2013 2014 2015 2016 2017 2018 2019 2020 2021 C. MATERIALS 2012 Options 2012 2013 2014 2015 2016 2017 2018 2019 2020 2021 2022 D. INFRASTRUCTURE 992 234 215 265 56 93 07 99 18 6 01
Female 938,907 938,9
07 967,1
32 1,002,
078 1,044,
888 1,057,9
28 1,070,1
66 1,083,6
36 1,097,8
50 1,115,4
48 1,133,23
9 1,150,9
49
Literacy rates 97.6%
97.7%
98.3%
99.5% 97.7% 95.9% 94.1% 92.4% 90.9% 89.6% 88.3%
Male 77.8% 123.5
% 123.5
% 124.1
% 125.6
% 123.1% 120.6% 118.0% 115.5% 113.3% 111.5% 109.7%
Female 55.0% 73.2%
73.3%
73.9%
75.0% 73.8% 72.6% 71.5% 70.5% 69.7% 68.9% 68.0%
Basic Literacy
Adults to enrol at literacy centres 38,90
1 44,35
9 44,91
6 45,48
5 46,065 46,657 47,260 47,876 48,504 49,144 49,797
Duration (years) of literacy programme 1 2 2 2 2 2 2 2 2 2 2 2 2
Male 24,405 2.0% 24,40
5 27,87
5 28,43
2 29,00
1 29,581 30,172 30,776 31,391 32,019 32,659 33,313
Class 1 22,848 22,84
8 23,30
5 23,77
1 24,24
6 24,731 25,226 25,731 26,245 26,770 27,305 27,852
Class 2 1,557 20% 1,557 4,570 4,661 4,754 4,849 4,946 5,045 5,146 5,249 5,354 5,461 Class 3 0 0% 0 0 0 0 0 0 0 0 0 0 0 Basic Literacy Pass Rate 9% 20% 9% 10% 11% 13% 14% 15% 16% 17% 18% 19% 20%
Female 14,496 0.0% 14,49
6 16,48
4 16,48
4 16,48
4 16,484 16,484 16,484 16,484 16,484 16,484 16,484
Class 1 13,737 13,73
7 13,73
7 13,73
7 13,73
7 13,737 13,737 13,737 13,737 13,737 13,737 13,737
Class 2 759 20% 759 2,747 2,747 2,747 2,747 2,747 2,747 2,747 2,747 2,747 2,747 Class 3 0 0% 0 0 0 0 0 0 0 0 0 0 0 Basic Literacy Pass Rate 22% 35% 22% 24% 25% 26% 27% 29% 30% 31% 32% 34% 35%
B. TEACHING AND NON TEACHING STAFF
Some indicators Student/teacher ratio 25.0 13 14 15 17 18 19 20 21 23 24 25

162
A. ENROLMENTS BASELINE
POLICY OBJECTIVES PROJECTION RESULTS
B. EDUCATIONAL STAFF 2011 Targets/ 2011 2012 2013 2014 2015 2016 2017 2018 2019 2020 2021 C. MATERIALS 2012 Options 2012 2013 2014 2015 2016 2017 2018 2019 2020 2021 2022 D. INFRASTRUCTURE Total classes 1,566 1,566 1,785 1,806 1,828 1,850 1,872 1,895 1,919 1,943 1,967 1,992
Student/class ratio 25.0 25 25 25 25 25 25 25 25 25 25 25 New teaching staff required 3% 0 228 0 0 0 0 0 0 0 0 0
Total teaching staff 2,970 2,970 3,105 2,902 2,729 2,579 2,449 2,335 2,234 2,144 2,064 1,992 Basic literacy teachers 2,700 2,700 2,823 2,639 2,481 2,346 2,228 2,124 2,032 1,951 1,878 1,813 Post-Basic teachers 270 270 282 263 247 234 222 211 202 193 186 179
Teacher/Basic literacy teachers ratio 91.0% 91% 91% 91% 91% 91% 91% 91% 91% 91% 91% 91%
Teacher/Post-Basic teachers ratio 9.0% 9% 9% 9% 9% 9% 9% 9% 9% 9% 9% 9%
New non-teaching staff required 3% 0 15 0 0 0 0 0 0 0 0 0 Total non-teaching staff 200 200 209 195 184 173 165 157 150 144 139 134
Non-Teaching 200 200 209 195 184 173 165 157 150 144 139 134 Category 2 0 0 0 0 0 0 0 0 0 0 0 0
Teacher/Non-Teaching ratio 14.9 14.9 14.9 14.9 14.9 14.9 14.9 14.9 14.9 14.9 14.9 14.9 Teacher/Category 2 ratio 0.0 0.0 0.0 0.0 0.0 0.0 0.0 0.0 0.0 0.0 0.0 0.0
C. TEXTBOOKS AND TEACHER GUIDES
Core textbooks 2011 2013 116,7
06 66,54
1 67,37
8 68,23
1 69,101 69,988 70,893 71,817 72,758 73,719 74,699
Core subject books per pupil 3.00 3.0 3.0 3.0 3.0 3.0 3.0 3.0 3.0 3.0 3.0 3.0 3.0
# Textbooks 116,703
66,538
67,375
68,228 69,098 69,985 70,890 71,814 72,755 73,716 74,696
Teaching guides 2011 2013 5,940 1,554 1,453 1,366 1,292 1,227 1,170 1,119 1,074 1,034 998 Books per teacher 2.00 2.0 2.0 2.0 2.0 2.0 2.0 2.0 2.0 2.0 2.0 2.0 2.0 # Teaching guides 5,940 1,552 1,451 1,364 1,290 1,225 1,168 1,117 1,072 1,032 996
D. CLASSROOMS AND OTHER ROOMS
Classroom utilization rate 100% 100% 100% 100% 100% 100% 100% 100% 100% 100% 100% 100% Total classrooms 1,566 1,566 1,785 1,806 1,828 1,850 1,872 1,895 1,919 1,943 1,967 1,992
Classrooms to build by year (Apparent) 0 219 21 22 22 23 23 23 24 24 25

163
A. ENROLMENTS BASELINE
POLICY OBJECTIVES PROJECTION RESULTS
B. EDUCATIONAL STAFF 2011 Targets/ 2011 2012 2013 2014 2015 2016 2017 2018 2019 2020 2021 C. MATERIALS 2012 Options 2012 2013 2014 2015 2016 2017 2018 2019 2020 2021 2022 D. INFRASTRUCTURE Classrooms to build (Cumulated) 0 219 240 262 284 306 329 353 377 401 426
# Staff rooms 27 27 36 36 37 37 37 38 38 39 39 40
Staff rooms to build by year 50
<= Classroom/st
aff room ratio
0 9 0 0 0 0 0 0 0 0 0
# Latrines/toilets 1 1 59 60 61 62 62 63 64 65 66 66
Latrines/toilets to build each year 30
<= Classroom/to
ilet ratio 0 58 1 1 1 1 1 1 1 1 1
# Total other rooms 17 0% 17 0 0 0 0 0 0 0 0 0 0 Other rooms to build by year 0 0 0 0 0 0 0 0 0 0 0
OTHER NON FORMAL EDUCATION PROGRAMMES A. ENROLMENTS
Number of children/adults receiving NFE Basic Education
Post-Basic Literacy 1,350 1,350 1,385 1,420 1,455 1,490 1,525 1,560 1,595 1,630 1,665 1,700 Male 0 200 0 20 40 60 80 100 120 140 160 180 200 Female 1,350 1,500 1,350 1365 1380 1395 1410 1425 1440 1455 1470 1485 1500
Literacy Test Pass Rate 69% 70% 69% 69% 69% 69% 69% 69% 70% 70% 70% 70% 70% Continuing Education Centre 350 350 365 380 395 410 425 440 455 470 485 500
Male 141 200 141 147 153 159 165 171 176 182 188 194 200 Female 209 300 209 218 227 236 245 255 264 273 282 291 300
Literacy Test Pass Rate 68% 70% 68% 68% 68% 69% 69% 69% 69% 69% 70% 70% 70% Remedial Education 3,127 3,127 2,954 2,782 2,609 2,436 2,264 2,091 1,918 1,745 1,573 1,400
Male 1,970 800 1,970 1853 1736 1619 1502 1385 1268 1151 1034 917 800 Female 1,157 600 1,157 1101 1046 990 934 879 823 767 711 656 600
Literacy Test Pass Rate 0% 70% 0% 7% 14% 21% 28% 35% 42% 49% 56% 63% 70% Prison Inmates 131 131 134 137 140 143 146 148 151 154 157 160
Male 131 140 131 132 133 134 135 136 136 137 138 139 140 Female 0 20 0 2 4 6 8 10 12 14 16 18 20

164
A. ENROLMENTS BASELINE
POLICY OBJECTIVES PROJECTION RESULTS
B. EDUCATIONAL STAFF 2011 Targets/ 2011 2012 2013 2014 2015 2016 2017 2018 2019 2020 2021 C. MATERIALS 2012 Options 2012 2013 2014 2015 2016 2017 2018 2019 2020 2021 2022 D. INFRASTRUCTURE Literacy Test Pass Rate 0% 70% 0% 7% 14% 21% 28% 35% 42% 49% 56% 63% 70%
Programme 5 0 0 0 0 0 0 0 0 0 0 0 0 Male 0 0 0 0 0 0 0 0 0 0 0 0 0 Female 0 0 0 0 0 0 0 0 0 0 0 0 0
Literacy Test Pass Rate 0% 0% 0% 0% 0% 0% 0% 0% 0% 0% 0% 0% 0% Cumulative Total 4,958 4,838 4,718 4,599 4,479 4,359 4,239 4,119 4,000 3,880 3,760
Male 2,242 2,152 2,062 1,971 1,881 1,791 1,701 1,611 1,520 1,430 1,340 Female 2,716 2,686 2,657 2,627 2,598 2,568 2,538 2,509 2,479 2,450 2,420
B. TEACHING AND NON TEACHING STAFF
Post-Basic Literacy Student/teacher ratio 25.0 13 14 15 16 18 19 20 21 23 24 25 New trainers 3% 0 0 0 0 0 0 0 0 0 0 0
Total training staff 108 108 101 95 90 85 81 78 75 72 70 68 New non-teaching staff required 3% 0 0 0 0 0 0 0 0 0 0 0
Total non teaching staff 27 25 24 22 21 20 20 19 18 18 17 Non- Teaching 27 27 25 24 22 21 20 20 19 18 18 17 Category 2 0 0 0 0 0 0 0 0 0 0 0 0
Teacher/Non- Teaching ratio 4.0 4.0 4.0 4.0 4.0 4.0 4.0 4.0 4.0 4.0 4.0 4.0
Teacher/Category 2 ratio 0.0 0.0 0.0 0.0 0.0 0.0 0.0 0.0 0.0 0.0 0.0 0.0
Continuing Education Centre Student/teacher ratio 10.0 5 6 6 7 7 8 8 9 9 10 10 New trainers 3% 0 0 0 0 0 0 0 0 1 1 1
Total training staff 65 65 62 60 58 57 55 54 53 52 51 50 New non-teaching staff required 3% 0 0 0 0 0 0 0 0 0 0 0
Remedial Education
Student/teacher ratio 2.0 23 21 19 17 15 13 10 8 6 4 2 New trainers 3% 0 10 11 13 16 20 26 37 59 113 339
Total training staff 135 135 140 147 155 166 180 200 230 280 382 700 New non-teaching staff required 3% 0 18 21 25 31 40 54 79 127 247 741

165
A. ENROLMENTS BASELINE
POLICY OBJECTIVES PROJECTION RESULTS
B. EDUCATIONAL STAFF 2011 Targets/ 2011 2012 2013 2014 2015 2016 2017 2018 2019 2020 2021 C. MATERIALS 2012 Options 2012 2013 2014 2015 2016 2017 2018 2019 2020 2021 2022 D. INFRASTRUCTURE Total non teaching staff 142 155 171 190 215 248 294 362 475 701 1,400
Non-Teaching 142 142 155 171 190 215 248 294 362 475 701 1,400 Category 2 0 0 0 0 0 0 0 0 0 0 0 0
Teacher/Non-Teaching ratio 0.5 1.0 0.9 0.9 0.8 0.8 0.7 0.7 0.6 0.6 0.5 0.5 Teacher/Category 2 ratio 0.0 0.0 0.0 0.0 0.0 0.0 0.0 0.0 0.0 0.0 0.0 0.0
Prison Inmates
Student/teacher ratio 10.0 22 21 19 18 17 16 15 14 12 11 10 New trainers 3% 0 1 1 1 1 1 1 1 2 2 2
Total training staff 6 6 6 7 8 8 9 10 11 12 14 16 New non-teaching staff required 3% 0 0 0 0 0 0 0 0 0 0 0
Total non teaching staff 0 0 0 0 0 0 0 0 0 0 0 Category 1 0 0 0 0 0 0 0 0 0 0 0 0 Category 2 0 0 0 0 0 0 0 0 0 0 0 0
Teacher/Category 1 ratio 0.0 0.0 0.0 0.0 0.0 0.0 0.0 0.0 0.0 0.0 0.0 0.0 Teacher/Category 2 ratio 0.0 0.0 0.0 0.0 0.0 0.0 0.0 0.0 0.0 0.0 0.0 0.0
Programme 5
Student/teacher ratio 0.0 0 0 0 0 0 0 0 0 0 0 0 New trainers 0% 0 0 0 0 0 0 0 0 0 0 0
Total training staff 0 0 0 0 0 0 0 0 0 0 0 0 New non-teaching staff required 0% 0 0 0 0 0 0 0 0 0 0 0
Total non teaching staff 0 0 0 0 0 0 0 0 0 0 0 Category 1 0 0 0 0 0 0 0 0 0 0 0 0 Category 2 0 0 0 0 0 0 0 0 0 0 0 0
Teacher/Category 1 ratio 0.0 0.0 0.0 0.0 0.0 0.0 0.0 0.0 0.0 0.0 0.0 0.0 Teacher/Category 2 ratio 0.0 0.0 0.0 0.0 0.0 0.0 0.0 0.0 0.0 0.0 0.0 0.0
Cumulative Total
New trainers 0 10 12 14 17 21 27 39 61 116 342 Total training staff 314 310 309 311 316 326 342 369 417 517 834
New non-teaching staff required 0% 0 18 21 25 31 40 54 79 127 247 741 Total non teaching staff 169 180 194 213 236 268 313 380 493 718 1,417 Category 1 169 180 194 213 236 268 313 380 493 718 1,417

166
A. ENROLMENTS BASELINE
POLICY OBJECTIVES PROJECTION RESULTS
B. EDUCATIONAL STAFF 2011 Targets/ 2011 2012 2013 2014 2015 2016 2017 2018 2019 2020 2021 C. MATERIALS 2012 Options 2012 2013 2014 2015 2016 2017 2018 2019 2020 2021 2022 D. INFRASTRUCTURE Category 2 0 0 0 0 0 0 0 0 0 0 0
C. Textbooks & Teaching guides
Post-Basic Literacy 2011 2015 Core subject books per learner 3.00 3 3.00 3.0 3.0 3.0 3.0 3.0 3.0 3.0 3.0 3.0 3.0 # Textbooks 4,050 2,078 2,130 2,183 2,235 2,288 2,340 2,393 2,445 2,498 2,550 Books per facilitator 2.00 2 2.00 2.0 2.0 2.0 2.0 2.0 2.0 2.0 2.0 2.0 2.0 # Teaching guides 216 50 47 45 43 41 39 38 36 35 34
Continuing Education Centre 2011 2015 Core subject books per learner 3.00 3 3.00 3.0 3.0 3.0 3.0 3.0 3.0 3.0 3.0 3.0 3.0 # Textbooks 1,050 548 570 593 615 638 660 683 705 728 750 Books per facilitator 2.00 2 2.00 2.0 2.0 2.0 2.0 2.0 2.0 2.0 2.0 2.0 2.0 # Teaching guides 130 31 30 29 28 28 27 26 26 25 25
Remedial Education 2011 2015 Core subject books per learner 3.00 3 3.00 3.0 3.0 3.0 3.0 3.0 3.0 3.0 3.0 3.0 3.0 # Textbooks 9,381 4,431 4,172 3,913 3,654 3,395 3,136 2,877 2,618 2,359 2,100 Books per facilitator 2.00 2 2.00 2.0 2.0 2.0 2.0 2.0 2.0 2.0 2.0 2.0 2.0 # Teaching guides 270 70 73 78 83 90 100 115 140 191 350
Prison Inmates 2011 2015 Core subject books per learner 3.00 3 3.00 3.0 3.0 3.0 3.0 3.0 3.0 3.0 3.0 3.0 3.0 # Textbooks 393 201 205 210 214 218 223 227 231 236 240 Books per facilitator 2.00 2 2.00 2.0 2.0 2.0 2.0 2.0 2.0 2.0 2.0 2.0 2.0 # Teaching guides 12 3 4 4 4 5 5 6 6 7 8
Programme 5 2011 2015 Core subject books per learner 0.00 0 0.00 0.0 0.0 0.0 0.0 0.0 0.0 0.0 0.0 0.0 0.0 # Textbooks 0 0 0 0 0 0 0 0 0 0 0 Books per facilitator 0.00 0 0.00 0.0 0.0 0.0 0.0 0.0 0.0 0.0 0.0 0.0 0.0 # Teaching guides 0 0 0 0 0 0 0 0 0 0 0
Total
# Textbooks 14,87
4 7,257 7,078 6,898 6,718 6,539 6,359 6,179 5,999 5,820 5,640
# Teaching guides 628 155 154 155 158 163 171 184 208 259 417 D. INFRASTRUCTURE

167
A. ENROLMENTS BASELINE
POLICY OBJECTIVES PROJECTION RESULTS
B. EDUCATIONAL STAFF 2011 Targets/ 2011 2012 2013 2014 2015 2016 2017 2018 2019 2020 2021 C. MATERIALS 2012 Options 2012 2013 2014 2015 2016 2017 2018 2019 2020 2021 2022 D. INFRASTRUCTURE
Post-Basic Literacy 27 28 28 29 30 31 31 32 33 33 34
Rooms 1 50 <= Learners
per room 27 28 28 29 30 31 31 32 33 33 34
Rooms 2 0 <= Learners
per room 0 0 0 0 0 0 0 0 0 0 0
Continuing Education Centre 4 5 5 5 5 5 6 6 6 6 6
Rooms 1 80 <= Learners
per room 4 5 5 5 5 5 6 6 6 6 6
Rooms 2 0 <= Learners
per room 0 0 0 0 0 0 0 0 0 0 0
Remedial Education 39 37 35 33 30 28 26 24 22 20 18
Rooms 1 80 <= Learners
per room 39 37 35 33 30 28 26 24 22 20 18
Rooms 2 0 <= Learners
per room 0 0 0 0 0 0 0 0 0 0 0
Prison Inmates
Rooms 1 50 <= Learners
per room 3 3 3 3 3 3 3 3 3 3 3
Rooms 2 0 <= Learners
per room 0 0 0 0 0 0 0 0 0 0 0
Programme 5
Rooms 1 0 <= Learners
per room 0 0 0 0 0 0 0 0 0 0 0
Rooms 2 0 <= Learners
per room 0 0 0 0 0 0 0 0 0 0 0
Total 73 72 71 69 68 67 66 65 63 62 61 Rooms 1 73 72 71 69 68 67 66 65 63 62 61 Rooms 2 0 0 0 0 0 0 0 0 0 0 0 Rooms to build by year -1 -1 -1 -1 -1 -1 -1 -1 -1 -1 0
Source: Jigawa Simulation Model

168
4: Costs and Financing Projection Results EXPENDITURE FRAMEWORK 2011 2012 2013 2014 2015 2016 2017 2018 2019 2020 2021
2012 2013 2014 2015 2016 2017 2018 2019 2020 2021 2022 Cost projections (recurrent & capital) by education level (000)
Preschool education 1,123,611 1,330,376 1,612,864 1,941,483 2,324,637 2,772,563 3,297,816 3,915,920 4,646,243 5,513,194 4,554,608
Primary education (public) 10,349,287 9,492,359 10,515,205 11,766,150 12,798,51
8 14,117,13
9 15,826,427 17,491,97
2 19,304,055 21,305,652 22,578,222 Nomadic education 649,963 770,242 874,831 1,004,653 1,133,152 1,289,743 1,485,697 1,694,989 1,929,631 2,194,385 2,279,288 Integrated IQTE education 285,042 343,259 421,604 513,959 610,145 722,243 859,578 1,009,372 1,177,649 1,367,610 1,328,784 SENs 57,500 69,850 83,863 100,448 115,522 132,430 154,774 178,523 205,782 237,299 270,006
Junior Secondary education (public) 3,779,944 3,559,460 4,713,764 6,855,948 10,267,80
7 15,860,84
6 24,922,919 39,153,71
4 61,592,467 97,812,668 158,161,85
7
Senior Secondary education (public) 3,713,469 3,365,548 4,319,835 5,464,171 7,138,016 9,550,298 13,578,930 20,265,15
1 31,659,780 51,135,818 78,846,950 Higher education (public) 3,701,510 3,440,357 4,055,708 4,800,353 5,700,722 6,792,056 8,120,884 9,750,089 11,768,631 14,313,182 16,031,240 Mass Literacy 2,048,425 1,935,701 1,896,520 1,868,780 1,850,506 1,840,239 1,836,875 1,839,575 1,847,695 1,860,734 1,879,794 Other non formal programmes 102,415 97,952 96,836 96,246 96,088 96,296 96,818 97,616 98,661 99,930 101,395 Continuing education 14,118 9,144 9,372 9,676 10,077 10,598 11,274 12,159 13,342 15,015 17,902 Cross-cutting expenditures (MOE) 4,929,952 5,078,469 5,231,474 5,389,100 5,551,490 5,718,787 5,891,141 6,068,705 6,251,637 6,440,101 6,634,264
Total 30,755,236 29,492,717 33,831,876 39,810,966 47,596,68
0 58,903,23
7 76,083,133 101,477,7
86 140,495,573 202,295,58
9 292,684,31
1
Percentage distribution of cost projections (recurrent & capital) by education level
Preschool education 3.7% 4.5% 4.8% 4.9% 4.9% 4.7% 4.3% 3.9% 3.3% 2.7% 1.6% Primary education (public) 33.7% 32.2% 31.1% 29.6% 26.9% 24.0% 20.8% 17.2% 13.7% 10.5% 7.7% Nomadic education 2.1% 2.6% 2.6% 2.5% 2.4% 2.2% 2.0% 1.7% 1.4% 1.1% 0.8% Integrated IQTE education 0.9% 1.2% 1.2% 1.3% 1.3% 1.2% 1.1% 1.0% 0.8% 0.7% 0.5% SENs 0.2% 0.2% 0.2% 0.3% 0.2% 0.2% 0.2% 0.2% 0.1% 0.1% 0.1% Junior Secondary education (public) 12.3% 12.1% 13.9% 17.2% 21.6% 26.9% 32.8% 38.6% 43.8% 48.4% 54.0% Senior Secondary education (public) 12.1% 11.4% 12.8% 13.7% 15.0% 16.2% 17.8% 20.0% 22.5% 25.3% 26.9% Higher education (public) 12.0% 11.7% 12.0% 12.1% 12.0% 11.5% 10.7% 9.6% 8.4% 7.1% 5.5%

169
Mass Literacy 6.7% 6.6% 5.6% 4.7% 3.9% 3.1% 2.4% 1.8% 1.3% 0.9% 0.6% Other non formal programmes 0.3% 0.3% 0.3% 0.2% 0.2% 0.2% 0.1% 0.1% 0.1% 0.0% 0.0% Continuing education 0.0% 0.0% 0.0% 0.0% 0.0% 0.0% 0.0% 0.0% 0.0% 0.0% 0.0% Cross-cutting expenditures (MOE) 16.0% 17.2% 15.5% 13.5% 11.7% 9.7% 7.7% 6.0% 4.4% 3.2% 2.3%
Total 100.0% 100.0% 100.0% 100.0% 100.0% 100.0% 100.0% 100.0% 100.0% 100.0% 100.0% Source: Jigawa Simulation Model

170
5. Concensus Scenarios
This annex describes the scenario developed in the process of this SESP and SESOP planning process. This scenario serves the base in formulation of policy priorities, targets and strategies of both SESP and SESOP.
The Scenario reveals (How will the Jigawa Education System evolve if the major policy options, defined during stakeholders’ consultations, are pursued and what will be the financial implications?) In May 2013 a final draft of the State Education Strategic Plan (SESP) was released. The formulation of this plan is based on the policy objectives derived from a number of sources, most notably the stakeholders’ consultations, and the High-Level Committee headed by the Permanrent Secretary (PS) MOEST and a core Technical Committee. The key policies and strategies focused on (i) expanding basic education coverage, especially for disadvantaged groups; (ii) improving the quality and relevance of basic, secondary and higher education; (iii) providing appropriate educational opportunities, especially for out-of-school youth and adult population; and (iv) strengthening institutional capacities to manage, plan, and monitor the delivery of education services more efficiently and effectively. The scenario was created to assess the degree of feasibility and realism of the policy targets and options that emerged during the above stakeholder consultations. The following paragraphs discuss the policy assumptions underlying the scenario as well as its implications. Policy Assumptions and Targets This section presents the major quantitative policy targets and options derived from the SESP document. These policy objectives and options are used as assumptions in constructing the 10-year SESP Scenario. Given the ambitious and numerous improvements that this SESP plan envisages, only a few, selected (not all) options that have major resource-related impacts have been taken and used to assess the degree of realism of this scenario. The main features are presented below: • In pre-primary education, gross enrolment ratio will reach 58% by 2022 for age-group 4-5
in public and private schools . PTR and PCR will be reduced to 40:1. Qualified teachers will represent 62% of the teaching force.
• In primary education, the share of private schools will be 4% of total enrolment by 2022. Both the pupil/teacher ratio and class size will reach 40:1 and 40:1 respectively by 2022. The promotion rate will be improved to about 98%, while the repetition rate will be around 1% with the dropout rate subsequently reduced to 1%. As a way of improving the learning outcomes, each pupil will be provided, free of charge, 4 core textbooks by 2022. In other words, core textbook/pupil ratio will be increased to 4 (with 3-year rental scheme), as well as libraries and labs will be provided every 366 classrooms (Classrooms/Library-lab ratio 366:1). 71% of teachers will be qualified. Double shift will be 0%.
• In order to achieve the universal junior secondary education, all children who graduate from primary education will be admitted into junior secondary by 2022; private education
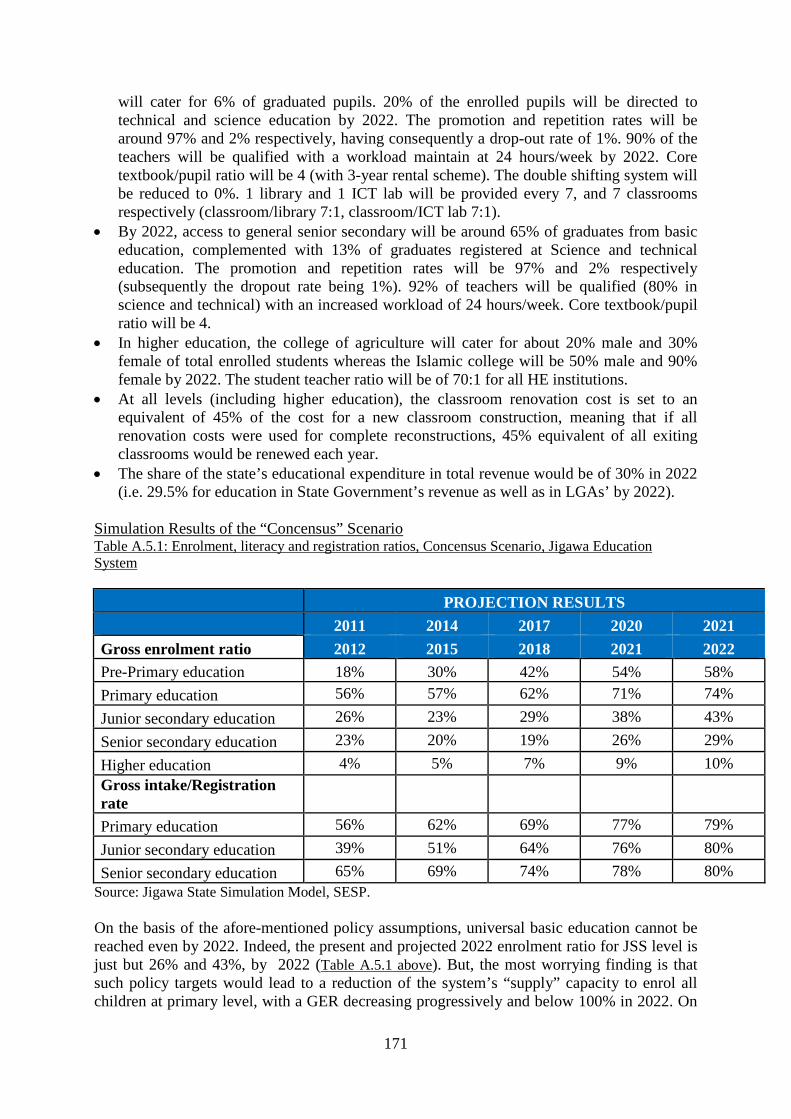
171
will cater for 6% of graduated pupils. 20% of the enrolled pupils will be directed to technical and science education by 2022. The promotion and repetition rates will be around 97% and 2% respectively, having consequently a drop-out rate of 1%. 90% of the teachers will be qualified with a workload maintain at 24 hours/week by 2022. Core textbook/pupil ratio will be 4 (with 3-year rental scheme). The double shifting system will be reduced to 0%. 1 library and 1 ICT lab will be provided every 7, and 7 classrooms respectively (classroom/library 7:1, classroom/ICT lab 7:1).
• By 2022, access to general senior secondary will be around 65% of graduates from basic education, complemented with 13% of graduates registered at Science and technical education. The promotion and repetition rates will be 97% and 2% respectively (subsequently the dropout rate being 1%). 92% of teachers will be qualified (80% in science and technical) with an increased workload of 24 hours/week. Core textbook/pupil ratio will be 4.
• In higher education, the college of agriculture will cater for about 20% male and 30% female of total enrolled students whereas the Islamic college will be 50% male and 90% female by 2022. The student teacher ratio will be of 70:1 for all HE institutions.
• At all levels (including higher education), the classroom renovation cost is set to an equivalent of 45% of the cost for a new classroom construction, meaning that if all renovation costs were used for complete reconstructions, 45% equivalent of all exiting classrooms would be renewed each year.
• The share of the state’s educational expenditure in total revenue would be of 30% in 2022 (i.e. 29.5% for education in State Government’s revenue as well as in LGAs’ by 2022).
Simulation Results of the “Concensus” Scenario Table A.5.1: Enrolment, literacy and registration ratios, Concensus Scenario, Jigawa Education System PROJECTION RESULTS 2011 2014 2017 2020 2021 Gross enrolment ratio 2012 2015 2018 2021 2022 Pre-Primary education 18% 30% 42% 54% 58% Primary education 56% 57% 62% 71% 74% Junior secondary education 26% 23% 29% 38% 43% Senior secondary education 23% 20% 19% 26% 29% Higher education 4% 5% 7% 9% 10% Gross intake/Registration rate
Primary education 56% 62% 69% 77% 79% Junior secondary education 39% 51% 64% 76% 80% Senior secondary education 65% 69% 74% 78% 80%
Source: Jigawa State Simulation Model, SESP. On the basis of the afore-mentioned policy assumptions, universal basic education cannot be reached even by 2022. Indeed, the present and projected 2022 enrolment ratio for JSS level is just but 26% and 43%, by 2022 (Table A.5.1 above). But, the most worrying finding is that such policy targets would lead to a reduction of the system’s “supply” capacity to enrol all children at primary level, with a GER decreasing progressively and below 100% in 2022. On

172
the other hand, access indicators will have improved across most of formal education levels (pre-primacy through senior secondary education, primary education being the exception). Although no proper action was taken in non formal education, improved primary and JSS completion rates will lead to increased literacy rates, thus curbing down the illiteracy rate. Figure A.5.1: Gross enrolment ratios in pre-primary, primary, JSS, SSS and higher education, Concensus Scenario 2011/12 baseline, Jigawa state
Source: Jigawa State Simulation Model, SESP. According to the Concensus Scenario, Jigawa education system will cost 33,343,168,000 billion Naira in 2016 and 50,070,452,000 billion Naira in 2022 as shown in the following table.

173
Table A.5.2: Total cost and breakdown by level of education, Concensus Scenario Jigawa State. EXPENDITURE FRAMEWORK 2011 2012 2013 2014 2015 2016 2017 2018 2019 2020 202
2012 2013 2014 2015 2016 2017 2018 2019 2020 2021 202 Cost projections (recurrent & capital) by education level (000)
Preschool education 1,123,611 1,330,376 1,612,864 1,941,483 2,324,637 2,772,563 3,297,816 3,915,920 4,646,243 5,513,194 4,55 Primary education (public) 10,349,287 9,492,359 10,515,205 11,766,150 12,798,518 14,117,139 15,826,427 17,491,972 19,304,055 21,305,652 22,57 Nomadic education 649,963 770,242 874,831 1,004,653 1,133,152 1,289,743 1,485,697 1,694,989 1,929,631 2,194,385 2,27 Integrated IQTE education 285,042 343,259 421,604 513,959 610,145 722,243 859,578 1,009,372 1,177,649 1,367,610 1,32 SENs 57,500 69,850 83,863 100,448 115,522 132,430 154,774 178,523 205,782 237,299 27 Junior Secondary education (public) 3,779,944 3,559,460 4,713,764 6,855,948 10,267,807 15,860,846 24,922,919 39,153,714 61,592,467 97,812,668 158,16 Senior Secondary education (public) 3,713,469 3,365,548 4,319,835 5,464,171 7,138,016 9,550,298 13,578,930 20,265,151 31,659,780 51,135,818 78,84 Higher education (public) 3,701,510 3,440,357 4,055,708 4,800,353 5,700,722 6,792,056 8,120,884 9,750,089 11,768,631 14,313,182 16,03 Mass Literacy 2,048,425 1,935,701 1,896,520 1,868,780 1,850,506 1,840,239 1,836,875 1,839,575 1,847,695 1,860,734 1,87 Other non formal programmes 102,415 97,952 96,836 96,246 96,088 96,296 96,818 97,616 98,661 99,930 10 Continuing education 14,118 9,144 9,372 9,676 10,077 10,598 11,274 12,159 13,342 15,015 1 Cross-cutting expenditures (MOE) 4,929,952 5,078,469 5,231,474 5,389,100 5,551,490 5,718,787 5,891,141 6,068,705 6,251,637 6,440,101 6,63 Total 30,755,236 29,492,717 33,831,876 39,810,966 47,596,680 58,903,237 76,083,133 101,477,786 140,495,573 202,295,589 292,68
Source: Jigawa State Simulation Model, SESP.

174
Not all the ambitious objectives and targets of the SESP document as defined by the stakeholders were taken in this scenario; however, the funding gap proves to be untenable. By around 2022, the budgetary gap will be 6.5%

175
Table A.5.3 Expenditure on education and funding gaps stakeholders scenario, Jigawa State Baseline PROJECTED RE Domestic resources (000) 2011 2011 2012 2013 2014 2015 2016 2017 2018 2019 2020
2012 2012 2013 2014 2015 2016 2017 2018 2019 2020 2021 State resources 52,382,837 52,382,837 55,001,979 57,752,078 60,639,682 63,671,666 66,855,249 70,198,012 73,707,912 77,393,308 81,262,973 85, Education as % of total state revenue 29.5% 29.5% 29.8% 30.0% 30.3% 30.5% 30.8% 31.0% 31.3% 31.5% 31.8%
Allocation to Education (MOEST) 15,475,149.6 15,475,150 16,384,080 17,345,215 18,361,503 19,436,058 20,572,164 21,773,290 23,043,099 24,385,456 25,804,440 27,
Of which Recurrent 57.3% 57.3% 57.6% 57.9% 58.1% 58.4% 58.7% 58.9% 59.2% 59.5% 59.7% Recurrent 8,873,487.4 8,873,487 9,438,248 10,038,056 10,675,041 11,351,463 12,069,713 12,832,327 13,641,992 14,501,554 15,414,030 16, Capital 6,601,662.2 6,601,662 6,945,832 7,307,159 7,686,462 8,084,595 8,502,451 8,940,963 9,401,107 9,883,901 10,390,410 10,
Total allocation to Education 27,973,439 27,973,439 29,662,486 31,450,504 33,343,168 35,346,471 37,466,747 39,710,685 42,085,349 44,598,203 47,257,129 50,
As % of total state & LGA expenditure 33.4% 33.4% 33.7% 34.1% 34.4% 34.7% 35.1% 35.4% 35.7% 36.1% 36.4%
'Formal' Education 44.8% 44.8% 44.8% 44.8% 44.8% 44.8% 44.8% 44.8% 44.8% 44.8% 44.8% Of which Pre-primary 5.0% 5.0% 5.0% 5.0% 5.0% 5.0% 5.0% 5.0% 5.0% 5.0% 5.0% Of which Primary 12.3% 12.3% 12.3% 12.3% 12.3% 12.3% 12.3% 12.3% 12.3% 12.3% 12.3% Of which Junior Secondary 4.6% 4.6% 4.6% 4.6% 4.6% 4.6% 4.6% 4.6% 4.6% 4.6% 4.6% Of which Senior Secondary 15.70% 15.7% 15.7% 15.7% 15.7% 15.7% 15.7% 15.7% 15.7% 15.7% 15.7% Of which Higher 7.2% 7% 7% 7% 7% 7% 7% 7% 7% 7% 7% Amount Formal Education 12,532,101 13,288,794 14,089,826 14,937,739 15,835,219 16,785,103 17,790,387 18,854,236 19,979,995 21,171,194 22,4 Of which Pre-primary 1,398,672 1,483,124 1,572,525 1,667,158 1,767,324 1,873,337 1,985,534 2,104,267 2,229,910 2,362,856 2, Of which Primary 3,440,733 3,648,486 3,868,412 4,101,210 4,347,616 4,608,410 4,884,414 5,176,498 5,485,579 5,812,627 6, Of which Junior Secondary 1,286,778 1,364,474 1,446,723 1,533,786 1,625,938 1,723,470 1,826,691 1,935,926 2,051,517 2,173,828 2, Of which JSS TVET 2,797 2,966 3,145 3,334 3,535 3,747 3,971 4,209 4,460 4,726 Of which Senior Secondary 4,391,830 4,657,010 4,937,729 5,234,877 5,549,396 5,882,279 6,234,578 6,607,400 7,001,918 7,419,369 7, Of which Science, technical and commercial education 2,797 2,966 3,145 3,334 3,535 3,747 3,971 4,209 4,460 4,726
Of which Higher 2,008,493 2,129,767 2,258,146 2,394,039 2,537,877 2,690,112 2,851,227 3,021,728 3,202,151 3,393,062 3, Other education 0.4% 0.4% 0.4% 0.4% 0.4% 0.4% 0.4% 0.4% 0.4% 0.4% 0.4%

176
programmes Amount ('000) 111,894 118,650 125,802 133,373 141,386 149,867 158,843 168,341 178,393 189,029 2 Cross-cutting 5.6% 5.6% 54.8% 54.8% 54.8% 54.8% 54.8% 54.8% 54.8% 54.8% 54.8% Amount ('000) 50.8% 1,566,513 16,255,042 17,234,876 18,272,056 19,369,866 20,531,777 21,761,455 23,062,771 24,439,815 25,896,907 27,4 Shortfall Domestic Resources & Simulation Costs 9.9% -0.6% 7.6% 19.4% 34.7% 57.2% 91.6% 141.1% 215.0% 328.1%
Additional amount to mobilize 2,781,797 -169,769 2,381,372 6,467,798 12,250,209 21,436,490 36,372,448 59,392,437 95,897,370 155,038,460 242,
Source: Jigawa State Simulation Model, SESP.

177
Figure A.5.2: Financial gap between budget prevision and simulation costs
Source: Jigawa State Simulation Model, SESP.
In sum, the quantitative targets set forth in SESP won’t lead to the achievement of the UBE/EFA objectives, even producing a negative side effect within the plan scope: a decrease in primary education gross enrolment, although a significant share of the education budget is devoted to primary education. Furthermore the expected financial gaps is reasobale that the Concensus Scenario maybe attained However it will require drastic budget increases, cost savings by means of policy shifts and trade offs across and within subsectors are enacted or alternative source of fund.
The funding gap will stay at a manageable level until 2016 (up to 20% of funding gap), but will increase dramatically in a very short time reaching a peak of 6.5% funding gap in 2022. Under this scenario, the State can easily fill the gap until 2022 either by slightly increasing the State and LGAs allocations to education or by mobilizing donors support which is marginal presently. In 2021/22, the funding gap seems untenable and some policy trade-offs will be necessary.

178
Table A.5.5: Expenditure on education and funding gaps, Concensus scenario, Jigawa State
BASELINE PROJECTION RESULTS
2011 2012 2013 2014 2015 2016 2017 2018 2019 2020 2021
2012 2013 2014 2015 2016 2017 2018 2019 2020 2021 2022
Total State/LGA resources 81,765,529 85,853,80
6 90,146,49
6 94,653,82
1 99,386,51
2 104,355,83
7 109,573,62
9 115,052,31
1 120,804,92
6 126,845,17
2 133,187,43
1 Public expenditure on education as % of total state expenditure 50.3% 49.0% 47.6% 46.3% 45.0% 43.6% 42.3% 41.0% 39.6% 38.3% 37.0% Public expenditure on education 41,119,423
42,033,384
42,935,942
43,823,672
44,692,836 45,539,357 46,358,798 47,146,334 47,896,727 48,604,294 49,262,876
Pre-primary education 5.0% 5.2% 5.5% 5.8% 6.0% 6.3% 6.6% 6.9% 7.3% 7.6% 8.0% Primary education 12.3% 14.3% 16.6% 19.3% 22.4% 26.0% 30.2% 35.1% 40.8% 47.3% 55.0% Nomadic education 0.0% 0.0% 0.0% 0.0% 0.0% 0.1% 0.1% 0.1% 0.2% 0.2% 0.3% Integrated IQTE
education 0.0% 0.1% 0.1% 0.2% 0.2% 0.3% 0.3% 0.4% 0.4% 0.5% 0.5% Junior Secondary 4.6% 5.3% 6.0% 6.9% 7.9% 9.1% 10.4% 12.0% 13.7% 15.7% 18.0% Senior Secondary 15.7% 13.7% 11.9% 10.4% 9.1% 7.9% 6.9% 6.0% 5.3% 4.6% 4.0% Science, technical and
commercial education 0.0% 0.0% 0.0% 0.0% 0.1% 0.1% 0.2% 0.4% 0.7% 1.2% 2.0% Higher 7.2% 9.7% 11.7% 13.3% 14.5% 15.1% 15.0% 14.3% 12.6% 9.8% 5.4% Other education
programmes 0.4% 0.4% 0.4% 0.5% 0.5% 0.5% 0.5% 0.5% 0.5% 0.5% 0.5% Other cross-cutting
expenditures 5.6% 51.3% 47.5% 43.4% 39.0% 34.3% 29.2% 23.7% 17.8% 11.4% 4.5%
Financing gaps 2,417,735 -3,442,110 -919,966 3,007,064 8,735,955 17,285,929 31,471,208 52,602,690 83,930,695 138,506,81
9 222,525,79
2 Total gap in % of public
spending 5.9% -8.2% -2.1% 6.9% 19.5% 38.0% 67.9% 111.6% 175.2% 285.0% 451.7% Source: Jigawa State Simulation Model, SESP.

179
Figure A.5.4: Financial gap between budget prevision and simulation costs, Concensus scenario, Jigawa State
Source: Jigawa State Simulation Model, SESP.

180
Annex C
GLOSSARY OF SELECTED TERMS USED IN THIS DOCUMENT
Class size (or pupil-class ratio): The number of students a teacher has in his/her class at a given time. In Nigeria, stream is frequently used to mean a class.
Core Welfare Indicators Questionnaire (CWIQ) survey: CWIQ survey was designed to
produce indicators of social welfare to provide instrument for the continuous monitoring of poverty reduction programmes and social development in general. The 2006 Nigerian CWIQ was a nationwide sample survey conducted to produce welfare indicators for the population at national and sub-national levels, particularly Zones, States and Senatorial Districts. The Survey compliments 2004 Nigerian Living Standards Survey (NLSS) by NBS which profiled poverty in the country.
Dropout rate: The proportion of pupils leaving school without completing a given grade in a
given school-year expressed as a percentage of those who were enrolled in the same grade at the beginning of that grade at the beginning of the same school-year.
Education Trust Fund (ETF): The ETF is a major source of funding for capital expenditures
in many states of Nigeria. The ETF is a trust fund established by decree in 1993 (amended by Act 40 of 1998) with the objective of using funding combined with project management to improve the quality of education in Nigeria. All corporations and companies of identified minimum operating capacity and registered in Nigeria contribute a levy of 2% of their annual assessable profits to the Fund which complements Federal, State and Local Government budgets for the three levels of education nationwide.
Gender parity index (GPI): Ratio of female to male values of a given indicator. A GPI of 1
indicates parity between sexes; a GPI above or below 1 indicates a disparity in favour of one sex over the other.
Gross completion rate: The total number of students completing the final year of primary or
secondary education, expressed as a percentage of the population of the official primary or secondary graduation age. Primary completion rate in Nigeria is to be calculated by dividing the number of students graduating from the grade 6 of primary schools by the population of the official graduation age (age 12). However, in Nigeria, completion rate is sometimes understood as the ratio of the total number of pupils enrolled in the final grade to the total number of school age pupils in the population of that age level, i.e. the Gross Enrolment Ratio for final grade.
Gross enrolment ratio (GER): Total enrolment in a specific level of education, regardless of
age, expressed as a percentage of the eligible official school-age population corresponding to the same level of education in a given school-year. GER can be disaggregated by gender or by location to assess the equity levels.

181
Gross intake rate (GIR): Total number of new entrants in the first grade of primary education, regardless of age, expressed as a percentage of the population at the official primary school-entrance age (6 in Nigeria). Apparent intake rate is alternatively used.
Multigrade class: Its structure is known by various names in different countries, such as:
"composite" or "combination" classes, "double" classes, "split" classes, "mixed-age" classes and "vertically grouped" classes. Multigrade classes can be defined as pedagogical sections where groups of students of different grades are taught in a single classroom. In Nigeria, such classes are rather a rare phenomenon, which may however be worth investigating, especially in small schools in order to optimize the resource utilization (teachers, buildings, etc.)
Net enrolment ratio (NER): Enrolment of the official age-group for a given level of education
expressed as a percentage of the corresponding population. NER for primary education in Nigeria is calculated by dividing the number of pupils enrolled who are of the official age-group for the primary education level by the population for the same age-group (age 6-11).
Percentage distribution of public current expenditure on education by level: Public current
expenditure for each level of education, expressed as a percentage of total public current expenditure on education. One will have to make distinction between approved and actual expenditure because the gap between these two can be high. This indicator is important to appraise the importance accorded by a Government for the development of a given level of education.
Promotion rate: The proportion of pupils enrolled in a given grade in a given school-year who
will at the beginning of the following school-year, be enrolled in the next higher grade. Public expenditure on education as percentage of total public expenditure: Total public
expenditure on education (current and capital) expressed as a percentage of total public expenditure in a given financial year. One will have to make distinction between approved and actual expenditure because the gap between these two can be high. It is calculated by dividing total expenditure on education incurred by all government agencies/departments in a given financial year by the total government expenditure for the same financial year.
Pupil-classroom ratio (PCR): The ratio of the number of pupils (students) to the number of
classrooms. For example, in a Nigeria state, the number of pupils (students) enrolled in this state at a level of education is divided by the number of classrooms available in this state for providing learning at this level of education.
Pupil-teacher ratio (PTR): Otherwise called “pupil-teacher ratio” or “students per teacher”,
this indicator expresses the average number of pupils (students) per teacher at a specific level of education in a given school-year. For the purpose of examining system-wide pupil-teacher ratios, teachers are defined as persons whose professional activity involves the facilitation of learning and the acquisition of attitudes and skills that are stipulated in a formal curriculum by students enrolled in a formal educational institution. Non-formal institutions require a separate investigation. Their staffing is likely to be considerably different from formal institutions. Cross-country or cross-state comparisons may be affected by such factors as the composition of teachers by part- and
182
full-time employment. PTR is not the same and is generally lower than “average class size”. This is because PTR calculation includes teachers who run special programmes, such as music, art and special education, where they may teach smaller groups of students.
Repetition rate: the proportion of pupils from a cohort enrolled in a given grade in a given
school-year who are studying in the same grade in the following school-year. This rate is slightly different from the percentage of repeaters.
Survival rates by grade (SR): Percentage of a cohort of pupils (or students) enrolled in the
first grade of a given level or cycle of education in a given school-year who are expected to reach successive grades. They are calculated by dividing the total number of pupils belonging to a school-cohort who reached each successive grade of the specified level of education by the number of pupils in the school-cohort, i.e. those originally enrolled in the first grade of primary education.
Teachers’ emoluments (salaries) as multiple of GDP per capita: This indicates the level of
teacher salaries in comparison with the affordability of a country or state’s economic and financial situation. It is calculated by dividing the total amount of salaries devoted to all or a category of teachers of all or part of the education system in a given financial year by the GDP per capita of the same financial year. Cross-country, cross-state or cross-sectoral comparisons can allow to see the level of salaries one education system is allocating to teachers, and to analyze the cost-efficiency of the system, the teacher motivation, etc.
UBE Intervention Fund: The Universal Basic Education Law, signed in 2004, provides for
funding the UBE programme from three principal sources: (i) Block grants from the Federal Government of not less than 2 per cent of its Consolidated Revenue Fund, which will be in the form of proposed federal matching contributions to states for financing of basic education; (ii) funds or contributions in the form of federal guaranteed credits and loans, and (iii) international donor grants. For any state to qualify for UBE grant funds, it must contribute not less than 50 percent of its total cost of projects as a cost-share. The criteria for fund utilization are as follows: (a) expenditure by components of UBE programme (Pre-primary 5%, Primary 60%, Junior Secondary 35%); (b) expenditure by activities in each of the components of the UBE Programme (Infrastructural development 70% including classroom construction, classroom furniture, classroom renovation/rehabilitation, laboratory/workshop equipment, introductory technology equipment, borehole construction, construction of toilets, etc.; Textbooks and working materials 15%, including development/ procurement of textbooks for pre-primary, four basic core subjects for primary and five basic core subjects for junior secondary schools, library books, development/procurement of teachers’ guide for pre-primary, four core subjects for primary schools and five core subjects for junior secondary schools, teaching aids (excluding consumables), etc.; and teacher professional Development 15% including short-term training and re-training of teachers at the three levels, with more emphasis on primary, JSS and pre-primary, in that order to be conducted by either the National Teachers’ Institute (NTI), Colleges of Education (COEs) or Institutes of Education and NIEPA to conduct those for managers of UBE institutions.)