State Children’s Health Insurance Program (SCHIP ... · Stockley, Walter -0-State ... (SCHIP)...
26
Stockley, Walter -0- State Children’s Health Insurance Program (SCHIP) Expansion: Will increasing income eligibility limits for children increase insurance coverage? Karen Stockley; Ann Walter Notre Dame Faculty Endorsement: Professor Bill Evans Abstract: The State Children’s Health Insurance Program (SCHIP) was established to provide health insurance coverage to children whose families cannot afford private coverage and whose incomes are too high to qualify for Medicaid. Currently, a majority of states limit SCHIP eligibility to children with family incomes at or below 200% of the federal poverty level (FPL), while four states have set the eligibility threshold at 250% of FPL. Our paper employs a difference-in-difference model that exploits these differences in eligibility thresholds to determine if higher eligibility thresholds have a positive impact on insurance coverage. We find no evidence that extending eligibility for SCHIP to families above 200% of FPL has contributed to increased insurance coverage for children in this higher eligibility range. These results suggest that future efforts to increase insurance coverage for low-income children should focus on increasing enrollment among children already eligible for Medicaid and SCHIP and not on extending eligibility for public insurance to higher-income groups.
Transcript of State Children’s Health Insurance Program (SCHIP ... · Stockley, Walter -0-State ... (SCHIP)...

Stockley, Walter -0-
State Children’s Health Insurance Program (SCHIP) Expansion:
Will increasing income eligibility limits for children increase insurance coverage?
Karen Stockley; Ann Walter
Notre Dame Faculty Endorsement: Professor Bill Evans
Abstract:
The State Children’s Health Insurance Program (SCHIP) was established to provide health insurance coverage to children whose families cannot afford private coverage and whose incomes are too high to qualify for Medicaid. Currently, a majority of states limit SCHIP eligibility to children with family incomes at or below 200% of the federal poverty level (FPL), while four states have set the eligibility threshold at 250% of FPL. Our paper employs a difference-in-difference model that exploits these differences in eligibility thresholds to determine if higher eligibility thresholds have a positive impact on insurance coverage. We find no evidence that extending eligibility for SCHIP to families above 200% of FPL has contributed to increased insurance coverage for children in this higher eligibility range. These results suggest that future efforts to increase insurance coverage for low-income children should focus on increasing enrollment among children already eligible for Medicaid and SCHIP and not on extending eligibility for public insurance to higher-income groups.

Stockley, Walter -1-
I. Introduction
Passed into law with bipartisan support as part of Title XXI of the 1997 Balanced
Budget Act, the State Children’s Health Insurance Program (SCHIP) was established to
provide health insurance to children whose families could not afford private coverage but
whose incomes were too high to qualify for Medicaid. SCHIP has been praised for
successfully increasing insurance coverage for low-income children, and in 2006,
approximately 6.7 million children were enrolled in SCHIP (Kenney, 2008).
Congress initially appropriated over $40 billion in federal matching funds over 10
years that states could use to expand Medicaid eligibility, establish separate SCHIP
programs, or to combine new SCHIP programs with Medicaid. SCHIP is a means tested
program with eligibility thresholds measured in terms of family income as a percent of
the Federal Poverty Level (FPL). Title XXI allowed states to extend eligibility for public
insurance to children with family incomes up to 200% of the federal poverty level (e.g.
$42,054 for a family with two parents and two children in 2007) with the exception that
those states with Medicaid eligibility levels already above 200% could extend eligibility
to higher levels. Currently, the number of states that set eligibility at, above and below
200% of the FPL are 28, 14 and 8, respectively.
SCHIP came up for renewal in 2007, and Congress was required to reauthorize
funding to continue the program. Since SCHIP was recognized as being successful at
increasing insurance coverage among children, many SCHIP supporters urged Congress
to expand the program by appropriating more federal funds and increasing the maximum
eligibility threshold. Although Congress passed legislation to extend funding for SCHIP
for five additional years, President Bush vetoed comprehensive reauthorization bills

Stockley, Walter -2-
twice. In addition to renewing previous funding levels, this legislation authorized
additional funds for outreach and enrollment efforts, but did not raise eligibility
thresholds. After much debate, a compromise was finally reached in December of 2007 to
temporarily extend SCHIP for 18 months. Critics, such as President Bush, argue that
raising the eligibility threshold will do little to increase overall insurance coverage for
children because children in the upper income eligibility range are likely to already have
private coverage. SCHIP will again come before Congress in 2009, and it is likely that
they will again consider expanding funding and eligibility levels (Kenney, 2008). A
Democratic presidential victory in 2008 would likely place SCHIP reauthorization high
on the agenda since the two remaining Democratic presidential candidates have made
expansion of SCHIP a key component of their health care reform packages. Even with a
Republican in the White House, SCHIP will continue to attract bipartisan support.
Given the goals of SCHIP and continued efforts to increase the number eligible
for the program, it is imperative to know if expanding eligibility thresholds will lead to an
increase in coverage. Early research has shown that SCHIP contributed to the decline in
the percent of low-income children that are uninsured from 23 percent in 1996 to 18.6
percent in 2002 (Selden et al., 2004). It has been hailed for its success in increasing
coverage and improving access to care for low-income children (Cunningham et al.,
2002; Kenney and Cook, 2007; Quinn and Rosenbach, 2005). The success of SCHIP in
increasing coverage is affected by take-up rates, or the percent of eligible children that
actually enroll. SCHIP take-up has risen since the initial years of the program, and is now
around 60% (Selden et al., 2004). Our estimates show that higher-income families are
Stockley, Walter -3-
less likely to take-up SCHIP, and so take-up will likely be lower if eligibility is expanded
further.
SCHIP can only increase insurance coverage rates if new enrollees are coming
from the ranks of the uninsured. A primary criticism of SCHIP is that it leads to “crowd
out,” or children dropping private insurance coverage to enroll in SCHIP. If crowd out
rates are large, expanding public insurance does little to impact overall insurance rates.
Estimates of SCHIP crowd out vary and are sensitive to data sources and specifications,
with some authors finding that 50-60% all enrollees switch from private insurance (Lo
Sasso et al. 2004; Gruber and Cutler, 2007) and others finding more modest effects of 7-
15% (Wooldridge et al., 2005).
Given less than 100 percent take up and the potential for crowd out, it is not
known whether expansions of the program will increase insurance coverage. In this
paper, we exploit variation across states in SCHIP eligibility rules to test whether higher
income eligibility thresholds contribute to higher insurance rates for children. As noted
above, a majority of states limit SCHIP eligibility to children whose family incomes are
at or below 200% of FPL. In contrast, four states (California, New York, Washington
and Rhode Island) have set the eligibility threshold at 250% of FPL. Among the four
states with more generous SCHIP eligibility rules, we would expect to see higher
insurance coverage for those with incomes between 200 and 250% of FPL than those
with incomes between 150 and 200%. Some of this difference is due to expansions of the
SCHIP program to higher-income groups, but some will also be due to the fact that
insurance rates for children tend to rise with family income. Looking at insurance
coverage rates for the less generous states as a control, the difference in insurance rates
Stockley, Walter -4-
between the higher (200 to 250% of FPL) and lower (150 to 200% of FPL) eligibility
states provides an estimate of the change in insurance coverage that would occur in the
four more generous states had there not been an expansion in coverage. The difference in
these differences is then an estimate of what expansion of the program to high income
groups has done to insurance coverage rates. We find no evidence that extending
eligibility for SCHIP to families above 200% of the FPL has contributed to an increase in
insurance coverage for children in this higher eligibility range. These results suggest that
future efforts to increase insurance coverage for low-income children should focus on
increasing enrollment among children already eligible for Medicaid and SCHIP and not
on extending eligibility for public insurance to higher-income groups.
II. Empirical Methodology
A. Data
The data for this study comes from the March Current Population Survey (CPS).
The CPS is a monthly survey of roughly 50,000 households that has been conducted for
more than 50 years by the U.S. Census Bureau for the Bureau of Labor Statistics.1 The
survey is representative of the civilian noninstitutional population. A series of questions
regarding labor force and demographic characteristics are asked monthly with detailed
questions regarding income, poverty, and health insurance status asked in March as part
of the Annual Demographic File and Income Supplement.
1 http://www.census.gov/cps/
Stockley, Walter -5-
Data is obtained through the Integrated Public Use Microdata Series (IPUMS) for
the CPS.2 IPUMS-CPS is an integrated set of data spanning 1962-2007 for the March
CPS where data elements have been harmonized for comparability over time. Data is
available at both the individual and household level.
We use individual data for the years 2001-2007. The primary reason for
beginning in 2001 is that it was the first year a verification question was added at the end
of the series of insurance questions. The verify question asks: “Does the person with no
coverage reported previously have any coverage?” If yes, the respondent was then able
to choose up to six types of health insurance for the previous calendar year. This “verify”
estimate greatly reduced the estimated number of persons without health insurance (about
8% of persons previously classified as not having health insurance). The March 2001
CPS was also the first to include a Medicaid follow up question on whether individuals
18 and under were covered by SCHIP. This variable cannot be used exclusively to
determine the number of children enrolled in SCHIP because of the way the survey
structures insurance questions. We return to this point in detail below.
The key outcome variables included in our analysis are indicators for whether an
individual child is covered by any insurance, private insurance, and public insurance.
The variable any insurance indicates the individual reported coverage through Medicaid,
Medicare, military health insurance, Civilian Health and Medical Program of the
Department of Veterans’ Affairs, Indian Health Service, SCHIP, group coverage, private
coverage, or through the verify question. Individuals are categorized as having private
insurance if they report being covered by private insurance or group insurance. People
2 Miriam King, Steven Ruggles, Trent Alexander, Donna Leicach, and Matthew Sobek. Integrated Public Use Microdata Series, Current Population Survey: Version 2.0. [Machine-readable database]. Minneapolis, MN: Minnesota Population Center [producer and distributor], 2004. <cps.ipums.org/cps>.

Stockley, Walter -6-
are classified as having public insurance, if they report having Medicaid or SCHIP.
Other forms of public insurance, including Medicare, were not included in the public
insurance variable because the main criteria for eligibility in these programs is not
income, but other requirements such as age, disability status, and veteran status.
Eligibility for SCHIP is determined by family income in relation to the federal
poverty level, which is itself a function of family size. We impute the income eligible for
inclusion in a child’s poverty level calculation using rules developed by the U.S. Census
Bureau. According to these definitions, all related family members within a household
have the same poverty status, and so the incomes from all related family members are
included when calculating a family’s poverty status.3 Since the March CPS collects
information for the previous calendar year, we use poverty thresholds that are lagged one
year (i.e. the 2007 March CPS poverty thresholds are based off 2006 U.S. Census Bureau
poverty thresholds).
Our sample consists of children aged 0-18, the age eligibility range for SCHIP.
We omit non-U.S. citizens from our sample because they are ineligible. We are not able
to include foster children and other children living with non-relatives because family
income data is not available for them. Our sample is also confined to children with
incomes between 150-250% of FPL, which is the subgroup relevant for our difference-in-
difference model.
B. Econometric Model
We estimate a difference-in-difference model by grouping states into a low
eligibility control group and a high eligibility treatment group. States in the low eligibility
group use the most common eligibility threshold, covering children with family incomes 3 http://www.census.gov/hhes/www/poverty/threshld.html

Stockley, Walter -7-
up to 200% of FPL. We use all low eligibility states that use similar income eligibility
requirements to form the control group in our model.4 Four states grant eligibility to
children with incomes up to 250% of FPL, and these four states form the treatment group
where the “treatment” is expanded eligibility for SCHIP. Table 1 lists all states in the
treatment group, and Table 2 lists all states in the control group. States with eligibility
levels other than 200 and 250% are not included in our sample. In addition, we exclude
four states because they operate separate state programs in which eligibility for public
coverage exceeds SCHIP eligibility levels. All states not included in our sample are
described in Table 3.
Children in our sample are divided into two groups based on family income.
Children in the lower-income group have incomes 150-200% of FPL. Kids in this group
are eligible for SCHIP in both treatment and control states. Therefore, any difference in
insurance coverage between lower-income kids in treatment and control states is due to
secular differences between low eligibility control states and high eligibility treatment
states. Children in the higher-income group have incomes 200-250% of the FPL. Higher-
income kids living in treatment states are eligible for SCHIP but those living in control
states are not eligible. The difference in insurance coverage between higher-income kids
in treatment and control states are a result of both secular differences between treatment
and control states and eligibility for SCHIP. Since we can identify the secular effect as
the difference between lower-income kids in treatment and control states, subtracting this
4 States are given the flexibility to set their own rules for income attribution and exemptions, enrollment policies, and other program features in separate SCHIP and SCHIP combination programs. We use only those states that use income attribution rules which are identical or very similar to Medicaid rules in an attempt to pool states with the most similar programs and to minimize the variation in what types of income can be counted in determining SCHIP eligibility across states. We also tried running our model for all states with 200% eligibility, excluding states with separate programs that finance children above SCHIP levels, but did not find large enough changes for us to abandon using only states with Medicaid rules.
Stockley, Walter -8-
difference from the difference between higher-income kids in treatment and control states
will give the effect of SCHIP eligibility on insurance coverage for higher-income kids.
Table 4 provides summary statistics for treatment and control groups. As noted before,
the sample consists of U.S. citizens aged 0-18, with incomes ranging 150-250% of FPL.
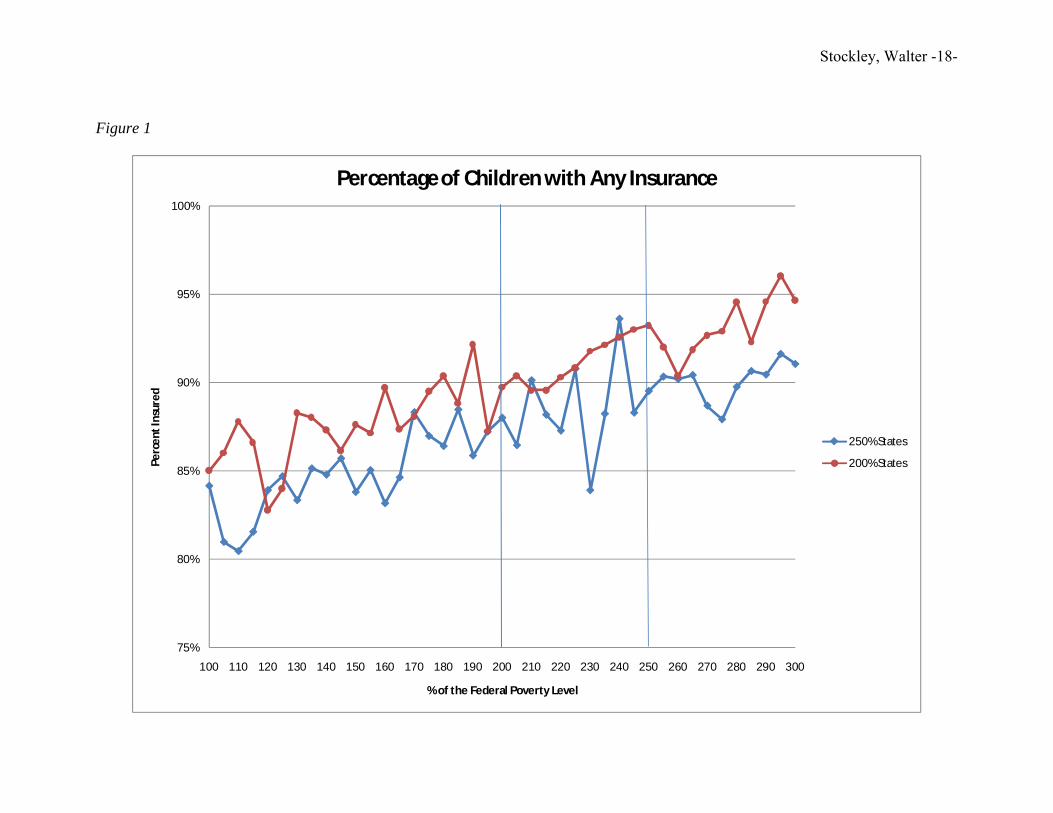
The visual results from the difference-in-difference model are graphically
represented in Figures 1-3. In Figure 1, we report the fraction of children with any health
insurance in states with 200 and 250% cutoff levels. In both groups of states, children
with incomes below 200% of the FPL are eligible for SCHIP and notice that as incomes
rise, the change in insurance status increases at about the same rate in both state groups.
If expanding eligibility to 250% has increased insurance coverage for children in this
higher income range, we should see a break in the trend line of the 250% states at the
200% threshold. In particular, the trend line should jump upward if SCHIP eligibility is
causing more kids with incomes 200-250% to be insured. However, the graphs show no
such breaks at the 200% threshold for any of the insurance outcomes. This suggests that
expanded eligibility is not having an impact on insurance coverage.
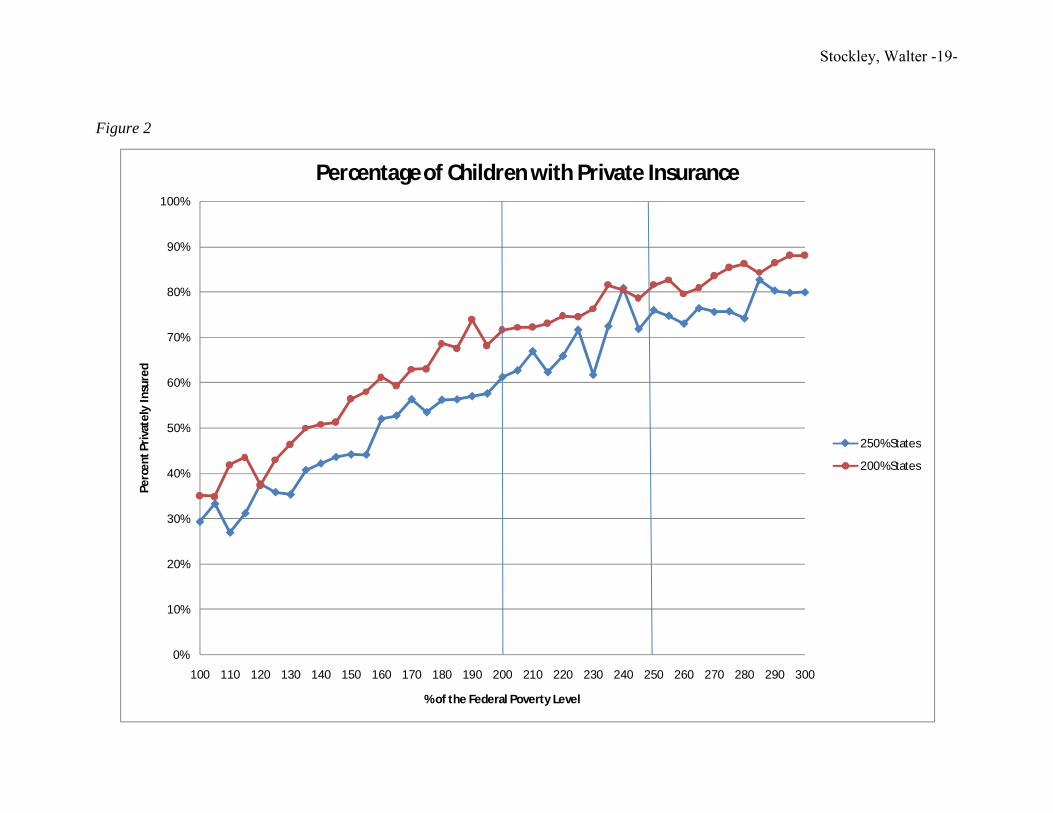
In Figures 2-3, we repeat the exercise with the two other key outcomes: whether
the child has private and public insurance, respectively. In both of these graphs, we see
similar insurance rates for the children below 200% of the FPL and no appreciable
change in the vertical distance between the graphs in the 200 to 250% ranges. Again,
these figures, especially Figure 3, provide visual evidence that expanded SCHIP
eligibility in the four states listed in the treatment group does not appear to have changed
public insurance enrollment rates above what we would expect in states that do not cover
these children.

Stockley, Walter -9-
The basic difference-in-difference regression model estimated for a child (i) from
state (s) in year (t) follows the form of
(1) Yist = β0 + β1Tist + β2Aist + β3TistAist + εist
where Yist=1 if the child is insured (by any, private, or public policy) and zero otherwise.
We begin with a limited set of covariates. We identify Tist=1 if the observation belongs
to a treatment state with a 250% eligibility cutoff; Aist=1 for an individual in the higher
income group of 200-250% of FPL (the treatment period); TistAist is the interaction of
living in a treatment state with an income 200-250% of the FPL. β3 is the coefficient of
interest, interpreted as the effect of SCHIP eligibility on insurance coverage for children
in the 200-250% income range. The variable εist is a random error.
As the numbers in Table 5 indicate, there are some potential differences in
demographic characteristics across states that could potentially contaminate a simple
model like Equation 1. Therefore, we need to control for a denser set of covariates than
reported in Equation 1.
(2) Yist = β0 + β1Tist + β2Aist + β3TistAist + β4Xi + uis + λit + εist
where Yist=1 if the child is insured (by any private or public policy) and zero otherwise,
Tist=1 for the treatment states, Aist=1 for an individual with income 200-250% of the FPL
(the treatment period), TistAist is the interaction of living in a treatment state with an
income 200-250% of the FPL. β3 is, again, the coefficient of interest, interpreted as the
effect of SCHIP eligibility on insurance coverage for children in the 200-250% income
range. Xi is a vector of individual characteristics. Included are sex, age, the interaction
of age and male, Hispanic, white, black, and Asian. Looking at Figure 1, there is a
pronounced positive relationship between the FPL and insurance status. Although the

Stockley, Walter -10-
relationship can be approximated by a linear function, we allow for a possible non-linear
relationship between FPL and insurance status by including a squared and a cubic term in
the FPL into the regressions. We allow for the possibility that the treatment states are not
randomly assigned (i.e. 250% states have higher eligibility thresholds by choice) by
including state effects. State and year effects are represented by us and λt respectively,
and εist is a random error term.
A key assumption of the difference-in-difference model is that the change in
insurance coverage in the control states between lower and higher income groups
represents the change in coverage that would occur in the treatment groups in the absence
of any expansion of SCHIP beyond the 200% level. For example, suppose that
expanding the eligibility of SCHIP to higher levels of FPL increases children’s insurance
coverage, but insurance coverage is changing at a higher rate in higher eligibility states
compared to lower eligibility states. In this case, the difference-in-difference model will
overstate the effect of increased eligibility rates. While we cannot verify that the
outcomes would have been the same in the absence of intervention, Figures 1-3 provide
some evidence that this assumption is valid. Note that the change in insurance coverage
as one moves from 150 to 200% of FPL within each of these groups is nearly identical.
For all insurance and private insurance, insurance coverage gradually increases with
higher FPL. For public insurance, children’s insurance coverage gradually decreases
with higher FPL.

Stockley, Walter -11-
III. Results
Table 5 reports mean insurance coverage rates for four different groups: states
with high (250% of FPL) and low (200% of FPL) SCHIP income eligibility cutoffs and
individuals with higher (200-250% of FPL) and lower (150 to 200% of FPL) incomes.
Looking at the ‘treatment’ states with more generous coverage (columns (4) and (3)), we
see that insurance coverage rates are 2.5 percentage points higher for children in the
higher-income group in high eligibility states. However, among states without any
SCHIP coverage for children in the 200 to 250% of the FPL range, there is also only a
2.4 percentage point difference in insurance coverage rates between the high and low
income groups. The small difference in these means (column (7)) confirms the visual
evidence in Figure 1 that expanding SCHIP to the higher-income group of children
appears to have had little impact on insurance coverage rates. The numbers indicate a
slight decrease in public insurance and slight increase in private insurance for 250%
states, but neither of these estimates is qualitatively large.
Our complete regression estimates are reported in Table 6. We estimate three
models for three different outcome variables. The outcome variables are indicators for if
an individual is covered by any insurance (1), covered by private insurance (2), and
covered by public insurance (3). The coefficient of interest is for the interaction term
“Above 200% Federal Poverty Level*States with Cutoff at 250% of Federal Poverty
Level”, which gives the effect of living in a high eligibility state on the probability that a
child with income 200-250% FPL will have insurance. This coefficient is essentially the
difference-in-difference means given in Table 5 adjusted for demographic characteristics
and state and year effects. The estimated coefficient for the any insurance model is not

Stockley, Walter -12-
statistically different from zero, which corresponds to the small difference in means
discussed above. The interpretation of this result is that a higher-income child is not more
likely to have insurance as a result of being eligible for SCHIP.
The estimated coefficient for public insurance is also not statistically different
from zero, with the interpretation that SCHIP also has a negligible impact on public
insurance coverage for children with incomes 200-250% of the FPL. This would imply
very low take-up rates for children in this income range. The estimated effect on private
insurance is positive and statistically significant at the 5 percent level. The interpretation
is that expanded SCHIP eligibility increases the probability that children with incomes
200-250% will be privately insured. The magnitude is small, but the positive sign of this
result is counterintuitive because being eligible for public coverage should have the effect
of decreasing private coverage if it has any effect at all. One plausible explanation for this
result is that people are misreporting public insurance coverage as private coverage in the
CPS. This nonsampling error concern is discussed in more detail below.
We have tried numerous other ways to specify the data and create accurate
measures. One method employed throughout the research process was an alternative
method of computing family income. An income was constructed using only the mother
and father’s income (if living with the child) because we were concerned that families did
not actually report the incomes of all related family members when applying for SCHIP.
Since these results differ very little from our published results, we have not included
them, but they can be provided upon request. Another method used was including all
states with 200% of the FPL in the control group, excluding the states with SCHIP

Stockley, Walter -13-
programs financed past those levels. Again, the results did not differ drastically and we
feel that our closer specification of income criteria produces more credible results.
Accuracy of estimates depend on the extent of sampling error and nonsampling
error. Sampling error occurs because of differences between sample values, which are
estimated for a subset of the total population and the true population values. Standard
errors should account for sampling error. Nonsampling error refers to the difference from
the true population value that would occur if the entire population was sampled. The
aspect of nonsampling error of greatest concern is that the March CPS being a self-
reported survey. Respondents may not recall their previous year’s income correctly or
may misunderstand a question. Respondents may have problems remembering previous
health coverage or may have switched and neglected to report all previous forms of
insurance. In addition, often people on Medicaid or SCHIP are issued a health insurance
card from Blue Cross/Blue Shield or another private insurer. Respondents may be
confused about whether their coverage is in fact public or private insurance. The Census
Bureau attempts to control for problems by electronically changing the name of the
Medicaid program to match the state’s terms. Various other precautions are also taken to
limit nonsampling error.
We feel the biggest problem in our research is that the income measures we
generate do not exactly simulate incomes used to determine eligibility for Medicaid and
SCHIP. Factors such as child care expenses, alimony, and outgoing child support
payments are not reported in the CPS but are used as income exemptions when applying
for Medicaid and most SCHIP programs. Variation exists in how states determine SCHIP
eligibility, and it is not always clear how states calculate the types of income that are

Stockley, Walter -14-
relevant for eligibility. We try to limit these errors by only including states that exactly or
very closely follow Medicaid eligibility rules so we can at least be certain that all states in
our sample are using the same rules. However, we cannot be certain that the incomes we
generate are identical to ones actually used to determine eligibility in all cases.5
IV. Discussion and Conclusion
Our results show that expanding SCHIP eligibility beyond 200% of the FPL has
no discernable impact on the probability that a child with family income 200-250% of the
FPL will be insured. Thus, we conclude that expanding eligibility thresholds over 200%
of the FPL has had a negligible impact on insurance coverage. These results are not
entirely unexpected considering that crowd-out is greater and take-up rates are lower for
higher-income groups. Our results provide suggestive evidence that further expanding
SCHIP eligibility levels will do little to impact uninsurance rates and that proposed
SCHIP expansions to extend eligibility to families with incomes of 300% or more of the
FPL will be an inefficient use of resources.
Nearly three-quarters of uninsured children are already eligible for public
insurance (Dubay et al., 2002). Therefore, lack of eligibility is not the primary problem
policymakers must grapple with in their efforts to decrease the number of uninsured
children. Policies intended to increase insurance coverage for low-income children
should instead focus on increasing the enrollment of eligible children. Haley and Kenney
(2001) find that lack of knowledge about the SCHIP program was the primary barrier to
enrollment for one-third of uninsured children. Administrative difficulties were
responsible for another 10%, while 22% of uninsured kids’ parents said they did not want

Stockley, Walter -15-
or need public insurance; 18% of those surveyed had had Medicaid or SCHIP at some
point in previous year but hadn’t re-enrolled for various reasons.
Simplifying eligibility procedures, community-based outreach and application
options, as well as integrating enrollment for Medicaid and separate SCHIP programs
would help expand enrollment (Ross and Hill, 2001). Grants to decrease barriers to
enrollment through features such as automatic enrollment, premium assistance programs,
and translation services have the potential to increase insurance coverage for high poverty
and near poverty children. Federal grants for implementing these programs were included
in the proposed legislation vetoed by President Bush in 2007, but not in the temporary
extension bill that expires in 2009. Enrolling eligible children for Medicaid should also
be a top priority. Currently states receive lower federal matching rates for Medicaid than
for SCHIP, which may partly explain greater state efforts to enroll children in SCHIP
than Medicaid. Increasing Medicaid payments would go a long way toward increasing
enrollment and access to care for high poverty children (Kenney, 2008).
Providing the nation’s estimated 9.4 million uninsured children with an adequate
source of regular care should be a top priority for policymakers. The results of our study
do not diminish the role that SCHIP has played in providing coverage to its target
population, children below 200% of the FPL. Rather, they demonstrate that extending
eligibility beyond the 200% threshold is not the best way to target uninsured children.
The literature suggests that states have been reasonably effective in expanding coverage
for low-income children currently eligible for SCHIP. Future SCHIP expansions should
seek to build on this success by giving states more resources to increase enrollment of
uninsured children below 200% of FPL.

Stockley, Walter -16-
Bibliography
A. Quinn and M. Rosenbach. “Beyond Coverage: SCHIP Makes Strides toward
Providing a Usual Source of Care to Low-Income Children”. Cambridge, Mass.:
Mathematica Policy Research, 2005.
Cunningham, Peter H. “SCHIP Making Progress: Increased Take-Up Contributes to
Coverage Gains”. 2003. Health Affairs 22, no. 4. 163-172
Gruber J, Simon K. and Kosali Simon. Crowd-out Ten Years Later: Have Recent Public
Insurance Expansions Crowded Out Private Health Insurance? Working Paper
#12858, January 2007, NBER: Cambridge, MA.
Dubay, Lisa, Genevieve M. Kenney and Jennifer Haley. 2002. "Children’s Participation
in Medicaid and SCHIP”. Washington, D.C.: The Urban Institute. Assessing the
New Federalism Policy Brief B-40.
Haley, Jennifer and Genevieve Kenney. 2001. "Why Aren’t More Children Enrolled in
Medicaid and SCHIP?”. Washington, D.C.: The Urban Institute. Assessing the
New Federalism Policy Brief B-35.
Kenney, G and J Yee.“SCHIP At A Crossroads: Experiences to Date and Challenges
Ahead.” Health Affairs. March/April 2007; 26(2): 356-369.
Kenney, Genevieve M. 2008. “The Failure of SCHIP Reauthorization: What Next?”.
Washington, D.C.: The Urban Institute. Timely Analysis of Immediate Health
Policy Issues.
Ross, Donna Cohen and Ian T. Hill. 2003. “Enrolling Eligible Children and Keeping
Them Enrolled”. Health Insurance for Children. The Future of Children. Vol. 13,
no.1

Stockley, Walter -17-
Selden, T.M., J.L. Hudson, and J.S. Banthin, “Tracking Changes in Eligibility and
Coverage among Children, 1996–2002,” Health Affairs 23, no. 5 (2004): 39–50.
Wooldridge J, Hill I, Harrington M, Kenney G, Hawkes C, Haley J.
Congressionally-Mandated Evaluation of the State Children’s Health Insurance
Program: Final Report to Congress. Report conducted by Mathematica Policy
Research and the Urban Institute for the Office of the Assistant Secretary for
Planning and Evaluation at the U.S. Department of Health and Human Services;
October 26, 2005.
Stockley, Walter -18-
Figure 1
75%
80%
85%
90%
95%
100%
100 110 120 130 140 150 160 170 180 190 200 210 220 230 240 250 260 270 280 290 300
Perc
ent I
nsur
ed
% of the Federal Poverty Level
Percentage of Children with Any Insurance
250% States
200% States
Stockley, Walter -19-
Figure 2
0%
10%
20%
30%
40%
50%
60%
70%
80%
90%
100%
100 110 120 130 140 150 160 170 180 190 200 210 220 230 240 250 260 270 280 290 300
Perc
ent P
riva
tely
Ins
ured
% of the Federal Poverty Level
Percentage of Children with Private Insurance
250% States
200% States

Stockley, Walter -20-
Figure 3
0%
10%
20%
30%
40%
50%
60%
70%
100 110 120 130 140 150 160 170 180 190 200 210 220 230 240 250 260 270 280 290 300
Perc
ent P
ublic
ly I
nsur
ed
% of the Federal Poverty Level
Percentage of Children Age 0-18 with Public Insurance
250% States
200% States

Stockley, Walter -21-
Table 1200% States' SCHIP Eligibility Levels as a Percent of the Federal Poverty Level
State Type1 Medicaid Income2 2000 2001 2002 2003 2004 2005 2006
Alaska E Y 200 200 200 175 175 175 175Arizona S Y 200 200 200 200 200 200 200Arkansas E Y 200 200 200 200 200 200 200Colorado S Y 185 185 185 185 185 185 200Delaware C Y 200 200 200 200 200 200 200D.C. E Y 200 200 200 200 200 200 200Hawaii E Y 200 200 200 200 200 200 200Indiana C Y 200 200 200 200 200 200 200Kansas S Y 200 200 200 200 200 200 200Louisiana E Y 150 200 200 200 200 200 200Maine C Y 200 200 200 200 200 200 200Michigan C Y 200 200 200 200 200 200 200Mississippi S Y 200 200 200 200 200 200 200North Carolina S Y 200 200 200 200 200 200 200Ohio E Y 200 200 200 200 200 200 200Utah S Y 200 200 200 200 200 200 200Virginia C Y 185 200 200 200 200 200 200West Virginia S Y 150 200 200 200 200 200 200Wisconsin E Y 185 200 200 200 200 200 200Wyoming S Y 133 133 133 185 185 185 2001Indicates whether the state chose to implement SCHIP as a separate program (S), an expansion of its current Medicaid program (E), or a combination of the two (C)2Indicates yes (Y) if the rules for attributing family income are identical or very similar to Medicaid income determination regulations*A separate state program finances insurance for children in families with incomes exceeding SCHIP levels
Table 2250% States' SCHIP Eligibility Levels as a Percent of the Federal Poverty Level
State Type1 Medicaid Income2 2000 2001 2002 2003 2004 2005 2006
California C N 250 250 250 250 250 250 250
New York C N 250 250 250 250 250 250 250
Rhode Island E Y 250 250 250 250 250 250 250
Washington S N 250 250 250 250 250 250 2501Indicates whether the state chose to implement SCHIP as a separate program (S), an expansion of its current Medicaid program (E), or a combination of the two (C)2Indicates yes (Y) if the rules for attributing family income are identical or very similar to Medicaid income determination regulations*A separate state program finances insurance for children in families with incomes exceeding SCHIP levels

Stockley, Walter -22-
Table 3Remainder of States' SCHIP Eligibility Levels as a Percent of the Federal Poverty Level
State Type1 Medicaid Income2 2000 2001 2002 2003 2004 2005 2006
Alabama S N 200 200 200 200 200 200 200Connecticut S Y 300 300 300 300 300 300 300Florida C N 200 200 200 200 200 200 200Georgia S N 235 235 235 235 235 235 235Idaho E Y 150 150 150 150 185 185 185Illinois* C Y 185 185 185 200 200 200 200Iowa C N 200 200 200 200 200 200 200Kentucky C N 200 200 200 200 200 200 200Maryland C N 200 300 300 300 300 300 300Massachusetts* C Y 200 200 200 200 200 200 200Minnesota E Y 275 275 275 275 275 275 275Missouri E N 300 300 300 300 300 300 300Montana E Y 150 150 150 150 150 150 150Nebraska E Y 185 185 185 185 185 185 185Nevada S N 200 200 200 200 200 200 200New Hampshire C Y 300 300 300 300 300 300 300New Jersey C N 350 350 350 350 350 350 350New Mexico E Y 235 235 235 235 235 235 235North Dakota C Y 140 140 140 140 140 140 140Oklahoma E Y 185 185 185 185 185 185 185Oregon S N 170 170 170 185 185 185 185Pennsylvania* S N 200 200 200 200 200 200 200South Carolina E Y 150 150 150 150 150 150 150South Dakota C N 140 200 200 200 200 200 200Tennessee* S Y 133 133 133 133 133 133 250Texas S N 200 200 200 200 200 200 200Vermont S Y 300 300 300 300 300 300 300
1Indicates whether the state chose to implement SCHIP as a separate program (S), an expansion of itscurrent Medicaid program (E), or a combination of the two (C)2Indicates yes (Y) if the rules for attributing family income are identical or very similar to Medicaid incomedetermination regulations*A separate state program finances insurance for children in families with incomes exceeding SCHIP levels

Stockley, Walter -23-
Table 4Summary Statistics of Descriptive Characteristics for children in states that have SCHIP Eligibility Levels (as indicated in Table 1 and Table 2) 200% and 250% of the Federal Poverty Level
Variable MeanStandard Deviation Variable Mean
Standard Deviation
States that cover children up to 200% of the Federal Poverty Limit
States that cover children up to 250% of the Federal Poverty Limit
Male 0.515 0.500 Male 0.505 0.500
Hispanic 0.111 0.314 Hispanic 0.451 0.498
White 0.753 0.431 White 0.798 0.401
Black 0.150 0.357 Black 0.095 0.294
Asian 0.021 0.144 Asian 0.045 0.207
Insured 0.900 0.300 Insured 0.872 0.334
Private Insurance 0.702 0.458 Private Insurance 0.606 0.489
Public Insurance 0.245 0.430 Public Insurance 0.320 0.467
Note: Summary statistics for variables calculated using all related individuals in the house to determine the federal poverty limit cutoff. Sample consists of children 0-18, citizens, and with income between 150-250% of the Federal Poverty Limit.

Stockley, Walter -24-
Table 5Percentage of children having any insurance, private insurance, and public insurance before and after the 200% federal poverty limit
200% States 250% States Difference
Difference in
difference
Below 200% (1)
Above 200%
(2)
Below 200%
(3)
Above 200%
(4)
Difference[(2)-(1)]
(5)
Difference[(4)-(3)]
(6)[(6)-(5)]
(7)
Insured 0.889 0.913 0.861 0.886 0.024 0.025 0.001
(0.003) (0.003) (0.004) (0.004) (0.004) (0.006) (0.003)
Private Insurance 0.647 0.764 0.536 0.692 0.118 0.156 0.038
(0.004) (0.004) (0.006) (0.006) (0.006) (0.008) (0.005)
Public Insurance 0.300 0.184 0.383 0.243 -0.116 -0.140 -0.024
(0.004) (0.003) (0.006) (0.005) (0.005) (0.008) (0.004)
Sample Sizes: 13963 12281 7769 6295 26244 14064 40308
Notes: Standard errors are in parentheses. The states with public insurance coverage up to 200% above the Federal Poverty limit constitute the treatment group. The control group is states with public insurance coverage up to 250% above the Federal Poverty limit. Income limits calculated based on all related family members in the household.

Stockley, Walter -25-
Table 6
Dependent VariableAll forms Insurance
(1)Private Insurance
(2)Public Insurance
(3)
Male 0.003 -0.001 0.013(0.007) (0.011) (0.010)
Age -0.003 0.002 -0.006(0.001) (0.001) (0.001)
Age*Male 0.000 0.000 -0.001(0.001) (0.001) (0.001)
Hispanic -0.053 -0.171 0.122(0.006) (0.008) (0.007)
White 0.015 0.108 -0.077(0.010) (0.013) (0.012)
Black -0.002 0.021 0.007(0.011) (0.015) (0.014)
Asian 0.016 0.105 -0.080(0.014) (0.021) (0.019)
Federal Poverty Level 0.025 0.025 -0.018(0.014) (0.020) (0.019)
Federal Poverty Level^2 0.000 0.000 0.000(0.000) (0.000) (0.000)
Federal Poverty Level^3 0.000 0.000 0.000(0.000) (0.000) (0.000)
Above 200% of the Federal Poverty Level -0.004 -0.029 0.013(0.011) (0.015) (0.014)
-0.002 0.025 -0.009(0.008) (0.011) (0.010)
Constant -0.762 -1.575 2.033(0.916) (1.285) (1.211)
Sample Size 40308 40308 40308
R2 0.017 0.072 0.064
Notes: The dependent variable is (1) insurance (2) private insurance or (3) public insurance. Standard errors are in parentheses. The omitted race is other.
Regression impact of higher eligibility on increased insurance rates, private insurance, and public insurance for children 0-18
Above 200% Federal Poverty Level *States with Cutoff at 250% of Federal Poverty Level