starbucks 2000ar_financial
36
Letter to Shareholders starbucks coffee company P. 17 To our Shareholders, We entered the new Millennium with a great sense of accomplishment and excitement, knowing that we were poised to share the Starbucks Experience with even more people around the world. Today, the anticipation we experienced as we began fiscal year 2000 has been more than fulfilled, thanks to the passion and dedication of our partners (employees), our unwavering commitment to the highest quality coffee, and the connection that we are fortunate to enjoy with our customers. We believe that the possibilities for our future achievements are virtually limitless, and we are even more inspired to climb to greater heights. These are still the early days of building our company and the Starbucks brand. Starbucks experienced tremendous success and growth in fiscal year 2000. We had record revenues of $2.2 billion for the year. Our stellar performance included three consecutive quarters of double-digit comparable store sales increases - an amazing achievement for any retail company of our size and maturity, culminating in a 9 percent comparable stores sales growth for the full year, the highest it has been since 1995. We far exceeded our projected target of 600 new store openings for the year, with 1,035 new company- owned and licensed locations worldwide, including 778 stores in North America alone. We surpassed our goal to open 150 international stores, opening 257 international locations by the end of fiscal year 2000. In the United Kingdom, we opened 63 new locations, well ahead of our target of 50 stores. We also entered a number of international markets including Lebanon, the United Arab Emirates, Qatar, Hong Kong, Shanghai and Australia, bringing our total number of international locations to 525 at the end of the fiscal year. During the year we acquired a majority interest in our Thailand operations. We were also thrilled to announce our plans to enter Switzerland, our first market in continental Europe. Our remarkable success in virtually every international market we have entered to date has inspired us to set ambitious targets for the future. We plan to have 650 Starbucks locations throughout Europe by the end of fiscal year 2003, and we believe that customers in the European market will embrace the Starbucks Experience. Our outstanding growth is testimony to the strength of the Starbucks brand worldwide. When we opened our first store in Tokyo, consultants told us that Japanese customers would never use to-go cups or drink coffee while walking on the street. If you visit Japan today, you will see people proudly holding Starbucks cups with the logo facing out. As the result of our customers’ warm acceptance, Starbucks Coffee Japan became profitable in fiscal year 2000 - more than two years ahead of plan. Additionally, we were extremely pleased that Nikkei Restaurant Magazine, one of Japan’s most respected food service industry publications, recognized Starbucks as the most preferred restaurant chain in Tokyo, just four years after our entry into the market. In addition, Interbrand Corporation, the world’s leading brand consultancy, recently ranked Starbucks as one of the top 75 global brands. These accomplishments confirm our belief that we have incredible opportunities ahead. By the end of fiscal year 2000, Starbucks had more than 3,500 locations worldwide, serving more than 12 million customers per week in 17 countries. We believe that in the past we dramatically underestimated the size of the global market and the power of the Starbucks brand. We now believe that we have the potential to have at least 20,000 locations worldwide, with as many as 10,000 locations in international markets.
-
Upload
finance41 -
Category
Economy & Finance
-
view
943 -
download
0
Transcript of starbucks 2000ar_financial
L e t t e r t o S h a r e h o l d e r s s t a r b u c k s c o f f e e c o m p a n y P. 1 7
To our Shareholders,
We entered the new Millennium with a great sense of accomplishment and excitement, knowing thatwe were poised to share the Starbucks Experience with even more people around the world. Today, theanticipation we experienced as we began fiscal year 2000 has been more than fulfilled, thanks to thepassion and dedication of our partners (employees), our unwavering commitment to the highestquality coffee, and the connection that we are fortunate to enjoy with our customers. We believe thatthe possibilities for our future achievements are virtually limitless, and we are even more inspired toclimb to greater heights. These are still the early days of building our company and the Starbucks brand.
Starbucks experienced tremendous success and growth in fiscal year 2000. We had record revenues of $2.2 billion for the year. Our stellar performance included three consecutive quarters ofdouble-digit comparable store sales increases - an amazing achievement for any retail company of oursize and maturity, culminating in a 9 percent comparable stores sales growth for the full year, thehighest it has been since 1995.
We far exceeded our projected target of 600 new store openings for the year, with 1,035 new company-owned and licensed locations worldwide, including 778 stores in North America alone. We surpassedour goal to open 150 international stores, opening 257 international locations by the end of fiscalyear 2000. In the United Kingdom, we opened 63 new locations, well ahead of our target of 50stores. We also entered a number of international markets including Lebanon, the United ArabEmirates, Qatar, Hong Kong, Shanghai and Australia, bringing our total number of internationallocations to 525 at the end of the fiscal year. During the year we acquired a majority interest in ourThailand operations. We were also thrilled to announce our plans to enter Switzerland, our firstmarket in continental Europe. Our remarkable success in virtually every international market wehave entered to date has inspired us to set ambitious targets for the future. We plan to have 650Starbucks locations throughout Europe by the end of fiscal year 2003, and we believe that customersin the European market will embrace the Starbucks Experience.
Our outstanding growth is testimony to the strength of the Starbucks brand worldwide. When weopened our first store in Tokyo, consultants told us that Japanese customers would never use to-gocups or drink coffee while walking on the street. If you visit Japan today, you will see people proudlyholding Starbucks cups with the logo facing out. As the result of our customers’ warm acceptance,Starbucks Coffee Japan became profitable in fiscal year 2000 - more than two years ahead of plan.Additionally, we were extremely pleased that Nikkei Restaurant Magazine, one of Japan’s most respectedfood service industry publications, recognized Starbucks as the most preferred restaurant chain inTokyo, just four years after our entry into the market. In addition, Interbrand Corporation, theworld’s leading brand consultancy, recently ranked Starbucks as one of the top 75 global brands.These accomplishments confirm our belief that we have incredible opportunities ahead.
By the end of fiscal year 2000, Starbucks had more than 3,500 locations worldwide, serving morethan 12 million customers per week in 17 countries. We believe that in the past we dramaticallyunderestimated the size of the global market and the power of the Starbucks brand. We now believethat we have the potential to have at least 20,000 locations worldwide, with as many as 10,000locations in international markets.
P. 1 8 s t a r b u c k s c o f f e e c o m p a n y L e t t e r t o S h a r e h o l d e r s
Our core retail business in North America continues to thrive. We introduced the sumptuousWhite Chocolate Mocha and Caramel Apple Cider drinks early in the year, followed by two decadent new blended beverages for summer – Chocolate Brownie Frappuccino ® and OrangeMocha Chip Frappuccino ®. These popular additions to our menu provided our customers withdelightful indulgences for every season. We also introduced the Starbucks Barista AromaA ™coffeemaker and thermal carafe – an instant hit with customers. And our positioning for Holiday2000, “Home for the Holidays,” offered simple, traditional messaging designed to capture ourcustomers’ hearts. In addition to festive favorites such as the Eggnog Latte and our uniqueChristmas Blend coffee, we introduced the delectable Gingerbread Latte to bring alive the flavorof the season. We also created and unveiled the revolutionary Starbucks Barista Utopia™ vacuumcoffee brewing system. This stylish, innovative machine brews the perfect cup of Starbucks ® coffeefor our customers to savor at home. Customers gave the Utopia a very enthusiastic reception, andwe were delighted by its success.
This was a pivotal year for two Starbucks brands that complement the coffeehouse experience –Tazo® tea and Hear Music™. In fiscal year 2000, Tazo Tea crafted and introduced a new line of filter bag and full-leaf teas to tempt customers’ palates. Our customers also enjoyed anenhanced music program through Hear Music’s displays and branded compilation discs. These twoemerging brands are positioned for strong growth, and they add to the richness and texture of the Starbucks Experience.
One mark of a great company is its ability to choose business partners who reflect its core values and guiding principles. Our Business Alliances group, part of our specialty operations, created andnurtured relationships that reach more than 20 million customers per month by providingincreased access and visibility to the Starbucks brand. During the year, we signed licensing agreements with several key accounts, including Albertson’s, Inc., Safeway Inc., Dayton HudsonCorporation (Super Target stores) and Marriott International, Inc. Our achievements to date haveextended the Starbucks brand and created significant momentum for our future growth. We areconfident that we have the potential to open many more licensed locations in grocery stores, airports and other convenient venues.
We also announced an exciting alliance with The New York Times, which recently became the exclusivenationwide newspaper sold in all of our company-owned locations in the United States. As part ofthis strategic three-year agreement, The Times will use its advertising resources to promote theStarbucks brand. We are proud to team up with The Times to provide our customers with one of theworld’s most widely read and respected newspapers.
Even in the best years, we face challenges. In the fourth quarter, we took a non-cash write-downof our entire investment in living.com Inc. and the majority of our equity positions inKozmo.com, Inc., Cooking.com, Inc. and Talk City, Inc. to reflect fair value. We have learnedfrom this experience and we believe this knowledge will benefit our business going forward.Starbucks is an entrepreneurial company, and we have achieved extraordinary benefits from courageousand innovative business practices. That spirit and practice of innovation will continue. However, weremain focused on our core business, and we realize that the growth potential within that core businessis far greater than even we previously imagined. Going forward, we will pursue only those opportunitiesthat we feel will complement our core operations.

L e t t e r t o S h a r e h o l d e r s s t a r b u c k s c o f f e e c o m p a n y P. 1 9
Our people are crucial to ensuring that we deliver the Starbucks Experience every day. The passion theybring to our customers is one of our greatest assets. To ensure that our partners share in Starbuckssuccess, we provided stock option grants to eligible partners under the Bean Stock Plan for the 10thconsecutive year. Our ongoing commitment to providing a great work environment has also had manypositive impacts on our partners and customers. One indication of our collective passion is the dedicationand team spirit displayed by partners at our LaBrea & San Vicente store (opened through our alliance withEarvin “Magic” Johnson). The morning after these outstanding partners won the fourth largest lottery jackpot in California history, they chose to come to work and cheerfully opened the store at 5:30 a.m. toserve their customers.
Starbucks long-term success as a company will be measured in part by our ability to be a responsibleglobal citizen. As part of our ongoing efforts to address social and environmental issues in coffee-origin countries, we committed to a year-round offering of shade grown, organic or Fair Tradecertified coffees. We launched this Commitment to Origins™ category with Shade Grown Mexicocoffee in collaboration with Conservation International, and we were proud to introduce Fair TradeCertified coffee to our customers through a new alliance with TransFair USA. In addition, wesignificantly increased our commitment to provide financial support for ConservationInternational’s work to protect global biodiversity. Starbucks also continues to be one of the largestNorth American contributors to CARE, the international aid and development organization, and weare honored to support their work to improve the lives of people in coffee origin countries.
We are also deeply committed to bringing the joy of reading to people around the world. TheStarbucks Foundation assisted more than 100 organizations in fiscal year 2000 by providing morethan $1 million in literacy grants in North America. We also extended the program to include initiatives in New Zealand, Thailand and the Philippines. In addition, we held our fourth annualAll Books for Children drive, through which we collected more than 335,000 books for schools andliteracy programs.
Our joint venture with Earvin “Magic” Johnson’s Johnson Development Corporation to open StarbucksCoffee stores in under-served urban neighborhoods continues to enrich lives and contribute positivelyto the communities in which the stores operate. During fiscal year 2000 we opened 11 new stores in sixstates in the United States through this unique joint venture.
We each assumed new leadership roles in fiscal year 2000 that were designed to leverage ourrespective skills and experience in our growing and dynamic company. We feel that our transitionhas been seamless, and we are more confident than ever that the Starbucks brand has tremendousopportunities ahead. We are humbled by Starbucks success. The achievements of the past inspireus to continue this amazing journey together as we strive towards our goal of becoming a great,enduring global brand.
For all of you who bring Starbucks to life, thank you for your ongoing support.
Warm regards,
H o w a r d S c h u l t z O r i n C . S m i t hchairman and chie f g lobal s t rateg i s t pres ident and chie f execut ive of f i cer

Business
Starbucks Corporation and its subsidiaries (collectively “Starbucks” or the “Company”) purchases androasts high quality whole bean coffees and sells them, along with fresh, rich-brewed coffee, Italian-style espresso beverages, cold blended beverages, a variety of pastries and confections, coffee-related accessories and equipment, and a line of premium teas, primarily through its Company-operatedretail stores. In addition to sales through its Company-operated retail stores, Starbucks sells coffeeand tea products through other channels of distribution (collectively, “specialty operations”).Starbucks, through its joint venture partnerships, also produces and sells bottled Frappuccino®
coffee drink and a line of premium ice creams. The Company’s objective is to establish Starbucks asthe most recognized and respected brand in the world. To achieve this goal, the Company plans tocontinue to rapidly expand its retail operations, grow its specialty operations and selectively pursueother opportunities to leverage the Starbucks brand through the introduction of new products and thedevelopment of new distribution channels.
The Company’s retail goal is to become the leading retailer and brand of coffee in each of its targetmarkets by selling the finest quality coffee and related products and by providing superior customerservice, thereby building a high degree of customer loyalty. Starbucks strategy for expanding its retailbusiness is to increase its market share in existing markets and to open stores in new markets where the opportunity exists to become the leading specialty coffee retailer. In furtherance of this strategy,the Company opened 490 new stores during the fiscal year ended October 1, 2000 (“fiscal 2000”).At fiscal year end, Starbucks had 2,619 Company-operated stores in 34 states, the District of Columbia and five Canadian provinces (which comprise the Company-operated North American retailoperations), as well as the United Kingdom, Thailand and Australia (which comprise the Company-operated international retail operations). Company-operated retail stores accounted for approximately84% of net revenues during fiscal 2000. The Company intends to finance additional growth in the number of Company-operated retail stores with cash flow from operations.
Starbucks specialty operations strive to develop the Starbucks brand outside the Company-operatedretail store environment through a number of channels. Starbucks strategy for expanding its specialtyoperations is to reach customers where they work, travel, shop and dine by establishing relationshipswith prominent third parties who share Starbucks values and commitment to quality. These relationshipstake various forms, including retail store licensing agreements, wholesale accounts, grocery channellicensing agreements and joint ventures. Starbucks specialty operations also include direct-to-consumer marketing channels. In certain licensing situations, the licensee is a joint venture in whichStarbucks has an equity ownership interest. During fiscal 2000, specialty revenues (which include royalties and fees from licensees as well as product sales) accounted for approximately 16% of theCompany’s net revenues.
P. 2 0 s t a r b u c k s c o f f e e c o m p a n y

s t a r b u c k s c o f f e e c o m p a n y P. 2 1
Selected Financial DataIn thousands, except earnings per share and store operating data
The following selected financial data have been derived from the consolidated financial statements of theCompany. The data set forth below should be read in conjunction with “Management’s Discussion andAnalysis of Financial Condition and Results of Operations” and the Company’s consolidated financialstatements and notes thereto.
As of and for the Oct 1, 2000 Oct 3, 1999 Sept 27, 1998 Sept 28, 1997 Sept 29, 1996fiscal year ended (1) (52 Wks) (53 Wks) (52 Wks) (52 Wks) (52 Wks)RESULTS OF OPERATIONS DATA Net revenues:
Retail $ 1,823,607 $ 1,423,389 $ 1,102,574 $ 836,291 $ 601,458 Specialty 345,611 256,756 206,128 139,098 96,414
Total net revenues 2,169,218 1,680,145 1,308,702 975,389 697,872 Merger expenses (2) - - 8,930 - - Operating income 212,252 156,711 109,216 86,199 56,575 Internet-related investment losses (3) 58,792 - - - - Gain on sale of investment (4) - - - - 9,218 Net earnings $ 94,564 $ 101,693 $ 68,372 $ 55,211 $ 41,710 Net earnings per common share -diluted (5) $ 0.49 $ 0.54 $ 0.37 $ 0.33 $ 0.27 Cash dividends per share - - - - - BALANCE SHEET DATAWorking capital $ 146,568 $ 135,303 $ 157,805 $ 172,079 $ 239,365 Total assets 1,493,131 1,252,514 992,755 857,152 729,227 Long-term debt (including current portion) 7,168 7,691 1,803 168,832 167,980 Shareholders’ equity 1,148,399 961,013 794,297 533,710 454,050 STORE OPERATING DATA Comparable store sales (6) 9% 6% 5% 5% 7%Stores open at year-end:
Continental North America:Company-operated stores 2,446 2,038 1,622 1,270 929 Licensed stores 530 179 133 94 75
International:Company-operated stores 173 97 66 31 9 Licensed stores 352 184 65 17 2
Total stores 3,501 2,498 1,886 1,412 1,015
(1) The Company’s fiscal year ends on the Sunday closest to September 30. All fiscal years presented include 52 weeks, except fiscal 1999 which includes 53 weeks.
(2) Merger expenses relate to the business combination with Seattle Coffee Holdings Limited in fiscal 1998.(3) Internet-related investment losses consist of write-downs of investments in Kozmo.com, Inc., living.com Inc.,
Cooking.com, Inc. and Talk City, Inc. (4) Gain on sale of investment relates to the sale of Noah’s New York Bagels, Inc. stock in fiscal 1996. (5) Diluted earnings per share is based on the weighted average number of shares and common stock units outstanding
during the period. In addition, the presentation of diluted earnings per share includes the dilutive effect of commonstock equivalents consisting of certain shares subject to stock options and assumes conversion of the Company’s formerlyoutstanding convertible subordinated debentures using the “if converted” method when such securities were dilutive, with net income adjusted for the after-tax interest expense and amortization applicable to these debentures. Earnings per share data for fiscal years 1996 through 1998 have been restated to reflect the two-for-one stock split in fiscal 1999.
(6) Percentage growth of comparable store sales includes only Company-operated stores open 13 months or longer.
Cautionary Statement Pursuant to the Private Securties Litigation Reform Act of 1995 Certain statements set forth in this Annual Report, including anticipated store and market openings,planned capital expenditures and trends in or expectations regarding the Company’s operations, constitute “forward-looking statements” within the meaning of the Private Securities Litigation ReformAct of 1995. Such statements are based on currently available operating, financial and competitiveinformation and are subject to various risks and uncertainties. Actual future results and trends may differ materially depending on a variety of factors, including, but not limited to, coffee and other rawmaterials prices and availability, successful execution of internal performance and expansion plans, theimpact of competition, the effect of legal proceedings and other risks detailed herein and in theCompany’s annual and quarterly filings with the Securities and Exchange Commission.
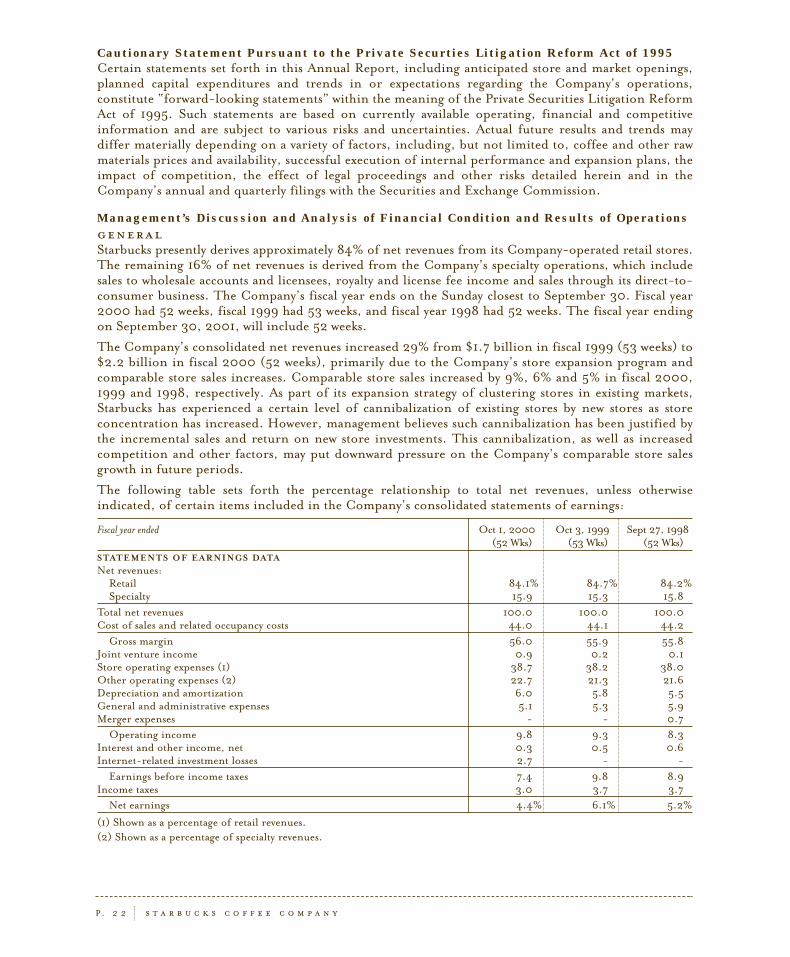
Management’s Discussion and Analysis of Financial Condition and Results of Operations general Starbucks presently derives approximately 84% of net revenues from its Company-operated retail stores.The remaining 16% of net revenues is derived from the Company’s specialty operations, which includesales to wholesale accounts and licensees, royalty and license fee income and sales through its direct-to-consumer business. The Company’s fiscal year ends on the Sunday closest to September 30. Fiscal year2000 had 52 weeks, fiscal 1999 had 53 weeks, and fiscal year 1998 had 52 weeks. The fiscal year endingon September 30, 2001, will include 52 weeks.
The Company’s consolidated net revenues increased 29% from $1.7 billion in fiscal 1999 (53 weeks) to$2.2 billion in fiscal 2000 (52 weeks), primarily due to the Company’s store expansion program andcomparable store sales increases. Comparable store sales increased by 9%, 6% and 5% in fiscal 2000,1999 and 1998, respectively. As part of its expansion strategy of clustering stores in existing markets,Starbucks has experienced a certain level of cannibalization of existing stores by new stores as store concentration has increased. However, management believes such cannibalization has been justified bythe incremental sales and return on new store investments. This cannibalization, as well as increasedcompetition and other factors, may put downward pressure on the Company’s comparable store salesgrowth in future periods.
The following table sets forth the percentage relationship to total net revenues, unless otherwise indicated, of certain items included in the Company’s consolidated statements of earnings:
Fiscal year ended Oct 1, 2000 Oct 3, 1999 Sept 27, 1998(52 Wks) (53 Wks) (52 Wks)
STATEMENTS OF EARNINGS DATANet revenues:
Retail 84.1% 84.7% 84.2%Specialty 15.9 15.3 15.8
Total net revenues 100.0 100.0 100.0Cost of sales and related occupancy costs 44.0 44.1 44.2
Gross margin 56.0 55.9 55.8Joint venture income 0.9 0.2 0.1Store operating expenses (1) 38.7 38.2 38.0Other operating expenses (2) 22.7 21.3 21.6Depreciation and amortization 6.0 5.8 5.5General and administrative expenses 5.1 5.3 5.9Merger expenses - - 0.7
Operating income 9.8 9.3 8.3Interest and other income, net 0.3 0.5 0.6Internet-related investment losses 2.7 - -
Earnings before income taxes 7.4 9.8 8.9Income taxes 3.0 3.7 3.7
Net earnings 4.4% 6.1% 5.2%
(1) Shown as a percentage of retail revenues. (2) Shown as a percentage of specialty revenues.
P. 2 2 s t a r b u c k s c o f f e e c o m p a n y
business combinations During fiscal 2000, Starbucks acquired the outstanding stock of Tympanum, Inc. (d/b/a “Hear Music”),a music retailer, and of Coffee Partners Co. Ltd., the company licensed to operate Starbucks stores inThailand (“Thailand Operations”). The combined purchase price for these two acquisitions was $14.1million. During fiscal 1999, Starbucks acquired the net assets of Tazo, L.L.C., a Portland, Oregon-based tea company that produces premium tea products, and the stock of Pasqua Inc., a San Francisco,California-based roaster and retailer of specialty coffee. The combined purchase price for these twoacquisitions was $16.5 million. All of the above acquisitions were accounted for under the purchasemethod of accounting. Results of operations of the acquired companies are included on the accompanyingconsolidated financial statements from the dates of acquisition. During fiscal 1998, Starbucks acquiredthe United Kingdom-based Seattle Coffee Holdings Limited (“Seattle Coffee Company”) in a pooling-of-interests transaction (the “Transaction”). In conjunction with the Transaction, Starbucks recordedpre-tax charges of $8.9 million in direct merger costs and $6.6 million in other charges associated with the integration of Seattle Coffee Company. The historical financial statements for theperiods prior to the Transaction were restated as though the companies had always been combined.
results of operations — fiscal 2000 compared to fiscal 1999Systemwide Retai l Store Sales Systemwide retail store sales, which include net sales for both Company-operated and licensed retailstores, were $2.3 billion for fiscal 2000 (52 weeks) an increase of 38% from $1.6 billion in fiscal 1999 (53 weeks), primarily due to the opening of an additional 1,035 stores. Systemwide retail store sales provides a broader perspective of global brand sales; however, it excludes net revenues from non-retail channels.
R e v e n u e s Consolidated net revenues increased 29% to $2.2 billion for fiscal 2000, compared to $1.7 billion forfiscal 1999. Retail revenues increased 28% to $1.8 billion from $1.4 billion. The increase in retail revenues was due to the addition of new Company-operated stores and comparable store sales growth of9%. The increase in comparable store sales resulted from a 5% increase in the number of transactionsand a 4% increase in the average dollar value per transaction. During fiscal 2000, the Company opened417 stores in continental North America, 63 stores in the United Kingdom, eight in Thailand and twoin Australia. As of fiscal year-end, there were 2,446 Company-operated stores in continental NorthAmerica, 156 in the United Kingdom, 15 in Thailand and two in Australia. During fiscal 2001, the Company expects to open at least 450 Company-operated stores in North America and 75 in international markets.
Specialty revenues increased 35% to $346 million for fiscal 2000 from $257 million for fiscal 1999.The increase was driven primarily by higher sales to licensees, grocery channel and food service accounts.Licensees (including those in which the Company is a joint venture partner) opened 361 stores in continental North America, of which over 280 stores related to the Company’s expansion into grocerystores, and 184 stores in international markets. The Company ended the year with 530 licensed storesin continental North America and 352 licensed stores in international markets. During fiscal 2001, theCompany expects to open at least 575 licensed stores.
s t a r b u c k s c o f f e e c o m p a n y P. 2 3

G r o s s M a r g i nGross margin increased to 56.0% of net revenues for fiscal 2000 from 55.9% in fiscal 1999. The positive impact on gross margin of lower green coffee costs and retail beverage sales price increases waspartially offset by higher retail occupancy costs. Occupancy costs, which are primarily fixed costs, werehigher as a percentage of revenue due, in part, to one less week of sales in fiscal 2000. Also, occupancycosts have increased as a result of higher average rent expense per square foot as well as the expansion ofCompany-operated stores into international markets that have higher occupancy costs as a percentage ofrevenue than North American retail operations.
J o i n t Ve n t u r e I n c o m e The Company has two joint ventures to produce and distribute Starbucks branded products. The NorthAmerican Coffee Partnership is a 50/50 joint venture partnership with the Pepsi-Cola Company todevelop and distribute bottled Frappuccino® coffee drink. The Starbucks Ice Cream Partnership is a 50/50 joint venture partnership with Dreyer’s Grand Ice Cream, Inc. to develop and distribute premium ice creams.
The Company is a partner in several other joint ventures that operate licensed Starbucks retail stores,including Starbucks Coffee Japan Limited, a 50/50 joint venture partnership with a Japanese retailerand restauranteur, SAZABY Inc., to develop Starbucks retail stores in Japan.
Joint venture income was $20.3 million for fiscal 2000, compared to $3.2 million for fiscal 1999. The increase was primarily due to the crossover from losses to profitability of Starbucks Coffee JapanLimited as a result of an increase in scale, and due to the improved profitability of the North AmericanCoffee Partnership.
E x p e n s e s Store operating expenses as a percentage of retail revenues increased to 38.7% for fiscal 2000 from 38.2%for fiscal 1999. The increase was due to a number of factors. Higher average wage rates combined with acontinuing shift in retail sales to more labor-intensive handcrafted beverages resulted in higher payroll-related expenditures. This shift in retail sales mix also resulted in increased maintenance on store equipment.Provision for losses on asset disposals increased due to store remodel costs associated with the expansion oflunch programs and computer system upgrades. These increases were partially offset by leverage gained fromretail beverage sales price increases and reductions in advertising expenses.
Other operating expenses (expenses associated with all operations other than Company-operated retailstores) were 22.7% of specialty revenues during fiscal 2000, compared to 21.3% for fiscal 1999. Thisincrease was primarily due to higher payroll-related expenditures for accelerating the growth of theCompany’s specialty businesses.
Depreciation and amortization was 6.0% of net revenues, compared to 5.8% of net revenues for fiscal1999. Excluding the extra week of sales in fiscal 1999, depreciation and amortization would have been5.9% of net revenues in fiscal 1999.
General and administrative expenses were 5.1% of net revenues during fiscal 2000, compared to 5.3%for fiscal 1999 primarily due to lower payroll-related expenses as a percentage of net revenues.
P. 2 4 s t a r b u c k s c o f f e e c o m p a n y
I n t e r n e t - R e l a t e d I n v e s t m e n t L o s s e s During fiscal 2000 and 1999, the Company made several minority investments in companies that derivethe majority of their revenue from Internet-related activities.
In fiscal 1999, the Company invested $8 million in Talk City, Inc. (“Talk City”), a publicly traded interactive online chat site. The Company also invested $20 million in living.com Inc. (“living.com”),an online furniture retailer. Also in fiscal 1999, the Company established an alliance with Cooking.com,Inc. (“Cooking.com”), a privately held web-based retailer of cookware, accessories and specialty foodsand provider of information about cooking. As part of this alliance, the Company made a $10 millioninvestment in Cooking.com.
In the second quarter of fiscal 2000, the Company invested $25 million in Kozmo.com, Inc.(“Kozmo.com”), an Internet-to-door delivery service for food, entertainment and convenience items.Starbucks and Kozmo.com also entered into a commercial agreement to provide in-store return boxesin Starbucks stores in exchange for cash, a channel for selling the Company’s products and other marketing opportunities. In connection with this agreement, Starbucks received a $15 million paymentthat is being recognized as revenue on a straight-line basis over twelve months. The Company does notexpect to continue recording revenue from the current Kozmo.com relationship after February 2001.
During the fourth quarter of fiscal 2000, the Company determined that its investments in Internet-related companies had experienced declines in value that were other than temporary. As a result, theCompany recognized losses totaling $59 million to reduce its investments in living.com, Talk City,Cooking.com and Kozmo.com to their aggregate fair value of $5 million as of October 1, 2000.
I n c o m e Ta x e s The Company’s effective tax rate for fiscal 2000 was 41.1% compared to 38.0% for fiscal 1999. Theincrease was due to the establishment of a valuation allowance against a portion of the Internet-relatedinvestment losses which management has determined may ultimately not be realizable for tax purposes.Excluding the effect of these losses, the effective tax rate for fiscal 2000 was 37.6%. Management expectstax planning efforts to lower the effective tax rate to approximately 37.0% in fiscal 2001.
results of operations — fiscal 1999 compared to fiscal 1998S y s t e m w i d e R e t a i l S t o r e S a l e sSystemwide retail store sales, which include net sales for both company-operated and licensed retailstores, were $1.6 billion for fiscal 1999 (53 weeks), up 37% from $1.2 billion in fiscal 1998 (52 weeks)primarily due to the opening of an additional 625 stores.
R e v e n u e s Consolidated net revenues increased 28% to $1.7 billion for fiscal 1999, compared to $1.3 billion forfiscal 1998. Retail revenues increased 29% to $1.4 billion from $1.1 billion. The increase in retail revenues was due to the addition of new Company-operated stores, comparable store sales growth of 6%and sales for the 53rd week of the fiscal year. The increase in comparable store sales resulted from a 5%increase in the number of transactions and a 1% increase in the average dollar value per transaction.During fiscal 1999, the Company opened 424 stores in continental North America and 36 stores in theUnited Kingdom. As of fiscal year-end, there were 2,038 Company-operated stores in continentalNorth America and 97 in the United Kingdom.
Specialty revenues increased 25% to $257 million for fiscal 1999 from $206 million for fiscal 1998. Theincrease was driven primarily by higher sales to licensees and joint ventures and business dining customers. Licensees (including those in which the Company is a joint venture partner) opened 44stores in continental North America and 121 stores in international markets. The Company ended the yearwith 179 licensed stores in continental North America and 184 licensed stores in international markets.
s t a r b u c k s c o f f e e c o m p a n y P. 2 5

G r o s s M a r g i n Gross margin increased to 55.9% for fiscal 1999 from 55.8% in fiscal 1998. The positive impact on grossmargin of lower green coffee costs was partially offset by lower gross margins associated with a change inthe Company’s strategy for the grocery channel. In late fiscal 1998, the Company signed a long-termlicensing agreement with Kraft Foods, Inc. (“Kraft”) to handle the U.S. distribution, marketing andadvertising for Starbucks whole bean and ground coffee in grocery, warehouse club and mass merchandisestores. The transition to Kraft occurred in the first quarter of fiscal 1999.
J o i n t Ve n t u r e I n c o m e Joint venture income was $3.2 million for fiscal 1999, compared to $1.0 million for fiscal 1998. Theincrease was primarily due to the improved profitability from the North American Coffee Partnershipand from Starbucks Coffee Japan Limited.
E x p e n s e s Store operating expenses as a percentage of retail sales increased to 38.2% for fiscal 1999 from 37.5%for fiscal 1998, excluding costs associated with the Transaction. This was due primarily to higher payroll-related expenditures resulting from both an increase in average hourly wage rates and a continuing shiftin sales to handcrafted beverages, which are more labor intensive. Including the Transaction costs, storeoperating expenses for fiscal 1998 were 38.0% of retail sales.
Other operating expenses were 21.3% of specialty revenues during fiscal 1999, compared to 21.6% forfiscal 1998. This decrease was attributable to lower operating expenses associated with the grocery channelafter the transition to Kraft, partially offset by higher payroll-related expense supporting other channels.
Depreciation and amortization was 5.8% of net revenues, compared to 5.5% of net revenues for fiscal1998, primarily due to depreciation on new information systems put into service in late fiscal 1998 andduring fiscal 1999. General and administrative expenses were 5.3% of net revenues during fiscal 1999compared to 5.9% for fiscal 1998, primarily due to proportionately lower payroll-related expenses.
I n c o m e Ta x e s The Company’s effective tax rate for fiscal 1999 was 38.0% compared to 41.2% for fiscal 1998. Theeffective tax rate in fiscal 1998 was impacted by non-deductible losses of Seattle Coffee Company priorto the Transaction. Fiscal 1998’s rate was also affected by Transaction-related costs.
Liquidity and Capital Resources The Company ended fiscal 2000 with $132.2 million in total cash and short-term investments. Workingcapital as of October 1, 2000, totaled $146.6 million compared to $135.3 million as of October 3,1999. Cash and cash equivalents increased by $4.4 million during fiscal 2000 to $70.8 million atOctober 1, 2000. This increase was in addition to an increase in short-term investments of $10.0 million during the same period.
Cash provided by operating activities for fiscal 2000 totaled $318.6 million and resulted primarily from net earnings of $299.0 million before non-cash charges. Accrued compensation and related costscontributed $31.0 million, primarily due to accrued bonus increases resulting from the financial performance of the Company’s core businesses. In addition, deferred revenue increased mainly fromthe commercial agreement with Kozmo.com. Higher international accounts receivable, which are generally outstanding for longer periods of time than domestic receivables, and higher receivables fromlicensees resulted in an increased use of cash.
P. 2 6 s t a r b u c k s c o f f e e c o m p a n y

Cash used by investing activities for fiscal 2000 totaled $373.2 million. This included capital additionsto property, plant and equipment of $316.5 million related to opening 490 new Company-operatedretail stores, remodeling certain existing stores, enhancing information systems, purchasing roastingand packaging equipment for the Company’s roasting and distribution facilities and expanding existingoffice space. The Company also used $35.5 million primarily to make minority investments inKozmo.com and Cooking.com. The purchases of Hear Music and the Thailand operations used $13.5million. The Company invested excess cash primarily in short-term, investment-grade marketable debtsecurities. The net activity in the Company’s marketable securities portfolio during fiscal 2000 used$10.5 million. During fiscal 2000, the Company made equity investments of $8.5 million in its international joint ventures. The Company received $13.7 million in distributions from the NorthAmerican Coffee Partnership, $0.5 million in distributions from the Starbucks Ice Cream Partnershipand $0.1 million from its international joint ventures.
Cash provided by financing activities for fiscal 2000 totaled $59.4 million. This included $58.5 million generated from the exercise of employee stock options and $10.3 million generated from theCompany’s employee stock purchase plan. As options granted under the Company’s stock option plansare exercised, the Company will continue to receive proceeds and a tax deduction; however, neither theamounts nor the timing thereof can be predicted. Checks issued but not presented for payment used$7.5 million.
Cash requirements for fiscal 2001, other than normal operating expenses, are expected to consist primarily of capital expenditures related to the addition of new Company-operated retail stores. TheCompany plans to open at least 525 Company-operated stores during fiscal 2001. The Company alsoanticipates incurring additional expenditures for remodeling certain existing stores and enhancing itsproduction capacity and information systems. While there can be no assurance that current expectationswill be realized, management expects capital expenditures for fiscal 2001 to be approximately $390 million.
Management believes that existing cash and investments plus cash generated from operations should besufficient to finance capital requirements for its core businesses through fiscal 2001. New joint ventures,other new business opportunities or store expansion rates substantially in excess of that presentlyplanned may require outside funding.
Coffee Prices, Availability and General Risk Conditions The supply and price of coffee are subject to significant volatility. Although most coffee trades in thecommodity market, coffee of the quality sought by the Company tends to trade on a negotiated basis ata substantial premium above commodity coffee prices, depending upon the supply and demand at thetime of purchase. Supply and price can be affected by multiple factors in the producing countries,including weather, political and economic conditions. In addition, green coffee prices have been affectedin the past, and may be affected in the future, by the actions of certain organizations and associationsthat have historically attempted to influence commodity prices of green coffee through agreementsestablishing export quotas or restricting coffee supplies worldwide. The Company’s ability to raise salesprices in response to rising coffee prices may be limited, and the Company’s profitability could beadversely affected if coffee prices were to rise substantially.
The Company enters into fixed-price purchase commitments in order to secure an adequate supply ofquality green coffee and bring greater certainty to the cost of sales in future periods. As of October 1,2000, the Company had approximately $84 million in fixed-price purchase commitments which,together with existing inventory, is expected to provide an adequate supply of green coffee for the majorityof fiscal 2001. The Company believes, based on relationships established with its suppliers in the past,that the risk of non-delivery on such purchase commitments is remote.
s t a r b u c k s c o f f e e c o m p a n y P. 2 7
In addition to fluctuating coffee prices, management believes that the Company’s future results of operations and earnings could be significantly impacted by other factors such as increased competitionwithin the specialty coffee industry, the Company’s ability to find optimal store locations at favorablelease rates, increased costs associated with opening and operating retail stores and the Company’s continued ability to hire, train and retain qualified personnel.
Financial Risk Management The Company is exposed to market risk related to changes in interest rates, equity security prices andforeign currency exchange rates.
interest rate riskThe Company’s available-for-sale portfolio consists mainly of diversified fixed income instruments withaverage maturities of three months. The primary objectives of these investments are to preserve capitaland liquidity without significantly increasing risk to the Company. Available-for-sale securities are ofinvestment grade and are recorded on the balance sheet at fair value with unrealized gains and lossesreported as a separate component of accumulated other comprehensive income. As of October 1, 2000,this portfolio comprised 98% of “Short-term investments” on the accompanying consolidated balancesheet. The Company does not hedge its interest rate exposure.
equity security price riskThe Company has minimal exposure to price fluctuations on equity mutual funds within the tradingportfolio, which comprised the remaining 2% of “Short-term investments” on the accompanying consolidated balance sheet as of October 1, 2000. The trading securities are designated to approximatethe Company’s liability under the Management Deferred Compensation Plan (“MDCP”). A correspondingliability is included in “Accrued compensation and related costs” on the accompanying consolidated balance sheets. These investments are recorded at fair value with unrealized gains and losses recognized in “Interest and other income, net.” The offsetting changes in the MDCP liability are recorded in “General and administrative expenses” on the accompanying consolidated statements of earnings.
The Company also has equity investments in privately held Internet-related companies. These investmentsare inherently risky as the products and services supplied by these companies could be considered in thestart-up or development stages and may never materialize. The Company could lose its entire investmentin these companies. During fiscal 2000, the Company recorded other-than-temporary write-downs of$59 million. These investments are recorded on the accompanying consolidated balance sheet at a fairvalue of $5 million as of October 1, 2000.
foreign currency exchange riskThe majority of the Company’s revenue, expense and capital purchasing activities are transacted inUnited States dollars. However, because a portion of the Company’s operations consists of activities outside of the United States, the Company has transactions in other currencies, primarily the Canadian dollar, British pound and Japanese yen. Historically, this exposure has had a minimal impact on the Company.
The Company did not hedge foreign currency risk or engage in any other hedging transactions duringfiscal 2000, 1999 or 1998. The Company has entered into forward foreign exchange contracts to hedgeforeign currency risk in fiscal 2001.
P. 2 8 s t a r b u c k s c o f f e e c o m p a n y
Seasonality and Quarterly Results The Company’s business is subject to seasonal fluctuations. Significant portions of the Company’s netrevenues and profits are realized during the first quarter of the Company’s fiscal year, which includes theDecember holiday season. In addition, quarterly results are affected by the timing of the opening of newstores, and the Company’s rapid growth may conceal the impact of other seasonal influences. Because ofthe seasonality of the Company’s business, results for any quarter are not necessarily indicative of theresults that may be achieved for the full fiscal year.
New Accounting Standards In June 1998, the Financial Accounting Standards Board (“FASB”) issued Statement of FinancialAccounting Standards (“SFAS”) No. 133, “Accounting for Derivative Instruments and HedgingActivities.” In June 2000, the FASB issued SFAS No. 138, which amends certain provisions of SFAS 133to clarify four areas causing difficulties in implementation. The amendment included expanding the normal purchase and sale exemption for supply contracts, permitting the offsetting of certain intercompany foreign currency derivatives, thereby reducing the number of third party derivatives, permitting hedge accounting for foreign-currency assets and liabilities and redefining interest rate riskto reduce sources of ineffectiveness. The Company has adopted the provisions of SFAS 133/138 as ofOctober 2, 2000, the first day of fiscal 2001. Adoption of SFAS 133/138 will not have a material impacton the Company’s consolidated results of operations, financial position or cash flows.
In December 1999, the staff of the Securities and Exchange Commission released Staff AccountingBulletin No. 101 (“SAB 101”), “Revenue Recognition,” to provide guidance on the recognition, presentation and disclosure of revenues in financial statements. The Company believes that its revenuerecognition practices are in conformity with the guidelines in SAB 101, as revised, and that this pronouncement will have no material impact on its financial statements.
In March 2000, the FASB released Interpretation No. 44, “Accounting for Certain Transactionsinvolving Stock Compensation: an interpretation of APB Opinion No. 25.” Interpretation No. 44 provides clarification of certain issues, such as the determination of who is an employee, the criteria fordetermining whether a plan qualifies as a non-compensatory plan, the accounting consequence of various modifications to the terms of a previously fixed stock option or award and the accounting for anexchange of stock compensation awards in a business combination. The Company believes that itspractices are in conformity with this guidance, and therefore Interpretation No. 44 has no impact on itsfinancial statements.
In September 2000, the Emerging Issues Task Force (“EITF”) reached a consensus regarding Issue 00-10, “Accounting for Shipping and Handling Fees and Costs,” which requires any shipping and handling costs billed to customers in a sale transaction to be classified as revenue. The Company will adoptIssue 00-10 as of October 2, 2000, and does not expect it to have a material impact on the Company’sconsolidated results of operations.
EITF Issue 00-15, “Classification in the Statement of Cash Flows of the Income Tax Benefit Realized bya Company upon Employee Exercise of a Nonqualified Stock Option,” was adopted by the Company infiscal 2000. Issue 00-15 requires the income tax benefit resulting from the exercise of nonqualifiedstock options to be classified as cash provided by operating activities in the consolidated statements ofcash flows.
s t a r b u c k s c o f f e e c o m p a n y P. 2 9

Consolidated Balance Sheets In thousands, except share data
Oct 1, 2000 Oct 3, 1999ASSETSCurrent assets:
Cash and cash equivalents $ 70,817 $ 66,419Short-term investments 61,336 51,367Accounts receivable, net of allowances of $2,941 and $1,227, respectively 76,385 47,646 Inventories 201,656 180,886Prepaid expenses and other current assets 20,321 19,049Deferred income taxes, net 29,304 21,133Total current assets 459,819 386,500
Joint ventures 52,051 42,718Other investments 3,788 25,342Property, plant and equipment, net 930,759 760,289Other assets 25,403 23,474Goodwill, net 21,311 14,191TOTAL ASSETS $ 1,493,131 $ 1,252,514
LIABILITIES AND SHAREHOLDERS’ EQUITYCurrent liabilities:
Accounts payable $ 73,653 $ 56,108Checks drawn in excess of bank balances 56,332 63,811Accrued compensation and related costs 75,250 43,872Accrued occupancy costs 29,117 23,017Accrued taxes 35,841 30,752Other accrued expenses 35,053 32,480Deferred revenue 7,320 484Current portion of long-term debt 685 673Total current liabilities 313,251 251,197
Deferred income taxes, net 21,410 32,886Long-term debt 6,483 7,018Minority interest 3,588 400Shareholders’ equity:
Common stock — Authorized, 300,000,000 shares; issued andoutstanding, 188,157,651 and 183,282,095 shares, respectively(includes 848,550 common stock units in both years) 750,872 651,020
Retained earnings 408,503 313,939Accumulated other comprehensive loss (10,976) (3,946)Total shareholders’ equity 1,148,399 961,013
TOTAL LIABILITIES AND SHAREHOLDERS’ EQUITY $ 1,493,131 $ 1,252,514
See Notes to Consolidated Financial Statements.
P. 3 0 s t a r b u c k s c o f f e e c o m p a n y

Consolidated Statements of Earnings In thousands, except earnings per share
Fiscal year ended Oct 1, 2000 Oct 3, 1999 Sept 27, 1998Net revenues:
Retail $ 1,823,607 $ 1,423,389 $ 1,102,574 Specialty 345,611 256,756 206,128
Total net revenues 2,169,218 1,680,145 1,308,702Cost of sales and related occupancy costs 953,560 741,010 578,483Gross margin 1,215,658 939,135 730,219Joint venture income 20,300 3,192 1,034Store operating expenses 704,898 543,572 418,476Other operating expenses 78,374 54,566 44,513Depreciation and amortization 130,232 97,797 72,543General and administrative expenses 110,202 89,681 77,575Merger expenses - - 8,930 Operating income 212,252 156,711 109,216Interest and other income, net 7,110 7,315 7,134 Internet-related investment losses 58,792 - -Earnings before income taxes 160,570 164,026 116,350Income taxes 66,006 62,333 47,978
Net earnings $ 94,564 $ 101,693 $ 68,372Net earnings per common share — basic $ 0.51 $ 0.56 $ 0.39Net earnings per common share — diluted $ 0.49 $ 0.54 $ 0.37Weighted average shares outstanding:
Basic 185,595 181,842 176,110 Diluted 192,999 188,531 183,771
See Notes to Consolidated Financial Statements.
s t a r b u c k s c o f f e e c o m p a n y P. 3 1

Consolidated Statements of Cash Flows In thousands
Fiscal year ended Oct 1, 2000 Oct 3, 1999 Sept 27, 1998OPERATING ACTIVITIES:Net earnings $ 94,564 $ 101,693 $ 68,372Adjustments to reconcile net earnings
to net cash provided by operating activities:Depreciation and amortization 142,171 107,512 80,901Internet-related investment losses 58,792 - -Provision for losses on asset disposals 5,753 2,456 7,234Conversion of compensatory options into common stock - - 1,158Deferred income taxes, net (18,252) 794 2,125Equity in (income) losses of investees (15,139) (2,318) 14Tax benefit from exercise of nonqualified stock options 31,131 18,621 9,332Cash provided (used) by changes in operating assets and liabilities:
Net purchases of trading securities (1,414) - -Accounts receivable (28,235) 3,838 (19,790)Inventories (19,495) (36,405) (23,496)Prepaid expenses and other current assets (700) (7,552) (2,497)Accounts payable 15,561 4,711 4,601Accrued compensation and related costs 30,962 7,586 9,943Accrued occupancy costs 6,007 5,517 5,342Accrued taxes 5,026 12,429 7,173Minority interest 3,188 400 -Deferred revenue 6,836 (53) 209Other accrued expenses 1,818 10,366 1,590
Net cash provided by operating activities 318,574 229,595 152,211
INVESTING ACTIVITIES:Purchase of available-for-sale investments (118,501) (122,800) (51,354)Maturity of available-for-sale investments 58,750 85,053 112,080Sale of available-for-sale investments 49,238 3,633 5,138 Purchase of businesses, net of cash acquired (13,522) (15,662) -Investments in joint ventures (8,473) (10,466) (12,418)Purchases of other investments (35,457) (20,314) -Distributions from joint ventures 14,279 8,983 2,750Additions to property, plant and equipment (316,450) (257,854) (201,855)Additions to other assets (3,096) (6,866) (3,184)Net cash used by investing activities (373,232) (336,293) (148,843)
FINANCING ACTIVITIES:Increase/(decrease) in cash provided by checks drawn in excess of bank balances (7,479) 29,512 4,846Proceeds from sale of common stock under employee stock purchase plan 10,258 9,386 4,649Exercise of stock options 58,463 33,799 20,755Payments on long-term debt (1,889) (1,189) (1,993)Net cash provided by financing activities 59,353 71,508 28,257Effect of exchange rate changes on cash and cash equivalents (297) (54) (88)Net increase/(decrease) in cash and cash equivalents 4,398 (35,244) 31,537CASH AND CASH EQUIVALENTS:Beginning of year 66,419 101,663 70,126End of year $ 70,817 $ 66,419 $ 101,663SUPPLEMENTAL DISCLOSURE OF CASH FLOW INFORMATION:Cash paid during the year for:
Interest $ 411 $ 442 $ 4,130Income taxes 51,856 35,366 32,643
NONCASH FINANCING AND INVESTING TRANSCATIONS:Liabilities assumed in conjunction with the acquisition of land and building - 7,746 -Net unrealized holding gains (losses) on investments (163) 683 (595)Conversion of convertible debt into common stock,
net of unamortized issue costs and accrued interest - - 162,036Common stock tendered in settlement of stock options exercised - - 4,859
See Notes to Consolidated Financial Statements.
P. 3 2 s t a r b u c k s c o f f e e c o m p a n y

Consolidated Statements of Shareholders’ EquityIn thousands, except share data
ACCUMULATEDCOMMON OTHER
STOCK RETAINED COMPREHENSIVESHARES AMOUNT EARNINGS INCOME (LOSS) TOTAL
Balance, September 28, 1997 161,118,046 $ 391,284 $ 143,874 $ (1,448) $ 533,710Net earnings - - 68,372 - 68,372Unrealized holding losses, net - - - (595) (595)Translation adjustment - - - (5,120) (5,120)Comprehensive income 62,657Conversion of convertible debt
into common stock 14,194,054 162,036 - - 162,036Common stock units issued
under deferred stock plan,net of shares tendered 848,550 - - - -
Exercise of stock options,including tax benefit of $9,332 2,834,528 31,245 - - 31,245
Sale of common stock 271,778 4,649 - - 4,649Balance, September 27, 1998 179,266,956 589,214 212,246 (7,163) 794,297
Net earnings - - 101,693 - 101,693Unrealized holding gains, net - - - 683 683Translation adjustment - - - 2,534 2,534Comprehensive income 104,910 Exercise of stock options,
including tax benefit of $18,621 3,522,908 52,420 - - 52,420Sale of common stock 492,231 9,386 - - 9,386
Balance, October 3, 1999 183,282,095 651,020 313,939 (3,946) 961,013Net earnings - - 94,564 - 94,564Unrealized holding losses, net - - - (163) (163)Translation adjustment - - - (6,867) (6,867)Comprehensive income 87,534 Exercise of stock options,
including tax benefit of $31,131 4,471,785 89,594 - - 89,594Sale of common stock 403,771 10,258 - - 10,258
Balance, October 1, 2000 188,157,651 $ 750,872 $ 408,503 $ (10,976) $ 1,148,399
See Notes to Consolidated Financial Statements.
s t a r b u c k s c o f f e e c o m p a n y P. 3 3

Notes to Consolidated Financial Statements Years ended October 1, 2000, October 3, 1999 and September 27, 1998
Note 1: Summary of significant accounting policies description of business Starbucks Corporation and its subsidiaries (collectively “Starbucks” or the “Company”) purchases androasts high quality whole bean coffees and sells them, along with fresh, rich-brewed coffees, Italian-styleespresso beverages, cold blended beverages, a variety of pastries and confections, coffee-related accessories and equipment and a line of premium teas, primarily through its Company-operated retailstores. In addition to sales through its Company-operated retail stores, Starbucks sells coffee and tea products through other channels of distribution (collectively, “specialty operations”). Starbucks, throughits joint venture partnerships, also produces and sells bottled Frappuccino® coffee drink and a line of premium ice creams. The Company’s objective is to establish Starbucks as the most recognized and respected brand in the world. To achieve this goal, the Company plans to continue to rapidly expand its retail operations, grow its specialty operations and selectively pursue other opportunities to leverage the Starbucks brand through the introduction of new products and the development of new distribution channels.
principles of consolidation The consolidated financial statements reflect the financial position and operating results of Starbucks,its subsidiaries and investments in joint ventures in which the Company has significant control. All significant intercompany transactions have been eliminated.
The Company has investments in unconsolidated joint ventures that are accounted for under the equitymethod, as the Company does not exercise control over the operating and financial policies of such jointventures. The Company also has other investments that are accounted for under the cost method.
fiscal year-end The Company’s fiscal year ends on the Sunday closest to September 30. The fiscal years ended October1, 2000 and September 27, 1998 each included 52 weeks. The fiscal year ended October 3, 1999,included 53 weeks.
estimates and assumptions The preparation of financial statements in conformity with accounting principles generally accepted inthe United States of America requires management to make estimates and assumptions that affect thereported amounts of assets, liabilities, revenues and expenses. Actual results may differ from these estimates.
cash and cash equivalents The Company considers all highly liquid instruments with a maturity of three months or less at the timeof purchase to be cash equivalents.
cash management The Company’s cash management system provides for the reimbursement of all major bank disbursementaccounts on a daily basis. Checks issued but not presented for payment to the bank are reflected as “Checksdrawn in excess of bank balances” on the accompanying consolidated financial statements.
short-term investments The Company’s investments consist primarily of investment-grade marketable debt and equity securities,all of which are classified as trading or available-for-sale. Trading securities are recorded at fair value withunrealized holding gains and losses included in earnings. Available-for-sale securities are recorded at fairvalue, and unrealized holding gains and losses are recorded, net of tax, as a separate component of accumulated other comprehensive income. Unrealized losses are charged against net earnings when adecline in fair value is determined to be other than temporary. Realized gains and losses are accounted foron the specific identification method. Purchases and sales are recorded on a trade date basis.
P. 3 4 s t a r b u c k s c o f f e e c o m p a n y

other investments The Company has investments in privately held equity securities that are recorded at their estimated fair values.
fair value of financial instruments The carrying value of cash and cash equivalents approximates fair value because of the short-term maturityof those instruments. The fair value of the Company’s investments in marketable debt and equity securitiesis based upon the quoted market price on the last business day of the fiscal year. The fair value and amortized cost of the Company’s investments (short- and long-term) at October 1, 2000, were $61.3 million and $61.0 million, respectively. The fair value and amortized cost of the Company’s investments atOctober 3, 1999, were $56.4 million and $56.2 million, respectively.
For equity securities of companies that are privately held, or where an observable quoted market pricedoes not exist, the Company estimates fair value using a variety of valuation methodologies. Suchmethodologies include comparing the security with securities of publicly traded companies in similar linesof business, applying revenue multiples to estimated future operating results for the private company and estimating discounted cash flows for that company. For further information on investments,see Notes 4 and 7. The carrying value of long-term debt approximates fair value.
inventories Inventories are stated at the lower of cost (primarily moving average cost) or market.
property, plant and equipment Property, plant and equipment are carried at cost less accumulated depreciation and amortization.Depreciation of property, plant and equipment, which includes amortization of assets under capitalleases, is provided on the straight-line method over estimated useful lives, generally ranging from two toseven years for equipment and 30 to 40 years for buildings. Leasehold improvements are amortized overthe shorter of their estimated useful lives or the related lease life, generally ten years. The portion ofdepreciation expense related to production and distribution facilities is included in “Cost of sales andrelated occupancy costs” on the accompanying consolidated statements of earnings.
goodwill Goodwill resulting from business acquisitions represents the excess purchase price paid over net assets ofbusinesses acquired and is amortized on a straight-line basis over the period of expected benefit, whichranges from ten to twenty years.
long-lived assets When facts and circumstances indicate that the carrying values of long-lived assets, including intangibles,may be impaired, an evaluation of recoverability is performed by comparing the carrying value of the assetsto projected future cash flows in addition to other quantitative and qualitative analyses. Upon indicationthat the carrying value of such assets may not be recoverable, the Company recognizes an impairment lossby a charge against current operations.
revenue recognition Retail store revenues are recognized when payment is tendered at the point of sale. Specialty revenues,consisting mainly of product sales, are generally recognized upon shipment to customers. Initial non-refundable fees required under licensing agreements are earned upon substantial performance ofservices. Royalty revenues based upon a percentage of sales and other continuing fees are recognizedwhen earned. All revenues are recognized net of any discounts.
advertising The Company expenses costs of advertising the first time the advertising campaign takes place, except fordirect-to-consumer advertising, which is capitalized and amortized over its expected period of futurebenefit, generally six to twelve months. Net capitalized direct-to-consumer advertising costs were $0.2million and $2.5 million as of October 1, 2000 and October 3, 1999, respectively, and are included in“Prepaid expenses and other current assets” on the accompanying consolidated balance sheets. Totaladvertising expenses, recorded in “Store operating expenses” and “Other operating expenses” on the accompanying consolidated statements of earnings, were $32.6 million, $38.4 million and $31.4million in 2000, 1999, and 1998, respectively.
s t a r b u c k s c o f f e e c o m p a n y P. 3 5
store preopening expenses Costs incurred in connection with the start-up and promotion of new store openings are expensed as incurred.
rent expense Certain of the Company’s lease agreements provide for scheduled rent increases during the lease termsor for rental payments commencing at a date other than the date of initial occupancy. Minimum rentalexpenses are recognized on a straight-line basis over the terms of the leases.
foreign currency translation The Company’s international operations use their local currency as their functional currency. Assets andliabilities are translated at exchange rates in effect at the balance sheet date. Income and expense accountsare translated at the average monthly exchange rates during the year. Resulting translation adjustmentsare recorded as a separate component of accumulated other comprehensive income.
income taxes The Company computes income taxes using the asset and liability method, under which deferred incometaxes are provided for the temporary differences between the financial reporting basis and the tax basisof the Company’s assets and liabilities.
stock split On March 19, 1999, the Company effected a two-for-one stock split for its holders of record on March5, 1999. All applicable share and per-share data in these consolidated financial statements have beenrestated to give effect to this stock split.
earnings per share The computation of basic earnings per share is based on the weighted average number of shares andcommon stock units outstanding during the period. The computation of diluted earnings per shareincludes the dilutive effect of common stock equivalents consisting of certain shares subject to stockoptions. The computation of diluted earnings per share also assumes conversion of the Company’s formerly outstanding convertible subordinated debentures using the “if converted” method when suchsecurities were dilutive, with net income adjusted for the after-tax interest expense and amortizationapplicable to these debentures.
recent accounting pronouncements In June 1998, the Financial Accounting Standards Board (“FASB”) issued Statement of FinancialAccounting Standards (“SFAS”) No. 133, “Accounting for Derivative Instruments and HedgingActivities.” In June 2000, the FASB issued SFAS No. 138, which amends certain provisions of SFAS 133to clarify four areas causing difficulties in implementation. The amendment included expanding thenormal purchase and sale exemption for supply contracts, permitting the offsetting of certain inter-company foreign currency derivatives, thereby reducing the number of third party derivatives, permittinghedge accounting for foreign-currency assets and liabilities and redefining interest rate risk to reducesources of ineffectiveness. The Company has adopted the provisions of SFAS 133/138 as of October 2,2000, the first day of fiscal 2001. Adoption of SFAS 133/138 will not have a material impact on theCompany’s consolidated results of operations, financial position or cash flows.
In December 1999, the staff of the Securities and Exchange Commission released Staff AccountingBulletin No. 101 (“SAB 101”), “Revenue Recognition,” to provide guidance on the recognition, presentation and disclosure of revenues in financial statements. The Company believes that its revenuerecognition practices are in conformity with the guidelines in SAB 101, as revised, and that this pronouncement will have no material impact on its financial statements.
In March 2000, the FASB released Interpretation No. 44, “Accounting for Certain Transactionsinvolving Stock Compensation: an interpretation of APB Opinion No. 25.” Interpretation No. 44 provides clarification of certain issues, such as the determination of who is an employee, the criteria fordetermining whether a plan qualifies as a non-compensatory plan, the accounting consequence of various modifications to the terms of a previously fixed stock option or award and the accounting for an exchange of stock compensation awards in a business combination. The Company believes that itspractices are in conformity with this guidance, and therefore Interpretation No. 44 has no impact on itsfinancial statements.
P. 3 6 s t a r b u c k s c o f f e e c o m p a n y

In September 2000, the Emerging Issues Task Force (“EITF”) reached a consensus regarding Issue 00-10, “Accounting for Shipping and Handling Fees and Costs,” which requires any shipping and handling costs billed to customers in a sale transaction to be classified as revenue. The Company willadopt Issue 00-10 as of October 2, 2000, and does not expect it to have a material impact on theCompany’s consolidated results of operations.
EITF Issue 00-15, “Classification in the Statement of Cash Flows of the Income Tax Benefit Realized bya Company upon Employee Exercise of a Nonqualified Stock Option,” was adopted by the Company infiscal 2000. Issue 00-15 requires the income tax benefit resulting from the exercise of nonqualifiedstock options to be classified as cash provided by operating activities in the consolidated statements ofcash flows.
reclassifications Certain reclassifications of prior years’ balances have been made to conform to the fiscal 2000 presentation.
Note 2: Business combinations During fiscal 2000, Starbucks acquired the outstanding stock of Tympanum, Inc. (d/b/a “Hear Music”),a music retailer, and of Coffee Partners Co. Ltd., the company licensed to operate Starbucks stores inThailand (“Thailand Operations”). The combined purchase price for these two acquisitions was $14.1million. During fiscal 1999, Starbucks acquired the net assets of Tazo, L.L.C., a Portland, Oregon-based tea company that produces premium tea products, and the stock of Pasqua Inc., a San Francisco,California-based roaster and retailer of specialty coffee. The combined purchase price for these twoacquisitions was $16.5 million. All of the above acquisitions were accounted for under the purchase methodof accounting. Results of operations of the acquired companies are included on the accompanyingconsolidated financial statements from the dates of acquisition. During fiscal 1998, Starbucks acquiredthe United Kingdom-based Seattle Coffee Holdings Limited (“Seattle Coffee Company”) in a pooling-of-interests transaction (the “Transaction”). In conjunction with the Transaction, Starbucks recordedpre-tax charges of $8.9 million in direct merger costs and $6.6 million in other charges associated with the integration of Seattle Coffee Company. The historical financial statements for theperiods prior to the Transaction were restated as though the companies had always been combined.
The following summarizes the Company’s net revenues, net earnings and earnings per share for theperiods in fiscal 1998 prior to and following the Transaction (in thousands, except earnings per share):
SEATTLECOFFEE
STARBUCKS COMPANY COMBINED
34 Weeks prior to the Transaction:Net revenues $ 805,151 $ 15,675 $ 820,826Net earnings 45,811 (3,312) 42,499Net earnings per share — diluted 0.25 (0.02) 0.23
18 Weeks after the Transaction:Net revenues $ 487,876Net earnings 25,873Net earnings per share — diluted 0.15
Note 3: Cash and cash equivalents Cash and cash equivalents consist of the following (in thousands):
Oct 1, 2000 Oct 3, 1999Operating funds and interest-bearing deposits $ 48,821 $ 39,926Commercial paper 998 7,980Money market funds 20,998 18,513
Total $ 70,817 $ 66,419
s t a r b u c k s c o f f e e c o m p a n y P. 3 7

Note 4: Short-term investments The Company’s investments consist of the following (in thousands):
GROSS GROSSUNREALIZED UNREALIZED
FAIR AMORTIZED HOLDING HOLDINGOctober 1, 2000: VALUE COST GAINS LOSSES
Short-term investments - available-for-sale:U.S. Government obligations $ 10,990 $ 10,996 $ 3 $ (9)Commercial paper 45,356 45,373 1 (18)Marketable equity securities 1,227 1,227 - -
Total $ 57,573 $ 57,596 $ 4 $ (27)Short-term investments - trading 3,763Total short-term investments $ 61,336
GROSS GROSSUNREALIZED UNREALIZED
FAIR AMORTIZED HOLDING HOLDINGOctober 3, 1999: VALUE COST GAINS LOSSES
Short-term investments - available-for-sale:Corporate debt securities $ 17,233 $ 17,123 $ 155 $ (45)U.S. Government obligations 4,988 4,976 13 (1)Commercial paper 18,706 18,751 - (45)Mutual funds 2,056 2,002 73 (19)Marketable equity securities 8,384 8,258 313 (187)
Total $ 51,367 $ 51,110 $ 554 $ (297)Long-term investments:
U.S. Government obligations $ 5,028 $ 5,044 $ - $ (16)
Available-for-sale securities with remaining maturities of one year or less are classified as short-terminvestments. Securities with remaining maturities longer than one year are classified as long-term andare included in the line item “Other investments” on the accompanying consolidated balance sheets.The specific identification method is used to determine a cost basis for computing realized gains and losses.
In fiscal 2000, 1999 and 1998, proceeds from the sale of investment securities were $49.2 million, $3.6million and $5.1 million, respectively. Gross realized gains and losses from the sale of securities were notmaterial in 2000, 1999 and 1998.
During fiscal 2000, the Company recorded a loss of $6.8 million on its investment in the commonstock of Talk City, Inc., due to an impairment that was determined by management to be other than temporary. The remaining fair value of the investment was $1.2 million as of October 1, 2000.
Trading securities are classified as short-term investments. The trading securities are marketable equityfunds designated to approximate the Company’s liability under the Management DeferredCompensation Plan (“MDCP”). The corresponding deferred compensation liability of $3.8 million isincluded in “Accrued compensation and related costs” on the accompanying consolidated balancesheets. The change in net unrealized holding gains in the trading portfolio included in earnings duringthe year was $0.3 million. There were no trading securities as of October 3, 1999.
P. 3 8 s t a r b u c k s c o f f e e c o m p a n y

Note 5: InventoriesInventories consist of the following (in thousands):
Oct 1, 2000 Oct 3, 1999Coffee:
Unroasted $ 90,807 $ 95,001Roasted 27,880 28,065
Other merchandise held for sale 59,420 37,564Packaging and other supplies 23,549 20,256
Total $ 201,656 $ 180,886
As of October 1, 2000, the Company had fixed-price inventory purchase commitments for green coffee totaling approximately $84 million. The Company believes, based on relationships establishedwith its suppliers in the past, that the risk of non-delivery on such purchase commitments is remote.
Note 6: Joint ventures The Company has two joint ventures to produce and distribute Starbucks branded products. The NorthAmerican Coffee Partnership is a 50/50 joint venture partnership with the Pepsi-Cola Company todevelop and distribute bottled Frappuccino® coffee drink. The Starbucks Ice Cream Partnership is a50/50 joint venture partnership with Dreyer’s Grand Ice Cream, Inc. to develop and distribute premiumice creams.
The Company is a partner in several other joint ventures that operate licensed Starbucks retail stores,including Starbucks Coffee Japan Limited, a 50/50 joint venture partnership with a Japanese retailerand restauranteur, SAZABY Inc., to develop Starbucks retail stores in Japan. The Company also hasinterests in joint ventures to develop Starbucks retail stores in Hawaii, Taiwan, Shanghai, Hong Kongand Switzerland.
The Company accounts for these investments using the equity method when Starbucks is deemed to havesignificant influence over the investee but is not the controlling or managing partner; otherwise, theinvestment is accounted for using the cost method. The Company’s share of income and losses for equitymethod joint ventures is included in “Joint venture income” on the accompanying consolidated statementsof earnings. This line includes both the Company’s proportionate share of gross margin resulting from thesale of coffee and other products to the joint ventures and the Company’s proportionate share of royaltyand license fee revenues received from the joint ventures.
The Company’s investments in these joint ventures are as follows (in thousands):
EQUITY COSTJOINT JOINT
VENTURES VENTURES TOTAL
Balance, September 28, 1997 $ 29,263 $ - $ 29,263Allocated share of losses (14) - (14)Distributions from joint ventures (2,750) - (2,750)Capital contributions 12,059 359 12,418
Balance, September 27, 1998 38,558 359 38,917Allocated share of income 2,318 - 2,318Distributions from joint ventures (8,983) - (8,983)Capital contributions 10,466 - 10,466
Balance, October 3, 1999 42,359 359 42,718Allocated share of income 15,139 - 15,139Distributions from joint ventures (14,279) - (14,279)Capital contributions 8,049 424 8,473
Balance, October 1, 2000 $ 51,268 $ 783 $ 52,051
The Company has a consolidated 90/10 joint venture with Starbucks Coffee Company (Australia) PtyLtd. to develop retail stores in Australia. In addition, the Company has a consolidated 50/50 joint venture, Urban Coffee Opportunities, LLC, with Johnson Development Corporation to develop retailstores in under-served urban communities.
s t a r b u c k s c o f f e e c o m p a n y P. 3 9

Note 7: Other investments In fiscal 1999, the Company invested $20.3 million in living.com Inc. (“living.com”), an online furnitureretailer. Also in 1999, the Company established an alliance with Cooking.com, Inc. (“Cooking.com”), aprivately held web-based retailer of cookware, accessories and specialty foods and provider of informationabout cooking. As part of this alliance, the Company made a $10.0 million investment in Cooking.com.
During fiscal 2000, the Company invested $25.0 million in Kozmo.com, an Internet-to-door deliveryservice for food, entertainment and convenience items. Starbucks and Kozmo.com also entered into acommercial agreement to provide in-store return boxes in Starbucks stores in exchange for cash, a channel for selling the Company’s products and other marketing opportunities. In connection with thisagreement, Starbucks received a $15.0 million payment that is being recognized as revenue on a straight-line basis over twelve months. The Company does not expect to continue recording revenue from the current Kozmo.com relationship after February 2001.
During fiscal 2000, the Company determined that its investments in Internet-related companies hadsuffered declines in value that were other than temporary. As a result, the Company recognized lossestotaling $52.0 million to reduce its investments in living.com, Cooking.com and Kozmo.com to theiraggregate fair value of $3.6 million as of October 1, 2000.
The Company also had various other investments recorded at their estimated aggregate fair value of $0.2million as of October 1, 2000.
Note 8: Property, plant and equipment Property, plant and equipment are recorded at cost and consist of the following (in thousands):
Oct 1, 2000 Oct 3, 1999
Land $ 5,084 $ 5,084Building 19,795 19,795Leasehold improvements 736,471 591,640Roasting and store equipment 369,587 273,612Furniture, fixtures and other 182,528 130,223
1,313,465 1,020,354Less accumulated depreciation and amortization (446,403) (320,982)
867,062 699,372Work in progress 63,697 60,917Property, plant and equipment, net $ 930,759 $ 760,289
Note 9: Long-term debt In September 1999, the Company purchased the land and building comprising its York County,Pennsylvania roasting plant and distribution facility. The total purchase price was $12.9 million. In connection with this purchase, the Company assumed loans totaling $7.7 million from the York CountyIndustrial Development Corporation. The remaining maturities of these loans range from 9 to 10 years,with interest rates from 0.0% to 2.0%.
Scheduled principal payments on long-term debt are as follows (in thousands):
Fiscal year ending
2001 $ 6852002 6972003 7102004 7222005 735Thereafter 3,619Total principal payments $ 7,168
P. 4 0 s t a r b u c k s c o f f e e c o m p a n y

Note 10: Leases The Company leases retail stores, roasting and distribution facilities and office space under operatingleases expiring through 2023. Most lease agreements contain renewal options and rent escalation clauses.Certain leases provide for contingent rentals based upon gross sales.
Rental expense under these lease agreements was as follows (in thousands):
Fiscal year ended Oct 1, 2000 Oct 3, 1999 Sept 27, 1998Minimum rentals $ 127,149 $ 95,613 $ 75,912Contingent rentals 3,743 1,581 1,406Total $ 130,892 $ 97,194 $ 77,318
Minimum future rental payments under non-cancelable lease obligations as of October 1, 2000, are asfollows (in thousands):
Fiscal year ending
2001 $ 129,4072002 129,0182003 127,6042004 122,4042005 112,988Thereafter 417,874Total minimum lease payments $ 1,039,295
Note 11: Shareholders’ equity The Company has authorized 7,500,000 shares of its preferred stock, none of which was outstanding atOctober 1, 2000.
comprehensive income The Company adopted SFAS No. 130, “Reporting Comprehensive Income,” as of the first quarter of fiscal 1999. Comprehensive income includes all changes in equity during the period, except those resultingfrom transactions with shareholders of the Company. It has two components: net income and other comprehensive income. Accumulated other comprehensive income (loss) reported on the Company’sconsolidated balance sheets consists of foreign currency translation adjustments and the unrealized gainsand losses, net of applicable taxes, on available-for-sale securities. Comprehensive income, net of relatedtax effects, is as follows (in thousands):
Fiscal year ended Oct 1, 2000 Oct 3, 1999 Sept 27, 1998Net earnings $ 94,564 $ 101,693 $ 68,372
Unrealized holding gains (losses) oninvestments, net of tax (provision)benefit of $52, ($155) and $373in 2000, 1999 and 1998, respectively (85) 252 (595)
Reclassification adjustment for (gains) lossesrealized in net income, net of tax provision(benefit) of ($48) and $270, respectively (78) 431 -
Net unrealized gain (loss) (163) 683 (595)Translation adjustment (6,867) 2,534 (5,120)
Total comprehensive income $ 87,534 $ 104,910 $ 62,657
s t a r b u c k s c o f f e e c o m p a n y P. 4 1

Note 12: Employee stock and benefit plans stock option plans The Company maintains several stock option plans under which the Company may grant incentive stockoptions and non-qualified stock options to employees, consultants and non-employee directors. Stockoptions have been granted at prices at or above the fair market value on the date of grant. Options vestand expire according to terms established at the grant date. The following summarizes all stock optiontransactions from September 28, 1997, through October 1, 2000:
WEIGHTED WEIGHTEDAVERAGE SHARES AVERAGE
SHARES EXERCISE SUBJECT TO EXERCISESUBJECT TO PRICE EXERCISABLE PRICE
OPTIONS PER SHARE OPTIONS PER SHARE
Outstanding, September 28, 1997 17,907,322 $ 9.66 7,427,352 $ 5.43Granted 6,508,632 18.52Exercised (3,683,078) 6.13Cancelled (1,229,478) 11.79
Outstanding, September 27, 1998 19,503,398 13.10 7,560,806 8.49Granted 8,051,998 22.97Exercised (3,522,908) 9.53Cancelled (1,461,937) 18.99
Outstanding, October 3, 1999 22,570,551 16.84 12,080,825 13.55Granted 4,705,165 24.84Exercised (4,471,785) 13.07Cancelled (1,859,068) 21.41
Outstanding, October 1, 2000 20,944,863 $ 19.10 10,165,370 $ 15.65
As of October 1, 2000, there were 16,762,482 shares of common stock available for issuance pursuantto future stock option grants.
Additional information regarding options outstanding as of October 1, 2000, is as follows:
OPTIONS OUTSTANDING OPTIONS EXERCISABLE
WEIGHTED AVERAGE WEIGHTED WEIGHTED
REMAINING AVERAGE AVERAGERANGE OF CONTRACTUAL EXERCISE EXERCISE
EXERCISE PRICES SHARES LIFE (YEARS) PRICE SHARES PRICE
$ 0.75 $ 9.41 3,046,798 4.04 $ 7.14 2,872,310 $ 7.019.69 18.41 6,942,673 6.54 16.92 4,007,553 16.15
19.42 22.69 5,530,507 8.17 21.52 2,681,621 21.4823.25 35.31 5,197,385 8.93 25.60 603,886 27.4936.06 40.75 227,500 9.75 38.13 - -
$ 0.75 $ 40.75 20,944,863 7.23 $ 19.10 10,165,370 $ 15.65
P. 4 2 s t a r b u c k s c o f f e e c o m p a n y

employee stock purchase plan The Company has an employee stock purchase plan which provides that eligible employees may contribute up to 10% of their base earnings, up to $25,000 annually, toward the quarterly purchase ofthe Company’s common stock. The employees’ purchase price is 85% of the lesser of the fair marketvalue of the stock on the first business day or the last business day of the quarterly offering period. Nocompensation expense is recorded in connection with the plan. The total number of shares issuableunder the plan is 8,000,000. There were 403,771 shares issued under the plan during fiscal 2000 atprices ranging from $20.37 to $32.73. There were 492,231 shares issued under the plan during fiscal1999 at prices ranging from $14.05 to $25.18. There were 271,778 shares issued under the plan duringfiscal 1998 at prices ranging from $15.99 to $19.58. Of the 24,465 employees eligible to participate,6,708 were participants in the plan as of October 1, 2000.
deferred stock plan The Company has a Deferred Stock Plan for certain key employees that enables participants in the planto defer receipt of ownership of common shares from the exercise of non-qualified stock options. Theminimum deferral period is five years. As of October 1, 2000, receipt of 848,550 shares was deferredunder the terms of this plan. The rights to receive these shares, represented by common stock units, areincluded in the calculation of basic and diluted earnings per share as common stock equivalents.
accounting for stock-based compensation The Company accounts for its stock-based awards using the intrinsic value method in accordance withAccounting Principles Board Opinion No. 25, “Accounting for Stock Issued to Employees” and itsrelated interpretations. Accordingly, no compensation expense has been recognized in the financialstatements for employee stock arrangements.
SFAS No. 123, “Accounting for Stock-Based Compensation,” requires the disclosure of pro forma netincome and net income per share as if the Company adopted the fair-value method of accounting for stock-based awards as of the beginning of fiscal 1996. The fair value of stock-based awards to employees iscalculated using the Black-Scholes option-pricing model with the following weighted average assumptions:
EMPLOYEE STOCK OPTIONS EMPLOYEE STOCK PURCHASE PLAN
2000 1999 1998 2000 1999 1998Expected life (years) 2 - 6 1.5 - 6 1.5 - 6 0.25 0.25 0.25Expected volatility 55% 50% 45% 42 - 82% 44 - 66% 37 - 45%Risk-free interest rate 5.65 - 6.87% 4.60 - 6.21% 5.28 - 6.05% 5.97 - 6.40% 4.26 - 5.63% 5.26 - 5.74%Expected dividend yield 0.00% 0.00% 0.00% 0.00% 0.00% 0.00%
The Company’s valuations are based upon a multiple option valuation approach and forfeitures are recognized as they occur. The Black-Scholes option valuation model was developed for use in estimating thefair value of traded options, which have no vesting restrictions and are fully transferable. In addition, optionvaluation models require the input of highly subjective assumptions, including the expected stock-pricevolatility. The Company’s employee stock options have characteristics significantly different from those oftraded options, and changes in the subjective input assumptions can materially affect the fair value estimate.
s t a r b u c k s c o f f e e c o m p a n y P. 4 3

As required by SFAS No. 123, the Company has determined that the weighted average estimated fair values of options granted during fiscal 2000, 1999 and 1998 were $10.74, $8.86 and $7.20 per share,respectively. Had compensation costs for the Company’s stock-based compensation plans been accountedfor using the fair value method of accounting described by SFAS No. 123, the Company’s net earnings andearnings per share would have been as follows (in thousands, except earnings per share):
PRO FORMAUNDER SFAS
Fiscal year ended AS REPORTED NO. 123
October 1, 2000:Net earnings $ 94,564 $ 66,241Net earnings per common share:
Basic $ 0.51 $ 0.36Diluted $ 0.49 $ 0.35
October 3, 1999:Net earnings $ 101,693 $ 75,326Net earnings per common share:
Basic $ 0.56 $ 0.41Diluted $ 0.54 $ 0.40
September 27, 1998:Net earnings $ 68,372 $ 51,595Net earnings per common share:
Basic $ 0.39 $ 0.30Diluted $ 0.37 $ 0.28
In applying SFAS No. 123, the impact of outstanding stock options granted prior to 1996 has been excludedfrom the pro forma calculations; accordingly, the 2000, 1999 and 1998 pro forma adjustments are not necessarily indicative of future period pro forma adjustments.
defined contribution plans Starbucks maintains voluntary defined contribution plans covering eligible employees as defined in the plan documents. Participating employees may elect to defer and contribute a percentage of their compensation to the plan, not to exceed the dollar amount set by law. For certain plans, the Companymatches 25% of each employee’s eligible contribution up to a maximum of the first 4% of each employee’s compensation.
The Company’s matching contributions to the plans were approximately $1.1 million, $0.9 million and$0.8 million for fiscal 2000, 1999 and 1998, respectively.
Note 13: Income taxes A reconciliation of the statutory federal income tax rate with the Company’s effective income tax rate isas follows:
Fiscal year ended Oct 1, 2000 Oct 3, 1999 Sept 27, 1998Statutory rate 35.0% 35.0% 35.0%State income taxes, net of federal
income tax benefit 3.7 3.7 3.8Non-deductible losses and merger costs - - 2.6Valuation allowance change from prior year 3.5 - -Other, net (1.1) (0.7) (0.2)Effective tax rate 41.1% 38.0% 41.2%
The provision for income taxes consists of the following (in thousands):
Fiscal year ended Oct 1, 2000 Oct 3, 1999 Sept 27, 1998Currently payable:
Federal $ 71,758 $ 52,207 $ 39,267State 12,500 9,332 6,586
Deferred (asset) liability, net (18,252) 794 2,125Total $ 66,006 $ 62,333 $ 47,978
P. 4 4 s t a r b u c k s c o f f e e c o m p a n y

Deferred income taxes (benefits) reflect the tax effect of temporary differences between the amounts ofassets and liabilities for financial reporting purposes and amounts as measured for tax purposes. TheCompany will establish a valuation allowance if it is more likely than not these items will either expirebefore the Company is able to realize their benefits, or that future deductibility is uncertain. At October1, 2000, the Company established a valuation allowance of $5.7 million as a result of the losses incurredon Internet-related investments. The tax effect of temporary differences and carryforwards that causesignificant portions of deferred tax assets and liabilities is as follows (in thousands):
Oct 1, 2000 Oct 3, 1999Deferred tax assets:
Loss on investments $ 22,635 $ -Accrued rent 10,321 8,234Accrued compensation and related costs 6,710 5,622Inventory related costs 3,550 2,067Other 15,222 9,900
Total 58,438 25,823Valuation allowance (5,659) -
Total deferred tax asset, net of valuation allowance 52,779 25,823Deferred tax liabilities:
Depreciation (36,249) (29,826)Investments in joint ventures (4,616) (3,990)Other (4,020) (3,760)
Total (44,885) (37,576)Net deferred tax asset (liability) $ 7,894 $ (11,753)
Taxes currently payable of $17.9 million and $16.3 million are included in “Accrued taxes” on theaccompanying consolidated balance sheets as of October 1, 2000 and October 3, 1999, respectively.
Note 14: Earnings per share
The following table represents the calculation of net earnings per common share – basic (in thousands,except earnings per share):
Fiscal year ended Oct 1, 2000 Oct 3, 1999 Sept 27, 1998Net earnings $ 94,564 $ 101,693 $ 68,372Weighted average common shares and common stock units outstanding 185,595 181,842 176,110Net earnings per common share - basic $ 0.51 $ 0.56 $ 0.39
The following table represents the calculation of net earnings per common and common equivalentshare - diluted (in thousands, except earnings per share):
Fiscal year ended Oct 1, 2000 Oct 3, 1999 Sept 27, 1998Net earnings calculation: Net earnings $ 94,564 $ 101,693 $ 68,372
Add after-tax interest expense on debentures - - 348Add after-tax amortization of issuance costs related to the debentures - - 30
Adjusted net earnings $ 94,564 $ 101,693 $ 68,750Weighted average common shares and common stock units outstanding 185,595 181,842 176,110
Dilutive effect of outstanding common stock options 7,404 6,689 6,257Assuming conversion of convertible subordinated debentures - - 1,404
Weighted average common and common equivalent shares outstanding 192,999 188,531 183,771Net earnings per common and common equivalent share - diluted $ 0.49 $ 0.54 $ 0.37
s t a r b u c k s c o f f e e c o m p a n y P. 4 5

The Internet-related investment losses of 58.8 million during fiscal 2000 negatively impacted the dilutedearnings per share calculation by $0.22. Excluding these losses, the diluted net earnings per common andcommon equivalent share was $0.71. See Notes 4 and 7.
Options with exercise prices greater than the average market price were not included in the computationof diluted earnings per share. These options totaled 0.3 million, 0.6 million and 0.3 million for fiscal2000, 1999 and 1998, respectively.
Note 15: Commitments and contingencies In connection with various bank loans entered into by Starbucks Coffee Japan Limited, the Company hasguaranteed $25.4 million of the outstanding debt in the event of default by Starbucks Coffee Japan Limited.
In the normal course of business, the Company has various legal claims and other contingent mattersoutstanding. Management believes that any ultimate liability arising from these actions would not have amaterial adverse effect on the Company’s results of operations or financial condition as of and for thefiscal year ended October 1, 2000.
Note 16: Segment reporting In fiscal 1999, the Company adopted SFAS No. 131, “Disclosures about Segments of an Enterprise andRelated Information,” which establishes reporting and disclosure standards for an enterprise’s operatingsegments. Operating segments are defined as components of an enterprise for which separate financialinformation is available and regularly reviewed by the Company’s senior management.
The Company is organized into a number of business units. The Company’s North American retailbusiness sells coffee beverages, whole bean coffees and related hardware and equipment throughCompany-operated retail stores in the United States and Canada. The Company’s international retailbusiness consists of entities that own and operate retail stores in the United Kingdom, Thailand andAustralia. These two retail segments are managed by different presidents within the Company and aremeasured and evaluated separately by senior management.
The Company operates through several other business units, each of which is managed and evaluatedindependently. These other business units are organized around the strategic relationships that govern thedistribution of products to the customer. These relationships include retail store licensing agreements,wholesale accounts, grocery channel licensing agreements, joint ventures and direct-to-consumer marketing channels. Revenues from these segments include both sales to unaffiliated customers and inter-segment sales, which are accounted for on a basis consistent with sales to unaffiliated customers.Intersegment sales and other intersegment transactions have been eliminated on the accompanying consolidated financial statements.
The accounting policies of the operating segments are the same as those described in the summary of significant accounting policies in Note 1. Operating income represents earnings before interest andother income/expense and income taxes. No allocations of overhead, interest or income taxes are madeto the segments. Identifiable assets by segment are those assets used in the Company’s operations in eachsegment. General corporate assets include cash and investments, unallocated assets of the corporateheadquarters and roasting facilities, deferred taxes and certain intangibles. Management evaluates performance of the segments based on direct product sales and operating costs.
P. 4 6 s t a r b u c k s c o f f e e c o m p a n y

The tables below present information by operating segment (in thousands):
Fiscal year ended Oct 1, 2000 Oct 3, 1999 Sept 27, 1998REVENUES:North American retail $ 1,734,929 $ 1,375,018 $ 1,076,731All other business units 457,496 320,604 238,798Intersegment revenues (23,207) (15,477) (6,827)Total revenues $ 2,169,218 $ 1,680,145 $ 1,308,702OPERATING INCOME:North American retail $ 249,924 $ 209,338 $ 161,334All other business units 97,100 55,998 45,943Unallocated corporate expenses (134,902) (107,460) (89,069)Merger expenses - - (8,930)Intersegment eliminations 130 (1,165) (62)Interest and other income, net 7,110 7,315 7,134Internet-related investment losses (58,792) - -Total earnings before income taxes $ 160,570 $ 164,026 $ 116,350DEPRECIATION AND AMORTIZATION:North American retail $ 94,312 $ 72,252 $ 56,328All other business units 13,664 7,766 4,721Unallocated corporate expenses 22,256 17,779 11,494Total depreciation and amortization $ 130,232 $ 97,797 $ 72,543INCOME (LOSSES) FROM EQUITY METHOD INVESTEES:All other business units $ 15,139 2,318 $ (14)Intersegment eliminations 5,161 874 1,048Total income from equity method investees $ 20,300 $ 3,192 $ 1,034
Oct 1, 2000 Oct 3, 1999IDENTIFIABLE ASSETS:North American retail $ 664,773 $ 587,823All other business units 165,702 97,544General corporate assets 662,656 567,147Total assets $ 1,493,131 $ 1,252,514
s t a r b u c k s c o f f e e c o m p a n y P. 4 7

The tables below represent information by geographic area (in thousands):
Fiscal year ended Oct 1, 2000 Oct 3, 1999 Sept 27, 1998REVENUES FROM EXTERNAL CUSTOMERS:United States $ 1,940,723 $ 1,490,133 $ 1,173,982Foreign countries 228,495 190,012 134,720 Total $ 2,169,218 $ 1,680,145 $ 1,308,702
Revenues from foreign countries are based on the location of the customers and consist primarily of revenues from Canada and the United Kingdom. No customer accounts for 10% or more of theCompany’s revenues.
Oct 1, 2000 Oct 3, 1999LONG-LIVED ASSETS:United States $ 819,200 $ 680,344Foreign countries 111,559 79,945Total $ 930,759 $ 760,289
Assets attributed to foreign countries are based on the country in which those assets are located.
Note 17: Quarterly f inancial information (unaudited) Summarized quarterly financial information for fiscal years 2000 and 1999 is as follows (in thousands,except earnings per share):
FIRST SECOND THIRD FOURTH
2000 quarter:Net revenues $ 526,982 $ 504,698 $ 555,546 $ 581,992Gross margin 288,580 281,449 314,420 331,209Net earnings 34,749 23,406 34,913 1,496Net earnings per common share — diluted $ 0.18 $ 0.12 $ 0.18 $ 0.01
1999 quarter:Net revenues $ 405,638 $ 375,822 $ 423,792 $ 474,893Gross margin 219,338 205,865 238,772 275,160Net earnings 26,733 17,957 24,635 32,368Net earnings per common share — diluted $ 0.14 $ 0.10 $ 0.13 $ 0.17
P. 4 8 s t a r b u c k s c o f f e e c o m p a n y

Management’s Responsibility for Financial Reporting The management of Starbucks Corporation is responsible for the preparation and integrity of the financialstatements included in this Annual Report to Shareholders. The financial statements have been prepared inconformity with accounting principles generally accepted in the United States of America and includeamounts based on management’s best judgment where necessary. Financial information included elsewherein this Annual Report is consistent with these financial statements.
Management maintains a system of internal controls and procedures designed to provide reasonable assurance that transactions are executed in accordance with proper authorization, that transactions areproperly recorded in the Company’s records, that assets are safeguarded and that accountability for assets ismaintained. The concept of reasonable assurance is based on the recognition that the cost of maintainingour system of internal accounting controls should not exceed benefits expected to be derived from the system. Internal controls and procedures are periodically reviewed and revised, when appropriate, due tochanging circumstances and requirements.
Independent auditors are appointed by the Company’s Board of Directors and ratified by the Company’sshareholders to audit the financial statements in accordance with auditing standards generally acceptedin the United States of America and to independently assess the fair presentation of the Company’sfinancial position, results of operations and cash flows. Their report appears in this Annual Report.
The Audit Committee, all of whose members are outside directors, is responsible for monitoring theCompany’s accounting and reporting practices. The Audit Committee meets periodically with managementand the independent auditors to ensure that each is properly discharging its responsibilities. The independent auditors have full and free access to the Committee without the presence of managementto discuss the results of their audits, the adequacy of internal accounting controls and the quality offinancial reporting.
O r i n C . S m i t h M i c h a e l C a s e ypresident and executive vice president, chief executive officer chief financial officer and
chief administrative officer
s t a r b u c k s c o f f e e c o m p a n y P. 4 9
Starbucks Corporation (Seattle, Washington)
We have audited the accompanying consolidated balance sheets of Starbucks Corporation and subsidiaries (the Company) as of October 1, 2000, and October 3, 1999, and the related consolidatedstatements of earnings, shareholders’ equity and cash flows for each of the three years in the period endedOctober 1, 2000. These financial statements are the responsibility of the Company’s management. Ourresponsibility is to express an opinion on these financial statements based on our audits.
We conducted our audits in accordance with auditing standards generally accepted in the United Statesof America. Those standards require that we plan and perform the audit to obtain reasonable assuranceabout whether the financial statements are free of material misstatement. An audit includes examining,on a test basis, evidence supporting the amounts and disclosures in the financial statements. An auditalso includes assessing the accounting principles used and significant estimates made by management, aswell as evaluating the overall financial statement presentation. We believe that our audits provide a reasonable basis for our opinion.
In our opinion, such consolidated financial statements present fairly, in all material respects, the financialposition of Starbucks Corporation and subsidiaries as of October 1, 2000, and October 3, 1999, and theresults of their operations and their cash flows for each of the three years in the period ended October 1,2000, in conformity with accounting principles generally accepted in the United States of America.
D e l o i t t e & T o u c h e L L P
Seattle, Washington
December 8, 2000
P. 5 0 s t a r b u c k s c o f f e e c o m p a n y
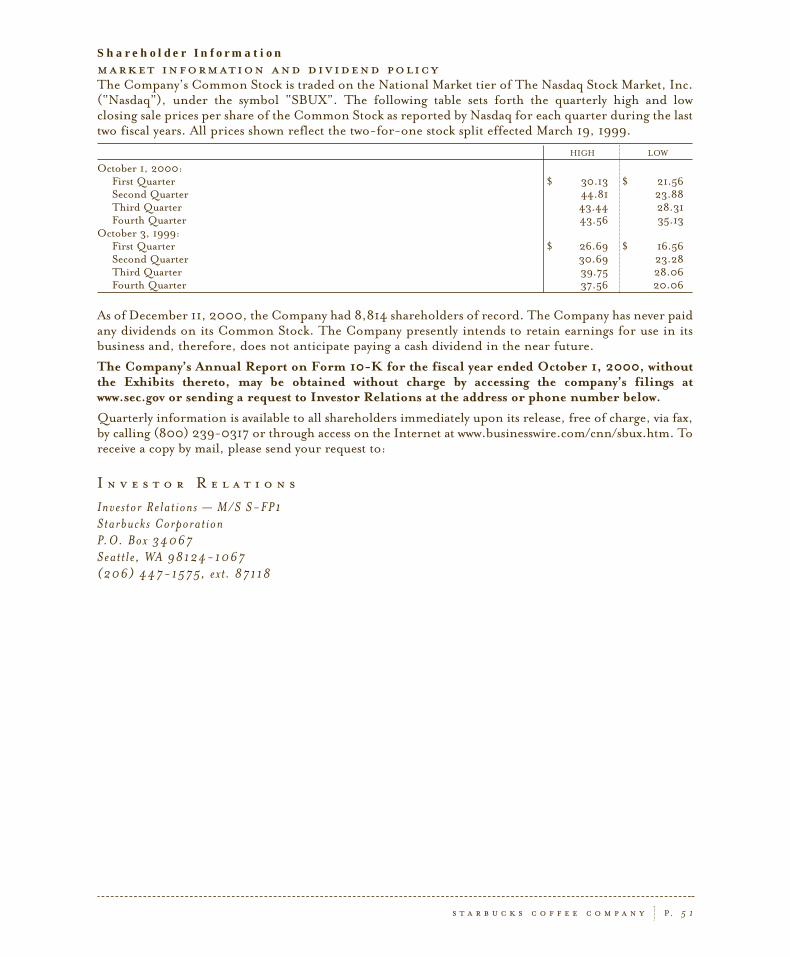
s t a r b u c k s c o f f e e c o m p a n y P. 5 1
Shareholder Information market information and dividend policy The Company’s Common Stock is traded on the National Market tier of The Nasdaq Stock Market, Inc.(“Nasdaq”), under the symbol “SBUX”. The following table sets forth the quarterly high and low closing sale prices per share of the Common Stock as reported by Nasdaq for each quarter during the lasttwo fiscal years. All prices shown reflect the two-for-one stock split effected March 19, 1999.
HIGH LOW
October 1, 2000:First Quarter $ 30.13 $ 21.56Second Quarter 44.81 23.88Third Quarter 43.44 28.31Fourth Quarter 43.56 35.13
October 3, 1999:First Quarter $ 26.69 $ 16.56Second Quarter 30.69 23.28Third Quarter 39.75 28.06Fourth Quarter 37.56 20.06
As of December 11, 2000, the Company had 8,814 shareholders of record. The Company has never paidany dividends on its Common Stock. The Company presently intends to retain earnings for use in itsbusiness and, therefore, does not anticipate paying a cash dividend in the near future.
The Company’s Annual Report on Form 10-K for the fiscal year ended October 1, 2000, withoutthe Exhibits thereto, may be obtained without charge by accessing the company’s filings atwww.sec.gov or sending a request to Investor Relations at the address or phone number below. Quarterly information is available to all shareholders immediately upon its release, free of charge, via fax,by calling (800) 239-0317 or through access on the Internet at www.businesswire.com/cnn/sbux.htm. Toreceive a copy by mail, please send your request to:
I n v e s t o r R e l a t i o n sInves tor Relat ions — M/S S-FP1 Starbucks Corporat ion P.O. Box 34067 Seat t le , WA 98124-1067 (206) 447-1575, ex t . 87118

Board of Directors and Senior Officers
Board of Directors
H o w a r d S c h u l t z
Starbucks Corporationchairman of the board and
chief global strategist
O r i n C . S m i t h
Starbucks Corporationpresident and chief executive officer
A r l e n I . P r e n t i c e
Kibble & Prenticeco-chairman and chief executive officer
B a r b a r a B a s s
Gerson Bakar Foundationpresident
C r a i g J . F o l e y
Wickham Capital Corp.president
C r a i g E . W e a t h e r u p
The Pepsi Bottling Group, Inc.chairman and chief executive officer
G r e g o r y B . M a f f e i
360networks inc.president and chief executive officer
H o w a r d P . B e h a r
director
J a m e s G . S h e n n a n , J r .
Trinity Venturesgeneral partner
Senior Officers
P a u l D . D a v i s
president, North America
P e t e r M a s l e n
president, Starbucks Coffee
International, Inc.
D e i d r a W a g e r
executive vice president, Retail
E d ua r d o R . ( Te d ) G a r c i a
executive vice president, Supply Chain
and Coffee Operations
M i c h a e l C a s e y
executive vice president, chief financial
officer and chief administrative officer
S h e l l e y B . L a n z a
executive vice president, Human
Resources, Corporate Social
Responsibility, general counsel
and secretary
B r u c e C r a i g
senior vice president, Retail Operations
D a r r e n H u s t o n
senior vice president, New Ventures
D a v i d O l s e n
senior vice president,
Corporate Social Responsibility
E n g l e E . S a e z
senior vice president,
Marketing and Category Management
H o w a r d W o l l n e r
senior vice president,
Starbucks Coffee International
Strategic Business Systems
J a m e s A l l i n g
senior vice president, Business Alliances
J o h n A l d e r s o n
senior vice president, Southwest Zone
L e e G e l b
senior vice president, Human Resources
M a r c i a A d a m s
senior vice president, Central Zone
M a r k M c K e o n
senior vice president and president,
Europe, Middle East and Africa
M a r k W e s l e y
senior vice president,
Store Development and
Asset Management
M a r t i n A n n e s e
senior vice president,
Northeast/Eastern Canada Zone
M a r y W i l l i a m s
senior vice president, Coffee
P a u l T w o h i g
senior vice president, Northwest/Western
Canada Zone
P e d r o Y . K . M a n
senior vice president and president,
Starbucks Coffee Asia Pacific Ltd.
W a n d a H e r n d o n
senior vice president,
Worldwide Public Affairs
P. 5 2 s t a r b u c k s c o f f e e c o m p a n y