The use of the Sustainability Balanced Scorecard Framework ...
Upload
standard-registerCategory
view
312download
2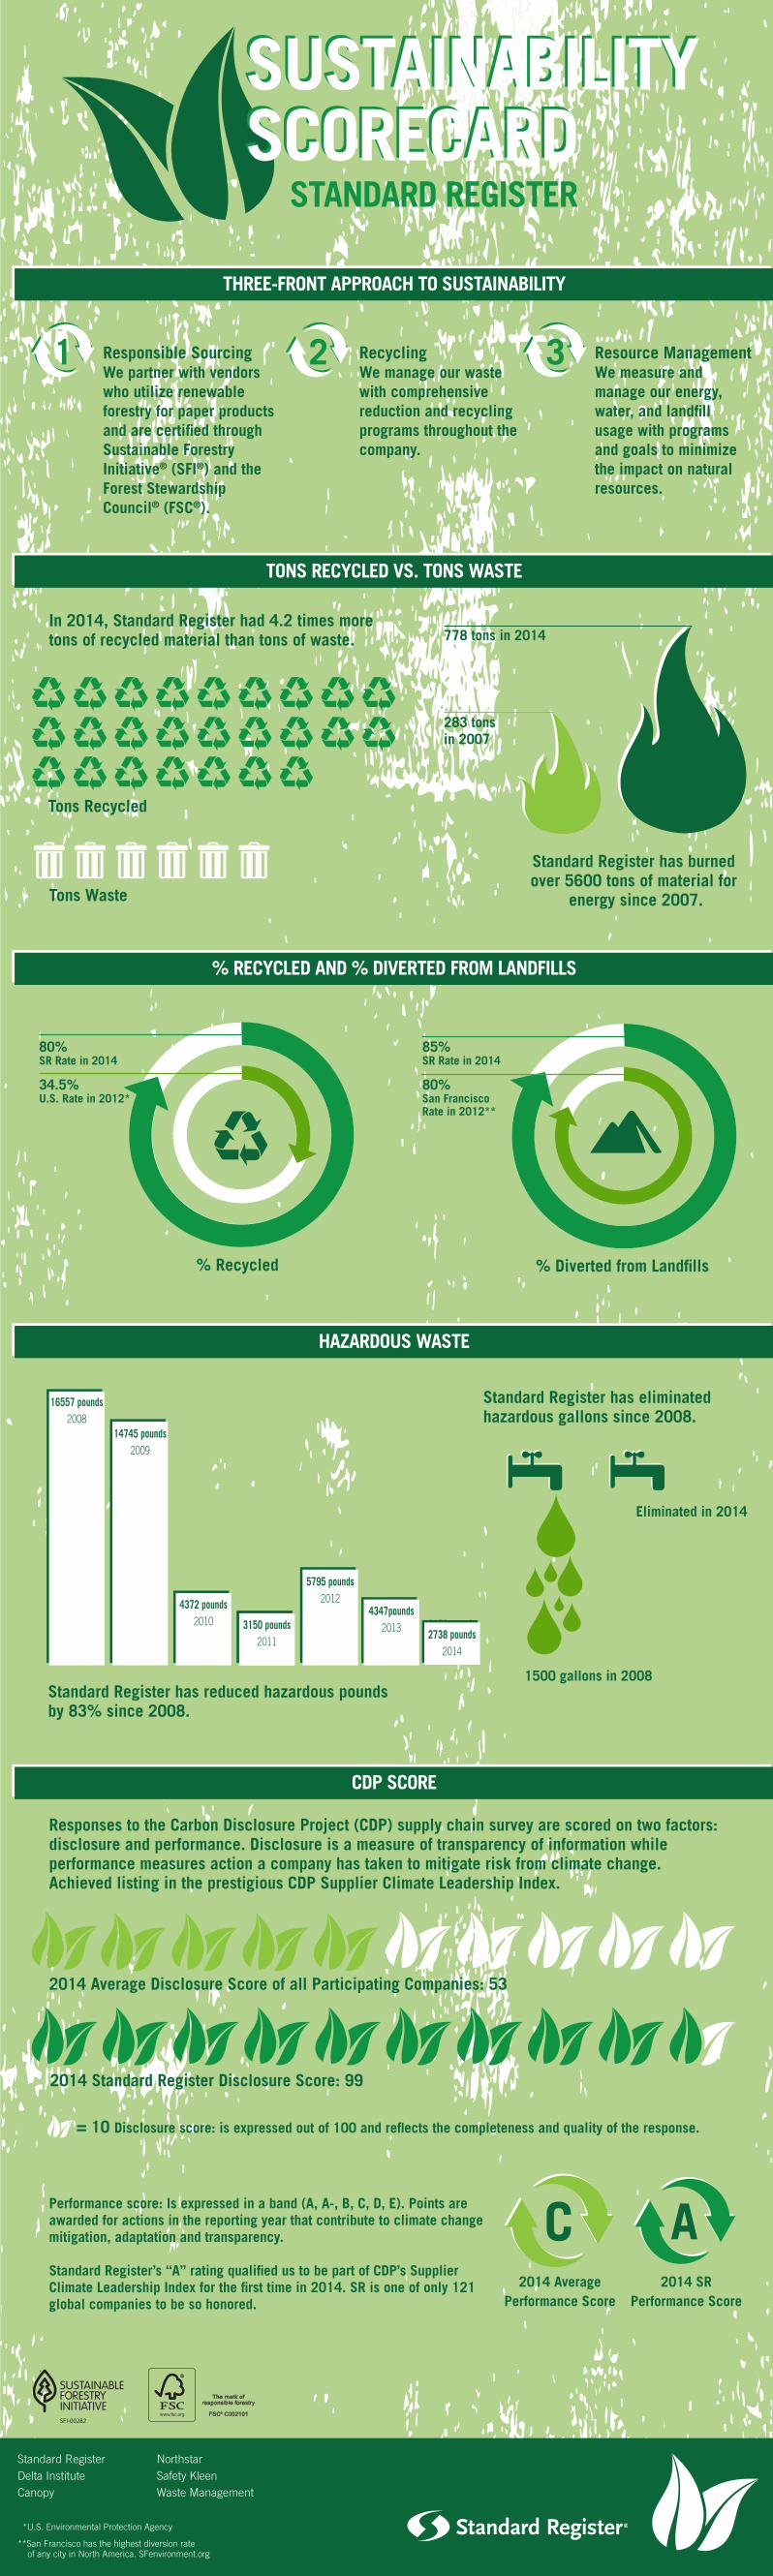
THREE-FRONT APPROACH TO SUSTAINABILITY
SUSTAINABILITYSCORECARDSUSTAINABILITYSCORECARD
STANDARD REGISTER
Responsible SourcingWe partner with vendors who utilize renewable forestry for paper products and are certified through Sustainable Forestry Initiative® (SFI®) and the Forest Stewardship Council® (FSC®).
RecyclingWe manage our waste with comprehensive reduction and recycling programs throughout the company.
Resource ManagementWe measure and manage our energy, water, and landfill usage with programs and goals to minimize the impact on natural resources.
1 2 3
TONS RECYCLED VS. TONS WASTE
In 2014, Standard Register had 4.2 times more tons of recycled material than tons of waste. 778 tons in 2014
Standard Register has burned over 5600 tons of material for
energy since 2007.
283 tons in 2007
Tons Recycled
Tons Waste
% RECYCLED AND % DIVERTED FROM LANDFILLS
% Recycled % Diverted from Landfills
80%SR Rate in 2014
34.5%U.S. Rate in 2012*
85%SR Rate in 2014
80%San Francisco Rate in 2012**
HAZARDOUS WASTE
Standard Register has reduced hazardous poundsby 83% since 2008.
16557 pounds2008
14745 pounds2009
4372 pounds2010 3150 pounds
2011
5795 pounds2012
Standard Register has eliminatedhazardous gallons since 2008.
1500 gallons in 2008
Eliminated in 2014
4347pounds2013
C A
2014 Average Disclosure Score of all Participating Companies: 53
2014 AveragePerformance Score
2014 SRPerformance Score
2014 Standard Register Disclosure Score: 99
= 10 Disclosure score: is expressed out of 100 and reflects the completeness and quality of the response.
Responses to the Carbon Disclosure Project (CDP) supply chain survey are scored on two factors: disclosure and performance. Disclosure is a measure of transparency of information while performance measures action a company has taken to mitigate risk from climate change. Achieved listing in the prestigious CDP Supplier Climate Leadership Index.
Performance score: Is expressed in a band (A, A-, B, C, D, E). Points are awarded for actions in the reporting year that contribute to climate change mitigation, adaptation and transparency.
Standard Register’s “A” rating qualified us to be part of CDP’s Supplier Climate Leadership Index for the first time in 2014. SR is one of only 121 global companies to be so honored.
CDP SCORE
SFI-00282
Standard Register Northstar Delta Institute Safety Kleen Canopy Waste Management
*U.S. Environmental Protection Agency
**San Francisco has the highest diversion rate of any city in North America. SFenvironment.org
3150 pounds2011
3150 pounds20112738 pounds2014