Standard Deviation - WordPress.com
16
Standard Deviation A measure of how spread out data are.
Transcript of Standard Deviation - WordPress.com
Standard Deviation
A measure of how spread out data are.
So, what is standard deviation?
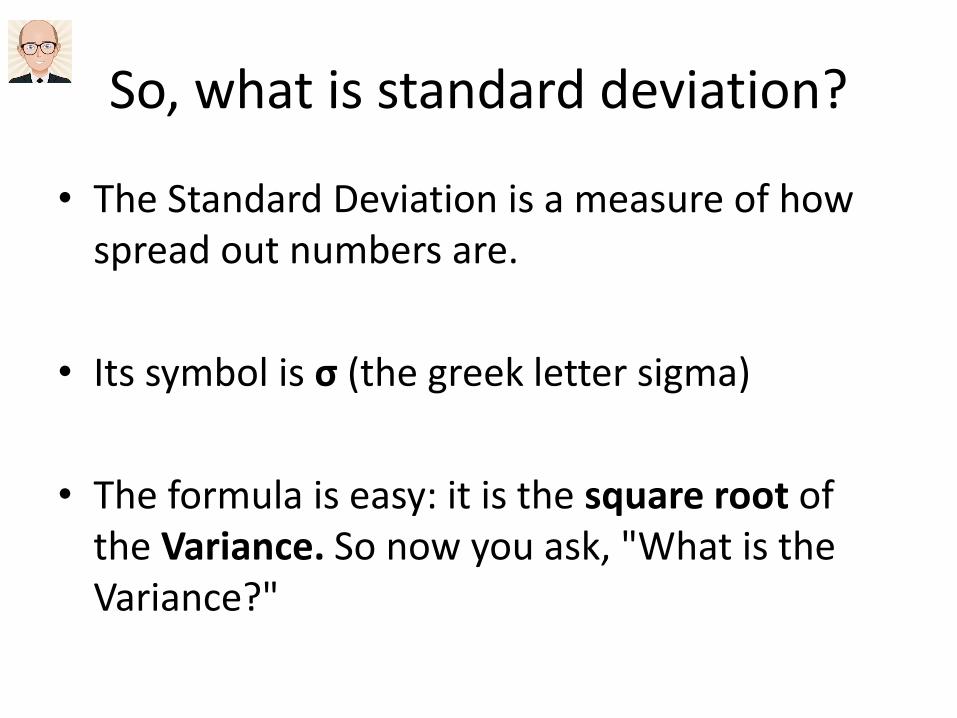
• The Standard Deviation is a measure of how spread out numbers are.
• Its symbol is σ (the greek letter sigma)
• The formula is easy: it is the square root of the Variance. So now you ask, "What is the Variance?"
Variance
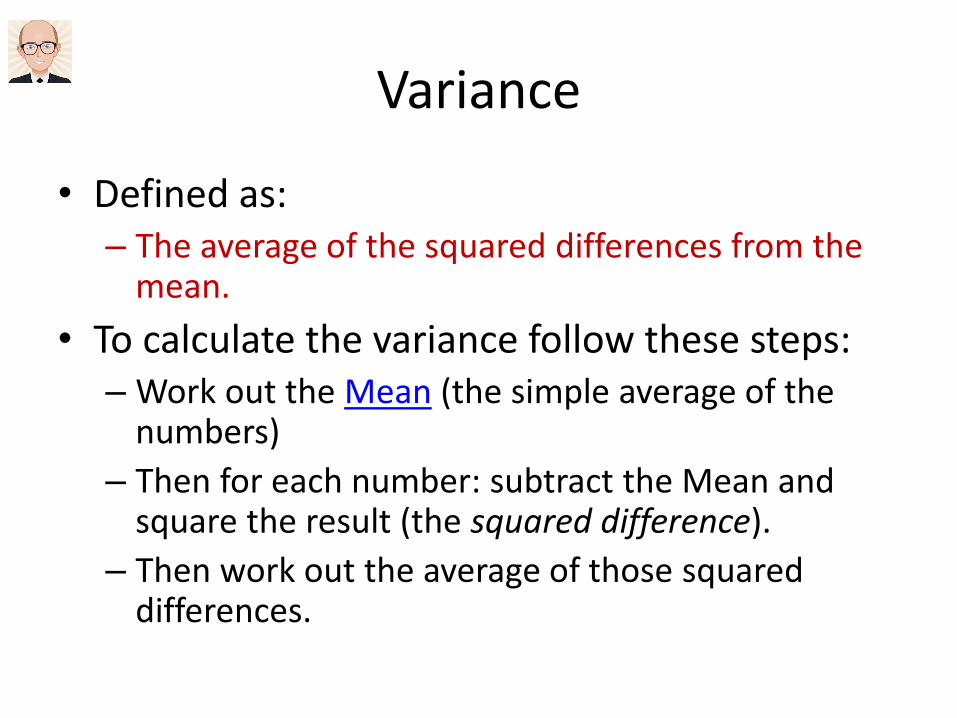
• Defined as:– The average of the squared differences from the
mean.
• To calculate the variance follow these steps:– Work out the Mean (the simple average of the
numbers)
– Then for each number: subtract the Mean and square the result (the squared difference).
– Then work out the average of those squared differences.
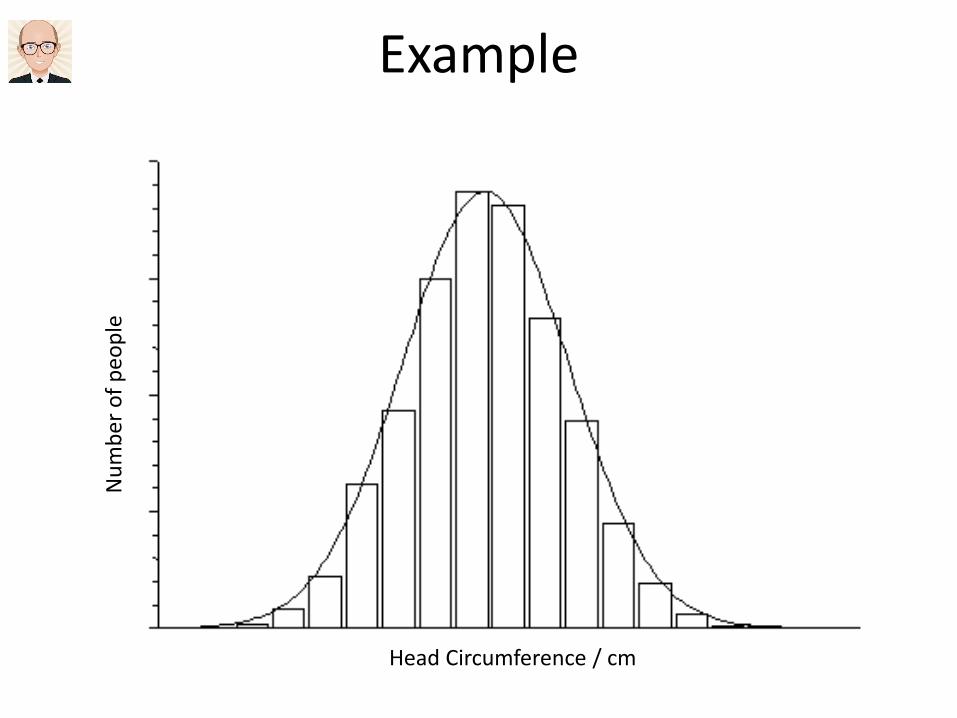
Example
Head Circumference / cm
Nu
mb
er
of
pe
op
le

• Normal distributions can vary in how big the spread of values is
• All normal distributions can be described if we know:
• The central point
• The degree of spread

Central Tendency
• Central tendency is indicated by the average
• In normal data the mean, median and mode are the same
• Usual to use mean
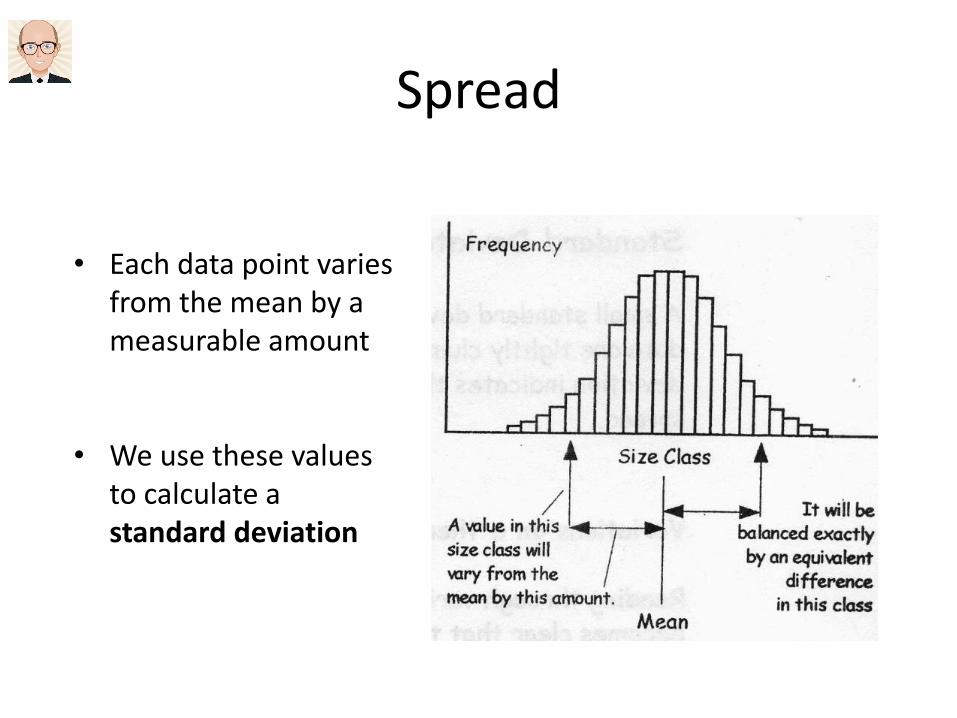
Spread
• Each data point varies from the mean by a measurable amount
• We use these values to calculate a standard deviation
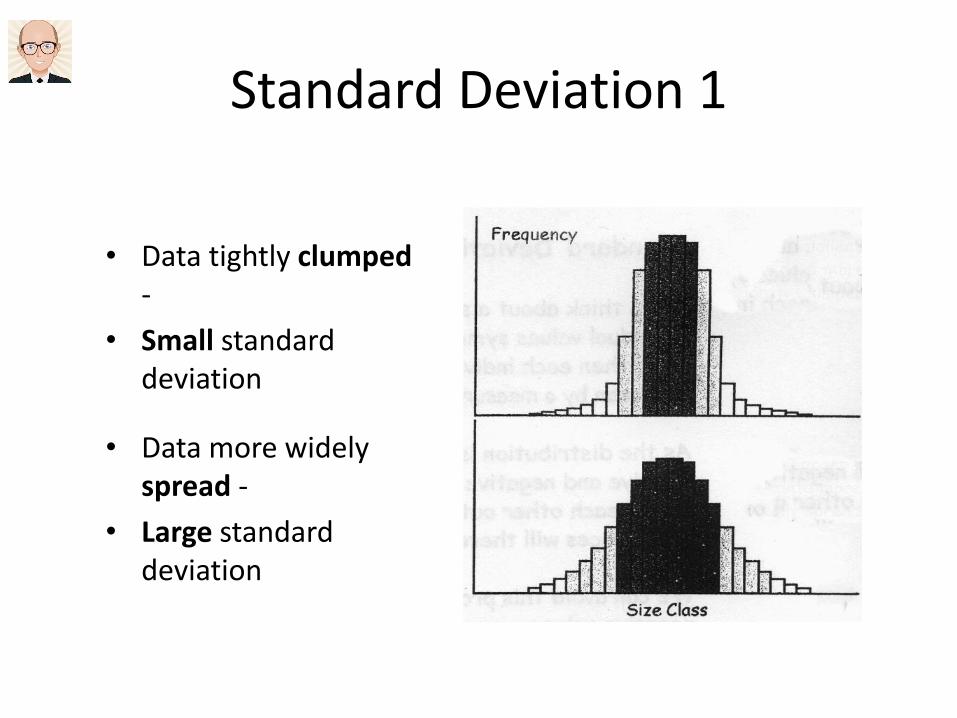
Standard Deviation 1
• Data tightly clumped-
• Small standard deviation
• Data more widely spread -
• Large standard deviation

Standard Deviation 2
• Whether large or small
• One standard deviation each way encloses 68% of all the values
• 1.96 S enclose 95% of all the values
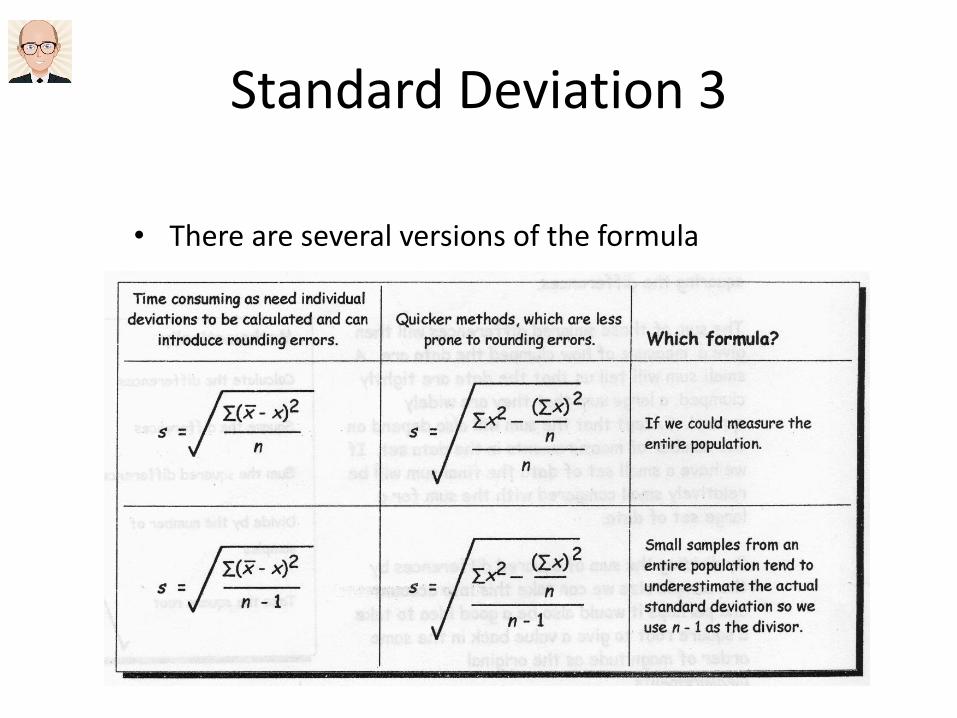
Standard Deviation 3
• There are several versions of the formula

Standard Deviation 4
• Fortunately, calculators can give you the standard deviation at the touch of a button…..but which one?

Real Data Ivy Leaves
• Once we have some data we need to…
• …check if they are normally distributed
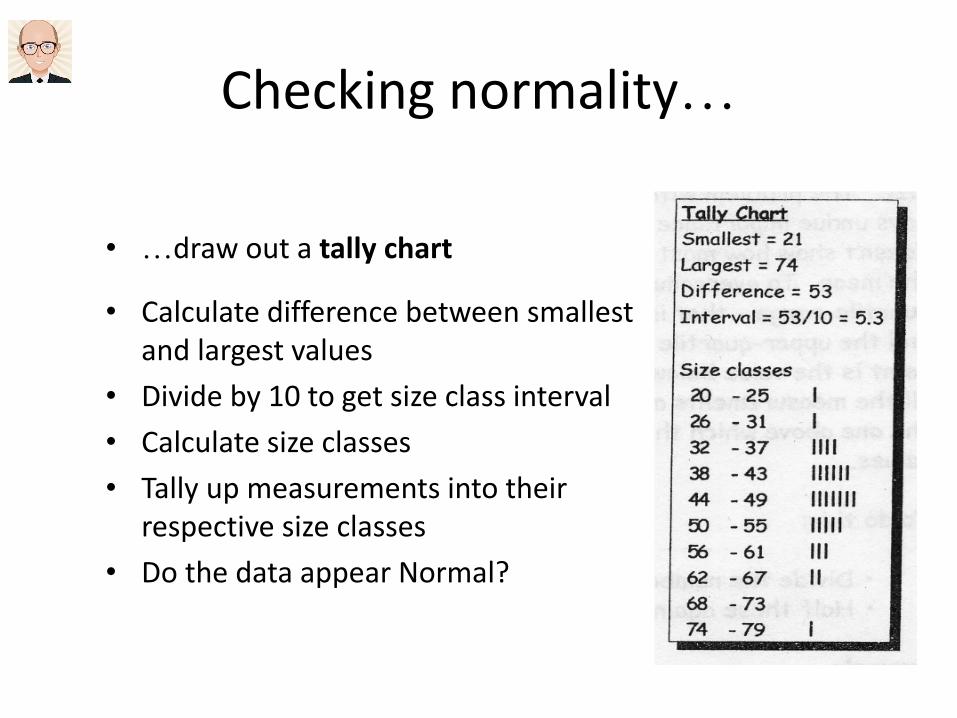
Checking normality…
• …draw out a tally chart
• Calculate difference between smallest and largest values
• Divide by 10 to get size class interval
• Calculate size classes
• Tally up measurements into their respective size classes
• Do the data appear Normal?
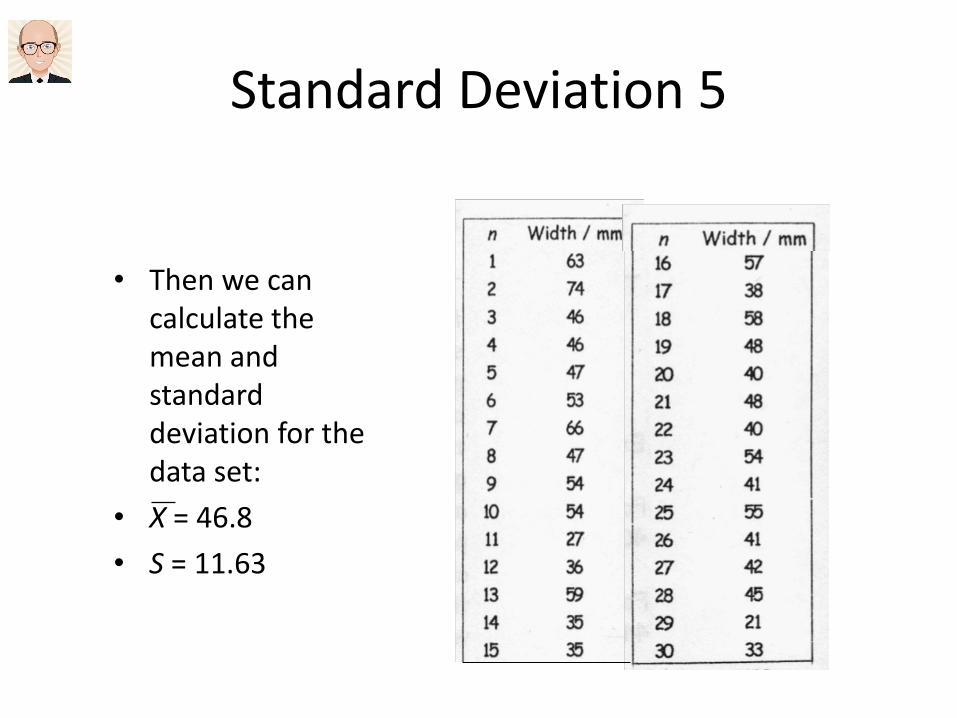
Standard Deviation 5
• Then we can calculate the mean and standard deviation for the data set:
• X = 46.8
• S = 11.63
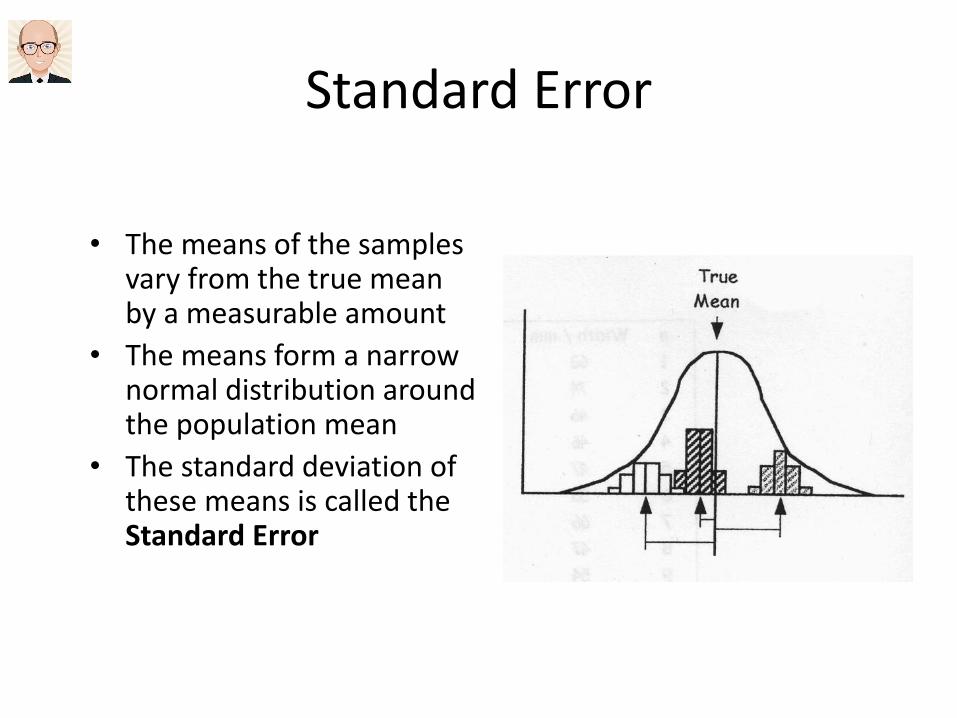
Standard Error
• The means of the samples vary from the true mean by a measurable amount
• The means form a narrow normal distribution around the population mean
• The standard deviation of these means is called the Standard Error

Standard Error 2
• The standard error is the standard deviation divided by the square root of the number of measurements, n.