Staging and Decisional Balance Measures for Two Diabetes ...
99
University of Rhode Island University of Rhode Island DigitalCommons@URI DigitalCommons@URI Open Access Master's Theses 1996 Staging and Decisional Balance Measures for Two Diabetes Self- Staging and Decisional Balance Measures for Two Diabetes Self- Management Behaviors Management Behaviors Janet Marie Dryfoos University of Rhode Island Follow this and additional works at: https://digitalcommons.uri.edu/theses Recommended Citation Recommended Citation Dryfoos, Janet Marie, "Staging and Decisional Balance Measures for Two Diabetes Self-Management Behaviors" (1996). Open Access Master's Theses. Paper 1695. https://digitalcommons.uri.edu/theses/1695 This Thesis is brought to you for free and open access by DigitalCommons@URI. It has been accepted for inclusion in Open Access Master's Theses by an authorized administrator of DigitalCommons@URI. For more information, please contact [email protected].
Transcript of Staging and Decisional Balance Measures for Two Diabetes ...

University of Rhode Island University of Rhode Island
DigitalCommons@URI DigitalCommons@URI
Open Access Master's Theses
1996
Staging and Decisional Balance Measures for Two Diabetes Self-Staging and Decisional Balance Measures for Two Diabetes Self-
Management Behaviors Management Behaviors
Janet Marie Dryfoos University of Rhode Island
Follow this and additional works at: https://digitalcommons.uri.edu/theses
Recommended Citation Recommended Citation Dryfoos, Janet Marie, "Staging and Decisional Balance Measures for Two Diabetes Self-Management Behaviors" (1996). Open Access Master's Theses. Paper 1695. https://digitalcommons.uri.edu/theses/1695
This Thesis is brought to you for free and open access by DigitalCommons@URI. It has been accepted for inclusion in Open Access Master's Theses by an authorized administrator of DigitalCommons@URI. For more information, please contact [email protected].

STAGING AND DECISIONAL BALANCE MEASURES
FOR TWO DIABETES SELF-MANAGEMENT BEHAVIORS
BY
JANET MARIE DRYFOOS
A THESIS SUBMITTED IN PARTIAL FULFILLMENT OF THE
REQIBREMENTS FOR THE DEGREE OF
MASTER OF ARTS
IN
PSYCHOLOGY
3 59 & ~ If t,o THE UNIVERSITY OF RHODE ISLAND
1996
BF &97 .5 s 4 3 0 '79L.f
199(::.

Abstract
Recent research shows proper performance of self-care regimens helps postpone
development, slow progression , and alleviate symptoms of the many complications of
diabetes mellitus. The Transtheoretical Model (TTM) is a systematic approach to the
acquisition of health behaviors , showing remarkable success across a wide range of
behaviors .
A total of 2056 participants with Insulin Dependent Diabetes Mellitus and Non
Insulin Dependent Diabetes Mellitus were proactively recruited, and assessed regarding
their typical performance of glucose testing and medication adherence . The two
constructs of the TTM that were investigated were Stage of Change and Decisional
Balance . For both behaviors , measure development followed the same procedure. When
a Principal Component Analysis requesting two factors resulted in all decisional balance
items loading on their theoretically appropriate constructs , the theoretical two-factor
correlated structure was imposed on an exploratory sample . The fit indices for this model
were excellent and the proposed model explained significantly more than even the next
best alternative model. This model was then imposed on a confirmatory sample and a
series of subsamples, and, again, fared quite well .
With high proportions of participants in the Action and Maintenance stages of both
behaviors , participants were reassigned to stage. Similarity of the single- and four-item
algorithms shows the algorithms are internally consistent , while the cross validations by
related variables provide external validity. Two-way Multivariate Anayses of Variance
were performed on decisional balance for both behaviors, one by stage and gender , and
the other by stage and type of diabetes . For glucose testing , neither interaction was
ii

significant, but all three of the main effects were . For medication, neither the interaction
of stage by gender nor the main effect for gender were significant, however , the main
effect for stage and the interaction of stage by type were .
As can be seen, staging and decisional balance constructs of the TTM hold up in
one area of chronic disease behavior management--diabetes self-management. Before
developing interventions, however , measures for the other constructs of the TTM need to
be developed . This study is only the first of many steps needed to develop an effective,
efficient intervention .
iii

Acknowledgment
First, and foremost , I would like to express my gratitude and apprec1at1on to Dr. Laurie Ruggiero . She started out as my supervisor when I began working at the Cancer Prevention Research Center my first semester in the Experimental program, four years ago . Shortly thereafter, she became my Major Professor and introduced me to the area of diabetes . More than that , however , during the many difficult times I have gone through in my life, she has been a patient ear--which is above and beyond the call of duty . She is a wonderful role model in many ways, and my respect for her is tremendous .
This project would not have been possible without the continuous and unlimited support of my methodologist, Dr. Joseph Rossi. His incredible statistical knowledge and skills combined with his patience and love of teaching lead to my being able to learn and accomplish a tremendous amount. Also on my committee is Dr. Geoffrey Greene, of Food Science and Nutrition . His detailed knowledge of diabetes and his different perspective contributed immensely to the many decisions that were made along the way .
I am forever indebted to my colleges, friends , and family whose practical , emotional , and psychological support enabled me to complete the enormous task that I set out to accomplish . Since all of them have been through it before, themselves , the practical support my colleges provide is enormous . Above and beyond that , however , they also identify with both the joys and the pains involved . Among my colleges are : Patricia Lee ; Dr. Gabe Reed; Arthur Little , Dr. Sara Little ; and Dr. Janice Tsoh .
My friends have endured a lot and their patience, understanding, and love is phenomenal. While going through difficult times of their own, they are always willing to provide me the support I need . Their unending interest in my life helps me to see things I wouldn 't otherwise see, as well as to see more clearly and from different perspectives the things I already see--keeping me grounded in reality. I am forever indebted to them . My two best friends are Lynda Dunnington and Cheryl Whitright ; others include Dana Clay, Lynn and Melinda Taylor, and my "adopted parents " John and Jennie Dunnington .
My family, albeit small, is wonderful. My brother , aunt, and grandfather in particular are terrific, and a welcome new addition to my family is my sister-in-law . Between them all, and all in different ways, they offer me the support, nurture, guidance, and help without which I would have had a most difficult time doing the things I have been able to do . Finally, I would like to thank my late mother . The relationship we had was incredible--in addition to being my mother she was my best friend . She taught me a lot while she was here, and I also learned a lot from her death. Her encouragement to pursue my dreams and what I wanted most in life lead to my being here today.
While I hope each person knows the things I've said here, too often the "obvious" things go unacknowledged , and it is then that we end up wishing we had said them .
Thank you, . . . everyone.
iv

Table of Contents
ABSTRACT .... ................. ........ ........... ............ ........ ...... .... ................. ...... .......... ............. ii
ACKNOWLEDGEMENT ........... ...... ............. .......... ............ ................ .......... ................ iv
TABLE OF CONTENTS ............. ............. ............... ................ ............... .. ........ ....... ....... v
LIST OF TABLES ..................................... .................................... ................. ............ Vlll
LIST OF FIGURES .... ..... ......... ..... ....... .... ..................... ............... ..... ......... .... ................ xi
INTRODUCTION .... .... ...... ........ ........... .... ....... ................... ......................... ................... I
Prevalence and Incidence of Diabetes ......................................... ..... ........ ............ ........ ]
Comorbidities and Predictors of Onset .............. ........ .... ..... .......................................... 2
Comphcations .................................................. ................. ............. ............. ............. .... 3
Diabetes Self-Management Behaviors ....... ....... ........ ....... .......... ................. .... ....... ... .... 4
Medication ....... ............ ..................................... ..... .... ......... ........ ..... ..... ...... .............. 5
Glucose testing ............... .................................... ........ ... ...................... ................. ..... 6
Factors Affecting Diabetes Self-Management ...................... ......... ............. ...... ......... .... 8
Treatment and disease variables ............ .......... ..................... ........ ..... ....... ..... ...... ....... 8
Sociodemographic variables ...... .... ........... ............. .......... .... .... .... ...... .... ..... ............... 8
Intrapersonal variables ............ ..... ......... ......... ........ ................. .............................. ..... 8
The Transtheoretical Model of Behavior Change .......... ... .................. .......................... 9
Stages ....... ..... ..... ... ............. .............. ......... .......... .......... ........................... .......... .... IO
Processes ...... ............ .......... .......... ............ ....... ....... .... ................. ..... ........ .............. I I
\I

Decisional balance ........................ ..... ............. ................... .... ................. .... ......... .... 12
Self-efficacy .......... ... .......... .......... ......... ...... .......... ......... ......................... ................ 12
A I. . d l'"' pp 1cat1on an success ........ ................... ...... ...... ............... ............... .... .................. _,
METHOD .... ......... .................. ..... ... ..... ............ ............... ................ ... .......... ..... ... .... ..... 14
Participants ............. ....... ......... ....... .................. .......... ........ ..................... .... ...... ......... 14
Measures ..... ....... ... ..... .............. ..... ........... ...... ................ .... ...... ........ ........ ..... ........ ..... 17
Staging ................... ........... ............ .......... .... ............................ ........ ... ....... .............. 17
Decisional balance ...... ........ ........... ................ ........ ...... ......... .................. ................ . l 7
Procedure .... .............................. ................ ...... ........... ............... .................. ........ ...... J 8
RESULTS .................... ........ .......... .... ..... ...... ................ .................... ........ ...... .............. 20
GL UCOSE T ESTING ..... . ... . . .. .. .... .. ...... .............. . ............ . ... ... ... .. ..... . .. ... . . ..... . . ... .. . ... . . ... . . ... 20
Glucose Testing Decisional Balance Measure Development ...... ...... ....... .................... 20
Principal Components Analysis ...... ..... ............... ............ ... ....................... ..... ........... 20
Confirmatory Factor Analysis: The Two Factor Correlated Model.. ......................... 20
Comparison models ... .................... ....... ... ...... ............ ........... ........ ...... ........ ....... ...... 21
Cross validation ........ ... ... ................ .... ..... ..... ...... ............. ....................... ................. 23
Applicability of final model to sub-populations ................... ..................................... 23
Staging Algorithms ......... ...... ........................... ... ...... ...... ........... ............... ................ .. 24
Predicting Stage from Decisional Balance: Discriminant Function Analysis .............. 25
Stage Diffe rences on Decisional Balance: Multivariate Analysis of Variance ......... ... 26
Decisional balance by stage and gender ....... ... ...................... .............. .... ...... .... ....... . 26
Decisional balance by stage and type of diabetes ................. ..... .... ... .............. ........... 28
vi

MEDICATI ON ... .... ... . .... .. ..... ... .. .. . ... . .. .. ...... ... .. .. . ................... ..... ...... ... . ...... .. ..... . . .. ... . .... .. . 29
Medication Decisional Balance Measure Development ............ ............. .......... ........... 29
Principal Components Analysis .... : ......... ............. ............. ....... ............... ... ............... 29
Confirmatory Factor Analysis: Two Factor Correlated Model.. .............. ... ............... 30
Comparison models ......................... .... ..... .......................... ............ ......................... 30
Cross validation ........ ................... ........... .................................. .......... ...... ........ ..... .. 32
Applicability of final model to sub-populations ..... ....... ........ .......... ................. ......... 32
Staging Algorithms .... .... .......... .......... ...... ....... ...... .......... .......................... .... ....... ....... 3 3
Insulin adherence ....... ................................ ....................... ...... ........... ...................... 33
Pill adherence ............ .............. .................... ...... ............. ................... ........ .............. 34
Stage Differences on Decisional Balance: Multivariate Analys is of Variance ...... .... .. 34
Decisional balance by stage and gender ..... ..... ....... ...... ...... ......................... .... ...... .... 34
Decisional balance by stage and type of diabetes ........ ....... ... .... .......... ......... ....... ..... . 3 6
DISCUSSION .... ................ ........ ............. .................... ..................... ........ ....... ..... ......... 36
BIBLIOGRAPHY ...... ............ ..... ............. .... ............. .............. ........... .... ........... ... ......... 79
vu

List of Tables
TABLE 1 FREQ UENCIES FOR THE REPRESENT ATIVE AND A UGMENTED SAMPLES A CROSS THE
WHOLE SAMPLE AND BY TYPE OF DIABETES .. .. ..... . .. .. .. . .. . ... ...... ........ . ...... . ... . .... . ........... 40
TABLE 2 DEMOGRAPHICS AND KEY VARIABLES FOR THE WHOLE SAMPLE AND BY TYPE OF
DIABETES ..... . . . . . . . ...... .. ... .... .. . .. ... . ... . . . .... .. . . .. . .. .... .. .. ...... . ........ .. .. .......... . . . . . ...... . ... . ..... 41
TABLE 3 STAGE DISTRIB UTIONS USING THE O NE-ITEM ALGORITHM FOR ALL THREE
BEHAVIORS PRIOR TO RE-STAGING A CROSS THE WHOLE SAMPLE AND BY TYPE OF
DIABETES .. .......... . ........... . ............. . .. . .. . ...... . . . .... . .... .. ....... . ... . . ... ............ . ..... .. . ..... . . ... . 42
TABLE 4 GE NERAL HEALTH STAT US VARIABLES ACROSS THE WHOLE SAMPLE AND BY TYPE OF
DIABETES .... .. .... .. . .. .. ........ . .. .. . .... .. ... . ....... . .. . ... . ... . .................. . .. ... ....... ......... . .. . .. .. ..... 43
TABLE 5 HEALTH STATUS VARIABLES SPECIFIC TO GLUCOSE TESTING A CROSS THE WHOLE
SAMPLE AND BY TYPE OF DIABETES . . .. .............. . ... .... .... .. .. . . ..... .... .. ..... . ...... . .. .. .. . ... .. .... 44
TABLE 6 HEALTH STATUS VARIABLES SPECIFIC TO INSULIN ACROSS THE WHOLE SAMPLE AND
BY TYPE OF DI ABETES ....... . ... ... ......... . .... . .......... ....... . ... . .. .... .. . .. ...... .. . .. ... ... . . .. . ...... ... ... 45
TABLE 7 HEALTH STATUS VARIABLES SPECIFIC TO ORAL DIABETES MEDI CATION A CROSS THE
WHOLE SAMPLE AND BY TYPE OF DI ABETES ..... ...... ... . ... .. .... .... .... .... ... .. . .. . . .. .. .. .. . .... .. . . .. 46
TABLE 8 FIT INDICES FOR GLUCOSE TESTING DE CISIONAL BAL 4NCE: ExPLORATORY CFAS
R UN ON THE FIRST H ALF OF THE SAMPLE (N=597); CONFIRMATORYCFA R UN ON THE
SECOND H ALF OF THE SAMPLE(N=6 07) .... . .............. . ........ . ... ..... . . .. . ...... ......... .. ........ .. 47
TABLE 9 FA CTOR LOADI NGS FOR GLUCOSE TESTING DE CISIONAL B ALANCE: EXPLORAT ORY
CFASR UN ONTHEFIRST H.4LFOFTHE SAMPLE (N= 59 7); CONFIRMATORY CF A R UN ON
THE SECOND H ALF OF THE ,SAMPLE(N=607) .. . . .. .. .. . . . ....... .. . .. .. .... ... . . .. ........ ................ . 48
viii

TABLE 10 CHI-SQUARE DIFFERENCE TESTS BETWEEN THE Two FACTOR CORREl.ATED
MODEL FOR GLUCOSE TESTING DECISIONAL BALANCE AND EACH COMPARISO N MODEL49
TABLE 11 FIT INDICES FOR THE FINAL Two FACTOR CORREI.ATED MODEL FOR GLUCOSE
TESTING DECIS10NAL B ALANCE RUN ON THE OVERALL SAMPLE AND THEN ON DIFFERENT
SUB-SAMPLES ....... ... ..... . .............. ... ... ..... .. ... ... ... . .... ... . ... .. .... ....... ....... .. .... .. .... ... ... ..... 50
TABLE 12 FACTOR LOADINGS FOR THE FINAL Two FACTOR CORREI.ATED MODEL FOR
GLUCOSE TESTING DECIS10NAL BALANCE RUN ON THE OVERALL SAMPLE AND THEN ON
DIFFERENT SUB-SAMPLES .... ..... .. . .. . .... ... .. . .. .... .. .. ..... ... .. .... .. . .. ...... ..... .. .. ... . .. . .. .. ... . ..... 51
TABL E 13 STAGE DISTRIBUTIONS USING THE ONE-ITENI ALGORITHM FOR ALL THREE
BEHAVIORS ACROSS THE WHOLE SAMPLE AND BY TYPE OF DIABETES ... . ...... ... . ...... ...... . 52
TABL E 14 CI.ASSIFICATION RESULTS OF A DFA Rl!N ON THOSE STAGED FR0/1.1 PC TO
MAI NTENANCE (N=338) IN ORDER TO Pl.ACE DOCTOR'S STANDARD GROUP (N =682) AND
DON'T KNOW STANDARD GROUP (N=209) INTO A FOUR-STAGE MODEL ... . ... . ...... ... ..... 53
TABLE 15 THEPROSAND CONS OF GLUCOSE TESTING BY STAGE OF GLUCOSE TESTING,
GENDER, AND TYPE OF DIABETES .... .... ... ...... ... .. . ... ...... ... ...... .... .. ..... ... ... .. ... . . ........ ..... 54
TABLE 16 FIT INDICES FOR MEDICATIO N DECJS10NAL BALANCE: ExPLORATORY CFAS R UN
ON THE FIRST HALF OF THE SAMPLE (N= 784); CONFIRMATORY CF A Rl !N ON THE SECOND
HALF OF THE SA!v!PLE(N=789) ................ ... . .. .. .. . .. .. ... . ..... ...... ... ... . ..... .. .... ... . ... . ... ........ 55
TABLE 17 FACTOR LOADINGS FOR MEDICATION DECIS10NAL BAI.ANCE: ExPLORATORY CF AS
R UN ON THE FIRST HALF OF THE SAMPLE (N=784); CONFIRJv!ATORYCFA Rl !N ON THE
SECOND HALF OF THE SAMPLE(N=789) ... .. ... ..... ...... .. .. .. .. .. ... ..... ... .. ... . ........ ... . ... ........ 56
TABLE 18 CHI -S QUARE DIFFERENCE TESTS BETWEEN THE Two FACTOR CORREI.ATED
MODEL FOR MEDICATION DECIS10NAL BALANCE AND EACH COMPARISON MODEL ..... .. 57
ix

TABLE 19 FIT INDICES FOR FI NAL Two FACTOR CORRELATED MODEL FOR MEDI CATION
DE CISIONAL B ALANCE R UN ON THE O VERALL SAMPLE AND THEN ON DIFFERE NT S UB-
SAMPLES ..... .. . . . ... .. . ....... .. ...... .. .. . . .. .. ... ... .. . ... . ... . .. .. . . ..... ... . ..... . . . .... . ... ... ... . .. . .. ... ... . ... . .. 58
TABLE 20 F AC TOR L OADINGS FOR FI NAL Two F AC TOR CORRELATED M ODEL FOR
MEDI CATION DE CISIONAL BALA NCE Rl !N ON THE O VERALL SAMPLE AND THEN ON
DIFFERE NT S UB-SAMPLES ....... . .. .. .. . .. . .. ... .. ... .. . ... . .... . . .. . .. .. . . . . .. . .. . ... .... . ... ... ... . . .. ... . . . . ... 59
TABLE 21 THE PR OS AND CONS OF MEDI CATION BY STAGE OF MEDI CATION, GE NDER, AND
STAGE BY TYPE OF DIABETE S .... .. .. . ...... .. . .. .. ........... . .... . .. ......... . ... . . .. .. . . ... . . ........ . .. . .... .. 60
X

List of Figures
FIGURE 1. Two FACTOR CORRELATED CFA FOR GLUCOSE TESTING DECISIONAL BALANCE
ON EXPLORATORY SAMPLE (N=579) .... .. .. . ... ... ... . .. . . .. ... . ........... . .. . .. . ... . ....... . .... . ... ... . .. 61
FIGURE 2. Two FACTOR CORRELATED CF A FOR GLUCOSE TESTING DECISIONAL BALANCE
ON CONFIRMATORY SAMPLE (N=607) . .. .. . ... ......... . . ... . . . .. . .. .. ... . . . . .. . .. ... . . .. . ... .. . .... . . . . .... 63
FIGURE 3. GLUCOSE TESTING DECISIONAL BALANCE BY STAGE OF CHANGE FOR GLUCOSE
TESTING, WHOLE SAMPLE (N=l055) . . ... . ........... . ... . .... . ..... . ... . .... ... ... . ..... .. ... . . .. .... . ...... 65
FIGURE 4. GLUCOSE TESTING DECISIONAL BALANCE BY GENDER; WHOLE SAMPLE
(N=1055) . .. ... . . . .. .. .. ... .. . . .. . .. .. . . ..... . .. .... .. .. .. ... .. .. .. . . . ... . .. .. .. . . .. . . .. ... . . .. .. .. . . .. . . . . . .. . . . .. .. . . .. 67
FIGURE 5. GLUCOSE TESTING DECISIONAL BALANCE BY TYPE OF DIABETES ; WHOLE SAMPLE
(N=992) . .. ............ . .. .. . . . . ............ . .. ... . . .. . ... .. . .. .. .. . ... . . . ... ...... . .. .. . . . ..... . .. . ...... . ...... .. .. ..... 69
FIGURE 6. Two FACTOR CORRELA TED CF A FOR MEDICATION DECISIONAL BALANCE ON
EXPLORATORY SAMPLE (N=784) .. . .. . .. . .......... . ....... . .... .... . ............ . .. .... . .. .. .. .. . ..... . ... ... . 71
FIGURE 7. Two FACTOR CORRELA TED CF A FOR MEDICATION DECISIONAL BALANCE ON
CONFIRMATORY SAMPLE (N=789) . .. .. . .... . . ... .. . .. .. . . .. . .. . .... . . . . . .. . .. . . .. .. . .. . ... .. . .. .... . ... . .... . 73
FIGURE 8. MEDICATION DECISIONAL BALANCE BY STAGE OF CHANGE FOR MEDICATION;
WHOLE SAMPLE (N=l048) . . ... . . ...... . . ... . .......... . . .. . ... .. . .... . ... . . . .. . ........ ..... . ......... . .. .. . ..... 75
FIGURE 9. MEDICATION DECISIONAL BALANCE BY STAGE OF CHANGE FOR MEDICATION
AND TYPE OF DIABETES; WHOLE SAMPLE (N=985) . ...... ... .. ....... . ...... . . ... ... ... .. .. . ... ....... 77
XI

Prevalence and Incidence of Diabetes
Diabetes mellitus is a heterogeneous family of chronic systemic diseases whose one
common feature is the body's inability to properly metabolize sugar. This inability is the
result of the decreased secretion or activity of insulin. Its statistics are staggering .
Diabetes is the third leading cause of death by disease in the United States , preceded only
by heart disease and cancer (Cox , Gonder-Frederick, Pohl , & Pennebaker , 1986;
Ignatavicius & Bayne, 1991 ), and it is the leading cause of blindness, lower extremity
amputations , and kidney transplants in the United States (Cox & Gonder-Frederick ,
1992) . According to the American Diabetes Association (ADA, 1993), approximately 5%
of Western populations are affected with diabetes , which means that there is an estimated
total of 13 million Americans who have diabetes--over half of whom are not even aware
that they have the disease . Annually, more than 650 ,000 people are diagnosed with
diabetes , and more than 150,000 people die from it. Its treatment costs over $90 billion
per year in both direct costs (such as payment for health care services rendered) and
indirect costs (such as decreased productivity and disability) .
Furthermore , the prevalence , incidence, and mortality rates of diabetes reflect a
bias towards older people, women , and minorities. Both incidence (number of new cases
each year) and overall prevalence (total number of current cases) increases with age across
races , but minorities are consistently higher . For example , prevalence increases with age
until finally, in the 65-74 year old age bracket , it reaches 17% of whites , 26% of African
Americans , and 33% of Hispanics . Although incidence is decreasing for women and
increasing for men, it is still higher among women (ADA, 1993).

2
The two most common types of diabetes mellitus are insulin dependent diabetes
mellitus (IDDM) or Type I diabetes and non-insulin dependent diabetes mellitus (NIDDM)
or Type II diabetes . IDDM is usually diagnosed early in life--before age 30, but primarily
during childhood--and people with IDDM need exogenous insulin to survive . NIDDM is
usually diagnosed later in life--after age 30--and people with NIDDM have a much more
varied regimen . Some people with NIDDM can use just diet and exercise to control their
glucose levels, others use hypoglycemic oral medication , and others need exogenous
insulin.
Sometimes NIDDM can start , and continue undiagnosed for quite a while.
Unfortunately , undiagnosed NIDDM is not a benign condition . According to Harris et al.
(Harris , Klein, Welborne, & Knuiman, 1992), untreated hyperglycemia is a major risk
factor for retinopathy , renal impairment , and sensory neuropathy . These complications
both begin and progress prior to the diagnosis of NIDDM . Among newly diagnosed
NIDDM patients, macrovascular complications are two to three times more common than
in people with normal glucose tolerance (Harris, et al., 1992). In general , people with
diabetes are two to four times more likely to die from cardiovascular disease and are at
least four times more likely to have peripheral vascular disease than people without
diabetes (ADA, 1993).
Comorbidities and Predictors of Onset
Family history of diabetes , obesity, poor dietary intake, lack .of exercise , high
glucose levels, and even low education levels, low income, and urbanization (which
usually is associated with changes in diet, physical exercise , and socioeconomic status ) all
predict the development of diabetes (ADA, 1993; Zinman, 1984; Zinman & Vranic , 1985).

3
Estimates of the percentage of all people with diabetes who have NIDDM vary between
80% and 95%, of which 60% to 90% are obese (Cox & Gonder-Frederick , 1992;
Hampson, Glasgow , & Toobert, 1990). In addition to predicting the onset of diabetes ,
obesity is also associated with insulin resistance, and exacerbates the risk of cardiovascular
disease (Abrams , Steinberg, Follick, & Raciti , 1986).
Complications
As was previously stated, the degree of complications and the rate at which they
develop are related to control of glucose levels (DCCT , 1993; Ignatavicius & Bayne ,
1991 ). Unfortunately , even with strict adherence to medication , glucose testing , diet, and
exercise behaviors , glucose levels still fluctuate excessively , and complications eventually
arise (Cox & Gonder-Frederick, 1992). Complications include : retinopathy, neuropathy ,
nephropathy, and both peripheral (micro-) and coronary (macro-) vascular disease (both of
which occur at accelerated rates; Cox & Gonder-Frederick , 1992; Ignatavicius & Bayne ,
1991; Rossini , Mordes, & Like, 1985) . Onset of these complications is not usually
predictable , but some of them can be treated (Knuiman , Welborne , McCann , Stanton , &
Constable, 1986). Many studies have been conducted in order to find correlates of
diabetic complications . The results of these studies indicate both good and bad news .
The good news is that some of the correlates can be controlled . For instance , the
Diabetes Control and Complications Trial (DCCT, 1993) followed 1441 patients for an
average of 6. 5 years . After. being randomly assigned to either the intensive (i.e., frequent
testing of blood glucose, adjusting insulin doses according to glucose levels, more
frequent contact with physicians) or conventional treatment regimens , the results showed
that those in the more intensive treatment regimen had a lower cumulative incidence of all

4
of these complications than those in the conventional regimen . This was a phenomenal
finding. Although for many years this was thought to be true , the DCCT was the first
experimental trial to show it. Some of these group differences , however, did not appear
until rather late in the study (i.e ., after three to five years of treatment) and even then, they
only appeared after strict adherence to the regimen for this lengthy period of time .
Furthermore , as may be indicated by their adherence levels alone, this study was
composed of a very specialized sample of people with diabetes , thus its generalizability
may be quite limited. Generalizability issues not withstanding, the potential control of and
reduction in complications via behavioral change opens up a whole new arena for
psychological interventions in the medical world .
The bad news regarding complication correlates is that some of them cannot be
controlled . For instance, using both IDDM and NIDDM patients, Knuiman et al. (1986)
found that age, duration of diabetes, and age at diagnosis are the best time-related
correlates of diabetic complications . Interestingly , neither complication occurrence rates
nor risk-factor profiles differed between IDDM and NIDDM patients , suggesting that
interventions (such as those used in the DCCT) may be able to be applied across different
types of diabetes .
Diabetes Self-Management Behaviors
Upon diagnosis , people with diabetes must make major life-style changes (Curry ,
Kristal , & Bowen, 1993; Hampson, et al., 1990). These changes include the peiformance
of many self-care behaviors , which puts a tremendous burden on the patient (Cox , et al.,
1986; Surwit , Fenglos , & Scovern , 1983). Regimen behaviors include the administration
of medication , testing and recording of blood or urine glucose levels, modification of

5
dietary intake, adoption of physical activity, performance of routine foot care procedures.
management of weight , attendance of regular eye examinations, reduction of stress. and
cessation of smoking habits (Clark & Abrams , 1993; Cox & Gonder-Frederick, 1992;
Curry , 1993; Galvotti & Fava, 1993; Heiby, Gafarian , & McCann, 1989) . Obviously ,
these behaviors make the treatment of diabetes very complex and intense (Hampson, et al.,
1990) . The behaviors themselves are extensive, continuous , tedious , expensive, and
(sometimes) even aversive (Cox , et al., 1986) . The daily performance of these behaviors
is no small task and is particularly difficult to do on a regular basis .
Medication. Insulin plays a crucial role in the body's ability to metabolize glucose ,
free fatty acids, and amino acids . Perhaps most importantly, insulin enables cells to absorb
glucose, which is a major source of energy (Ignatavicius & Bayne, 1991). Using
medication, inadequate amounts of insulin can be compensated for in two different ways .
First , insulin can be injected into one's body , which, as was previously stated, is the
method the IDDM patients must use, and the method that some NIDDM patients use .
Second, oral hypoglycemic medications can be taken , which stimulate one's pancreas to
produce more insulin of its own and decrease insulin resistance , which is the method that
other NIDDM patients use .
Of all people who have diabetes, there are 27% who use insulin, 35% who use oral
diabetes medications, 14% who use only diet, and, disturbingly , there are actually 24%
who use none of these .therapies. These types of therapy vary by age,. with the younger
and middle-aged age groups being more likely to use insulin, and the older age groups
being more likely to use oral agents and diets. In addition , these treatments also vary by

6
race, with insulin being used more frequently among African-Americans , and Hispanics
being the most likely to be untreated , (ADA, 1993).
Without adequate amounts of insulin, the level of glucose in the blood rises above
the target range . High levels of glucose in the blood is known as hyperglycemia .
Conversely , with excessive amounts of insulin, the level of glucose in the blood falls below
the target range . Low levels of glucose in the blood is known as hypoglycemia . In both
cases , side effects can range from quite mild ones, such as headaches and irritability, to
ones as severe as coma and even death (lgnatav icius & Bayne , 1991).
Adherence rates for long-term treatment regimens in general are quite poor-
between 41 % and 69% with a mean of 54% (Sacket & Snow, 1979). Granted that there
are problems with defining "adherence " and that there are likely to be differences in
adherence rates between problem areas (as a function of regimen complexity, patient
population , etc.) , even so, these rates are quite discouraging. Fortunately, adherence rates
for diabetes treatment regimens tend to be better (Glasgow, McCaul , & Schafer , 1987;
Glasgow, Toobert , Hampson , Brown , Dewinsohn , & Donnel y, 1992) . For example ,
according to Glasgow et al., (I 987) , among people with IDDM , 92% have never missed
an injection , and 77% take their injections within 30 minutes of the prescribed time or
activity.
Glucose testing. Glucose self-monitoring (using either blood or urine) is an
important diabetes self-management behavior because it enables the patients to keep their
glucose levels within their target ranges , and to prevent episodes of hypo- or
hyperglycemia . We know from the DCCT (1993) , that tighter control of glucose levels
(medicating and testing more frequentl y, and following a diet and an exercise plan)

7
reduces both the incidence and the progression of the complications associated with
diabetes. However , it is not the performance of glucose monitoring , in and of itself, that
leads to better diabetes self-management (Baumann & Dougherty, 1988). Glucose
monitoring simply leads to the ability to better control one's glucose levels. It is how one
utilizes the glucose monitoring information to control glucose levels that leads to better
diabetes self-management, which is the key to delaying the onset of complications
(Ignatavicius & Bayne , 1991).
Estimates of the percentage of people who test their blood glucose at least once a
day vary from 33% to 50% (ADA, l 993 ; Ignatavicius & Bayne , l 991) . Broken down by
type of diabetes : 79% of IDDM patients test their glucose at least once a day, 53% of
insulin-using NIDDM patients test their glucose at least once a day, and 24% of non
insulin using NIDDM patients test their glucose at least once a day (Ignatavicius & Bayne,
1991).
When looking at the performance of any testing at all over the course of a week ,
the percentages are relatively high. They range from 83% to 88% (Gonder-Frederick,
Jullian, Cox , Clark, & Carter, 1988; Hirsch, Matthews, Rawlings, Breyfogle , Simonds, &
Kossoyu, 1983; Wing, Epstein, Nowalk, Scott, & Koeske, 1985) . However, this is the
percentage of people who are measuring their glucose levels at all and is NOT to be
interpreted as being the percentage of people who test their glucose levels with the same
frequency as they were instructed by their physician. Moreover , these. frequencies were
based on self-reported data, which is known to overestimate actual frequencies (self
report or subject-response bias; Wing, et al., 1985). When measuring the percentage of
people who are performing glucose testing with the same frequency as they were

8
instructed by their physician, studies report adherence rates of 32% to 68% (Gonder
Frederick , et al., 1988; Wing, et al., 1985). These frequencies include both self-reported
and marked item studies.
Factors Affecting Diabetes Self-Management
Treatment and disease variables. Adherence to medical regimens rs a very
complex phenomenon . It is a function of many factors and, as such, is not easily
predicted . Some treatment related factors that impede adherence to diabetic regimens
include behavioral restriction (i.e ., lifestyle change) , length of treatment durations (i.e .,
one's entire remaining lifetime), frequency of behavior performance (i.e., up to several
times daily), and delayed effects of non-adherence (i.e., up to several years later ;
Rainwater , 1983) . Adherence also reportedly varies with the degree to which normal
functioning is interrupted , and the degree to which the doctor and the patient agree on the
prescribed regimen (Eckerling & Kohrs, 1984).
Sociodemographic variables. Perhaps as may be expected , people who have more
years of education adhere more closely to their prescribed regimens than people with
fewer years of education (Polly, 1992) . Interestingly, however , women have a higher
knowledge about diabetes than men (McCaul , Glasgow , & Schafer , 1987) , while men
have a higher overall adherence than women (Littlefield , Daneman , Craven , Murry , Rodin ,
& Rydall, 1992) .
Intrapersonal variables. Adherence to prescribed regimen behaviors reportedly
varies with such cognitive variables as perceived health , perceived barriers, and self
efficacy (Irvine , 1989; Kavanagh , Gooley , & Wilson, 1993; Littlefield , et al., 1992;
Padgett , 1991; Polly, 1992) . Littlefield , et al. (1992) found that low self-esteem , low self-

9
efficacy, high depression, and high rates of binge eating behavior were all associated with
lower adherence . The same relationship between self-efficacy and adherence was found
by Padgett ( 1991) and was found specific to glucose testing and medication adherence by
McCaul et al. (1987) . However , neither a high correlation nor a low correlation is
consistently found between personality variables and adherence to medical regimens ,
therefore , personality variables cannot be said to either be related or not be related to
adherence to medical regimens (Cox & Gonder-Frederick, 1992; Cox , et al., 1986).
Furthermore , there seem to be some very interesting relationships between the
attitudes and beliefs of people with diabetes and their regimens (Irvine , 1989). People
who accept their diabetes (and, therefore , are less anxious about it) may obtain better
control by adhering more closely to their prescribed regimens (Cox , et al., 1986). In
addition , people on insulin-dependent regimens report less positive attitudes towards
living with diabetes than those patients on diet-only regimens , and lower levels of
perceived health than those patients on oral medication regimens . Thus , perceived health
seems to correlate with adherence to multiple behaviors . Those patients who are on
insulin-dependent regimens seem to have poor attitudes about living with diabetes and
poor perceived health . Consequently , those patients who are on insulin-dependent
regimens may be at particularly high risk for complications due to non-adherence .
The Transtheoretical Model of Behavior Change
As is evident , the day to day life of people with diabetes differs .dramatically from
that of people without diabetes . Numerous cognitive and behavioral changes are
necessary for the successful management of diabetes and for the prevention of its
complications . Adherence to medication regimens, regular testing of blood glucose levels,

10
modification of diet, and participation m regular physical activity or exercise are
consistently cited as the most important behavioral changes in the self-care of people with
diabetes (Cox & Gonder-Frederick , 1992; Heiby, et al., 1989; Rainwater, 1983). As
things stand , " ... levels of self-care [are] inadequate for the maintenance of adequate
metabolic control and the prevention of long term complications " (Irvine , 1989, p.10) . It
is hypothesized , however, that by implementing disease prevention and health promotion
strategies, we can eliminate more than 50% of its disabling complications (Sulivan, 1991 ).
According to Kumanyika & Ewart (Kumanyika & Ewart , 1990), model based
strategies of behavioral change may be underutilized in the diabetes population . Thus ,
there is a pressing need for the development and application of theoretical models ,
measures , and methods of health behavior change in people with diabetes .
Systematic strategies for behavioral change can only be developed on the basis of
corresponding models of behavior change . One of the most promising models of health
behavior change is the Transtheoretical Model (TTM ; DiClemente & Prochaska , 1982;
Prochaska & DiClemente , 1983; Prochaska & DiClemente , 1992) . Over its 15 years of
theoretical and research development , common principles of change have been found that
can account for how people succeed and fail in their attempts to modify problem
behaviors . The TTM describes relationships among several concepts .
Stages. The Stages of Change describe a developmental sequence of motivational
readiness to modify problem behaviors . This sequence is composed of five stages through
which people pass (Prochaska , DiClemente , & Norcross , 1992a) . Precontemplation (PC)
is when a person has no intention to change in the foreseeable future (usually defined as:
the next six months) . Contemplation (C) is when someone is seriously considering

11
changing in the foreseeable future. Preparation (P) involves two components : intention to
change and a behavioral attempt to change. The time-frame for intention to change is
within the next month, and the behavioral attempt to change must be in the recent past.
Action (A) is when a person has been performing the new behavior for less than six
months . Finally, Maintenance (M) is when a person has maintained the new behavior for
six months or more . Movement through the stages is rarely linear (Prochaska &
Goldstein, 1991; Prochaska , Rossi, & Wilcox, 1991; Prochaska , Velicer, Guadagnoli ,
Rossi , & DiClemente , 1991) . People often relapse , recycling back to an earlier stage of
change. In fact , successful behavior change may require several attempts before long-term
maintenance is achieved (Prochaska, et al., 1992a ; Prochaska, DiClemente , & Norcross,
1992b) .
Processes . The strategies for progressing through the Stages of Change are ten
processes of change . The processes of change are different strategies that people use in
their attempts to change. Each of the processes tends to be used more or less, depending
upon one's stage of change. Successful change is characterized by a specific pattern of
process use (DiClemente, Prochaska, Fairhurst, Velicer , Velasquez , & Rossi , 1991;
Prochaska & Di Clemente , 1983 ). The processes can be viewed as belonging to one of
two categories: experiential or behavioral (Kristeller , Rossi , Ockene , Goldberg , &
Prochaska , 1992; Prochaska , Velicer , DiClemente, & Fava , 1988 ; Rossi , 1992).
Experiential processes tend to be used more in the earlier Stages of Change. These
processes include : consciousness raising, dramatic relief , social liberation , environmental
reevaluation, and self-reevaluation. Behavioral processes tend to be used more in the later
Stages of Change . These processes include : reinforcement management , stimulus control,

12
counter conditioning, helping relationships , and self-liberation (Prochaska & Goldstein,
1991 ).
Decisional balance. One intervening variable is decisional balance . Decisional
balance involves the weighing of the pros and cons of changing one's behavior . Originally,
decisional balance items were created based on Janis & Mann's decision making model
(Janis & Mann, 1977) , which is a conflict model. It asserts that all relevant considerations
can be sorted into eight main categories: utilitarian gains or losses for oneself, utilitarian
gains or losses for significant others , self-approval or self-disapproval , and approval or
disapproval from significant others . However , principal components analysis consistently
indicates that these items are best summarized by two scales: the pros of changing and the
cons of changing (Velicer, DiClemente , Prochaska , & Brandenburg, 1985) .
Across many behaviors , the pros of changing have regularly been found to increase
across the Stages of Change; while the cons of changing decrease across the Stages of
Change, thus it has been termed the cross-over pattern of Decisional Balance (Prochaska
& Goldstein, 1991; Prochaska , Velicer , Rossi , Goldstein , Marcus , Rakowski , et al., 1994) .
In addition , it has been found to take one full standard deviation of change on the pros
(i.e ., increase) , while it only takes one half of a standard deviation of change on the cons
(i.e. , decrease) in order to move from Precontemplation to Action (Prochaska, 1994) .
These are the "strong " and "weak " principles of change , respectively .
Se!f-efficacy. Another intervening variable in the TIM model is Self-Efficacy .
Bandura (1977) originall y formulated the concept of self-efficacy, positing that a person ' s
perceived ability to perform a behavior is highly related to his/her actual ability to perform
that behavior. In fact , self-efficac y and future performance have been found to be more

13
closely related than past behavior and future performance (Bandura, Adams, Hardy , &
Howells , 1980; DiClemente , 1981 ). Self-efficacy can be evaluated across various
situations in which maintaining new behaviors may be difficult. In the TTM , these
situations are typically characterized as being individual, social, and physiological in
nature , and are called negative/affective , positive/social , and habit/addictive , respectively
(Velicer, DiClemente , Rossi, & Prochaska, 1990). In addition to evaluating the
temptation to no longer perform new, healthy behaviors, confidence to continue
performing new healthy behaviors may also be evaluated in those same situations (V elicer,
et al., 1990) . These two subscales (Tempting Situations and Confidence) compose the
Self-Efficacy construct of the TTM model.
As with the pros and cons of the decisional balance construct , the temptations and
confidence of the self-efficacy construct also show the cross-over pattern across the
Stages of Change . Using cross-sectional data , as stage increases, temptation decreases ,
while confidence increases , both in a linear fashion (Prochaska , et al., 1991 ) .
Application and success. Across several problem areas , these variables have
consistently outperformed demographic and personal history variables in their ability to
predict both successful change and relapse (Di Clemente, et al., 1991; Marcus , Rossi,
Selby, Niaura , & Abrams , 1992b; Prochaska & DiClemente , 1985; Prochaska, et al.,
1992a; Prochaska & Goldstein , 1991; Redding , 1993; Wilcox, Prochaska , Velicer, &
Di Clemente , 1985). As outlined by Prochaska et al. ( 1994), the TTM has been
successfully applied across a broad range of problem behaviors . The Stages of Change
and Decisional Balance constructs of the TTM were supported in twelve separate studies ,
on twelve different problem behaviors (Prochaska , et al., 1994). These problem behaviors

14
were : smoking (Velicer, et al., 1985); quitting cocaine (Rosenbloom , 1991); weight
control (O'Connell & Velicer , 1988); high fat diets (Rossi , 1993) ; adolescent delinquent
behaviors (Fiore-Lerner, 1990); safer sex (Redding , Rossi , Velicer , & Prochaska , 1989) ;
condom use (Prochaska , Harlow , Redding , Snow, Rossi , Velicer , et al., 1992); sun
exposure (Rossi & Blais, 1991 ); radon exposure (Rossi , 1990); sedentary lifestyles
(Marcus , Rakowski , & Rossi , 1992a); mammography screening (Rakowski , Dube ,
Marcus , Prochaska , Velicer , & Abrams, 1992); and physicians' preventive practices with
smoking (Eaton , Goldstein , Guadagnoli , Niaura , McDonald , & Dube , 1992) . Given the
tremendous need for behavioral change in people with diabetes , the need for model based
research on behavioral change, and the broad range of behaviors with which the TTM of
behavior change has been successful , diabetes seems to be a natural target for its
application . In fact , this need has been recognized by the diabetes professional
community , and a special issue of Diabetes Spectrum was devoted to its application
(Ruggiero & Prochaska, 1993) .
Method
Participants
The project was part of a larger study (Ruggiero , Dryfoos , Prochaska , Rossi,
Rossi, Greene , et al., 1996), which was done in collaboration with Johnson & Johnson .
Participants with IDDM as well as those with NIDDM were recruited , and assessed
regarding their typical performance of many behaviors , the two currently of interest being
self-monitoring of glucose level and medication adherence . The recruited sample
consisted of 2800 people with diabetes , 1300 of whom were representative of the U.S.
diabetes population , as well as an additional 1500 insulin-using participants , who were

15
included in order to increase our sample of Type I participants (in particular) . Due to the
low expected response rate of approximately 58%, a post-card prompt was planned ,
however , the actual response rate was 73 .4% resulting in a total of 2056 participants ,
hence, the post-card prompt was not executed . There were roughly equal numbers of
participants obtained from the representative (n=988) and augmented (n= 1068) samples ;
the distribution of type of diabetes among each subsample varied accordingly (see Table
1 ) .
The sample was an older one (M=5 9. 1, SD= 14 .1) with many retired people
(43 .9%) . Most were females (61.8%) , married (62 .0%), and fairly well educated (46.8%
had at least some college) . While the sample was largely Caucasian (69 .9%) there was an
unusually high representation of Native Americans (23 .0%; see Table 2).
Type of diabetes will be broken down into Type I (those diagnosed below age 30
and have taken insulin since diagnosis) , Type II using insulin (those diagnosed at or above
age 30 and are currently using insulin), and Type II not using insulin (those diagnosed at
or above age 30, are not currently using insulin but may or may not be taking pills).
Participants with type I diabetes constituted 13.8% of the sample, participants with type II
diabetes who were using insulin constituted 55.9% of the sample, and participants with
type II diabetes who were not using insulin constituted 30.2% of the sample. There was
8.8% of the sample who who could not be typed (10.4% of the representative sample and
7.3% of the augmented sample). Less than 20% of the sample had heard of the DCCI
and were aware of its results . When looked at by type of diabetes , it was a disappointing
number of those with type I diabetes (3 5. 7%) who were aware of the DCCI results . The
percentages , however , were in the expected direction, with less of those with type II

16
diabetes using insulin who were aware of the results ( 19. 9% ), and even fewer of those
with type II diabetes not using insulin who were aware of the results (10.6% ; see Table 2) .
The distribution of staging for all behaviors was severely skewed , with the vast
majority of participants indicating they were in Maintenance (based on the one-item
algorithms , the range was from 73.4% to 94.7%; see Table 3) . Regarding general health
status , overall , the sample was in relatively good health . When looking at potential
complications of diabetes, both individually and using a composite variable, the majority of
participants do not have problems : over 50% of the participants answer "no" to each listed
complication, and the mean number of complications ( out of a total of 16) was 3. 8
(SD=2 . 7). As far as hospital and emergency room admissions , routine office visits, and
days of work missed due to diabetes problems , all of these were severely skewed and
kurtotic. Only 10.4% of the sample had been admitted to the hospital within the last year ,
of those admitted the mean number of admissions was 2.2 (SD=5 .6), and the mode and
median were only I. The mean length of stay for these admissions was 10.4 days
(SD=13 .2), however , the mode was only 3 days and the median was 6 days. There were
14.3% of the participants who had emergency visits, among whom the mean number of
visits was 2.6 (SD=3 . l) , the mode was I visit, and the median was 2 visits . Almost 90%
of the participants visited their doctors for routine exams within the last year, the mean
was semi-annually (M=S.8 , SD=7.0), but both the mode and median were quarterly (4
times in the last year) . Finally of those who were employed part- or full-time, 16.4%
missed any work at all, the mean indicated that when they missed any they missed quite a
bit, (M=9.3, SD=20 .5), but the mode was only 2 days and the median was 3 days (see

17
Table 4) . For frequencies of health status variables specific to each behavior (such as
recommended regimens, skipping, behavior in the last week , etc.), see Tables 5-7.
Using listwise deletion, there were 1186 participants with complete decisional
balance data for all glucose testing items (number of items=26), and 1573 participants
with complete decisional balance data for all medication items (number of items=l8) .
When considering those who have complete decisional balance data for the final measures
(number of items=l2) and who also have stage for these behaviors, there are 1282
participants for glucose testing and 1495 participants for medication .
Measures
Typical demographic items were collected along with some descriptive diabetes
characteristics (both general and behavior-specific).
Staging. Two different methods were used in this study to assess stage of change
for adherence to both self-monitoring of glucose testing and medication regimens.
Adherence to medication regimens was broken down into adherence to pill regimens and
adherence to insulin regimens. First, there was a series of four dichotomous items.
Second, there was a single item with five stage-appropriate alternatives .
Decisional balance. Decisional balance items measure the importance of each
opinion (item) to the participants in their decision to perform each behavior. Items were
rated on a five-point Likert scale, where 1 = "Not At All Important " and 5 = "Extremely
Important ." Thus, lower scale scores indicate little importance of .that scale to the
participants' decision making process and higher scale scores indicate more importance of
that scale. There are 26 decisional balance items for glucose testing, 14 are pros and 12

18
are cons . There are 18 decisional balance items for medication , nine are pros , and nine are
cons .
Procedure
Items were generated , randomized , given to confederates who were
knowledgeable about the TTM model , and these people were asked to sort the items into
the categories they believed the items represented. Any ambiguous items, such as those
items that multiple confederates sort into incorrect categories , were then discarded.
Items , sorted incorrectly by only one person , or sorted correctly but were difficult to
understand , were then edited . Some new items were then created.
Participants were proactively recruited by mailing them packages including both a
letter about the study and the study questionnaire . There was only one point of contact
for each subject , after which the subject's participation in this study was complete . As
incentives for completing the questionnaire , there were 16 drawings for cash prizes--three
drawings for prizes of $150 each, five drawings for prizes of $100 each, and eight
drawings for prizes of $50 each.
The measure development process included a senes of Principal Components
Analyses (PCA) and Confirmatory Factor Analyses (CF A). First , a PCA was performed
on an exploratory sample and the number of components to be retained was determined
using both Velicer ' s (Velicer , 1976) Minimum Average Partial correlation (MAP)
procedure, and Horn ' s (Horn, 1965) Parallel Analysis (PA) procedure , both of which have
been well supported in the literature (Zwick & V elicer, 1986) . No items were deleted
based solely on the PCA. Next , several CF As were performed on the exploratory sample.
in order to determine which model best fit the data . Then, the best model was applied

19
(using CF A) to the second half of the sample--the confirmatory half Last of all, this
model was applied to various sub-samples ( using CF A) as validation for the measure ' s
application to these sub-samples .
Crosstabs of the two staging algorithms for each of the three behaviors indicated
how well they matched (i.e., to what extent they indicated the same stages for the same
people) . Crosstabs of stage with related variables , for example, how many times
participants skipped each behavior , provided some validity for staging .
Next , Discriminant Functions Analyses (DFAs) were done in order to determine
how well stage could be predicted from decisional balance . Finally, Multivariate Analyses
of Variance (MANOVAs) were done in order to determine whether or not there were
differences across the stages on decisional balance ; univariate Analyses of Variance
(ANOVAs) and Tukey tests were used as follow-up tests to the MANOVAs .
Except for the PCAs, which were done using Component Analysis Extended
(CAX; Velicer, Fava, Zwick , & Harrop , 1988), all statistics were done using SPSS ,
version 4. 0 ( 1990); the CF As used the LISREL program , version 7 .16; the crosstabs used
the CROSST AB program; the DF As used the DISCRIMINANT program ; the
MANOV As used the MANOV A program ; and the ANOV As used the ONEW A Y
program with the subcommand TUKEY to obtain the Tukey tests .

20
Results
Glucose Testing
The sample of 1186 participants with complete glucose testing decisional balance
data was randomly split into exploratory and confirmatory subsamples of n=579 and
n=607, respectively .
Glucose Testing Decisional Balance Measure Development
Principal Components Analysis (PCA). Using the exploratory subsample and
listwise deletion, a 26x26 matrix of interitem correlations was created (n=579) . PCA was
then conducted using CAX . MAP suggested a four component solution ( accounting for
60. 1 % of the variance), while PA suggested a three component solution ( accounting for
5 6. 1 % of the variance). The third component , suggested by both MAP and PA, was
composed of three items that seemed to be related to one ' s health care provider. The
fourth component, suggested by MAP , was composed of only two items that were both
related to exercise . The requested two factor solution resulted in all items loading on their
theoretically appropriate constructs , most items loaded well ( .554-.876 and .381-.726) ,
and this solution accounted for 49.4% of the variance. Using an oblique rotation , the two
factors had a correlation of .119.
Confirmatory Factor Analyses (CFA): The Two Factor Correlated Model. Given
that the requested two-factor PCA solution resulted in all of the items loading
appropriately, an attempt was made to impose the theoretical two..,factor correlated
structure on the exploratory sample. Several iterations of models were performed, deleting
items at each step with any of the following characteristics: loading less than .50 on their
appropriate factor , loading .30 or higher on both factors , or items that had extremely high

21
modification indices. The final measure consisted of six Pros of glucose testing and six
Cons of glucose testing. The fit indices for this model were : 1) x\ s3)=157 .57, J2 <.001; 2)
Goodness of Fit Index= .958; and 3) Root Mean Square Residual=.056. The glucose
testing Pros factor consisted of items that loaded from .68 to .87, and its internal
consistency rating (coefficient alpha) was .91. The Glucose testing Cons factor consisted
of items that loaded from .52 to .80, and it had a coefficient alpha of .81. The correlation
of the Pros and Cons of glucose testing was -0.128, see Tables 8 and 9, and Figure 1.
Comparison models. In order to test one ' s choice of a model, one should test
several plausible alternative models , this way, either a better fitting model will be found or
the model of interest will be confirmed . Two of the alternative models chosen are used as
baselines. These are the null model and the random two factor correlated model. The null
model forces each item to act as a factor , none of which are allowed to be related to any
others . The random two factor correlated model forces random items to be assigned to
each of two factors that are allowed to correlate . The other two alternative models were
plausible models. One was a one factor model, which asserts that all items are part of one
construct. Some items may be on one end of the construct and other items may be on the
other end, but they are all part of one construct. The other model was a two factor
uncorrelated model, which asserts that the items represent two unrelated constructs . The
results of the alternative models are also presented in Tables 8 and 9.
First , was the null model. Its fit indices were : 1) x2c66l=2998.30, Q <.001 ; 2)
Goodness of Fit Index=.435; and 3) Root Mean Square Residual=.316 ; but , by definition,
the factor loadings and coefficient alphas cannot be computed . Second , was the two factor
random model. It did not converge , hence , there are no fit indices, factor loadings, or

22
coefficient alphas to report . Third, was the one factor model. Its fit indices were : 1)
x2cs4i=l067 .24, 12 <.001; 2) Goodness of Fit Index= .683; and 3) Root Mean Square
Residual=.183 . The single factor consisted of items that loaded from -.20 to . 88; its
coefficient alpha was .76. Last , was the two factor uncorrelated model. Its fit indices
were : 1) x2(s4)=164 .71, 12 <.001; 2) Goodness of Fit Index= .956 ; and 3) Root Mean
Square Residual= .065 . The glucose testing Pros factor consisted of items that loaded
from .68 to .87, and the glucose testing Cons factor consisted of items that loaded from
.52 to .80. The coefficient alphas for the Pros and Cons of glucose testing in this model
are, by definition, the same as for the two factor correlated model (Pros alpha= . 9 I , Cons
alpha=.81) .
Chi-square difference tests were performed in order to test whether or not
significant differences existed between the proposed theoretical model and each of the
alternative models . These results are presented in Table 10. The proposed model (the
two factor correlated model) explained significantly more than even the next best
alternative model (the two factor uncorrelated model) .
Since both the null model and the one factor model, as evidenced by their fit
indices, were such poor models, they were both enormously different from the two factor
correlated model. The random model was so poor that it could not even be compared
(because it did not converge) . The differences between the two facto r uncorrelated model
and the two factor correlated model are minimal, however , the correlated model does fit
better (has a lower x2 and RMSR, and has a higher GFI) . Therefore , while the differences
between the fit indices of the two best models were slight, the two factor correlated model
does explain the data best (fits the data significantly better than the uncorrelated model) .
,..
23
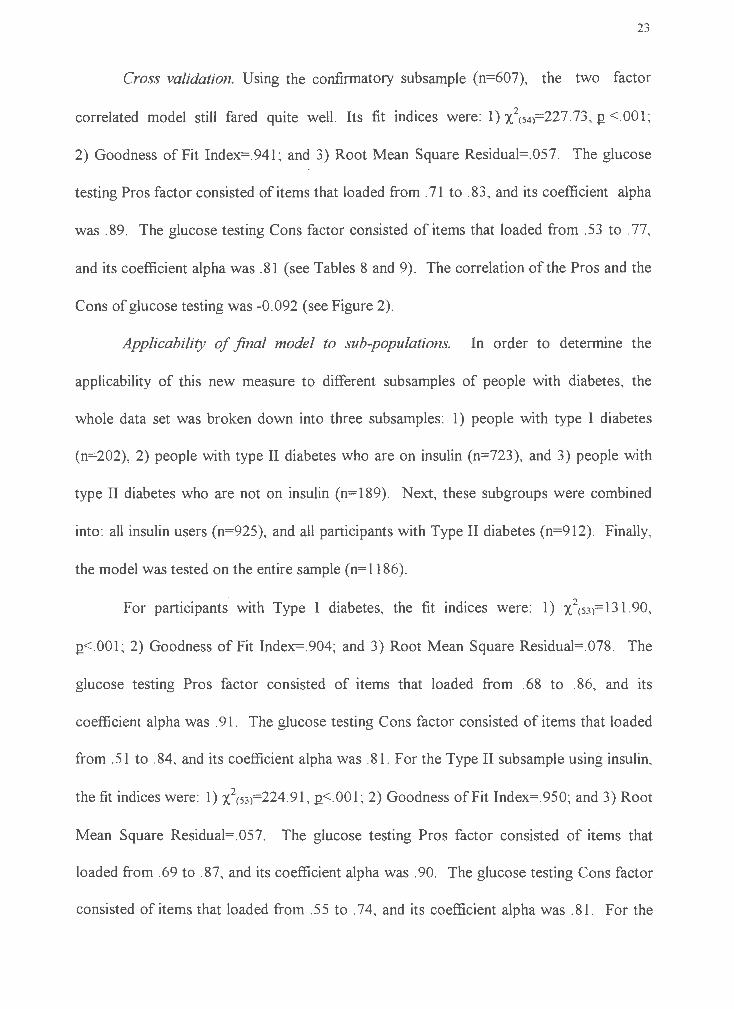
Cross validation. Using the confirmatory subsample (n=607) , the two factor
correlated model still fared quite well. Its fit indices were : 1) x\ s4)=227 .73, Q <.001 ;
2) Goodness of Fit Index= .941; and 3) Root Mean Square Residual=.057 . The glucose
testing Pros factor consisted of items that loaded from . 71 to . 83, and its coefficient alpha
was .89. The glucose testing Cons factor consisted of items that loaded from .53 to .77,
and its coefficient alpha was .81 (see Tables 8 and 9). The correlation of the Pros and the
Cons of glucose testing was -0.092 (see Figure 2).
Applicability of final model to sub-populations. In order to determine the
applicability of this new measure to different subsamples of people with diabetes , the
whole data set was broken down into three subsamples : 1) people with type I diabetes
(n=202) , 2) people with type II diabetes who are on insulin (n=723) , and 3) people with
type II diabetes who are not on insulin (n=l 89) . Next, these subgroups were combined
into: all insulin users (n=925), and all participants with Type II diabetes (n=9 l 2). Finally,
the model was tested on the entire sample (n=l 186).
For participants with Type I diabetes , the fit indices were : 1) x\s3>=131.90 ,
g<.001; 2) Goodness of Fit Index=. 904; and 3) Root Mean Square Residual= . 078. The
glucose testing Pros factor consisted of items that loaded from . 68 to . 86, and its
coefficient alpha was . 91. The glucose testing Cons factor consisted of items that loaded
from .51 to .84, and its coefficient alpha was .81. For the Type II subsample using insulin,
the fit indices were : 1) x2cs3>=224 .91, g<.001; 2) Goodness of Fit Index= .950; and 3) Root
Mean Square Residual= .057. The glucose testing Pros factor consisted of items that
loaded from .69 to .87, and its coefficient alpha was .90 . The glucose testing Cons factor
consisted of items that loaded from . 5 5 to . 7 4, and its coefficient alpha was . 81. For the
I

24
Type II subsample not using insulin, the fit indices were : 1) x\s3i=l42 .27, g<.001; 2)
Goodness of Fit Index=.893 ; and 3) Root Mean Square Residual= .075. The glucose
testing Pros factor consisted of items that loaded from .68 to .84, and its coefficient alpha
was .89. The glucose testing Cons factor consisted of items that loaded from .31 to .90,
and its coefficient alpha was . 73.
For the subsample of insulin users, the fit indices were: 1) X2cs3i=271.81 , g<.001;
2) Goodness of Fit Index= .953; and 3) Root Mean Square Residual= .056 . The glucose
testing Pros factor consisted of items that loaded from .69 to .85, and its coefficient alpha
was . 90. The glucose testing Cons factor consisted of items that loaded from . 5 5 to . 77,
and its coefficient alpha was . 81. For the subsample of all Type II participants , the fit
indices were : 1) x\ 53i=291.52 , g<.001; 2) Goodness ofFit Index= .949; and 3) Root Mean
Square Residual= .055. The glucose testing Pros factor consisted of items that loaded
from .70 to .87, and its coefficient alpha was .90. The glucose testing Cons factor
consisted of items that loaded from .52 to .76, and its coefficient alpha was .80. For the
whole sample, the fit indices were : 1) X2<53i=340 .89, g<.001; 2) Goodness of Fit
lndex=.954 ; and 3) Root Mean Square Residual= .054. The glucose testing Pros factor
consisted of items that loaded from . 69 to . 86, and its coefficient alpha was . 90. The
glucose testing Cons factor consisted of items that loaded from . 53 to . 79, and its
coefficient alpha was . 81. These results are presented in Tables 11 and 12.
Staging Algorithms
Given the high proportion of participants in the Action and Maintenance stages
(already presented in Table 3), an attempt was made to validate this by using other
behavioral indicators . Consequently , some participants were removed from the Action

25
and Maintenance stages based on their reported and recomended testing frequencies. If
participants were testing as often as they were told by their physicians to test , they were
kept in Action and Maintenance ; if they were testing less often, they were put in the
"Don't Know Standard " (or DK) group (see Table 13).
Using this new staging method , a crosstab of the single- and four-item staging
algorithms for glucose testing adherence was performed. The two overlapped (indicated
the same stage) for 89.4% of the participants . Allowing a one-stage margin-of-error in
each direction , the two algorithms were off for 4.8% of the participants. Furthermore ,
when looking at the crosstabs for each staging algorithm by number of times in the past
year participants have skipped testing their glucose levels, the anticipated pattern
emerged--as people progressed through the stages, they skipped their glucose testing less.
This pattern was true for both the single-item and the four-item staging algorithms , and
the two were almost exactly the same. Since the two algorithms are so similar, and since
more data is lost as the number of items increases , logic would suggest using the most
parsimonious algorithm--the one-item algorithm.
Predicting Stage from Decisional Balance : Discriminant Function Analysis (DF A)
A Discriminant Function Analyses (DF A) was performed to predict in what stage
the DK group would best belong in a five stage model. The DF A used the two decisional
balance variables (the Pros and Cons of glucose testing) as predictors of membership in
one categorical dependent variable (the five stages of change for glucose testing) . Of the
original 1573 participants with decisional balance or staging for glucose testing , 1250 had
both , and were testing their blood (those testing only their urine were excluded) . The
DF A left the DK stage as "ungrouped " cases and only the "grouped " cases (the first five

26
stages) are used for the actual analysis; those results, were used to classify the
"ungrouped " cases into one of the five stages . Therefore, while the analyses predicted
group membership for the 220 participants in the DK group , the analysis was based on
only the 1030 participants who are in PC, C, P, A, or M .
Two discriminant functions were derived , both functions were significant
predictors of stage . Function one had a Wilks' ').., = .622, Q<.001, and accounted for
35 .32% of the total variance, function two had a Wilks' ').., = .962, Q<.001, and accounted
for 3. 82% of the total variance . The first function separates all five of the stages , then the
second function separates the "stable" stages (PC and M) from the "unstable " stages (C,
P, and A). Classifying the DK group , 9.5% were placed in PC, 12.7% were placed in C,
18.6% were placed in P, 21.4% were placed in A, and 37 .7% were placed in M (see Table
14).
Stage Differences on Decisional Balance : Multivariate Analysis of Variance (MANO VA)
Decisional balance by stage and gender. In order to determine whether or not
men and women differed across the stages of change on decisional balance, a 5x2
between-subjects MANOV A was performed . The two independent variables were
glucose testing stage (PC, C, P, A, and M) and gender (male and female) . The dependent
variables (DVs) were the Pros and Cons of glucose testing and they were entered at the
same time . Those in the DK group and those who tested their glucose only by urine were
excluded . There were 1028 participants included in the analysis .
Using the Wilks ' criterion , the combined DVs were not significantly affected by
the interaction of stage and gender , Ecs. 2034)=1.422 , Q>.05 , but were significantly affected
independently by both stage , Ecs. 20341=66 .393, Q<.001 and gender , Ec2. !017)=6.089 , Q<.01.

27
The effect of stage was very strong (r/=.207) , however, the effect of gender was very
weak (ri 2=.0l 1).
Since the interaction of stage and gender in the MANOV A was not significant, no
two-way follow-up ANOV As were done , however , each of the significant one-wa y
MANOV As (stage and gender) were followed up with one-way ANOV As .
Looking at stage of change for glucose testing, the ANOV A for the Pros of
glucose testing was significant , E<4. 1018)=88 .792 , 12<.00l , as was the ANOVA for the Cons
of glucose testing , E<4. 1018)=4 7 .241 , 12<.001. The effect size of the Pros was very strong
(ri 2= .259) and the effect size of the Cons was moderate (ri 2= .157) . See Table 15 for
means and standard deviations of the glucose testing Pros and Cons by stage of change for
glucose testing . See Figure 3 for the pattern of glucose testing Pros and Cons across the
Stages of Change for glucose testing.
Following the ANOVAs, Tukey Pairwise-Comparisons were used to determine
which stages were significantly different from one another. Regarding the Pros of glucose
testing, those in Precontemplation were different from everyone ; Contemplation and
Preparation did not differ from each other , but both of them differed from Action and
Maintenance . As for the later stages, those in Action and Maintenance differed from those
in the early stages (PC , C, and P) , and those in Action were different from those in
Maintenance (see Table 15) .
Regarding the Cons of glucose testing , those in Precontemplation , Contemplation,
and Preparation did not differ from one another, but all of them differed from those in
Maintenance ; Contemplation and Preparation also differed from those in Action . As for

28
the later stages, those in Action differed from those m Maintenance ; and those m
Maintenance differed from everyone (see Table 15).
Looking at gender , the ANOV A for the Pros of glucose testing was significant,
Ec1. 1018>=8 .642, 12<.Ol, as was the ANOVA for the Cons of glucose testing, Eo. 10181=4.453 ,
12<.05. The effect sizes of both the Pros and the Cons were small (Pros : ri 2=.OO8, Cons :
ri 2=.OO4). See Table 15 for means and standard deviations of the glucose testing Pros and
Cons by gender. See Figure 4 for the pattern of glucose testing Pros and Cons across
gender. No Tukey tests were needed for the Cons of glucose testing by gender , because
there were only two groups (male and female).
Decisional balance by stage and type of diabetes. Because there were very few
Type I people in the Action stage of glucose testing , the two stages of Action and
Maintenance were collapsed. Therefore, a 4x3 between-subjects MANOV A was
performed on two dependent variables, which were the Pros and Cons of glucose testing .
The two independent variables were glucose testing stage (PC, C, P, and AIM) and type
of diabetes (type I, type II using insulin, and type II not using insulin).
Using the Wilks' criterion, the combined DVs were not significantly affected by
the interaction of stage and type, t.(12. 1904)= 1.688, 12>.05, but were significantly affected
independently both by stage, Ec6. 1904)=63 .138, Q<.001, and by type , Ec4. 19o41=3 .O57, Q<.05 .
The effect size of stage on the DV s was strong ( ri 2= . l 66), but the effect size of type on
the DVs was very weak (ri 2=.OO6). For a summary of all the MANOV As (see Table 15).
Since the interaction of stage of change and type of diabetes in the MANOV A was
not significant, no two-way ANOV As were done. The significant one-way MANOV As
were followed up with one-way ANOV As. The ANOV As on stage will not be reported

29
again for either the Pros or the Cons of glucose testing, since they were already reported
above . Looking at type of diabetes, the ANOV A on the Pros of glucose testing was not
significant, Ec2• 953i=0 .021, p_>.05. The ANOVA on the Cons of glucose testing was
significant, Ec2• 953>=6 . l 15, p_<.01, but with a small effect size (r/= .013). See Table 15 for
means and standard deviations of the glucose testing Pros and Cons by type of diabetes .
See Figure 5 for the pattern of glucose testing Pros and Cons across type of diabetes .
The follow-up Tukey Pairwise-Comparison test showed that on the Cons of
glucose testing , the participants with type I diabetes were significantly different from type
II participants who were on insulin, but not from type II particiapants who were not on
insulin. The two categories of type II participants , however , were not different from one
another.
Medication
The sample of 1573 subjects with complete medication decisional balance data was
randomly split into exploratory and confirmatory subsamples of n=784 and n=789 ,
respectively.
Medication Decisional Balance Measure Development
Principal Components Analys is (PCA). Using the exploratory subsample (n=784),
a PCA was conducted on the l 8x 18 matrix of interitem correlations . MAP suggested a
two component solution with all items loading on their theoreticall y appropriate constructs
(.468- .782 and .588 to .732), accounting for 46 .2% of the variance .. Using an oblique
rotation , the two factors had a correlation of .070. PA suggested a four component
solution ( accounting for 59. 5% of the variance). The third component , suggested by PA,
was composed of four con items that were mostly related to taking medication . One of

30
these items was complex, and loaded poorly on the two constructs on which it did load .
The fourth component , suggested by PA, was composed of three pro items and one con I
item most of which were related to satisfaction . Two of these items were complex and
both of them loaded poorly on the constructs on which they did load. Hence , the third
and fourth factors were fairly weak.
Confirmatory Factor Analysis (CFA): Two Factor Correlated Model. Given that
the requested two-factor PCA solution resulted in all of the items loading on their
theoretically appropriate constructs , an attempt was made to impose the theoretical , two
factor correlated structure using the exploratory sample. After several iterations of
models, deleting items at each step that loaded less than .50 on their appropriate factor ,
items that loaded .30 or higher on both factors, and items that had extremely high
modification indices, the final measure consisted of six Pros of medication and six Cons of
medication . The fit indices for this model were: 1) X2cs3)=202 .51, 12<.001 ; 2) Goodness of
Fit Index= .959; and 3) Root Mean Square Residual=.040. The Pros factor consisted of
items that loaded from .67 to .81, and its internal consistency rating (coefficient alpha)
was .86. The Cons factor consisted of items that loaded from .51 to .78, and it had a
coefficient alpha of .81. The correlation of the Pros of medication adherence and the Cons
of medication adherence was -0.089 (see Tables 16 and 17 and Figure 6).
Comparison models. As was previously stated , in order to test one ' s choice of a
model, one should test several plausible alternative models. The same . set of alternative
models were tested with the medication decisional balance, because the same theory was
being tested . The results to the alternative models are presented in Tables 16 and 17.
I

31
First, was the null model. Its fit indices were : 1) x2<66J=3340 .34, Q<.001 ; 2)
Goodness of Fit Index=.472 ; and 3) Root Mean Square Residual= .294; but , by definition,
the factor loadings and coefficient alphas cannot be computed . Second , was the two factor
random model. Its fit indices were : 1) x2<s3J=1490 .30, 12<.00l ; 2) Goodness of Fit
Index=.677 ; and 3) Root Mean Square Residual=.186 . The first factor consisted of items
that loaded from -0 .13 to .82, and its coefficient alpha was .55. The second factor
consisted of items that loaded from -0.10 to .74, and its coefficient alpha was also .55.
Third, was the one factor model. Its fit indices were : 1) x2(54J= 1499 .48, 12<.001 ; 2)
Goodness of Fit Index= .676; and 3) Root Mean Square Residual= .186. The single factor
consisted of items that loaded from -.132 to .81; its coefficient alpha was . 74. Finally, was
the two factor uncorrelated model. Its fit indices were : 1) x\s4J=206 .99, 12<.00l; 2)
Goodness of Fit lndex= .958; and 3) Root Mean Square Residual= .048 . The Pros factor
consisted of items that loaded from . 67 to . 82, and its coefficient alpha, by definition, was
the same as for the two factor correlated model (.86) . The Cons factor consisted of items
that loaded from . 51 to . 78, and its coefficient alpha was also the same as for the two
factor correlated model (.81 ).
Chi-square difference tests were performed in order to test whether or not
significant differences existed between the proposed theoretical model and each of the
alternative models . These results are presented in Table 18. The theoretical model (the
two factor correlated model) explained significantly more than even the next best
alternative model (the two factor uncorrelated model) .
As can be seen, the differences between the null model, the one factor model, and
the random model each compared to the two factor correlated model were all enormous .

32
These three comparison models, as expected and as evidenced by their fit indices, were all
poor models . However , the differences between the two factor uncorrelated model and the
two factor correlated model are minimal. The correlated model does do better (has a
lower x2 and RMSR and a higher CFI) . Therefore, as with the glucose testing decisional
balance, while the differences between the fit indices of the two best models were slight,
the two factor correlated model seems to explain the data best.
Cross validation. Using the confirmatory subsample (n=789) , the two factor
correlated model still fared quite well . The fit indices were : 1) x\ s3)=201.24 , p<.001 ; 2)
Goodness of Fit Index= .957; and 3) Root Mean Square Residual= .046 . The Pros factor
consisted of items that loaded from .64 to .81, and its coefficient alpha was .83. The Cons
factor consisted of items that loaded from .52 to .77, and its coefficient alpha was .82.
The correlation of the Pros and the Cons of medication adherence was -0. 003 ( see Figure
7).
Applicability of final model to sub-populations. In order to determine the
applicability of this new measure to different subsamples of people with diabetes , the data
was broken down into three subsamples : 1) people with type I diabetes (n=234 ); 2) people
with type II diabetes who are on insulin (n=855) ; and 3) people with type II diabetes who
are not on insulin (n=388) . Finally, the model was tested on the entire sample (n=l573) .
For the Type I subsample, the fit indices were : 1) x2<s3>=118 .87, p<.001; 2)
Goodness of Fit Index= .920 ; and 3) Root Mean Square Residual= .052 : The Pros factor
consisted of items that loaded from .63 to .86, and its coefficient alpha was .88. The Cons
factor consisted of items that loaded from . 52 to . 72, and its coefficient alpha was . 79. For
the Type II subsample using insulin, the fit indices were : 1) X2<53>=196.30, p<.001; 2)

33
Goodness of Fit Index= .962; and 3) Root Mean Square Residual=.046. The Pros factor
consisted of items that loaded from .61 to .81, and its coefficient alpha was .84. The Cons
factor consisted of items that loaded from .52 to .74, and its coefficient alpha was .82. For
the Type II subsample not using insulin, the fit indices were: 1) X2cs3)=123 .10, 12<.00l ; 2)
Goodness of Fit Index=.948 ; and 3) Root Mean Square Residual=.050. The Pros factor
consisted of items that loaded from .64 to .79, and its coefficient alpha was .84. The Cons
factor consisted of items that loaded from .50 to .72, and its coefficient alpha was .80. For
the whole sample, the fit indices were: 1) x2cs3>=309 .15, Q<.001 ; 2) Goodness of Fit
Index=.967 ; and 3) Root Mean Square Residual= .040. The Pros factor consisted of items
that loaded from . 64 to . 81, and its coefficient alpha was . 85. The Cons factor consisted
of items that loaded from . 52 to . 77, and its coefficient alpha was . 81. These results are
presented in Tables 19 and 20.
Staging Algorithms
Insulin adherence. Given that the vast majority of subjects were in Maintenance , a
cross-check was done to validate this . If subjects were taking at least as much insulin as
they were supposed to be taking, they stayed in Maintenance , otherwise , they were put
into a DK group . There were no subjects in Contemplation . Doing a crosstab of the
single-item and four-item staging algorithms for insulin adherence , the two new algorithms
overlapped for 98.3% of the subjects . Allowing a one-stage margin-of-error in each
direction , the two algorithms were off for only 0.5% of the subjects . Furthermore , when
looking at the crosstab of stage by number of times in the past year subjects have skipped
their insulin, the anticipated pattern emerged--as people progressed through the stages ,
they skipped their insulin shots less. This pattern was true for both the single-item and the

34
four-item staging algorithms, and the two were very similar. Since the two algorithms are
so similar, and since more data is lost as the number of items increases, logic would
suggest using the most parsimonious algorithm--the one-item algorithm.
Pill adherence. As with insulin, the vast majority of subjects were in Maintenance .
So, again, a cross-check was done to validate this . If subjects were taking at least as
much medication as they were supposed to be taking, they stayed in Maintenance,
otherwise , they were put into a DK group. Again, there were no subjects in
Contemplation. Doing a crosstab of the single-item and four-item staging algorithms for
pill adherence, the two overlapped for 95.2% of the subjects . Allowing a one-stage
margin-of-error in each direction, the two algorithms were off for only 2.5% of the
subjects . As with insulin, when looking at the crosstab of stage by number of times in the
past year subjects have skipped their pills, the anticipated pattern emerged--overall, as
people progressed through the stages , they skipped their pills less. This pattern was true
for both the single-item and the four-item staging algorithms . Since the two algorithms
are so similar, and since more data is lost as the number of items increases , logic would
suggest using the most parsimonious algorithm--the one-item algorithm.
Stage Differences on Decisional Balance : Multivariate Analysis of Variance (MANOVA)
Decisional balance by stage and gender . To determine whether or not males and
females differed across the stages of change on decisional balance, a 4x2 between-subjects
MANOVA was performed. The two independent variables were medication stage (PC,
CIP, A, and M) and gender (male and female). The dependent variables were the Pros and
Cons of medication adherence and they were entered at the same time . There were I 048
subjects included in the analysis.

35
Using the Wilks' criterion , neither the interaction of stage and gender , Ec6.
2078i=O. 764, 12>.OS, nor the main effect of gender , Ec2. 1039)=0.907, 12>.OS, were significant.
The main effect for stage , Ec6. 2078i= 13. 806, 12<.001, was significant, however , its effect size
was weak (r/= .O38).
Since neither the interaction of stage and gender nor the main effect for gender
were significant in the MANOV A, the two-way follow-up ANOV As and the one-wa y
follow-up ANOV As for gender were not done on the Pros or the Cons of medication
adherence . Only the significant one-way MANOV A on decisional balance by stage of
change was followed-up by one-way ANOV As and Tukey tests on each dependent
variable .
The ANOVA for the medication Pros was significant, Ec3, 10401=18 .371, 12<.OOl, as
was the ANOVA for medication Cons, E(3. 104oi=9.4O3, 12<.OOl. The effect sizes, however ,
were both weak (Pros : r{= .O5O; Cons : r{= .O26). See Table 21 for means and standard
deviations of the medication Pros and Cons by stage of change for medication . See Figure
8 for the pattern of the medication Pros and Cons across the stages of change for
medication.
Tukey Pairwise-Comparisons were used to determine which stages were
significantly different from one another. Regarding the Pros of medication adherence ,
those in Precontemplation and the Contemplation/Preparation group were different from
those in Action and Maintenance. Similarly, regarding the Cons of medication adherence ,
those in Precontemplation and the Contemplation/Preparation group were different from
those in Maintenance.

36
Decisional balance by stage and type of diabetes. To determine whether or not
people with different types of diabetes differed across the stages of change on decisional
balance, a 4x3 between-subjects MANOVA was performed . The two independent
variables were medication stage (PC, C/P, A, and M) and type of diabetes ( type I, type II
using insulin, and type II not using insulin). The dependent variables were the Pros and
Cons of medication adherence and they were entered at the same time. There were 985
subjects included in the analysis.
Using the Wilks ' criterion , the interaction of stage and type was significant, Ec12,
1944 1=3 .883, p_<.001, hence, the main effects of type and stage were not investigated . The
effect size, however , was weak (r/= .023) .
Since the interaction of stage and type in the MANOV A was significant, two-way
follow-up ANOV As were done on each the Pros and the Cons of medication adherence .
The interaction of stage and type on the ANOV A for the medication Pros was significant,
E<G. 973)=6.626, p_<.001, however, its effect size was small (ri2=.039) . The interaction of
stage and type on the ANOVA for the medication Cons was not significant, Ec6. 973i=l .135,
p_>.05. The significant main effect for stage was already presented above (see Table 21
and Figure 9). Tukey Pairwise-Comparisons cannot be computed for two-way
interactions .
Discussion
The first objective for each of the two behaviors was to develop decisional balance
measures . This was accomplished by using a series of exploratory and confirmatory
procedures to determine and verify the structure of each measure . Exploratory procedure s
included a PCA, a series of measurement models (used to determine poor items that

37
should be deleted) , and several alternative measurement models (serving as comparisons) .
Confirmatory procedures included verifying the selected model on the second half of the
data, as well as applying this model to several different subsamples . Overall, it was found
that the typical, expected two factor correlated decisional balance model fit both the
glucose testing and the medication adherence behaviors . In addition to fitting the second
half of the data, final model did respectably well on all the subsamples of different types of
diabetes , and quite well on the entire sample. Once again, the decisional balance model of -. !
the TTM held up .
The second objective for each of the two behaviors was to develop staging
measures . This was accomplished by a series of crosstabs to determine the differences
between the two staging algorithms for each behavior and also the validity of each staging
algorithm as reflected by several related behavioral variables . The results showed
remarkable similarity of the single- and four-item algorithms not only when compared to
one another, but also when each was compared to related behavioral variables. Moreover ,
the similar results of the cross validations done between each of the algorithms and across
other related behavioral variables indicates that the algorithm does seem to be measuring
the construct of stage , and people are consistent in their answers. Additionally , it is
noteworthy that the percentages of people in the Action and Maintenance stages are
consistent with adherence rates in previous diabetes self-management literature .
Finally, group differences on decisional balance were found using MANOV As,
looking at stage of change , gender, and type of diabetes. Regarding main effects, there
were significant differences on decisional balance by stage of change for both of the
investigated behaviors, all in the expected directions. These differences indicate the

38
amount of change needed to progress through the stages of change . There ware also
significant differences on decisional balance by gender , but only on glucose testing , not on
medication . So, men and women judge the advantages and disadvantages of glucose
testing differently, but judge the advantages and disadvantages of medication similarly.
Regarding type of diabetes , there was a main effect for glucose testing , but type of
diabetes interacted with stage of change for medication ( discussed below ; this was the
only significant interaction) . This means that people with different types of diabetes judge
the advantages and disadvantages of glucose testing differently.
The lack of interactions between stage and gender for both behaviors , shows that
even though men and women weight the advantages and disadvantages of glucose testing
differently, they change the same way across the stages of change . Similarly, the lack of
interaction between stage and type for glucose testing , shows that people with different
types of diabetes change the same way across the stages of change . This lack of
interactions is a powerful statement in support of the TTM .
On a theoretical level, the interaction between stage and type of diabetes for
medication adherence is understandable, given that the medication regimens are so very
different for the different types of diabetes . This interaction , however, may actually just be
a product of the staging distribution rather than a meaningful difference between the
groups . While the distribution of stage was skewed for both behaviors , it was
tremendously skewed for medication adherence. This tremendous skewness produces
unreliability in the data and it could be argued that stage of change for medication was so
skewed that it was no longer meaningful and its results were not interpretable . Decisional
balance scores are standardized , which is most useful among evenly distributed categorical

39
variables . Tremendous skewness leads to very heavy weighting at one end of the
distribution, and very little weighting at the other therefore, the scores at one end of the
distribution will be very close to the mean, and those at the other end will be very extreme .
This skewness, however , is not likely to be due to the sampling procedures given that the
sample was proactively recruited from a representative sample of people with diabetes and
the response rate was so high. Since sampling does not seem to be an issue , then more
work may need to be done to better understand the Stages of Change in the medication
area .
As was previously shown , diabetes has a tremendous impact, not only on patients ,
but also on the health care system and society . If the development and successful
application of a stage-based behavior change program for the self-management of diabetes
were to help prevent the development, slow the progression , and alleviate the symptoms
of the many complications of diabetes , it could then in tum have a tremendous impact on
patients , the health care system, and society . The development of these measures is one
step in the direction of developing interventions. In order to develop interventions ,
however , measures need to be developed for the other constructs of the TTM. As
evidenced by all of these findings, the staging and decisional balance constructs of the
TTM can now be said to hold up outside the cancer prevention field . There is now
promise for the application of the TTM in at least one area of chronic disease .
-~- ----------------------,1

Table 1 Frequencies for the Representative and Augmented Samples Across the Whole Sample and by Type of Diabetes
Type of Diabetes
Total Type I Type II , Type II, Sample Insulin No Insulin
Sample N N (%) N {%) N (%) Representative 988 72 (8.1) 289 (32.7) 524 (59.2)
Augmented 1068 186 (18.8) 760 (76.8) 44 (4.3)
Total 2056 258 (12 .5) 1049 (51.0) 568 (27.6)
40

4 1
Table 2 Demographics and Key Variables/or the Whole Sample and by Type of Diabetes
DEMOGRAPHICS Total Type I Type II , Type II , Insulin No Insulin
N {%} N (%} N (%) N (%) Gender Ma le 784 (38.2) 107 (41. 5) 392 (37.5) 230 (40 .5) Female 1267 (61.8) 151 (58.5) 654 (62.5) 338 (59.5)
Race Hispanic 25 (1.2) 4 (1.6) 12 (1.2) 7 ( 1.2) Afr ican Ame rican 107 (5.3) 7 (2.8) 59 (5 .7) 27 (4.8) Asian 12 (0.6) 5 (0.5) 4 (0.7) Native Ame rican 466 (23.0) 25 (9.8) 24 1 (23.3) 154 (27 .5) Caucas ian 14 14 (69.9) 2 18 (85.8) 716 (69.3) 369 (65 .8)
Marital Status Marrie d 1272 (62.0) 166 (64.3) 643 (61.5) 348 (61.4) Sep/Di v/W id 560 (27.3) 28 (10. 9) 320 (30.6) 171 (30.2) Single 176 (8.6) 43 (16 .7) 74 (7.1) 38 (6 .7) Single, with Sig. Othe r 42 (2.0) 21 (8.1) 9 (0 .9) 10 (1.8)
Living Arrangement With Partne r 1289 (62.8) 174 (67.7) 639 (6 1.0) 359 (63.3) With Oth ers 291 (14 .2) 44 (17.1) 156 ( 14. 9) 69 (12.2) Alone 464 (22.6) 39 (15.2) 245 (23.4) 138 (24 .3) In a Care Facili!X 9 (0.4) 8 (0.8) 1 (0.2)
Workin g Status Full T ime 466 (23.3) 122 (48.0) 173 (17.0) 132 (23.8) Part Time 151 (7.6) 25 (9 .8) 69 (6.8) 41 (7.4) Unemployed 72 (3.6) 21 (8.3) 34 (3.3) 9 (1.6) Retired 877 (43.9) 17 (6.7) 525 (5 1.5) 272 (49 . 1) Homemake r 307 (15.4) 46 (18. 1) 146 (14.3) 8 1 (14 .6) Other 124 (6.2) 23 (9.1) 72 (7 .1) 19 (3.4)
Education Some High School 325 (16.2) 21 (8.3) 177 (17 .2) 92 (16. 7) High School 742 (37.0) 78 (30 .8) 400 (38.8) 207 (37.6) Some College 538 (26.8) 74 (29 .2) 278 (27 .0) 144 (26 .1) College 206 (10.3) 45 (17.8) 89 (8.6) 5 1 (9.3) Post-Graduate 194 (9.7) 35 ( 13 .8) 86 (8 .3) 57 (10.3)
DCCT Hear d of an d A ware 387 (19.3) 91 (35. 7) 206 (19 .9) 59 (10.6) Heard of and Not Aware 245 (12.2) 33 (12.9) 136 (13.2) 6 1 (10.9) Not Hear d of and Not Awa re 1377 (68.5) 131 (51.4) 692 (66. 9) 439 (78 .5)
T~'l>e Type I 258 (13 .8) 258 (100 .0) Type II, on insulin 1049 (55 . 9) 1049 (100 .0) Type II, not on insulin 568 (30.2) 568 (100 .0)
M (SD) M (SD) M (SD) M (SD) Age 59 .1 (14. 1) 39 .7 (11.1) 62.8 (10 .8) 62.3 ( 12.2) Age at Dia2J)osis 45.8 (17.2) 15.8 (7.6) 49.9 (1 1.4) 54.5 (11.5) BMI 30. l (8.1) 25 .9 (6.1) 30.9 (8 .1) 30.8 (8.3)

42
Table 3 Stage Distributions Using the One-Item Algorithm for All Three Behaviors Prior to Re-Staging Across the Whole Sample and by Type of Diabetes
STAGES OF CHANGE Total Type I Type II , Type II , Insulin No Insulin
N % N % N % N %
Glucose Testing Stage Precontemplation 73 (4.6) 19 (8.0) 33 (3.6) 16 (5.1) Contempl ation 69 (4.4) 11 (4.6) 38 (4.2) 12 (3.8) Preparation 130 (8.3) 20 (8.4) 59 (6.5) 37 (11.8) Action 146 (9.3) 15 (6.3) 69 (7.6) 51 (16.3) Maintenance 1156 (73.4) 172 (72.6) 710 (78.1) 197 (62.9) Total 1574 258 909 313
Medicat ion Stage- Overall Precontemplation 24 (1.3) 3 (l.2) 9 (0.9) 7 ( 1.5) Contemplation 4 (0.2) 2 (0.8) 1 (0.1) I (0.2) Preparati on 17 (0.9) 1 (0.4) 5 (0.5) 10 (2.1) Action 77 (4.1) 3 (1.2) 45 (4.3) 22 (4.7) Main tenance 1755 (93.5) 247 (96.5) 976 (94.2) 427 (91.4) Total 1877 256 1036 467
Medication Stage- Insulin Precontemplation 14 (1.0) 3 (1.2) 9 (0.9) Contemplat ion 3 (0.2) 2 (0.8) (0.1) Preparation 6 (0.4) (0.4) 5 (0.5) Action 50 (3.7) 3 (1.2) 45 (4.4) Maintenance 1296 (94.7) 247 (96.5) 973 (94.2) Total 1369 256 1033
Medication Stage-- Pills Precontemplation 29 (4.0) 18 (9.4) 7 (1.5) Contemplation 2 (0.3) 1 (0.5) 1 (0.2) Preparation 12 (1.7) (0.5) 10 (2.1) Action 44 (6.1) 15 (7.9) 22 (4.7) Maintenance 631 (87.9) 156 (81.7) 427 (91.4) Total 718 191 467

Table 4 General Health Status Variables Across the Whole Sample and by Typ e of Diabetes
HEALTH STATUS: Total Type I Type II, Type II , General Insulin No Insulin
N (%) N (%) N (%) N (%) Eye problems (retinopath y) Yes 618 (30. 1) 122 (47.3) 350 (33.4) 99 (17.4) No 1438 (69. 9) 136 (52. 7) 699 (66.6) 469 (82.6)
Kidney problem s (nephrop athy) Yes 240 (11. 7) 48 (18.6) 139 (13 .3) 35 (6.2) No 1816 (88.3) 210 (8 1.4) 910 (86.7) 533 (93.8)
Decrease or loss of feelin g in legs or feet (neuropathy) Yes 736 (35.8) 95 (36 .8) 460 (43.9) 125 (22 .0)
No 1320 (64.2) 163 (63.2) 589 (56. 1) 443 (78.0)
Foot problems (ulcers , infections , sores) Yes 339 (16.5) 45 (17.4) 200 (19. 1) 65 (1 1.4) No 17 17 (83.5) 213 (82.6) 849 (80.9) 503 (88.6)
Sexual problems Yes 45 1 (2 1. 9) 49 (19.0) 268 (25.5) 107 (18.8) No 1605 (78.1) 209 (81.0) 781 (74.5) 46 1 (8 1.2)
High Blood Pres sure (hyperten sion) Yes 991 (48.2) 70 (29. l ) 553 (52.7) 30 1 (53.0) No 1065 (51.8) 188 (72.9) 496 (47.3) 267 (47.0)
Angina Yes 341 (16.6) 28 (10.9) 229 (21.8) 59 (10.4) No 17 15 (83.4) 230 (89.1) 820 (78 .2) 509 (89.6)
Congestive Heart Disease Yes 278 (13 .5) 14 (5.4) 197 (18.8) 47 (8.3) No 1778 (86.5) 244 (94.6) 852 (81.2) 521 (91.7)
Heart Attack Yes 266 (12.9) 17 (6.6) 179 (17. 1) 52 (9.2) No 1790 (87. 1) 241 (93.4) 870 (82.9) 516 (90.8)
Stroke Yes 150 (7.3) 14 (5.4) 96 (9.2) 30 (5.3) No 1906 (92.7) 244 (94.6) 953 (90.8) 538 (94.7)
M (SD) M (SD) M (SD} M (SD)
# Comelic ations 3.8 (2.7) 3.4 (2.8) 4.4 (2.7) 3.3 (2.2) # Hoseit al admissions {year) 0.2 (2.0) 0.3 (0.9) 0.3 (2.7) 0.0 (0.3) # Days in the hosp. (all adms) 10.4 (13.2) 12.2 (18.4) 9.9 (11.8) 12.7 (13.5) # ER admissions {year} 0.9 (14.5) 2.6 (31.3) 0.4 ( 1.6) 0. 1 (0.7) # Routine doctor 's visits (vear) 5.3 (6.9) 5.4 (7.8) 5.9 (7.3) 4.3 (5.3) # Days of work missed h•ea r) 1.5 (8.9) 2.0 (9.3) 2.3 (12.2) 0.4 (1.9)

44
Table 5 Health Status Variables Specific to Glucose Testing Across the Whole Sample and by Type of Diabetes
HEALTH STATUS: Total Type I Type II , Type II , Glucose Testing Insulin No Insulin
N (%) N (%) N (%) N (%) Told to test glucose Yes 1647 (81.0) 245 (95.3) 966 (92 .4) 313 (55.6) No 386 (19.0) 12 (4.7) 80 (7.6) 250 ( 44.4)
How do you test your glucose? Urine 49 (3.2) 3 (1.3) 17 (1.9) 24 (7.9) Strips 96 (6.2) 17 (7.5) 49 (5.4) 22 (7.3) Meter 1400 (90.6) 207 (91.2) 834 (92.7) 256 (84.8)
# Times skipp ed for 1 day or more in the last yea r Never 541 (34.8) 82 (35.0) 347 (38.6) 76 (24.6) 1-5 times 364 (23.4) 47 (20. 1) 219 (24.3) 74 (23.9) 6-10 times 166 (10.7) 24 (10.3) 79 (8.8) 50 (16.2) 11-20 times 143 (9.2) 17 (7.3) 80 (8.9) 35 (11.3) 2 1 or more times 342 (22.0) 64 (27.4) 175 (19.4) 74 (23. 9)
M (SD) M (SD) M (SD) M (SD)
# Times told to test glucose per wee k 10.3 (8.4) 16.4 (10.2) 10.4 (7.8) 5.4 (5.2)
Avg. # time s you test )!er week 9.0 (8.6) 13.7 (10.8) 9.4 (8.3) 4.6 (4.6) # Last seven da:ys tested 4.6 (2.6) 5.2 (2.6) 5.0 (2.5) 3.4 (2.5) # Tests done in the last week 8.7 (8.4) 13.4 (10.5) 9.0 (8.1) 4.5 (5.3) # Planned breaks in J!ast month 6.1 (7.8) 8.1 (7.9) 6.3 (8.7) 3.7 (4.4) # Time s skiee ed in ea st month 5.5 (10.4) 8.3 (13.2) 4.8 (9.5) 4.6 (8.0)

45
Table 6 Health Status Variables Specific to Insulin Across the Whole Sample and by Type of Diabetes
HEALTH STATUS: Total T)'pe I Type II, Type II, Insulin Insulin No Insulin
N (%) N (%) N {%) N (%) Insulin at diagnosis Yes 784 (39.0) 258 (100 .0) 498 (48 .5) 8 (1.4) No 1228 (61.0) 528 (51.5) 557 (98.6)
Take insulin now Yes 1390 (67.6) 258 (100 .0) 1049 (100.0) No 621 (30.2) 568 (100 .0)
How do you take your insulin? Pump 8 (0.6) 3 (1.2) 4 (0.4) Injections 1336 (99.4) 249 (98 .8) 1012 (99 .6)
# Times skipped for 1 day or more in the last year Never 1126 (82.0) 223 (87.1) 838 (81.0) 1-5 times 190 (13.8) 26 (10.2) 151 (14 .6) 6-10 times 25 (1.8) 6 (2.3) 19 (1.8) 11-20 times 16 (1.2) 14 (1.4) 21 or more times 16 (1.2) (0.4) 13 (1.3)
M (SD) M (SD) M (SD) M (SD)
# Times told to take insulin per week 23.2 (58.0) 26.9 (36.9) 22.7 (64.0)
# Insulin shots in last week 12.6 (6.1) 14.8 (7.1) 12. l (5.6)
# Times ski1?1?ed in past month 0.6 (3.0) 0.8 (5.8) 0.5 (1.4)

46
Table 7 Health Status Variables Specific to Oral Diabetes Medication Across the Whole Sample and by Type of Diabetes
HEALTH STATUS: Total Type I Type II, Type II, Pills Insulin No Insulin
N (%) N (%} N (%) N {%) Take pills now Yes 828 (42.4) lO (3.9) 283 (28 .6) 479 (84.3) No 1126 (57.6) 245 (96 .1) 708 (71.4) 89 (15.7)
M (SD) M (SD) M (SD) M (SD)
# Times told to take pills per week 39.4 (112.8) 22.8 (33.4) 31.7 (90.9) 44 .8 (126.2)
# Pills in the last week 13.3 (10.3) 12.8 (12.8) 12.2 (9.9) 13.8 (10 .4)
# Times ski~~ed in ~ast month 1.2 (5.4) 0.8 (1.3) 1.0 (3.4} 1.3 (6.2)
# Times ski~~ed in ~ast ~ear 3.3 (11.8) 1.2 (1.9) 2.9 ( 11.6) 3.4 ( 12.2)

47
Table 8 Fit Indices for Glucose Testing Decisional Balance: Exploratory CFAs Run on the First Half of the Sample (n=597); Confirmatory CFA Run on the Second Ha(f of the Sample(n=607)
Null One Random Two Two Confirmatory Model Factor Two Factor Factor Sample
Model Factor Uncorr. Correlated Two Factor Correlated Model Model Correlated
Model* Model
x2 2998 .30 1067.24 164.71 157.57 227 .73 df 66 54 54 53 53
.I! <.001 <.001 <.001 <.001 <.001
GFI .435 .683 .956 .958 .941 CFI .654 .962 .964 .940 RMSR .316 .183 .065 .056 .057 Alpha .7621 Pros .9080 .9080 .8894 Cons .8060 .8060 .8059
*did not converge

48
Table 9 Factor Loadings for Glucose Testing Decisional Balance: Exploratory CF As Run on the First Half of the Sample (n=597); Confirmatory CFA Run on the Second Half of the Sample(n=607)
Null One Random Two Two Confirmatory Model Factor Two Factor Factor Sample
Model Factor Uncorr. Correlated Two Factor Correlated Model Model Correlated
Model* Model
Pros of Glucose Testing 1 838 Factor 1 .837 .838 .745 7 .822 Factor 1 .823 .823 .798 9 .760 Factor 2 .763 .762 .723 13 .683 Factor 1 .682 .682 .709 21 .754 Factor 2 .755 .755 .738 26 .875 Factor 2 .874 .874 .833
Cons of Glucose Testing 4 -.154 Factor 1 .725 727 .681 8 -.197 Factor 2 .795 .800 .771 IO -.017 Factor 1 .652 .649 .628 12 .072 Factor 1 .610 .604 .633 14 - .080 Factor 2 .529 .528 .592 24 - .071 Factor 2 .521 .520 .531
*did not converge

49
Table IO Chi-Square Difference Tests Between the Two Factor Correlated Model/or Glucose Testing Decisional Balance and Each Comparison Model
Model x2 Difference df Difference I! Null 2840 .73 13 <.001 One Factor 909 .67 1 <.001 Two Factor, Uncorrelated 7.14 1 <.01

50
Table 11 Fit Indices for the Final Two Factor Co"elated Mode/for Glucose Testing Decisional Balance Run on the Overall Sample and then on Different Sub-Samples
Entire Type I ss Type II ss, Type II ss, All ss All Sam~le on insulin no insulin on insulin Tr~e II ss
N 1186 202 723 189 925 912
x2 340.89 131.90 224.91 142.27 271.81 291.52 df 53 53 53 53 53 53
I! <.001 <.001 <.001 <.001 <.001 <.001 GFI .954 .904 .950 .893 .953 .949 CFI .953 .930 .953 .897 .954 .947 RMSR .054 .078 .057 .075 .056 .055 Alpha Pros .8993 .9052 .8983 .8892 .9006 .8980 Cons .8056 .8125 .8087 .7319 .8099 .7966

51
Table 12 Factor Loadings for the Final Two Factor Correlated Model for Glucose Testing Decisional Balance Run on the Overall Sample and then on Different Sub-Samples
Entire Type I ss Type II ss, Type II ss, All ss All Samele on insulin no insulin on insulin T:yee II ss
Pros of Glucose Testing 1 .795 .803 .786 .789 .789 .792 7 .811 .855 .787 .811 .810 .794 9 .743 .776 .741 .735 .755 .740 13 .694 .679 .692 .688 .688 .695 21 .746 .776 .757 .683 .762 .743 26 .855 .818 .868 .837 .853 .865
Cons of Glucose Testing 4 .703 .764 .702 .596 .718 .687 8 .785 .843 .744 .897 .771 .762 10 .638 .601 .660 .580 .638 .642 12 .618 .640 .641 .407 .637 .601 14 .560 .510 .554 .521 .549 .554 24 .525 .511 .555 .308 .550 .521

52
Table 13 Stage Distributions Using the One-Item Algorithm for All Three Behavior s Across the Whole Sample and by Type of Diabetes
Total Type I Type II , Type II , Insulin No Insulin
N (%) N (%) N (%) N (%) Glucose Testing Stage Precontemplation 73 (4.9) 19 (8.4) 33 (3.8) 16 (5.6) Contemplation 69 (4.7) 11 (4.9) 38 (4.4) 12 (4.2) Preparation 130 (8.8) 20 (8.9) 59 (6.8) 37 (12. 9) Action 85 (5.8) 6 (2.7) 39 (4.5) 33 {l 1.5) Maintenance 870 (58.9) 117 (52.0) 544 (63.l ) 156 (54.4) Don 't Know Standard 249 (16.9) 52 (23 .1) 149 (17.3) 33 (11.5) Total 1404 225 862 287
Medic ation Stage- Overall Precontemplation 24 (1.4) 3 (1.3) 3 (0.9) 7 (l.6) Contemplation 4 (0.2) 2 (0.8) (0. 1) (0.2) Preparati on 18 (1.0) (0.4) 6 (0.6) 10 (2.3) Action 54 (3. 1) l (0.4) 33 (3.5) 15 (3.4) Maintenance 1122 (64.8) 85 (35.4) 606 (63.7) 363 (82. 9) Don 't Know Standard 510 (29.4) 148 (61.7) 296 (3 1.l ) 42 (9.6) Total 1732 240 951 438
Medicat ion Stage- Insulin Precontempl ation 14 ( l.l ) 3 (1.3) 9 (0.9) Contemplation 3 (0.2) 2 (0.8) (0.1) Preparation 6 (0.5) (0.4) 5 (0.5) Action 35 (2.9) (0.4) 33 (3.6) Maintenance 7 18 (60. 9) 85 (35.4) 59 1 (65. 9) Don 't Know Standard 459 (34.5) 148 (61.7) 29 1 (29.0) Total 1235 240 930
Medication Stage-- Pills Precontemplation 29 (4.1) 18 (9.7) 7 ( 1.5) Contemplation 2 (0.3) (0.5) I (0.2) Preparati on 12 ( l. 7) (0.5) 10 (2.2) Action 27 (4.9) 7 (6.5) 15 (3.5) Maintenance 524 (78.9) 126 (71.0) 363 (83 .4) Don 't Know Standard 71 (10. 1) 22 ( 11.8) 42 (9.2) Total 665 175 438
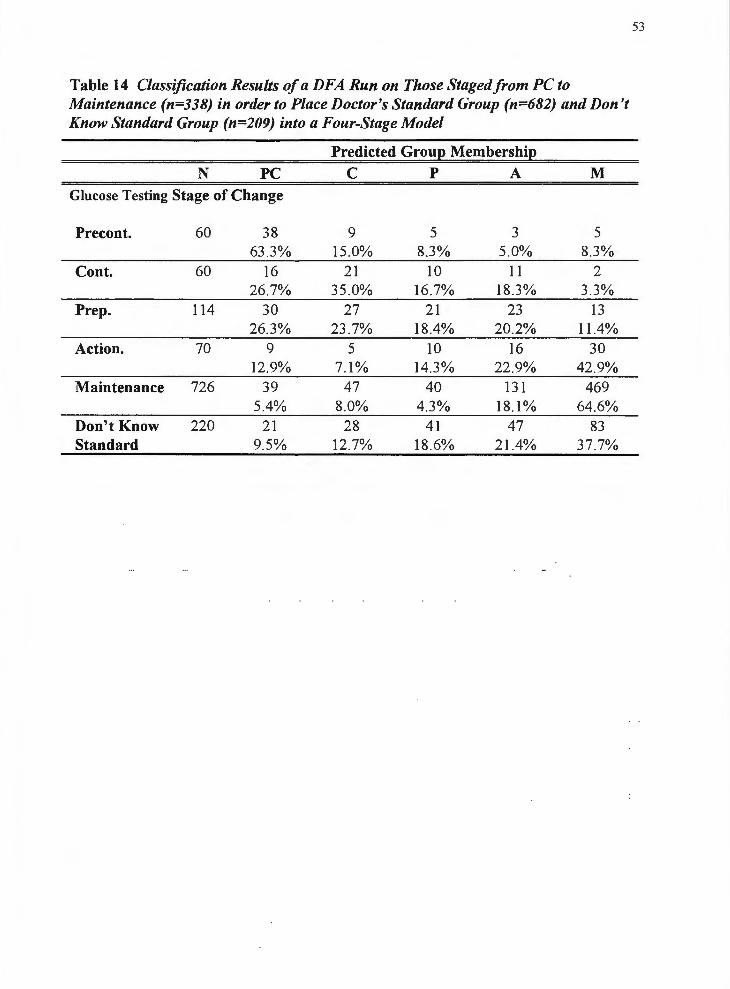
53
Table 14 Classification Results of a DFA Run on Those Staged from PC to Maintenance (n=338) in order to Place Doctor's Standard Group (n=682) and Don't Know Standard Group (n=209) into a Four-Stage Model
Predicted Groue Membershie N PC C p A M
Glucose Testing Stage of Change
Precont. 60 38 9 5 ,.,
5 _,
63.3% 15.0% 8.3% 5.0% 8.3% Cont. 60 16 21 10 11 2
26 .7% 35.0% 16.7% 18.3% 3.3% Prep. 114 30 27 21 23 13
26.3% 23 .7% 18.4% 20.2% 11.4% Action. 70 9 5 10 16 30
12.9% 7.1% 14.3% 22 .9% 42.9% Maintenance 726 39 47 40 131 469
5.4% 8.0% 4.3% 18.1% 64 .6% Don't Know 220 21 28 41 47 83 Standard 9.5% 12.7% 18.6% 21.4% 37.7%

54
Table 15 The Pros and Cons of Glucose Testing By Stage of Glucose Testing, Gender, and Type of Diabetes
Stage of Change Precontemplation Contemplation Preparation Action Maintenance
Gender Male Female
Type of Diabetes Type I Type II , Insulin Type II, No Insulin
NS not significant g<.05 g<.01
*** g<.001
Pros of Glucose Testing N M (SD)
Fe 4. 1018)=88. 792***, 112=.259 60 33.4 3 (12.6) 60 43 .6b (10 .5)
114 44 .5b ( 10.2) 70 49 .2c (10.2)
724 52 .9d (8.0)
.... 2 Fo , t018J=8.642 , 11 =.007 408 48 .73 (11.1) 620 51.0b (9 .7)
Fc2,9s3J=0 .021 162 48 .7 606 51.1 197 48 .2
NS
(11. 9) (9 .9)
(10 .3)
Cons of Glucose Testing N M (SD)
••• 2 7 Fc4. 101sJ=47.241 , 11 = .15
60 54 .53 (11.0) 60 58.3 3 (9 .9)
114 57 . la (8.5) 70 51.0b (9 .3)
724 47 .2c (9.2)
* 2 Fo . 101sJ=4.453 , 11 = .004 408 48.7 3 (9 .9) 620 50 .3b (10.2)
** 2 Fc2,953l=6 . l 15 , 11 = .013 162 51.4 3 (10.4) 606 49 .0bc (10 .1) 197 49 .lac (9.1)

55
Table 16 Fit Indices for Medication Decisional Balance: Exploratory CFAs Run on the First Half of the Sample (n=784); Confirmatory CFA Run on the Second Half of the Same_le(n=789l
Null One Random Two Two Confirmatory Model Factor Two Factor Factor Sample
Model Factor Uncorr. Correlated Two Factor Correlated Model Model Correlated
Model Model x2 3340.34 1499.48 1490.30 206 .99 202.51 154.97 df 66 54 53 54 53 53
I! .001 <.001 <.001 <.001 <.001 <.001 GFI .472 .676 .677 .958 .959 .967 CFI .559 .561 .953 .954 .967 RMSR .294 . 186 . 186 .048 .040 .040 Alpha .7384 Pros .5463 .8601 .8601 .8345 Cons .5543 .8099 .8099 .8 165
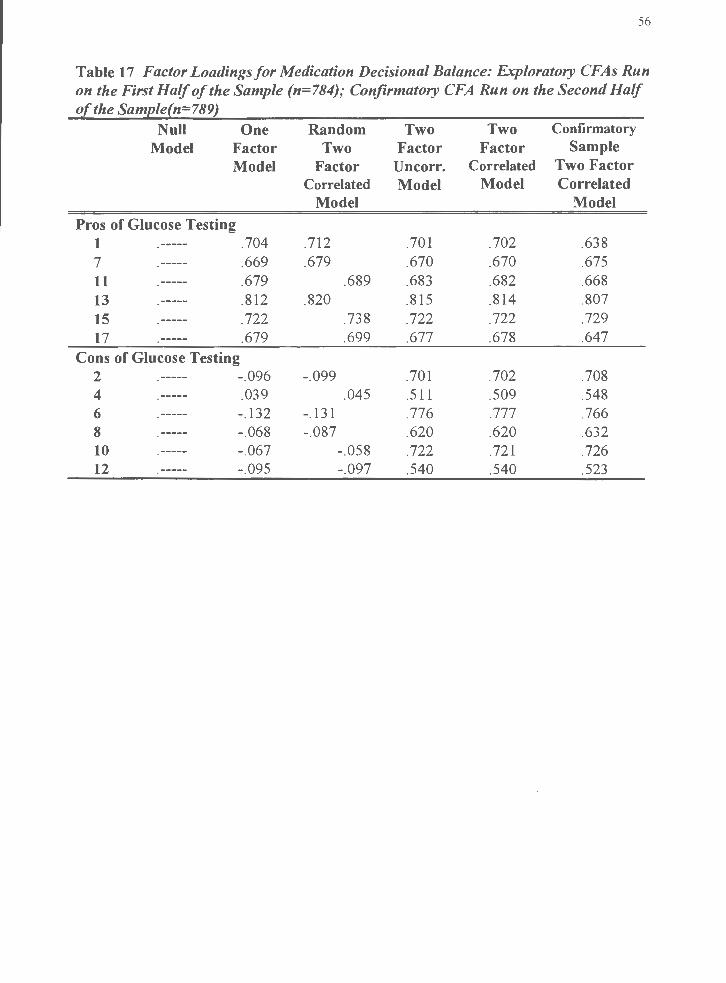
56
Table 17 Factor Loadings for Medication Decisional Balance: Exploratory CFAs Run on the First Half of the Sample (n=784); Confirmatory CFA Run on the Second Half of the Same_le(n=789l
Null One Random Two Two Confirmatory
Model Factor Two Factor Factor Sample Model Factor Uncorr. Correlated Two Factor
Correlated Model Model Correlated Model Model
Pros of Glucose Testing 1 .704 .712 .701 .702 .638 7 .669 .679 .670 .670 .675 11 .679 .689 .683 .682 .668 13 .812 .820 .815 .814 .807 15 .722 .738 .722 .722 .729 17 .679 .699 .677 .678 .647
Cons of Glucose Testing 2 -.096 -.099 .701 .702 .708 4 .039 .045 .511 .509 .548 6 -.132 -.131 .776 .777 .766 8 -.068 -.087 .620 .620 .632 10 -.067 - .058 .722 .721 .726 12 - .095 - .097 .540 .540 .523

57
Table 18 Chi-Square Difference Tests Between the Two Factor Co"e/ated Mode/for Medication Decisional Balance and Each Comparison Model Comparison Models x2 Difference df Difference I!
Null 3137 .83 13 <.001 One Factor 1296.97 <.001 Two Factor, Uncorrelated 4.48 <.05

58
Table 19 Fit Indices/or Final Two Factor Correlated Model/or Medication Decisional Balance Run on the Overall Same_le and then on Di(Jerent Sub-Same_les
Entire Type I ss Type II ss, Type II All ss All Type II Sample on insulin ss, no on insulin
insulin N 1573 234 855 388 1089 1243 x2 309 .15 118.87 196.30 123.10 213.40 260 .82 df 53 53 53 53 53 53
.I! <.001 <.001 <.001 <.001 <.001 <.001
GFI .967 .920 .962 .948 .967 .965 CFI .959 .936 .959 .951 .964 .958 RMSR .040 .052 .046 .050 .041 .043 Alpha Pros .8479 .8796 .8430 .8375 .8531 .8421 Cons .8138 .7896 .8212 .7998 .8146 .8158

59
Table 20 Factor Loadings for Final Two Factor Co"elated Model for Medication Decisional Balance Run on the Overall Same.le and then on Different Sub-SameJes
Entire Type I ss Type II ss, Type II All ss on All Type 0 Sample on insulin ss, no insulin ss
insulin Pros of Medication
1 .638 .692 .605 .637 .628 .620 7 .675 .736 .643 .648 .671 .649 11 .668 .757 .674 .637 .685 .664 13 .807 .858 .805 .787 .821 .799 15 .729 .774 .730 .727 .745 .724 17 .647 .634 .667 .641 .658 .659
Cons of Medication 2 .708 .620 .722 .695 .707 .715 4 .548 .621 .553 .496 .561 .539 6 .766 .715 .791 .713 .778 .771 8 .632 .590 .637 .653 .631 .639 10 .726 .660 .737 .722 .721 .737 12 .523 .520 .522 .526 .513 .519

Table 21 The Pros and Cons of Medication By Stage of Medication , Gender, and Stage by Type of Diabetes
Pros of Medication Cons of Medication
N M {SD} N M {SD)
Stage of Change *** 2 Fc4. 1484)=14 .165 , Tl = .037 *** 2 Fc4, 1484)=6 .993 , Tl = .019 Precontemplation 12 33.2a (17 .8) 12 59_9a ( 13.4) Cont./Prep . 19 39 _7a (15 .9) 19 56 .2a ( 10.2) Action 51 49 . lb (8 .5) 51 52.2ab (11.0) Maintenance 966 50 .2b (9 .61 966 45 .5b (9 .5)
Gender F(l. 1040)=0 .102NS Fo . 104oi= 1. 702 NS
Male 600 48 .7 (11.1) 600 49 .3 (9 .7) Female 894 50 .6 {9.0) 894 50.4 {10.01
Stage by Type of Diabetes *** 2 Fcs.1394i=4 .958 , ri = .028 Fcs.1394)=0 .984 NS
PC/Type I 3 45 .2 (10 .6) 3 54 .1 (16 .2) PC/Type II , Insulin 7 33 .7 (16 .0) 7 59 .3 (12.6) PC/Type II, No Insulin 1 -2 .2 (0) 1 79.4 (0) C&P /Type I
,.., 55.4 (5 .9) 3 57.2 (8 .5) .,
C&P/Type II , Insulin 5 45 .6 (11.8) 5 61.2 (13.2) C&P/Type II, No Insulin 10 30 .1 (13 .7) 10 54 .0 (9.4) N Type I 1 28.3 (0) I 47 .9 (0) NType II , Insulin 31 50 .2 (6 .8) 31 53.4 (10 .9) NType II , No Insulin 14 48 .3 (10 .5) 14 51.2 ( 11. 8) M/Type I 79 49 .5 (10 .0) 79 49.4 (8 .7) M/Type II , Insulin 517 51.0 (9 .3) 517 50.2 (10 . I) M/Type II , No Insulin 314 49 .3 (10.0) 314 48 .6 (9 .0) DK/Type I 134 49.6 (10 .8) 134 48 .3 (8.4) DK/Type II , Insulin 252 51 .0 (9.0) 252 50 .9 (10.4) DK/Type II , No Insulin 38 48 .2 (10 .7) 38 49 .6 (10 .5)
NS not significant n< 05 .. n<.01
••• n<.001
60

6 1
Figure J. Two factor correlated CFA for glucose testing decisional balance on
exploratory sample (n=579).

1 7 [iJ
.762
13
21 r
I
26 r
Exp
lora
tory
Sam
ple,
n=
579
-.12
8
SMB
G
Pros
a
= .
91
2 X
(53
)=15
7.5
7 G
FI=
.958
C
FI=
.964
R
MSR
=.0
56
SMB
G
Con
s a=
.8
1
QJ 8 10
12
\20 1_
!4
' 24 I
°'
N

63
Figure 2. Two factor correlated CF A for glucose testing decisional balance on
confirmatory sample (n=607).
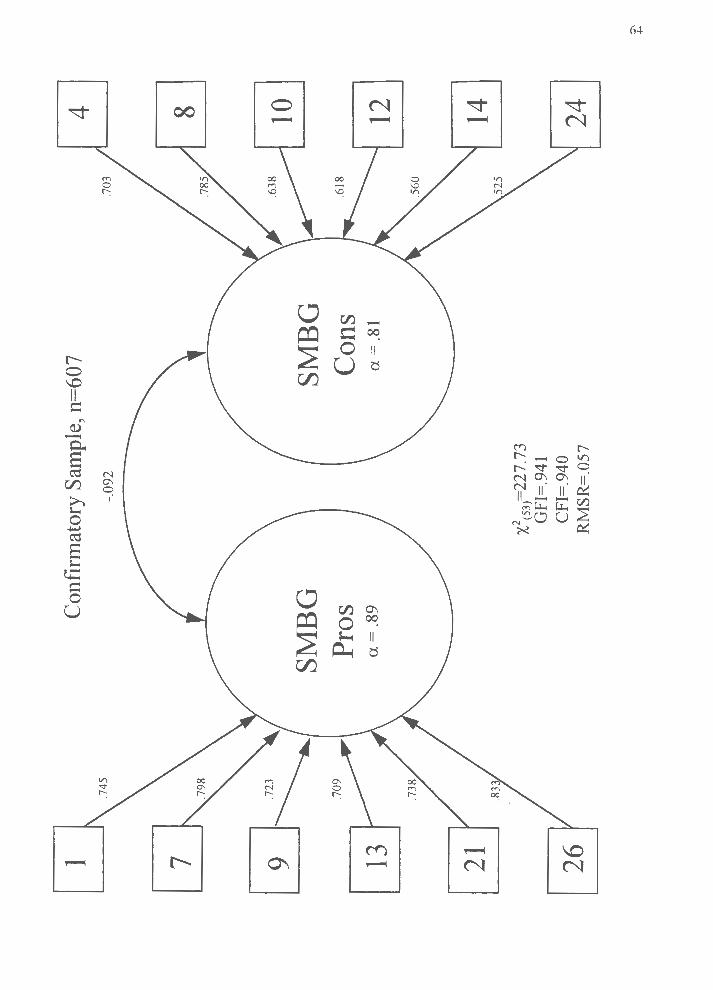
1 .7
45
7 Cu
.723
13
21 r
I
26 r
Con
finn
ator
y Sa
mpl
e, n
=60
7
-.09
2
SMB
G
Pro
s a=
.8
9
X2cs
3J=22
1.1
3 G
FI=
.941
C
FI=
.94
0 R
MSR
=.0
57
SMB
G
Con
s a
= .
81
4 .7
03
8 10
12
\,,
1_!4
' 24
I
°'
-I>
-

65
Figure 3. Glucose testing decisional balance by stage of change for glucose testing,
whole sample (N=1055).
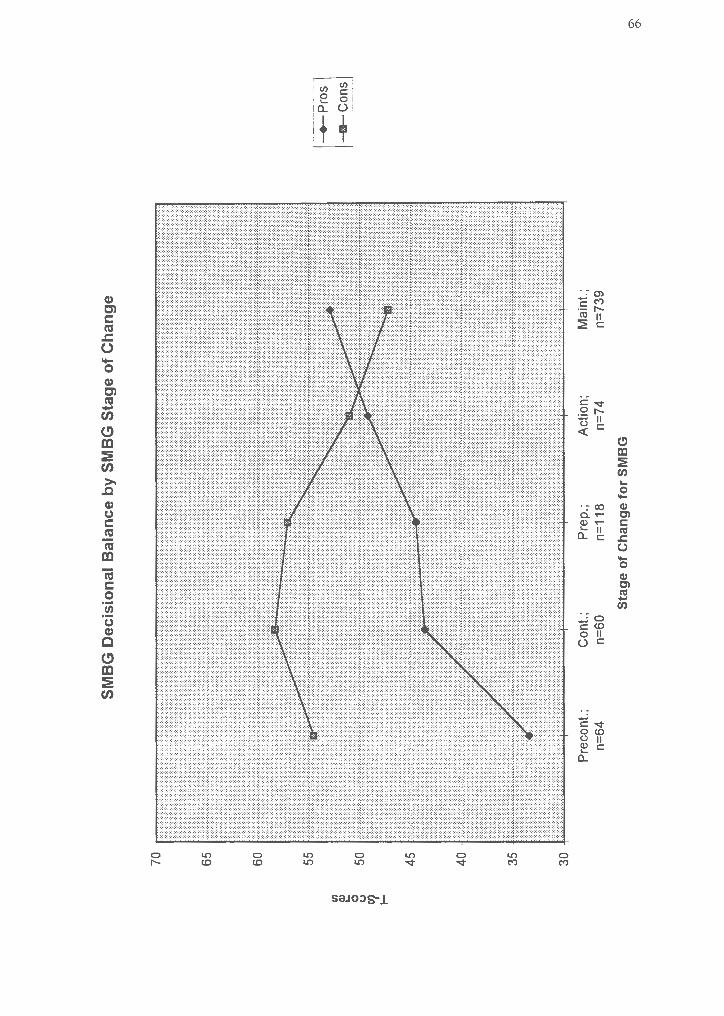
Ill ~
0 <J
'1
I-
70
45
35
30
Pre
cont
.;
n=64
SM
BG
Dec
isio
nal
Bal
ance
by
SM
BG
Sta
ge
of
Ch
ang
e
Con
t.;
n=60
P
rep
.;
n=11
8
Sta
ge
of
Ch
ang
e fo
r S
MB
G A
ctio
n;
n=74
M
aint
.;
n=73
9
-+-P
ros
---c
ons
°' °'

67
Figure 4. Glucose testing decisional balance by gender; whole sample (N=I055).

II) ~
0 (J '1
I-
51.5
49.5
48.5
48
SM
BG
Dec
isio
nal
B
alan
ce b
y G
end
er
Mal
es; n
=41
6 F
emal
es; n
=63
9
Gen
der
-+-P
ros
-m-C
ons
°'
00

69
Figure 5. Glucose testing decisional balance by type of diabetes; whole sample
(N=992).

en
~
0 (.) '1
I-
53
50
48
47
SM
BG
Dec
isio
nal
Bal
ance
by
Typ
e of
Dia
bete
s
Typ
e I;
n=16
4 T
ype
II,
Ins;
n=
614
Typ
e of
Dia
bete
s
Typ
e II
, N
o In
s;
n=21
4
-+-P
ros
--11
-Con
s
--.I
0

7 1
Figure 6. Two factor correlated CF A for medication decisional balance on
exploratory sample (n=784).

1 7 LJJ
J~./
13 1
JI
\
1 s r
I
11 r
Exp
lora
tory
Sam
ple,
n=
784
-.08
9
Med
icat
ion
Med
icat
ion
Pros
C
ons
a=
.86
a=
.81
x2(s
3)=
202.
51
GFI
=.9
59
CFI
=.9
54
RM
SR=
.040
2 .7
02
4
\' -'~
6
~
---i
8
\•o ~
i 12
I
-..I
Iv

73
Figure 7. Two factor correlated CFA for medication decisional balance on
confirmatory sample (n=789).
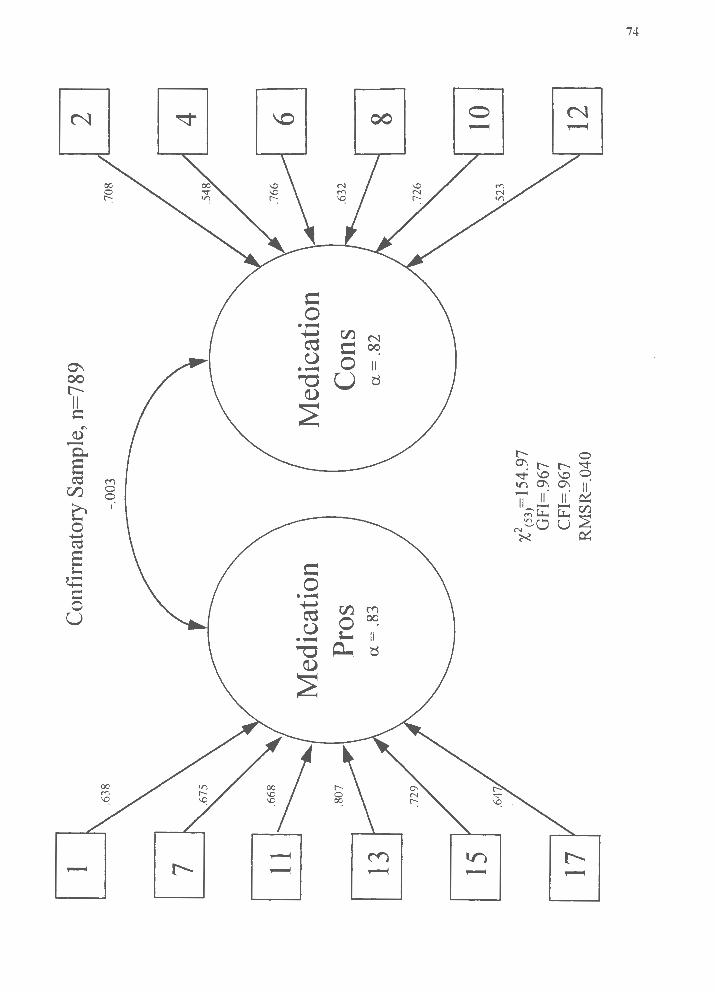
1 7 CiiJ
~./
13 1
j(
\
1 s r
I
11 r
Con
finn
ator
y Sa
mpl
e, n
=78
9
-.00
3
Med
icat
ion
Med
icat
ion
Pros
C
ons
a=
.83
a=
.82
x2(s
3)=
1s4_
97
GFI
=.9
67
CFI
=.9
67
RM
SR=
.040
2 4
\' I~
6
~ ~
8
\,, ~
i 12
I
-.J +'-

75
Figure 8. Medication decisional balance by stage of change for medication; whole
sample (N=1048).
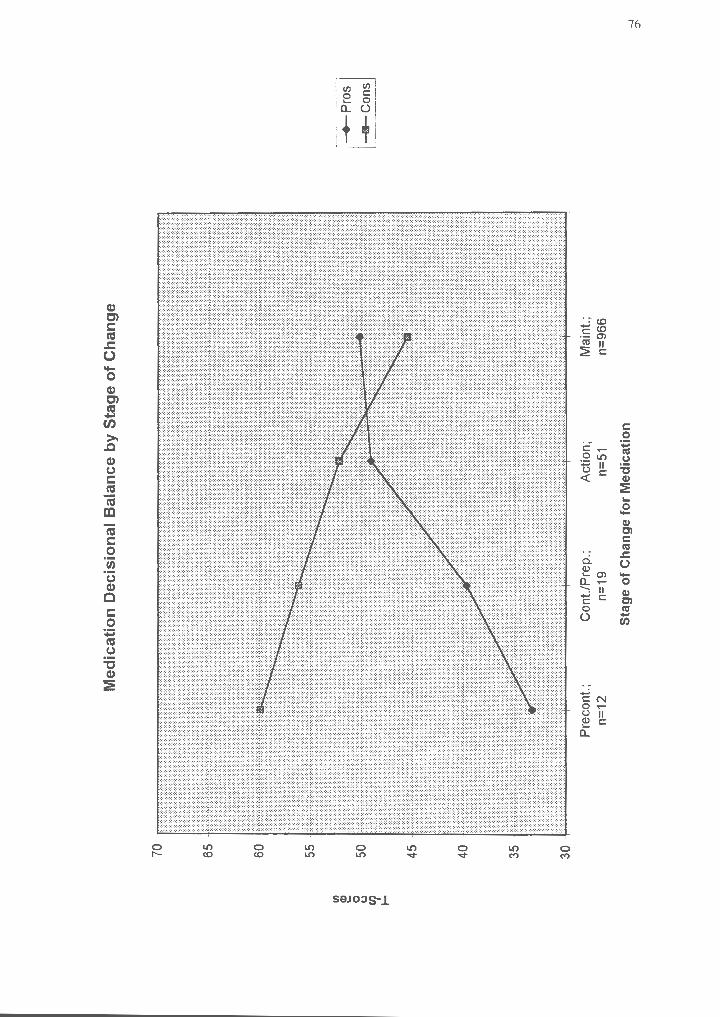
(/) e 0 (.) Cll ....
40
35 -
1:::::::
:'::::
c:c
:
30
Med
icat
ion
Dec
isio
nal
Bal
ance
by
Sta
ge
of
Ch
ang
e
Pre
cont
.;
n=12
C
ont./
Pre
p.;
n=19
A
ctio
n;
n=51
Sta
ge
of
Ch
ang
e fo
r M
edic
atio
n
Mai
nt.;
n=
966
-+-P
ros
---1
1--C
ons
-.I °'

77
Figure 9. Medication decisional balance by stage of change for medication and type
of diabetes; whole sample (N=985).
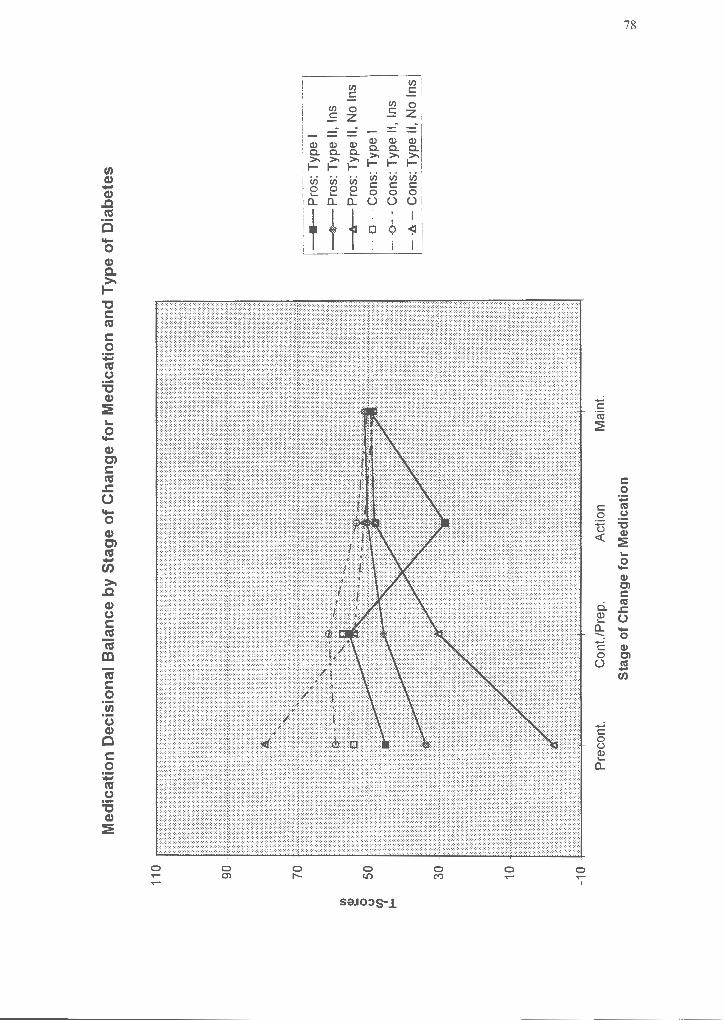
Cl)
~
0 (.) 11
...
.
10
Med
icat
ion
D
ecis
ion
al B
alan
ce b
y S
tag
e o
f C
han
ge
for
Med
icat
ion
an
d T
ype
of
Dia
bet
es
Pre
cont
. C
ont./
Pre
p.
Act
ion
Mai
nt.
Sta
ge
of
Ch
ang
e fo
r M
edic
atio
n
a--
Pro
s: T
ype
I
.-P
ros
: Typ
e 11
, In
s
-1r-
Pro
s: T
ype
II, N
o In
s
· ·
a ··
·· Con
s: T
ype
I
---o
--
Con
s: T
ype
II, I
ns
-·b
. -
Con
s: T
ype
11,
No
Ins
-.J
00

79
Bibliography
Abrams, D. B., Steinberg , J. L., Follick, M. J., & Raciti, M. A. (1986). Obesity
and type-II diabetes : Behavioral medicine's contribution . Behavioral Medicine Abstracts,
1, 1-4.
ADA ( 1993). 1993 Diabetes vital statistics . Alexandria , VA: Author .
Bandura, A. (1977) . Self-efficacy : Toward a Unifying theory of behavior change .
Psychological Review, 84, 191-215.
Bandura, A., Adams, N. E ., Hardy , A. B. , & Howells , G. N . (I 980) . Tests of the
generality of self-efficacy theory. Cognitive Therapy and Research, 4, 39-66.
Baumann , L. J., & Dougherty, L. L. (1988). Effects of blood glucose monitoring
on control of type-II diabetes . The Ninth Annual Meeting of the Society of Behavoral
Medicine , Boston , MA.
Clark, M . M. , & Abrams , D . B. (1993). Commentary . Diabetes Spectrum, 4, 41-
42.
Cox, D. J., & Gonder-Frederick , L. (1992). Major developments in behavioral
diabetes research . Journal of Consulting and Clinical Psychology, 60, 628-638 .
Cox, D. J., Gonder-Frederick, L., Pohl , S., & Pennebaker, J. W. (1986) . Diabetes .
In K. A. Holroyd & T. L. Creer (Eds .), Self-management of chronic disease (pp. 305-
346). Orlando , FL: Academic Press .
Curry, S. J. (1993) . Commentary. Diabetes Spectrum, 6, 34-35 .
Curry, S. J., Kristal, A. R., & Bowen, D. J. (1992). An application of the stage
model of behavior change to dietary fat reduction . Health Education Research : Theory
and Practice, 7, 97-105.

80
Diabetes Control and Complication Trial (1993) . The effect of intensive treatment
of diabetes on the development and progression of long-term complications in insulin
dependent diabetes mellitus. The New England Journal of Medicine, 329 , 977-986 .
DiClemente, C. C. (1981 ) . Self-efficacy and smoking cessation maintenance.
Cognitive Therapy and Research, 5, 175-187 .
DiClemente , C. C., & Prochaska , J. 0 . (1982). Self-Change and therapy change of
smoking behavior: A comparison of processes of change in cessation and maintenance .
Addictive Behaviors, 7, 133-142 .
DiClemente , C. C., Prochaska , J. 0 ., Fairhurst , S. K., Velicer , W . F. , Velasquez ,
M . M ., & Rossi , J. S. (1991) . The process of smoking cessation: An analysis of
precontemplation , contemplation , and preparation stages of change. Journal of Consulting
and Clinical Psychology, 59, 295-304 .
Eaton , C., Goldstein , M. G., Guadagnoli , E ., Niaura , R., McDonald , N. , & Dube ,
C. (1992) . Development of a decisional balance measure of physician smoking cessation
intervention . Manuscript submitted for publication.
Eckerling , L. , & Kohrs, M . B. (1984). Research on compliance with diabetic
regimens : Applications to practice. Perspectives in Practice, 84, 805-809 .
Fiore-Lerner , C. (1990) The Transtheoretical Model of Change: Self-Change in
adolescent delinquent behaviors . Doctoral Dissertation , University of Rhode Island .
Galvotti , C., & Fava, J. (1993) . Commentary . Diabetes Spectrum. 6, 40-41.
Glasgow , R. E ., McCaul , K. D., & Schafer, L. C. (1987) . Self-Care behaviors and
glycemic control in type I diabetes . Journal of Chronic Disease, 40 , 3 99-412 .

81
Glasgow , R . E. , Toobert , D . J. , Hampson, S. D ., Brown , J. E ., Dewinsohn , P . M. ,
& Donnely , J. ( 1992) . Improving self-care among older patients with type II diabetes : The
"sixty something ... " study. Patient Education and Counseling, 19, 61-74.
Gonder-Frederick, L. A., Jullian , D . M. , Cox , D . J., Clark , W . L. , & Carter, W . R .
( 1988) . Self-measurement of blood glucose : Accuracy of self-reported data and adherence
to recommended regimen. Diabetes Care, 11, 579-585 .
Hampson , S. E. , Glasgow , R. E. , & Toobert , D . J. (1990) . Personal models of
diabetes and their relations to self-care activities . Health Psychology, 9, 623-646.
Harris , M . I. , Klein , R ., Welbome , T. A., & Knuiman , M. W. (1992) . Onset of
NIDDM occurs at least 4-7 yr. before clinical diagnosis . Diabetes Care, 15, 815-819 .
Heiby , E . M ., Gafarian , C. T., & McCann , S. C. (1989) . Situational and behavioral
correlates of compliance to a diabetic regimen. Journal of Compliance and Health Care, 4,
101-116 .
Hirsch , I., Matthews, M ., Rawlings, J. H . B. , Breyfogle , J., Simonds, J. , &
Kossoyu, K. ( 1983 ). Home capillary blood glucose monitoring (HBGM) for diabetic
youth: A one year follow-up of98 patients . Diabetes, 32(16A).
Horn , J. I. (1965). A rationale and test for the number of factors in factor analysis .
Psychometrika, 30, 179-185 .
Ignatavicius , D. D ., & Bayne, M. V. ( 1991) . Interventions for clients with diabetes
mellitus . In M . J. Brown (Eds.), Medical-Surgical Nursing (pp.1584-1623). Philadelphia,
PA : W .B. Saunders Co .
Irvine , A. A. ( 1989) . Self-care behaviors m a rural population with diabetes .
Patient Education and Counseling, 13, 3-13 .

82
Janis, I. L. , & Mann , L. ( 1977) . Decision Making: A psychological analysis of
conflict, choice, and commitment. New York , NY : Collier Macmillan.
Kavanagh , D. J. , Gooley, S., & Wilson, P . H . (1993). Prediction of adherence and
control in diabetes. Journal ofBehavioral Medicine, 16, 509-522 .
Knuiman , M . W ., Welborne , T. A., McCann, V. J. , Stanton, K. G ., & Constable , I.
J. (1986) . The prevalence of diabetic complications in relation to risk factors . Diabetes,
35 , 1132-1139 .
Kristeller , J. L., Rossi, J. S., Ockene , J. K. , Goldberg , R. , & Prochaska , J. 0 .
( 1992) . Process of change in smoking cessation: A cross-validation study in cardiac
patients . Journal of Substance Abuse, 4, 263-276.
Kumanyika , S. K., & Ewart, C. K. (1990) . Theoretical and baseline considerations
for diet and weight control of diabetes among blacks. Diabetes Care, 13, 1154-1162.
Littlefield , C. H ., Daneman , D. , Craven , J. L., Murry , M. A., Rodin , G. M ., &
Rydall, A. C. ( 1992). Relationship of self-efficacy and binging to adherence to diabetes
regimen among adolescents . Diabetes Care, 15, 90-94 .
Marcus , B. H., Rakowski , W. , & Rossi , J. S. (1992a). Assessing motivational
readiness and decision making for exercise . Health Psychology, 11, 257-261.
Marcus , B. H., Rossi, J. S., Selby, V . C., Niaura , R . S., & Abrams, D . B. (1992b ).
The stages and processes of exercise adoption and maintenance in a worksite sample.
Health Psychology, 11, 386-395 .
Mccaul , K. D ., Glasgow , R. E ., & Schafer , L. C. (1987) . Diabetes regimen
behaviors : Predicting adherence . Medical Care, 25 , 868-881 .

83
O'Connell , D ., & Velicer , W . F . (1988) . A decisional balance measure and the
stages of change model for weight loss. The International Journal of the Addictions, 23,
729-750 .
Padgett , D . K. (1991) . Correlates of self-efficacy belief among patients with non
insulin dependent diabetes mellitus in Zagreb , Yugoslavia. Patient Education and
Counseling, 18, 13 9-14 7.
Polly, R. K. ( 1992) . Diabetes health beliefs , health care behaviors , and glycemic
control among older adults with non-insulin-dependent diabetes mellitus . Diabetes
Educator, 18, 321-327.
Prochaska , J. 0. (1994) . Strong and weak principles for progressin g from
precontemplation to action on the basis of twelve problem behaviors . Health Psychology,
13, 47-51.
Prochaska , J. 0 ., & DiClemente , C. C. (1983 ) . Stages and processes of self-
change in smoking : Towards an integrative model of change . Journal of Consulting and
Clinical Psychology, 51, 390-395 .
Prochaska , J. 0 ., & DiClemente , C. C. (1985) . Common processes of self-change
in smoking , weight control, and psychological distress. In S. Shiffinan & T. Wills (Eds .),
Coping and substance abuse : A conceptual framework (pp . 345-363 ). New York, NY :
Academic Press .
Prochaska, J. 0. , & DiClemente, C. C. (1992 ) . Stages of change m the l.._
modification of problem behaviors . Newbury Park , CA : Sage.
Prochaska , J. 0 ., DiClemente , C. C. , & Norcross , J. C . (1992a ). In search of how
people change . American Psychologist. 4 7, 1102-1114 .

84
Prochaska, J. 0 ., Di Clemente , C. C., & Norcross , J. C. ( 1992b ). In search of the
structure of change. In Y. Klar , J. D . Fisher , J. M . Chinsky , & A. Nadler (Eds.) , Self
change : Social psychological and clinical perspectives (pp . 87-114) . New York , NY:
Springer-Verlag .
Prochaska , J. 0 ., & Goldstein , M . G. (1991) . Process of smoking cessation .
Clinics in Chest Medicine, 12, 72 7-73 5.
Prochaska , J. 0 ., Harlow , L. L. , Redding , C. A. , Snow , M . G. , Rossi , J. S.,
Velicer , W . F ., Rhodes, F ., Schnell , D ., & Galavotti , C. (1992) . Stages of change, self
efficacy, and decisional balance of condom use in a high HIV -risk sample Manuscript
submitted for publication .
Prochaska , J. 0 ., Rossi , J. S., & Wilcox , N . S. (1991) . Change processes and
psychotherapy outcome in integrative case research. Journal of Psychotherapy Integration,
l , 103-119 .
Prochaska, J. 0 ., Velicer, W . F. , DiClemente , C. C., & Fava , J. (1988) . Measuring
processes of change : Applications to the cessation of smoking . Journal of Consulting and
Clinical Psychology, 56, 520-528 .
Prochaska , J. 0 ., Velicer , W . F ., Guadagnoli, E ., Rossi , J. S., & DiClemente, C. C.
( 1991 ). Patterns of change : Dynamic typology applied to smoking cessation . Multivariate
Behavioral Research, 26 , 83-107.
Prochaska, J. 0 ., Velicer, W . F. , Rossi, J. S., Goldstein , M. G.., Marcus , B. H. ,
Rakowski, W. , Fiore , C. , Harlow , L. L. , Redding , C. A., Rosenbloom , D ., & Rossi , S. R.
(1994) . Stages of change and decisional balance for 12 problem behaviors . He alth
Psychology, 13, 39-46.

85
Rainwater , N. (1983) . Adherence to the diabetes medical regimen : Assessment and
treatment strategies . Pediatric Annals, 12, 658-661.
Rakowski, W., Dube , C., Marcus , B. H. , Prochaska , J. 0 ., Velicer , W . F ., &
Abrams , D . B. (1992) . Assessing elements of women's decision about mammography .
Health Psychology, 11, 111-118 .
Redding, C. A. (I 993). The Transtheoretical Model applied to safer sex behaviors
among university students : A cross-sectional investigation. University of Rhode Island.
Redding , C. A., Rossi, J. S., Velicer , W . F ., & Prochaska , J. 0. (1989) . Pros and
cons of safer sex: A measurement model. Presented at the 97th Annual Convention of the
American Psychological Association , New Orleans, LA:
Rosenbloom, D . (1991) A Transtheoretical analysis of change among cocame
users . Doctoral Dissertation , University of Rhode Island .
Rossi , J. S. (1990) . Radon and ultraviolet light exposure: Emerging cancer risk
factors . Presented at the 98th Annual Convention of the American Psychological
Association , Boston , MA.
Rossi , J. S. (I 992) . Common processes of change across nine problem behaviors .
Presented at the 100th Annual Convention of the American Psychological Association ,
Washington, DC .
Rossi , J. S., & Blais , L. M. ( 1991 ) . The pros and cons of using sunscreen .
Presented at the 12th Annual Meeting of the Society of Behavioral Medicine , Washington ,
DC.

86
Rossi , S. R . (1993) . Application of the Transtheoretical Model of Behavior
Change to dietary fat reduction in a naturalistic environment . Doctoral Dissertation ,
University of Rhode Island.
Rossini, A., Mordes, J. P ., & Like , A. A. (1985). Immunology of insulin dependent
diabetes mellitus. The Annual Review oflmmunology, 3, 289-320 .
Ruggiero , L. , Dryfoos , J. M ., Prochaska , J. 0., Rossi , J. S., Rossi, S. R ., Greene ,
G. W ., Reed , G. R ., & Orleans , C. T. (1996) . Facing the challenge of changing multiple
health behaviors : Diabetes self-management. Presented at the 17th Annual Meeting of the
Society of Behavioral Medicine ., Washington, D .C.
Ruggiero , L., & Prochaska , J. 0 . ( 1993 ). Readiness for change : Application of the
Transtheoretical Model to diabetes . Diabetes Spectrum, 6, 21-60 .
Sacket , E . L., & Snow , J. C. ( 1979) . The magnitude of compliance and
noncompiance . Baltimore , MD : Johns Hopkins Press .
SPSS (1990). SPSS Base System, Release 4.0. Chicago , IL: SPSS .
Sulivan, L. W . (1991) . Partners in prevention : A mobilization plan for
implementing Healthy People 2000 . Health Policy, 5, 291-297 .
Surwit , R . S., Fenglos , M . N. , & Scovem , A. W . (1983) . Diabetes and behavior : A
paradigm for health psychology. American Psychologist, 38, 255-262 .
Velicer , W . F . (197 6). Determining the number of components from the matrix of
partial correlations . Psychometrika, 41 , 321-327 .
Velicer , W . F ., DiClemente , C. C., Prochaska, J. 0 ., & Brandenburg , N . (1985) . A
decisional balance measure for predicting smoking cessation . Journal of Personality and
Social Psychology, 48 , 1279-1289 .

87
Velicer, W. F., Fava , J. L., Zwick , W. R., & Harrop , J. W. (1988) . Component
Analysis Extended [Computer Program]. Kingston , RI : University of Rhode Island.
Velicer , W. F., DiClemente , C. C., Rossi, J. S., & Prochaska, J. 0 . (1990) . Relapse
situations and self-efficacy : An integrative model. Addictive Behaviors, 15, 271-283.
Wilcox, N. S., Prochaska , J. 0. , Velicer , W. F., & DiClemente , C. C. (1985).
Client characteristics as predictors of self-change in smoking cessation. Addictive
Behaviors, 10, 407-412 .
Wing, R. R., Epstein, L. H., Nowalk, M. P., Scott , M., & Koeske, R. (1985).
Compliance to self-monitoring of blood glucose: A marked-item technique compared with
self-report . Diabetes Care, 8, 456-460 .
Zinman, B. (1984) . Diabetes mellitus and exercise . Behavioral Medicine Update, 6,
22-25 .
Zinman , B., & Vranic , M. (1985) . Diabetes and exercise . The Medical Clinics of
North America, 69, 145-157.
Zwick , W. R., & Velicer, W. F. (1986). A comparison of five rules for determining
the number of components to retain . Psychological Bulletin, 99 , 432-442.