STABILITY INDEX LAKE CHAD BASIN - displacement.iom.int
17
1. Methodology The Stability Index collects data through key informant interviews at the lowest possible administrative level, the locality level (see Annex for further information on the locality selection process). Key informants, including mayors, community leaders, aid workers, etc. were interviewed in each location (n = 1,893) by enumerators in March-April 2021 in all four countries of the Lake Chad Basin (Cameroon, Chad, Niger and Nigeria). The key informant method has the advantage of allowing the coverage of many localities. Multiple key informants were interviewed in each locality, allowing IOM to cross-validate information. However, its main limitation lies in the fact that only a few informants report on the views of a community. The index correlates data available on localities with indicators, grouped in the following three scales: 1) Access to Livelihoods and Basic Services • Access to drinking water • Access to health centers • Delaying medical care (due to COVID) • Delaying medical care (not due to COVID) • Farmland cultivation and access • Fishing grounds usages and access • Habitat access • Habitat destruction due to conflict • ICT access • Electricity access • Local market activity and stocks • Primary education access • Public sector employee presence STABILITY INDEX – LAKE CHAD BASIN REGIONAL OVERVIEW ROUND 1 – MARCH/APRIL 2021 September 2021 1,752,743 Returnees DISPLACEMENT FIGURES 2) Social Cohesion • Equal access to basic services • Cattle theft reported • Illegal occupation of HLP • Robbery personal effects • Daily public life activity • Social cohesion and community support systems • Community tension • Identity documents possession • Participation in public affairs These indicators represent a set of critical living conditions that are necessary to make a place stable and conducive to durable solutions for internal displacement. Questions on the perception of stability by the community (feeling of stability, future intentions, evolution of the situation in the last 6 months) are used as the “anchor questions”, which are tested to assess the impact of each indicator (3 scales) on this perception of stability. 1.1 Stability Index Calculation The Stability Index uses Principal Component Analysis (see Annex for further explanation) to assess the impact of each indicator on the perception of stability in an area hosting displaced or returned populations, and then provides a specific value per indicator. These calculations make it possible to evaluate which indicators have a relatively greater statistical impact on the perception of stability. Each indicator thus has an associated value that enables the calculation of a «livelihood and basic services score»,a «social cohesion score» and a «safety and security score». These three scores are then combined to create the Stability Index. The index ranges from 0 (low perception of stability) to 100 (high perception of stability). 3,012,239 IDPs BACKGROUND: The conflict currently affecting the Lake Chad Basin (North-East Nigeria, Far North Cameroon, Lac Province Chad and Diffa Region Niger) has displaced 3,0125,239 people as of May 2021. The crisis is one of the worst humanitarian situations in the world, generating widespread displacement and engendering deep social, political, economic and health crises. While new displacements continue to take place, some areas have become more stable and have seen the return of displaced persons. As of May 2021, 1.75 million individuals have returned to their location of origin in the LCB region (in addition to the 3 million IDPs). In order to find durable solutions for internal displacement — whether through return to communities of origin, local integration, or relocation – and to prevent new displacements in the region, it is critical to understand the relative levels of stability in locations hosting returnees or displaced populations. To better measure this phenomenon and provide structured solutions, IOM has launched the Stability Index (SI), to evaluate the stability of areas hosting returnees or displaced populations in the LCB. The SI seeks to understand which factors influence a location's stability in order to identify priority interventions for transition and recovery, with the goal of strengthening the resilience and stability in this conflict and displacement-affected region. In practical terms, the Stability Index measures perceptions of stability and analyzes which factors have relatively larger impact on the decisions of populations to remain in place or to move. The tool can serve as a measure of stability in targeted areas in the LCB to enable governmental authorities and partners to develop better strategies, and to prioritize and plan resources in fragile, unstable areas for coherent and comprehensive interventions that link humanitarian, recovery, and stabilization approaches. While pilot SI surveys were carried out in Nigeria, Chad and Cameroon in 2019, the first round of a harmonized SI data collection in all four countries of the LCB took place in 2021. This report presents results from the March-April 2021 Stability Index round of data collection conducted in Cameroon, Chad, Nigeria and Niger. INTERNATIONAL ORGANIZATION FOR MIGRATION (IOM) Contact: RO Dakar - Data and Research [email protected] https://displacement.iom.int When quoting, paraphrasing or in any way using the information mentioned in this report, the source needs to be stated appropriately as follows: “Source: International Organization for Migration (IOM), September 2021, Displacement Tracking Matrix (DTM)”. 3) Safety and Security • Access to legal remedies • Activities by non-state armed groups • Formal curfew • Informal curfew • Freedom of movement • Local crime trends • Security incident over resources • Serious security incidents • Security forces presence • Police presence • Non-State Armed Groups presence • Community perception of security 1
Transcript of STABILITY INDEX LAKE CHAD BASIN - displacement.iom.int
1. MethodologyThe Stability Index collects data through key informant interviewsat the lowest possible administrative level, the locality level (seeAnnex for further information on the locality selection process). Keyinformants, including mayors, community leaders, aid workers, etc.were interviewed in each location (n = 1,893) by enumerators inMarch-April 2021 in all four countries of the Lake Chad Basin(Cameroon, Chad, Niger and Nigeria).
The key informant method has the advantage of allowing thecoverage of many localities. Multiple key informants wereinterviewed in each locality, allowing IOM to cross-validateinformation. However, its main limitation lies in the fact that only afew informants report on the views of a community.
The index correlates data available on localities with indicators,grouped in the following three scales:
1) Access to Livelihoods and Basic Services
• Access to drinking water • Access to health centers • Delaying medical care (due to COVID) • Delaying medical care (not due to COVID)• Farmland cultivation and access• Fishing grounds usages and access• Habitat access• Habitat destruction due to conflict• ICT access• Electricity access• Local market activity and stocks• Primary education access
• Public sector employee presence
STABILITY INDEX – LAKE CHAD BASINREGIONAL OVERVIEW ROUND 1 – MARCH/APRIL 2021
September 2021
1,752,743 Returnees
DISPLACEMENT FIGURES
2) Social Cohesion• Equal access to basic services• Cattle theft reported• Illegal occupation of HLP• Robbery personal effects• Daily public life activity• Social cohesion and
community support systems
• Community tension• Identity documents
possession• Participation in public affairs
These indicators represent a set of critical living conditions that arenecessary to make a place stable and conducive to durable solutionsfor internal displacement.
Questions on the perception of stability by the community (feelingof stability, future intentions, evolution of the situation in the last 6months) are used as the “anchor questions”, which are tested toassess the impact of each indicator (3 scales) on this perception ofstability.
1.1 Stability Index Calculation
The Stability Index uses Principal Component Analysis (see Annex forfurther explanation) to assess the impact of each indicator on theperception of stability in an area hosting displaced or returnedpopulations, and then provides a specific value per indicator. Thesecalculations make it possible to evaluate which indicators have arelatively greater statistical impact on the perception of stability.Each indicator thus has an associated value that enables thecalculation of a «livelihood and basic services score», a «socialcohesion score» and a «safety and security score». These threescores are then combined to create the Stability Index. The indexranges from 0 (low perception of stability) to 100 (high perception ofstability).3,012,239 IDPs
BACKGROUND: The conflict currently affecting the Lake Chad Basin (North-East Nigeria, Far North Cameroon, Lac Province Chad and DiffaRegion Niger) has displaced 3,0125,239 people as of May 2021. The crisis is one of the worst humanitarian situations in the world,generating widespread displacement and engendering deep social, political, economic and health crises.
While new displacements continue to take place, some areas have become more stable and have seen the return of displaced persons. As ofMay 2021, 1.75 million individuals have returned to their location of origin in the LCB region (in addition to the 3 million IDPs).
In order to find durable solutions for internal displacement — whether through return to communities of origin, local integration, or relocation
– and to prevent new displacements in the region, it is critical to understand the relative levels of stability in locations hosting returnees ordisplaced populations.
To better measure this phenomenon and provide structured solutions, IOM has launched the Stability Index (SI), to evaluate the stability ofareas hosting returnees or displaced populations in the LCB. The SI seeks to understand which factors influence a location's stability in order toidentify priority interventions for transition and recovery, with the goal of strengthening the resilience and stability in this conflict anddisplacement-affected region. In practical terms, the Stability Index measures perceptions of stability and analyzes which factors haverelatively larger impact on the decisions of populations to remain in place or to move. The tool can serve as a measure of stability in targetedareas in the LCB to enable governmental authorities and partners to develop better strategies, and to prioritize and plan resources in fragile,unstable areas for coherent and comprehensive interventions that link humanitarian, recovery, and stabilization approaches.
While pilot SI surveys were carried out in Nigeria, Chad and Cameroon in 2019, the first round of a harmonized SI data collection in all fourcountries of the LCB took place in 2021. This report presents results from the March-April 2021 Stability Index round of data collectionconducted in Cameroon, Chad, Nigeria and Niger.
INTERNATIONAL ORGANIZATION FOR MIGRATION (IOM)
Contact: RO Dakar - Data and Research [email protected] https://displacement.iom.int
When quoting, paraphrasing or in any way using the information mentioned in this report, the source needs to be stated appropriately as follows:
“Source: International Organization for Migration (IOM), September 2021, Displacement Tracking Matrix (DTM)”.
3) Safety and Security• Access to legal remedies• Activities by non-state armed
groups • Formal curfew• Informal curfew• Freedom of movement• Local crime trends• Security incident over resources• Serious security incidents• Security forces presence• Police presence• Non-State Armed Groups presence• Community perception of security
1

80
66
67
83
60
75
69
66
80
82
75
79
71
74
62
76
50
45
73
65
74
68
68
80
76
57
67
85
83
89
77
76
99
49
86
75
73
77
70
92
94
63
74
76
82
71
76
85
66
82
77
94
93
95
94
DiamaréLogone-Et-Chari
Mayo-DanayMayo-KaniMayo-Sava
Mayo-TsanagaExtreme Nord
BossoDiffa
Maine_SoroaNGuigmi
Diffa
AskiraBama
ChibokDamboa
DikwaGubio
GwozaJere
KagaKonduga
MafaMagumeriMonguno
NgalaBorno
DemsaGirei
GombiGuyukHong
LamurdeMadagali
MaihaMayo - belwa
MichikaMubi northMubi south
NumanShelleng
SongYola southAdamawaDamaturu
GeidamGujbaGulani
YunusariYusufari
Yobe
FouliKaya
MamdiLac
Extr
eme
No
rdD
iffa
Bo
rno
Ad
amaw
aYo
be
Lac
CA
MER
OO
NN
IGER
NIG
ERIA
CH
AD
Stability Index Score by "Département" or Local Government Area
2. Stability Scores Analysis
2.1 Stability Index Score by Country
The average Stability Index score of the 1,893 assessedlocations was 74/100, with a wide range of scores on thethree scales per country.
When reviewing the Stability Index score at region or statelevel (first administrative level), the lowest average StabilityIndex scores are in Borno (67/100), in Nigeria and ExtremeNorth (69/100), in Cameroon.
2.2 Stability Index Score by Département or
Local Government Area (LGA)
A more granular overview of Stability Index scores by“Département” or “Local Government Area” (LGA) (secondadministrative level) is shown in the chart to the right. Thisoverview allows for the identification of “Départements” orLGAs that are at both high and low extremes of the stabilityspectrum.
INTERNATIONAL ORGANIZATION FOR MIGRATION (IOM)
Contact: RO Dakar - Data and Research [email protected] https://displacement.iom.int
When quoting, paraphrasing or in any way using the information mentioned in this report, the source needs to be stated appropriately as follows:
“Source: International Organization for Migration (IOM), September 2021, Displacement Tracking Matrix (DTM)”.
September 2021
CAMEROON 6 DÉPARTEMENTS883
LOCATIONS
NIGER 4 DÉPARTEMENTS180
LOCATIONS
NIGERIA 36 LOCAL GOVERNMENT AREAS608
LOCATIONS
CHAD 3 DÉPARTEMENTS221
LOCATIONS
COUNTRY STABILITY INDEX SCORE
LIVELIHOOD & BASIC
SERVICES
SOCIAL COHESION
SAFETY AND SECURITY
Cameroon 69/100 52 69 74
Niger 79/100 51 86 72
Nigeria 74/100 73 73 69
Chad 94/100 94 96 91
Overall 74/100
1.2. Data collection overview
The data collection was conducted in March and April 2021,covering a total of 1,893 locations in Cameroon, Niger,Nigeria and Chad, as per below.
STABILITY INDEX – LAKE CHAD BASINREGIONAL OVERVIEW ROUND 1 – MARCH/APRIL 2021
CA
MER
OO
NN
IGER
NIG
ER
IAC
HA
D
2
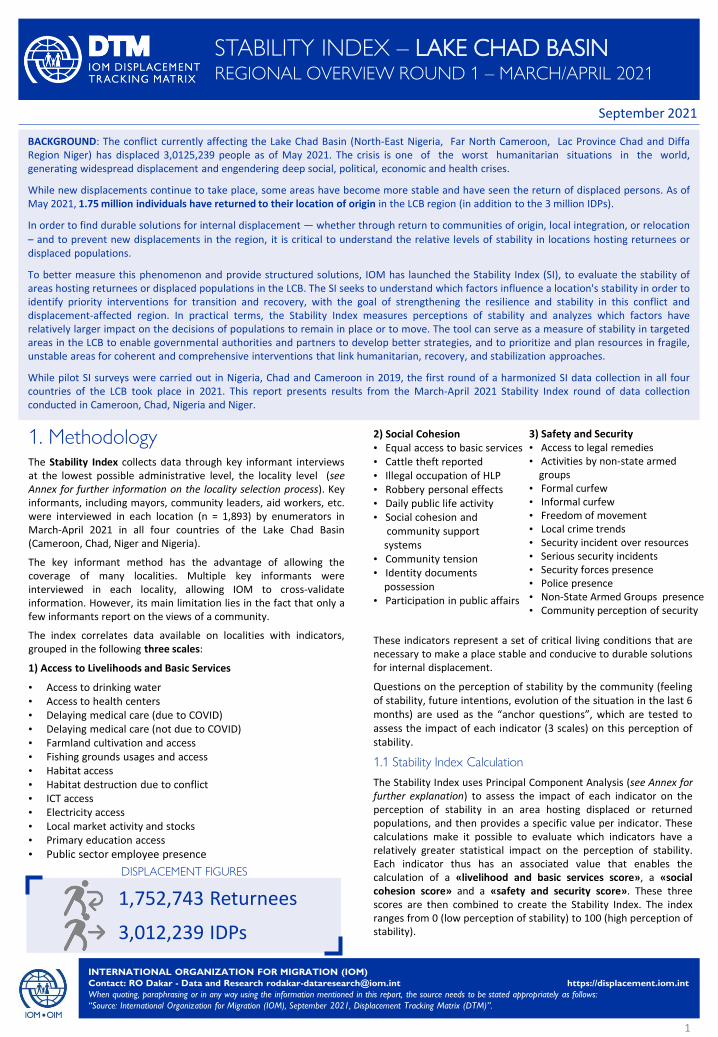
STABILITY INDEX SCORES OF LOCATIONS ASSESSED IN THE LAKE CHAD BASIN
STABILITY INDEX – LAKE CHAD BASINREGIONAL OVERVIEW ROUND 1 – MARCH/APRIL 2021
September 2021

September 2021
INTERNATIONAL ORGANIZATION FOR MIGRATION (IOM)
Contact: RO Dakar - Data and Research [email protected] https://displacement.iom.int
When quoting, paraphrasing or in any way using the information mentioned in this report, the source needs to be stated appropriately as follows:
“Source: International Organization for Migration (IOM), September 2021, Displacement Tracking Matrix (DTM)”.
2.3 Perception of Stability
The first section of the questionnaire is focused on the keyinformants’ perception of stability in the assessed communities.These questions are used as the “anchor questions”, which aretested in the analysis to assess the impact of each indicator onthe three scales (livelihood and social services, social cohesion,safety and security) on the perception of stability.
Three main questions were used to measure this perception ofstability (see Annex for further details) :
1. Feeling of stability;
2. Future intentions of the population;
3. Evolution of the situation in the last 6 months
The Stability Index score calculation is obtained by comparingthe results of the first question on “feeling of stability” againstall other indicators collected. It is this calculation, of thecorrelation of each of these 23 indicators with the perceptionof stability, that allows us to calculate the overall stabilityscore as well as the scores for each scale.
The next paragraphs analyse the responses to the threequestions on stability against the Stability Index score.
Feeling of stability: asked to choose the best statementdescribing the feeling of stability in the locality, most keyinformants (82%) responded they felt that the locality was safeand stable. Their answers correlate with the stability score in
the same areas. In safe and stable localities, the averageStability Index score is 79/100, whereas in areas consideredunsafe and unstable the average score is 53/100.
Ability to continue living in the locality: on the need to movefrom the current location soon due to safety and stabilityconcerns, most key informants (88%) responded that thepeople in the location did not expect to move anytime soon.Borno State in Nigeria has the highest proportion of localitieswhere people expect to need to move soon (24%).
Evolution of the situation in the last 6 months: to the question“How has your feeling of the situation in your locality changedover the last 6 months?” responses are quite different bycountry. In Nigeria, 74% of the localities assessed are morehopeful about the community than 6 months ago. This result issomewhat lower in Cameroon (52%) and significantly lower inNiger, where only 26% of localities are hopeful about thefuture.
82% Safe
18 % Unsafe
Feeling of stability in the locality
Average stability score for these safe localities: 78
Average stabilityscore for these
unsafe localities: 53
87% 91% 87%96%
13% 9% 13%4%
Cam
ero
on
Nig
er
Nig
eria
Ch
ad
Ability to continue to live in the locality
May need to leavesoon because ofsafety or stabilityconcerns
Do not need toleave soonbecause of safetyor stabilityconcerns
Nigeria (74%)Cameroon (52%)Chad (47%)Niger (26%)
More hopeful about the situation in the last 6 months
More hopeful about the state of our
community than 6 months ago
2.2. Stability Index Score by Locality
The locality Stability Index scores range from 11/100 to100/100 across the Lake Chad Basin localities, with the lowestscores mainly found in Cameroon: 27 of the lowest-scoring 30localities are found in Cameroon, with the remaining three inNigeria – although it is worth noting that several localities inNigeria are not included in this assessment due to physicalinsecurity impeding data collection.
Highest scores are mainly found in Chad and Nigeria: 20 of the30 localities with the highest scores are in Chad, nine in Nigeriaand one in Niger.
STABILITY INDEX – LAKE CHAD BASINREGIONAL OVERVIEW ROUND 1 – MARCH/APRIL 2021
14 54
13
180
26
120
416
53
247
3
220
101
228
218
CMR
NER
NGA
TCD
Distribution of localities by SI score and countries
0-20 21-40 41-60 61-80 81-100
74 81 7894
4767
55
87
CMR NER NGA TCD
Average Stability Index score by feeling of stability
Safe
Unsafe
4

September 2021
LOC
ALI
TIES
WIT
H H
IGH
EST
SCO
RE
LOC
ALI
TIES
WIT
H L
OW
EST
SCO
RE
Stability Livelihood and Basic Services
Country Region Locality
Feel
ing
of
stab
ility
Inte
nti
on
to
sta
y
Ch
ange
in
situ
atio
n
Hab
itat
acc
ess
Hab
itat
d
estr
uct
ion
Edu
cati
on
acc
ess
Hea
lth
acc
ess
Mar
ket
acce
ss
Elec
tric
ity
acce
ss
Wat
er a
cces
s
Farm
lan
d
cult
ivat
edFi
shin
g gr
ou
nd
s ac
cess
Pu
blic
sec
tor
pre
sen
ce
ICT
acce
ss
TCD Lac Bibi Barrage
NGA Adamawa Oplao
NGA Adamawa Tigno Kogi
NGA Adamawa Buamutudo
NGA Adamawa Lamurde
NGA Adamawa Gyawana
NGA Adamawa Ngbakowo
NGA Adamawa Overseer
TCD Lac Village Melea
TCD Lac Kiskawa Urbain
TCD Lac Yiga Village
TCD Lac Ngororom Village
TCD Lac Yiga Site
TCD Lac Yakoua
TCD Lac Ngouboua Centre
TCD Lac Diamerom
TCD Lac Baga-sola
TCD Lac Kollom
TCD Lac Koudoubol_bol
NGA Adamawa Tigno Dutse
TCD Lac Digou 2
NGA Adamawa Chumun
NER Diffa Ngeul Kolo
TCD Lac Medi Koura
TCD Lac Chebrey
TCD Lac Kokolom
TCD Lac Moundi A
TCD Lac Salia
TCD Lac Maar
TCD Lac Baboul 2
CMR Extreme Nord Mbzagabai
CMR Extreme Nord Tokombere
CMR Extreme Nord Margui
CMR Extreme Nord Nassarao
CMR Extreme Nord Madouvaya
CMR Extreme Nord Ndaga
CMR Extreme Nord Palbara
CMR Extreme Nord Mayo-plata
CMR Extreme Nord Kartche
CMR Extreme Nord Manda 1
CMR Extreme Nord Gadabak
CMR Extreme Nord Kassibe
CMR Extreme Nord Ndego 1
CMR Extreme Nord Badra
NGA Adamawa Humshe
CMR Extreme Nord Tinderme
CMR Extreme Nord Oumaka
CMR Extreme Nord Ndolohe Arabe
CMR Extreme Nord Soudralhel
CMR Extreme Nord Goubago
CMR Extreme Nord Dougoummango
CMR Extreme Nord Attri-salamat
CMR Extreme Nord Hitere
NGA Adamawa Muduvu
CMR Extreme Nord Tazang
CMR Extreme Nord Djeskawe
CMR Extreme Nord Serawa
CMR Extreme Nord Sattomi
NGA Adamawa Mango
STABILITY INDEX – LAKE CHAD BASINREGIONAL OVERVIEW ROUND 1 – MARCH/APRIL 2021
3. LOCALITY ANALYSIS
3.1 Livelihood and Basic
Services — Comparative
analysis of localities with
highest and lowest SI scores
This table shows the scores ofthe key livelihood and basicservices indicators and thethree stability “anchorquestions” for the localitieswith the highest and lowestscores in the four regions ofthe Lake Chad Basin.
It is interesting to note thatsome indicators are low (red)across both the localities withthe highest and lowestscores: for example, access toelectricity and public sectoremployee presence. Thisindicates that whileprogrammes could supportthese areas of focus, theywould not necessarily affectthe overall perception ofstability, as the localities withhighest stability scores alsoscore poorly (red) on theseindicators.
Other indicators, however,clearly have a significantimpact on the perception ofstability. Access to habitat,access to drinking water andinformation and commun-ication technology (ICT) areall low (red) for the localitieswith a low stability score andhigh (green) for localities withhigh stability scores,indicating that theseindicators are significantlyinfluencing the perception ofstability.
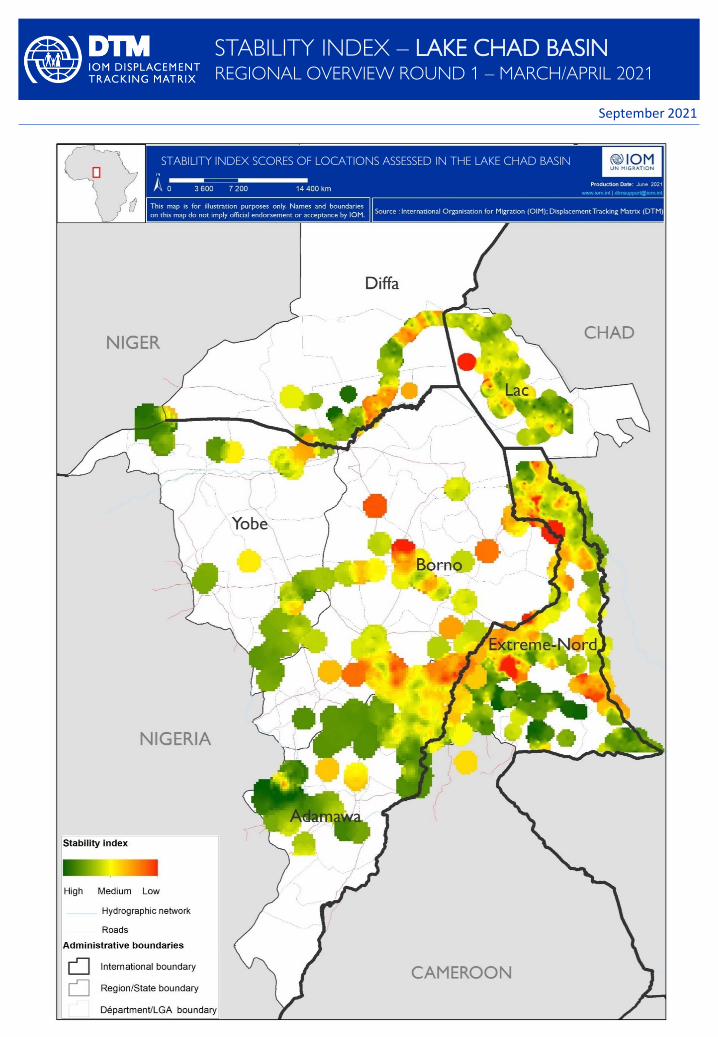
This section provides an overview of the localities with the highest and lowest scores across the four countries, along the three scales ofanalysis. It shows, for each of these localities, the score from worst possible answer (red) to best (green) for the main indicators collected. Thisallows the identification of the indicators on which programmes should focus in order to change the perception of stability (i.e. indicators thatare red in low score localities and green in high score localities).
Scale shown for each indicator moves gradually
from red (worst possible response for the
indicator) to green (best possible response for
the indicator). The score for each indicator is
rescaled to range between 0 to 10. A score of
10 indicates a good situation (the most positive
answer possible) and is depicted in green. A
score of 0 indicates the worst possible answer
for this indicator and is depicted in red. These
scores are not directly linked with the calculation
of the Stability Index score.
WorstBest 10 0
September 2021
This table shows the scoresof the key socialcohesion indicators and thethree stability “anchorquestions” for the localitieswith the highest and lowestscores in the four regions ofthe Lake Chad Basin.
Some indicators are low(red) across the localitieswith the lowest and higheststability scores: identitydocument possession andthe participation in publicaffairs. This indicates thatwhile programmes couldsupport these areas of focus,they would not necessarilyaffect the overall perceptionof stability, as the localitieswith highest stability scoresalso score poorly (red) onthese indicators.
Other indicators are clearlydivided and heavily impactthe perception of stability:illegal occupation ofhabitat, land and property(HLP), the liveliness andeconomic activities in thestreets of the locality (dailypublic life activity) and theequal access to basicservices all have a low score(red) for localities with thelowest stability scores and ahigh score (green) forlocalities with the higheststability scores indicatingthat these indicators have astrong influence on theperception of stability andmay therefore be primeareas of focus forprogrammatic interventions.
3.2 Social Cohesion
— Comparative
analysis of localities
with highest and
lowest SI scores
LOC
ALI
TIES
WIT
H H
IGH
EST
SCO
RE
LOC
ALI
TIES
WIT
H L
OW
EST
SCO
RE
Stability Social Cohesion
Country Region Locality
Feel
ing
of
stab
ility
Inte
nti
on
to
sta
y
Ch
ange
in s
itu
atio
n
Ille
gal
occ
up
atio
n o
f H
LP
Ro
bb
ery
of
per
son
al
bel
on
gin
gs
Ro
bb
ery
of
catt
le
Dai
ly p
ub
lic l
ife
acti
vity
Co
mm
un
ity
sup
po
rt
syst
ems
Co
mm
un
ity
ten
sio
ns
Equ
al a
cces
s to
bas
ic
serv
ices
Iden
tity
do
cum
ent
po
sse
ssio
n
Pa
rtic
ipat
ion
in
pu
blic
af
fair
s
TCD Lac Bibi Barrage
NGA Adamawa Oplao
NGA Adamawa Tigno Kogi
NGA Adamawa Buamutudo
NGA Adamawa Lamurde
NGA Adamawa Gyawana
NGA Adamawa Ngbakowo
NGA Adamawa Overseer
TCD Lac Village Melea
TCD Lac Kiskawa Urbain
TCD Lac Yiga Village
TCD Lac Ngororom Village
TCD Lac Yiga Site
TCD Lac Yakoua
TCD Lac Ngouboua Centre
TCD Lac Diamerom
TCD Lac Baga-sola
TCD Lac Kollom
TCD Lac Koudoubol_bol
NGA Adamawa Tigno Dutse
TCD Lac Digou 2
NGA Adamawa Chumun
NER Diffa Ngeul Kolo
TCD Lac Medi Koura
TCD Lac Chebrey
TCD Lac Kokolom
TCD Lac Moundi A
TCD Lac Salia
TCD Lac Maar
TCD Lac Baboul 2
CMR Extreme Nord Mbzagabai
CMR Extreme Nord Tokombere
CMR Extreme Nord Margui
CMR Extreme Nord Nassarao
CMR Extreme Nord Madouvaya
CMR Extreme Nord Ndaga
CMR Extreme Nord Palbara
CMR Extreme Nord Mayo-plata
CMR Extreme Nord Kartche
CMR Extreme Nord Manda 1
CMR Extreme Nord Gadabak
CMR Extreme Nord Kassibe
CMR Extreme Nord Ndego 1
CMR Extreme Nord Badra
NGA Adamawa Humshe
CMR Extreme Nord Tinderme
CMR Extreme Nord Oumaka
CMR Extreme Nord Ndolohe Arabe
CMR Extreme Nord Soudralhel
CMR Extreme Nord Goubago
CMR Extreme Nord Dougoummango
CMR Extreme Nord Attri-salamat
CMR Extreme Nord Hitere
NGA Adamawa Muduvu
CMR Extreme Nord Tazang
CMR Extreme Nord Djeskawe
CMR Extreme Nord Serawa
CMR Extreme Nord Sattomi
NGA Adamawa Mango
STABILITY INDEX – LAKE CHAD BASINREGIONAL OVERVIEW ROUND 1 – MARCH/APRIL 2021
WorstBest 10 0

September 2021
LOC
ALI
TIES
WIT
H H
IGH
EST
SCO
RE
This table shows thescores of the key safetyand security indicatorsand the three stability“anchor questions” for thelocalities with thehighest and lowest scoresin the four regions of theLake Chad Basin.
Some indicators are low(red) across the localitieswith the lowest andhighest stability scores:Security forcepresence and policepresence in the locality.This indicates that whileprogrammes couldsupport these areas offocus, they would notnecessarily affect theoverall perception ofstability, as the localitieswith highest stabilityscores also score poorly(red) on these indicators.
Other indicators areclearly divided and heavilyimpact the perception ofstability. The freedom ofmovement (the ability tomove around the localityfreely) and thecommunity perception ofsecurity (whetherresidents are worriedabout security in thelocality) all have lowscores (red) for the lowestSI localities and a highscores (green) forlocalities with the higheststability scores indicatingthat these indicators havea strong influence on theperception of stability.
LOC
ALI
TIES
WIT
H L
OW
EST
SCO
RE
3.3 Safety and Security
— Comparative
analysis of localities
with highest and
lowest SI scores
Stability Safety and Security
Country Region Locality
Feel
ing
of
stab
ility
Inte
nti
on
to
sta
y
Ch
ange
in s
itu
atio
n
Seri
ou
s se
curi
ty in
cid
ents
Secu
rity
inci
den
t o
ver
reso
urc
es
Act
ivit
ies
by
NSA
G
Loca
l cri
me
tren
ds
Co
mm
un
ity
per
cep
tio
n o
f se
curi
ty
Secu
rity
fo
rces
pre
sen
ce
Po
lice
pre
sen
ce
NSA
G p
rese
nce
Free
do
m o
f m
ove
men
t
Form
al c
urf
ew
Info
rmal
cu
rfew
Acc
ess
to le
gal
rem
edie
s
TCD Lac Bibi Barrage
NGA Adamawa Oplao
NGA Adamawa Tigno Kogi
NGA Adamawa Buamutudo
NGA Adamawa Lamurde
NGA Adamawa Gyawana
NGA Adamawa Ngbakowo
NGA Adamawa Overseer
TCD Lac Village Melea
TCD Lac Kiskawa Urbain
TCD Lac Yiga Village
TCD LacNgororom
Village
TCD Lac Yiga Site
TCD Lac Yakoua
TCD LacNgouboua
Centre
TCD Lac Diamerom
TCD Lac Baga-sola
TCD Lac Kollom
TCD Lac Koudoubol_bol
NGA Adamawa Tigno Dutse
TCD Lac Digou 2
NGA Adamawa Chumun
NER Diffa Ngeul Kolo
TCD Lac Medi Koura
TCD Lac Chebrey
TCD Lac Kokolom
TCD Lac Moundi A
TCD Lac Salia
TCD Lac Maar
TCD Lac Baboul 2
CMR Extreme Nord Mbzagabai
CMR Extreme Nord Tokombere
CMR Extreme Nord Margui
CMR Extreme Nord Nassarao
CMR Extreme Nord Madouvaya
CMR Extreme Nord Ndaga
CMR Extreme Nord Palbara
CMR Extreme Nord Mayo-plata
CMR Extreme Nord Kartche
CMR Extreme Nord Manda 1
CMR Extreme Nord Gadabak
CMR Extreme Nord Kassibe
CMR Extreme Nord Ndego 1
CMR Extreme Nord Badra
NGA Adamawa Humshe
CMR Extreme Nord Tinderme
CMR Extreme Nord Oumaka
CMR Extreme Nord Ndolohe Arabe
CMR Extreme Nord Soudralhel
CMR Extreme Nord Goubago
CMR Extreme NordDougoummang
o
CMR Extreme Nord Attri-salamat
CMR Extreme Nord Hitere
NGA Adamawa Muduvu
CMR Extreme Nord Tazang
CMR Extreme Nord Djeskawe
CMR Extreme Nord Serawa
CMR Extreme Nord Sattomi
NGA Adamawa Mango
STABILITY INDEX – LAKE CHAD BASINREGIONAL OVERVIEW ROUND 1 – MARCH/APRIL 2021
WorstBest 10 1

September 2021
INTERNATIONAL ORGANIZATION FOR MIGRATION (IOM)
Contact: RO Dakar - Data and Research [email protected] https://displacement.iom.int
When quoting, paraphrasing or in any way using the information mentioned in this report, the source needs to be stated appropriately as follows:
“Source: International Organization for Migration (IOM), September 2021, Displacement Tracking Matrix (DTM)”.
The Stability Index uses a Principal Component Analysis tounderstand the impact of each variable on the perception ofkey informants of the stability in the area and then provides aspecific value per indicator.
This allows for the analysis of which indicators have the mostimpact on the perception of stability among the population.For a more detailed overview of what each indicator measures,see Appendix.
4. Analysis Of Main Indicators Influencing Stability
CAMEROON CHAD NIGER NIGERIA
TOP 5 MOST INFLUENTIAL INDICATORS ON PERCEPTION OF STABILITY BY COUNTRY
1
2
3
4
5
Daily Public Life Activity
Freedom of Movement
Community Perception of Security
Access to Legal Remedies
Possession of Identity Documents
Illegal Occupation of Land
Informal Curfew
Delay in Access Medical Care
Freedom of Movement
Security Incidents
Robbery Personal Effects
Non-State Armed Groups Activities
Freedom of Movement
Security Incidents
Illegal Occupation of Land
Daily Public Life
Freedom of Movement
Security Incidents
Robbery Personal Effects
Violent Extremist Incidents
This analysis provides insight into the possibleprogrammatic and policy responses that need to beimplemented in the target communities:
The freedom of movement stands out as an influentialindicator cutting across all four countries, highlighting thatthis important issue should be a consideration forprogrammatic work throughout the region. Security alsoranked as an influential factor in all countries — although itis noteworthy that the most influential explicit securityindicator in Cameroon was the community perception ofsecurity (the extent that residents are worried aboutsecurity) whereas for the other three countries the dominantexplicit security indicator was security incidents (theexperience of a serious security incident in recent months).While daily public life is the most important factor in bothCameroon and Nigeria (which are also the countries with the
two lowest overall stability scores), it does not rank in thetop five for either Chad or Niger.
This breakdown of the most influential indicators reveals astark difference between the relative impact of the threesub-categories of thematic indicators – security indicatorsrepresent the largest proportion of influential indicators,although social cohesion indicators rank as the mostinfluential in each country. Only one livelihood indicator isrepresented – access to medical care in Chad, indicating thatthe other two thematic categories may have more influenceon the perception of stability.
Sections 3.2, 3.3 and 3.4 provide a description of the mostinfluential indicators on perception of stability for the threescales livelihood and basic services, social cohesion andsafety and security by country.
STABILITY INDEX – LAKE CHAD BASINREGIONAL OVERVIEW ROUND 1 – MARCH/APRIL 2021
4.1 Top influential indicators on the perception of stability by country
8
LIVELIHOOD SOCIAL COHESION SECURITY

Question: “At any time in the last 4 weeks, are you aware ofresidents delaying getting medical care because of the COVID-19pandemic?”
This variable was highlighted as a key indicator in Chadimpacting the perception of stability among communities. Ifthere is no delay in accessing medical care due to COVID-19 inthe locality, the Stability Index score tends to be higher.
4.2 Scale 1: Livelihood & basic services
Delaying medical care (due to COVID)
September 2021
INTERNATIONAL ORGANIZATION FOR MIGRATION (IOM)
Contact: RO Dakar - Data and Research [email protected] https://displacement.iom.int
When quoting, paraphrasing or in any way using the information mentioned in this report, the source needs to be stated appropriately as follows:
“Source: International Organization for Migration (IOM), September 2021, Displacement Tracking Matrix (DTM)”.
93% 91% 88% 98%
7% 9% 12%2%
0%
20%
40%
60%
80%
100%
CMR NER NGA TCD
Delay in access to medical care due to COVID-19
Yes
No
Question: “Describe the damage to homes caused by theongoing conflict?”
No homes in the locality were destroyed or badly damaged.Less than 50% of homes in the locality were destroyed or badlydamaged, but reconstruction is underway.Less than 50% of homes in the locality were destroyed or badlydamaged and NO reconstruction is underway.50% or more homes in the locality were destroyed or badlydamaged, but reconstruction is underway.50% or more homes in the locality were destroyed or badly damagedand NO reconstruction is underway.
If habitat is not damaged or if construction is underway in thelocality, the Stability Index score tends to be higher. The highestproportion of buildings damaged was found in Cameroon andNigeria where respectively 20% and 12% of localities witnesseddamages of more than 50% of the houses available.
Destruction of habitat due to conflict
56%
75%
22%
78%
0%
10%
20%
30%
40%
50%
60%
70%
80%
90%
100%
CMR NER NGA TCD
Destruction of habitat due to conflict
No home damaged
Less than 50% damaged,Construction underway
Less than 50% damaged,No constuction underway
More than 50% damaged,Construction underway
More than 50% damaged,No construction underway
45%
17%
55%
22%
44%
63%
42%
62%
11%21%
3%
17%
0%
10%
20%
30%
40%
50%
60%
70%
80%
90%
100%
CMR NER NGA TCD
Situation of local markets
Closed
Open butsupplies arescarce
Open andsuppliedregularly
Question: “Describe the situation of markets in the locality interm of supply and status?”
The local markets and small shops are open and are regularly andreliably supplied.The local markets and small shops are open, but items are scarce.Local markets and small shops are closed.
The access to and supplies available in local markets is a keyindicator impacting the perception of stability. If markets areopen and supplied in the locality, the Stability Index score tendsto be higher. Nigeria and Cameroon have the highest proportionof localities with markets open and regularly supplied.
Availability of local market
STABILITY INDEX – LAKE CHAD BASINREGIONAL OVERVIEW ROUND 1 – MARCH/APRIL 2021
This section analyses the key variables that influence the perception of stability related to livelihood and basic services.
9

Question: “Are land, habitat or property being occupied illegally(without authorization from family, neighbors, localauthorities…) in the locality?”
No, none.Yes, but land, habitat or property illegal occupation is not an issueimpacting the whole locality (only a few or minor cases reported).Yes, land, habitat or property illegal occupation is a major issueimpacting the locality .
Illegal occupation of land, habitat or property (HLP) plays a bigrole in stability perception in the localities assessed. Althoughthese percentages may not seem very high, illegal occupation ofHLP plays a large role in the perception of stability.
4.3 Social Cohesion - Descriptive analysis
Illegal occupation of land, habitat and property
September 2021
INTERNATIONAL ORGANIZATION FOR MIGRATION (IOM)
Contact: RO Dakar - Data and Research [email protected] https://displacement.iom.int
When quoting, paraphrasing or in any way using the information mentioned in this report, the source needs to be stated appropriately as follows:
“Source: International Organization for Migration (IOM), September 2021, Displacement Tracking Matrix (DTM)”.
Question: “Describe the current daily public life in the locality”Streets are lively and residents are able to carry out activities (goingto the market, kids playing, going out, street vendors…) withoutworry.Streets are lively and residents are able to carry out activities (goingto the market, kids playing, going out, street vendors…), but thesituation is tense.There are very few people in the streets and people leave their homeonly if absolutely necessary.
This question focused on the level of economic activities andliveliness in street of assessed localities. If streets are lively andactivities are being carried out normally in the locality, theStability Index score tends to be higher. Both Niger and Chadshowed positive results with respectively 91% and 92% oflocalities where streets are lively and activities being carried outnormally.
Daily public life (activities, market day, etc.)
Question: “Describe the situation with respect to identitydocuments”
Most residents have identity documents.Most residents do NOT have identity documents, but it would beeasy for them to get some.Most residents do NOT have identity documents, and it would bedifficult for them to get some.
The possession and access to identity documents is anotherimportant variable in the perception of stability. If residentshave identity documents in the locality, the Stability Index scoreis higher. Localities in Cameroon and Chad showed very lowproportion of residents with identity documents or the ability toaccess documents if needed.
Identity documents possession
80% 81%72%
100%
14% 16%23%
6% 4% 5%
0%
10%
20%
30%
40%
50%
60%
70%
80%
90%
100%
CMR NER NGA TCD
Illegal occupation of land, habitat and property
Yes many
Yes some
None
66%
91%
64%
92%
22%
8%
34%
4%12%
2% 2% 4%
0%
10%
20%
30%
40%
50%
60%
70%
80%
90%
100%
CMR NER NGA TCD
Daily public life in the locality
Street are empty andpeople are staying home
Streets are livelily andactivities ongoing butthe situation is tense
Streets are lively andactivities being carriedout normaly
35%
81%75%
52%
29%
9%14%
13%
35%
9% 11%
35%
0%
10%
20%
30%
40%
50%
60%
70%
80%
90%
100%
CMR NER NGA TCD
Possession of identity documents
Residents dont havedocuments, hard toget
Residents dont havedocuments, but couldget some
Residents havedocuments
STABILITY INDEX – LAKE CHAD BASINREGIONAL OVERVIEW ROUND 1 – MARCH/APRIL
2021
This section analyses the key variables that influences the perception of stability related to social cohesion.
10

Question: “Is the locality under an informal curfew? (imposed bynon-state actors)”
Curfew imposed by non-state armed groups (NSAG) is a keyvariable in the perception of stability. If no curfew is imposed byNSAG in the locality, the Stability Index score tends to be higher. Toillustrate this point, none of the assessed locations in Chad areunder an informal curfew and Chad is also the country with thehighest Stability Index score, demonstrating the relationshipbetween curfews and a location's stability.
4.4 Safety and Security - Descriptive analysis
Curfew imposed by non-state actors
September 2021
INTERNATIONAL ORGANIZATION FOR MIGRATION (IOM)
Contact: RO Dakar - Data and Research [email protected] https://displacement.iom.int
When quoting, paraphrasing or in any way using the information mentioned in this report, the source needs to be stated appropriately as follows:
“Source: International Organization for Migration (IOM), September 2021, Displacement Tracking Matrix (DTM)”.
Question: “Describe the current incident trend linked with crimes(theft, small scale crimes) in the locality?”
There is an increase in these incidents in the locality in the past 3months.There is decrease in these incidents in the locality in the past 3 months.There is no change in these incidents in the locality in the past 3months.
The evolution of crime in the localities assessed played a key rolein the perception of stability among key informants. If theevolution in local crime in the locality is positive (decrease in thenumber of incidents), the Stability Index score tends to be higher.Two countries witnessed a large increase in local crime rates in thepast 3 months: Niger (23% of localities) and Nigeria (16%).
Local crime incidents
Question: “Describe the current trend linked to activities by Non-State Armed Groups (kidnapping, terrorist attacks, fighting, raids,bombings, killings of security forces) in the locality?”
There is an increase in these incidents in the locality in the past 3months.There is a decrease in these incidents in the locality in the past 3months.There is no change in these incidents in the locality in the past 3months.
The evolution of the number of incidents involving NSAGs in thepast 3 months in localities assessed also has a strong influence onthe perception of stability. If there was a decrease in the numberof incidents in the last months, the Stability Index score is higher.Two countries witnessed a large increase in incidents involvingNSAG in the past 3 months: Niger (19% of localities) and Nigeria(16%)
Activities by Non-State Armed Groups
85%96%
80%100%
15%
4%
20%
0%
20%
40%
60%
80%
100%
CMR NER NGA TCD
Curfew imposed by Non-State Armed Groups
Curfew
No curfew
53%43%
62%51%
38%
34%
22% 45%
9%23%
16%4%
0%
10%
20%
30%
40%
50%
60%
70%
80%
90%
100%
CMR NER NGA TCD
Evolution of local crimes in the past 3 months
Increase past 3months
No change past 3months
Decrease past 3months
51%40%
62%51%
39%
41%
23% 46%
10%19% 16%
3%
0%
10%
20%
30%
40%
50%
60%
70%
80%
90%
100%
CMR NER NGA TCD
Incidents involving non-state armed groups
Increase past 3months
No change past 3months
Decrease past 3months
STABILITY INDEX – LAKE CHAD BASINREGIONAL OVERVIEW ROUND 1 – MARCH/APRIL 2021
This section analyses the key variables that influence the perception of stability related to Safety and Security.
11

September 2021
5. Cluster AnalysisAs the Stability Index focuses its data collection at the lowest
possible administrative level, it is difficult to develop generic
recommendations for all four countries of the Lake Chad Basin.
For programmatic purposes, the creation of “clusters” of localitiescould facilitate targeted interventions with the most impact, in linewith the most influential variables in each cluster.
5.1 Stability Index Score by Cluster
27 clusters have been identified using two main criteria:geographic proximity and Stability Index score.
The average Stability Index score for these clusters ranges from62/100 to 95/100.
Most clusters are located within the boundaries of one country(21), but 6 clusters span the borders two countries.
Clusters may be further grouped to facilitate the design ofprogrammatic interventions. A coherent set of activities can beimplemented for each group to achieve better perceptions ofstability.
Example Cluster-Group Based Programmatic Approach:
• Low SI Clusters in Cameroon: The values of the differentindicators of the Stability Index suggest that programmes in thiscluster group should urgently focus on restoring local economicactivities, supporting freedom of movement as well asaccessing legal remedies and identity documents to achievehigher levels of perceived stability. (Clusters 4, 6, and 8)
• Low SI Clusters in Nigeria: Programmes should urgently focuson restoring local economic activities, supporting freedom ofmovement and reducing security incidents and petty crimes inorder to achieve higher levels of perceived stability. (Clusters23, 24, 25)
• Mixed High and Low SI Clusters: These clusters include a mix oflocalities with both high and low SI scores. Localities with alower score have the potential to destabilize localities with ahigher score, while high-scoring localities could positivelyinfluence those with lower scores. For instance, as illustrated inthe table below, cluster 10 includes 22 localities with closedmarkets. Supporting the (re)opening of markets in theselocalities could have a potential positive impact on the wholecluster. (Clusters 9, 10, 11, 27)
Cluster Locations CountriesStability
Index Score# of
Localities
1Mayo Tsanago et Mayo Savana, Borno
Cameroon, Nigeria 69 223
2Diamaré, Mayo Kani, Mayo Tsanaga
Cameroon 84 72
3 Mayo-Danay Cameroon 84 19
4 Mayo-Danay, Logone et Chari Cameroon 63 67
5 Logone et Chari Cameroon 72 10
6 Logone et Chari Cameroon 62 18
7 Logone et Chari Cameroon 76 87
8 Logone et Chari, Borno Cameroon, Nigeria 63 280
9 Mamdi Chad 95 60
10 Fouli, Kaya Chad 94 100
11 Fouli, Kaya Chad 93 49
12 Nguigmi Niger 68 17
13 Nguigmi Niger 82 20
14 Diffa Niger 66 28
15 Diffa, Maine Soroa, Yobé Niger, Nigeria 85 106
16 Maine Niger 74 5
17 Adamawa Nigeria 86 23
18 Yobe Nigeria 81 4
19 Yobe, Diffa Nigeria, Niger 69 30
20 Yobe Nigeria 84 2
21 Yobe Nigeria 84 31
22 Borno, Yobe Nigeria 75 22
23 Borno Nigeria 68 30
24 Borno Nigeria 66 67
25 Adamawa, Borno, Far North Nigeria, Cameroon 65 156
26 Adamawa Nigeria 83 133
27 Adamawa Nigeria 89 58
Stability Index - Clusters
12
STABILITY INDEX – LAKE CHAD BASINREGIONAL OVERVIEW ROUND 1 – MARCH/APRIL 2021
12
Example of discrepancies between market situationsin mixed high and low SI clusters
Cluster Closed
Open but supplies are
scarce
Open and supplied regularly Total
(# of localities) (# of localities) (# of localities)
9 1 43 16 60
10 22 63 15 100
11 11 25 13 49
27 0 8 50 58
September 2021
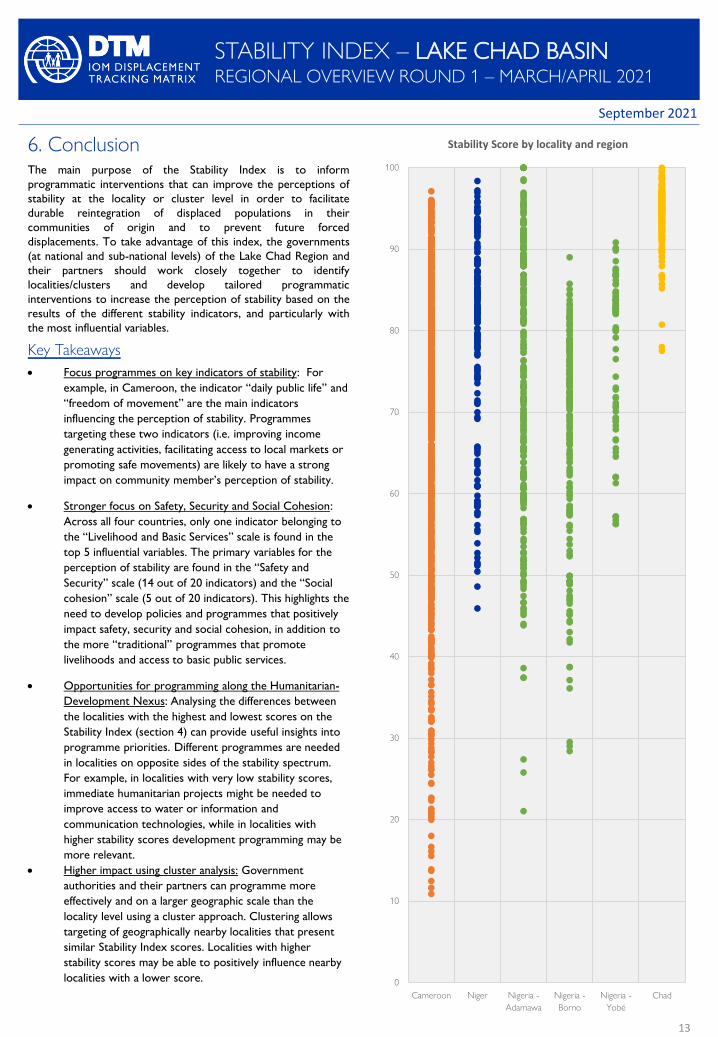
6. ConclusionThe main purpose of the Stability Index is to inform
programmatic interventions that can improve the perceptions of
stability at the locality or cluster level in order to facilitate
durable reintegration of displaced populations in their
communities of origin and to prevent future forced
displacements. To take advantage of this index, the governments
(at national and sub-national levels) of the Lake Chad Region and
their partners should work closely together to identify
localities/clusters and develop tailored programmatic
interventions to increase the perception of stability based on the
results of the different stability indicators, and particularly with
the most influential variables.
Key Takeaways
• Focus programmes on key indicators of stability: For
example, in Cameroon, the indicator “daily public life” and
“freedom of movement” are the main indicators
influencing the perception of stability. Programmes
targeting these two indicators (i.e. improving income
generating activities, facilitating access to local markets or
promoting safe movements) are likely to have a strong
impact on community member’s perception of stability.
• Stronger focus on Safety, Security and Social Cohesion:
Across all four countries, only one indicator belonging to
the “Livelihood and Basic Services” scale is found in the
top 5 influential variables. The primary variables for the
perception of stability are found in the “Safety and
Security” scale (14 out of 20 indicators) and the “Social
cohesion” scale (5 out of 20 indicators). This highlights the
need to develop policies and programmes that positively
impact safety, security and social cohesion, in addition to
the more “traditional” programmes that promote
livelihoods and access to basic public services.
• Opportunities for programming along the Humanitarian-
Development Nexus: Analysing the differences between
the localities with the highest and lowest scores on the
Stability Index (section 4) can provide useful insights into
programme priorities. Different programmes are needed
in localities on opposite sides of the stability spectrum.
For example, in localities with very low stability scores,
immediate humanitarian projects might be needed to
improve access to water or information and
communication technologies, while in localities with
higher stability scores development programming may be
more relevant.
• Higher impact using cluster analysis: Government
authorities and their partners can programme more
effectively and on a larger geographic scale than the
locality level using a cluster approach. Clustering allows
targeting of geographically nearby localities that present
similar Stability Index scores. Localities with higher
stability scores may be able to positively influence nearby
localities with a lower score. 0
10
20
30
40
50
60
70
80
90
100
Cameroon Niger Nigeria -
Adamawa
Nigeria -
Borno
Nigeria -
Yobé
Chad
Stability Score by locality and region
STABILITY INDEX – LAKE CHAD BASINREGIONAL OVERVIEW ROUND 1 – MARCH/APRIL 2021
13

September 2021
7. Annex
INTERNATIONAL ORGANIZATION FOR MIGRATION (IOM)
Contact: RO Dakar - Data and Research [email protected] https://displacement.iom.int
When quoting, paraphrasing or in any way using the information mentioned in this report, the source needs to be stated appropriately as follows:
“Source: International Organization for Migration (IOM), September 2021, Displacement Tracking Matrix (DTM)”.
STABILITY INDEX – LAKE CHAD BASINREGIONAL OVERVIEW ROUND 1 – MARCH/APRIL 2021
14
7.1 Additional Discussion of Methodology
Selection of Localities Explained The selection of localities was as broad as possible in areasaffected by displacement and/or returns in the Lake ChadBasin, which includes the Diffa region of Niger, the Far-North region of Cameroon, the Lac region in Chad andAdamawa, Borno, and Yobe regions of Nigeria.
A list of localities was created in every country based ondata collected by IOM on displacement/returns and/orother existing data systems (census, administrative lists).All these localities were surveyed. The objective was tohave a large enough number of localities both at countryand regional level to ensure a solid statistical analysis.
LimitationsSome localities that were not accessible during the datacollection period were not assessed due to security orlogistical reasons. This may have introduced bias into theanalysis as data points from some of the least securelocations were not collected. This limits the generalizabilityof the Stability Index in extremely insecure localities.
It is important to note that the Stability Index estimatesinformants’ perceptions of stability and does not claim toprovide an objective measure of this complex topic. Keyinformants are not randomly selected and may havedifferent opinions about the stability in their locality thansome of their neighbors.
7.2 – Map of localities assessed in the Lake
Chad Basin
In the context of the LCB, a locality is theadministrative level 4 (lowest possible level).The level has a representation, whetherformal (State) or informal (Chef de village).
Principal Component Analysis ExplainedPrincipal Component Analysis is a statisticaldimensionality reduction tool, which allowsfor the consideration of many variables byavoiding the typical concern of overfittingthe model. PCA measures how each variableis associated with the others, the directionsin which the data is dispersed, and therelative importance of each variable.Essentially, PCA helps identify the indicatorsthat are associated with the largestchanges in a key variable of interest – inthis case, the perception of stability.
While each of the indicators is clearlyimportant for informing programming alongthe humanitarian-development-peacenexus, PCA is particularly useful fordemonstrating the impact of differentindicators on one another, and theproportional influence of a given indicatoron a given dataset. For example, while theavailability of electricity and access to healthcare are both individually important factors,they also heavily influence one another (thisis called collinearity). PCA helps to seebeyond the collinearity and drives atinfluence in a more coherent way, which iscritical to understanding complexphenomena like the nature and conditionsof return.

September 2021
7.3 – Survey Indicators
INTERNATIONAL ORGANIZATION FOR MIGRATION (IOM)
Contact: RO Dakar - Data and Research [email protected] https://displacement.iom.int
When quoting, paraphrasing or in any way using the information mentioned in this report, the source needs to be stated appropriately as follows:
“Source: International Organization for Migration (IOM), September 2021, Displacement Tracking Matrix (DTM)”.
ANCHOR QUESTIONS: PERCEPTION OF STABILITYThese key indicators were used to measure the perception of stability in each locality. The key indicators where then testedagainst each of the thematic indicators below to identify the most influential thematic indicators on the perception of stability.
Feeling of Stability in the Locality
Describe the feeling of stability in the locality
Ability to Continue Living in Locality
Describes the feeling of the community about their ability to continue to live here
Changes in Stability Perception in the Last 6 Months
Change in this feelings over the last 6 months?
SCALE 1: LIVELIHOOD & SERVICESAccess to Drinking Water
Access to water and frequency of water provision in the locality
Access to Health Centers
Access to functioning health center in the locality or in neighboring town
Delaying Medical Care (due to COVID)
Residents delayed medical care because of the COVID-19 pandemic in the last 4 weeks
Delaying Medical Care (not due to COVID)
Residents delayed medical care for reasons other than COVID-19 the last 4 weeks
Farmland Cultivation and Access
Extent of farmland being cultivated in the locality
Fishing Grounds Usage and Access
Extent of fishing ground being used in the locality
Habitat Access
Proportion of community residents currently living in a habitat
Destruction of Habitat Due to Conflict
Extent of the habitat damaged due to conflict and of reconstruction access
ICT Access
Residents can connect (by mobile phone or WIFI) and improvement on network
Electricity Access
Access to electricity and frequency in the locality
Availability of Local Market
Markets open and supplied
Primary Education Access
Access to primary education and availability of schools in the locality or in neighbouring towns
Public Sector Employee Presence
Presence of public sector employee as per pre-conflict situation (public servants, teachers, nurses, etc.)
STABILITY INDEX – LAKE CHAD BASINREGIONAL OVERVIEW ROUND 1 – MARCH/APRIL 2021
15

September 2021
INTERNATIONAL ORGANIZATION FOR MIGRATION (IOM)
Contact: RO Dakar - Data and Research [email protected] https://displacement.iom.int
When quoting, paraphrasing or in any way using the information mentioned in this report, the source needs to be stated appropriately as follows:
“Source: International Organization for Migration (IOM), September 2021, Displacement Tracking Matrix (DTM)”.
SCALE 2: SOCIAL COHESIONEqual Access to Basic Services
Indiscriminate access of populations in the locality to basic services and resources no matter their age, sex or group
Cattle Theft Reported
Cattle theft reported in the locality in the last 6 months
Illegal Occupation of House, Land and Property
Land, habitat or property occupied illegally (without authorization from family, neighbors, local authorities)
Robbery Personal Effects
Robbery of personal belongings in the last 6 months
Daily Public Life Activity
Street social activities and current daily public life in the locality
Social Cohesion And Community Support Systems
In case of problem with the supply of water or food in the locality, livelihood of cooperation between nearby communities
Community Tension
Incidents involving two community groups (religious, ethnic, herders/farmers, displaced/returnee/host communities) in the locality in the last 6 months
Identity Document Possession
Possession of identify documents and possibility of renewal if lost
Participation in Public Affairs
Residents’ level of participation in local public and political life (civil society organizations, unions, committees, social gatherings, religious groups, sports activities)
STABILITY INDEX – LAKE CHAD BASINREGIONAL OVERVIEW ROUND 1 – MARCH/APRIL 2021
16
7.3 – Survey Indicators
SCALE 3: SAFETY AND SECURITYAccess to Legal Remedies
Access to legal remedies in the locality
Activities by Non-State Armed Groups
Current incident trend linked to activities by Non-State Armed Groups (kidnapping, terrorist attacks, fighting, raids bombing, killing of security forces) in the locality in the past 3 months
Curfew Imposed by State
Formal curfew for security reasons enforced by State
Curfew Imposed by Non-State Armed Groups
Formal curfew enforced by Non-State Armed Groups
Freedom of Movement
Residents’ freedom of movement (to markets, to one’s home, to the workplace, to farms, etc.) in the locality
Local Crime Incidents
Current incident trends linked with local crimes (theft, kidnapping, small scale crimes) in the locality in the past 3 months
Security Incidents Over Resources
Current incident trends linked to resources tensions (cattle raiding or killing, land conflict, communal clashes, etc.) in the locality in the past 3 months
Serious Security Incidents
Residents’ concerned about security in the locality
Security Forces Presence
Presence of security forces in the locality
Police Presence
Presence of police/gendarmerie in the locality
Non-State Armed Groups Presence
Presence of Non-State Armed Groups in the locality
Community Perception of Security
Residents worried about security in the locality

STABILITY INDEX – LAKE CHAD BASINREGIONAL OVERVIEW ROUND 1 – MARCH/APRIL 2021
IOM Regional Office for West and Central Africa
Zone 3, Route des Almadies
Dakar BP16 838
Sénégal: Tel: +221 33 689 62 00
Fax: +221 33 869 62 33
Equipe RO Dakar – Regional Data Hub: [email protected]
Data Collection and Analysis Activities funded with the support of
Fragility, Solution and Mobility working group, IOM
The Stability Index is part of a larger body of work developed by IOM country teams in Iraq, Somalia, the Lake Chad Basin, and elsewhere—that improvestrategic planning and implementation of transition and recovery programs. The Fragility, Solutions, and Mobility working group is working to provide aseries of technical and strategic guidance and tools, including drafting a methodological framework to allow for a malleable, context specific butstandardized approach to measuring fragility in new and emerging operations. The goal is an IOM-led global minimum standard for data collection andresponsible data management for measuring and understanding indicators of fragility and stability through the deployment of analytical models indisplacement and conflict contexts.
IOM’s Transition and Recovery Division (TRD) and the IOM Displacement Tracking Matrix (DTM)'s work in this space allows for new and unique approachesaimed at consolidating and packaging existing methods, to achieve stronger outcomes and to better scale programming in fragile contexts. This approachprovides a foundation from which to adapt and contextualize data-based evidence for the support of strategic planning and implementation of transitionand recovery programs. Grounded in the principles of responsible data management, appropriate evidence can identify core factors of fragility, solutions,and mobility at the community level, and help identify how these factors impact the overall condition of the physical location and local community, andhow these evolve over time.