Application of Water Evaluation and Planning (WEAP): A ... · PDF file... Niger Basin...
12
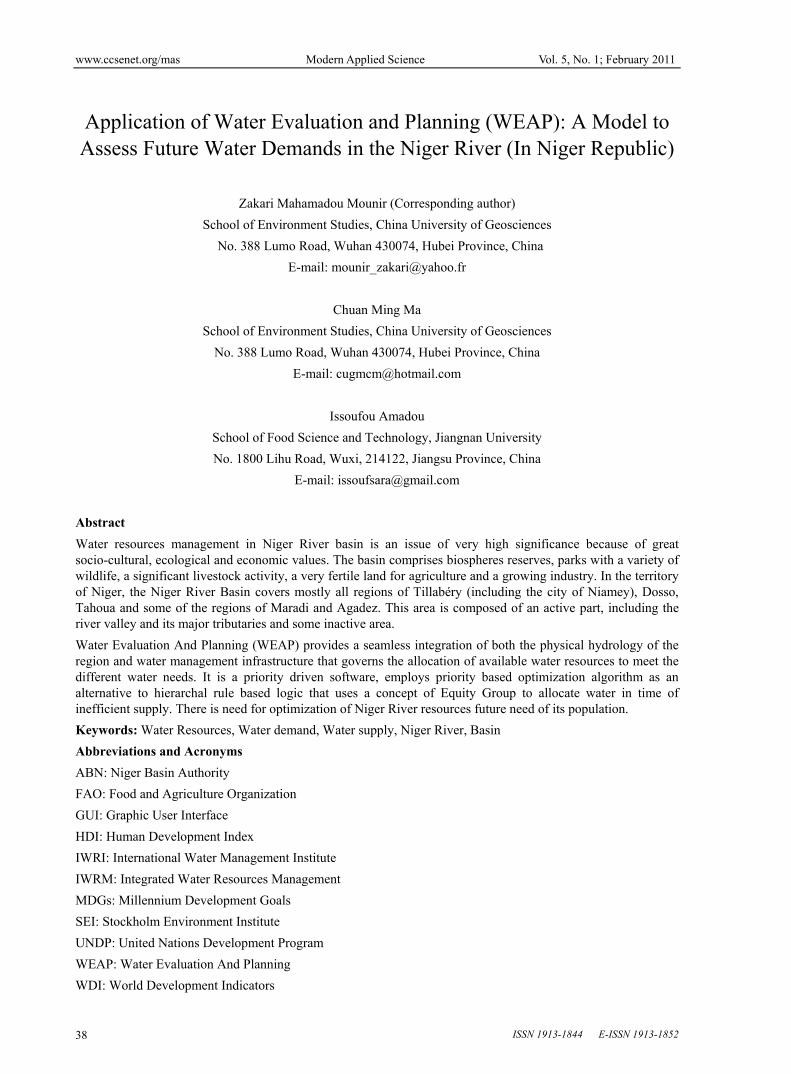
www.ccsenet.org/mas Modern Applied Science Vol. 5, No. 1; February 2011 ISSN 1913-1844 E-ISSN 1913-1852 38 Application of Water Evaluation and Planning (WEAP): A Model to Assess Future Water Demands in the Niger River (In Niger Republic) Zakari Mahamadou Mounir (Corresponding author) School of Environment Studies, China University of Geosciences No. 388 Lumo Road, Wuhan 430074, Hubei Province, China E-mail: [email protected] Chuan Ming Ma School of Environment Studies, China University of Geosciences No. 388 Lumo Road, Wuhan 430074, Hubei Province, China E-mail: [email protected] Issoufou Amadou School of Food Science and Technology, Jiangnan University No. 1800 Lihu Road, Wuxi, 214122, Jiangsu Province, China E-mail: [email protected] Abstract Water resources management in Niger River basin is an issue of very high significance because of great socio-cultural, ecological and economic values. The basin comprises biospheres reserves, parks with a variety of wildlife, a significant livestock activity, a very fertile land for agriculture and a growing industry. In the territory of Niger, the Niger River Basin covers mostly all regions of Tillabéry (including the city of Niamey), Dosso, Tahoua and some of the regions of Maradi and Agadez. This area is composed of an active part, including the river valley and its major tributaries and some inactive area. Water Evaluation And Planning (WEAP) provides a seamless integration of both the physical hydrology of the region and water management infrastructure that governs the allocation of available water resources to meet the different water needs. It is a priority driven software, employs priority based optimization algorithm as an alternative to hierarchal rule based logic that uses a concept of Equity Group to allocate water in time of inefficient supply. There is need for optimization of Niger River resources future need of its population. Keywords: Water Resources, Water demand, Water supply, Niger River, Basin Abbreviations and Acronyms ABN: Niger Basin Authority FAO: Food and Agriculture Organization GUI: Graphic User Interface HDI: Human Development Index IWRI: International Water Management Institute IWRM: Integrated Water Resources Management MDGs: Millennium Development Goals SEI: Stockholm Environment Institute UNDP: United Nations Development Program WEAP: Water Evaluation And Planning WDI: World Development Indicators
Transcript of Application of Water Evaluation and Planning (WEAP): A ... · PDF file... Niger Basin...
www.ccsenet.org/mas Modern Applied Science Vol. 5, No. 1; February 2011
ISSN 1913-1844 E-ISSN 1913-1852 38
Application of Water Evaluation and Planning (WEAP): A Model to Assess Future Water Demands in the Niger River (In Niger Republic)
Zakari Mahamadou Mounir (Corresponding author)
School of Environment Studies, China University of Geosciences
No. 388 Lumo Road, Wuhan 430074, Hubei Province, China
E-mail: [email protected]
Chuan Ming Ma
School of Environment Studies, China University of Geosciences
No. 388 Lumo Road, Wuhan 430074, Hubei Province, China
E-mail: [email protected]
Issoufou Amadou
School of Food Science and Technology, Jiangnan University
No. 1800 Lihu Road, Wuxi, 214122, Jiangsu Province, China
E-mail: [email protected]
Abstract
Water resources management in Niger River basin is an issue of very high significance because of great socio-cultural, ecological and economic values. The basin comprises biospheres reserves, parks with a variety of wildlife, a significant livestock activity, a very fertile land for agriculture and a growing industry. In the territory of Niger, the Niger River Basin covers mostly all regions of Tillabéry (including the city of Niamey), Dosso, Tahoua and some of the regions of Maradi and Agadez. This area is composed of an active part, including the river valley and its major tributaries and some inactive area.
Water Evaluation And Planning (WEAP) provides a seamless integration of both the physical hydrology of the region and water management infrastructure that governs the allocation of available water resources to meet the different water needs. It is a priority driven software, employs priority based optimization algorithm as an alternative to hierarchal rule based logic that uses a concept of Equity Group to allocate water in time of inefficient supply. There is need for optimization of Niger River resources future need of its population.
Keywords: Water Resources, Water demand, Water supply, Niger River, Basin
Abbreviations and Acronyms
ABN: Niger Basin Authority
FAO: Food and Agriculture Organization
GUI: Graphic User Interface
HDI: Human Development Index
IWRI: International Water Management Institute
IWRM: Integrated Water Resources Management
MDGs: Millennium Development Goals
SEI: Stockholm Environment Institute
UNDP: United Nations Development Program
WEAP: Water Evaluation And Planning
WDI: World Development Indicators
www.ccsenet.org/mas Modern Applied Science Vol. 5, No. 1; February 2011
Published by Canadian Center of Science and Education 39
1. Introduction
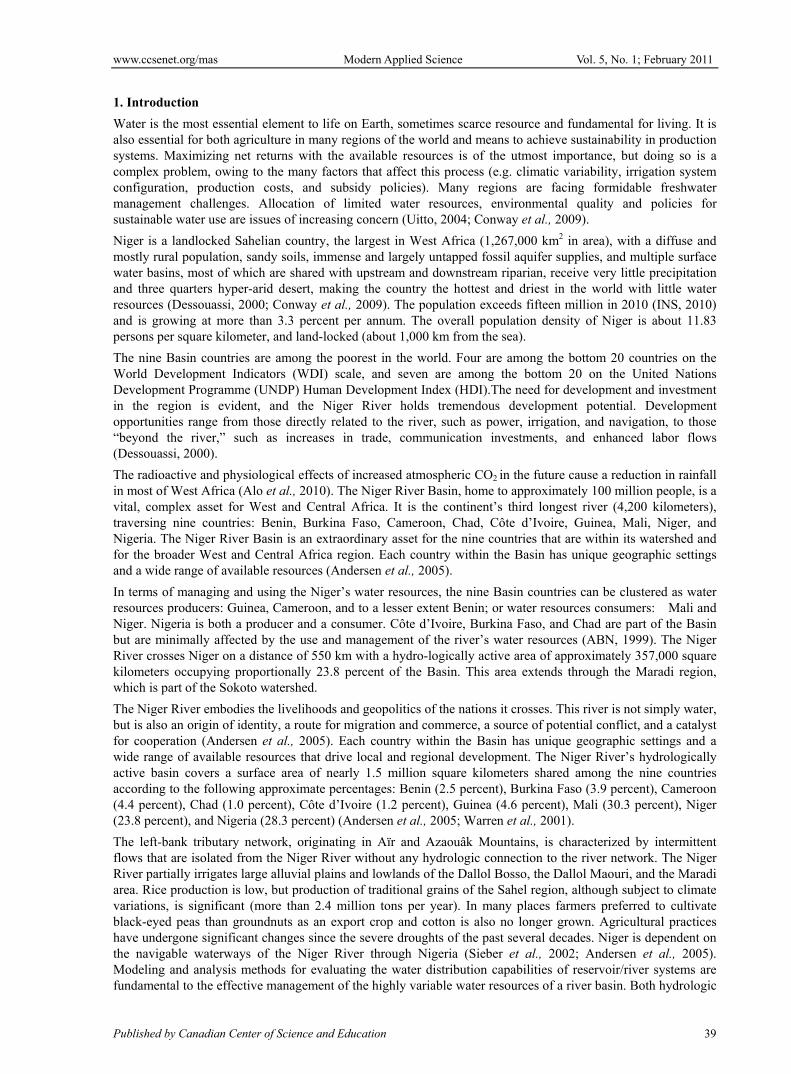
Water is the most essential element to life on Earth, sometimes scarce resource and fundamental for living. It is also essential for both agriculture in many regions of the world and means to achieve sustainability in production systems. Maximizing net returns with the available resources is of the utmost importance, but doing so is a complex problem, owing to the many factors that affect this process (e.g. climatic variability, irrigation system configuration, production costs, and subsidy policies). Many regions are facing formidable freshwater management challenges. Allocation of limited water resources, environmental quality and policies for sustainable water use are issues of increasing concern (Uitto, 2004; Conway et al., 2009).
Niger is a landlocked Sahelian country, the largest in West Africa (1,267,000 km2 in area), with a diffuse and mostly rural population, sandy soils, immense and largely untapped fossil aquifer supplies, and multiple surface water basins, most of which are shared with upstream and downstream riparian, receive very little precipitation and three quarters hyper-arid desert, making the country the hottest and driest in the world with little water resources (Dessouassi, 2000; Conway et al., 2009). The population exceeds fifteen million in 2010 (INS, 2010) and is growing at more than 3.3 percent per annum. The overall population density of Niger is about 11.83 persons per square kilometer, and land-locked (about 1,000 km from the sea).
The nine Basin countries are among the poorest in the world. Four are among the bottom 20 countries on the World Development Indicators (WDI) scale, and seven are among the bottom 20 on the United Nations Development Programme (UNDP) Human Development Index (HDI).The need for development and investment in the region is evident, and the Niger River holds tremendous development potential. Development opportunities range from those directly related to the river, such as power, irrigation, and navigation, to those “beyond the river,” such as increases in trade, communication investments, and enhanced labor flows (Dessouassi, 2000).
The radioactive and physiological effects of increased atmospheric CO2 in the future cause a reduction in rainfall in most of West Africa (Alo et al., 2010). The Niger River Basin, home to approximately 100 million people, is a vital, complex asset for West and Central Africa. It is the continent’s third longest river (4,200 kilometers), traversing nine countries: Benin, Burkina Faso, Cameroon, Chad, Côte d’Ivoire, Guinea, Mali, Niger, and Nigeria. The Niger River Basin is an extraordinary asset for the nine countries that are within its watershed and for the broader West and Central Africa region. Each country within the Basin has unique geographic settings and a wide range of available resources (Andersen et al., 2005).
In terms of managing and using the Niger’s water resources, the nine Basin countries can be clustered as water resources producers: Guinea, Cameroon, and to a lesser extent Benin; or water resources consumers: Mali and Niger. Nigeria is both a producer and a consumer. Côte d’Ivoire, Burkina Faso, and Chad are part of the Basin but are minimally affected by the use and management of the river’s water resources (ABN, 1999). The Niger River crosses Niger on a distance of 550 km with a hydro-logically active area of approximately 357,000 square kilometers occupying proportionally 23.8 percent of the Basin. This area extends through the Maradi region, which is part of the Sokoto watershed.
The Niger River embodies the livelihoods and geopolitics of the nations it crosses. This river is not simply water, but is also an origin of identity, a route for migration and commerce, a source of potential conflict, and a catalyst for cooperation (Andersen et al., 2005). Each country within the Basin has unique geographic settings and a wide range of available resources that drive local and regional development. The Niger River’s hydrologically active basin covers a surface area of nearly 1.5 million square kilometers shared among the nine countries according to the following approximate percentages: Benin (2.5 percent), Burkina Faso (3.9 percent), Cameroon (4.4 percent), Chad (1.0 percent), Côte d’Ivoire (1.2 percent), Guinea (4.6 percent), Mali (30.3 percent), Niger (23.8 percent), and Nigeria (28.3 percent) (Andersen et al., 2005; Warren et al., 2001).
The left-bank tributary network, originating in Aïr and Azaouâk Mountains, is characterized by intermittent flows that are isolated from the Niger River without any hydrologic connection to the river network. The Niger River partially irrigates large alluvial plains and lowlands of the Dallol Bosso, the Dallol Maouri, and the Maradi area. Rice production is low, but production of traditional grains of the Sahel region, although subject to climate variations, is significant (more than 2.4 million tons per year). In many places farmers preferred to cultivate black-eyed peas than groundnuts as an export crop and cotton is also no longer grown. Agricultural practices have undergone significant changes since the severe droughts of the past several decades. Niger is dependent on the navigable waterways of the Niger River through Nigeria (Sieber et al., 2002; Andersen et al., 2005). Modeling and analysis methods for evaluating the water distribution capabilities of reservoir/river systems are fundamental to the effective management of the highly variable water resources of a river basin. Both hydrologic
www.ccsenet.org/mas Modern Applied Science Vol. 5, No. 1; February 2011
ISSN 1913-1844 E-ISSN 1913-1852 40
and institutional considerations are important in assessing water availability and reliability of such assessments (Sieber et al., 2002).
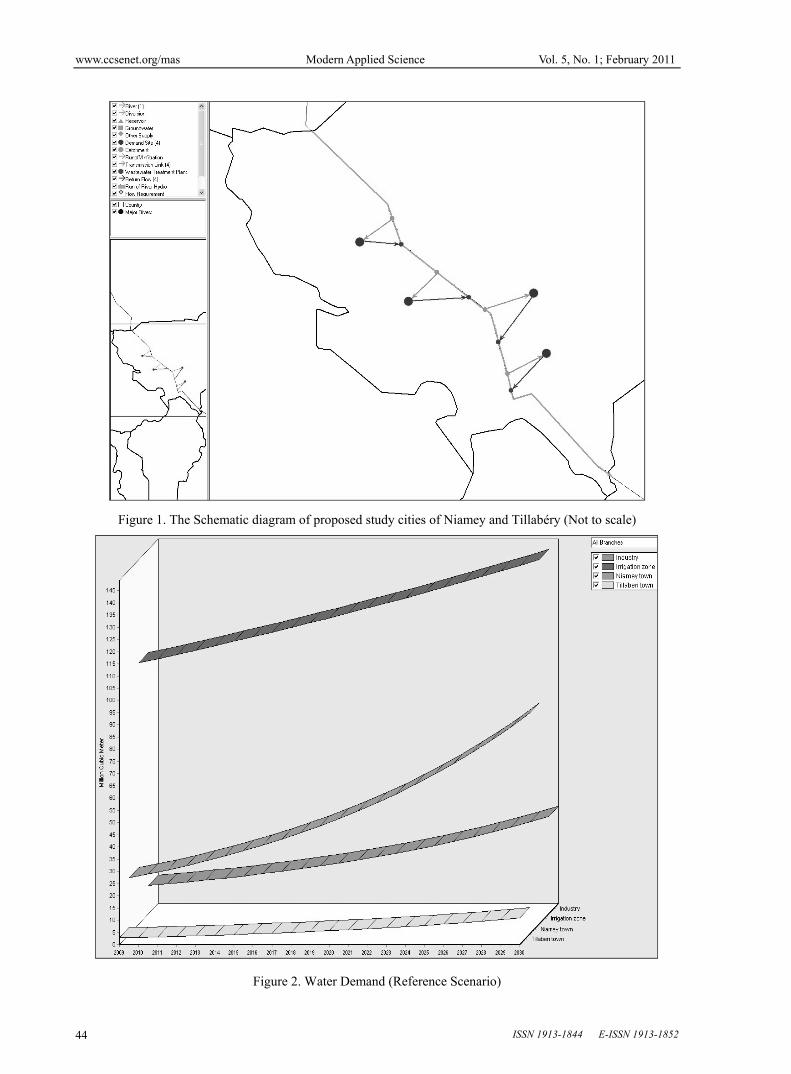
This paper describes the use of the Water Evaluation And Planning (WEAP) model to investigate scenarios of future water resource development in the Niger River Basin in Niger Republic. Therefore, the investigation consisted on the use of water consumption for human needs, for agriculture (irrigation) and industries in the cities of Niamey and Tillabéry due to their position along the Niger basin (Figure 1).
2. Experimental Design
In WEAP the typical scenario modeling effort consists of three steps. First, a Current Accounts year is chosen to serve as the base year of the model; two a Reference scenario is established from the Current Accounts to simulate likely evolution of the system without intervention; and thirdly “what-if” scenarios created to alter the “Reference Scenario” and evaluate the effects of changes in policies and/or technologies. The data used in modeling for current accounts, is ranged for the period of (2009-2030) as it’s shown in Table 1. For allocation of available resources a number of option tested by developing several scenarios and future water demands are projected.
The WEAP21 (Water Evaluation And Planning) software was used to evaluate the future water demands in the two region of the Niger River (Niamey city and Tillabéry).
3. Generalities and presentation of the WEAP model
The Water Evaluation and Planning (WEAP) model has a long history of development and use in the water planning arena. Raskin et al. (1992) first applied WEAP to a study on the Aral Sea, but that version of WEAP had several limitations, including an allocation scheme that treated rivers independently, gave priority to demands on upstream sites over downstream sites, and assured demand sites that preferred groundwater to surface water were last in line in getting surface water allocations. Given these deficiencies, WEAP21 introduces major advances including a modern Graphic User Interface (GUI), a robust solution algorithm to solve the water allocation problem, and the integration of hydrologic sub-modules that include a conceptual rainfall runoff, an alluvial groundwater model, and a stream water quality model (Rosenzweiga et al., 2004).
The WEAP model was developed by the Stockholm Environment Institute (SEI). It operates at a monthly step on the basic principle of water balance accounting. The user represents the system in terms of its various sources of supply (e.g. rivers, groundwater, and reservoirs), withdrawals, water demands, and ecosystem requirements (SEI, 2001).
WEAP applications generally involve the following steps:
• Problem definition including time frame, spatial boundary, system components and configuration;
• Establishing the ‘current accounts’, which provides a snapshot of actual water demand, resources and supplies for the system;
• Building scenarios based on different sets of future trends based on policies, technological development, and other factors that affect demand, supply and hydrology;
• Evaluating the scenarios with regard to criteria such as adequacy of water resources, costs, benefits, and environmental impacts.
The scenarios can address a broad range of ‘what if’ questions, such as: What if population growth and economic development patterns change? What if ecosystem requirements are tightened? What if irrigation techniques and crop patterns are altered? What if various demand management strategies are implemented?
WEAP model has two primary functions (Sieber et al., 2005):
Simulation of natural hydrological processes (e.g., evapotranspiration, runoff and infiltration) to enable assessment of the availability of water within a catchment.
Simulation of anthropogenic activities superimposed on the natural system to influence water resources and their allocation (i.e. consumptive and non-consumptive water demands) to enable evaluation of the impact of human water use.
To allow simulation of water allocation, the elements that comprise the water demand-supply system and their spatial relationship are characterized for the catchment under consideration. The system is represented in terms of its various water sources (e.g. surface water, groundwater, and desalinization and water reuse elements); withdrawal, transmission, reservoirs, and wastewater treatment facilities, and water demands (i.e. user-defined sectors but typically comprising industry, mines, irrigation, domestic supply, etc.). The data structure and level
www.ccsenet.org/mas Modern Applied Science Vol. 5, No. 1; February 2011
Published by Canadian Center of Science and Education 41
of detail can be customized (e.g. by combining demand sites) to correspond to the requirements of a particular analysis and constraints imposed by limited data. A graphical interface facilitates visualization of the physical features of the system and their layout within the catchment (Purkey and Huber-Lee, 2006; Sieber et al., 2005).
This intuitive graphical interface provides a simple yet powerful means for constructing, viewing and modifying the system and its data. The main functions - loading data, calculating and reviewing results - are handled through an interactive screen structure. WEAP also has the flexibility to accommodate the evolving needs of the user: e.g. availability of better information, changes in policy, planning requirements or local constraints and conditions.
The present application of the WEAP model forms part of ongoing research at the International Water Management Institute (IWMI) to develop, test and promote management practices and decision-support tools for effective management of water and land resources.
WEAP has been described as being ‘‘comprehensive, straight forward and easy-to-use, and attempts to assist rather than substitute for the skilled planner’’ (University of Kassel, 2002).
4. Case of study
In Republic of Niger the uncontrolled growth of population, inappropriate agricultural practices, overgrazing, soil erosion and deforestation are among the other causes of degradation of its land.
Climate change is important to water planners and managers because it may change underlying water management conditions (Barnett et al., 2008) and increase the need for new water management programs and capital investments (California Urban Water Agencies, 2007). Climate change may also confound water resources planning because the local effects of climate change are so uncertain and difficult to predict (Conway et al., 2009).
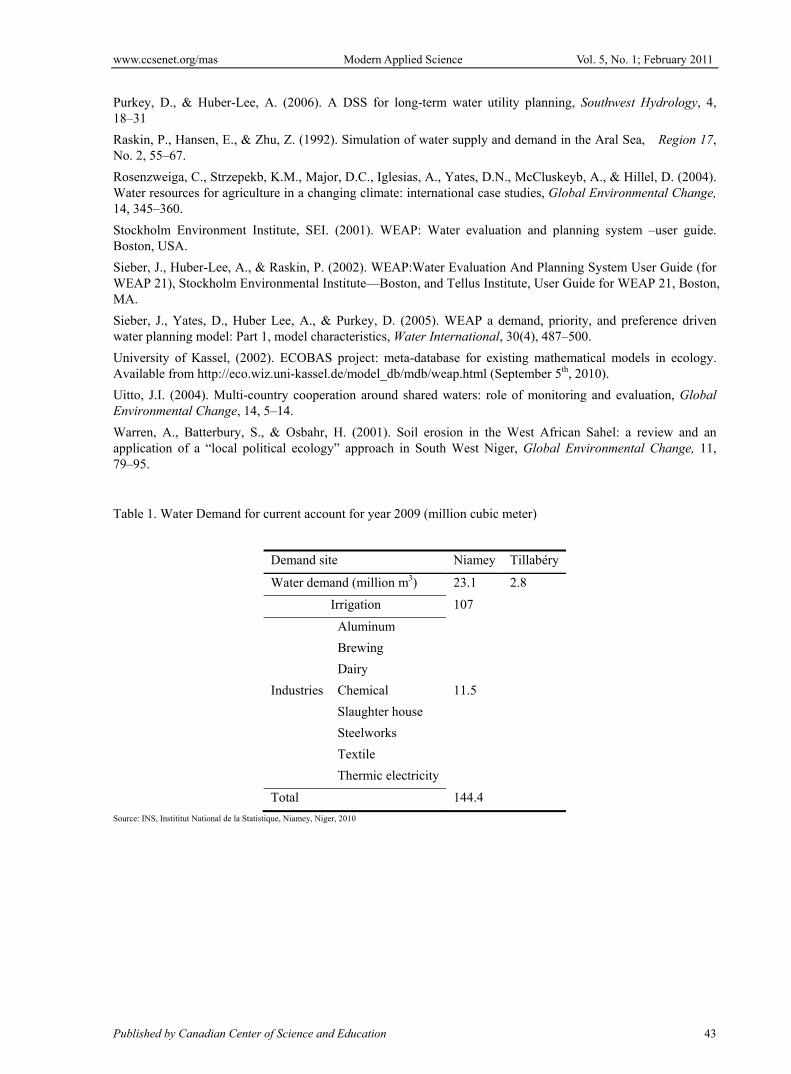
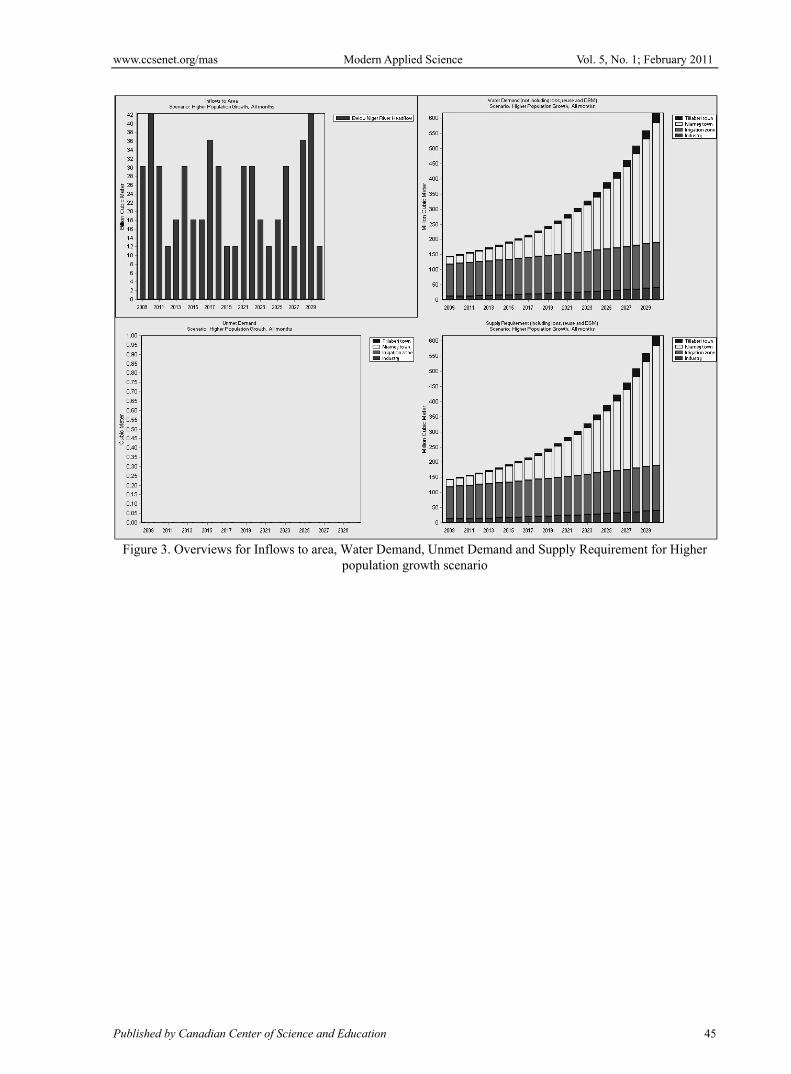
For the range of this study (2009-2030) period, the rate of Niger population increase with 3.3% per year. Demand for irrigation is 7367 m3/ha and the irrigated area increased by 1.6% per year (INS, 2010). Niger industries water consumption estimated in 2009 raised in 11.5 million m3 with and annual increase of 3%. Figure 3 shows an application for water demand of the four sites (Niamey town; Tillabéry town, industries and irrigation). Table 1 shows that water consumption for the year 2009 (Current Accounts) for the four sites which are our main target in this study. Niamey (capital city of Niger republic) is estimated to have 1 146 000 inhabitants in year 2009 (INS, 2010) with 23.1 million m3 water consumption; whereas Tillabéry city with estimated population of 278 100 inhabitants have 2.8 million m3 water consumption. The water demand for all the irrigated area of Niger River valley is estimated to 14 005 ha (107 million m3) and the water consumption for the main industries located around the Niger River is evaluated to 11.5 million m3 (Table 1). Figure 2 shows the evolution (growth) of water consumption for the four sites for the period 2009-2030. It was projected that the total water demands for the 4 sites increased from 144.4 million m3 in year 2009 date of beginning of our study to 290.5 million m3 for the end of the scenario (year 2030). First scenario: Higher population growth 7% and 6% respectively to Niamey town and Tillabéry Town. Water consumption for irrigation and industry remain unchanged; Figure 3 shows the annual demand for the 4 sites. It is shown that the water demand for 2030 is 618.1 million m3. It was observed that a null value (0 m3) for 2009 to 2030 as far as the Unmet Demand is concern for the 4 sites studied (Figure 3), therefore, satisfied all the sites despite the high rate of population growth.
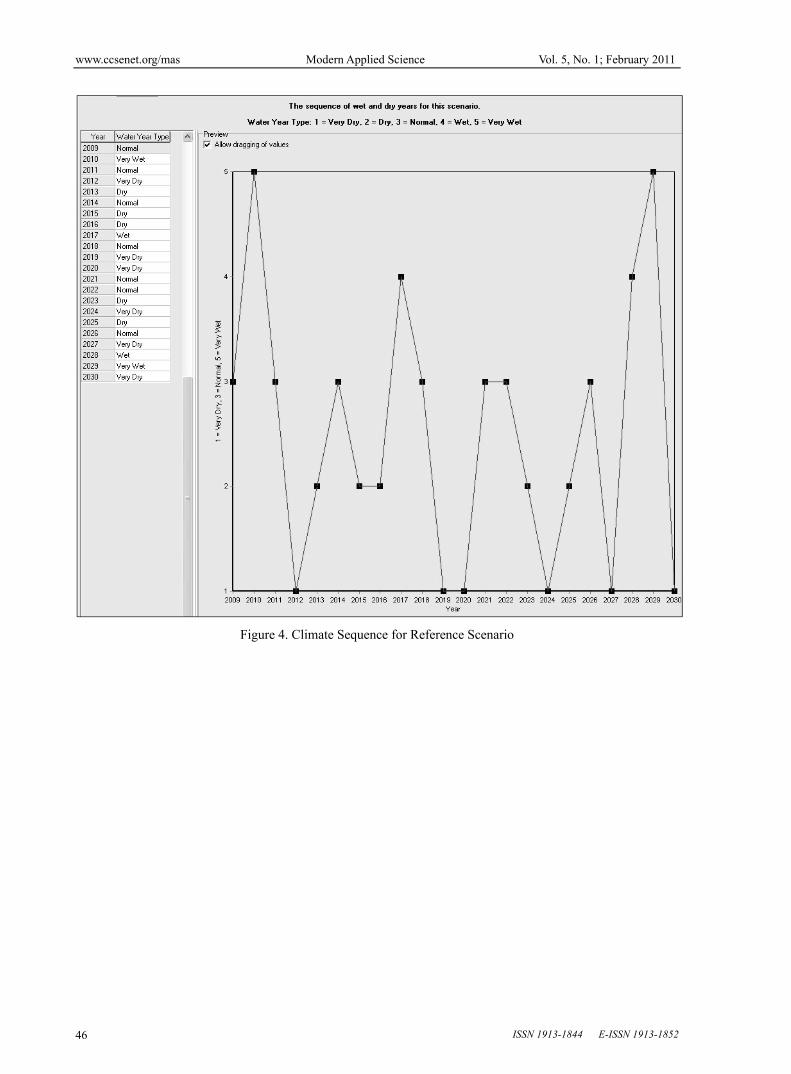
Second scenario: Using the Water Year Method, the previous exercise only varied demand, not supply. In this step we now want to see how natural variation in climate data (stream flow, rainfall etc.) can be taken into account in WEAP through scenario analyses. We will use the “Water Year Method” as an example. The Water Year Method is a simple means to represent variation in climate data such as streamflow, rainfall, and groundwater recharge. The method first involves defining how different climate regimes (e.g., very dry, dry, very wet) compare relative to a normal year, which is given a value of 3. Dry years have a value less than 3, very wet years have a value greater than 3.
The next step in using the “Water Year Method” is to create the sequence of climatic variation for the scenario period. Each year of the period is assigned one of the climate categories (e.g., wet). For the “Reference” scenario, we will assume the following sequence shown in Figure 4.
The inflows to the model (in our case, the headflow of the main river) vary in time, WEAP offered two strategies. If detailed forecasts are available, those that can be read using the ReadFromFile function (are referred to the Tutorial module on Format and Data for more details). Another method, which as presented in this study, is the “Water Year Method" Under which method every year in the model’s duration that can be defined as normal,
www.ccsenet.org/mas Modern Applied Science Vol. 5, No. 1; February 2011
ISSN 1913-1844 E-ISSN 1913-1852 42
wet, very wet, dry or very dry. Different scenarios can then alter the chosen sequence of dry and wet years to assess the impact of natural variation on water resources management.
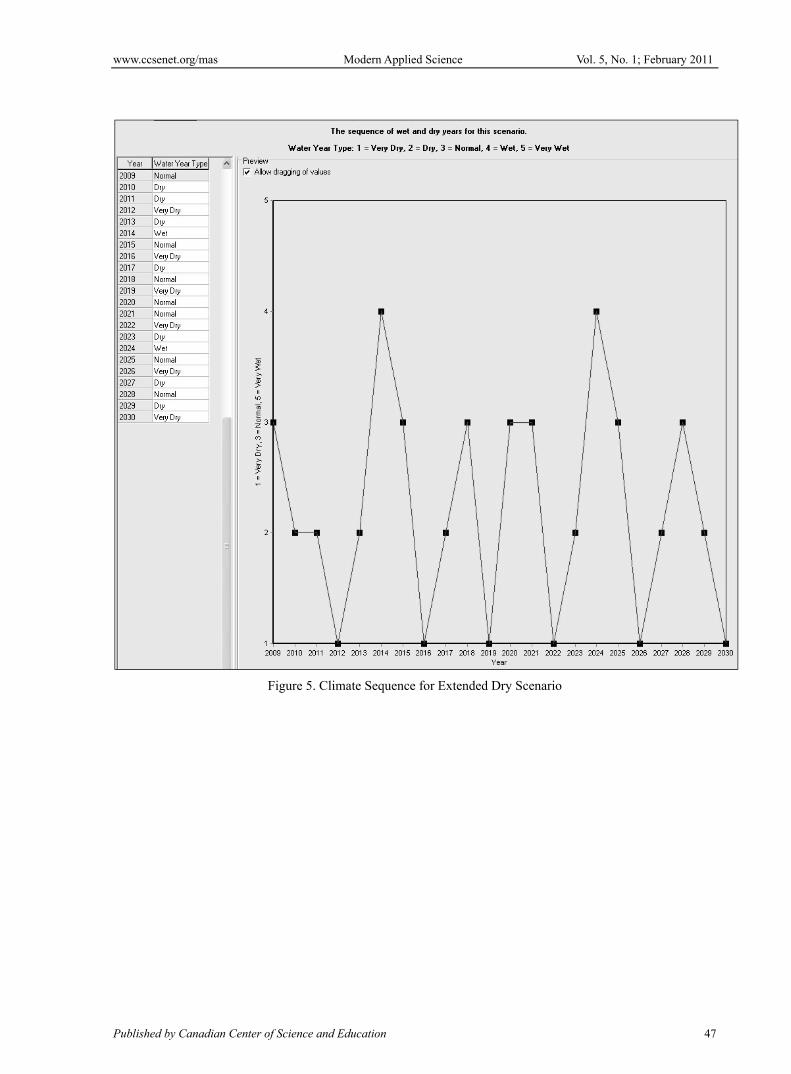
Third scenario: Generally in the Sahel region and Niger in particular the phenomenon of drought is recurrent. Several research works have shown that one of three years, there has been a drastic drop in rainfall causing poor harvest. The characteristic of Figure 5 is that, we wanted to see the case whereby a recrudescence of the dry years; without any climate “very wet year”. Thus we tried to see the extreme case of the dryness on the Niger River. However, we noted that with time (in 2030), there would be cases where the Niger River will not be enough to satisfy the need for the 4 sites studied.
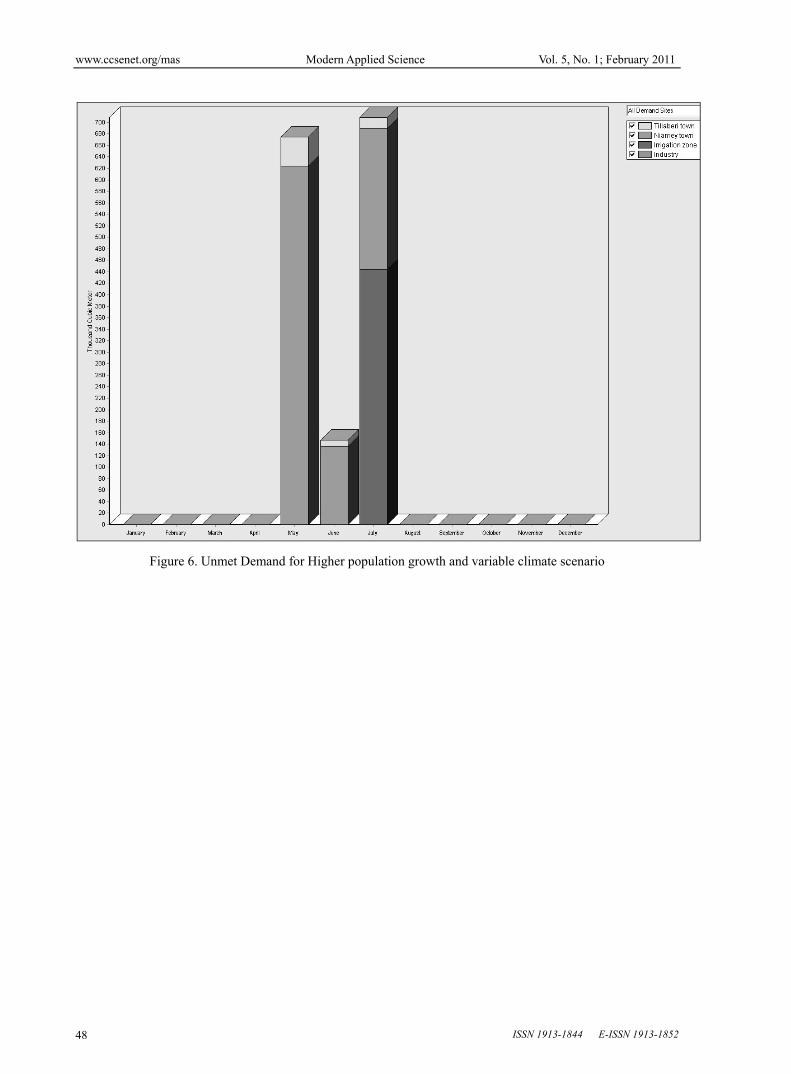
If scenario results from the scenario of “Reference”, the demand for water is said to be completely satisfied. However, where this scenario is gotten from the scenario (high population growth) the observation periods during which the demand, for water is said to be satisfied for only 59.3% in May 2030; 90.8% in June 2030 for Niamey city and Tillabéry. Furthermore, 84% in July 2030 was observed for irrigation and drinking water for Niamey and Tillabéry, respectively. Figure 6 projects that the nonsatisfied request would be observed in the months of June, May and July; in this study, we supposed that the four sites have the same priority (Priority 1 with software WEAP). That is to say, the water delivery for all the sites should be made equitable. Moreover, the request for industries is set satisfactory. However, water demand would be nonsatisfied during 3 months (May, June, and July) for the populations of Niamey and Tillabéry. This request also would not be satisfied for the month of July for the irrigation which is practiced in Niger for 5 months in a year that is from July at November.
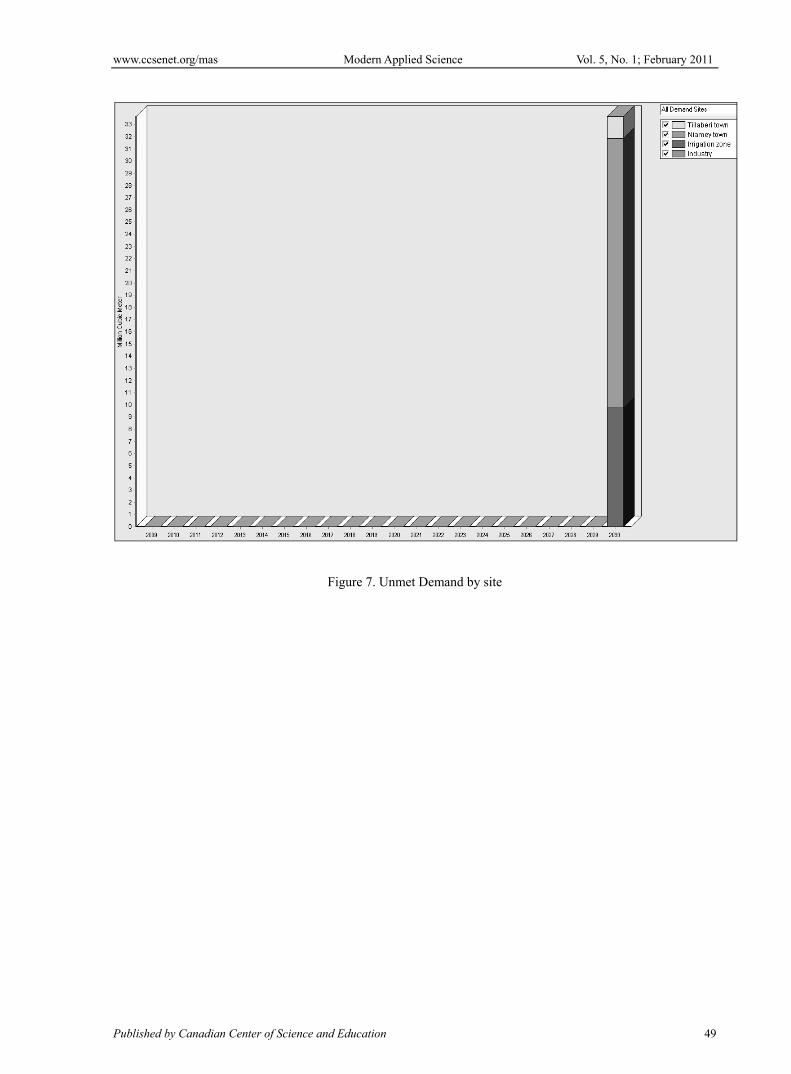
By observing all the scenarios and for all the sites of demand, the nonsatisfied demand is shown in Figure 7. The nonsatisfied demand is observed only on the level of the scenario Higher Population Growth and Climate Variable. In 2030, there would be a deficit of 33.7 million cubic meter of water set as follows: 9.8 million m3 for the irrigation, 22.1 million m3 for Niamey city and 1.8 million m3 for Tillabéry town.
5. Conclusion
With the use of this software, we can confirm that the difficulty of water will arise with acuity in Niger as long as mechanisms of management are not in place to retain the phenomena of rapid population increase and climate change. It will be a good thing if a hydro-electric dam could be constructed on the Niger River, which will make it help to control the flows of water fall and low water levels on river. The dam will also make it possible to find adequate drinking water for two growing cities Niamey and Tillabéry. Dam provides available water for modern agriculture practice so to eradicate poverty and contribute directly to the achievement of the Millennium Development Goals (MDGs). In a country like Niger, where more than 3/4 of the population lives from agriculture products; the development of the irrigation is essential to achieve the Millennium Development Goals. The main and fundamental objective of this study is to propose a significant method to assist reduction by half the extreme poverty and the famine in Niger from now to 2015 as proclaimed by United Nations Development Program. Attention should be drown to optimize the Niger River resources use if not the scarce resources available in this River may not meet the future needs.
References
ABN. (1999). The Niger Basin Authority Three-Year Action Plan 2000-2002, ABN, Niger.
Alo, A., & Wang, G. (2010). Role of dynamic vegetation in regional climate predictions over western Africa Clement, Climate Dynamics, 35, 907–922.
Andersen, I., Dione, O., Jarosewich-Holder, M., & Olivry, J.C. (2005). The Niger River Basin: A Vision for sustainable management, foreword, World Bank-Washington, DC. Available on the Internet: www.worldbank.org (October 1st, 2010).
Barnett, T.P., Pierce, D.W., Hidalgo, H.G., Bonfils, C., Santer, B.D., Das, T. Bala, G., Wood, A.W., Nozawa, T., Mirin, A.A., Cayan, D.R.., & Dettinger, M.D. (2008). Human-Induced Changes in the Hydrology of the Western United States, Science, 319, 1080–1083.
California Urban Water Agencies. (2007). Climate Change and Urban Water Resources, 15 pp., California Urban Water Agencies, Sacramento, CA.
Conway, D., Persechino, A., Ardoin-Bardin, S., Hamandawana, H., Dieulin, C., & Mahé, G. (2009). Rainfall and Water Resources Variability in Sub-Saharan Africa during the Twentieth Century, Journal of Hydrometeorology, 10, 41–59.
Dessouassi, R. (2000). Revue des perspectives dans le Bassin du fleuve Niger, ABN, Niger.
Instititut National de la Statistique: INS, Niamey, Niger, 2010.
www.ccsenet.org/mas Modern Applied Science Vol. 5, No. 1; February 2011
Published by Canadian Center of Science and Education 43
Purkey, D., & Huber-Lee, A. (2006). A DSS for long-term water utility planning, Southwest Hydrology, 4, 18–31
Raskin, P., Hansen, E., & Zhu, Z. (1992). Simulation of water supply and demand in the Aral Sea, Region 17, No. 2, 55–67.
Rosenzweiga, C., Strzepekb, K.M., Major, D.C., Iglesias, A., Yates, D.N., McCluskeyb, A., & Hillel, D. (2004). Water resources for agriculture in a changing climate: international case studies, Global Environmental Change, 14, 345–360.
Stockholm Environment Institute, SEI. (2001). WEAP: Water evaluation and planning system –user guide. Boston, USA.
Sieber, J., Huber-Lee, A., & Raskin, P. (2002). WEAP:Water Evaluation And Planning System User Guide (for WEAP 21), Stockholm Environmental Institute—Boston, and Tellus Institute, User Guide for WEAP 21, Boston, MA.
Sieber, J., Yates, D., Huber Lee, A., & Purkey, D. (2005). WEAP a demand, priority, and preference driven water planning model: Part 1, model characteristics, Water International, 30(4), 487–500.
University of Kassel, (2002). ECOBAS project: meta-database for existing mathematical models in ecology. Available from http://eco.wiz.uni-kassel.de/model_db/mdb/weap.html (September 5th, 2010).
Uitto, J.I. (2004). Multi-country cooperation around shared waters: role of monitoring and evaluation, Global Environmental Change, 14, 5–14.
Warren, A., Batterbury, S., & Osbahr, H. (2001). Soil erosion in the West African Sahel: a review and an application of a “local political ecology” approach in South West Niger, Global Environmental Change, 11, 79–95.
Table 1. Water Demand for current account for year 2009 (million cubic meter)
Demand site Niamey Tillabéry
Water demand (million m3) 23.1 2.8
Irrigation 107
Industries
Aluminum
11.5
Brewing
Dairy
Chemical
Slaughter house
Steelworks
Textile
Thermic electricity
Total 144.4
Source: INS, Instititut National de la Statistique, Niamey, Niger, 2010
www.ccsenet.org/mas Modern Applied Science Vol. 5, No. 1; February 2011
ISSN 1913-1844 E-ISSN 1913-1852 44
Figure 1. The Schematic diagram of proposed study cities of Niamey and Tillabéry (Not to scale)
Figure 2. Water Demand (Reference Scenario)
www.ccsenet.org/mas Modern Applied Science Vol. 5, No. 1; February 2011
Published by Canadian Center of Science and Education 45
Figure 3. Overviews for Inflows to area, Water Demand, Unmet Demand and Supply Requirement for Higher
population growth scenario
www.ccsenet.org/mas Modern Applied Science Vol. 5, No. 1; February 2011
ISSN 1913-1844 E-ISSN 1913-1852 46
Figure 4. Climate Sequence for Reference Scenario
www.ccsenet.org/mas Modern Applied Science Vol. 5, No. 1; February 2011
Published by Canadian Center of Science and Education 47
Figure 5. Climate Sequence for Extended Dry Scenario
www.ccsenet.org/mas Modern Applied Science Vol. 5, No. 1; February 2011
ISSN 1913-1844 E-ISSN 1913-1852 48
Figure 6. Unmet Demand for Higher population growth and variable climate scenario
www.ccsenet.org/mas Modern Applied Science Vol. 5, No. 1; February 2011
Published by Canadian Center of Science and Education 49
Figure 7. Unmet Demand by site