STA 2023 WEISS MULTIPLE CHOICE. Choose the one …math.fau.edu/~pbudhath/Spring2014_Practice Set...
14
STA 2023 WEISS Ch apters 1, 2 3 4 Review MULTIPLE CHOICE. Choose the one alternative that best completes the statement or answers the question. Provide an appropriate response. 1) The table below shows the number of new AIDS cases in the U.S. in each of the years 1989 - 1994. Year New AIDS cases 1989 33,643 1990 41,761 1991 43,771 1992 45,961 1993 103,463 1994 61,301 Classify the study as either descriptive or inferential. 1) A) Descriptive B) Inferential 2) The table below shows the average income by age group for the residents of one town in the year 1998. The average incomes for each age group are estimates based on a sample of size 100 from each group. Age group Average income 18 - 24 $17,180 25 - 39 $26,661 40 - 54 $32,471 55 - 70 $25,960 Over 70 $18,241 Classify the study as either descriptive or inferential. 2) A) Descriptive B) Inferential Answer the question. 3) A magazine publisher mails a survey to every subscriber asking about the quality of its subscription service. The total number of subscribers represents what? 3) A) The population B) The sample 4) A magazine publisher always mails out a questionnaire six months before a subscription ends. This questionnaire asks its subscribers if they are going to renew their subscriptions. On average, only 10 % of the subscribers respond to the questionnaire. Of the 10 % who do respond, an average of 44 % say that they will renew their subscription. This 10 % who respond to the questionnaire are known as what? 4) A) The population B) The sample 5) An employee at the local ice cream parlor asks three customers if they like chocolate ice cream. Identify the sample and population. 5) A) Sample: the customers who like chocolate ice cream; population: all customers B) Sample: the 3 selected customers; population: all customers C) Sample: all customers; population: the 3 selected customers D) Sample: the 3 selected customers; population: the customers who like chocolate ice cream 1
Transcript of STA 2023 WEISS MULTIPLE CHOICE. Choose the one …math.fau.edu/~pbudhath/Spring2014_Practice Set...

STA 2023 WEISS Ch apters 1, 2 3 4 Review
MULTIPLE CHOICE. Choose the one alternative that best completes the statement or answers the question.
Provide an appropriate response.1) The table below shows the number of new AIDS cases in the U.S. in each of the years 1989-1994.
Year New AIDS cases1989 33,6431990 41,7611991 43,7711992 45,9611993 103,4631994 61,301
Classify the study as either descriptive or inferential.
1)
A) Descriptive B) Inferential
2) The table below shows the average income by age group for the residents of one town in the year1998. The average incomes for each age group are estimates based on a sample of size 100 fromeach group.
Age group Average income18-24 $17,18025-39 $26,66140-54 $32,47155-70 $25,960
Over 70 $18,241
Classify the study as either descriptive or inferential.
2)
A) Descriptive B) Inferential
Answer the question.3) A magazine publisher mails a survey to every subscriber asking about the quality of its
subscription service. The total number of subscribers represents what?3)
A) The population B) The sample
4) A magazine publisher always mails out a questionnaire six months before a subscription ends.This questionnaire asks its subscribers if they are going to renew their subscriptions. On average,only 10% of the subscribers respond to the questionnaire. Of the 10% who do respond, an averageof 44% say that they will renew their subscription. This 10% who respond to the questionnaire areknown as what?
4)
A) The population B) The sample
5) An employee at the local ice cream parlor asks three customers if they like chocolate ice cream.Identify the sample and population.
5)
A) Sample: the customers who like chocolate ice cream; population: all customersB) Sample: the 3 selected customers; population: all customersC) Sample: all customers; population: the 3 selected customersD) Sample: the 3 selected customers; population: the customers who like chocolate ice cream
1

6) A computer network manager wants to test the reliability of some new and expensive fiber-opticEthernet cables that the computer department just received. The computer department received 4boxes containing 10 cables each. The manager does not have the time to test every cable in eachbox. The manager will choose one box at random and test 2 cables chosen randomly within thatbox. What is the population?
6)
A) The one box that was chosen at random from the 4 boxesB) 40 cablesC) The 4 boxesD) The 2 cables chosen randomly for testing
Identify the study as an observational study or a designed experiment.7) At one hospital in 1992, 674 women were diagnosed with breast cancer. Five years later, 88% of the
Caucasian women and 83% of the African American women were still alive.7)
A) Designed experiment B) Observational study
8) 400 patients suffering from chronic back pain were randomly assigned to one of two groups. Over afour-month period, the first group received acupuncture treatments and the second group receiveda placebo. Patients who received acupuncture treatments improved more than those who receivedthe placebo.
8)
A) Designed experiment B) Observational study
List all possible samples from the specified population.9) The members of a board of directors have the following roles: president (P), vice president (V),
secretary (S), treasury (T), and fundraiser (F). Consider these board members to be a population ofinterest. List the 10 possible samples (without replacement) of size two from this population of fiveboard members.
9)
A) S,T S,F T,P T,V T,S T,F F,P F,V F,S F,TB) P,V P,S P,T P,F V,S V,T V,F S,T S,F T,FC) P,P P,V P,S P,T P,F V,V V,S V,T V,F S,SD) P,V P,S P,T P,F V,P V,S V,T V,F S,P S,V
Provide an appropriate response.10) The finalists in an essay competition are Lisa (L), Melina (M), Ben (B), Danny (D), Eric (E), and
Joan (J). Consider these finalists to be a population of interest. The possible samples (withoutreplacement) of size two that can be obtained from this population of six finalists are as follows.
L,M L,B L,D L,E L,J M,B M,D M,E M,J B,D B,E B,J D,E D,J E,J
If a simple random sampling method is used to obtain a sample of two of the finalists, what are thechances of selecting Lisa and Danny?
10)
A) 215
B) 13
C) 16
D) 115
11) True or false? In simple random sampling, each possible sample is equally likely to be the oneobtained.
11)
A) True B) False
2

Classify the data as either qualitative or quantitative.12) The following table gives the top five movies at the box office this week.
Rank Last week Movie title Studio Box office sales ($ millions)1 N/A Pirate Adventure Movie Giant 35.22 2 Secret Agent Files G.M.G. 19.53 1 Epic Super Hero Team 21st Century 14.34 5 Reptile Ride Movie Giant 10.15 4 Must Love Cats Dreamboat 9.9
What kind of data is provided by the information in the second column?
12)
A) Qualitative B) Quantitative
Classify the data as either discrete or continuous.13) An athlete runs 100 meters in 10.7 seconds. 13)
A) Discrete B) Continuous
14) The total number of phone calls a sales representative makes in a month is 425. 14)A) Discrete B) Continuous
Tell whether the statement is true or false.15) A variable whose values are observed by counting something must be a discrete variable. 15)
A) True B) False
16) A discrete variable can only yield whole-number values. 16)A) True B) False
Provide an appropriate response.17) The data in the following table show the results of a survey of college students asking which
vacation destination they would choose given the eight choices shown. Determine the value thatshould be entered in the relative frequency column for Arizona.
Destination Frequency Relative frequencyFlorida 34Mexico 80Belize 18Puerto Rico 26Alaska 4California 20Colorado 12Arizona 6
17)
A) 0.003 B) 0.03 C) 0.06 D) 6
Construct the requested graph.
3

18) Construct a bar graph for the relative frequencies given.
Blood Frequency Relative type frequencyO 22 0.44A 19 0.38B 6 0.12AB 3 0.06
18)
A)
B)
C)
4

Given the following "data scenario," decide which type of grouping (single-value, limit, or cutpoint) is probably the best.19) Number of Pets: The number of pets per family. 19)
A) Single-value grouping B) Limit groupingC) None of these D) Cutpoint grouping
20) Exam Scores: The exam scores, rounded to the nearest whole number, of all students in a givenmath course.
20)
A) Single-value grouping B) None of theseC) Cutpoint grouping D) Limit grouping
21) Wingspan of Cardinal: The wingspan lengths, to the nearest hundredth of a millimeter, of a sampleof 35 cardinals.
21)
A) Limit grouping B) None of theseC) Cutpoint grouping D) Single-value grouping
Construct a dotplot for the given data.22) A manufacturer records the number of errors each work station makes during the week. The data
are as follows. 6 3 2 3 5 2 0 2 5 4 2 0 1
22)
A) B)
C) D)
Construct a stem-and-leaf diagram for the given data.23) The midterm test scores for the seventh-period typing class are listed below.
85 77 93 91 74 65 68 97 88 59 74 83 85 72 63 79
23)
A)56789
9 5 8 3 7 4 4 2 9 5 8 3 5 3 1 7
B)56789
9 3 5 8 3 5 5 8 2 4 4 7 9 1 3 7
5

24) The diastolic blood pressures for a sample of patients at a clinic were as follows. The measurementsare in mmHg.
78 87 91 85 97 102 73 90 102 10594 85 81 95 77 106 84 101 83 9279 81 96 88 100 85 89 87 83 9088 95 78 74 108 85 87 92 97 83
Construct a stem-and-leaf diagram using two lines per stem.
24)
A) 7 7 8 8 9 91010
3 4 8 7 9 8 1 4 3 1 3 3 7 5 5 8 5 9 7 8 5 7 1 0 4 2 0 2 7 5 6 5 7 2 2 1 0 5 6 8
B)7788991010
8 3 7 9 8 4 7 5 5 1 4 3 1 8 5 9 7 3 8 5 7 3 1 7 0 4 5 2 6 0 5 2 7 2 2 5 6 1 0 8
A nurse measured the blood pressure of each person who visited her clinic. Following is a relative-frequency histogramfor the systolic blood pressure readings for those people aged between 25 and 40. Use the histogram to answer thequestion. The blood pressure readings were given to the nearest whole number.
25) Approximately what percentage of the people aged 25-40 had a systolic blood pressure readinggreater than or equal to 130?
25)
A) 26% B) 74% C) 23% D) 15%
6

A graphical display of a data set is given. Identify the overall shape of the distribution as (roughly) bell-shaped,triangular, uniform, reverse J-shaped, J-shaped, right skewed, left skewed, bimodal, or multimodal.
26) A relative frequency histogram for the sale prices of homes sold in one city during 2006 is shownbelow.
26)
A) J-shaped B) Right skewedC) Reverse J-shaped D) Left skewed
27) A relative frequency histogram for the heights of a sample of adult women is shown below. 27)
A) Bell-shaped B) Triangular C) Left skewed D) J-shaped
7

28) A die was rolled 200 times and a record was kept of the numbers obtained. The results are shownin the relative frequency histogram below.
28)
A) Triangular B) J-shaped C) Left skewed D) Uniform
29) Two dice were rolled and the sum of the two numbers was recorded. This procedure was repeated400 times. The results are shown in the relative frequency histogram below.
29)
A) Bell-shaped B) Right-skewed C) Triangular D) Left skewed
30) The ages of a group of patients being treated at one hospital for osteoporosis are summarized in thefrequency histogram below.
30)
A) Left skewed B) Reverse J-shapedC) Bell-shaped D) Right skewed
8
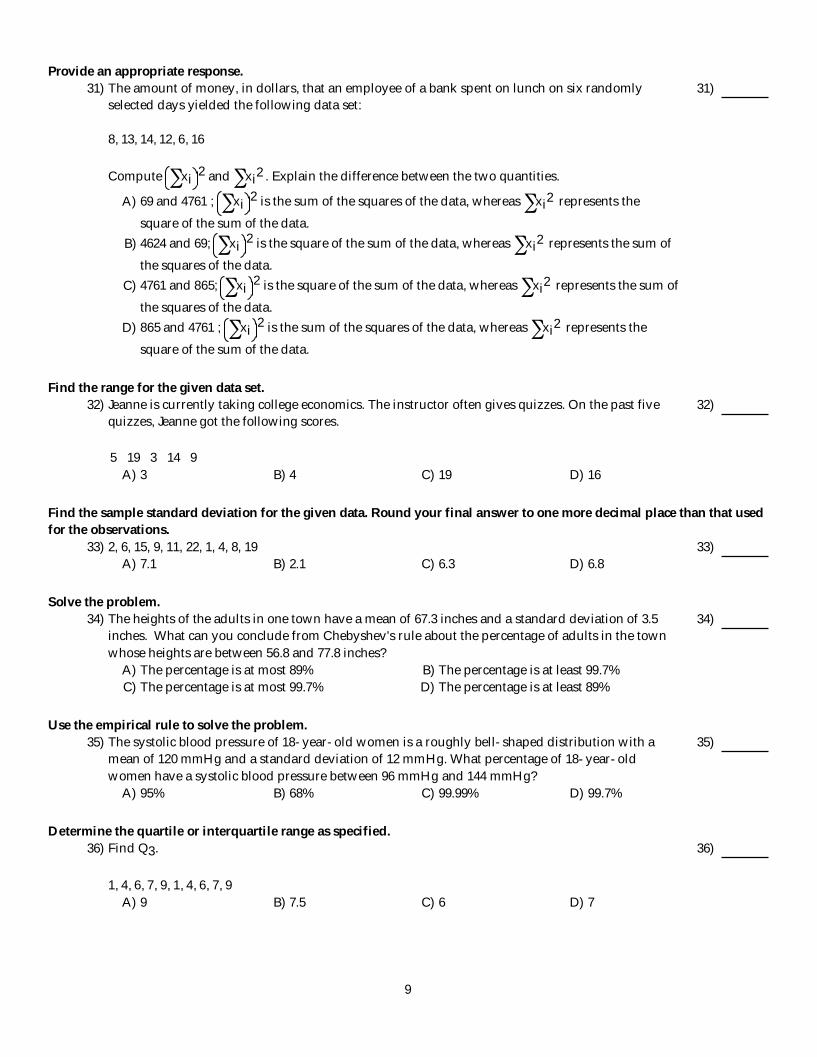
Provide an appropriate response.31) The amount of money, in dollars, that an employee of a bank spent on lunch on six randomly
selected days yielded the following data set:
8, 13, 14, 12, 6, 16
Compute xi 2 and xi2 . Explain the difference between the two quantities.
31)
A) 69 and 4761 ; xi 2 is the sum of the squares of the data, whereas xi2 represents the
square of the sum of the data.B) 4624 and 69; xi 2 is the square of the sum of the data, whereas xi2 represents the sum of
the squares of the data.C) 4761 and 865; xi 2 is the square of the sum of the data, whereas xi2 represents the sum of
the squares of the data.D) 865 and 4761 ; xi 2 is the sum of the squares of the data, whereas xi2 represents the
square of the sum of the data.
Find the range for the given data set.32) Jeanne is currently taking college economics. The instructor often gives quizzes. On the past five
quizzes, Jeanne got the following scores.
5 19 3 14 9
32)
A) 3 B) 4 C) 19 D) 16
Find the sample standard deviation for the given data. Round your final answer to one more decimal place than that usedfor the observations.
33) 2, 6, 15, 9, 11, 22, 1, 4, 8, 19 33)A) 7.1 B) 2.1 C) 6.3 D) 6.8
Solve the problem.34) The heights of the adults in one town have a mean of 67.3 inches and a standard deviation of 3.5
inches. What can you conclude from Chebyshev's rule about the percentage of adults in the townwhose heights are between 56.8 and 77.8 inches?
34)
A) The percentage is at most 89% B) The percentage is at least 99.7%C) The percentage is at most 99.7% D) The percentage is at least 89%
Use the empirical rule to solve the problem.35) The systolic blood pressure of 18-year-old women is a roughly bell-shaped distribution with a
mean of 120 mmHg and a standard deviation of 12 mmHg. What percentage of 18-year-oldwomen have a systolic blood pressure between 96 mmHg and 144 mmHg?
35)
A) 95% B) 68% C) 99.99% D) 99.7%
Determine the quartile or interquartile range as specified.36) Find Q3.
1, 4, 6, 7, 9, 1, 4, 6, 7, 9
36)
A) 9 B) 7.5 C) 6 D) 7
9

37) Determine the interquartile range.
2, 4, 5, 8, 9, 11, 2, 4, 5, 8, 9, 11
37)
A) 4 B) 5 C) 4.5 D) 5.5
Obtain the five-number summary for the given data.38) 2, 3, 5, 8, 10 38)
A) 2, 2, 5, 10, 10 B) 2, 2.5, 5, 7.5, 10 C) 2, 3.5, 5, 8.5, 10 D) 2, 3, 5, 8, 10
Identify potential outliers, if any, for the given data.39) The test scores of 15 students are listed below.
33 43 51 65 6668 70 72 74 7679 82 87 90 99
39)
A) 33 B) 33, 43 C) 33, 99 D) None
Construct and interpret a boxplot or a modified boxplot as specified.40) The ages of the 21 members of a track and field team are listed below. Construct a modified boxplot
for the data.
15 18 18 19 22 23 2424 24 24 25 26 26 2728 28 30 32 33 40 42
40)
A)
The data is roughly symmetrical, possibly bell-shaped, with no outliers.B)
The data is roughly symmetrical with one potential outlier.C)
The data is roughly symmetrical with two potential outliers.D)
The data is roughly symmetrical with three potential outliers.
10

Solve the problem.41) The boxplots display case prices (in dollars) of white wines produced by three vineyards in the
western United States. Describe these wine prices.41)
A) Vineyards A and B have about the same average price; the boxplots show similar mediansand similar IQRs. Vineyard C has higher prices except for one potential outlier, and lessvariation in pricing as shown by the smaller IQR and overall range. All three distributionsare roughly symmetric.
B) Vineyards A and B have about the same average price; the boxplots show similar mediansand similar IQRs. Vineyard C has consistently higher prices except for one potential outlier,but more variation in pricing as shown by the larger IQR. The distributions for A and B areapproximately symmetric, while the distribution for C is right-skewed.
C) Vineyards A and B have about the same average price; the boxplots show similar mediansand similar IQRs. Vineyard C has higher prices except for one potential outlier, and a lessvariation in pricing as shown by the smaller IQR and overall range. Distributions A and B areapproximately symmetric, while distribution C is right-skewed.
D) Vineyards A and B have different average prices, but a similar variation. Vineyard C haslower prices except for one potential outlier, and less variation in pricing as shown by thesmaller IQR. The distributions for A and B are approximately symmetric, while thedistribution for C is right-skewed.
Provide an appropriate response.42) Find the population standard deviation. Round to one decimal place as needed.
0, -1, 5, 6
42)
A) 1.7 B) 3 C) 9.3 D) 7.5
11
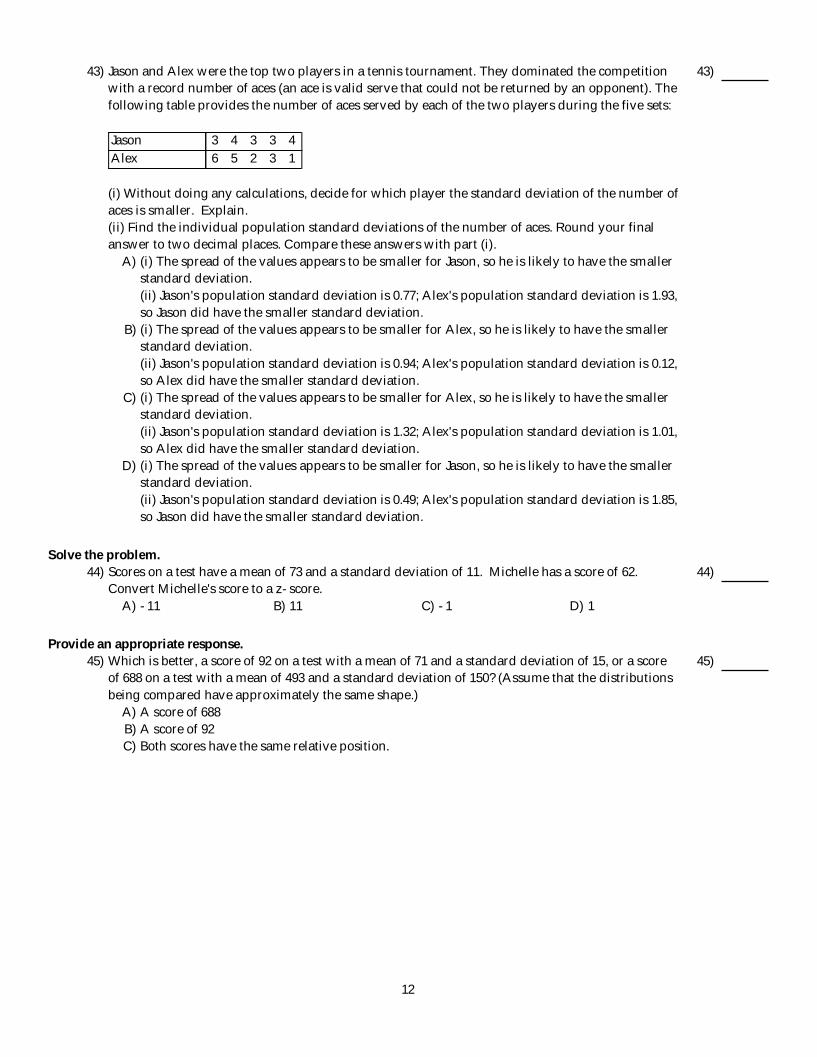
43) Jason and Alex were the top two players in a tennis tournament. They dominated the competitionwith a record number of aces (an ace is valid serve that could not be returned by an opponent). Thefollowing table provides the number of aces served by each of the two players during the five sets:
Jason 3 4 3 3 4Alex 6 5 2 3 1
(i) Without doing any calculations, decide for which player the standard deviation of the number ofaces is smaller. Explain. (ii) Find the individual population standard deviations of the number of aces. Round your finalanswer to two decimal places. Compare these answers with part (i).
43)
A) (i) The spread of the values appears to be smaller for Jason, so he is likely to have the smallerstandard deviation.(ii) Jason's population standard deviation is 0.77; Alex's population standard deviation is 1.93,so Jason did have the smaller standard deviation.
B) (i) The spread of the values appears to be smaller for Alex, so he is likely to have the smallerstandard deviation.(ii) Jason's population standard deviation is 0.94; Alex's population standard deviation is 0.12,so Alex did have the smaller standard deviation.
C) (i) The spread of the values appears to be smaller for Alex, so he is likely to have the smallerstandard deviation.(ii) Jason's population standard deviation is 1.32; Alex's population standard deviation is 1.01,so Alex did have the smaller standard deviation.
D) (i) The spread of the values appears to be smaller for Jason, so he is likely to have the smallerstandard deviation.(ii) Jason's population standard deviation is 0.49; Alex's population standard deviation is 1.85,so Jason did have the smaller standard deviation.
Solve the problem.44) Scores on a test have a mean of 73 and a standard deviation of 11. Michelle has a score of 62.
Convert Michelle's score to a z-score.44)
A) -11 B) 11 C) -1 D) 1
Provide an appropriate response.45) Which is better, a score of 92 on a test with a mean of 71 and a standard deviation of 15, or a score
of 688 on a test with a mean of 493 and a standard deviation of 150? (Assume that the distributionsbeing compared have approximately the same shape.)
45)
A) A score of 688B) A score of 92C) Both scores have the same relative position.
12

46) For the linear equation y = -9 - 8.7x, explain what the y-intercept and slope represent in terms ofthe graph of the equation.
46)
A) The y-intercept, b0 = -9, gives the y-value at which the straight line y = -9 - 8.7x intersectsthe x-axis. The slope, b1 = -8.7, indicates that the x-value decreases by 8.7 units for everyincrease in y of 1 unit.
B) The y-intercept, b0 = -9, gives the y-value at which the straight line y = -9 - 8.7x intersectsthe y-axis. The slope, b1 = 8.7, indicates that the y-value increases by 8.7 units for everyincrease in x of 1 unit.
C) The y-intercept, b0 = -8.7, gives the y-value at which the straight line y = -9 - 8.7x intersectsthe y-axis. The slope, b1 = -9, indicates that the y-value decreases by 9 units for everyincrease in x of 1 unit.
D) The y-intercept, b0 = -9, gives the y-value at which the straight line y = -9 - 8.7x intersectsthe y-axis. The slope, b1 = -8.7, indicates that the y-value decreases by 8.7 units for everyincrease in x of 1 unit.
Is the data point, P, an outlier, a potential influential observation, both, or neither?47) 47)
A) Outlier B) BothC) Neither D) Potential influential observation
Use the regression equation to predict the y-value corresponding to the given x-value. Round your answer to the nearesttenth.
48)^
The regression equation relating dexterity scores (x) and productivity scores (y) for ten randomly
selected employees of a company is y = 5.50 + 1.91x. Predict the productivity score for an employeewhose dexterity score is 24.
48)
A) 133.9 B) 58.2 C) 51.3 D) 56.3
13

Answer KeyTestname: CHS 1,2,3, 4
1) A2) B3) A4) B5) B6) B7) B8) A9) B
10) D11) A12) B13) B14) A15) A16) B17) B18) A19) A20) D21) C22) B23) A24) A25) A26) B27) A28) D29) C30) A31) C32) D33) A34) D35) A36) D37) B38) D39) B40) D41) C42) B43) D44) C45) B46) D47) B48) C
14