STA 2023 Practice Questions Final Exammmeece/2023/PQ3new.pdf · STA 2023 Practice Questions Final...
21
STA 2023 Practice Questions Final Exam What you need to know: General Format for Confidence Interval – estimator +/- (t or z) est. standard error General Format of Test Statistic -- # ( ) o estimator from H t or z estimate of stderr Table given to you on the test: STATISTICAL INFERENCE TABLE: Case parameter estimator standard error Sampling Distribution one mean x n s t (n-1) Mean of matched pairs dif. d d x d s n t (n-1) difference of two independent means 2 1 2 1 x x 2 2 2 1 2 1 n s n s t with conservative df = smallest of (n1-1) and (n2-1) one proportion p p ˆ CI: ˆ ˆ (1 ) p p n ST: n p p ) 1 ( 0 0 z difference of two independent proportions 2 1 p p 2 1 ˆ ˆ p p CI: 1 1 2 2 1 2 ˆ ˆ ˆ ˆ (1 ) (1 ) p p p p n n ST: 2 1 1 1 ) ˆ 1 ( ˆ n n p p z McNemar YN NY TS YN NY OR NY YN TS YN NY
-
Upload
truongduong -
Category
Documents
-
view
236 -
download
0
Transcript of STA 2023 Practice Questions Final Exammmeece/2023/PQ3new.pdf · STA 2023 Practice Questions Final...
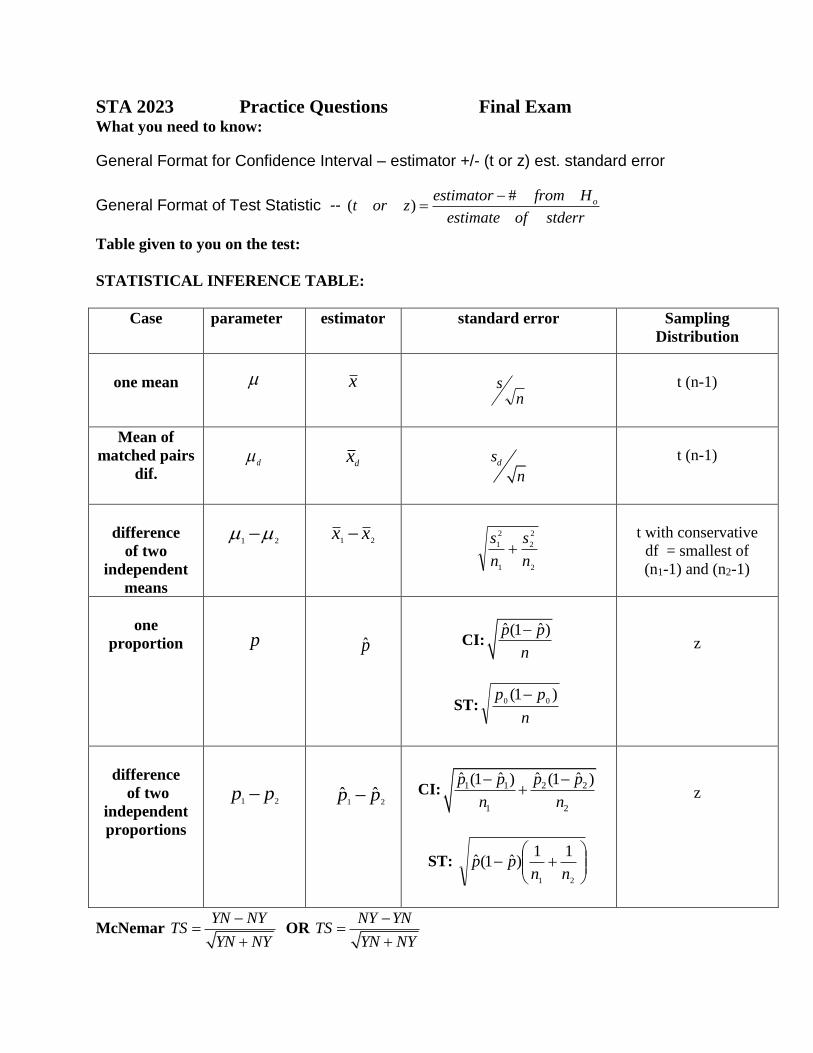
STA 2023 Practice Questions Final Exam What you need to know:
General Format for Confidence Interval – estimator +/- (t or z) est. standard error
General Format of Test Statistic -- #
( ) oestimator from Ht or z
estimate of stderr
Table given to you on the test:
STATISTICAL INFERENCE TABLE:
Case parameter estimator standard error Sampling
Distribution
one mean
x
ns
t (n-1)
Mean of
matched pairs
dif.
d
dx
ds
n
t (n-1)
difference
of two
independent
means
21
21xx
2
2
2
1
2
1
n
s
n
s
t with conservative
df = smallest of
(n1-1) and (n2-1)
one
proportion
p
p̂
CI:ˆ ˆ(1 )p p
n
ST:n
pp )1(00
z
difference
of two
independent
proportions
21pp
21ˆˆ pp
CI: 1 1 2 2
1 2
ˆ ˆ ˆ ˆ(1 ) (1 )p p p p
n n
ST:
21
11)ˆ1(ˆ
nnpp
z
McNemar YN NY
TSYN NY
OR
NY YNTS
YN NY
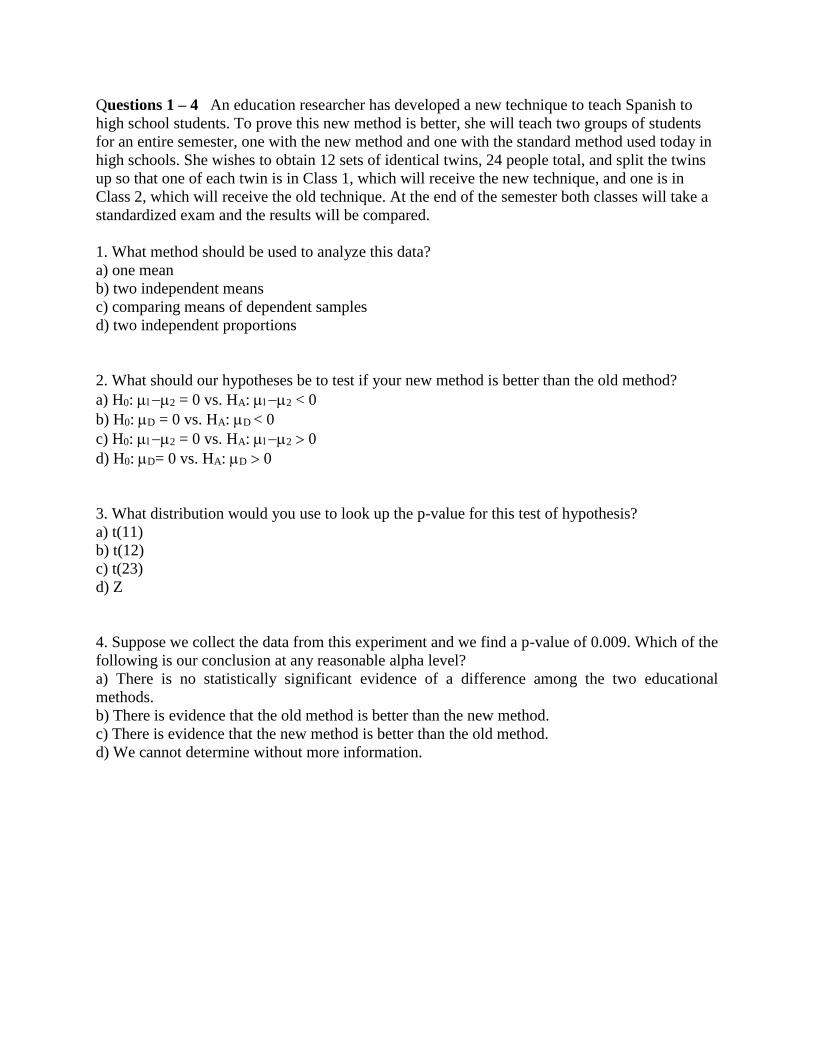
Questions 1 – 4 An education researcher has developed a new technique to teach Spanish to
high school students. To prove this new method is better, she will teach two groups of students
for an entire semester, one with the new method and one with the standard method used today in
high schools. She wishes to obtain 12 sets of identical twins, 24 people total, and split the twins
up so that one of each twin is in Class 1, which will receive the new technique, and one is in
Class 2, which will receive the old technique. At the end of the semester both classes will take a
standardized exam and the results will be compared.
1. What method should be used to analyze this data?
a) one mean
b) two independent means
c) comparing means of dependent samples
d) two independent proportions
2. What should our hypotheses be to test if your new method is better than the old method?
a) H0: 2 = 0 vs. HA: 2 < 0
b) H0: D = 0 vs. HA: D < 0
c) H0: 2 = 0 vs. HA: 2 0
d) H0: D= 0 vs. HA: D 0
3. What distribution would you use to look up the p-value for this test of hypothesis?
a) t(11)
b) t(12)
c) t(23)
d) Z
4. Suppose we collect the data from this experiment and we find a p-value of 0.009. Which of the
following is our conclusion at any reasonable alpha level?
a) There is no statistically significant evidence of a difference among the two educational
methods.
b) There is evidence that the old method is better than the new method.
c) There is evidence that the new method is better than the old method.
d) We cannot determine without more information.
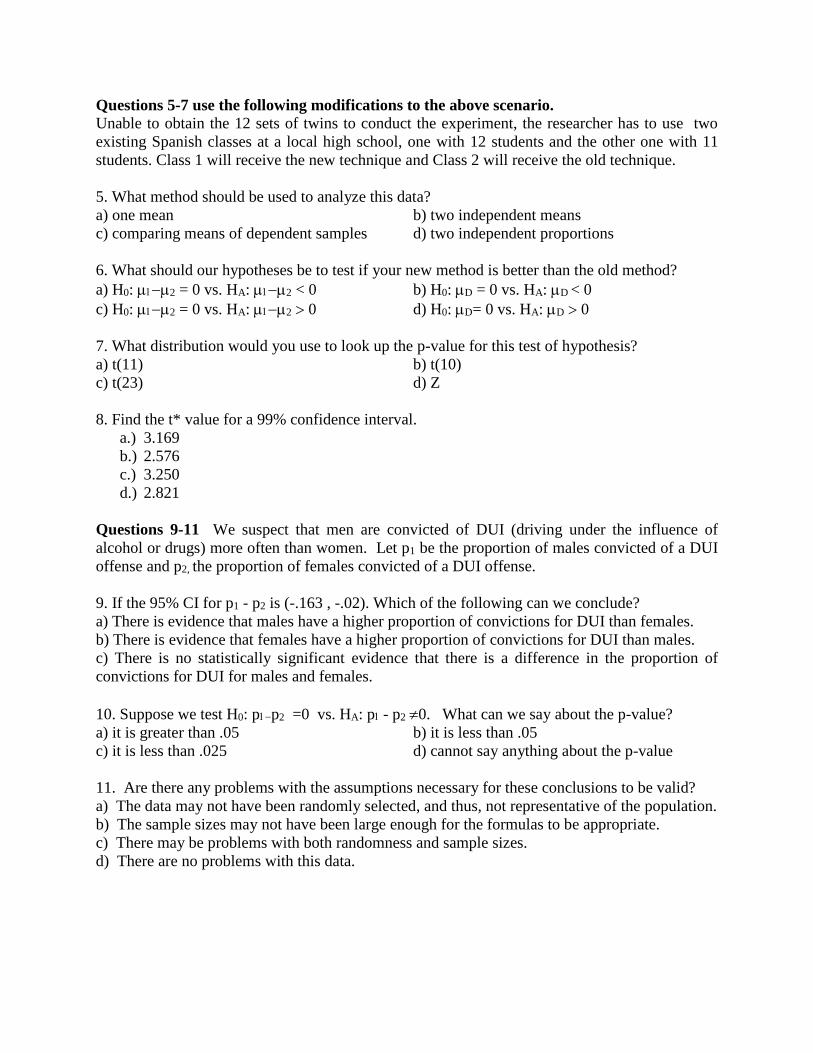
Questions 5-7 use the following modifications to the above scenario. Unable to obtain the 12 sets of twins to conduct the experiment, the researcher has to use two
existing Spanish classes at a local high school, one with 12 students and the other one with 11
students. Class 1 will receive the new technique and Class 2 will receive the old technique.
5. What method should be used to analyze this data?
a) one mean b) two independent means
c) comparing means of dependent samples d) two independent proportions
6. What should our hypotheses be to test if your new method is better than the old method?
a) H0: 2 = 0 vs. HA: 2 < 0 b) H0: D = 0 vs. HA: D < 0
c) H0: 2 = 0 vs. HA: 2 0 d) H0: D= 0 vs. HA: D 0
7. What distribution would you use to look up the p-value for this test of hypothesis?
a) t(11) b) t(10)
c) t(23) d) Z
8. Find the t* value for a 99% confidence interval.
a.) 3.169
b.) 2.576
c.) 3.250
d.) 2.821
Questions 9-11 We suspect that men are convicted of DUI (driving under the influence of
alcohol or drugs) more often than women. Let p1 be the proportion of males convicted of a DUI
offense and p2, the proportion of females convicted of a DUI offense.
9. If the 95% CI for p1 - p2 is (-.163 , -.02). Which of the following can we conclude?
a) There is evidence that males have a higher proportion of convictions for DUI than females.
b) There is evidence that females have a higher proportion of convictions for DUI than males.
c) There is no statistically significant evidence that there is a difference in the proportion of
convictions for DUI for males and females.
10. Suppose we test H0: pp2 =0 vs. HA: p- p2 0. What can we say about the p-value?
a) it is greater than .05 b) it is less than .05
c) it is less than .025 d) cannot say anything about the p-value
11. Are there any problems with the assumptions necessary for these conclusions to be valid?
a) The data may not have been randomly selected, and thus, not representative of the population.
b) The sample sizes may not have been large enough for the formulas to be appropriate.
c) There may be problems with both randomness and sample sizes.
d) There are no problems with this data.
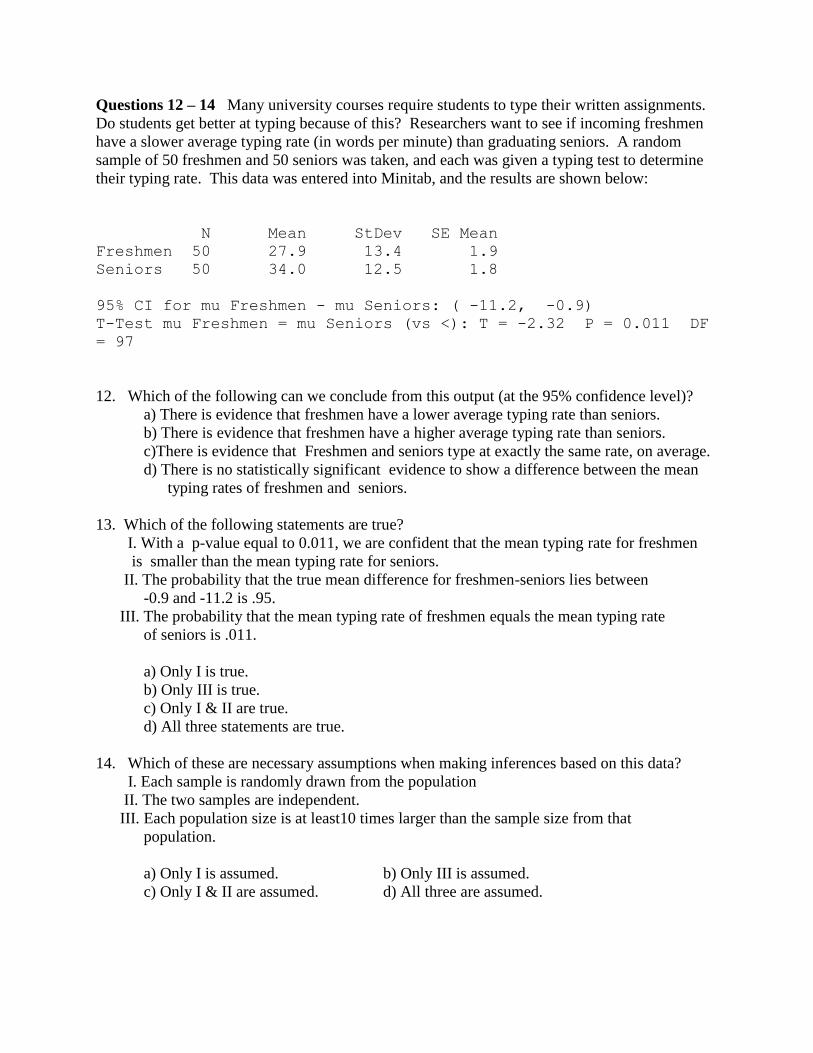
Questions 12 – 14 Many university courses require students to type their written assignments.
Do students get better at typing because of this? Researchers want to see if incoming freshmen
have a slower average typing rate (in words per minute) than graduating seniors. A random
sample of 50 freshmen and 50 seniors was taken, and each was given a typing test to determine
their typing rate. This data was entered into Minitab, and the results are shown below:
N Mean StDev SE Mean
Freshmen 50 27.9 13.4 1.9
Seniors 50 34.0 12.5 1.8
95% CI for mu Freshmen - mu Seniors: ( -11.2, -0.9)
T-Test mu Freshmen = mu Seniors (vs <): T = -2.32 P = 0.011 DF
= 97
12. Which of the following can we conclude from this output (at the 95% confidence level)?
a) There is evidence that freshmen have a lower average typing rate than seniors.
b) There is evidence that freshmen have a higher average typing rate than seniors.
c)There is evidence that Freshmen and seniors type at exactly the same rate, on average.
d) There is no statistically significant evidence to show a difference between the mean
typing rates of freshmen and seniors.
13. Which of the following statements are true?
I. With a p-value equal to 0.011, we are confident that the mean typing rate for freshmen
is smaller than the mean typing rate for seniors.
II. The probability that the true mean difference for freshmen-seniors lies between
-0.9 and -11.2 is .95.
III. The probability that the mean typing rate of freshmen equals the mean typing rate
of seniors is .011.
a) Only I is true.
b) Only III is true.
c) Only I & II are true.
d) All three statements are true.
14. Which of these are necessary assumptions when making inferences based on this data?
I. Each sample is randomly drawn from the population
II. The two samples are independent.
III. Each population size is at least10 times larger than the sample size from that
population.
a) Only I is assumed. b) Only III is assumed.
c) Only I & II are assumed. d) All three are assumed.
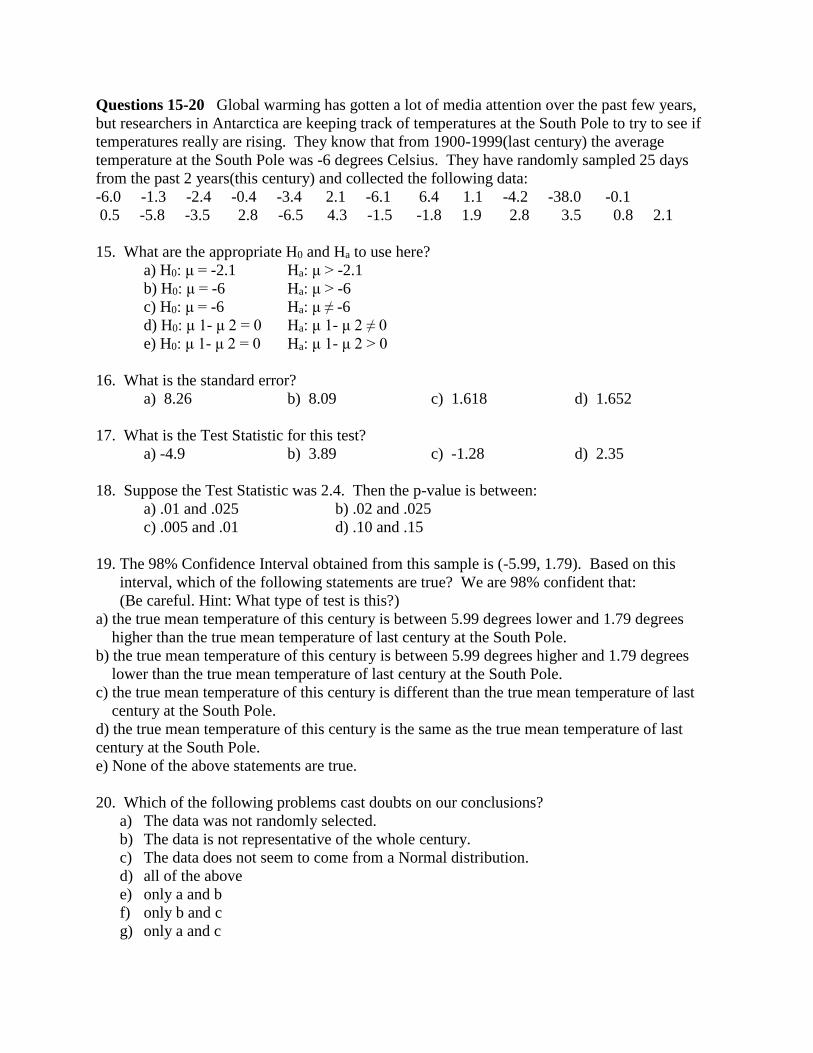
Questions 15-20 Global warming has gotten a lot of media attention over the past few years,
but researchers in Antarctica are keeping track of temperatures at the South Pole to try to see if
temperatures really are rising. They know that from 1900-1999(last century) the average
temperature at the South Pole was -6 degrees Celsius. They have randomly sampled 25 days
from the past 2 years(this century) and collected the following data:
-6.0 -1.3 -2.4 -0.4 -3.4 2.1 -6.1 6.4 1.1 -4.2 -38.0 -0.1
0.5 -5.8 -3.5 2.8 -6.5 4.3 -1.5 -1.8 1.9 2.8 3.5 0.8 2.1
15. What are the appropriate H0 and Ha to use here?
a) H0: μ = -2.1 Ha: μ > -2.1
b) H0: μ = -6 Ha: μ > -6
c) H0: μ = -6 Ha: μ ≠ -6
d) H0: μ 1- μ 2 = 0 Ha: μ 1- μ 2 ≠ 0
e) H0: μ 1- μ 2 = 0 Ha: μ 1- μ 2 > 0
16. What is the standard error?
a) 8.26 b) 8.09 c) 1.618 d) 1.652
17. What is the Test Statistic for this test?
a) -4.9 b) 3.89 c) -1.28 d) 2.35
18. Suppose the Test Statistic was 2.4. Then the p-value is between:
a) .01 and .025 b) .02 and .025
c) .005 and .01 d) .10 and .15
19. The 98% Confidence Interval obtained from this sample is (-5.99, 1.79). Based on this
interval, which of the following statements are true? We are 98% confident that:
(Be careful. Hint: What type of test is this?)
a) the true mean temperature of this century is between 5.99 degrees lower and 1.79 degrees
higher than the true mean temperature of last century at the South Pole.
b) the true mean temperature of this century is between 5.99 degrees higher and 1.79 degrees
lower than the true mean temperature of last century at the South Pole.
c) the true mean temperature of this century is different than the true mean temperature of last
century at the South Pole.
d) the true mean temperature of this century is the same as the true mean temperature of last
century at the South Pole.
e) None of the above statements are true.
20. Which of the following problems cast doubts on our conclusions?
a) The data was not randomly selected.
b) The data is not representative of the whole century.
c) The data does not seem to come from a Normal distribution.
d) all of the above
e) only a and b
f) only b and c
g) only a and c
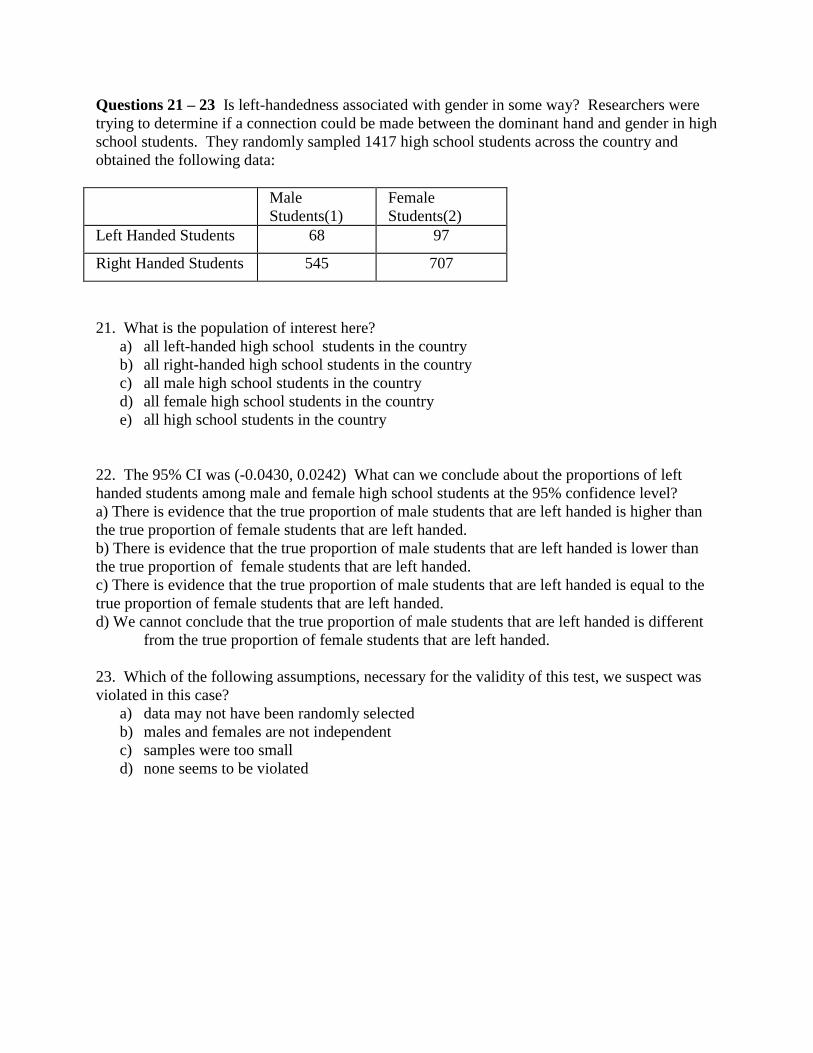
Questions 21 – 23 Is left-handedness associated with gender in some way? Researchers were
trying to determine if a connection could be made between the dominant hand and gender in high
school students. They randomly sampled 1417 high school students across the country and
obtained the following data:
Male
Students(1)
Female
Students(2)
Left Handed Students 68 97
Right Handed Students 545 707
21. What is the population of interest here?
a) all left-handed high school students in the country
b) all right-handed high school students in the country
c) all male high school students in the country
d) all female high school students in the country
e) all high school students in the country
22. The 95% CI was (-0.0430, 0.0242) What can we conclude about the proportions of left
handed students among male and female high school students at the 95% confidence level?
a) There is evidence that the true proportion of male students that are left handed is higher than
the true proportion of female students that are left handed.
b) There is evidence that the true proportion of male students that are left handed is lower than
the true proportion of female students that are left handed.
c) There is evidence that the true proportion of male students that are left handed is equal to the
true proportion of female students that are left handed.
d) We cannot conclude that the true proportion of male students that are left handed is different
from the true proportion of female students that are left handed.
23. Which of the following assumptions, necessary for the validity of this test, we suspect was
violated in this case?
a) data may not have been randomly selected
b) males and females are not independent
c) samples were too small
d) none seems to be violated

Questions 24-27 Below is data collected from a random sample of 3,647 American
professionals from 10 urban cities. We would like to know if male professionals(1) are more
likely to have children than female(2) professionals of the same age (33-38).
WOMEN MEN TOTALS
Without
children
With
children
Without
children
With
children
Without
children
With
children
18-25 265 62 132 164 397 226
26-32 408 216 178 397 583 613
33-38 276 412 86 563 362 978
39-45 89 294 23 275 112 569
46+ 23 145 64 455 87 600
24. This would be best analyzed as a:
a) comparing means of dependent samples b) One proportion
c) Two independent means d) Two independent proportions
25. Which data from the table above would we be analyzing in this case?
a) all women vs. all men
b) women aged 33-38 vs. men aged 33-38
c) women aged 33-38 vs. totals for all people 33-38
d) women aged 33-38 with children vs. women aged 33-38 without children
26. Are there any problems with this data that would violate the assumptions?
a) Yes, there is an outlier.
b) Yes, all the counts are too large.
c) Yes, the data does not come from a Normal distribution.
d) No problems.
Minitab gave the following output for this analysis.
95% CI for p(1) - p(2): (0.206951, 0.297170)
Test for p(1) - p(2) = 0 (vs > 0): Z = 10.95 P-Value = 0.000
27. What conclusion can we make about professional men and women, aged 33-38, in urban
cities?
a) There is not enough statistically significant evidence to conclude that professional men are
more likely than professional women in this age group to have children.
b) There is evidence that the proportion of professional men who have children is different than
the proportion of professional women in this age group.
c) There is evidence that the professional men are significantly more likely to have children than
professional women in this age group.
d) There is evidence that professional women are significantly more likely to have children than
professional men in this age group.
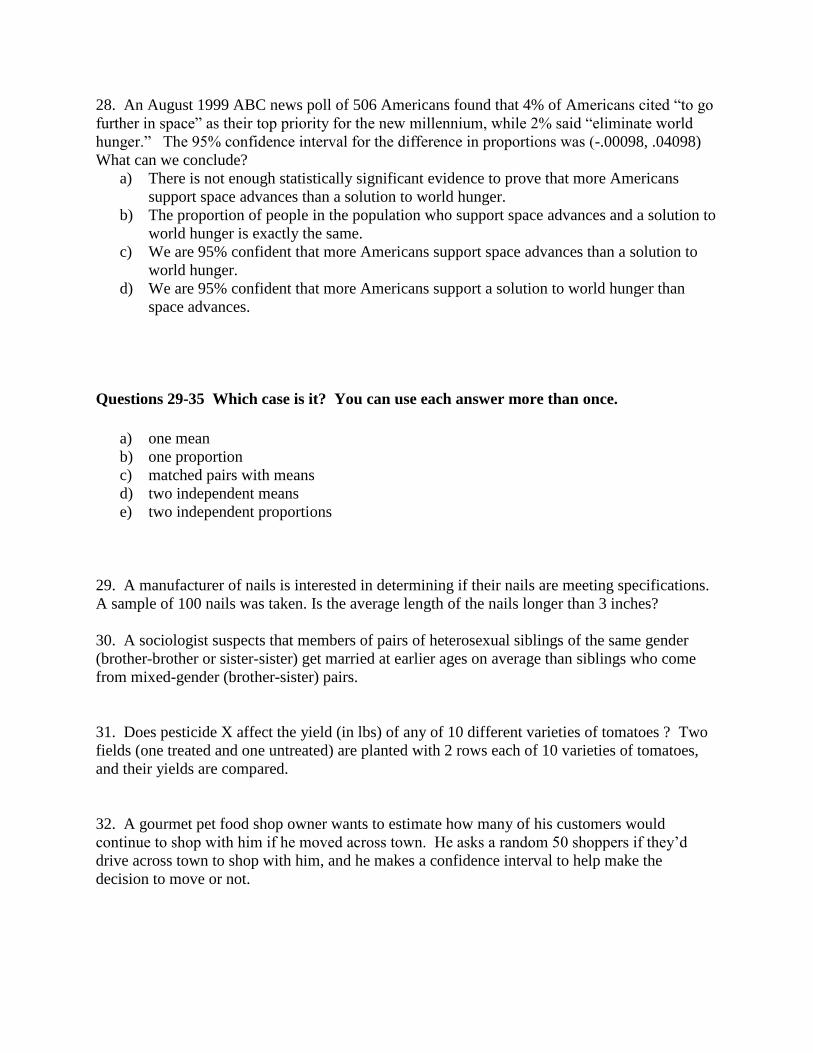
28. An August 1999 ABC news poll of 506 Americans found that 4% of Americans cited “to go
further in space” as their top priority for the new millennium, while 2% said “eliminate world
hunger.” The 95% confidence interval for the difference in proportions was (-.00098, .04098)
What can we conclude?
a) There is not enough statistically significant evidence to prove that more Americans
support space advances than a solution to world hunger.
b) The proportion of people in the population who support space advances and a solution to
world hunger is exactly the same.
c) We are 95% confident that more Americans support space advances than a solution to
world hunger.
d) We are 95% confident that more Americans support a solution to world hunger than
space advances.
Questions 29-35 Which case is it? You can use each answer more than once.
a) one mean
b) one proportion
c) matched pairs with means
d) two independent means
e) two independent proportions
29. A manufacturer of nails is interested in determining if their nails are meeting specifications.
A sample of 100 nails was taken. Is the average length of the nails longer than 3 inches?
30. A sociologist suspects that members of pairs of heterosexual siblings of the same gender
(brother-brother or sister-sister) get married at earlier ages on average than siblings who come
from mixed-gender (brother-sister) pairs.
31. Does pesticide X affect the yield (in lbs) of any of 10 different varieties of tomatoes ? Two
fields (one treated and one untreated) are planted with 2 rows each of 10 varieties of tomatoes,
and their yields are compared.
32. A gourmet pet food shop owner wants to estimate how many of his customers would
continue to shop with him if he moved across town. He asks a random 50 shoppers if they’d
drive across town to shop with him, and he makes a confidence interval to help make the
decision to move or not.
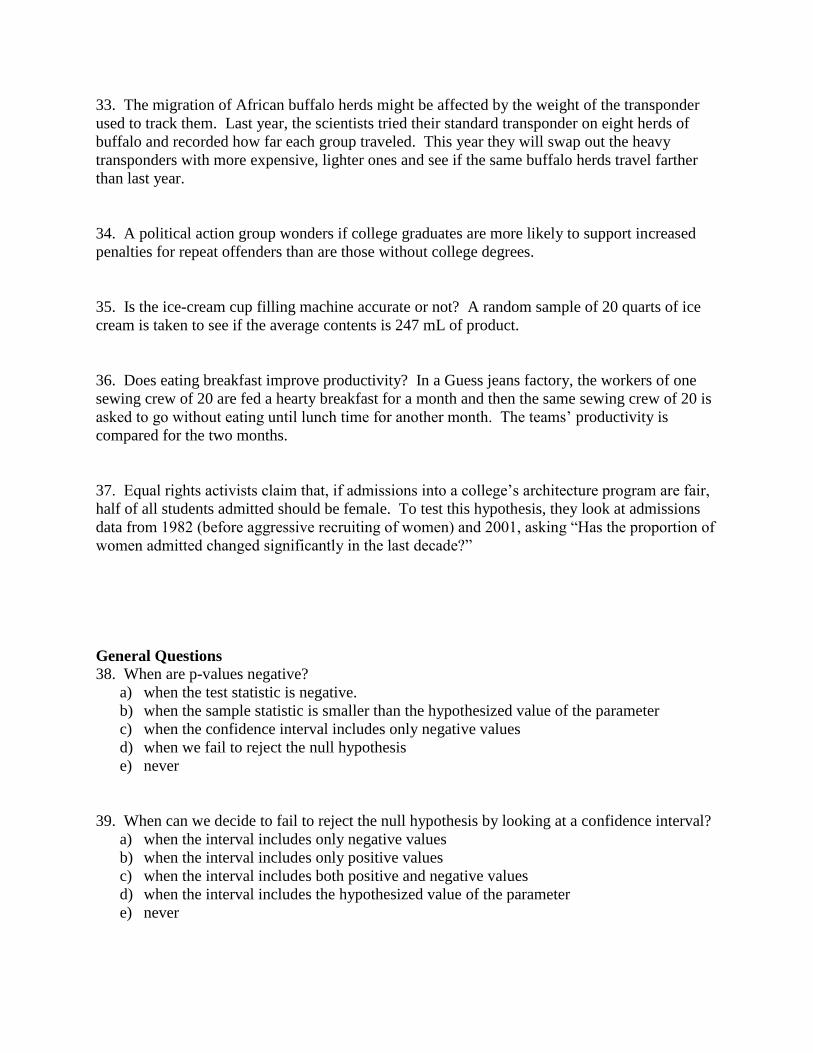
33. The migration of African buffalo herds might be affected by the weight of the transponder
used to track them. Last year, the scientists tried their standard transponder on eight herds of
buffalo and recorded how far each group traveled. This year they will swap out the heavy
transponders with more expensive, lighter ones and see if the same buffalo herds travel farther
than last year.
34. A political action group wonders if college graduates are more likely to support increased
penalties for repeat offenders than are those without college degrees.
35. Is the ice-cream cup filling machine accurate or not? A random sample of 20 quarts of ice
cream is taken to see if the average contents is 247 mL of product.
36. Does eating breakfast improve productivity? In a Guess jeans factory, the workers of one
sewing crew of 20 are fed a hearty breakfast for a month and then the same sewing crew of 20 is
asked to go without eating until lunch time for another month. The teams’ productivity is
compared for the two months.
37. Equal rights activists claim that, if admissions into a college’s architecture program are fair,
half of all students admitted should be female. To test this hypothesis, they look at admissions
data from 1982 (before aggressive recruiting of women) and 2001, asking “Has the proportion of
women admitted changed significantly in the last decade?”
General Questions
38. When are p-values negative?
a) when the test statistic is negative.
b) when the sample statistic is smaller than the hypothesized value of the parameter
c) when the confidence interval includes only negative values
d) when we fail to reject the null hypothesis
e) never
39. When can we decide to fail to reject the null hypothesis by looking at a confidence interval?
a) when the interval includes only negative values
b) when the interval includes only positive values
c) when the interval includes both positive and negative values
d) when the interval includes the hypothesized value of the parameter
e) never
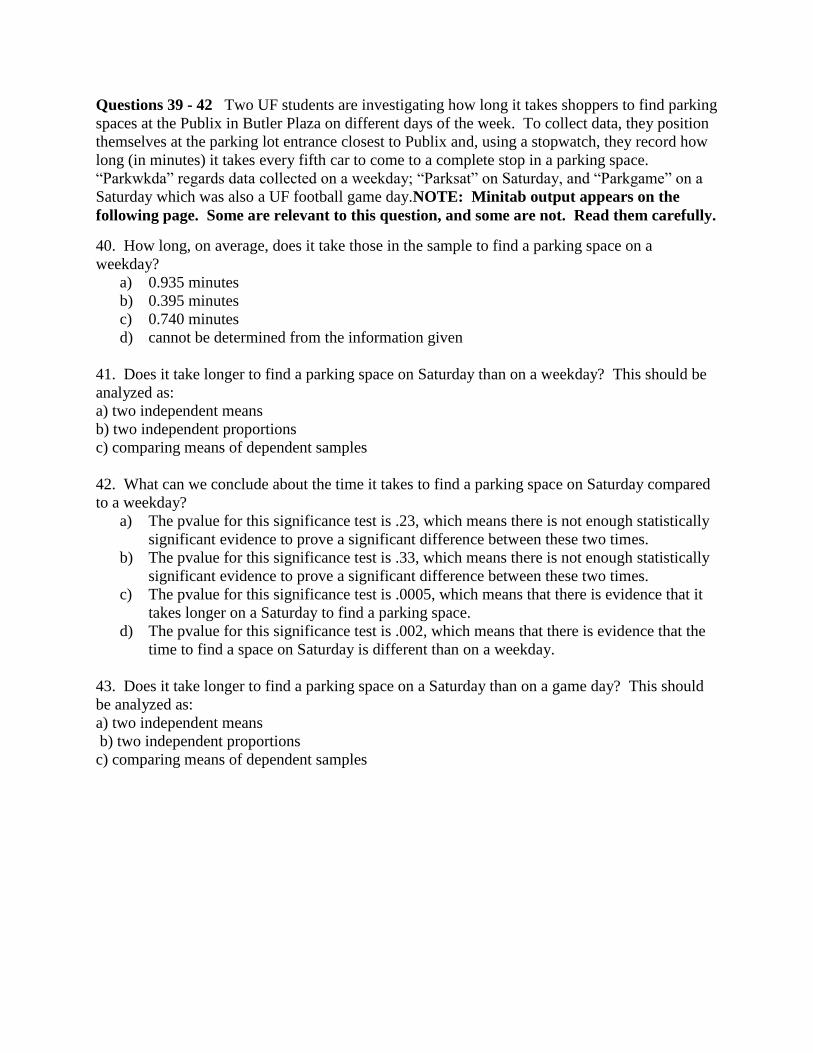
Questions 39 - 42 Two UF students are investigating how long it takes shoppers to find parking
spaces at the Publix in Butler Plaza on different days of the week. To collect data, they position
themselves at the parking lot entrance closest to Publix and, using a stopwatch, they record how
long (in minutes) it takes every fifth car to come to a complete stop in a parking space.
“Parkwkda” regards data collected on a weekday; “Parksat” on Saturday, and “Parkgame” on a
Saturday which was also a UF football game day.NOTE: Minitab output appears on the
following page. Some are relevant to this question, and some are not. Read them carefully.
40. How long, on average, does it take those in the sample to find a parking space on a
weekday?
a) 0.935 minutes
b) 0.395 minutes
c) 0.740 minutes
d) cannot be determined from the information given
41. Does it take longer to find a parking space on Saturday than on a weekday? This should be
analyzed as:
a) two independent means
b) two independent proportions
c) comparing means of dependent samples
42. What can we conclude about the time it takes to find a parking space on Saturday compared
to a weekday?
a) The pvalue for this significance test is .23, which means there is not enough statistically
significant evidence to prove a significant difference between these two times.
b) The pvalue for this significance test is .33, which means there is not enough statistically
significant evidence to prove a significant difference between these two times.
c) The pvalue for this significance test is .0005, which means that there is evidence that it
takes longer on a Saturday to find a parking space.
d) The pvalue for this significance test is .002, which means that there is evidence that the
time to find a space on Saturday is different than on a weekday.
43. Does it take longer to find a parking space on a Saturday than on a game day? This should
be analyzed as:
a) two independent means
b) two independent proportions
c) comparing means of dependent samples
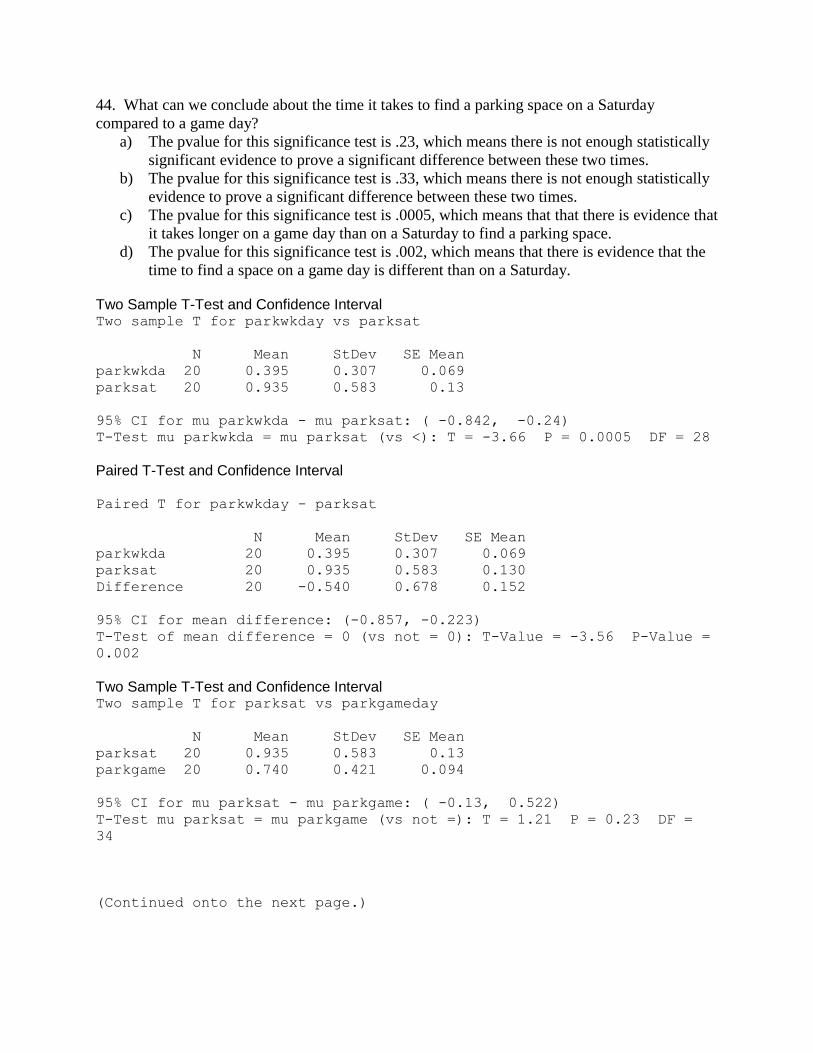
44. What can we conclude about the time it takes to find a parking space on a Saturday
compared to a game day?
a) The pvalue for this significance test is .23, which means there is not enough statistically
significant evidence to prove a significant difference between these two times.
b) The pvalue for this significance test is .33, which means there is not enough statistically
evidence to prove a significant difference between these two times.
c) The pvalue for this significance test is .0005, which means that that there is evidence that
it takes longer on a game day than on a Saturday to find a parking space.
d) The pvalue for this significance test is .002, which means that there is evidence that the
time to find a space on a game day is different than on a Saturday. Two Sample T-Test and Confidence Interval Two sample T for parkwkday vs parksat
N Mean StDev SE Mean
parkwkda 20 0.395 0.307 0.069
parksat 20 0.935 0.583 0.13
95% CI for mu parkwkda - mu parksat: ( -0.842, -0.24)
T-Test mu parkwkda = mu parksat (vs <): T = -3.66 P = 0.0005 DF = 28
Paired T-Test and Confidence Interval Paired T for parkwkday - parksat
N Mean StDev SE Mean
parkwkda 20 0.395 0.307 0.069
parksat 20 0.935 0.583 0.130
Difference 20 -0.540 0.678 0.152
95% CI for mean difference: (-0.857, -0.223)
T-Test of mean difference = 0 (vs not = 0): T-Value = -3.56 P-Value =
0.002
Two Sample T-Test and Confidence Interval Two sample T for parksat vs parkgameday
N Mean StDev SE Mean
parksat 20 0.935 0.583 0.13
parkgame 20 0.740 0.421 0.094
95% CI for mu parksat - mu parkgame: ( -0.13, 0.522)
T-Test mu parksat = mu parkgame (vs not =): T = 1.21 P = 0.23 DF =
34
(Continued onto the next page.)
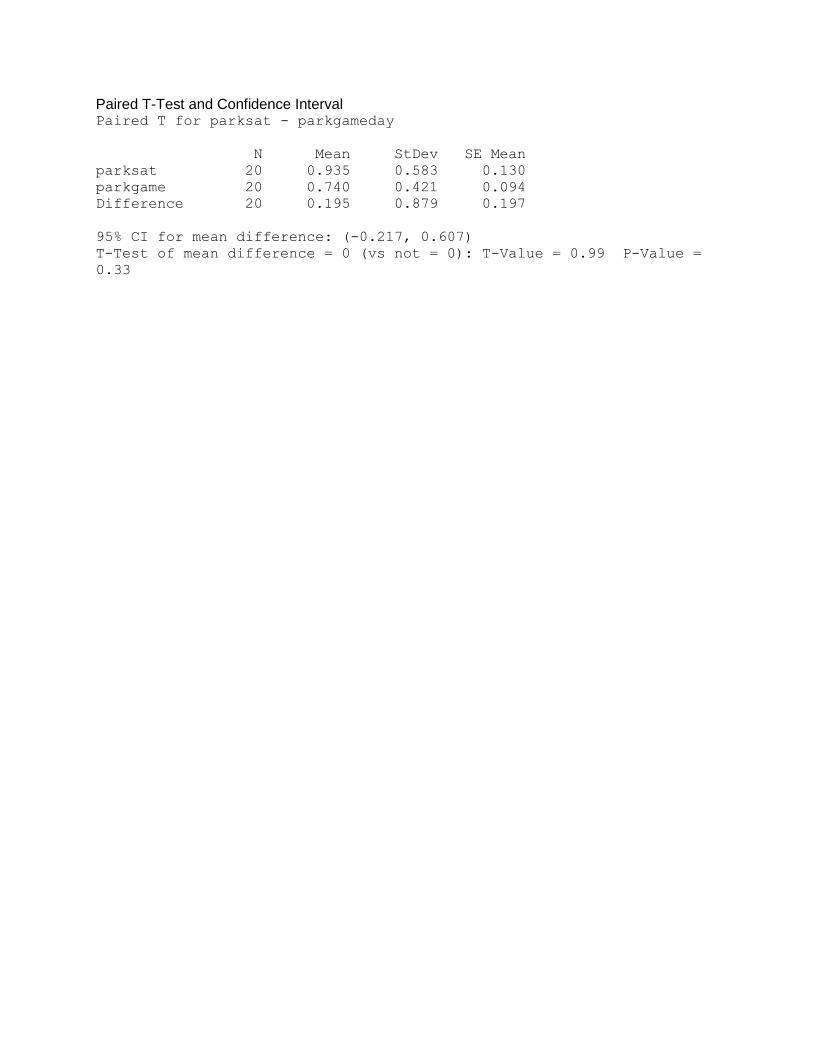
Paired T-Test and Confidence Interval Paired T for parksat - parkgameday
N Mean StDev SE Mean
parksat 20 0.935 0.583 0.130
parkgame 20 0.740 0.421 0.094
Difference 20 0.195 0.879 0.197
95% CI for mean difference: (-0.217, 0.607)
T-Test of mean difference = 0 (vs not = 0): T-Value = 0.99 P-Value =
0.33
45.Which of the following is TRUE?
a) For the method of two independent means, the size of the two samples can be different.
b) Matched pairs design uses the standard normal distribution, since the population is
required to be normal.
c) The method of two independent means can be used for categorical response variables,
whereas matched pairs design cannot.
d) All of the above.
46. Which of the following is TRUE?
a) Matched pairs design benefits from the fact that potential sources of bias are controlled.
b) The degrees of freedom for two independent means tests is n1+n2-1
c) We can use the normal distribution to find the p-value with comparing proportions from
two independent samples because the data comes from a normal distribution.
d) All of the above.
Questions 47 – 49 According to a study in 2005 by American Research Group, an American
adult spends on average an amount of $942 on gifts for the Christmas holiday. We claim that
students at UF are likely to spend less than that amount. To test this claim, we randomly
surveyed 25 students across campus, the resulted sample mean is 820.24, and the standard
deviation is 260.4.
47. Which of the following hypothesis is correct?
a) Ho: μ = 942, Ha: μ < 942.
b) Ho: μ = 0, Ha: μ ≠ 0.
c) Ho: μ = 942, Ha: μ > 942.
d) Ho: μ = 942, Ha: μ ≠ 942.
48. Conduct the significant test, what is the value of the test statistic?
a) -2.338
b) 2.338
c) -0.468
d) 0.468
49. What is the associated p-value?
a) 0.01 < p-value < 0.025
b) 0.02 < p-value < 0.05
c) 0.005 < p-value < 0.0125
d) p-value = 0.0096
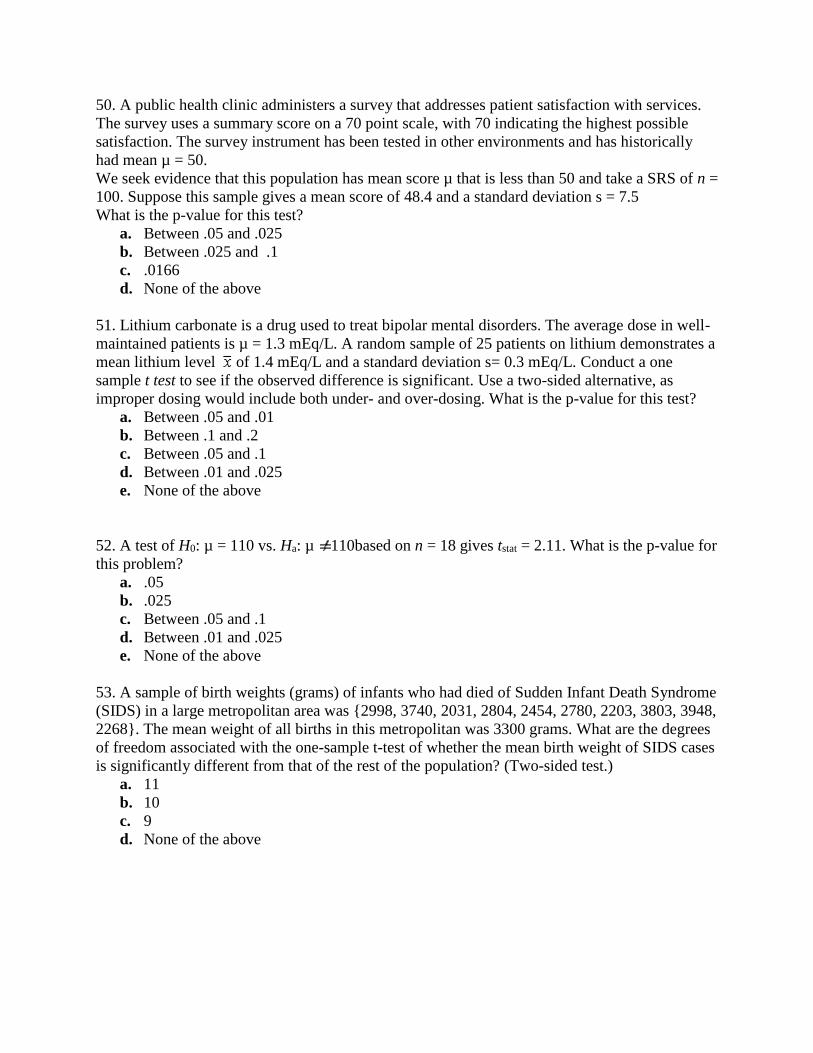
50. A public health clinic administers a survey that addresses patient satisfaction with services.
The survey uses a summary score on a 70 point scale, with 70 indicating the highest possible
satisfaction. The survey instrument has been tested in other environments and has historically
had mean µ = 50.
We seek evidence that this population has mean score µ that is less than 50 and take a SRS of n =
100. Suppose this sample gives a mean score of 48.4 and a standard deviation s = 7.5
What is the p-value for this test?
a. Between .05 and .025
b. Between .025 and .1
c. .0166
d. None of the above
51. Lithium carbonate is a drug used to treat bipolar mental disorders. The average dose in well-
maintained patients is µ = 1.3 mEq/L. A random sample of 25 patients on lithium demonstrates a
mean lithium level of 1.4 mEq/L and a standard deviation s= 0.3 mEq/L. Conduct a one
sample t test to see if the observed difference is significant. Use a two-sided alternative, as
improper dosing would include both under- and over-dosing. What is the p-value for this test?
a. Between .05 and .01
b. Between .1 and .2
c. Between .05 and .1
d. Between .01 and .025
e. None of the above
52. A test of H0: µ = 110 vs. Ha: µ 110based on n = 18 gives tstat = 2.11. What is the p-value for
this problem?
a. .05
b. .025
c. Between .05 and .1
d. Between .01 and .025
e. None of the above
53. A sample of birth weights (grams) of infants who had died of Sudden Infant Death Syndrome
(SIDS) in a large metropolitan area was {2998, 3740, 2031, 2804, 2454, 2780, 2203, 3803, 3948,
2268}. The mean weight of all births in this metropolitan was 3300 grams. What are the degrees
of freedom associated with the one-sample t-test of whether the mean birth weight of SIDS cases
is significantly different from that of the rest of the population? (Two-sided test.)
a. 11
b. 10
c. 9
d. None of the above
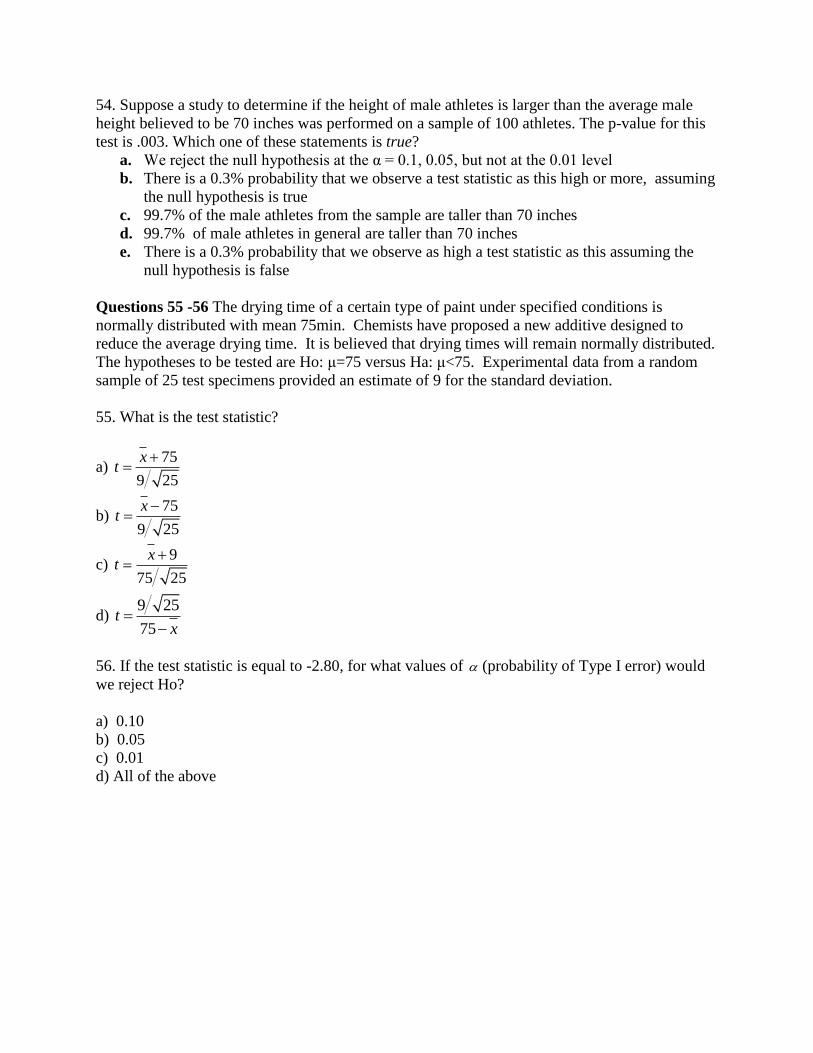
54. Suppose a study to determine if the height of male athletes is larger than the average male
height believed to be 70 inches was performed on a sample of 100 athletes. The p-value for this
test is .003. Which one of these statements is true?
a. We reject the null hypothesis at the α = 0.1, 0.05, but not at the 0.01 level
b. There is a 0.3% probability that we observe a test statistic as this high or more, assuming
the null hypothesis is true
c. 99.7% of the male athletes from the sample are taller than 70 inches
d. 99.7% of male athletes in general are taller than 70 inches
e. There is a 0.3% probability that we observe as high a test statistic as this assuming the
null hypothesis is false
Questions 55 -56 The drying time of a certain type of paint under specified conditions is
normally distributed with mean 75min. Chemists have proposed a new additive designed to
reduce the average drying time. It is believed that drying times will remain normally distributed.
The hypotheses to be tested are Ho: μ=75 versus Ha: μ<75. Experimental data from a random
sample of 25 test specimens provided an estimate of 9 for the standard deviation.
55. What is the test statistic?
a) 75
9 25
xt
b) 75
9 25
xt
c) 9
75 25
xt
d) 9 25
75t
x
56. If the test statistic is equal to -2.80, for what values of (probability of Type I error) would
we reject Ho?
a) 0.10
b) 0.05
c) 0.01
d) All of the above
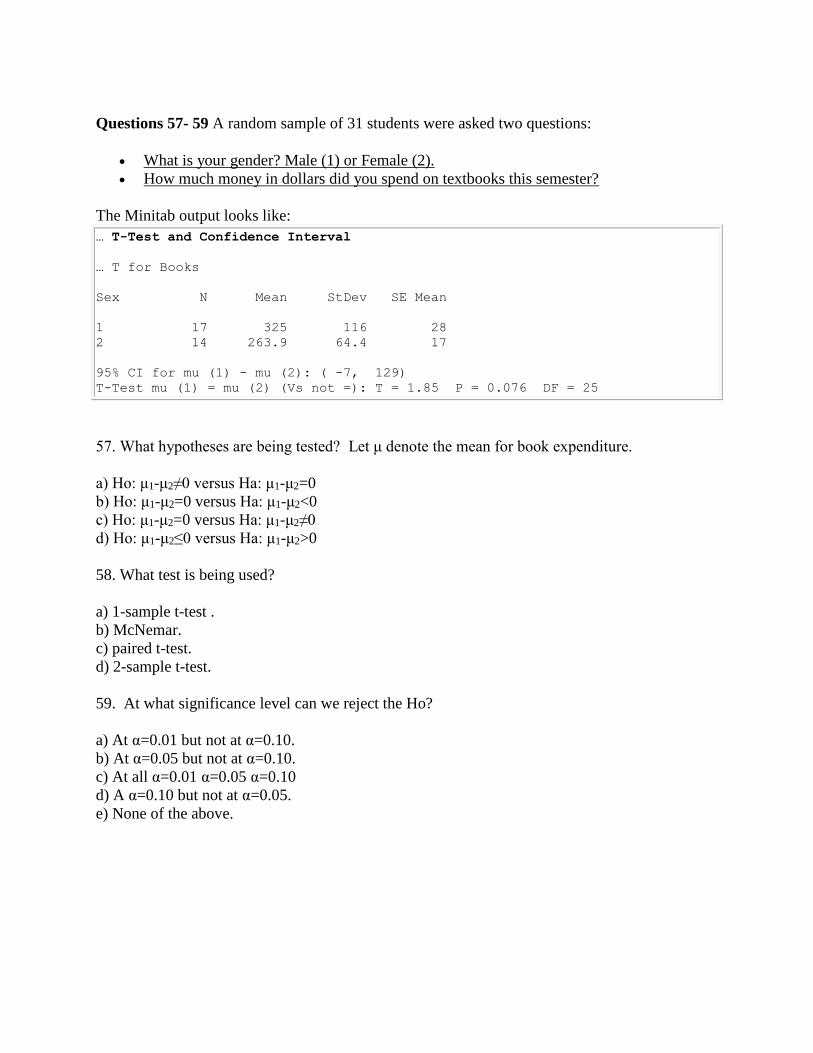
Questions 57- 59 A random sample of 31 students were asked two questions:
What is your gender? Male (1) or Female (2).
How much money in dollars did you spend on textbooks this semester?
The Minitab output looks like:
… T-Test and Confidence Interval
… T for Books
Sex N Mean StDev SE Mean
1 17 325 116 28
2 14 263.9 64.4 17
95% CI for mu (1) - mu (2): ( -7, 129)
T-Test mu (1) = mu (2) (Vs not =): T = 1.85 P = 0.076 DF = 25
57. What hypotheses are being tested? Let μ denote the mean for book expenditure.
a) Ho: μ1-μ2≠0 versus Ηa: μ1-μ2=0
b) Ho: μ1-μ2=0 versus Ηa: μ1-μ2<0
c) Ho: μ1-μ2=0 versus Ηa: μ1-μ2≠0
d) Ho: μ1-μ2≤0 versus Ηa: μ1-μ2>0
58. What test is being used?
a) 1-sample t-test .
b) McNemar.
c) paired t-test.
d) 2-sample t-test.
59. At what significance level can we reject the Ho?
a) At α=0.01 but not at α=0.10.
b) At α=0.05 but not at α=0.10.
c) At all α=0.01 α=0.05 α=0.10
d) A α=0.10 but not at α=0.05.
e) None of the above.

Questions 60 and 61: A researcher at a local university wants to find out the relationship
between person’s height right before sleep and right after sleep. She asks 50 people, randomly
selected, to participate in the study. These people monitor their heights for three days. Every
night, right before the participants go to sleep, they measure their height and then sleep for
approximately eight hours. After they wake up, they measure their height again, and take the
difference between the measurements:
Difference = Height After Sleep – Height Before Sleep
This routine is performed for three consecutive nights and three differences are obtained.
Finally, the differences are averaged to obtain an average difference, D, between heights.
The researcher is using the following hypothesis test in her study
Ho: μD = 0
Ha: μD > 0
60. What is the researcher trying to show using the above hypothesis test?
(a) People, on average, are taller after sleep than before sleep
(b) People, on average, are shorter after sleep than before sleep
(c) There is a difference between people’s average height before and after sleep
(d) There is no difference between people’s average height before and after sleep
61. If the p-value for the above hypothesis test is 0.21, what conclusion can we make, with α
being the usual 0.05?
(a) There is evidence that people, on average, are taller after sleep than before sleep
(b) There is evidence that people, on average, are shorter after sleep than before sleep
(c) There is no statistically significant evidence of a difference between people’s average height
before and after sleep
(d) There is definitely no statistically significant evidence of a difference between people’s
average height before and after sleep
Questions 62 – 63 After finishing her study of people’s heights, the researcher finds an article
about the relationship between people’s weight before and after sleep. The article describes a
study done at one of the universities, where an interesting result has been found. Based on the
result described in the article, she wants to test whether students at her university weigh less after
night’s sleep. Each student is weighed before and after sleeping.
62. Based on researcher’s goal, what could be the possible null hypothesis of her hypothesis test?
(a) People weigh more on average after sleep
(b) People weigh less on average after sleep
(c) There is evidence of a difference between the people’s average weight before and after sleep
(d) There is no statistically significant evidence of a difference between people’s average weight
before and after sleep
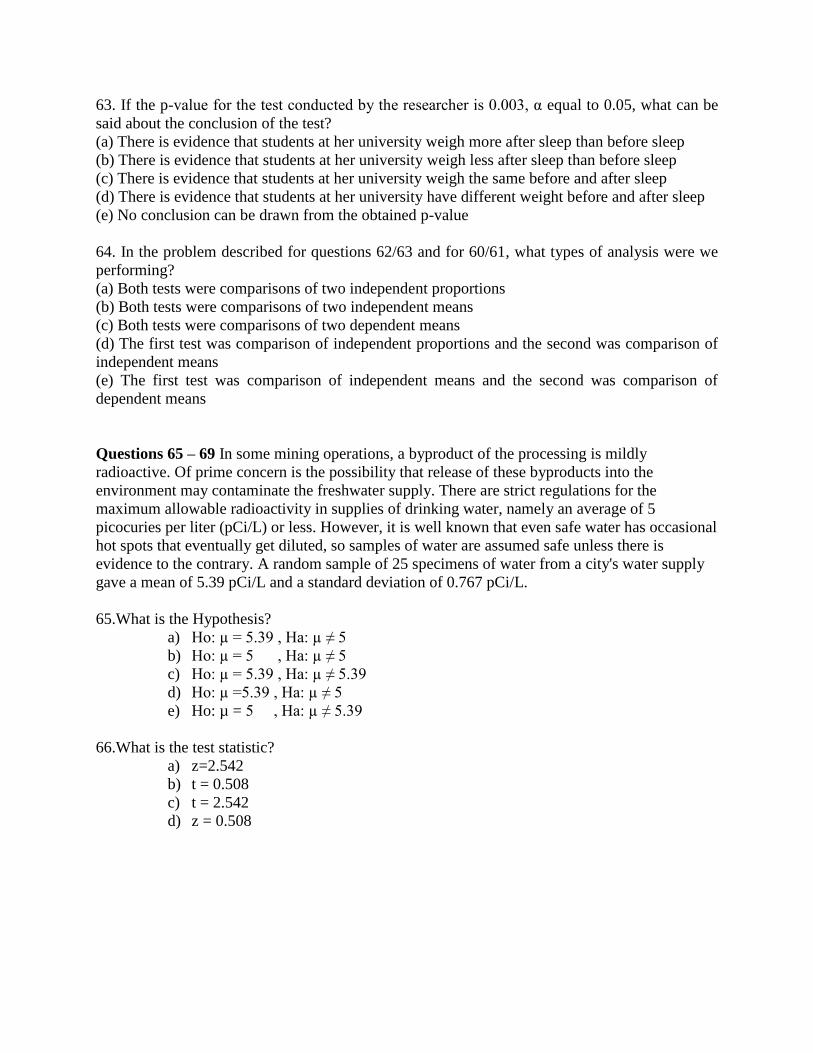
63. If the p-value for the test conducted by the researcher is 0.003, α equal to 0.05, what can be
said about the conclusion of the test?
(a) There is evidence that students at her university weigh more after sleep than before sleep
(b) There is evidence that students at her university weigh less after sleep than before sleep
(c) There is evidence that students at her university weigh the same before and after sleep
(d) There is evidence that students at her university have different weight before and after sleep
(e) No conclusion can be drawn from the obtained p-value
64. In the problem described for questions 62/63 and for 60/61, what types of analysis were we
performing?
(a) Both tests were comparisons of two independent proportions
(b) Both tests were comparisons of two independent means
(c) Both tests were comparisons of two dependent means
(d) The first test was comparison of independent proportions and the second was comparison of
independent means
(e) The first test was comparison of independent means and the second was comparison of
dependent means
Questions 65 – 69 In some mining operations, a byproduct of the processing is mildly
radioactive. Of prime concern is the possibility that release of these byproducts into the
environment may contaminate the freshwater supply. There are strict regulations for the
maximum allowable radioactivity in supplies of drinking water, namely an average of 5
picocuries per liter (pCi/L) or less. However, it is well known that even safe water has occasional
hot spots that eventually get diluted, so samples of water are assumed safe unless there is
evidence to the contrary. A random sample of 25 specimens of water from a city's water supply
gave a mean of 5.39 pCi/L and a standard deviation of 0.767 pCi/L.
65.What is the Hypothesis?
a) Ho: µ = 5.39 , Ha: µ ≠ 5
b) Ho: µ = 5 , Ha: µ ≠ 5
c) Ho: µ = 5.39 , Ha: µ ≠ 5.39
d) Ho: µ =5.39 , Ha: µ ≠ 5
e) Ho: µ = 5 , Ha: µ ≠ 5.39
66.What is the test statistic?
a) z=2.542
b) t = 0.508
c) t = 2.542
d) z = 0.508
67. What is the probability that the test statistic equals the observed value or a value even more
extreme if the null hypothesis is true?
a) b/t 0.01 and 0.005
b) b/t 0.01 and 0.02
c) .0180
d) .9910
68.What is the 95% confidence interval for the population mean amount of radioactive
byproducts?
a) (5.07, 5.71)
b) (5.00, 5.77)
c) (5.09, 5.69)
d) (4.92, 5.64)
69.What is the conclusion if you use significance level 0.05 ?
a) We fail to reject that the average radioactivity in the water is 5 pCi/L
b) We fail to reject that the average radioactivity in the water is 5.39 pCi/L
c) We have enough evidence to reject that the average radioactivity in the water is 5
pCi/L
d) We have enough evidence to reject that the average radioactivity in the water is
5.39 pCi/L
70.What is the hypothesis for the McNemar test?
a) Ho: p1-p2=0, Ha: p1- p2>0.
b) Ho: p1-p2=0, Ha: p1-p2<0.
c) Ho: p1-p2=0, Ha: p1-p2≠0.
d) Ho: p=0, Ha: p≠0.
e) Ho: p=0, Ha: p>0.
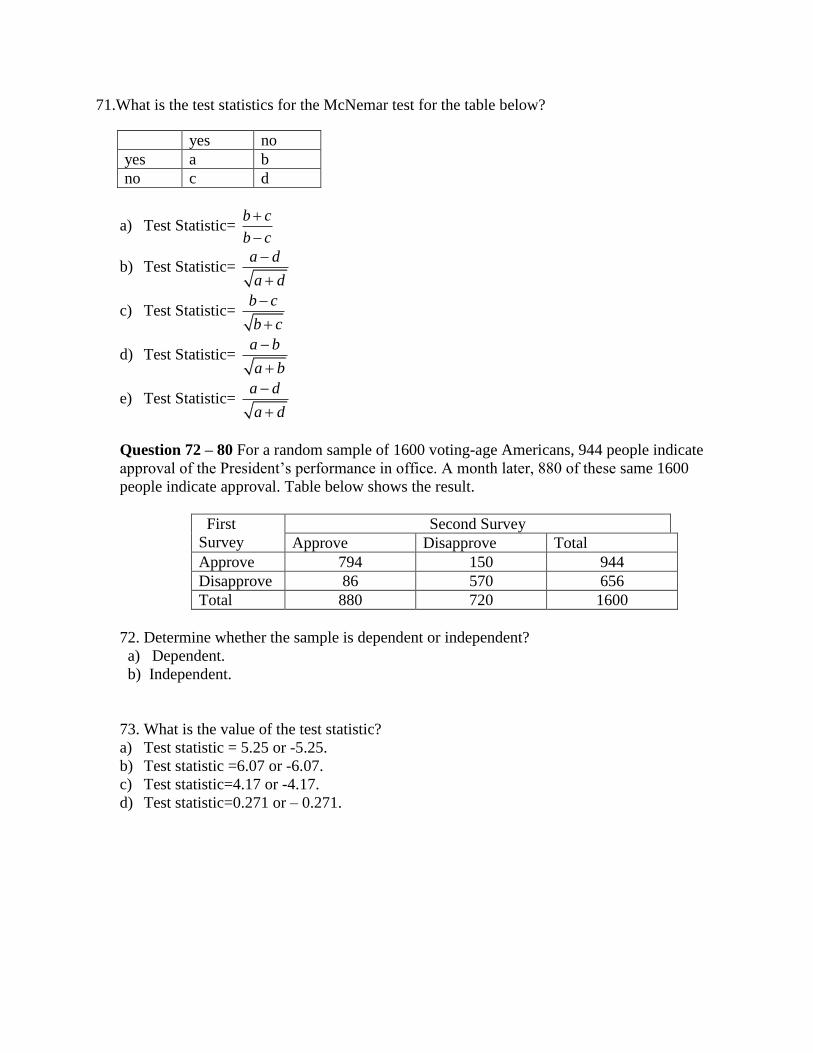
71.What is the test statistics for the McNemar test for the table below?
a) Test Statistic= b c
b c
b) Test Statistic= a d
a d
c) Test Statistic= b c
b c
d) Test Statistic= a b
a b
e) Test Statistic= a d
a d
Question 72 – 80 For a random sample of 1600 voting-age Americans, 944 people indicate
approval of the President’s performance in office. A month later, 880 of these same 1600
people indicate approval. Table below shows the result.
First
Survey
Second Survey
Approve Disapprove Total
Approve 794 150 944
Disapprove 86 570 656
Total 880 720 1600
72. Determine whether the sample is dependent or independent?
a) Dependent.
b) Independent.
73. What is the value of the test statistic?
a) Test statistic = 5.25 or -5.25.
b) Test statistic =6.07 or -6.07.
c) Test statistic=4.17 or -4.17.
d) Test statistic=0.271 or – 0.271.
yes no
yes a b
no c d
74. Give the conclusion for the test (take α =0.05)
a) We reject the null and conclude that there is no significant evidence of the change
in approval rating.
b) We fail to reject the null and conclude that there is significant evidence of the
change in the approval rating.
c) We accept the null and conclude that there is significant evidence of the change in
the approval rating.
d) We reject the null and conclude that there is significant evidence of the change in
approval rating.
75.In hypothesis testing, if you made a Type I error, you would do which of the following?
a.) Reject Ho when Ho was True
b.) Reject Ho when Ho was False
c.) Fail to Reject Ho when Ho was True
d.) Fail to Reject Ho when Ho was False
76. In hypothesis testing, if you made a Type II error, you would do which of the following?
a.) Reject Ho when Ho was True
b.) Reject Ho when Ho was False
c.) Fail to Reject Ho when Ho was True
d.) Fail to Reject Ho when Ho was False