ST3AM BUSINESS OPTIMISATION APPROACH
24
Business Optimisation Key Performance and Process Indicators Presented by Ralf Fickert
-
Upload
ralf-fickert -
Category
Presentations & Public Speaking
-
view
95 -
download
0
Transcript of ST3AM BUSINESS OPTIMISATION APPROACH

Business OptimisationKey Performance and Process Indicators
Presented by Ralf Fickert

Our approach together
Understand Interview Identify Define
© 2015 ST3AM / Depositphotos.com
Recommendations and suggestions
PHASE 1Delivery
PHASE 12 Weeks Discovery Workshop
People Processes Data Sources
Activity
Input
Delivery
Legend
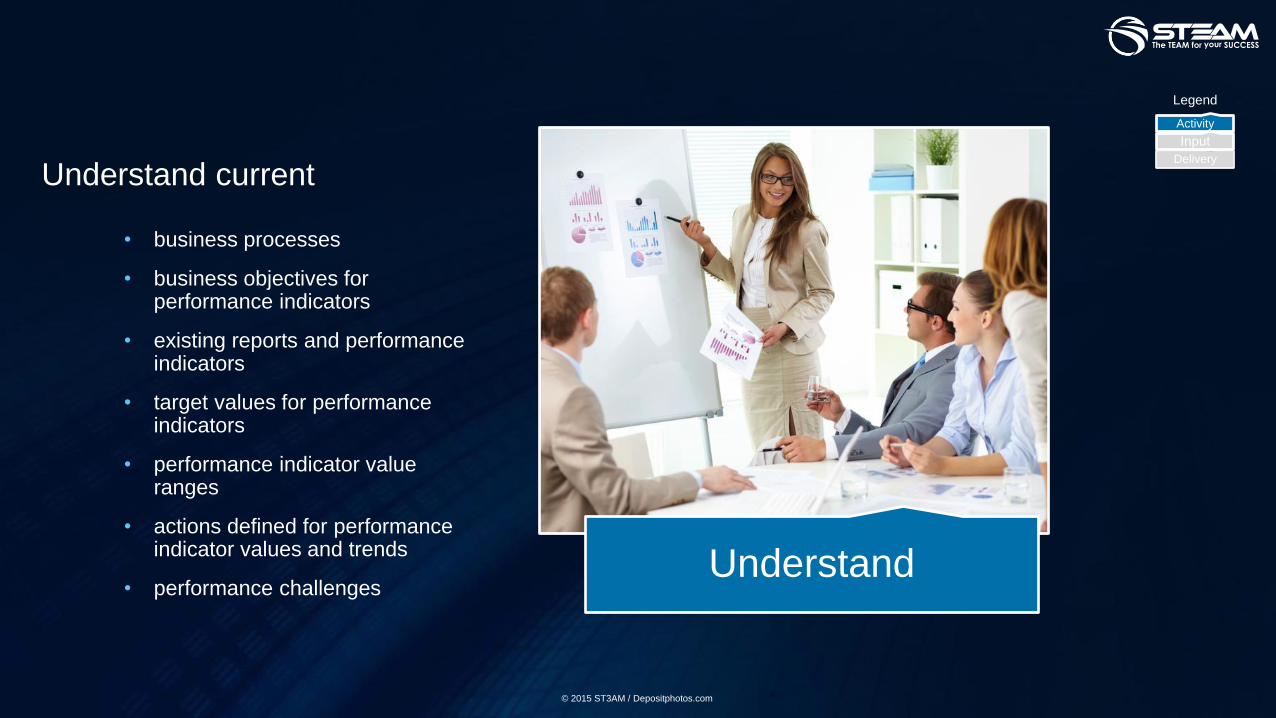
Understand current
Understand
• business processes
• business objectives for performance indicators
• existing reports and performance indicators
• target values for performance indicators
• performance indicator value ranges
• actions defined for performance indicator values and trends
• performance challenges
© 2015 ST3AM / Depositphotos.com
Activity
Input
Delivery
Legend

Conduct Interviews to
• compare business process execution with business process definition
• identify business obstacles influencing the desired performance indicator values
• understand operational objectives
Interview
© 2015 ST3AM / Depositphotos.com
Activity
Input
Delivery
Legend

Identify related data sources to
• understand existing data manipulation
• know which data are included and excluded
• know system limitations
• understand integration requirements
Identify
© 2015 ST3AM / Depositphotos.com
Activity
Input
Delivery
Legend
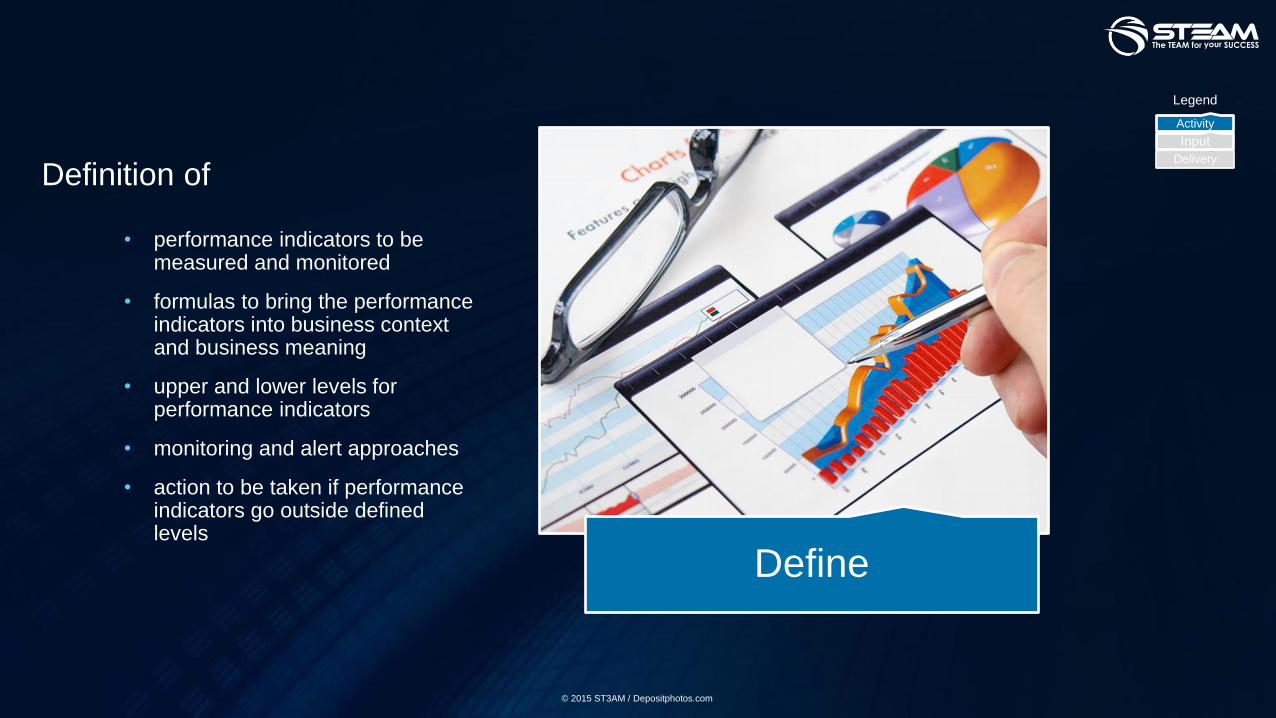
Definition of
• performance indicators to be measured and monitored
• formulas to bring the performance indicators into business context and business meaning
• upper and lower levels for performance indicators
• monitoring and alert approaches
• action to be taken if performance indicators go outside defined levels
Define
© 2015 ST3AM / Depositphotos.com
Activity
Input
Delivery
Legend

Processes
• Where are the measuring points of the business processes within the processes?
• What is measured on the measure points of the business processes?
• How is the business impact of the measure points defined?
• Who is monitoring the measure points?
• Who owns the processes?
• How do you adjust business processes to make them even better?
Processes
© 2015 ST3AM / Depositphotos.com
Activity
Input
Delivery
Legend

Data
• How do you ensure data quality?
• What is the relationship between data sets/entities? Do you have a recent entity relationship diagram?
• What is the expected data volume and frequency of the data sets?
• Do you have a mapping between data filtering conditions and business use cases?
• How do you do data validation checks?
Data
© 2015 ST3AM / Depositphotos.com
Activity
Input
Delivery
Legend

Sources
• Where are the data located?
• Do you use any integration platform?
• What is the process of adding new data for extraction?
• Where is the mapping done between different keys with the same meaning?
• How do you do the verification of the data extraction processes?
Sources
© 2015 ST3AM / Depositphotos.com
Activity
Input
Delivery
Legend
Change ManagementPath to sustainable success
Presented by Ralf Fickert

© 2015 ST3AM / Depositphotos.com
Desired State
Current State
Change Management

Our approach together
Explain Involve Motivate Inspire
© 2015 ST3AM / Depositphotos.com
On-Going
Change Management – Phase 2 -a path to sustainable success
People Processes Mind-Set
Success
Activity
Input
Delivery
Legend

Explain
• the business impacts of the planned changes
• the planned improvement process
• how your employees can positively impact the business success
• how the improvement and success is measured
• how ongoing feedback from the employees is collected to fine tune the improvements
• why compliance to the new changes/processes is important
Explain
© 2015 ST3AM / Depositphotos.com
Activity
Input
Delivery
Legend
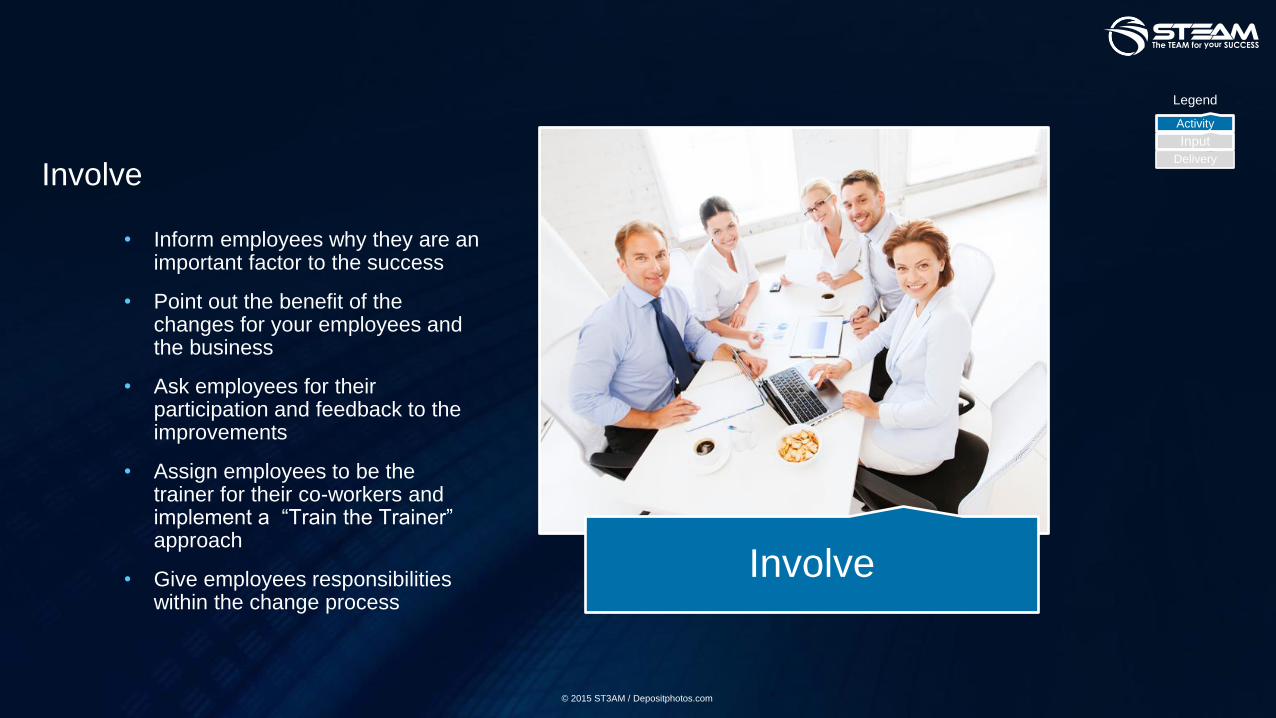
Involve
• Inform employees why they are an important factor to the success
• Point out the benefit of the changes for your employees and the business
• Ask employees for their participation and feedback to the improvements
• Assign employees to be the trainer for their co-workers and implement a “Train the Trainer” approach
• Give employees responsibilities within the change process
Involve
© 2015 ST3AM / Depositphotos.com
Activity
Input
Delivery
Legend

Motivate
• Create an award program
• Outline career opportunities
• Create competition program using “gamification” approach
• Create dashboards providing clear defined performance indicators, trend lines and actions
• Focus on the positive improvements and create success models to be used within areas with less improvements
• Encourage feedback from employees
Motivate
© 2015 ST3AM / Depositphotos.com
Activity
Input
Delivery
Legend

Inspire
• Setup an Idea-Lab cross organisations/departments for collaborations to share best practices, share knowledge, discuss and challenge
Inspire
© 2015 ST3AM / Depositphotos.com
Activity
Input
Delivery
Legend

Mind-Set
• “It is not the strongest of the species that survive, nor the most intelligent, but the one most responsive to change” Charles Darwin
• “To improve is to change; to be perfect is to change often” Winston Churchill
• „D x V x F > RD = Dissatisfaction with how things are now; V = Vision of what is possible; F = First, concrete steps that can be taken towards the vision; If the product of these three factors is greater than R = Resistance then change is possible. “.
Kathi Dannemiller (1980s) based on David Gleichers formula (1960s)
Mind-Set
© 2015 ST3AM / Depositphotos.com
Activity
Input
Delivery
Legend

Our approach together
Plan Execute Test Rollout
© 2015 ST3AM / Depositphotos.com
On-Going
PHASE 3Implementation based on Phase 1 and 2 Delivery
People Processes Data Sources
Monitor
Activity
Input
Delivery
Legend
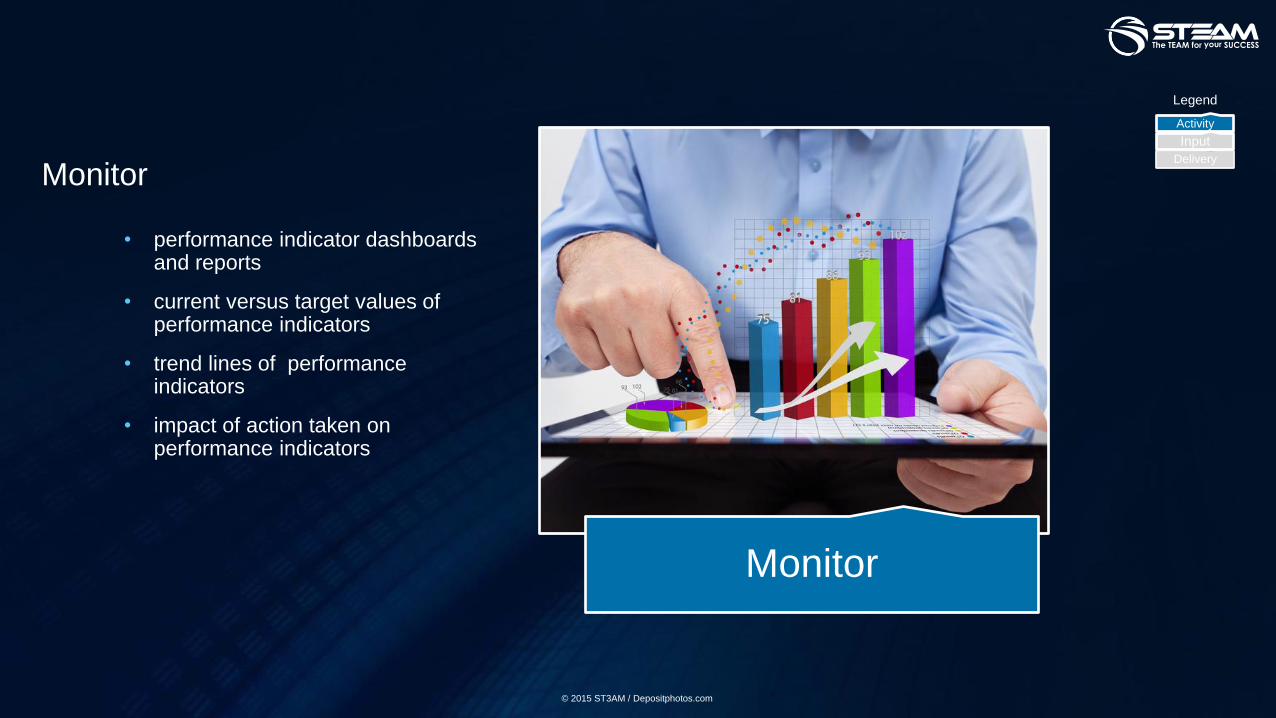
Monitor
• performance indicator dashboards and reports
• current versus target values of performance indicators
• trend lines of performance indicators
• impact of action taken on performance indicators
Monitor
© 2015 ST3AM / Depositphotos.com
Activity
Input
Delivery
Legend

How we work togetherA journey together for success
Presented by Ralf Fickert
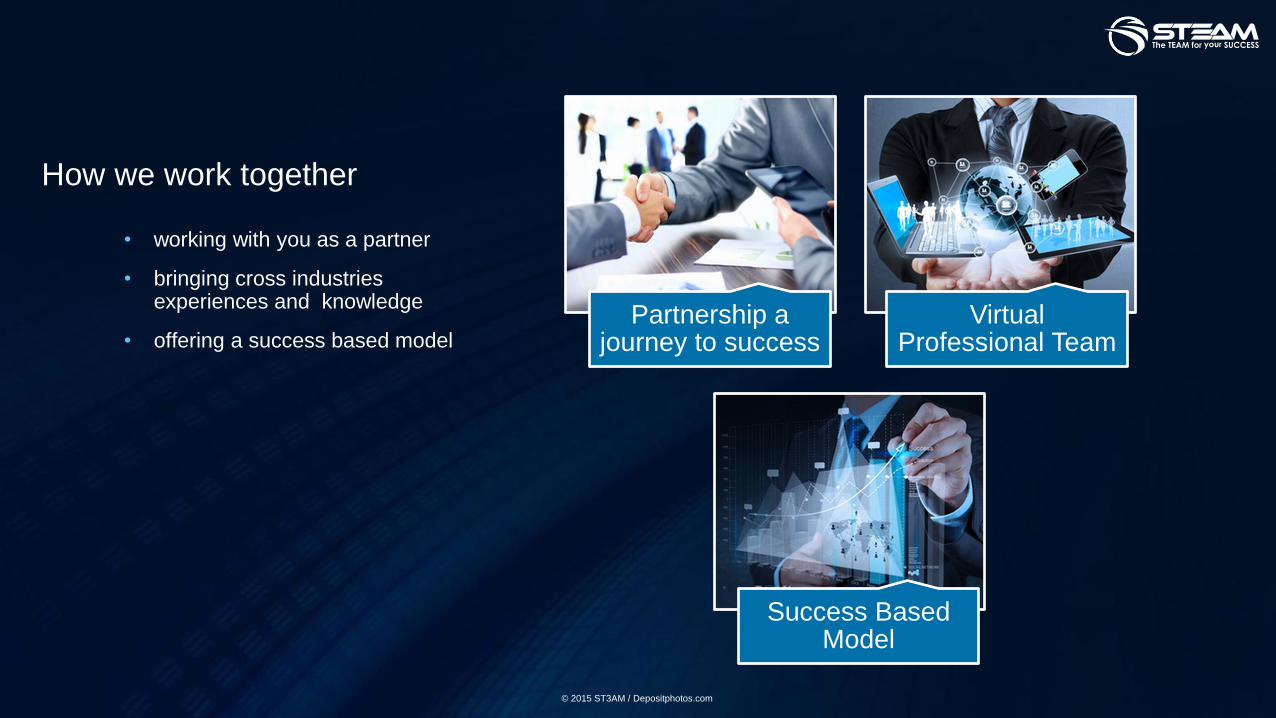
How we work together
• working with you as a partner
• bringing cross industries experiences and knowledge
• offering a success based modelPartnership a
journey to successVirtual
Professional Team
Success Based Model
© 2015 ST3AM / Depositphotos.com

© 2015 ST3AM / Depositphotos.com
Success driven
Win-Win driven
Cash flow driven
Success Based Model

Agree on how to measure our delivery
• What exactly does a successful delivery mean?
• How do we measure the success of the delivery?
• What are the expected cost savings and/or revenue growth related to the delivery?
Agree
© 2015 ST3AM / Depositphotos.com
Activity
Input
Delivery
Legend

Monitor
• Success of business optimisation delivery
• Cost savings / revenue growth based on business optimisation delivery
Monitor
© 2015 ST3AM / Depositphotos.com
Activity
Input
Delivery
Legend