St. Clair County Bike Share Feasibility Analysis · The Michigan State University practicum team...
87
St. Clair County Bike Share Feasibility Analysis Pam Brushaber Nash Clark Jacob Maurer Jonathan Sharp Source: Tevor Floyd, St. Clair County GIS 2013 Michigan State University Practicum for St. Clair County Metropolitan Planning Commission
Transcript of St. Clair County Bike Share Feasibility Analysis · The Michigan State University practicum team...

St. Clair County Bike Share Feasibility Analysis
Pam Brushaber Nash Clark
Jacob Maurer Jonathan Sharp
Source: Tevor Floyd, St. Clair County GIS
2013 Michigan State University Practicum
for
St. Clair County Metropolitan Planning Commission

ii
Table of Contents
Acknowledgements ............................................................................................................. vii
Preface ................................................................................................................................ viii
Executive Summary .............................................................................................................. ix
Purpose of the Plan ............................................................................................................. 10
Partnership with St. Clair County .............................................................................................. 10
Scope of Services ...................................................................................................................... 10
Purpose ..................................................................................................................................... 10
Strategy ..................................................................................................................................... 10
Method ..................................................................................................................................... 10
Bike Share ........................................................................................................................... 12
Evolution of Bike Share ............................................................................................................. 12
Benefits ..................................................................................................................................... 13
Social ..................................................................................................................................... 13
Economic ............................................................................................................................... 13
Transit ................................................................................................................................... 14
Environmental ....................................................................................................................... 15
Port Huron and St. Clair County Region ................................................................................ 16
Background ............................................................................................................................... 17
Non-motorized Trail Connections ............................................................................................. 19
Case Study Analysis ............................................................................................................. 22
Case Studies .............................................................................................................................. 22
Washington D.C. ................................................................................................................... 23
Minneapolis, Minnesota ....................................................................................................... 23
Salem, Massachusetts ........................................................................................................... 23
Spartanburg, South Carolina ................................................................................................. 24
Washington State University ................................................................................................ 25
Overview of System Elements .................................................................................................. 27
Comparison of Known Operating Models ................................................................................ 28

iii
Non-profit ............................................................................................................................. 28
Private ................................................................................................................................... 28
Public-Private Partnership .................................................................................................... 28
Program Expansion Strategies .................................................................................................. 29
Customer Fees and Payment Structures .................................................................................. 30
Funding ..................................................................................................................................... 31
Funding Sources .................................................................................................................... 32
Operating and Capital Costs ................................................................................................. 33
Liability and Insurance .............................................................................................................. 35
Summary of Case Study Analysis .............................................................................................. 36
Demand Analysis ................................................................................................................. 37
Anticipated Users ...................................................................................................................... 37
Market Analysis of St. Clair County ........................................................................................... 38
GIS Analysis ........................................................................................................................... 39
Population Density ............................................................................................................ 40
Job Density ........................................................................................................................ 41
Retail Density .................................................................................................................... 43
Community Indicators of Port Huron ................................................................................... 46
Bicycling Infrastructure ..................................................................................................... 46
Parks and Recreation Areas .............................................................................................. 48
Connection to Transit ........................................................................................................ 49
Colleges ............................................................................................................................. 51
Community and Tourist Attractions .................................................................................. 52
Tourism Population ........................................................................................................... 56
Income and Race ............................................................................................................... 57
Recreational Expenditures: Potential and Current ........................................................... 58
Alternative Commuters: Distances and Mode Share ........................................................ 58
Topography ....................................................................................................................... 59
Weather ............................................................................................................................ 59
Local Conditions and Opportunities ..................................................................................... 61
Local Policies & Regulations ...................................................................................................... 61
Public Outreach & Education .................................................................................................... 61
Placemaking, Economic Development, and Tourism ............................................................... 62

iv
Demand Thresholds ............................................................................................................. 63
Population Density ................................................................................................................ 65
Job Density ............................................................................................................................ 65
Retail Density ........................................................................................................................ 66
Bicycling Infrastructure ......................................................................................................... 66
Parks and Recreation ............................................................................................................ 66
Connection to Transit ........................................................................................................... 66
Colleges ................................................................................................................................. 67
Community and Tourist Attractions ..................................................................................... 67
Tourism Population ............................................................................................................... 67
Income .................................................................................................................................. 67
Recreational Expenditures: Potential and Current ............................................................... 68
Topography ........................................................................................................................... 68
Weather ................................................................................................................................ 68
Recommendations .............................................................................................................. 70
Station Location Analysis .......................................................................................................... 70
Community Surveys .................................................................................................................. 74
Bike Share Programmatic Summary ......................................................................................... 75
System ................................................................................................................................... 75
Bikes and Stations ................................................................................................................. 76
Financial feasibility ................................................................................................................ 76
Next Phases ........................................................................................................................... 78
Recommendations for Supporting Actions ............................................................................... 78
Conclusion ................................................................................................................................. 79
Bibliography ........................................................................................................................ 80

v
List of Figures
Figure 1: St. Clair County, Michigan .............................................................................................. 16
Figure 2: St. Clair County and City of Port Huron ......................................................................... 18
Figure 3: Bridge to Bay Trail - Port Huron, MI .............................................................................. 19
Figure 4: St. Clair County Overview Map ...................................................................................... 21
Figure 5: Spartanburg B-Cycle....................................................................................................... 24
Figure 6: Green Bike, Pullman, WA ............................................................................................... 25
Figure 7: St. Clair County Population Gradients ........................................................................... 40
Figure 8: St. Clair County Employment Gradients ........................................................................ 42
Figure 9: St. Clair County Retail Gradients .................................................................................... 43
Figure 10: Employment and Retail Gradients Port Huron ............................................................ 44
Figure 11: Population, Retail and Employment Gradients for Port Huron ................................... 45
Figure 12: St. Clair County Nonmotorized Facilities ..................................................................... 47
Figure 13: Bridge to Bay Trail Map and Port Huron Attractions ................................................... 48
Figure 14: Port Huron Transit Service ........................................................................................... 50
Figure 15: Location of New Blue Water Area Transit Center ....................................................... 51
Figure 16: Future Convention Center, North Port Huron ............................................................. 53
Figure 17: McMorran Place........................................................................................................... 53
Figure 18: Maritime Center .......................................................................................................... 54
Figure 19: Community and Tourist Attractions of Port Huron ..................................................... 55
Figure 20: Visitors to St Clair County ............................................................................................ 56
Figure 21: Average Monthly Weather in Port Huron ................................................................... 60
Figure 22: Potential Bike Share Location, Downtown Port Huron, MI ......................................... 71
Figure 23: Future Community and Tourist Attractions, Distance to Downtown ......................... 72
Figure 24: Blue Water Bridge, Port Huron, Michigan ................................................................... 79

vi
List of Tables
Table 1: Purpose, Strategy, & Method ......................................................................................... 11
Table 2: Comparable Communities Bike Share System Operations ............................................. 22
Table 3: Comparable Communities Operation Models ................................................................ 26
Table 4: User Fees of Comparable Communities .......................................................................... 31
Table 5: Funding Sources .............................................................................................................. 33
Table 6: Operating and Capital Costs ............................................................................................ 34
Table 7: Port Huron Household Income ....................................................................................... 57
Table 8: Demand Thresholds Compared by Case Studies to Port Huron ..................................... 64
Table 9: Demand Thresholds by Case Studies compared with Port Huron .................................. 69
Table 10: Bike Share Station Locations in Port Huron .................................................................. 75
Table 11: Sample Revenue Calculation ......................................................................................... 77
Table 12: Sample Operating Costs ................................................................................................ 77
Table 13: Sample Total Costs ........................................................................................................ 78

vii
Acknowledgements This project is supported in part pursuant to the receipt of financial assistance to the MSU Center for Community and Economic Development from the State of Michigan, Michigan State Housing Development Authority (MSHDA). The statements, findings, conclusions, and recommendations are solely those of the authors and do not necessarily reflect the views of any federal, state agency or Michigan State University.

viii
Preface Michigan State University’s Urban Planning Practicum is the capstone class required for students enrolled in the Urban and Regional Planning program. At the start of the course, projects are assigned according to each student’s preference, forming a partnership between a client and a small team of students. The partnership allows practicum students to manage outlined tasks, identify the problems, and form recommendations to address the issues. The class is designed to not only challenge the skills of each individual group member and his/her team, but also to give an opportunity to expand knowledge, develop planning skills and prepare for the professional world of planning.
ix
Executive Summary Bike share programs, similar to car sharing, are increasing throughout the U.S., after obtaining a reputation of success in Europe, as a sustainable, affordable and convenient transportation option. They are for short trips, providing ‘the last mile’ of a transit trip, and use branded bicycles strategically placed in urban areas. Advantages of bike share provide users and communities with social, economical, and environmental benefits. The St. Clair County Bike Share Feasibility Analysis was conducted to determine the feasibility of a bike share program in Port Huron, Michigan. A historical overview describes the character of the region, and identifies viable connections along the St. Clair River through non-motorized trails. Existing bike share programs were studied, specifically three with similar population size to Port Huron, to understand elements of bike share and provide comparison. Anticipated users were detailed, and from them a list of community indicators was compiled. A demand analysis details the breakdown of bike share users, bike share trips and the density of infrastructure within St. Clair County. A GIS analysis of population, job, and retail density shows Port Huron is the ideal location in St. Clair County. An analysis of community indicators details the local factors that will influence the effectiveness of bike sharing within the city. Local conditions and opportunities specify local policies, regulations, public outreach, placemaking, economic development and tourism initiatives that will have an impact on bike sharing in Port Huron. In addition to the demand analysis, a comparison of each case studies community indicators was detailed. Three case study communities, that have an operating bike share program, were analyzed for specific values for each community indicator. Each community indicator was given a threshold value, or minimum or maximum. It was then determined whether or not Port Huron ‘met criteria’ or ‘did not meet criteria’ currently, with existing conditions, for a bike share program. Port Huron ‘met criteria’ for 8 community indicators, out of 14, with 1 being undetermined. From the demand analysis and threshold values, a fourth generation bike share program is deemed feasible for Port Huron, MI, depending on size, future business plan and improvements made within the community. A phased-in approach is desirable, after financial and social sustainability of the existing program is seen, to include communities linked with bicycle infrastructure to Port Huron. At least two stations are recommended, with 11 docks, and 5 to 6 bikes a piece. A station location analysis and market analysis identified possible bicycle share station location areas in the downtown area, specifically at the Port Huron hospital and the St. Clair County Community College. A public-private partnership is recommended to fund and implement the system. The cost would be approximately $76k for capital costs, and $27k for maintenance. Other partnerships are needed to cut costs, and help the program be a sustainable, marketable, and financially successful program. The actual size of the system should be determined by the amount of secured funding and strength of partnerships. Supporting and facilitating actions are needed to further Port Huron as a ‘bikeable’ city, increasing ‘bike culture’. A business plan and financial feasibility study are further steps that need to be taken, as well as marketing and branding.

10
Purpose of the Plan The purpose of the St. Clair County Bike Share Feasibility Analysis is to determine whether the Port Huron area has the capacity to sustain and implement a successful bike share program. The county’s aim in creating a bike share program is grounded in placemaking; finding where the Port Huron area could take advantage of existing tourism and recreation infrastructure to provide a unique identity that people will associate with the region.
Partnership with St. Clair County “The St. Clair County Metropolitan Planning Commission works to make St. Clair County a better place to live, work and play. This mission is accomplished through comprehensive countywide planning programs that establish policies and plans to guide economic, physical, and social development” (St. Clair County, MI). The St. Clair County Metropolitan Planning Commission and Michigan State Planning practicum team have partnered together to research, identify, and propose recommendations regarding the feasibility of a bike share program in the county and, more specifically, the Port Huron region. Lindsay Wallace, senior transportation planner and direct contact for St. Clair County, and David Struck, executive director, have provided our team with immeasurable knowledge and a professional skill set.
Scope of Services The Michigan State University practicum team will prepare a written and visual report to the St. Clair County Metropolitan Planning Commission and the Michigan State University Urban Planning Practicum program. Our team will identify the purpose(s) followed by a set of strategies and then implement a method. Table 1 illustrates our method for pursuing each action in this bike share feasibility analysis:
Purpose Strategy Method
Find comparable size cities or municipalities that have
implemented bike share systems to assess lessons
learned
Examine the Nature and Scope of Bike Share Practice
Research bike share systems used in places of similar land /population size and level of
tourism
To properly distribute funds for the bike share system according to size and time
Examine Operations Analysis
Survey best practices, compare cost/fund structures,
recommend ownership, and recommend how to deal with
maintenance issues
To blend the ideal bike share locations with
locations of potential users
Identify Anticipated User Profiles
Research previous feasibility studies, rank users, create map identifying potential users and
ideal locations

11
Purpose Strategy Method
To discover the level of bicycle usage in the region
and identify high traffic areas
Calculate Demand Estimates Gather data through local bike
shops, non-profit groups, advocates, and the U.S. Census
To find best areas for the bike share system
Identify Community Indicators Use community indicators to
develop and gather GIS files for input
To determine if linkage between bike share and
transit systems can coexist Assess Connection to Transit
Research transit routes, stops, and bike trails. Report usage to
illustrate appropriate transit routes
To locate policies and regulations that could promote the St. Clair
County bike share systems and bike lanes
Assess Local Policies & Regulations
Examine policies such as bike riding/parking, curb space
management and complete streets ordinances in target area
Find interest groups, companies or non-profits
who may support and advocate for the bike share
system
Outline Public Outreach & Education
Contact various organizations or institutions such as the local hospital, community college,
and visitors bureau
To determine ideal locations for placement of
bike share kiosks Station Location Analysis
Calculate highest scoring areas according to indicators and
demand estimates
To accumulate all research and data involved to reach
overall conclusion
Make Informed Recommendations Based on
Analysis
Summarize the programmatic, policy, implementation, and
supporting actions
Table 1: Purpose, Strategy, & Method

12
Bike Share
Bike sharing is a sustainable and environmentally friendly transportation alternative that targets daily mobility by providing short-term bicycle rentals. Bike sharing programs allow users to access bicycles on an “as-needed” basis. Programs are commonly concentrated in urban settings and provide multiple bike station locations that enable users to pick up and return bicycles to different stations (i.e. kiosk). They operate via unattended bike stations where bicycle reservations, pick-up, and drop-off are self-service. Bike share user fees typically cover bicycle purchase and maintenance costs, as well as storage and parking responsibilities similar to car-sharing or short-term auto use (TSRC). The kiosk, attached to the bike station, is the electronic operating system that facilitates the transaction and provision of information per station. Kiosks serve the following functions:
Unlock in response to member keys and credit cards
Provide a secure locking point to deter theft
Transmit usage and billing information
Identify a known place to find bikes (by users or the bike sharing agency)
Advertise for the system and other commercial sponsors (Caywood, 2012).
Evolution of Bike Share There have been three generations of bike-sharing programs with a proposed fourth generation in the making. The first generation, in 1965, began in Amsterdam where ordinary bikes, painted white, were provided for public use (DeMaio, Paul, 2009). The main features included free use with distinguished style and color. Unfortunately, the program collapsed because of theft and vandalism. In 1995 the first large-scale, second generation bike-sharing program was launched in Copenhagen. This generation embraced the idea of check-out deposit and locking mechanisms. While these bikes were designed for more of an intense utilitarian use, the bikes still experienced theft due to the anonymity of the user (DeMaio, 2009).
”Technological advancements in the mid-to late-90s paved the way for the modern bike share system, also known as “third generation” programs. These consisted of bicycle parking stations with kiosks that leverage electric card-reading technology” (Seattle Bike Share Feasibility Study,
13
p. vii). As cities gradually adopted the bike share concept into their master and non-motorized plans, the bike share system grew in popularity and feasibility. Outside Europe, bike-sharing finally began to take hold in 2008, with new programs in Brazil, Chile, China, New Zealand, South Korea, Taiwan, and the U.S (Seattle Bike Share Feasibility Study, p. vii). In the next few years we will likely see the emergence of the fourth generation with much improved efficiency. “Fourth Generation” includes GPS, modular kiosks and mobile device applications (Cincinatti Bike Share Feasibility, p. 4). The bike share system can operate with a station (B-cycle) or as a stationless self sufficient bike (SOBI or social bicycle or ViaBicycke). It will use components such as solar power and wireless communication as opposed to requiring hardwired installation (Cincinnati Bike Share Feasibility Study, 2012). The next generation could enhance the versatility of modular stations allowing for future expansion, reduction, or relocation. Expansion of bike share kiosks is an option if the system is proven financially sustainable, otherwise reduction may occur. If initial recommended station locations are not viable, relocation is an affordable solution in 4th generation bike share systems.
Benefits The bike share system can benefit a community in various ways. People who use the system will have many reasons to use bike sharing, whether it is for riding the last mile to work, enjoying non-motorized trails, increasing physical activity, or for any other purpose. We believe the types of benefits a community may receive can be divided into four major categories: social, economic, transit, and environmental. With additional focus, these major categories can encompass a wide range of benefits including quality of life improvement, active lifestyles, employment opportunities, increased business in the downtown, additional advertisement, improved connectivity, and reduced carbon footprint.
Social Bike-sharing programs tend to introduce new people to bicycling, enhance social interactions and make bicycling a part of people’s lives that may have never had the chance to participate before. Thus, bike-sharing programs offer significant options for improvements in personal health and quality of life. If individuals are consistent and regularly bike to their destinations, the positive health effects can lead to reduction in obesity and promotion of active lifestyles (Bike Sharing Research in the U.S., 2013). In some communities in the United States, the expansion of their current bike share infrastructure to low-income neighborhoods helps target chronic obesity. An initiative by the U.S. Center for Disease Control and Prevention (CDC) in Minneapolis, MN, titled “Communities Putting Prevention to Work,” identified that recently their bike share program has added eight new kiosks in North Minneapolis, located in underserved areas of the city (Communities Putting Prevention to Work, 2010). This expansion has led to a tremendous increase in ridership over the course of only a few months.
Economic The location of the bike station and kiosk will prove to be an important decision that in more ways than one will affect the local economy. Bicycle sharing spurs economic development by increasing access and exposure to local businesses and employment opportunities. A 2011 member survey conducted by LDA Consultants on Washington DC’s Capital Bikeshare program reported that almost half of survey respondents made a trip in the past month that they would

14
not have made without the bike share program. Half of the survey respondents used the bike share program for non-work purposes including social and entertainment trips and personal errand and appointment trips, while 40 percent of respondents used the program to get to and from work (Monterey County Draft Bicycle Sharing Feasibility and Implementation Plan, 2012, pp. 72). This is a great example of why the support of the business community and major area employers are highly important to the success of bike sharing. The members of Capital Bikeshare that chose to make that additional trip are spending money that normally wouldn’t enter the local economy. Minneapolis NiceRide users spend an average of $7-$14 during each bike share trip (Schoner, 2012). A recent study estimates cyclists spend nearly $40 per person per season (30-week period) in additional retail purchases at businesses in close proximity to bicycle sharing stations (Monterey County Draft Bicycle Sharing Feasibility and Implementation Plan, 2012, pp. 72). If businesses notice that the local bike share participation begins to increase sales, it makes sense that sponsorships and partnerships will form between businesses and bike share operators. For cities, the GPS systems with bike share can be used as an evaluation tool, by tracking the number and location of riders. Current small businesses in Minneapolis's downtown retail area actively support the local bicycle sharing program “because it's an economic development tool [and] it gets people to come out to lunch from office towers a mile away." Simply bicycling increases exposure to their storefronts and retail businesses (Monterey County Draft Bicycle Sharing Feasibility and Implementation Plan, 2012, pp. 72-73). An increase in bike usage results in a virtuous cycle, simply by its nature of mobile self-advertisement.
Transit The locating of bike share systems in urban settings can and will benefit both the region and the user. As mentioned in University of Washington’s Seattle Bike Share feasibility study, the transportation benefits can be divided into the following two general categories (Monterey County Draft Bicycle Sharing Feasibility and Implementation Plan, 2012, pp. 72-73):
City/Region
o Is less expensive to purchase and maintain than other modes (rail, bus, auto)
o Allows low-cost expansion of existing transportation services o Promotes greater transit use through modal integration and does not add
to congestion o Requires less infrastructure investment than other modes
User/Society
o Provides low-cost, on-demand transportation o Serves as the “final mile” of commute (within a city) o More bicycles on the road increases the safety of other cyclists o Makes a city more livable and neighborly
A safe and reliable form of transportation by something more than the traditional car or bus will allow for a connection to a greater portion of a region or county. A limit is when the bike share systems could not serve all populations such as younger children who are not tall enough to participate, the elderly, or the disabled. Depending if the proper bicycling infrastructure was in place, the potential drawbacks to the bike share system could include an increase in
15
bicycle/vehicle accidents. However, the Journal of the Transportation Research states that bike share provides safe and convenient access to bicycles for short trips, increases the visibility of cycling, and increases mode share of cycling (Shaheen, et. al, 2010). Bike sharing may be a strong asset to a region or city that is strong in tourism, providing an additional form of transportation to the many community attractions.
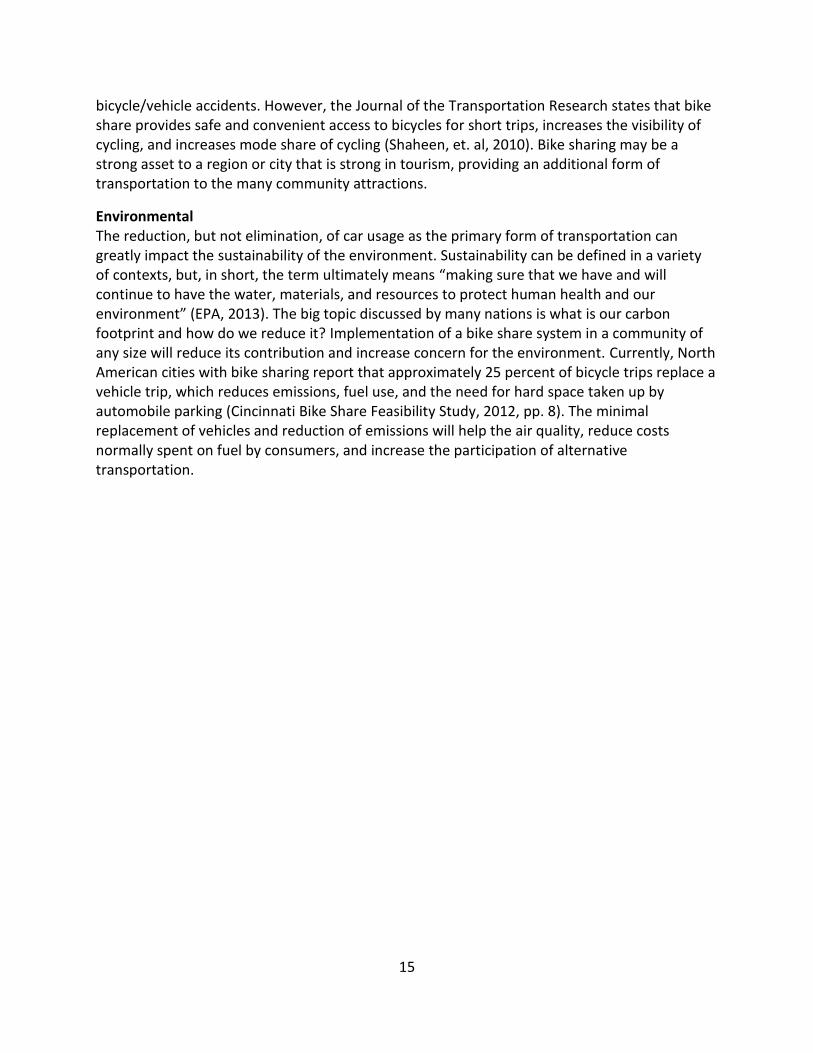
Environmental The reduction, but not elimination, of car usage as the primary form of transportation can greatly impact the sustainability of the environment. Sustainability can be defined in a variety of contexts, but, in short, the term ultimately means “making sure that we have and will continue to have the water, materials, and resources to protect human health and our environment” (EPA, 2013). The big topic discussed by many nations is what is our carbon footprint and how do we reduce it? Implementation of a bike share system in a community of any size will reduce its contribution and increase concern for the environment. Currently, North American cities with bike sharing report that approximately 25 percent of bicycle trips replace a vehicle trip, which reduces emissions, fuel use, and the need for hard space taken up by automobile parking (Cincinnati Bike Share Feasibility Study, 2012, pp. 8). The minimal replacement of vehicles and reduction of emissions will help the air quality, reduce costs normally spent on fuel by consumers, and increase the participation of alternative transportation.

16
Port Huron and St. Clair County Region The study area is located in St. Clair County, the easternmost county in Michigan (see Figure 2). Its eastern boundary is the international border of Canada, formed by the St. Clair River and Lake Huron (St. Clair County Master Recreation Plan, 2009, pp. 8). It is one of seven counties surrounding the Detroit metropolitan area and encompasses a land area of 724 square miles (2035 Long Range Transportation Plan, pp. 1). The U.S. Census Bureau states the population of St. Clair County in 2010 was 163,040, with 63,841 households and 44,238 families (U.S. Census Bureau).
St. Clair County, MI (Michigan Prosecutor)
Figure 1: St. Clair County, Michigan Due to job density, population, and geographic location, the St. Clair County Metropolitan Planning Commission desires to focus the study on the City of Port Huron, MI. Geographically, the city is located on the eastern edge of St. Clair County and is the most populated city in the county (see Figure 1). The City of Port Huron encompasses 8.0 square miles and 5,120 acres of land within its corporate city limits and more than 3,544 acres of waterways (City of Port Huron). Further on in the report you will learn that the top five employers in St. Clair County are located in Port Huron-- hence the large amount of employment and residents. According to the U.S. Census Bureau, the population of Port Huron in 2010 was 30,184, with 12,177 households and 7,311 families (U.S. Census Bureau). Connecting the City of Port Huron and St. Clair County to Sarnia, Canada is the Blue Water Bridge. The Blue Water Bridge is a major international crossing over the St. Clair River at the southern end of Lake Huron (Michigan.gov/mdot) (see Figure 2). As outlined in the Economic Study of the Blue Water Area, the bridge brings heavy freight traffic across the border as well as tourism and many other benefits (Border Economic Impact, 2009), including:
Culturally enhanced economy due to interactions with Canadian culture
Higher-skilled labor with a larger labor pool and diverse skill sets
Prime location for international trade and transportation business
New infrastructure such as roads, bridges and plazas reducing travel costs

17
Background The City of Port Huron and St. Clair County share a distinctive history that has shaped who they are today. The industries, communities, and people that have located to the county and city have prospered through the years, positioned adjacent to the expansive freshwater trading routes of the Great Lakes. St. Clair County’s 2030 Master Plan states that the area’s recorded history began in 1679 when an expedition led by French explorers Robert Cavelier de La Salle and Pére Louis Hennepin navigated what later became known as the St. Clair River. As a result of their exploits, the French claimed ownership of vast lands surrounding the Great Lakes and soon established missions and trading posts in the region (St. Clair County 2030 Master Plan, 2009, pp. 8). It was not until after the Revolutionary War that American settlers moved into what is now known as St. Clair County, and soon to follow were the construction of small settlements along the St. Clair River. In 1820 Lewis Cass, governor of the Northwest Territory, declared the area to be St. Clair County, named after the county’s first and largest village. In 1857 Port Huron became a city and by 1870 it was the largest community in the county. Its industries included seven sawmills, four shipyards, three breweries, two dry docks, and a soap factory (St. Clair County 2030 Master Plan, 2009, pp. 8). As years passed, technology increased and the way in which people made a living changed. The size of towns and cities fluctuated through the years and the way families supported themselves. People measured quality of life on availability of schools, streets, waste removal systems, safe drinking water, hospitals, and police and fire protection (St. Clair County 2030 Master Plan, 2009, pp. 10). It was these changes in technology, employment, and vision of quality of life that has allowed the City of Port Huron (see Figure 2) to become the largest city in the County and hold four of the top five employers for all of St. Clair County, MI. In 2010, the Economic Development Alliance of St. Clair County listed the top five employers as Port Huron Hospital, Port Huron Area School District, St. Clair County Government, DTE, and Mercy Hospital, respectively (Economic Development Alliance of St. Clair County, 2010).

18
Source: (MDOT: Statewide Modal Unit, 2013)
Figure 2: St. Clair County and City of Port Huron

19
Non-motorized Trail Connections St. Clair County encompasses a network of non-motorized facilities that are crucial to a bike share program’s feasibility. The first portion of the network is the 54-mile Bridge to Bay Trail (see Figure 3) that follows the St. Clair River and Lake Huron, running directly on the Port Huron’s freshwater boardwalk. The second portion is the Wadhams to Avoca Trail that runs along the rail line, owned and maintained by the county. Furthermore, the St. Clair County 2035 Long Range Transportation Plan displays planned improvements to these and other non-motorized trails, that are already made up of a combination of side paths, paved shoulders, and rail-trail segments, connecting the communities along the trails for walkers, joggers, strollers, and bicyclists of all ages (St. Clair County 2035 Long Range Transportation Plan, 2009, pp. 49). If the County can accommodate all modes of travel through the proper planning and preparation of locations that need additional focus, citizens will benefit and neighboring communities could see the expansion of this bike share if successful.
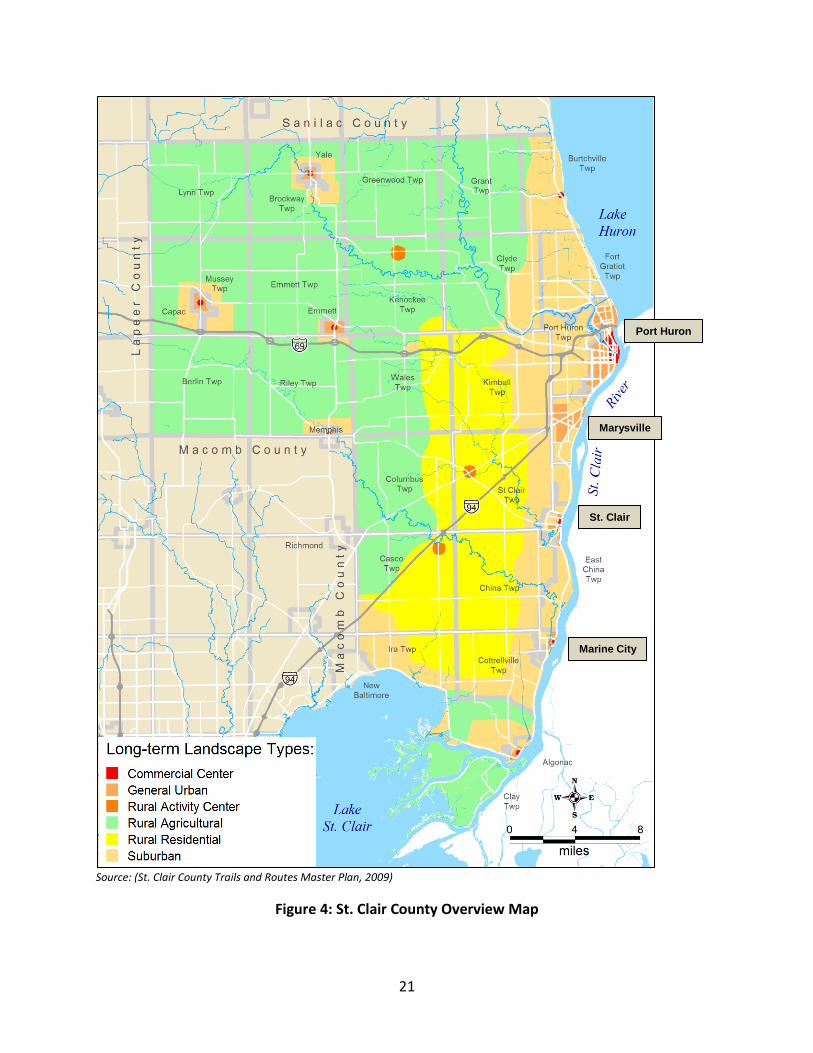
Linkages between the City of Port Huron and neighboring communities are essential to a bike share system and health of the community, and will also allow for the St. Clair County communities to attract an increased amount of visiting tourists. Further on in this study, additional focus will be applied toward the red commercial centers examining the key linkages between cities (see Figure 4). The St. Clair County communities that we believe will have an important linkage and correct proximity to the City of Port Huron and a bike share system include Marine City, City of Marysville, and the City of St. Clair. All three cities are located along the St. Clair River, connected with the Bridge to Bay Trail, and have a noteworthy population within the county. According to the 2010 U.S. Census, the City of Marysville had a population of 9,959 residents. It is located approximately six miles south of Port Huron. The City of St. Clair
Source: St. Clair County Metropolitan Planning Commission
Figure 3: Bridge to Bay Trail - Port Huron, MI

20
accounted for 5,485 residents, and is located approximately twelve miles south of Port Huron. Marine City, which is also positioned along the St. Clair River, is approximately nineteen miles south of Port Huron. This city recorded a population of 4,248 residents in 2010 (U.S. Census, 2010). In addition to the three Michigan communities listed above, Sarnia, Ontario, is another city located along the St. Clair River across from the City of Port Huron but separated by the international border. Sarnia already holds practical linkages to St. Clair County and its non-motorized trail via the Blue Water Bridge. With a respectable population of 84,163 residents in 2012, it would be wise of Port Huron to consider attracting more Sarnia residents to increase tourism profits within the city (Demographic and Income Profile, 2010). A bike share program overall will depend on connectivity of the biking facilities, as well as the densely populated communities in correct proximity.
21
Source: (St. Clair County Trails and Routes Master Plan, 2009)
Figure 4: St. Clair County Overview Map
Marysville
St. Clair
Marine City
Port Huron

22
Case Study Analysis Five case studies were identified; three of them (Spartanburg, SC, Greenbike or Washington State University’s in Pullman, WA and Salem Spins in Salem, MA) were based on similar population as Port Huron. An overview of system elements is given, as well as a comparison of known operating models for bike share. Most programs have used expansion strategies which are detailed below. These would include costs, therefore a description of fees and payment structures, and funding is also given below, with sources, and operating and capital costs described per systems. Finally, a description of liability and insurance concerns for communities operating bike share is given.
Case Studies The majority of programs were found in big cities. Two nationally recognized programs are Capital Bikeshare in Washington, D.C. and Nice Ride in Minneapolis. Port Huron, however, has a population of about 40,000 residents (Profile of General Population and Housing Characteristics, 2010). This study sought to compare bike share programs of a smaller scale with a similar population as Port Huron; although principles from these two successful bike share programs will be analyzed as well. The three small town bike share programs that were chosen are Salem Spins, a program in Salem, Massachusetts, Spartanburg B-cycle of Spartanburg, South Carolina, and Washington State University’s Greenbike program in Pullman, Washington. A comparison between these five programs’ operations is available in Table 2.
Program Number of bikes
Number of
stations
Population Ownership Trips per year
Number of
members
Salem Spins (Elie, Jeff. Personal Communication. January 15, 2013.)
20 2 41,000 City of Salem
~ 2,000 N/A
Spartanburg B-cycle (Spartanburg B-Cycle, 2013)
15 2 37,000 Partners for Active Living
~ 3,700 450
Greenbike (WSU, 2013) 120 9 28,300 University ~ 17,000 10,000
Capital Bike Share (CapitalBikeshare, 2013)
1670 175 5 million Public-Private Partnership
~1.8 million
220,000
Nice Ride MN (Nice Ride Minnesota, 2013)
1325 145 3.6 million Non-profit ~275,000 N/A
Table 2: Comparable Communities Bike Share System Operations

23
Port Huron is a less populated community than Washington D.C. and Minneapolis. As these two cities are larger though, more information is available to help understand functions of successful bike share programs. Therefore, main concepts will be taken from the large bike share programs to see how they may be helpful for a smaller bike share program.
Washington D.C. Washington D.C. is the capitol of the nation and the metropolitan region is home to over 5 million residents. Their bike share program, Capital Bikeshare, got its start in September 2010 and now contains over 175 stations and 1670 bikes (CapitalBikeshare, 2013). The program in 2013 has more than 30,000 annual members and has had 225,000 purchases for a 24-hour pass. The original cost of the program was $5 million for 100 stations and the yearly upkeep is $2.3 million which is paid for upfront by the city (Kaplan, 2010). Annually, the program recoups roughly half the costs through rider fees. The city is considering placing advertisements on the bikes or station kiosks to aid with funding. The city expects to receive $1 million annually from advertisements alone, which will help with costs greatly (Weir, 2012). The stations are powered by solar panels so they can be placed anywhere in the city (CapitalBikeshare, 2013). The program has been immensely successful and has expanded to neighboring cities such as Arlington and Alexandria and is now looking to expand into Maryland’s Montgomery County (CapitalBikeshare, 2013). The program has also been successful in terms of safety; the accident rate is 80% lower for Capital Bikeshare users as opposed to other cyclists. Riders are not required to use a helmet unless they are under the age of 16, which is actually a law of the District of Columbia (Burnham, 2012).
Minneapolis, Minnesota Minneapolis and St. Paul, Minnesota, commonly known as the twin cities are home to 3.6 million residents. Their bike share program, Nice Ride, is a seasonally operated program that got its start in June 2010. The program relied on a variety of funders including Blue Cross Blue Shield and the Federal Highway Administration. The program is operated by a non-profit called Nice Ride Minnesota, whose board first convened in 2009. Start up costs for the program was $3.1 million for 65 stations and 700 bikes. Yearly upkeep costs for the first three years of operation have averaged just above $700,000 (Nice Ride Minnesota, 2013). Nice Ride currently has 145 stations and 1,325 bikes, which are in operation from April until November. In 2012 there were over 250,000 rides taken, which is 50,000 more trips than in 2011. Blue Cross Blue Shield has provided 10,000 helmets thus far for the program, which are distributed at various giveaways across the city during the operational season (Nice Ride Minnesota, 2013).
Salem, Massachusetts Salem, Massachusetts, is an historical city of 41,000 residents, and is located on the East Coast. Salem Spins, their bike share program, began in September 2011 after the city was awarded $25,000 from the Green Communities grant program. The money went toward purchasing of bikes. Salem Spins currently has two stations located approximately 1.6 miles apart; one is located at Salem State University and the other is located at the Hawthorne Hotel. Riders must be at least 18 years of age and must also sign a liability form stating that the city is not responsible for any damage that may occur while riding. The cost is free, but riders are required to leave a credit card with an attendant while they are riding to protect against stolen
24
or damaged bikes. This system has no kiosks. A user can check a bike out from a desk at the Salem State University Police Station or from the front desk at the Hawthorne Hotel. The bikes are required to be back at a certain time depending on which location it was checked out from and are not allowed to leave the city limits. As for what bikes are used, Salem Cycle, a local bike shop was selected from a bidding process to supply the bikes and to also do any routine maintenance. Originally, the city paid $300 per bike for 26 bikes and paid Salem Cycle $2,500 for one year of upkeep and program operations. Salem Spins closes every year from November until March because of acclimate weather. There is no released data about how many rides a day the program has, but based on information from Jeff Elie, the planning director in Salem, there is an average of 8 bikes checked out a day from Salem Spins. From this estimate, there are about 2,000 rides taken every year. The bikes have three gears, and the stations have maps and helmets available to riders (Elie, Jeff. Personal Communication. January 15, 2013).
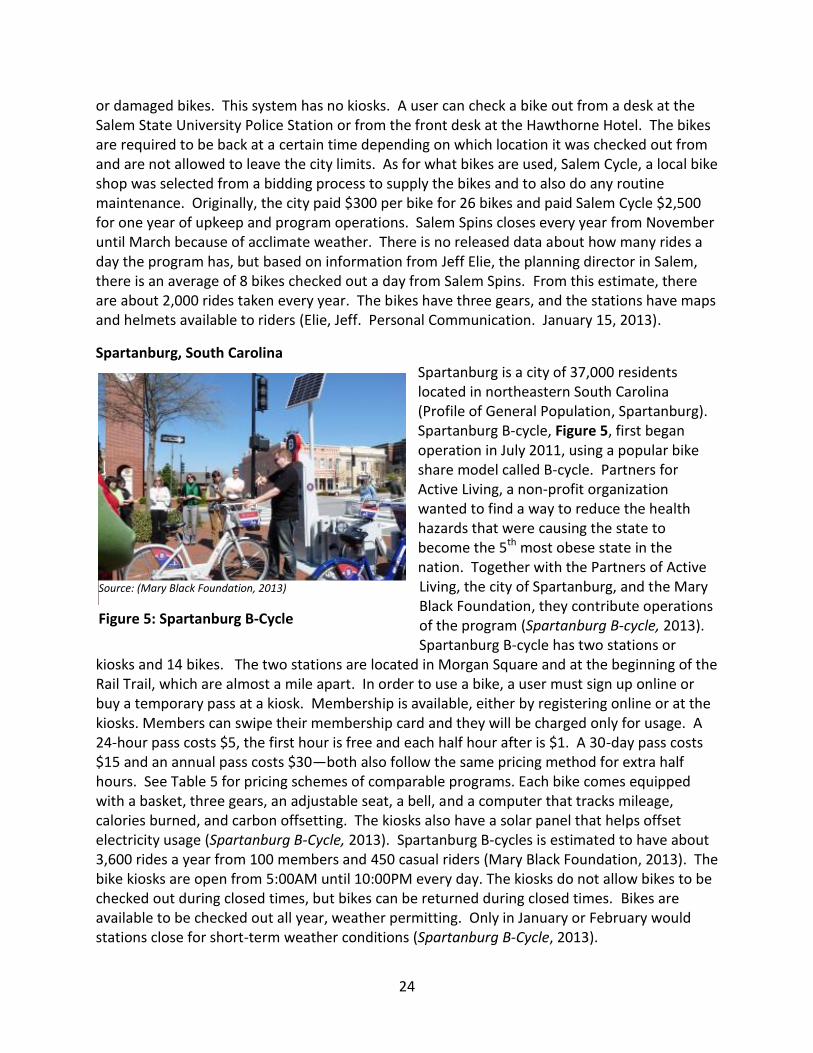
Spartanburg, South Carolina Spartanburg is a city of 37,000 residents located in northeastern South Carolina (Profile of General Population, Spartanburg). Spartanburg B-cycle, Figure 5, first began operation in July 2011, using a popular bike share model called B-cycle. Partners for Active Living, a non-profit organization wanted to find a way to reduce the health hazards that were causing the state to become the 5th most obese state in the nation. Together with the Partners of Active Living, the city of Spartanburg, and the Mary Black Foundation, they contribute operations of the program (Spartanburg B-cycle, 2013). Spartanburg B-cycle has two stations or
kiosks and 14 bikes. The two stations are located in Morgan Square and at the beginning of the Rail Trail, which are almost a mile apart. In order to use a bike, a user must sign up online or buy a temporary pass at a kiosk. Membership is available, either by registering online or at the kiosks. Members can swipe their membership card and they will be charged only for usage. A 24-hour pass costs $5, the first hour is free and each half hour after is $1. A 30-day pass costs $15 and an annual pass costs $30—both also follow the same pricing method for extra half hours. See Table 5 for pricing schemes of comparable programs. Each bike comes equipped with a basket, three gears, an adjustable seat, a bell, and a computer that tracks mileage, calories burned, and carbon offsetting. The kiosks also have a solar panel that helps offset electricity usage (Spartanburg B-Cycle, 2013). Spartanburg B-cycles is estimated to have about 3,600 rides a year from 100 members and 450 casual riders (Mary Black Foundation, 2013). The bike kiosks are open from 5:00AM until 10:00PM every day. The kiosks do not allow bikes to be checked out during closed times, but bikes can be returned during closed times. Bikes are available to be checked out all year, weather permitting. Only in January or February would stations close for short-term weather conditions (Spartanburg B-Cycle, 2013).
Source: (Mary Black Foundation, 2013)
Figure 5: Spartanburg B-Cycle
25
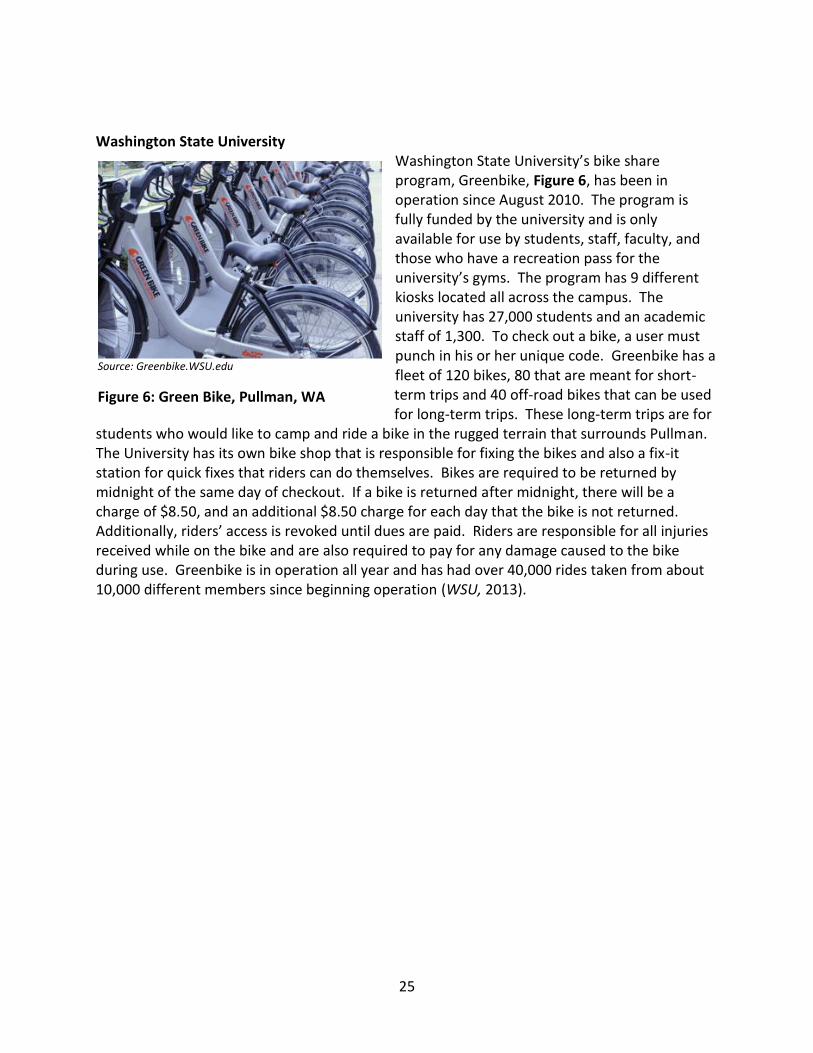
Washington State University Washington State University’s bike share program, Greenbike, Figure 6, has been in operation since August 2010. The program is fully funded by the university and is only available for use by students, staff, faculty, and those who have a recreation pass for the university’s gyms. The program has 9 different kiosks located all across the campus. The university has 27,000 students and an academic staff of 1,300. To check out a bike, a user must punch in his or her unique code. Greenbike has a fleet of 120 bikes, 80 that are meant for short-term trips and 40 off-road bikes that can be used for long-term trips. These long-term trips are for
students who would like to camp and ride a bike in the rugged terrain that surrounds Pullman. The University has its own bike shop that is responsible for fixing the bikes and also a fix-it station for quick fixes that riders can do themselves. Bikes are required to be returned by midnight of the same day of checkout. If a bike is returned after midnight, there will be a charge of $8.50, and an additional $8.50 charge for each day that the bike is not returned. Additionally, riders’ access is revoked until dues are paid. Riders are responsible for all injuries received while on the bike and are also required to pay for any damage caused to the bike during use. Greenbike is in operation all year and has had over 40,000 rides taken from about 10,000 different members since beginning operation (WSU, 2013).
Source: Greenbike.WSU.edu
Figure 6: Green Bike, Pullman, WA

26
A comparison between these three programs operations is available in Table 3.
Program
Number of bikes
Year began
Hours of operations
Initial Funding Maintenance Penalties Method of Operation
Phases
Salem Spins (Elie, Jeff. Personal Communication. January 15, 2013)
20 2011 8am-6:30pm at hotel, 9am-3pm at University
$30,000 Grant, Salem State University, City of Salem
Shuman’s Shop Credit card left with attendant
Non-profit No additions yet
Spartanburg B-cycle (Spartanburg B-Cycle, 2013)
15 2011 5am-10pm Mary Black Foundation, City of Spartanburg
Partners for Active Living
Charged to credit card
Pubilc-private Partnership
No additions yet
Greenbike (WSU, 2013)
120 2010 5:30-12am Washington State University
Washington State University Bike Store
Students account billed
Private Originally-40 bikes Currently-120 bikes
Capital Bike Share (Capital Bikeshare, 2013)
1670 2010 24 hours, 7 days a week
Counties, Federal Highway Administration, Virginia Department of Rail and Public Transportation
Capital Bike Share
Charged to credit card
Public-private Partnership
Originally-400 bikes Currently- 1670
Nice Ride MN (Nice Rider Minnesota, 2013)
1325 2010 24 hours, 7 days a week
Blue Cross Blue Shield, Federal Highway Administration
Nice Ride MN Charged to credit card
Non-profit Originally-700 bikes Currently- 1325 bikes
Table 3: Comparable Communities Operation Models

27
There are vast differences between Washington, D.C. and Minneapolis’ programs compared to Spartanburg, Salem, and Pullman’s programs. Most clearly, sheer size is the first difference noted among all the programs. This goes without explanation, as Washington D.C. and Minneapolis are so much larger than the other cities. Next, the smaller programs tend to have shorter daily operations. This is because in large cities there are more things to do at all hours of the day compared to the three smaller community’s programs. Along with this, the bigger programs receive more bureaucratic and nationally recognized organizational funding. Since these programs are bigger they receive more publicity, and therefore more funding. Two ideas that are more uniform across program size are the reliance on credit cards and the public-private partnership. Credit cards are a crucial aspect to bike share programs across program sizes because there needs to be someone responsible to pay for any damages to the bikes. The fines linked to these damages ensure user accountability. Furthermore, Spartanburg, Washington, D.C., and Minneapolis all use a public-private partnership for their method of operation. This has worked well for these programs as there is a specialized non-profit group that will be in charge of handling the relations with the private bike share company.
Overview of System Elements Bike share programs use different methods for each of their systems. The operating model, or ‘generation’, is the largest difference in bike share programs. Technology is the basis of the differences. Many modern bike share programs opt to include a computer in their bicycles so they can track stolen bicycles, usage, and mileage, as well as when the bikes are being used and by whom. All of this data would allow the company or program owner to better understand the users so in the future they can make decisions that would better suit the system and capitalize on potential revenue. An important component of 3rd generation bike share is the kiosks, which holds the bikes not in use. Kiosks are where subscriptions can be purchased, generally for short-term use only. Members must pay with a credit card so any damages that are received while being ridden can be incurred on the user responsible (Monterey County Draft Bicycle Sharing Feasibility and Implementation Plan, 2012). If users are long-term subscribers then they can bring their key with a microchip or they can punch in the code that was mailed to them. Another component of the kiosks is the lock mechanism, which ensures that bikes are not taken without payment. Kiosks generally only can hold 10-20 bicycles at a time. If a station is full then the user will have to return the bike to an alternative station where there is an available dock (Monterey County Draft Bicycle Sharing Feasibility and Implementation Plan, 2012). If a user has a smart phone they will be able to download the application that the program uses to see where there is an available dock or how many bikes are available at a station. Greenbike, Capital Bikeshare, and Nice Ride all use this application (Alta Planning + Design, 2012). Another element of bike share kiosks is that many have solar panels so they do not have to be plugged in constantly. Capital Bikeshare has solar panels on their kiosks, which helps conserve energy and increases their independence on connectedness to the grid (Capital Bikeshare, 2013). Kiosks contain pricing, purchase information, maps for tourists, and sometimes suggestions on how to travel safely around the city on a bike.
28
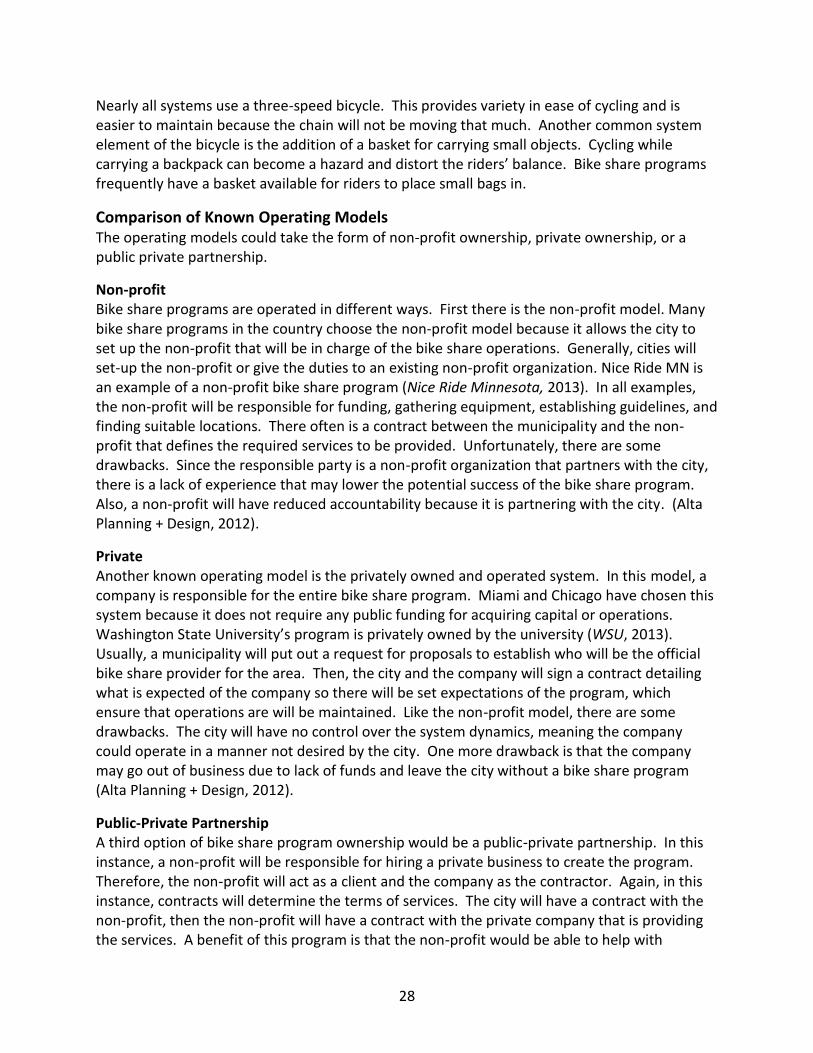
Nearly all systems use a three-speed bicycle. This provides variety in ease of cycling and is easier to maintain because the chain will not be moving that much. Another common system element of the bicycle is the addition of a basket for carrying small objects. Cycling while carrying a backpack can become a hazard and distort the riders’ balance. Bike share programs frequently have a basket available for riders to place small bags in.
Comparison of Known Operating Models The operating models could take the form of non-profit ownership, private ownership, or a public private partnership.
Non-profit Bike share programs are operated in different ways. First there is the non-profit model. Many bike share programs in the country choose the non-profit model because it allows the city to set up the non-profit that will be in charge of the bike share operations. Generally, cities will set-up the non-profit or give the duties to an existing non-profit organization. Nice Ride MN is an example of a non-profit bike share program (Nice Ride Minnesota, 2013). In all examples, the non-profit will be responsible for funding, gathering equipment, establishing guidelines, and finding suitable locations. There often is a contract between the municipality and the non-profit that defines the required services to be provided. Unfortunately, there are some drawbacks. Since the responsible party is a non-profit organization that partners with the city, there is a lack of experience that may lower the potential success of the bike share program. Also, a non-profit will have reduced accountability because it is partnering with the city. (Alta Planning + Design, 2012).
Private Another known operating model is the privately owned and operated system. In this model, a company is responsible for the entire bike share program. Miami and Chicago have chosen this system because it does not require any public funding for acquiring capital or operations. Washington State University’s program is privately owned by the university (WSU, 2013). Usually, a municipality will put out a request for proposals to establish who will be the official bike share provider for the area. Then, the city and the company will sign a contract detailing what is expected of the company so there will be set expectations of the program, which ensure that operations are will be maintained. Like the non-profit model, there are some drawbacks. The city will have no control over the system dynamics, meaning the company could operate in a manner not desired by the city. One more drawback is that the company may go out of business due to lack of funds and leave the city without a bike share program (Alta Planning + Design, 2012).
Public-Private Partnership A third option of bike share program ownership would be a public-private partnership. In this instance, a non-profit will be responsible for hiring a private business to create the program. Therefore, the non-profit will act as a client and the company as the contractor. Again, in this instance, contracts will determine the terms of services. The city will have a contract with the non-profit, then the non-profit will have a contract with the private company that is providing the services. A benefit of this program is that the non-profit would be able to help with

29
marketing and advertising the bike share program, which could contribute to the success of the program. Further advantages of this program include flexibility in funding sources, maintaining city control, providing operating expertise, and minimizing the risk of failure (Alta Planning + Design, 2012). Capital Bikeshare is an example of a successful public-private partnership. In their example the local governments of the area have partnered witih Alta Bicycle share. (CapitalBIkeshare, 2013).
Program Expansion Strategies While Salem Spins and Spartanburg B-cycle have not expanded their fleet, Greenbike has had much success expanding its fleet. The vast difference among these three programs is that Greenbike is based on a college campus where most of the potential users are between the ages 18 and 24. Furthermore, unlike the Spartanburg bike share program, the program is completely free, possibly explaining the high ridership. Greenbike’s success versus Salem Spins could be attributed to the specific city and its isolation. Salem is located only 20 miles north of Boston, whereas Pullman is located almost 300 miles from a major city. Pullman is located in abundant natural beauty, being surrounded by mountains and canyons. It also has a more bike-friendly climate than Salem. Furthermore, Greenbike offers long-term bike rental for biking on more difficult terrains that a regular bicycle cannot handle. While Salem State University is located in Salem and also home to a bike station, their student population is about 6,000, whereas Washington State University’s (WSU, 2013) is almost 30,000 (Elie, Jeff. Personal Communication. January 15, 2013; WSU, 2013). Washington State University’s biking-conducive climate and large student body have assisted the success of the bike share program, leading to several phases of implementation. A proposed bike share program in Santa Clara County, California, is set to start in 2013. A strategic part of its plan is how it will develop the program through different phases. Its plan is to have a hub kiosk in each of the target cities, which are Palo Alto, San Jose, and Mountain View. Then, over time it will add more kiosks within a mile of the hub kiosk (Monterey County Draft Bicycle Sharing Feasibility and Implementation Plan, 2012). This is helpful for the Port Huron situation because while the main focus of the bike share analysis is Port Huron, there is an opportunity to expand south along the St. Clair River to other towns in St. Clair County that are connected by a trail system. At a minimum, it would be important to have at least one kiosk in each of the cities along the river, which include Marysville, Marine City, St. Clair, and Algonac. In order for this to become possible, first there must be a successful program implementation in Port Huron and a demand for bike trips between cities. As these possible expansion cities all have populations of about 10,000 or less, each city’s bike station would not need more than 10 bikes to start. Then, depending on the success of the proposed expansion, more bikes could be included if demand were deemed high enough. In a large-scale example, Capital Bikeshare inWashington D.C. has succeeded in expanding its fleet to multiple cities. The program now has kiosks in Arlington and Alexandria, Virginia and Washington D.C., with plans to build stations in Maryland’s Montgomery County (Austermuhle, 2012).
30
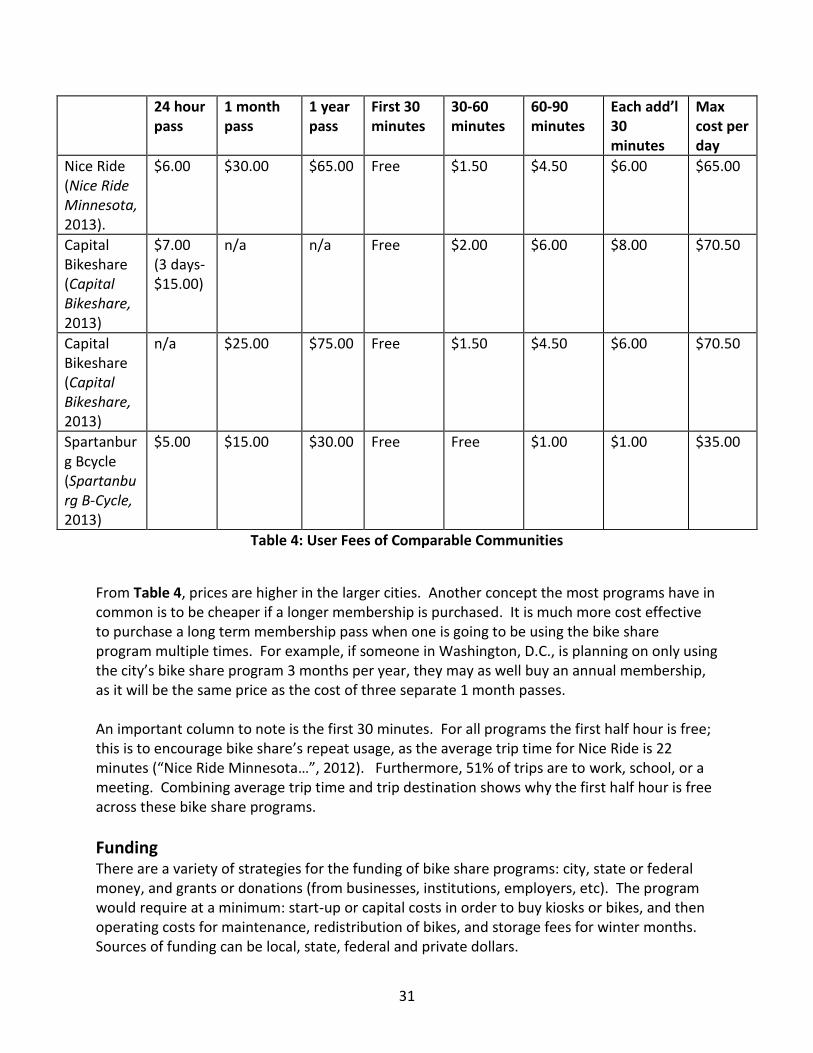
Customer Fees and Payment Structures There are various ways to receive payment for a bike share program that has been done successfully. First, most bike share programs have memberships available for longer than a 24-hour period. Generally, customers register online for this type of membership. After registering, a key with a microchip is shipped to their mailing address that allows them to have access for the period of membership that they purchased. Once having received the key, the member will have access to any bike, and then will only have to pay for how long they use the bike on that trip. If a customer only wants to purchase a 24-hour pass they will not have to purchase a membership online and can buy one at a kiosk with a credit card. Regardless of membership type, for the first half hour or hour the bike is generally free of charge, after which there is an additional fee. Spartanburg B-cycle charges $5 for a 24-hour pass, and after the first hour of use the next half hour costs $1 (Spartanburg B-Cycle, 2013). Capital Bikeshare of Washington, DC, is free for the first half hour and then charges $1.50 from 30 to 60 minutes, then goes up to $3 from 60 to 90 minutes, and then each half hour after that costs $6 (Capital Bikeshare, 2013). The expenses reach a limit of $70.50, which is reached at 6.5 hours of use. Capital Bike Share does not have numbers on ridership available, but since the introduction of the program 5 million less miles have been driven by personal vehicle and on average the annual user saves over $800 a year from using bike share (Capital Bikeshare, 2013). Nice Ride in Minneapolis is free for the first half hour, then charges $1.50 from 30-60 minutes, from 60-90 minutes the cost is $4.50, then each additional half hour the cost is $6.00. Although these prices may seem a little steep, according to Nice Ride 98% of trips used by annual members are less than half an hour (Nice Ride Minnesota, 2013). See Table 4 for a comparison of Nice Ride, Capital Bikeshare, and Spartanburg’s price structures. Please note that Salem and Greenbike are not included because both programs are free or included in tuition.
31
24 hour pass
1 month pass
1 year pass
First 30 minutes
30-60 minutes
60-90 minutes
Each add’l 30 minutes
Max cost per day
Nice Ride (Nice Ride Minnesota, 2013).
$6.00 $30.00 $65.00 Free $1.50 $4.50 $6.00 $65.00
Capital Bikeshare (Capital Bikeshare, 2013)
$7.00 (3 days-$15.00)
n/a n/a Free $2.00 $6.00 $8.00 $70.50
Capital Bikeshare (Capital Bikeshare, 2013)
n/a $25.00 $75.00 Free $1.50 $4.50 $6.00 $70.50
Spartanburg Bcycle (Spartanburg B-Cycle, 2013)
$5.00 $15.00 $30.00 Free Free $1.00 $1.00 $35.00
Table 4: User Fees of Comparable Communities
From Table 4, prices are higher in the larger cities. Another concept the most programs have in common is to be cheaper if a longer membership is purchased. It is much more cost effective to purchase a long term membership pass when one is going to be using the bike share program multiple times. For example, if someone in Washington, D.C., is planning on only using the city’s bike share program 3 months per year, they may as well buy an annual membership, as it will be the same price as the cost of three separate 1 month passes. An important column to note is the first 30 minutes. For all programs the first half hour is free; this is to encourage bike share’s repeat usage, as the average trip time for Nice Ride is 22 minutes (“Nice Ride Minnesota…”, 2012). Furthermore, 51% of trips are to work, school, or a meeting. Combining average trip time and trip destination shows why the first half hour is free across these bike share programs.
Funding There are a variety of strategies for the funding of bike share programs: city, state or federal money, and grants or donations (from businesses, institutions, employers, etc). The program would require at a minimum: start-up or capital costs in order to buy kiosks or bikes, and then operating costs for maintenance, redistribution of bikes, and storage fees for winter months. Sources of funding can be local, state, federal and private dollars.

32
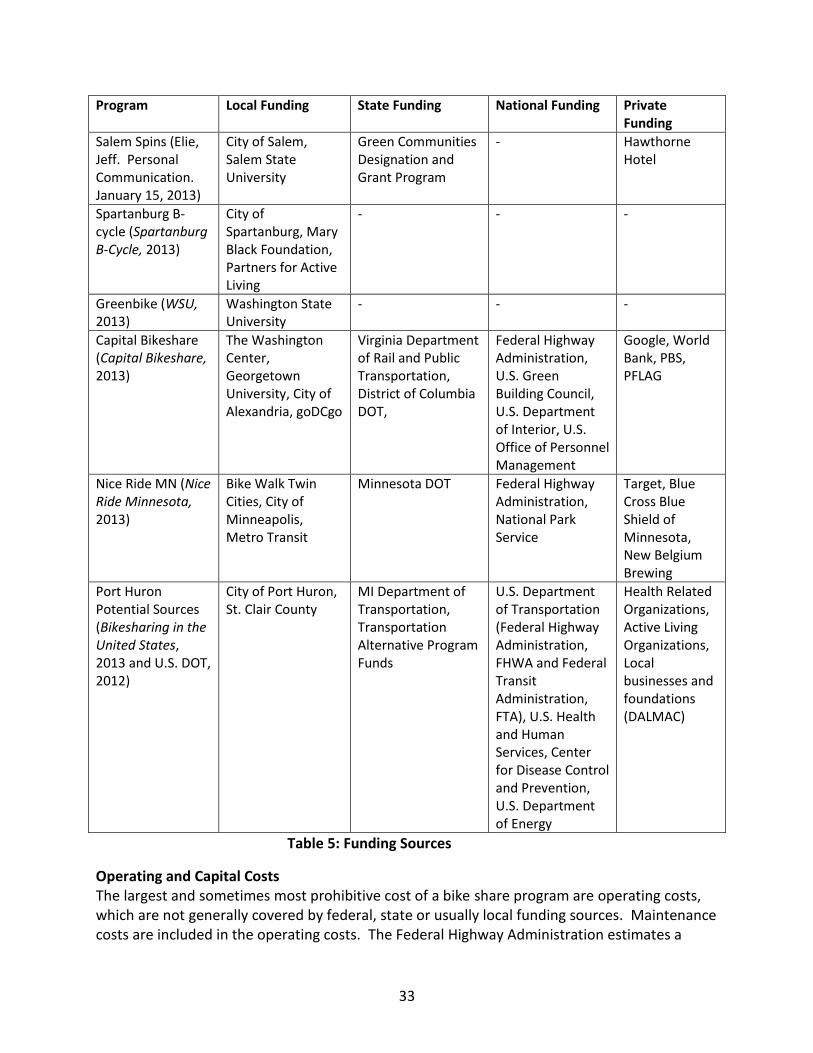
Funding Sources Salem Spins is an example of a bike share program that received its funding from a grant. The city was awarded $30,000 to implement the bike share program, which mainly went to the purchasing of their fleet. Apart from the grant money, the City of Salem and Salem State University contribute funding to keep the program running (Roy, 2011). Spartanburg B-cycle receives money from a local non-profit called the Mary Black Foundation and the city of Spartanburg. Proven aids for smaller-scale bike shares are local businesses. It is crucial to have these local organizations and businesses donating money consistently to the bike share as these programs are less visible to the public so a major corporation is less likely to donate. Blue Cross Blue Shield is a major example of a large corporation that has a history of donating money to bike share programs across the nation. Blue Cross Blue Shield has donated to bike share programs in Charlotte, Minneapolis, Houston, Kansas City, and have even backed the recent plan to establish a bike share program in Detroit (Gustafson, 2012). Most bike share programs receive grants that are open to the public, as the capital costs are generally too high for a city to afford on its own (Monterey County Draft Bicycle Sharing Feasibility and Implementation Plan, 2012). Applying for state and federal money is another option many bike share programs pursue to help finance a bike share program. Congestion Mitigation and Air Quality (CMAQ) is a federal program that aims to improve surface transportation and projects that will improve air quality. 13% of all CMAQ projects are bicycle or pedestrian projects, while 5% of CMAQ’s budget is appropriated to bike share projects. This may seem small, but bicycle and pedestrian projects are substantially cheaper than transit and traffic projects (CMAQ, 2013). Currently, about 70 million dollars are spent by CMAQ every year on bicycle or pedestrian improvement projects. What is more is that nearly every state under allocates the funds, meaning the money is available and not being used (CMAQ, 2013). The Environmental Protection Agency can provide federal funding when municipalities protect natural resources, establish trails and outdoor recreation facilities encourage maritime heritage activities, develop infrastructure and enhance public safety. State funding can come from Michigan Department of Environmental Quality for pollution prevention as well. Locally the Local Development Financing Authority can provide funds for improving and establishing public facilities (St. Clair County 2030 Master Plan, 2009, pp. 107). A state program that provides money to programs such as a bike share program is the Transportation Alternatives Program, which is a part of the Michigan Department of Transportation (MDOT). Every year about $23 million dollars is available to programs that promote non-vehicle transportation forms, such as bike shares (Transportation Alternatives Program, 2013). See the funding Table 5 below as a summary of the funding sources of existing bike shares by program and potential funding for St. Clair County.
33
Program Local Funding State Funding National Funding Private Funding
Salem Spins (Elie, Jeff. Personal Communication. January 15, 2013)
City of Salem, Salem State University
Green Communities Designation and Grant Program
- Hawthorne Hotel
Spartanburg B-cycle (Spartanburg B-Cycle, 2013)
City of Spartanburg, Mary Black Foundation, Partners for Active Living
- - -
Greenbike (WSU, 2013)
Washington State University
- - -
Capital Bikeshare (Capital Bikeshare, 2013)
The Washington Center, Georgetown University, City of Alexandria, goDCgo
Virginia Department of Rail and Public Transportation, District of Columbia DOT,
Federal Highway Administration, U.S. Green Building Council, U.S. Department of Interior, U.S. Office of Personnel Management
Google, World Bank, PBS, PFLAG
Nice Ride MN (Nice Ride Minnesota, 2013)
Bike Walk Twin Cities, City of Minneapolis, Metro Transit
Minnesota DOT Federal Highway Administration, National Park Service
Target, Blue Cross Blue Shield of Minnesota, New Belgium Brewing
Port Huron Potential Sources (Bikesharing in the United States, 2013 and U.S. DOT, 2012)
City of Port Huron, St. Clair County
MI Department of Transportation, Transportation Alternative Program Funds
U.S. Department of Transportation (Federal Highway Administration, FHWA and Federal Transit Administration, FTA), U.S. Health and Human Services, Center for Disease Control and Prevention, U.S. Department of Energy
Health Related Organizations, Active Living Organizations, Local businesses and foundations (DALMAC)
Table 5: Funding Sources
Operating and Capital Costs The largest and sometimes most prohibitive cost of a bike share program are operating costs, which are not generally covered by federal, state or usually local funding sources. Maintenance costs are included in the operating costs. The Federal Highway Administration estimates a

34
station that has 11 docks and 6 bikes will cost $35-40,000 for the equipment and installation and will cost $12-15,000 a year for maintenance (Monterey County Draft Bicycle Sharing Feasibility and Implementation Plan, 2012). A station that has 15 docks and 8 bikes will cost $45-48,000 in capital costs and $18-21,000 for annual upkeep. A station that has 19 docks and 10 bikes will cost $53-58,000 up front and will cost $24-28,000 of upkeep a year (Monterey County Draft Bicycle Sharing Feasibility and Implementation Plan, 2012). See Table 6 below.
Costs Estimates (per station)
Bikes Docks Equipment and installation Maintenance per year
6 11 $35-40,000 $12-15,000
8 15 $45-48,000 $18-21,000
11 19 $53-58,000 $24-28,000
Table 6: Operating and Capital Costs
The cost per bike varies across programs. Capital Bikeshare have their bikes at a value of $1,000 (Capital Bikeshare, 2013). Greenbike values their bicycles at $600 (WSU, 2013). Zotwheels, the bike share program at the University of California Irvine, Zotwheels, values their bicycles at $200 (UCI, 2013). From a FHWA summary, bicycles average $4,000-$5,000 including kiosk or $1,000-$2,000 without need of a docking station (Bike sharing in the United States: State of the Practice and Guide to Implementation, 2012). The prices depend on what technologies the bikes have. Maintenance is a primary issue in sustaining a bike share program. Maintaining a fleet of bicycles can be challenging; therefore, many bike share feasibility studies estimate on average that each bicycle will require about $1,500 of maintenance a year. This yearly cost could include items such as:
Insurance
Program Administration Salaries and Benefits
Internet and Phone Service
Office Furniture
Office Lease
Postage and Printing for New Subscriber Packages and Annual Mailing
Ongoing Promotions Annual Budget
Software License and Back-End Operation
Customer Service Help Desk
Credit Card Processing Fees
Wireless Communication between Locking Stations
Hosting Services
System Operating Cards
Miscellaneous Supplies and Expenses

35
Full-Time Bike Mechanics
Electronics Technicians
Bicycle Parts
Locking Station Batteries
Vehicle Maintenance
Theft and Vandalism
Locking Station Replacements (Monterey County Draft Bicycle Sharing Feasibility and Implementation Plan, 2012)
After implementation, cities must keep the bike share program running by using the revenue received from memberships, grants, and the city itself. Ideally, revenue from memberships would be sufficient to cover the costs of the program; unfortunately this is has not been the case yet. Capital Bikeshare in Washington D.C. expects subscription memberships to cover 50% of operating costs yearly (Capital Bikeshare, 2013). It is very important for a city to know that the revenue will not be sufficient for the operating costs. Subsidies from non-profits, government, and local businesses are a necessary part of maintaining an existing bike share program.
Liability and Insurance Many bike share programs in existence have customers sign a waiver saying that the customer is responsible for misuse of the bicycle and that the company is not liable to pay for damages from any injury that may be sustained. Both Nice Ride and Capital Bikeshare have a lengthy terms and conditions agreement that one has to agree to before they can check out a bike (Capital Bikeshare, 2013; Nice Ride Minnesota, 2013). Therefore, the city is not liable. However, bike share users have a history of being in fewer crashes than other urban cyclists. They travel at slower speeds and in areas within their comfort zone. Within Washington, D.C., there were fewer than 60 crashes in over thousands of bike share rides (Gilliland, Eric. Personal Communication. February 2013, Bikeshare session. Transportation Research Board Conference. Washington DC). Furthermore, bike share bicycles have many safety features including flashing LED lights, reflectors, and plastic casing around the tires. According to the 2011 St. Clair County Traffic Accident Report, only .8% of all accidents involved a cyclist. Furthermore, there were 3 fatalities in 2011, which accounted for 13% of all fatalities for the county. This can be viewed comparatively high compared to the number of bike accidents; however cyclists are much more vulnerable on the road than a driver, which accounts for this statistic (“County Profiles 2011 St. Clair”, 2012). Simple improvements to safety can be the installation of bike lanes or a mandatory helmet ordinance. Rider safety and city liability is usually not of great concern, although should be considered during all bicycle education opportunities. Currently no city requires a helmet to rent a bike. A study of Melbourne, Australia found that 20-30% decrease in ridership with a mandatory helmet requirement. Even though helmet use is not required, it is highly encouraged. This helps protect the bike share program operators from being sued if anything were to happen to a customer. Providing a helmet for repeated bike share use is a difficulty of the program, which is still under investigation by many currently operating systems.

36
Summary of Case Study Analysis Studying successful examples of bike share programs is a beneficial tool to help understand how a bike share program may function. For instance, many bike share programs operate completely different from one another. Most stations have a kiosk, but with Salem Spins one can only check a bike out form the Salem State University or a local hotel. Some programs are privately owned, some are publically owned, and some are a mixture of the two ownership systems. Salem Spins is also entirely free of charge assuming one will return the bike in the same condition it was received (Elie, Jeff. Personal Communication. January 15, 2013). What all programs have in common is their need for funding. If it was not without the outside help of local governments, non-profits, and private sponsorships these bike share programs cannot exist in the same fashion that they do today.

37
Demand Analysis The anticipated users were determined by a literature review and case studies of bike share systems in communities similar to Port Huron. The anticipated users helped form a consensus of which community indicators would be the most informative for a market analysis. A market analysis was conducted using the program ArcGIS (ArcMap 9.2), using community indicators to identify ideal bike share system locations. A natural bias was found towards Port Huron, Michigan, due to its densities. Therefore, a demand analysis specifically for Port Huron was conducted, integrating the anticipated users of bike share, socio-economic data of Port Huron residents, and the GIS analysis (based on community indicators). A summary of the community indicators, based off the anticipated users, is provided in the final section (see Recommendations, pg. 64 and 69).
Anticipated Users Bike share is attracting new users of all ages, sizes, and types (Bikesharing in the United States, 2013). A summary of anticipated users was compiled from a literature review of research on bike share, however, new research and data being collected and published by universities and communities using bike share, during this feasibility study. From a Californian study, anticipated users were statistically analyzed to find those that would produce the highest ridership levels (Monterey County Draft Bicycle Sharing Feasibility and Implementation Plan, 2012). Found to be statistically significant were race, income and high-income jobs, alternative commuters, and total jobs, among others (Monterey County Draft Bicycle Sharing Feasibility and Implementation Plan, 2012). From a variety of bike share studies, general statements can be made about the profile of people that use bike share. These statements are based off of current operations (and data recorded per bike or user) from bike sharing around the United States, Europe, and Asia. Bike share can also capture a new market of bicyclists, reaching beyond the anticipated users. The following are characteristics of potential demand for a bike share program:
Users of bike share (Cincinnati Bikeshare Feasibility Study, 2012): o College students
Young (20-39 years) (Daddido, 2012), well educated, environmentally conscious, are the early adopters
o People with higher incomes (Monterey County Draft Bicycle Sharing Feasibility and Implementation Plan, 2012)
Generally bike share struggles to attract lower-income people and people of color
o Alternative commuters Those who are willing to try different modes of transportation (Public
Bikesharing in North America: Early Operator and User Understanding, 2012)
o New bicyclists
38
Bike share has reported significant use by those that do not bike currently, or own their own bicycle (capturing a new market)
Tourists o Local population
Adoption of bike share by the local population, and not solely tourists, helps ensure long-term sustainability
Maximum potential of local users is the amount of people living in the vicinity
Minimum is based on specific community indicators o Prefer flatter topography and warmer temperatures for bicycling
Bike share trips: o are short, a half hour or less o offer the last mile service from transit hubs, parking garages, and destinations o offer alternative mode for short day-time business trips (ex: between meetings) o are ideal when stations are in sight of one another
Minimum distance between stations is about 3 city blocks to avoid redundancy (Gilliland, Eric. Personal Communication. February 2013, Bikeshare session. Transportation Research Board Conference. Washington DC)
o provide connections between destinations o vary by annual members (making shorter trips) and casual users
Density of infrastructure: o such as downtown city centers
Provides the largest amount of amenities and attractions in the smallest area
o specifically, bike infrastructure Safe, sufficient bike infrastructure linking attractions with appropriate
way finding signage Easily available map information for trails, routes, links to attractions, and
station locations
Market Analysis of St. Clair County In identifying community indicators, it is important to consider local environment, conditions, culture, circumstances, and opportunities. A GIS analysis captures preliminary indicators of population, job, and retail densities. Additional community indicators tailor the market analysis of the demand specifically to Port Huron. Special consideration is given to the combination of the tourist population demand for bike share as well as the local conditions, opportunities, and population of Port Huron. Bike share programs tend to be most successful where the populations are more dense. Because of this, the beginning phases of a St. Clair County bike share program should be in Port Huron proper, due to the city’s population, retail, and job densities. However, these are not the sole indicators of successful bike share. Community indicators were identified from a variety of feasibility studies around the United States. The structure and majority of the community

39
indicators are from the Seattle, WA, bike share feasibility study (Seattle Bike Share Feasibility Study, pp. 8). The most desirable area for a bike share would contain areas with the highest potential riders within the ArcGIS analysis, as well as within an ideal distance from and concentration of community indicators.
GIS Analysis ArcGIS (ArcMap 9.2) was the program used to aggregate data for purposes of a market analysis of the study area, St. Clair County. Data on St. Clair County was gathered from the U.S. Census Bureau, in the form of Tiger Shape files, ESRI data (from ArcGis Online), the Southeast Michigan Council of Governments (SEMCOG), the Michigan Department of Transportation (MDOT), and the St. Clair County Metropolitan Planning Commission. All files were collected in shape files and analyzed using ArcMap 9.2. The population, retail, and employment data were point data and the points were converted to gradients. The size of the point depicts either the number of people living in the area (population) or the number of people employed in the establishment. Retail employment (or described as retail density in this report) was weighted, because the employment data was assumed to cover the retail data as well. A map of each population, employment and retail, and the gradation, is below (see Figure 7, 8, and 9). Another map, joining the gradation of employment and retail is Figure 10. Visual inspection of each map determined the concentration of each on Port Huron. Overlaying all three data sources, it was revealed that Port Huron would be the primary area of concentration (see Figure 11). St. Clair County is the area of study; therefore, it provides the extreme boundary for potential locations for bike sharing.

40
Population Density Without sustained local interest, bike share systems lose momentum and participation diminishes. With higher population density, the system has the probability of greater market demand. Bike share flourishes when the bikes are seen on a daily basis and their value spread by word-of-mouth. The more use of bikes, within a dense population, the more visible the program (if branded with bright colors), thus the cyclical opportunity for continued ridership.
Source: (MDOT: Statewide Model Unit, 2013)
Figure 7: St. Clair County Population Gradients

41
Job Density Along with a high density of population, the more jobs in an area suggest greater success of bike share use. People may use bike share for commuting to work or to travel between daily meetings. Port Huron Hospital has the most number of employees in the county, with 1,750 employees (Economic Development Alliance of St. Clair County, 2010). The St. Clair County government and Port Huron Area School District employ the next largest amount of people, both around 1,000. DTE Energy employs 915 and Mercy Hospital 770 people (Economic Development Alliance of St. Clair County, 2010).

42
Source: (MDOT: Statewide Model Unit, 2013)
Figure 8: St. Clair County Employment Gradients
“Higher employment density yields greater access to potential bike share users. Employment density and location can also help determine how the pattern of morning commute may affect the distribution of bike share rides throughout the service area.” (Bike sharing in the United States: State of the Practice and Guide to Implementation, 2012, pp. 17)

43
Retail Density Bike share users need a destination, and retail stores provide a utilitarian purpose for bicycling. However, retail density needs to be combined with a safe, visual, and easily accessible bike route to the destination. Simply providing a dense shopping area, but not a means of accessing it by non-motorized transportation, does not suffice.
Source: (MDOT: Statewide Model Unit, 2013)
Figure 9: St. Clair County Retail Gradients

44
Source: (MDOT: Statewide Model Unit, 2013)
Figure 10: Employment and Retail Gradients Port Huron
The retail strip north of the city is extreme, but does not outweigh the number of employed persons in the City of Port Huron.

45
Source: (MDOT: Statewide Model Unit, 2013)
Figure 11: Population, Retail and Employment Gradients for Port Huron
46
The findings, per Figure 11, are the densities concentrated in the downtown development authority (DDA) within the City of Port Huron. The employment in this city center outweighs the densities of retail establishments. The DDA, or image on the right, is the densest area in the City, therefore the area most favorable to bike share. Therefore, the community indicators center on Port Huron, with a concentration on the trip attractions and generators in the city.
Community Indicators of Port Huron Factors chosen to be significant specifically to Port Huron, paralleling existing literature on the state of bike share in the United States, which were not covered within the GIS analysis of community indicators include:
Bicycle infrastructure
Connection to Transit
Community Colleges
Community and Tourist Attractions
Tourism Population
Parks and Recreation Areas
Income and Race
Expenditures
Commuting Distances and Mode Share
Topography
Weather Below is a description of each community indicator and why it was chosen to represent ideal locations for bike share.
Bicycling Infrastructure A concentration of existing bike paths and routes provides comfort and safety for bike share participants. They provide the means for using the product, or the bike. A route could also have signage to assist the user, and supply needed or desired amenities for the bike share user. As seen in Figure 12, St. Clair County has a prevalence of bike facilities, trails and connectivity. St. Clair County also has a plan for a system of non-motorized facilities, as seen in their St. Clair County Non-Motorized Plan (St. Clair County Nonmotorized Guidelines, 2005). The plan focuses on the use of the waterfront, and the trails and facilities spread from major focal points of communities along the coast, utilizing many existing paved trails, as seen in Figure 12 (St. Clair County, Trails and Routes Master Plan, 2009). The largest paved trail is the Bridge to Bay trail, 37.5 miles completed, running through and parallel to the coastal communities.

47
Source: (St. Clair County, Trails and Routes Master Plan, 2009, pp. 10)
Figure 12: St. Clair County Nonmotorized Facilities

48
In downtown Port Huron, seen in Figure 13, there is one street with a bike lane and a few divided bicycle trails. The bike lane extends the length of Erie Street 0.7 miles north from the Black River to Pine Grove Avenue. This is the only bike lane in Port Huron. Three different trails, or shared-use paths, in the focus area serve bicyclists along the
waterfront. The longest path runs south from the Blue Water Bridge until Lincoln Ave, 0.8 miles, and another path runs between Glenwood Avenue south until the
Black River. These trails are parts of the Bridge to Bay Trail along St. Clair County but are not connected. There is another shared-use path south of the Black River along Water St until it meets Erie/7th Street, 0.5 miles. Although focused on recreation, Port Huron has a concentrated and connected bicycling network. Specific bicycle amenities (bicycle lanes) are uncommon in the focus area, although local, low-traffic volume bikeable streets are common. These are currently used as shared-use path connections. Port Huron’s downtown space for bicycles is limited mostly to sidewalks.
Parks and Recreation Areas Residents of the county and Port Huron specifically, as well as tourists, populate parks and recreational areas more often during summer months. The parks are community attractions and trip generators. There locations provide trail connections throughout the city to institutions and community and tourist attractions. There are ten parks in Port Huron of varying size and use that could be locations for bike share kiosks. However, though these park attractions and destinations are potential station locations, “analysis excluded the idea of placing stations within parks, as this would change the focus of
0.8
mi
0.7
mi
0.5 mi
Source: (Bridge to Bay Trail map, stclaircounty.org)
Figure 13: Bridge to Bay Trail Map and Port Huron Attractions

49
bike-sharing to a recreational activity” (Seattle Bike Share Feasibility Study, pp. 16). Seattle opted not to choose parks as a location to place a station, as bike sharing is supposed to regularly reduce automobile trips for shopping, work, and social trips. Associating bike shares with recreation areas may interfere with the promotion of non-recreational bike share use. Parks should, however, give weight to proximal locations. An example is Pine Grove Park--as it is proximal to both the Port Huron Hospital and the Convention Center, it would give weight to a station near that location.
Connection to Transit Bike sharing at or near transit stations can allow for individuals using public transit to use a bike to make it to their final destination faster than by walking or finding another transit route. Individuals using a bike can also drop it off at the transit stop and use the transit to go to another destination. Major transit stops can assist bike sharing to further the public transit system and further reduce car trips, congestion, and greenhouse gas emissions. Connecting with the only public transit system in the county is ideal (McElroy, Dave. Personal communication. January 2013). St. Clair County is serviced by the transit agency Blue Water Area Transit, which runs efficiently for its size and density of population served. There is also an Amtrak train, the Blue Water line, which begins in Port Huron and continues to Flint, Michigan. The train station is on 16th street, on the southwest end of the city two miles from downtown (BWAT). The bus system has 7 routes throughout Port Huron and St. Clair County. Stops are throughout the county but centered in Port Huron, and each is serviced every 40 minutes (BWAT). The map below, Figure 14, shows the main transfer point of the regional transit system at Quay St, and the density of routes and stops in Port Huron.

50
Source: (Blue Water Area Transit)
Figure 14: Port Huron Transit Service
Blue Water Area Transit charges 75 cents or less with free transfers and has bike racks on each bus with two late night services. There is also the Blue Water Trolley, a trolley service that tours the area in a one-hour ride that focuses on destinations, running from June to August and during September on the weekends. Blue Water Area Transit ridership has been increasing since 2007 (BWAT). This increase has encouraged the BWAT to develop a state-of-the-art transit hub in the McMorran Parking Lot South. A new transit hub, see Figure 15, is planned to be constructed, ideally beginning construction by the summer of 2014. The expectation is that 80% of fixed route passengers, or 716,000 people, will pass through the transfer station per year, or roughly 1,900 people daily (McElroy, Dave. Personal communication. January 2013). The Blue Water Area Transit is adjacent to the Erie Street bike lane and is between St. Clair County Community College, the McMorran Center, and the downtown Port Huron River Walk.

51
Source: (McElroy, Dave, 2013)
Figure 15: Location of New Blue Water Area Transit Center
A bike share station in the downtown transit hub allows for individuals who’ve taken the bus to the downtown to finish their trip on a bicycle instead of using an automobile or walking. Bike share enhances transit use, and allows for greater accessibility for residents. However, bike share does not readily capture low income users, of whom are often bus dependent riders. Transit hubs are potential bike share kiosk locations, however, they must be understood in the context of the users. Colleges Port Huron has one community college, St. Clair Community College (SC4). Baker College and Baker College Culinary Institute is under construction currently and is adjacent to the Thomas Edison Inn and a future convention center, estimated to be completed by 2014. St. Clair Community College (SC4) typically has 4,500 students enrolled between January and May (White, Becky. Personal Communication. 2013). Two summer semesters enroll approximately 1,500 students. The campus contains no bike lanes or paths, however, it has 7 bike racks in 6 locations, with a maximum capacity of 86 bikes (White, Becky. Personal Communication. 2013). Baker College of Port Huron is located to the northwest of downtown Port Huron. It is unfortunately in an area of low residential and commercial density, and a commuter college. It enrolls approximately 1,100 students, and has 1 bike rack (White, Becky. Personal Communication. 2013).

52
Baker College Culinary Institute will be a future branch of Baker College, and it will be adjacent to the new convention center and the Thomas Edison Inn.
College students are a primary demographic of bike share users as well as SC4 being a part of the downtown. This is because student populations have a large transit mode share (Seattle Bike Share Feasibility Study, pp. 11). College students and university housing is a strong indicator towards bike share usage. The community college lends to the success of the bike share, providing alternative connections for students to downtown Port Huron, as well as increase travel opportunities during the day without risking the loss of a parking spot in the commuter lot. These students have a demand for the short bike share trips. However, students should not be used as the only criteria for market demand, due to the lower enrollment numbers (compared to Washington State University’s 27,000 students), and the prevalence of commuters. Neither college has bike lanes or paths. Overall, the colleges provide a stable local source of anticipated bike share users. The bike share program’s operation length should be coordinated with peak enrollment periods, as well as all other demand analysis elements (weather, tourism, etc).
Community and Tourist Attractions Bike share uses leisurely travelers, specifically tourists. Tourists have time, and they are willing to spend money on value added experiences. With 140 miles of coastal property in the Blue Water area (Blue Water Area Convention and Visitors Bureau, 2013), the County has a high density of tourist attractions along the waterfront and a history and culture that supports their heavy use. Stations could be provided at tourist attractions because of the goal of providing a well-defined, inexpensive, and high class service at these destinations, and a method for continuing the tourist experience. To ensure bike share usage, bike share kiosks need to be put in locations that will generate trips. Destinations and locations that will bring in visitors and tourists are ideal locations as individuals in the area could choose to ride a bike instead of their usual mode of transportation. Visibility is also an important factor of bike sharing success. Bike share stations should be in the eye of the public so they constantly know that they have access to the bikes and program. Tourist attractions are destinations for bike share users. Tourist travel has been a strong market for bike share programs worldwide (Seattle Bike Share Feasibility Study, pp. 8). Connections are essential components to generate bike share trips. Connections can include:
Hotels to downtown destinations (tourist attractions, entertainment, convention centers, business meetings, or restaurants)
Convention centers to downtown
Riverfront, marinas and parks to downtown
College campuses to downtown
Health centers, or hospitals, to riverfront or downtown
Examples of tourist and local community attractions specific to Port Huron, that can be connected with the bike share program:

53
Convention Center, Thomas Edison Museum and Hotel - A destination for visitors at the site of the former Thomas Jefferson Inn, a bike share station here would allow visitors to be connected to Downtown Port Huron without the use of an automobile. A new convention center is planned for recent years, see Figure 16. The adjacent Baker College Culinary Institute is discussed below, within Colleges.
McMorran Place and Ice Arena – The McMorran Center, Figure 17, is a professional and semi-professional sports venue. It serves concerts, stage shows, banquets and conventions. As the central entertainment venue of Port Huron, it provides flexibility as a bike share destination – as a venue catering to both residents and tourists.
Port Huron Hospital - The Port Huron Hospital is the largest employer in the city and just outside the downtown, a bike share station would allow access for its employees to more locations in the city. A bike share system coincides with a community healthy lifestyle and it would both promote and demonstrate health and wellness. Individual employees could use bike share bicycles during break times in their workday for recreation, errands or short trips
Source: eventective.com/photo/52797.jpg
Figure 17: McMorran Place
Source: (Wallace, Lindsay. Personal Communication. January 2013)
Figure 16: Future Convention Center, North Port Huron

54
Great Lakes Maritime Center – The Maritime Center, Figure 18, is a popular summer attraction, to watch commercial boating traffic and water recreation. It hosts an indoor Bistro, and museum artifacts and TV’s for viewing underwater cameras. Future plans for the maritime center are to construct a permanent structure, expanding the current building, and upgrading the area. The numbers of
visitors is high, however, need to be classified into age groups in order to determine demand for bike share trips.
Desmond’s Landing – This is a waterfront area, just south of the Maritime center, where the Black River and St. Clair River meet. There is ongoing effort to upgrade this southern section of Port Huron, as it is a deep-water port, with many visiting cruise ships and historic tall ships. Recreational activities include fishing and walking the promenade. Also, the YMCA and large employment centers or office buildings are adjacent to Desmond’s Landing.
River Walk – The Port Huron River Walk is a project to forward the downtown and increase activity along the Black River. The River Walk runs from 10th St past Huron Avenue and contains features such as sculptures, benches, bike racks, picnic tables, fire pits, art and food tents and access to promenades and plazas. It is designed to bring people downtown and to the river.
Others – As seen in Figure 19, more tourist attractions can be added to this list. The attraction, and specifically number of visitors within the ideal age group, or number of tourists, should be greater than the attractions in downtown Port Huron.
Source: puremichigan.org
Figure 18: Maritime Center

55
Source: Google Earth, authors
Figure 19: Community and Tourist Attractions of Port Huron
“As a general rule in urban areas, bike share stations should be placed at approximately ½ mile from each other. This range is directly related to the distance a person would have to walk to a station. … The ideal location in terms of demand does not always coincide with the ideal location in terms of physical space.” (Bike sharing in the United States: State of the Practice and Guide to Implementation, 2012, pp. 18)

56
From the Thomas Edison Museum and Hotel, it is approximately 0.8 miles to Pine Grove Park and approximately 0.7 miles down Erie St (using the bike lane) to the corner of Erie St and Grand River Ave (or the bridge over the Black River). It is approximately 1,500 feet from here to the intersection of Water St and Military St/Main St, the main thoroughfare and commercial strip of downtown Port Huron. It is approximately 0.5 miles from the bridge to Desmond Landing at the mouth of the Black River, or start of the Bridge to Bay trail. Most distances between destinations within the City of Port Huron are between 0.5 and 1.0 miles.
Tourism Population St. Clair County sees a small percentage, around 2.4% of total Michigan visitors (Morris, Davis. Personal communication, 2013. Michigan Economic Development Corporation (MEDC) statistics). However, it is a high percentage compared to their local population. The visitor count to Port Huron is over 50 times greater than the local population, as seen in Figure 20 (Morris, Davis. Personal communication. 2013. Michigan Economic Development Corporation (MEDC) statistics).
Source: MEDC and U.S. Census Bureau
Figure 20: Visitors to St Clair County
Local tourism information is limited for St. Clair County, and specifically for Port Huron. St. Clair County has 1,325,972 annual visitors (of the studied years between 2000 and 2004) according to the most recent economic study of the Blue Water Area, a Border Economic Impact (Border Economic Impact, pp. 22). Of these visitors, 19% were for business and 81% for leisure (Border Economic Impact, pp. 22). It is unknown if the annual visitors are out of state or in state, only that they traveled more than 50 miles from home (Border Economic Impact, pp. 22). The length of stay is 2.1 days (Border Economic Impact, pp. 22). This is only slightly less than a projection for 2013 that an out of state tourist will spend 2.3 days in the state (Border Economic Impact,
0
500,000
1,000,000
1,500,000
2,000,000
2,500,000
2011 2010 2009
Vis
ito
r P
op
ula
tio
n
St. Clair County
St. Clair County Population
St. Clair County Visitors

57
pp. 22). An out of state Michigan tourist will spend $120 on a day trip, and over $370 on an overnight trip (Lori, 2013). In 2007, visitors to Michigan spent an average of $93 per person per day, $25 of this on transportation (Border Economic Impact, pp. 23). According to the Border study, an estimated 15.1 million Canadian visitors came to Michigan in 2003 (Border Economic Impact, pp. 23). Canadian visitors spent an average of $18.56 per person per day in Michigan (Border Economic Impact, pp. 23), a small number compared to Michigan tourists, as the majority of Canadian visitors do not spend the night, but commute for work. High tourist season for Port Huron is the summer. There are 990 hotel or motel rooms in St. Clair County available to a tourist (Eschenburg, Lori. Personal Communication. January 2013.) Limited projection can take place for the applicability of tourism data to a specific area in the city of Port Huron. The data proves there are more tourists than local population in St. Clair County. It can be assumed, that the majority of visits occur during summer months, and concentrate on the place with a density of summer recreation attractions and amenities. Bike share could capture these tourists’ trips and perhaps the local at lunch work trips from working Canadians. However, a specific demand for number of trips is unattainable with the current data.
Income and Race The average income in Port Huron is lower than the average income statewide, as seen in Table 7 (U.S. Census, 2007-2011). The population below the poverty level from the 2007-2011 for Michigan was 15.7%, and for Port Huron was 26.4% (U.S. Census, 2007 – 2011).
Households by Income
Port Huron (ACS ’06 – ‘10) Michigan (ACS '06 -'10)
Income Number Percent Number Percent
$0 to $14,999 2,670 20.9% 304,785 13.6%
$15,000 to $24,999 2,224 17.4% 219,924 11.5%
$25,000 to $34,999 1743 13.7% 442,676 11.2%
$35,000 to $49,999 1847 14.5% 430,558 15.0%
$50,000 to $74,999 2,165 17.0% 577,569 19.0%
$75,000 to $99,999 1,129 8.8% 728,579 12.1%
$100,000 to $149,999 725 5.7% 466,664 11.3%
$150,000 to $199,999 110 0.9% 433,144 3.5%
$200,000+ 151 1.2% 134,211 2.8% Source: SEMCOG, and American Community Survey 2006-2010
Table 7: Port Huron Household Income
This could be problematic for bike share use as most users have higher incomes. However, 48% are middle income, making over $35,000 (City of Port Huron, 2006-2010). Bike share is feasible, but maximizing the other incentives for the bike share users will be essential. New methods, such as financial assistance [assumed to be provided by local government or private donations], community specific marketing, and membership media, are currently being researched and

58
utilized to best attract users from across income spectrum (Buck, 2013). The majority of Port Huron is white, over 83% in 2012 (U.S. Census Bureau, 2005-2009). 77% of all bike trips made in the United States are by white individuals (Sea Grant Michigan).
Recreational Expenditures: Potential and Current In the City of Port Huron; the average disposable income according to the 2010 U.S. Census was $33,758. The disposable income was slightly higher at $45,167, for St. Clair County (Demographic and Income Profile, 2010). Disposable income is the earned income remaining after taxes have been removed. For Michigan, the average is $32,651 (“Disposable Income”). According to Esri forecasts in 2010, recreational expenditures, the total amount that was spent on bicycles and/or equipment in St. Clair County was $974,465, of that $138,289 was in the City of Port Huron (“Recreational Expenditures,” 2006-2007). The spending potential index was low, at 61, compared to the national average of 100. “The Spending Potential Index (SPI) is household-based, and represents the amount spent for a product or service relative to a national average of 100 (“Recreational Expenditures,” 2006-2007.” However, entertainment and recreation expenditures were $202,199,729 for St. Clair County and $31,033,829 in Port Huron, Esri forecasted in 2010 (“Comprehensive Trend Report,” 2010). The Market Potential Index (MPI) “measures the relative likelihood of the adults in the specified trade area to exhibit certain consumer behavior or purchasing patterns compared to the U.S. An MPI of 100 represents the U.S. average” (“Sports and Leisure Market Potential”, Port Huron, 2011). The U.S. Census indicates that the expected number of adults participating in road bicycling in Port Huron is 9,163 and mountain biking is 3,597; or an MPI score of 91 and 94, respectively (“Sports and Leisure Market Potential”, Port Huron, 2011). For St. Clair County, the MPI’s were 92 (road bicycling) and 95 (mountain bicycling) (“Sports and Leisure Market Potential,” St. Clair County, 2011). The scores indicate bicycling trends for Port Huron and the County are on par with road and mountain biking trends within the U.S. Overall, the potential exists for bicycling in Port Huron, according to the MPI and the amount of disposable income. Recreational activities, and the amount spent within Michigan, are increasing, due in part to the Pure Michigan campaign. Biking is the 7th most popular outdoor recreation activity in Michigan (Sea Grant Michigan). However, the spending potential index for bicycling within Port Huron is low. The likelihood of spending for bicycling, or on bike share, could be determined by a community survey, discussed within Recommendations (pg 63).
Alternative Commuters: Distances and Mode Share When gaining consistent users of bike share, the work commute is a factor in their travel decisions (Public Bikesharing in North America: Early Operator and User Understanding, 2012). A majority of the residents living in Port Huron (89%) also work within Port Huron or St. Clair County (U.S. Census Bureau, 2005-2009). The local work force means an opportunity for bike share to capture commuters. Also encouraging is that 73% of people living in Port Huron travel a commuting distance of 19 minutes or less in (U.S. Census Bureau, 2005-2009). In Port Huron,

59
800 people, or 7% of the commuters, commute less than 5 minutes (U.S. Census Bureau, 2005-2009). The 2005-2009 ACS estimate for workers sixteen years and older who lived in St. Clair County and rode a bicycle to work was 177 of 72,009 residents, or 0.2% of the population. For the same period, 167 of 12,605 working residents sixteen and older lived in the City of Port Huron, or 1.3% of the population (U.S. Census Bureau, 2005-2009). The distribution of mode share within Port Huron is relatively average compared to the State of Michigan. In Michigan, 76% of people use their car for commuting to work (U.S. Census Bureau, 2009-2011), and in Port Huron, that percentage is 81 (U.S. Census Bureau, 2005-2009). Currently, 1.3% bicycle to work, 2.5% walk, and 10% carpool. From the years 2009-2011 from the U.S. Census, in Michigan as a whole, 1.7% of commuters bicycle to work, (1.3% in Port Huron), 2.8% walk (2.5%), and 9.7% carpool (10%) (U.S. Census Bureau, 2009-2011). Overall, the use of alternative modes of transportation, specifically for commuting could be favorable to bike share use. Potential exists for commuters to use alternative modes of transportation is favorable to bike share. To determine exact demand, a community survey is recommended, to determine bicycling demand, especially for commuting. Marketing bike share to these potential alternative commuters is discussed within Public Outreach and Education (pp. 61).
Topography Port Huron geography is flat, starting at 604 feet (Port Huron). Its topography varies little, as the east boundary of the city is the St. Clair River, which drops a total of 5 feet from Lake St. Clair to where it empties into Lake Huron (St. Clair River). Bicycling in general is affected by topography of the area, with an increase in bicycling for recreation with fewer hills. The size of a hill should specifically be considered if in between major destinations or stations, expecting more use of the downhill station and the lack of bike return on the uphill station. Slopes at a grade of 4% or higher are considered a major barrier for bicyclists (Bike sharing in the United States: State of the Practice and Guide to Implementation, 2012 p. 6). The topography, and specifically flatness, of Port Huron would not provide an impediment to bicycling.
Weather The weather in Port Huron is generally warm from April until September. The hottest month is July. Precipitation is average and not uncommon for a lake side community. See Figure 21 for a weather summary.

60
Source: weather.com, authors
Figure 21: Average Monthly Weather in Port Huron
The summer months are ideal weather for bicycling. The winter weather in Port Huron can be severe, with lake effect snow, harsh winds and low temperatures, with the months of December, January and February reporting average freezing temperatures. Bike share is not recommended to be operating during winter months due to low recreational activity, loss of tourist population and winter weather conditions. The bike share system in Salem, Oregon closes from November 15 to March. (White, Becky. Personal communication. 2013).
Some cities keep their systems open year round, for example in Washington DC. Their winter temperatures reach an average low in January of 29 degrees F (Port Huron, weather.com). Either removing the system from operation in winter months, or not, presents challenges such as storage costs, or maintenance issues. If running year round, maintenance could occur during off-line hours, usually late evening. However, lower demand systems usually do not operate in winter. Also, a local bike store owner, of Alpine Cycles and resident of Port Huron for 30 years, sees the highest bike sales generally from April to October (Eppley, Robert. Personal communication. February 2013. Alpine Cycles shop owner).This also corresponds with high tourist season. It is recommended to combine the ideal weather forecasts with high tourist season, when determining the length of operation of the bike share.
30 33
42
54
66
76 81 79
72
59
46
34
19 20
28
37
48
57
64 63
55
44
34
24
0.00
0.50
1.00
1.50
2.00
2.50
3.00
3.50
4.00
4.50
0
10
20
30
40
50
60
70
80
90
Jan Feb Mar Apr May Jun Jul Aug Sep Oct Nov Dec
Inch
es
De
gre
es
in F
are
nh
eig
ht
Port Huron Temperature and Precipitation
Average High Temp
Average Low Temp
Average Precipitation

61
Local Conditions and Opportunities Factors chosen to be significant specifically to Port Huron, and not covered within the analysis of community indicators, are local policies and regulations, public outreach and education, placemaking, economic development, and tourism. These factors, combined with anticipated users and community indicators tailored specifically to Port Huron, provide the foundation for recommendations on implementation of a bike share system.
Local Policies & Regulations Public policies and regulations can promote or inhibit the bike share implementation. St. Clair County has a Non-Motorized Plan, completed in 2009, that looks to accommodate bicycling, walking and other non-motorized travel methods. The County also has non-motorized guidelines and the St. Clair County 2030 Master Plan which complement the idea of a bike share program. St. Clair County and Port Huron desire to be a more transit friendly, bike friendly and walkable ‘place’. The St. Clair County Non-Motorized Guidelines (St. Clair County Nonmotorized Guidelines, 2005) incorporates AASHTO standards and places an emphasis on non-motorized facilities, while making recommendations. The St. Clair County 2030 Master Plan emphasizes the goals of bikability and walkability. Goal #11 of the Land Use and Change Management section promotes the creation of walkable communities that connect public spaces. The section emphasizes accommodating pedestrian-friendly developments, safe inviting, walking alternatives, promotion of social interaction and physical fitness, public, open and green spaces connected to trail systems, city centers more pedestrian friendly and enhancing the environmental quality of the county (St. Clair County 2030 Master Plan, 2009, Land Use and Management, pp. 31). The transportation portion of the 2030 plan encourages alternatives to relying on single-passenger automobiles with an emphasis on non-motorized transportation and linking and promoting public transit. Goal #10 of the transportation section seeks to establish opportunities for non-motorized access, multimodal facilities linked to employment, commerce and recreation and enhance community character.
Public Outreach & Education This section examines a brief look at groups that could work with the eventual implementation of a bike share in Port Huron. These groups can provide funding, advocating or education of the bike share as well as constitute a strong percentage of the users. Blue Water Young Professionals (BWYP) – The Blue Water Young Professionals is a non-profit group in the Blue Water community that strives to be a catalyst for enhancing the area through civic, social and business activities. The BWYP have focused programs in Downtown & Nightlife and Arts appreciation. Their desire to improve the area and enhance involvement and initiative in the local community makes them an asset in the implementation and stabilization of a bike sharing program in the area.
62
St. Clair County Community Services Coordinating Body (CSCB) - The CSCB is a non-profit “Community Collaborative,” working to promote inter-agency collaborative in St. Clair County to promote general wellness and healthy lifestyles. The CSCB is an organization that would be another asset in the implementation of a bike share in the area. St. Clair County Community College (SC4)- while also serving as a destination, is one of the primary target populations of a bike share program. SC4 would be an asset in funding and implementing the bike share program, as well as promoting and utilizing the program.
Placemaking, Economic Development, and Tourism Placemaking reshapes and creates quality communities where people want to live. Implementing placemaking principles into communities encompasses many factors and goals of different scales. There are short term and long term goals to attain these principles including:
Short Term Implementation Goals: o Individual projects o Corridors, nodes, centers o Quicker, cheaper projects first
Long Term Implementation Goals o Multiple transportation and housing options o Links to historic and regional attractions o Density, connectivity
Port Huron is already making strides in placemaking; with the River Walk area corridor downtown. Features such as sculptures, benches, bike racks, picnic tables, fire pits, art and food tents and access to promenades and plazas are already being established along the riverfront in an attempt to connect people to the downtown. Placemaking also encourages economic development (Myrick, Phil) and is an alluring destination for tourism (Hall, 2012). A bike sharing system would both complement and benefit the River Walk development and enhance placemaking in Port Huron through promotion of multi-modal transportation, environmental integrity and unique downtown features. Utilizing a bike share system in the downtown that coincides with the River Walk and bus system enhances St. Clair County’s goal to create walkable communities that connect public spaces throughout the town.

63
Demand Thresholds Paralleling the community indicators, thresholds were determined from the case studies above, including Salem, MA, Spartanburg, SC and Washington State University. These thresholds are compared to existing conditions in Port Huron, MI. The thresholds are estimates, with many assumptions, but used in order to determine the feasibility of Port Huron for a bike share, in compared to communities currently operating. The weight given each community indicator, or importance of the comparison, must be given close scrutiny by all those involved in bike share implementation, especially those with an in-depth understanding of trip attractions and trip generators in Port Huron. Other community indicators could include bicycling culture such as member of advocacy, general acceptance of bicycling in the community. Such a qualitative measure or potential community indicator has not been researched as of the writing of this report. Table 8, pp. 64 below is an assessment of each community indicator and its impact on a potential bike share for Port Huron. It contains a list of the community indicators (from the Demand Analysis p. 37), and the minimum threshold that Port Huron would have to be above in order to ‘Meet Criteria’ or qualify for a recommendation of a bike sharing system. A brief regional analysis is included to describe the situation in Port Huron, as related to the community indicator. For more detail on each indicator’s importance for bike share, and the existing conditions of Port Huron, refer back to the ‘Market Analysis of St. Clair County’ (pg. 39). Table 9, pp. 69, has a breakdown of the unit chosen as the ‘threshold’. Few thresholds have been found in the literature for a city the size of Port Huron, a mid-sized of approximately 30,000. Case studies were deemed the most appropriate measure of the compatibility of Port Huron for a bike share. Comparing the other communities with bike share to Port Huron required the classification of the indicators in terms of ratios. These ratios have never been scientifically tested and the data gathered is from multiple sources and different years. The foundation, however, and the general concepts were determined from the literature review of ‘anticipated users’ (pg. 37).

64
Community Indicators Criteria (see Table 9, pg. 70)
Regional Analysis Assessment (Meets Criteria, Does Not Meet)
Population Density City: 1,872 - 4,992 people per sq mi Campus: 4,949 - 28,300 people per sq mi See colored areas in GIS analysis. Centered in Port Huron.Port Huron is 3,740 people per sq mi Campus: 221,025 people per sq mi
Meets Criteria
Job Density 615 - 8,367 jobs per square mile See colored areas in GIS analysis. Centered in Port Huron.Port Huron has top employers in the County. Largest, at 1,142, is a health provider. Roughly, Salem, MA's health provider has 3,240 employees. Salem, MA has 1,273 jobs per sq mile, and Port Huron has 2,732.
Meets Criteria
Retail Density $13,139 retail sales per capita See colored areas in GIS analysis. Centered in Port Huron. Port Huron is $7,632. Does Not Meet Criteria
Bicycling Infrastructure 7.2 miles of bicycle facilities County has trail system, and robust regional future plan. Port Huron has local roads, with low traffic counts, and a shared used path, the Bridge to Bay Trail, which connect major community and tourist amenities.
Does Not Meet Criteria
Parks and Recreation Areas 8.8 acres of park per sq mi Concentration along waterfront, with connection to bicycling infrastructure. Port Huron has 14.25 acres of park in the city per square mile of city area.
Meets Criteria
Connection to Transit 3 bus routes; 500,000 riders per year One transit hub connection in Port Huron. High daily service, compared to population. 7 bus routes for County. ~900,000 uses per year.
Meets Criteria
Colleges 27% to 55% of total population is between 20 and 39 years 27% is total population of city between 20 and 39 years, the significant age of bike share trip user. 4,500 student potential from SC4. However, commuting college, no dormitories, or high population of college residents.
Meets Criteria
Income 48% to 68% of population that has a total annual household income of less than $50,000
County and Port Huron income is low compared to average in State of Michigan. 69% of Port Huron's population has a total annual household income of less than $50,000.
Does Not Meet Criteria
Race Minorities, or non-white, rarely use. Race is negligible for Port Huron. Over 85% white. Meets Criteria
Recreational Expenditures: Potential and Current
96 market potential index (MPI) for road bicycling Port Huron’s market potential index (MPI) for bicycling was 91. This is average compared to U.S. Conducting a community survey of expenditure habits is recommended.
Does Not Meet Criteria
Alternative Commuters: Distances and Mode Share
1.4% of population uses public transportation for commuting; 5.6% of population walks to work
Majority of employment is local to Port Huron, with 73% of population commuting less than 20 minutes. 1.1% uses public transportation to commute, 3.2% walks. New bicyclist demand unknown, community survey recommended.
Does Not Meet Criteria
Tourism Population N/A High visitor counts compared to local population. Need current tourism counts, expenditures, and hotel occupancy rates.
Not available.
Topography Slope 4% or higher Less than 4% grades across city. Slopes at a grade of 4% or higher are considered a major barrier for bicyclists. Appr. 140 miles of coastline (for recreation activities) available within County.
Meets Criteria
Weather Seasonal program, storage in winter. Seasonal programs ideal. Port Huron has mild summers, low precipitation. Harsh winters.
Meets Criteria (for seasonal use)
Sources: See descriptions below, pp. 66 - 69
Table 8: Demand Thresholds Compared by Case Studies to Port Huron
65
Below is a description of each indicator, the determination of the threshold, and the calculation of the threshold number. Indication is given whether Port Huron does or does not “meet criteria” (is above the minimum threshold). However, this is an unprecedented method in literature, and many assumptions were made. It is recommended future bike share planners, or the St. Clair County Metropolitan Planning Commission, assess the validity of the data source for the threshold. Please see a summary in Table 9, including all three case studies, compared to Port Huron, on pp. 70 and 71.
Population Density Spartanburg has a population of 37,000 and a land area of 19.8 square miles giving it a density of 1,870 people per square mile (U.S. Census Bureau, 2010, Spartanburg). Washington State University’s campus is an even one square mile and there are 28,300 people eligible to use the bike share program giving the campus a density of 28,300 per square mile (Facts and Figures, 2010-2011, WSU). Salem has a population of 41,000 and a land area of 8.3 square miles giving the city a density of 4,940 people per square mile (U.S. Census Bureau, 2010, Salem). Salem State University within the city of Salem has a student population of 9,658 and an area of .18 square miles giving the university a density of over 53,000 per square mile (Facts and Figures, 2013). Combining the Salem State University and the city’s population would give the area a total population of 50,658 leaving the city with a combined population density of 6,103 people per square mile. The city of Port Huron has a population of 30,000 and a land area of 8.1 square miles giving it a density of 3,740 people per square mile (U.S. Census Bureau, 2010, Port Huron). St. Clair County Community College has a student body of 8,841 and a land area of .04 square miles giving it a density of 221,025 people per square mile (“Facts about SC4”, 2013). Combining the student and city population gives the city a density of 4,795 people per square mile. The City of Port Huron and St. Clair County Community College meet criteria for the community indicator of “Population Density”.
Job Density Spartanburg, South Carolina has 615 jobs per square mile; the city employing 11,818 people over a city area of 19.2 square miles (Spartanburg, SC, Wikipedia.org). Washington State University employs 1,300 people and the campus is 1.0 square miles, therefore, the density of jobs is 1,300 jobs per square mile (Washington State University, Wikipedia.org). At Salem State University, 1,506 people are employed, and the campus is 0.18 square miles (Salem State University, Wikipedia.org). This relates to a job density of 8,367 jobs per square mile. The City of Salem employs 10,343 people, and has a square mileage of 8.1 (“Salem's Top Employers”, 2012). The job density per square mile is 1,273. In Port Huron, the job density is 2,732 jobs per square mile (with 21,857 jobs, and a city are of 8.0 square miles) (MDOT: Statewide Modal Unit, 2013; Port Huron, Wikipedia.org). On the St. Clair County Community College (SC4) campus, the density is 617 jobs per square mile (with 37
66
jobs and 0.06 square miles of campus) (MDOT: Statewide Modal Unit, 2013). The City of Port Huron meets criteria for the community indicator of “Job Density”.
Retail Density Spartanburg has retail sales per capita of $31,915 in 2007 (U.S. Census Bureau, 2010, Spartanburg). Washington State University does not have census data available for retail sales per capita. Salem, Massachusetts has retail sales per capita of $13,139 in 2007 (U.S. Census Bureau, 2010, Salem). Lastly, Port Huron has retail sales per capita of $7,632 in 2007 (U.S. Census Bureau, 2010, Port Huron). Port Huron’s retail sales per capita are low compared to the other communities. This would indicate that the retail establishments in Port Huron are not high trip attractors, or destinations. Thus, Port Huron does not meet criteria for the community indicator of “Retail Density”.
Bicycling Infrastructure Salem, MA, in 2010 had 2.34 miles of multi-use paths in the city, but as of today finished 4.85 miles of on- and off-road bicycle lanes with more planned (1.5 miles and extensions) in the immediate future (4.85 miles of Salem bike lane striping complete, 2011). Salem has road mileage of 88.5 miles (Faye, et al, 2010). Spartanburg, SC achieved Bicycle Friendly Community in 2006 from the League of American Bicyclists. Spartanburg currently has 90 miles of bicycle routes and trails (Partners for Active Living, 2011). Port Huron has approximately 4 miles of bicycle facilities, both on-road and off-road (Bridge to Bay Trail Map, stclaircounty.org; MDOT: Statewide Modal Unit, 2013). These do not count the number of low volume roadways, suited to bicycling. Port Huron does not meet criteria in terms of dedicated bicycle facilities.
Parks and Recreation Parks and areas for recreation activity is a community indicator as they provide destinations. The city of Spartanburg has 175 acres of parks and a total area of 19.8 square miles, therefore 8.8 acres of park space per square mile (City of Spartanburg). Washington State University’s campus can be considered a park itself as pedestrian traffic dominates the landscape. The campus is 640 acres, which equals 1 square mile (“Facts and Figures”, 2010-2011, WSU). Salem has 53 acres of parks in the city and a total land area of 8.1 square miles giving the city 6.4 acres of park per square mile (City of Salem, MA). Salem State University has 115 acres, or 0.18 square miles, of campus (“Facts and Figures”, 2013). Adding Salem State University campus to the city figure, there is 168 acres of parks, over 8.28 square miles, making the total 21 acres of park per square mile (“Facts and Figures”, 2013). Lastly, Port Huron has 117 acres of park in the city and a square mileage of 8.1 giving the city 14.5 acres of park per square mile (City of Port Huron). St. Clair County has 22,731 acres of recreation, parks, and open space (St. Clair County 2030 Master Plan, 2009, pp. 16). St. Clair County is 724 square miles (St. Clair County, Wikipedia.org). In the form of park density, Port Huron meets criteria for the community indicator of “Parks and Recreation”.
Connection to Transit Port Huron, MI has 7 standards bus routes, Salem, MA has 3 bus routes and ferry service, Spartanburg, SC has 8 and Pullman, WA has 12 full service routes, with 12 tripper options (BWAT; “Transportation”; spartabus.com; “Schedule Information”, 2013). Salem, MA, however,

67
is connected with the expansive Boston transit, Massachusetts Bay Transportation Authority (mbta.com) and has nearly 1,400,000 uses per year from residents. Spartanburg’s Spartabus has 500,000 uses per year while Pullman’s bus system is used over 1,500,000 times per year, as of 2011 (Pullman Transit). Port Huron is expected to increase ridership, currently at approximately 900,000 uses per year, with the construction of a transit hub in the next couple years (McElroy, Dave, personal communication, January, 2013). Port Huron meets criteria, based on the threshold of 3 bus routes.
Colleges The age of students that primarily use bike share is from 20-39 years (Daddido, 2012). Student populations can be a likely market for bike sharing programs because of their lower rates of automobile ownership (Bike Sharing in the United States: State of the Practice and Guide to Implementation, 2012). According to the 2010 U.S. Census, the population of Port Huron, MI was 30,184. The residents between the ages of 20-39 represented 27% of the total population, or 8,057 residents. The cities of Salem, MA and Spartanburg, SC are both comprised of residents, between the ages of 20-39, representing 31% and 27% of their total population, respectively, according to the 2010 U.S. Census. Spartanburg, SC, according to the 2010 U.S. Census, has a population of 37,013. The residents between the ages of 20-39 represented 27% of the total population, or 10,010 residents. Salem, MA, according to the 2010 U.S. Census, the population of Salem, MA was 41,340. The residents between the ages of 20-39 represented 31% of the total population, or 12,702 residents. The population of Pullman, WA (Washington State University, or the home of “Greenbike”) according to the 2010 U.S. Census is 29,799. The residents between the ages of 20-39 represented 55% of the total population, or 16,351 residents. Number of students enrolled on Washington State University’s main campus is 19,243 (“Quick Facts about WSU”). The student-faculty ratio is 16-1, thus the approximate number of faculty 1,203 (“Quick Facts about WSU”). Total population of campus is 20,446, students and faculty. Port Huron meets criteria for the community indicator of “Colleges”, or has an appropriate amount of students between the ages of 20 and 39, as compared to other case studies.
Community and Tourist Attractions The amount of “community and tourist attractions” varies greatly between cities, because of unique city-specific definitions of popular attractions. Therefore, visitor counts are not normally counted in a consistent manner. Port Huron has at least 12 attractions, as specified by previous plans and the St. Clair County Metropolitan Planning Commission. Consistent data is not available for case studies and Port Huron.
Tourism Population This information is not available on a consistent level for all case studies. Consistent data is not available for case studies and Port Huron.
Income The threshold chosen was the percent of the city population with an annual income of less than $50,000, because of a survey of Denver’s B-Cycle riders (Schmitt, 2013, “Why…”). The 2011 American Community Survey estimates that 69% of Port Huron’s total annual household
68
income is less than $50,000. The cities of Spartanburg, SC and Pullman, WA (home of Washington State University, or Greenbike) whom operate successful bike share programs, both recorded an estimate of 68% total annual household income less than $50,000, according to the 2011 American Community Survey. Salem, MA, according to the 2011, American Community Survey estimates that 48% of Salem, MA total annual household income is less than $50,000. Port Huron does not meet criteria, but only by 1%.
Recreational Expenditures: Potential and Current Market potential index (MPI) scores were used as a threshold, which is comparing the community to the U.S. as a whole, which is 100. Pullman, WA has an MPI bicycling (road) score of 188 ("Sports and Leisure Market Potential", Pullman), Salem, 106 ("Sports and Leisure Market Potential", Salem), and Spartanburg, 96 ("Sports and Leisure Market Potential", Spartanburg). Port Huron does not meet criteria with a score of 91, when based on market potential index scores. However, it is close to the U.S. score of 100. Alternative Commuters: Distances and Mode Shares Port Huron’s use of public transportation is 1.3% of the number of commuters (ACS, 2007-2011, Port Huron). Spartanburg, SC is close to Port Huron at 1.5% (ACS, 2007-2011, Spartanburg). Salem, MA and Pullman, MA however are far above, at 10.9% and 8.5%, respectively (ACS, Salem, MA; Pullman, MA). In Port Huron, 3.2% of the commuting population walks to work (ACS, 2007-2011, Port Huron). Spartanburg, SC captures 4.0%, Salem, MA captures 7.0%, and Pullman, WA (or Washington State University) captures 21.6% (ACS, 2007-2011, Spartanburg, SC; Salem, MA; Pullman, WA). Port Huron compares favorably with Spartanburg, SC on commuters. Pullman’s high percentage of walking highlights its university student body. Salem has a high public transportation commute share, due to its proximity to Boston and the commuters working in the metro-area. Port Huron does not meet criteria for commuters that use alternative commuting for work.
Topography From pg. 60 of Demand Analysis, Port Huron geography is flat. Slopes at a grade of 4% or higher are considered a major barrier for bicyclists (Bike sharing in the United States: State of the Practice and Guide to Implementation, 2012 p. 6). Port Huron meets criteria for topography, or the bicycling industry’s nationally accepted standard.
Weather All case study programs are seasonal. The need for a year round program would depend on the amount of tourist population and strength of the tourist attractions (refer to Demand Analysis, “Weather” on pg. 60 or “Tourism Population” on pg. 56). Port Huron meets criteria for a seasonal bike share program.

69
Community Indicators Spartanburg, SC Washington State University (Pullman, WA) Salem, MA Port Huron
Population Density 1,872 people per sq mi (37,000 population and
19.8 sq mi)
28,300 people per sq mi (Campus is 1 sq mile and
28,300 campus population including students,
faculty, staff)
University: 4,940 people per sq mi (population of 9,658 and an area of 0.18 sq mi)
City of Salem: 4,992 people per sq mile (41,000 population and 8.3 sq mi, exluding university students)
SC4: 221,025 people per sq mi (8,841 population and 0.04 square mi)
Port Huron: 3,740 people per sq mile (8.0 sq mi) (30,000 population and 8.1 sq mi)
Job Density 615 jobs per sq mi (11,818 jobs, 19.2 sq mi) 1,300 jobs per sq mi (1300 jobs, 1.0 sq mi) University: 8,367 jobs per sq mi (1506 college full and part time staff, 0.18 square mile campus)
Salem: 1,273 jobs per sq mi (8.1 sq mi Salem, 10,343 jobs)
SC4: 617 jobs per sq mi (37 jobs, 0.06 sq miles)
Port Huron: 2,732 jobs per sq mi (21,857 jobs, 8.0 sq mi)
Retail Density $31,915 retail sales per capita N/A $13,139 retail sales per capita St. Clair County: $9,424 retail sales per capita
Port Huron: $7,632 retail sales per capita
Bicycling Infrastructure 7.2 miles of bicycle facilities, on-road and off-
road
N/A 90 miles of bicycle facilities, on-road and off-road 37.5 miles of bicycle facilities, off-road
~4 miles of bicycle facilities, on-road and off-road
Parks and Recreation Areas 8.8 acres of park per sq mi (175 acres of parks
and 19.8 sq mi of city)
640 acres of "park" per sq mi (640 acres of
campus, 1 sq mi of bike share system)
SSU Campus: 115
acres of "park" per sq
mi (115 acres of
campus, 1 sq mi of
bike share system)
City: 6.4 acres of park per
sq mi (53 acres of parks
and 8.1 sq mi of city)
31 acres of park per sq mi (22,731 acres of park and 724 square miles of county)
14.5 acres of park per sq mi (117 acres of park in the city and 8.1 sq mi)
Connection to Transit 8 bus routes; ~500,000 uses per year 12 bus routes, ~ 1,500,000 uses per year 3 bus routes, ~1,400,000 uses per year 7 bus routes, approx. ~900,000 uses per year
Colleges 27% of total population is between 20 and 39
years
55% of total population is between 20 and 39
years
31% of total population is between 20 and 39 years
27% of total population is between 20 and 39 years
Income 68% of population has annual househould
income less than $50,000
68% of population has annual househould income
less than $50,000
48% of population has annual househould income
less than $50,000
69% of population has annual househould income
less than $50,000
Recreational Expenditures: Potential and Current
96 market potential index (MPI) for road bicycling 188 market potential index (MPI) for road bicycling 106 market potential index (MPI) for road bicycling 91 market potential index (MPI) for road bicycling
Alternative Commuters: Distances and Mode Share
1.5% of population uses public transportation for
commuting; 4.0% of population walks to work
8.5% of population uses public transportation for
commuting; 21.6% of population walks to work
10.9% of population uses public transportation for
commuting; 7.0% of population walks to work
1.3% of population uses public transportation for
commuting; 3.2% of population walks to work
Tourism Population N/A N/A N/A N/A
Topography Negligible Negligible Negligible Negligible
Sources: see sources above, pp. 66 - 69
Table 9: Demand Thresholds by Case Studies compared with Port Huron

70
Recommendations Bike share is recommended for St. Clair County, specifically Port Huron, however, with qualifications. Within the demand threshold analysis, from comparing existing systems with Port Huron’s community indicators, 8 community indicators met criteria, 5 did not, and 1 was undetermined. A limit to this analysis is the community indicators are not weighted. One indicator may be more important than others. The size of operations should be tailored to the characteristics of Port Huron demographics, and needs and desires of the residents of the community and the patterns of tourist activity. Bike share can use phases of expansion, but only after verification of financial sustainability (and social acceptance) of the first phase. A preliminary station location analysis is given, based off the community indicators, but with a final recommendation to perform community surveys to verify legitimacy of the station locations. A bike share programmatic summary is given, with topics including the system, bike and stations, financial feasibility and next steps. Finally, policy implications, future and supporting actions and a summary of implementation actions are detailed.
Station Location Analysis The demand analysis is only an estimate based on the most currently available information, trends within the bike share industry, and anticipated users for 2013. Stations should be located in order to maximize the number of highly visited attractions that can be reached within a short time period, and short distance. Stations can be placed on public or private property (“Bikesharing in the United States,” 2013). Basic recommendations suggest having alternatives available if the first desired location does not work. The locations should also be checked for cell reception, proper dimensions for the station style/bike share program chosen, among other details. Using the most prevalent threshold among the literature, ideal spacing for bike share stations or kiosks is 0.25 square miles. Bike share systems are currently services areas between 1.5 and 36 square miles (Bike sharing in the United States: State of the Practice and Guide to Implementation, 2012, p. 17). Stations are recommended within the black dashed area in Figure 22 below. The red grid if the left figure depicts distances between red dots. The red dots are solely for mileage, not potential stations. Specific bike share kiosk or station locations analysis can be built from this map, which incorporates retail establishments, employment, population and community and tourist attractions, and community surveys, discussed below. The area in the dashed black square represents the area that is approximately 0.5 miles from recreation facilities, including waterfront of the St. Clair River or the Black River. This black dashed area also includes a concentration of community attractions, including the regional transit hub, as well as dedicated facilities for bicycling, the Bridge to Bay trail and Port Huron River Walk.

71
Source: Google Earth, authors. Michigan Department of Transportation-Statewide Model Unit, February 2013
Figure 22: Potential Bike Share Location, Downtown Port Huron, MI
Roads not to scale

72
Source: (MDOT: Statewide Model Unit, 2013). Google Earth, authors.
Figure 23: Future Community and Tourist Attractions, Distance to Downtown
Roads not to scale
73
It is recommended to place the first stations at the St. Clair County Community College, the Port Huron hospital, given potential sponsorship and number of employees, and a highly visible location on Huron Ave, next to the bridge, in downtown, given proper signage for and to bicycle facilities. However, future facilities and their popularity, have the potential to outweigh the downtown area of Port Huron. Connections to the new convention center, hotel and Baker College Culinary Institute, once numbers are received, should also be heavily considered. The number of people (accounting for ideal age) expected to visit the Convention Center, hotel and the number of students enrolled (and/ or residing) at Baker College Culinary Institute (college students being ideal bike share riders), present this site as a potential bike share station. The site is connected currently, via multiple bicycling facilities, with amenities such as community attractions, retail, and parks, to downtown Port Huron. However, a station is recommended only if the number of visitors outweigh the density of downtown attractions, because the distance from downtown is approximately 1.7 miles (ideal station location is 0.25 miles gap (Bike Sharing in the United States: State of the Practice and Guide to Implementation, 2012, pp. 17), as seen in Figure 23. The bike share could follow a case study example in Salem, MA which has an operating bike share system and a station at a major hotel, which is 1.6 miles from another station on Salem State University campus. Within the black dashed area, (bounded by Glenwood Ave, 10th St., White St. and St. Clair River) the employment in this area is 6,038 people. The population is 2,069, and there are 64 retail establishments (23% of Port Huron’s retail), employing 340 people (Michigan Department of Transportation-Statewide Model Unit, 2013). Within Port Huron as a whole (using the ArcGIS Shapefile data), the population is 31,220, 21,857 employed persons, and there are 273 retail establishments, employing 1,798 people. Using only community indicators of employment, population (not accounting for age), and student population (4,500 attending SC4 during peak months), in the black dashed area of Figure 22, there are 12,607 people, which is highly unrealistic for the number of potential riders. This figure should be used as a base, from which to eliminate potential riders, from other community indicators, by weighting. Or, the number of expected bike share trips should not exceed this number, despite expected tourism estimates to future establishments, or the convention center. Bike share will divert traffic from other sources. These numbers were not accounted for within this study, due to unavailable traffic demand analysis studies in the St. Clair County. Diversion rates from other comparison cities, and other feasibility studies of comparable systems, have rates that would need too many assumptions to be of use in this study. Including these rates would only increase the number of possible bike share trips. Thus, the estimates of potential bike share trips in this study are low. The demand and station analysis is based solely on predictable characteristics of the community. The partners involved including their level of commitment, interest and dedication determines the sustainability of the program. Minnesota and Alta Planning, a well-respected consultant in non-motorized planning issues, completed a detailed feasibility study in 2009. They projected 14,500 subscribers based on a system with 80 stations and 1,000 bikes. However, 3 years later the system grew to 145 stations and 1,325 bikes and approximately

74
3,500 subscribers (Vars, Mitch. Personal communication. January 2013.). There is much variability between planning documents and the actual operation of the system once installed in the community. Since the data in this demand analysis was taken from multiple years, sources and without accountability for fluctuation through time, it is recommended to base the final recommended bike share and station locations on a combination of the market analysis (GIS demand analysis and community indicators) as well as community surveys.
Community Surveys Despite the intricate analysis via GIS, certain difficulties were present. The fluctuation per month, year within Port Huron and the County, of new construction, new businesses, and land use could be extreme and greatly affect the location of a station or the demand. Specific seasonal data sources were difficult to obtain. The availability of a complete set of data for a consistent year or years was also difficult. Especially because of the influx of summer tourists, changes in land use for boating and summer activities and number of open businesses in a specific area will fluctuate. Also, being in such close proximity to Sarnia, Canada, the data changes. Also, a fluctuation in unemployment rates would affect income, and the type of bike share users is reflected in income. In general, most data gathered within the GIS analysis is subject to change. From above, the spending potential index was low compared to the national average; however the amount of bicycling in Port Huron was average. To account for this, community surveys could be used for locating and determining optimal station locations, as well as determining bicycling demand. Within the research, stated preference surveys were found to be as accurate in some cases, as the detailed GIS analysis. The GIS data is primarily static, and residents and professionals in the County and City of Port Huron could be a more reliable and accurate source of data for determining travel demand. As such, it is recommended to perform a community wide survey for the demand for bicycling and bike share, the promotion of the system, and to analyze the desired placement of stations. Chattanooga, TN (population 170,000), in a recent launch of bike share, used a simple survey beforehand, finding 75% of respondents had some level of interest (Schmitt, 2013, “Chattanooga…”). The community survey could be based on existing practices of a functioning bike share system in Boulder, CO (Boulder, B-Cycle, 2013). Lansing, MI, though having no implementation plan set, employed a simple online survey through survey monkey (advertised through Facebook and neighborhood associations) and received at least 1,000 responses. A link to the survey can be found here: http://www.bikelansing.org/bikeshare/ . The 12 question survey was basic, first a paragraph explaining bike share, questions on bicycling habits, two maps on which to place a point for their desired pick-up station location and drop-off station location, and options for the desired method of payment. Finally, a comment box was provided, and an option for an email address. All answer boxes (except comment, zip code and map questions) were multiple choice answers. Santa Clara Valley combined the data collection of number of people, workers and students in a specific location, or mile radius, and surveyed them on the likelihood of their use of bike share. They applied this percentage to the amount of potential users. They conducted scenario and financial planning from here, based on the amount of funding available to them.

75
To provide potential station locations, and to identify trends within the GIS analysis, a survey of 45 professionals from Port Huron was performed via email, with 11 responses (24% response rate). A list of contacts was given by the St. Clair Planning Commission and each contact provided their top five locations based on their professional knowledge, and experience from residency. They represented a diverse sample of professionals, from different government departments, non-profits, private companies and small local businesses. The question was “What are the top five potential locations that you see a bike share kiosk (a bike rack or checkout point for bikes) being used the most?” with answers in Table 10 below.
Top Seven Station Locations in Port Huron
1. YMCA, Desmond's Landing, Vantage Pt, Maritime Center
2. Future Convention Center, Thomas Edison Inn (nearest the international crossing or Blue Water Bridge)
3. Quay Street, Blue Water Transit Hub (“busiest part of downtown”)
4. St. Clair County Community College campus
5. Pine Grove Park
6. Fort Gratiot Light House
7. McMorran Place Table 10: Bike Share Station Locations in Port Huron
The results are similar to the GIS analysis and the locations of the top employers, most attractive tourist destinations or community attractions and largest concentration of students. However, via this survey, the largest employer in the City was not included, the Port Huron hospital, who is most likely to be able to sponsor a potential station.
Bike Share Programmatic Summary The first phase of a bike share system recommended for Port Huron is the fourth generation system, with a focus on computer aided technology, and branding. From existing literature and small scale bike share systems currently operating in the United States in cities similar to Port Huron, a stationary kiosk, or bike share station, is recommended. It helps promote awareness and understanding of the system, a where and how to check out a bike, the cost, and a reference frame to destinations and bicycling facilities in the area.
System The bike and station provider would be determined by competitive bid, or a cost comparison based on the budget of the bike share program owner. B-cycle (bcycle.com) is the most prevalent bike share provider in the U.S., although independent systems could be available within a few years with pilot programs of lower price (A2B, Ann Arbor’s recent startup bike share company, a2bbikeshare.com). B-cycle does offer a new amenity in that annual membership purchase would allow the user to access all B-cycle bike shares operating throughout the United States (15 systems) (Boulder B-Cycle March Newsletter, Personal communication, March 2013). Bicycles and stations could be outfitted with minimal technology, (the check-out system be a hotel voucher, or community college ID), or with high level technology (solar panels, or GPS tracking of the bicycles and their use). The use of higher

76
technology provides more ease of use, more security for the bicycle, branding and marketing opportunities, more efficiency energy use, and a station ‘off the grid’, which is able to be transported to an alternate location easily. The system should also coordinate with local bike rental operations. From an interview with the owner of the local bicycle shop, the Thomas Edison Museum and hotel rents bicycles. The program is run by Suzanne Bennett ([email protected], 810-982-0891).
Bikes and Stations Preliminary station locations would be locations spaced 0.25 miles apart. “Most existing U.S. systems include a range of 3.5 to 5 bike share stations per square mile of service area” (Bike Sharing in the United States: State of the Practice and Guide to Implementation, 2012, pp. 18). The recently launched Chattanooga bike share operating manager stated that “stations need about 15 docks to be efficient from an operations standpoint and data shows that about a 2:1 ratio of docks to bikes is needed” (Pugliese, Philip. Personal communication. 2013). It is recommended that a website is provided or created, fully branded to the color and look of the physical bicycle in operation. Access would be by use of the kiosk, by credit card or by membership code ordered via website. A payment requirement is recommended, for security and deterrence of bicycle theft via a hold on a credit card, and for long term financial sustainability of the system. For ease of operation (for determination of bike share locations, available drop off slots or bicycles available for pick up) a smart phone application could be used, for example, via www.spotcycle.net.
Financial feasibility A financial feasibility or assessment study of Port Huron area is recommended as a follow up to this report. This is recommended before station location determination. Chattanooga, TN’s implementation method was to obtain all money, and to roll out their stations and system based on the amount available, through businesses and major corporate sponsorship (Pugliese, Philip, Personal communication, February 20, 2013). Once grants are applied for and awarded, then sponsors could be sought and chosen. The study should identify large corporations, businesses, or local advocacy groups that can provide start-up funding (the largest costs for bike share being capital costs). Part of the ongoing bike share planning, and financial assessment, partnerships need to be defined, needed tasks, the commitments of time and money required, is key to bike share success. The financial study should have a goal of sustainability for the program. Financial benchmarks should be identified, with time frames. Bike share needs long term financial commitments, preferably from a sponsor that had committed a station. The commitments could also take many forms, or marketing, staff time, etc. and can be in the form of a contract, with monthly or yearly success benchmarks in order for the system to receive additional funding. During or after the financial study, a determination should be made to if a public or private entity will run the operations. (For the benefits and challenges of each, see “Case Study Analysis”, pg. 23). This entity, or hired consultant depending on funding, could own and monitor the system.

77
As shown in Table 4, in “Funding” on pg. 32 a consistent pricing model is seen across bike share programs, which is the model recommended for Port Huron. The first 30 minutes of use is free, and after the first half hour, there is an increase in price per additional 30 minutes, until it caps out at $6 to $8.00. A maximum cost per day is recommended, less than $100.00 (Nice Ride Minnesota, 2013). For subscriptions that are 24 hours or 3 days, a slightly more costly pricing model is recommended, in order to encourage purchase of monthly passes, or membership. As Port Huron is a smaller city, it is recommended that the city follow a pricing scale similar to Spartanburg B-cycle’s, of $5 daily cost, free first hour, and each additional half hour $1. For a program with 2 stations, with 11 docks, from Table 6 in funding, on pg. 34, the stations are appoximately $38,000 a piece, including 6 bikes, capital costs are approximately $76,000. Maintenance and operating costs at approximately $13,500 per station would equal $27,000 per year. Capital costs are primarily covered with grants, and sponsorship; however maintenance and operating costs are covered with 100% local funds. Few systems have seen complete funding sustainability thus far, however expectations are high. Washington, DC is beginning to see funding sustainability, and some systems are seeing growth far exceeding planning expectations. Currently there is no research stating the rides needed per bike for financial sustainability. To determine a benchmark, more research is required. Successful systems such as Capital Bikeshare, D.C. and NiceRide, MN have seen more financial success from casual users rather than the annual membership. The more years the station is in place, it is assumed the demand will increase (depending on marketing, continued commitments from the local businesses, sponsors, etc.). For an example of the revenue generated by the number of users in a single season, see Table 11.
Number of Users Days of Use per Week Weeks per Season Fee per Trip Revenue
8 7 28 $5 (daily fee) $7,840
100 n/a n/a $15 (30 day pass) $1,500
100 n/a n/a $30 (annual pass) $3,000
Total $12,340
Table 11: Sample Revenue Calculation
For an example of the operating costs minus revenue, see Table 12 below.
Operating Costs (2 stations, 6 bikes each)
Revenue Total Costs per Year
$27,000 $12,340 $14,660
Table 12: Sample Operating Costs
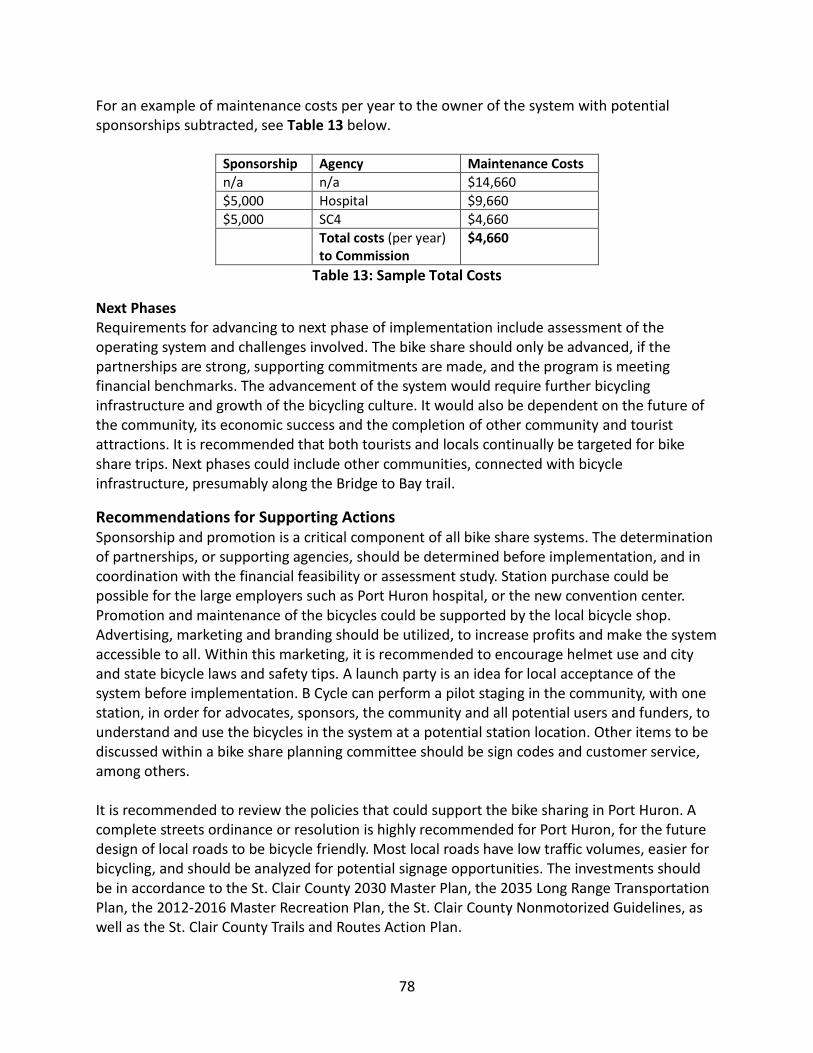
78
For an example of maintenance costs per year to the owner of the system with potential sponsorships subtracted, see Table 13 below.
Sponsorship Agency Maintenance Costs
n/a n/a $14,660
$5,000 Hospital $9,660
$5,000 SC4 $4,660
Total costs (per year) to Commission
$4,660
Table 13: Sample Total Costs
Next Phases Requirements for advancing to next phase of implementation include assessment of the operating system and challenges involved. The bike share should only be advanced, if the partnerships are strong, supporting commitments are made, and the program is meeting financial benchmarks. The advancement of the system would require further bicycling infrastructure and growth of the bicycling culture. It would also be dependent on the future of the community, its economic success and the completion of other community and tourist attractions. It is recommended that both tourists and locals continually be targeted for bike share trips. Next phases could include other communities, connected with bicycle infrastructure, presumably along the Bridge to Bay trail.
Recommendations for Supporting Actions Sponsorship and promotion is a critical component of all bike share systems. The determination of partnerships, or supporting agencies, should be determined before implementation, and in coordination with the financial feasibility or assessment study. Station purchase could be possible for the large employers such as Port Huron hospital, or the new convention center. Promotion and maintenance of the bicycles could be supported by the local bicycle shop. Advertising, marketing and branding should be utilized, to increase profits and make the system accessible to all. Within this marketing, it is recommended to encourage helmet use and city and state bicycle laws and safety tips. A launch party is an idea for local acceptance of the system before implementation. B Cycle can perform a pilot staging in the community, with one station, in order for advocates, sponsors, the community and all potential users and funders, to understand and use the bicycles in the system at a potential station location. Other items to be discussed within a bike share planning committee should be sign codes and customer service, among others. It is recommended to review the policies that could support the bike sharing in Port Huron. A complete streets ordinance or resolution is highly recommended for Port Huron, for the future design of local roads to be bicycle friendly. Most local roads have low traffic volumes, easier for bicycling, and should be analyzed for potential signage opportunities. The investments should be in accordance to the St. Clair County 2030 Master Plan, the 2035 Long Range Transportation Plan, the 2012-2016 Master Recreation Plan, the St. Clair County Nonmotorized Guidelines, as well as the St. Clair County Trails and Routes Action Plan.
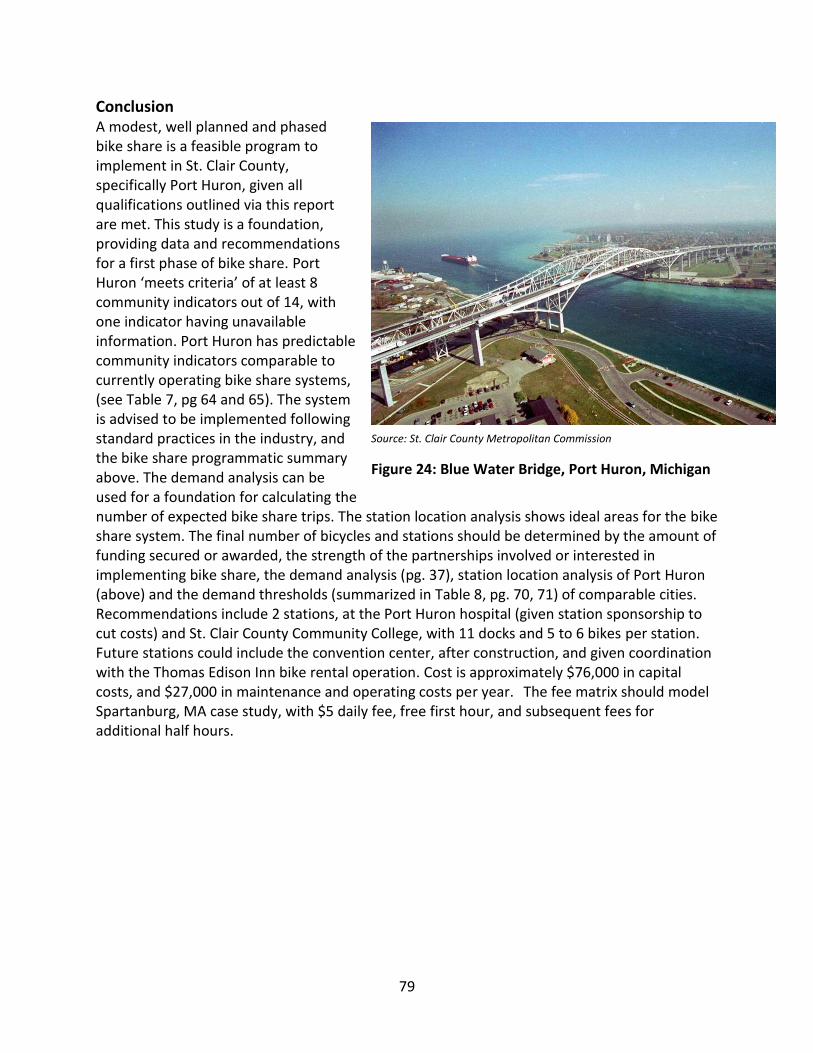
79
Conclusion A modest, well planned and phased bike share is a feasible program to implement in St. Clair County, specifically Port Huron, given all qualifications outlined via this report are met. This study is a foundation, providing data and recommendations for a first phase of bike share. Port Huron ‘meets criteria’ of at least 8 community indicators out of 14, with one indicator having unavailable information. Port Huron has predictable community indicators comparable to currently operating bike share systems, (see Table 7, pg 64 and 65). The system is advised to be implemented following standard practices in the industry, and the bike share programmatic summary above. The demand analysis can be used for a foundation for calculating the number of expected bike share trips. The station location analysis shows ideal areas for the bike share system. The final number of bicycles and stations should be determined by the amount of funding secured or awarded, the strength of the partnerships involved or interested in implementing bike share, the demand analysis (pg. 37), station location analysis of Port Huron (above) and the demand thresholds (summarized in Table 8, pg. 70, 71) of comparable cities. Recommendations include 2 stations, at the Port Huron hospital (given station sponsorship to cut costs) and St. Clair County Community College, with 11 docks and 5 to 6 bikes per station. Future stations could include the convention center, after construction, and given coordination with the Thomas Edison Inn bike rental operation. Cost is approximately $76,000 in capital costs, and $27,000 in maintenance and operating costs per year. The fee matrix should model Spartanburg, MA case study, with $5 daily fee, free first hour, and subsequent fees for additional half hours.
Source: St. Clair County Metropolitan Commission
Figure 24: Blue Water Bridge, Port Huron, Michigan

80
Bibliography
4.85 miles of Salem bike lane striping complete. (2011, June). Salem Patch. Retrieved from
http://salem.patch.com/articles/485-miles-of-salem-bike-lane-striping-complete
Alta Planning + Design. (2012, January). “King County Bike Share Business Plan.” Retrieved from http://pugetsoundbikeshare.org/wp-content/uploads/2012/07/KCBS_Business_Plan_FINAL.pdf
American Community Survey (ACS) Population Survey. (2005-2009). American Community Survey, U.S. Census Bureau.
American Community Survey (ACS), Port Huron, MI. 2007-2011, Retrieved from http://factfinder2.census.gov/faces/tableservices/jsf/pages/productview.xhtml?pid=ACS_11_5YR_DP03).
American Community Survey (ACS), Pullman, WA. 2007-2011. Retrieved from http://factfinder2.census.gov/faces/tableservices/jsf/pages/productview.xhtml?pid=ACS_11_5YR_DP03
American Community Survey (ACS), Salem, MA. 2007-2011, Retrieved from http://factfinder2.census.gov/faces/tableservices/jsf/pages/productview.xhtml?pid=ACS_11_5YR_DP03
American Community Survey (ACS), Spartanburg, SC. 2007-2011, Retrieved from http://factfinder2.census.gov/faces/tableservices/jsf/pages/productview.xhtml?pid=ACS_11_5YR_DP03
Austermuhle, Martin. (2012). “Maryland Gets Closer to Joining Capital Bikeshare”. DCist. Retrieved from http://dcist.com/2012/05/pg_county_bikeshare_study.php
Bike Sharing in the United States: State of the Practice and Guide to Implementation. (2012, September). Toole Design Group and Pedestrian and Bicycle Information Center. http://www.bicyclinginfo.org/promote/bikeshareintheus.pdf
Bike Sharing Research in the US. (2013). Bikes Belong, Stats and Research. Retrieved from http://www.bikesbelong.org/resources/stats-and-research/research/bike-sharing-in-the-united-states/
Bikesharing in the United States. (2013). Pedestrian and Bicycle Information Center Retrieved from http://www.youtube.com/watch?v=ClTr-DTZqps
Blue Water Area Convention and Visitors Bureau. (2013, March).
Blue Water Area Transit (BWAT). Retrieved from http://www.bwbus.com/

81
Border Economic Impact on Blue Water Area, Michigan. (2009, October). Retrieved from http://www.cis.stclaircounty.org/downloads/borderimpactreportchmura.pdf
Boulder, B-Cycle. (2013, November). Retrieved from http://boulder.bcycle.com/tabid/435/itemid/310/news.aspx
Buck, Darren. (2013). “Bike sharing systems push to reach underrepresented groups”. Washington Post. Retrieved from http://greatergreaterwashington.org/post/17321/bike-sharing-systems-push-to-reach-underrepresented-groups/
Burnham, Ted. (2012, May). “Why Do Bike-Share Riders Skip Helmets?” Shots. NPR. Retrieved from http://www.npr.org/blogs/health/2012/05/03/151955048/why-do-bike-share-riders-skip-helmets
Capital Bikeshare. (2013). Alta Bicycle Share, Inc. Retrieved from www.capitalbikeshare.com
Caywood, Matt. (2012, April). “Are smarter bikes in the future for bike sharing?” Greater, Greater Washington. Retrieved from http://greatergreaterwashington.org/post/14552/are-smarter-bikes-in-the-future-for-bike-sharing/
Cincinnati Bikeshare Feasibility Study. (2012, September). Prepared by Alta Planning and Design. Retrieved from http://www.cincinnati-oh.gov/bikes/linkservid/241025ED-EFF8-8292-C6AC74C67C3F7FA/showMeta/0/
City of Port Huron. (2006-2010). City Profiles. SEMCOG. American Community Survey. Retrieved from http://www.semcog.org/Data/Apps/comprof/economy.cfm?cpid=6135
City of Port Huron. (2013). Retrieved from porthuron.org
City of Salem, Massachusetts. (2013). Retrieved from salem.com
City of Spartanburg, South Carolina. (2013). Retrieved from cityofspartanburg.org
Communities Putting Prevention to Work. (2010). Center for Disease Control and Prevention. Retrieved from http://www.cdc.gov/CommunitiesPuttingPreventiontoWork/communities/profiles/pdf/CPPW_CommunityProfile_B1_Minneapolis_MN_508.pdf
Comprehensive Trend Report. (2010). Esri forecasts for Port Huron and St. Clair County. Consumer Expenditure Surveys, Bureau of Labor Statistics.
Congestion Mitigation and Air Quality Improvement Program (CMAQ). (2013). League of American Cyclists. Retrieved from www.BikeLeague.Org

82
Daddido, D. (2012). “Maximizing Bicycle Sharing: an empirical analysis of capital bikeshare usage”. University of North Carolina. http://rethinkcollegepark.net/blog/wp-content/uploads/2006/07/DaddioMP_Final-Draft.pdf
DeMaio, Paul. (2009). "Bike-sharing: History, Impacts, Models of Provision, and Future". MetroBike. Journal of Public Transportation. Vol 12. No. 4. Retrieved from http://www.nctr.usf.edu/jpt/pdf/JPT12-4DeMaio.pdf INTEXT (p. 42, 43).
Demographic and Income Profile. (2010). Esri forecast for Canada for 2012. U.S. Census Bureau.
Disposable Income. U.S. Department of Commerce. Bureau of Economic Analysis. Retrieved from http://www.bea.gov/iTable/iTable.cfm?reqid=70&step=1#reqid=70&step=1
Disposable Income. U.S. Department of Commerce. Bureau of Economic Analysis. Retrieved from http://www.bea.gov/iTable/iTable.cfm?reqid=70&step=1#reqid=70&step=1
Economic Development Alliance of St. Clair County. (2010). http://www.edascc.com/topemployers.php
Environmental Protection Agency, United States (EPA). 2013. Retrieved from http://www.epa.gov/sustainability/basicinfo.htm#sustainability
Facts about SC4. (2013). St. Clair County Community College. Retrieved from http://www.sc4.edu/show.php?title=Facts%20about%20SC4&category=Media%20
Facts and Figures. (2013). Salem State University. Retrieved from http://www.salemstate.edu/about/facts.php.
Facts and Figures. (2010-2011). Washington State University (WSU). Retrieved from http://facts-figures.wsu.edu/pdfs/1011factsfigures.pdf
Facts and Figures. (2010-2011). Washington State University. Retrieved from http://facts-figures.wsu.edu/pdfs/1011factsfigures.pdf
Faye, et al. (2010). City of Salem Department of Planning & Community Development, Engineering Department. Bicycle circulation master plan. Retrieved from http://www.salem.com/Pages/SalemMA_BComm/circulation?textPage=1
Gustafson, Sven. (2012, September). “Backers of bike sharing program in Detroit to conduct feasibility study.” A Healthier Michigan. Retrieved from http://www.ahealthiermichigan.org/2012/09/26/backers-of-bike-sharing-program-in-detroit-to-conduct-feasibility-study/
Hall, Michael C.. (2012, April). "Tourism Place-making: Governance of Locality in Sweden." Annals of Tourism Research. Volume 39, Issue 2: pp. 547-570.
83
Kaplan, Melanie. (2010, November). “DC Unveils Country’s Largest Bike Share Program.” Smart Planet. CBS. Retrieved from http://www.smartplanet.com/blog/pure-genius/dc-unveils-countrys-largest-bike-share-program/4940
Mary Black Foundation. (2013). Mary Black Foundation. Retrieved from maryblackfoundation.org
Michigan Department of Transportation (MDOT). History. Retrieved from http://www.michigan.gov/mdot/0,4616,7-151-9618_11070-22062--,00.html
Michigan Department of Transportation (MDOT): Statewide Model Unit. (2013, February).
Michigan Traffic Crash Facts. (2011) Michigan Office of Highway Safety Planning. Retrieved from http://publications.michigantrafficcrashfacts.org/2011/MTCF_CountyProfiles_2011.pdf
Monterey County Draft Bicycle Sharing Feasibility and Implementation Plan. (2012, October).
California. Transportation Agency for Monterey County (TAMC). Prepared by Economic & Planning Systems and Fehr & Peers. Retrieved from http://www.tamcmonterey.org/programs/bikeped/pdf/TAMC-DraftBikeShareFeasiblityStudy-2012.pdf
Myrick, Phil. "The Power of Place: A New Dimension for Sustainable Development." Editorial. Project for Public Spaces. Retrieved from http://www.pps.org/reference/the-power-of-place-a-new-dimension-for-sustainable-development/
Nice Ride Minnesota Bike Share Expands to North Minneapolis. (2012, October). Minneapolis Department of Health. Retrieved from http://www.minneapolismn.gov/health/cppw/dhfs_nicerideexpansion
Nice Ride Minnesota. (2013). Retrieved from www.niceridemn.org
Partners for Active Living. (2012). Biketown spartanburg. Retrieved from http://www.biketownspartanburg.org/
Population Study. (2005-2009). American Community Survey. U.S. Census Bureau.
Profile of General Population and Housing Characteristics. (2010). Demographic Profile Data. Port Huron. American FactFinder. U.S. Census Bureau.
Public Bikesharing in North America: Early Operator and User Understanding. (2012, June). Mineta Transportation Institute. http://transweb.sjsu.edu/PDFs/research/1029-public-bikesharing-understanding-early-operators-users.pdf

84
Pullman Transit. City of Pullman, WA. 2012 - 2017 Transit Development Plan. Retrieved from http://www.pullman-wa.gov/departments/pullman-transit/pullman-transit-info/877-2012-2017-transit-development-plan
Quick Facts about WSU. Washington State University. Retrieved from http://about.wsu.edu/about/facts.aspx
Recreational Expenditures. (2006-2007) Esri forecast for Port Huron for 2011. Consumer Expenditure Surveys. Bureau of Labor Statistics. U.S. Census Bureau.
Roy, Matthew. (2011, September). “Bicycle-sharing Program Starts in Salem Today” The Salem News. Retrieved from www.SalemNews.com
Salem's Top Employers. 2012, March. City of Salem, MA. Retrieved from http://www.salem.com/Pages/SalemMA_EcDev/topemp
Schedule Information (2013, January). City of Pullman, WA. Retrieved from http://www.pullman-wa.gov/departments/pullman-transit/bus-schedule
Schmitt, A. (2013, February). “Chattanooga Bike-Share: Lessons for Smaller Cities.” DC.StreetsBLOG.org. Retrieved from http://dc.streetsblog.org/2013/02/11/chattanooga-bike-share-lessons-for-smaller-cities/
Schmitt, A. (2013, February). “Why Isn’t Bike-Share Reaching More Low-Income People?” DC.StreetsBLOG.org. Retrieved from http://dc.streetsblog.org/2012/10/03/why-isnt-bike-share-reaching-more-low-income-people/
Schoner, J. (2012, May). Humphrey School and Civil Engineering, University of Minnesota. Retrieved from http://www.cts.umn.edu/events/conference/2012/documents/presentations/24-schoner.pdf
SCVTA Bike Share Business Plan. (2010, April). Economic & Planning Systems, Inc. Retrieved from http://www.vta.org/bike_information/pdf/Final%20VTA%20Bike%20Share%20Business%20 Plan_040110.pdf
Sea Grant Michigan. “Recreation Profile: Biking”. Southern Lake Huron Assessment. www.miseagrant.umich.edu/research/projects/huron
Seattle Bike Share Feasibility Study. University of Washington. Retrieved from http://seattlebikeshare.org/Seattle_Bike-Share_files/SeattleBikeShareFull Report.pdf

85
Shaheen, Susan; Guzman, S., and H. Zhang. (2010). "Bikesharing in Europe, the Americas, and Asia: Past, Present, and Future". Transportation Research Record: Journal of the Transportation Research.
Spartanburg B-cycle. (2013). Retrieved from spartanburg.bcycle.com
Sports and Leisure Market Potential. Esri forecasts 2011-2016 for Port Huron. GfK MRI.
Sports and Leisure Market Potential. Esri forecasts 2011-2016 for Pullman. GfK MRI.
Sports and Leisure Market Potential. Esri forecasts 2011-2016 for Salem. GfK MRI.
Sports and Leisure Market Potential. Esri forecasts 2011-2016 for Spartanburg. GfK MRI.
Sports and Leisure Market Potential. Esri forecasts 2011-2016 for St. Clair County. GfK MRI.
St. Clair County 2030 Master Plan. (2009, June). Land Use and Management. Retrieved from http://cis.stclaircounty.org/mpsummary2030.asp
St. Clair County 2035 Long Range Transportation Plan. (2009). St. Clair County Metropolitan Planning Commission. http://cis.stclaircounty.org/downloads/st_clair_county_2035_lrtp.pdf
St. Clair County Master Recreation Plan. (2009). Forecasts for years 2012-2016. Chapter 2 Community Description Retrieved from http://www.stclaircounty.org/offices/parks/plan.aspx
St. Clair County Nonmotorized Guidelines. (2005, September). Submitted to Michigan Department of Transportation. Greenway Collaborative and Midwestern Consulting. Retrieved from http://greenwaycollab.com/Projects/St.Clair_County_NoMo_Guidelines/StClairNoMo.htm
St. Clair County Trails and Routes Action Plan. (2007). Greenway Collaborative and Midwestern Consulting. Retrieved from http://greenwaycollab.com/Projects/St.Clair_County_Trails_and_Routes_Action_Plan/SCC_Trails_AP.htm
St. Clair County, Michigan. Metropolitan Planning. Retrieved from http://www.stclaircounty.org/Offices/metro/Default.aspx
St. Clair County. Michigan Traffic Crash Facts. “County Profiles 2011 St. Clair.” Michigan: 2012. Web. 20 Feb 2013. http://publications.michigantrafficcrashfacts.org/2011/MTCF_CountyProfiles_2011_St_Clair.pdf

86
Transportation Alternatives Program. Michigan Department of Transportation (MDOT). Retrieved from www.michigan.gov/tea
Transportation Sustainability Research Center (TSRC). University of California Berkeley. Retrieved from http://tsrc.berkeley.edu/bikesharing
Transportation. City of Salem, MA. Retrieved from http://salem.org/advertisers/C14
University of California Irvine. (UCI). (2013). Zotwheels. Retrieved from http://www.parking.uci.edu/zotwheels/main.cfm
U.S. Census Bureau (2010) State and City Quickfacts: Spartanburg, South Carolina. Retrieved from http://quickfacts.census.gov.
U.S. Census Bureau (2010) State and City Quickfacts: Spartanburg, South Carolina. Retrieved from http://quickfacts.census.gov.
U.S. Census Bureau. (2009-2011). Michigan. American Community Survey.
U.S. Census Bureau. (2005-2009). “ACS Population Survey”. American Community Survey.
U.S. Census Bureau. (2005-2009). “Population Study”. American Community Survey.
U.S. Census Bureau. (2007-2011). Retrieved from http://quickfacts.census.gov/qfd/states/26/2665820.html
U.S. Census Bureau. (2007-2011). Retrieved from www.census.gov
U.S. Census Bureau. (2009-2011). Michigan. American Community Survey. Retrieved from www.census.gov
U.S. Census Bureau. (2009-2011). Michigan. American Community Survey.
U.S. Census Bureau. (2010) State and City Quickfacts: Port Huron, Michigan. Retrieved from http://quickfacts.census.gov.
U.S. Census Bureau. (2010). State and City Quickfacts: Salem, Massachusetts. Retrieved from http://quickfacts.census.gov.
U.S. Census Bureau. 2010. Retrieved from www.census.gov
U.S. Census. (2007-2011). Retrieved from http://quickfacts.census.gov/qfd/states/26/2665820.html
U.S. Department of Transportation (DOT). (2013, July). “Frequently asked Questions and Answers concerning Bike Sharing Relative to the United States Department of

87
Transportation.” Retrieved from http://www.fhwa.dot.gov/environment/bicycle_pedestrian/funding/faq_bikeshare.cfm
Washington State University (WSU). (2013). Greenbike. Retrieved from http://www.greenbike.wsu.edu/
Weir, Kytja. (2012, October). “DC to Add Ads to Capital Bike Share Stations.” Washington Examiner. Retrieved from http://washingtonexaminer.com/d.c.-to-add-ads-to-capital-bikeshare-stations/article/2511938