SStatu's of Complex Welded Structures Involving Metals … · review of concepts and status of...
89
•NR fRtport 6"0e tu Revieow of Concepts and SStatu's of Procedures for Fracture-Safe Design of Complex Welded Structures Involving Metals of Low to Ultra-High Strength Levels W. S. PErLLNi, R. J. (kOODm, P. P. PUZAK, E. A. LANGZ AND R. W. HUBER MeAfdwgy Diiion rHARD COPY $ • M OCHE - - June 1965 DDC ULC4A E L *a E U.& NAVAL RLI.RCI LABORATORY wa i D.C.
Transcript of SStatu's of Complex Welded Structures Involving Metals … · review of concepts and status of...

•NR fRtport 6"0e
tu Revieow of Concepts andSStatu's of Procedures for Fracture-Safe Design
of Complex Welded Structures Involving Metalsof Low to Ultra-High Strength Levels
W. S. PErLLNi, R. J. (kOODm, P. P. PUZAK,E. A. LANGZ AND R. W. HUBER
MeAfdwgy Diiion
rHARD COPY $ •
M OCHE - -
June 1965
DDC
ULC4A E L*a E
U.& NAVAL RLI.RCI LABORATORYwa i D.C.
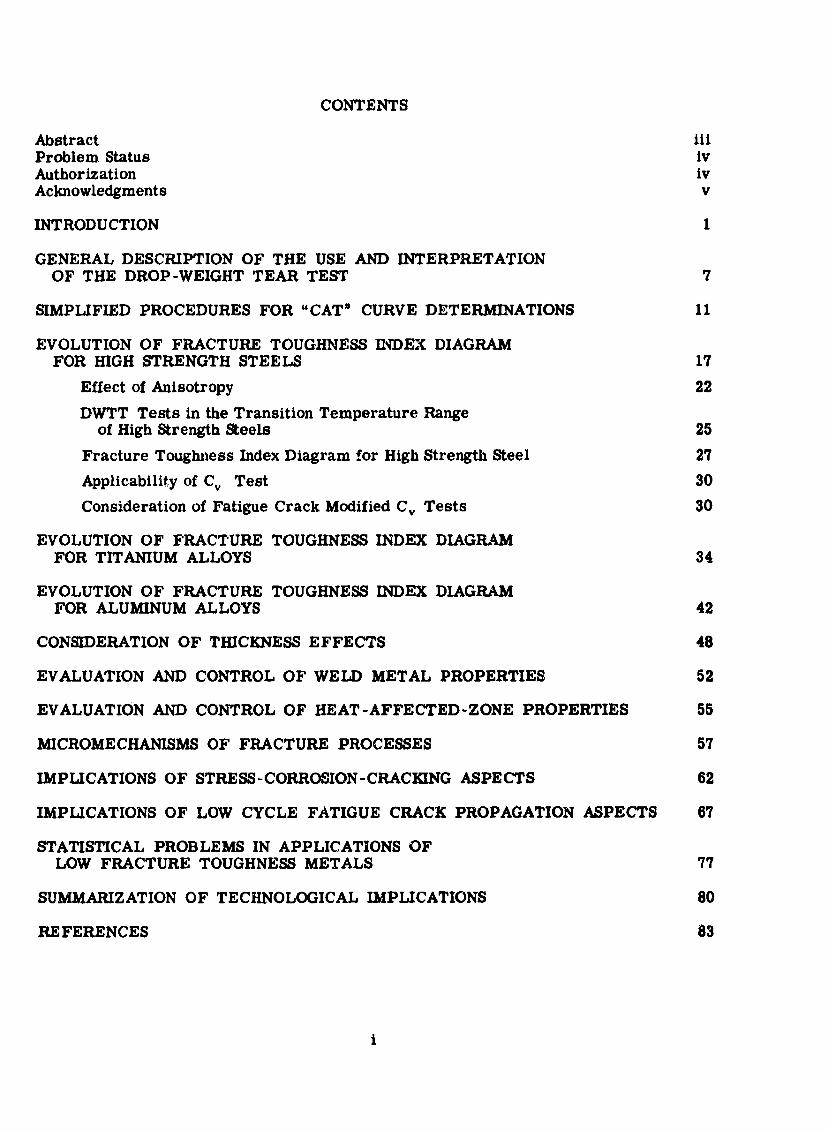
CONTENTS
AbstractProblem Status ivAuthorization ivAcknowledgments v
INTRODUCTION 1
GENERAL DESCRIPTION OF THE USE AND INTERPRETATIONOF THE DROP-WEIGHT TEAR TEST 7
SIMPLIFIED PROCEDURES FOR "CAT" CURVE DETERMINATIONS 11
EVOLUTION OF FRACTURE TOUGHNESS INDEX DIAGRAMFOR HIGH STRENGTH STEELS 17
Effect of Anisotropy 22
DWTT Tests in the Transition Temperature Rangeof High Strength Steels 25
Fracture Toughness Index Diagram for High Strength Steel 27
Applicability of Cv Test 30
Consideration of Fatigue Crack Modified C, Tests 30
EVOLUTION OF FRACTURE TOUGHNESS INDEX DIAGRAMFOR TITANIUM ALLOYS 34
EVOLUTION OF FRACTURE TOUGHNESS INDEX DIAGRAMFOR ALUMINUM ALLOYS 42
CONSIDERATION OF THICKNESS EFFECTS 48
EVALUATION AND CONTROL OF WELD METAL PROPERTIES 52
EVALUATION AND CONTROL OF HEAT-AFFECTED-ZONE PROPERTIES 55
MICROMECHANISMS OF FRACTURE PROCESSES 57
IMPLICATIONS OF STRESS-CORROSION-CRACKING ASPECTS 62
IMPLICATIONS OF LOW CYCLE FATIGUE CRACK PROPAGATION ASPECTS 67
STATISTICAL PROBLEMS IN APPLICATIONS OFLOW FRACTURE TOUGHNESS METALS 77
SUMMARIZATION OF TECHNOLOGICAL IMPLICATIONS 80
REFERENCES 83

ABSTRACT
This report presents integrated analyses and substantiating dataon problems of metallurgical optimization and solutions to fracture-safe design and fabrication of large welded structures, utilizing highstrength metals. The apparent complexities of attaining practical engi-neering use of high strength metals derive primarily from lack ofappreciation of the close interrelationships that exist between the in-trinsic susceptibilities of these metals to various failure modes andthe intrinsic structural mechanics features of the structures. Metalsof high intrinsic resistance to failure may be matched to structurps ofhigh ntrinsic design complexity and ordinary fabrication techmques,with assurance of structural safety. Metals of low intrinsic resistanceto failure must be matched only to structures that are exactly stressanalyzable and thereby are restricted to designs of the utmost attain-able simplicity and to fabrication by techniques of utmost precision.Such separations are basic to the theme of this report and provide the"starting point" for analyses of the potentials of utilizing variousmetals, within the range of metallurgically attainable strength levels.The metallurgical problems of optimizing the base metals, welds andheat-affected zones havebeen complicated bythe absence of parametric"frames of reference" required as bases of comparison. The absenceof such broad-base guide lines arises from the failure to evolve anadequate upderstanding of the significance of conventional engineeringtests and from the previous absence of definitive tests that provideassessment of failure mode sensitivities across the full spectrum ofmaterials and attainable strength levels. The development of such testprocedures has been one of the principal aims of the investigationsconducted by the authors and their associates. The spectrum view thathas emerged clearly defines metals and specific strength ranges thatprovide for matching to applications involving conventional fabricationof complex structures as compared to those that require exact designand fabrication. Thus, applications that may provide fracture-safedesign based on the use of simple engineering test methods may beseparated from applications that require the exact mathematical anal-yses of fracture mechanics.
iii

PROBLEM STATUS
This is a special summary progress report covering the resultsof a wide spectrum of integrated investigations within the MetallurgyDivision of NRL, aimed at the general problem of metallurgical opti-mization and fracture-safe design use of high strength metals in weldedstructures. The major portions of the studies are continuing under thegeneral "core effort" informal categorization of "Principles ofFracture-Safe Design,' including various officially established problemand sub-task categories, defined below.
AUTHORIZATION
NRL Problem F01-17; Project SP-00405NRL Problem M01-05; Projects SF 020-01-01-0724,
RR 007-01-46-5405, and WW-041 (R05-24A)NRL Problem M01-18; Projects SF 020-01-05-0731,
RR 007-01-46-5420, WW-041 (R05-24B), and AIPR Eng-Nav-65-12NRL Problem M03-01; Projects SF 020-01-01-0850 and
SF 020-01-01-0854
Manuscript submitted May 24, 1965.
iv

ACKNOWLEDGMENTS
In addition to the specialized professional contributionsof members of the Metallurgy Division of the Naval ResearchLaboratory cited in the text, the authors gratefully recognizeindependent contributions of major professional importanceon the part of associates that have been closely involved inthe fracture and fatigue studies-these include: R. W. Judy, Jr.,T. W. Crooker, C. N. Freed, D. G. Howe, and R. E. Morey.
The authors are particularly grateful for the financialassistance provided for the past and continuing aspects ofthese studies by Mr. George Sorkin and M". T. Griffin of theBureau of Ships; Mr. H. Bernstein of tht, Navy Special Proj-ects Office; Mr. M. L. Martin of the Army Corps of Engineers,and by our parent organization, the Office of Naval Research.
v

REVIEW OF CONCEPTS AND STATUS OF PROCEDURESFOR FRACTURE-SAFE DESIGN OF COMPLEX WELDED STRUCTURESINVOLVING METALS OF LOW TO ULTRA-HIGH STRENGTH LEVELS
INTRODUCTION
If we stand off far enough from the multitudinous details and litigations of specimendesigns and interpretations and survey the general field of fracture-safe design withreasonable detachment, it becomes clcar that there is need for a variety of approachesto the problem and that there are no 'one method" panacea. This conclusion derivesfrom recognition of a simple, yet fundamental fact that structural design problems covera wide spectrum - this fact may be appreciated by considering a broad split of the spec-trum in terms of two generic classes of 'structures" requiring fracture-safe designconsideration:
(1) Structures that are rigorously stress analyzable at all locations. Such analysesare not within the state of the art of ordinary computational design procedures and areattainable only by strain gaging and/or photoelastic stress analysis of representativemodels. Such structures generally feature the utmost attainable geometric simplicityand require exacting retention of the design features by fabrication with 'watchmaking"finesse. Rocket cases and aircraft components fall into this class.
(2) Structures that are stress analyzable in the usual "rough" sense, particularly.only in regions of relative geometric simplicity. Many regions of such structures aresimply considered 'stress indeterminate," and the natural plasticity of the metal iscounted upon to provide for adjustment and redistribution of loads at points of geometriccomplexity. Ordinary fabrication practices (out of roundness, slight mismatch at pointsof connection, residual stresses, etc.) further compound the stress-indeterminate natureof the complex regions and degrade the accuracy of computational stress analyses evenfor the remaining regions of relatively simple geometry.
Now, any fracture-safe analysis method that depends on exact knowledge of flaw sizeand stress level In the elastic range must necessarily relate to structures that are Oinfact" rigorously stress determinate at all positions. The virtue of the linear elasticanalysis (fracture mechanics) approach lies in its potential capability for mathematicallydefining critical levels of flaw size and stress. For relatively brittle materials that maybe considered critically sensitive to the presence of flaws in the elastic range, safe struc-tures may be constructed by such procedures, provided exact knowledge of the stresslevel and the flaw size at all positions of interest is available. We endorse and use thisapproach as the only feasible route by which such metals may be used.
To illustrate this case, we may consider Fig. 1 which presents the "upper bound"(best values) limgits of plane strain fracture toughness (K1 ) for two broad groupings ofsteels in the 1/2 to 1-in. thickness range. This figure represents a summary compilationby the authors of the highest recorded values resulting from tests of these two groups ofsteels by various qualified laboratories. Note that critical flaw sizes calculated by frac-ture mechanics procedures for yield stress and one-half yield stress levels are presentedin connection with the higher of the two 'upper bound" limit curves. These critical sizesare for flaws of relatively long dimension with respect to depth (10-1 ratio), commonlyknown as the 'worst" case. It is obvious from this figure that as the Kic value approaches
1

2 NAVAL RESEARCH LABORATORY
TEST OATA /QUESTOKNAASE I ESTIMATES OF "UPPER BOUND
/ ~(BEST RRi VARIOUS CLASSES
1I60 /OF 911- 1" STEEL PLATES
'NEW* STEELS - MARAGING & RP 9-4
~~I(BES WELDS MAY APPROXMATE PLATES)
CRITICAL FLAW SIZE-INCHESI DEPTH-LENGTH (ITOIO)
Dorxoror ys+ O.38xWW0.b ys
UJI20 -j
100 - .... it 0.4*
O.9W .0so100 a
60 4330-4 3-M-11
t40-LIJ
Z EXPECT DECREASE WITH USCRUAMO THICKCNESS
.. j20 -EXPECT DECREASE 0 PRESENCE OF MOISTW
(STRESS COIROSION CRACKIUS)
2 140 160 180 200 220 240 260 280 300YIELD STRENGTH (KSI)
Fig. 1- Upper bound, best value, limits of plane strain fracture toughness (K,,) for 1/2-
to 1-1n, plates of high strength steels, as reported by various qualified laboratories
180 kai AK., the critical flaw size for steels of the respective strength level increasesto the order of 0.25-in. depth for yield point stresses. In general the accuracy of meas-urement of K1 C values in the range of 150-180 ksi /15i., for the specified thickness,becomes quebtionable because of tb'q development of an excessive plastic zone size at thecrack tip. The implication of the almost vertical 6upswing* of the curves in the 180-200ksl yield strength (YS) range, for the subject 6best' steels of this thickness, is that furtherdecrease in YS level would result in very high increase In fracture toughness. Thus, atstrength levels below 180 ksi YS, the high order of metallurgically attainable fracturetoughness may be measurable readily by simple test methods - this fact is discussed ingreater detail in the sections to follow. Another point to note is that by increasing thestrength level to above 240 kal Y4~ the critical flaw size decreases to exceedingly smallvalues depending on the level of applied elastic stress. In the range of roughly 200 to 250ksi YS (depending on stress level) it is absolutely necessary to have exact knowledge of

NAVAL RESEARCH LABORATORY 3
stress level and of flaw sizes; this implies use of flaw inspection techniques which wouldmake such definition certain. Above the 240-250 kai YS range, flaw inspectabilitybecomes essentiaiy impossible because of the minuteness of the critical flaw sizes,even for stresses considerably below yield levels.
As indicated by the bold arrows in Fig. 1, metallurgical effects due to increasedthickness will result In decrease of the K,. levels of the two "upper bound" curves. Effectsdue to enviromment, such as the presence of water (stress corrosion cracking) are knownto additionally decrease the K IC levels, as will be discussed. Thus, from an optimummaterials point td view and for steels of the cited thickness range for which data areavailable, there is a relatively narrow range of strength for which the exact techniquesof fracture mechanics may be applied with confidence, provided environmental effectsare additionally considered. To disregard such exactness is to court dib -'ter in the useof the best attainable steels of the cited thickness at strength levels in en:.;uss of 200 ksiYS. In a broader sense, this statement applies to any steel or other metal that fallsroughly in the 50 to 150 K1 C fracture toughness range. Again, it should be emphasizedthat exactness is necessary not only in measurement of the KIc value, but also withrespect to knowledge of stress levels and flaw sizes - these requirements must be metsimultaneously. The evolution of fracture mechanics analyses procedures may be creditedwith making feasible the use of metals in the ultra-high strength range. Investigators inthis field are therefore to be commended for attainments of critical importance to fracture-safe design.
Now, a problem arises in that the application of fracture mechanics in the treatmentof fracture-safe design is considered by many as the only potentially certain method forcoping with all fracture-safe design problems. Other approaches lacking the sophistica-•on of mathematical calculation are too often considered crudity - we challenge suchattitudes and consider such thinking of a singular approach to the general problem asbasically unrealistic. The major tonnages of engineering structures are designed andfabricated by methods that defy the application of such exact stress and flaw size analyses.Moreover, a large builk of available structural materials in the intermediate and highstrength range can be melted, processed and heat treated to develop fracture toughnesslevels that presently defy valid measurement by linear elastic analysis techniques. Sim-ple engineering tests can be used to determine, specify, and quality-control materialsof fracture toughness properties that fall outside the province of presently establishedfracture mechanics definition. To the extent that such simple test procedures may beused, it is then possible to design and fabricate ordinary structures with complete safety.In other words, materials of high fracture toughness do not require and do not allow forultra..refined, mathematically based, fracture-safe design procedures. The validity ofthis fact must be recognized and accepted on the same basis as it is recognized andaccepted that metals of low fracture toughness cannot be used without the application ofthe utmost finesse in all respects and that fracture mechanics procedures are essential.There is a place for a simple atinkers job" as well as for a refined 'tailors job,' bothare honorable professions. Thus, we should not impose unrealistically uniform proceduresof rigorous stress analysis and fabrication finesse on structures built of materials that donot require such treatment. The basic question then becomes how to identify a materialas falling in the class of being fracture-safe for use in complex structures or falling intothe class that it can only be used with the utmost of design and fabrication finesse. Thedelineation between the two categories Js not difficult and is readily definable by the useof relatively simple procedures. This point is often missed and is not generally under-stood. A few introductory examples will suffice to explain this situation at this point andthe body of this report will further highlight the reality of this statement.
As a first example, let us consider low strength steels having sharply defined transi-tion temperature features. For such materials the temperature range of nil-ductilitytransition (NDT) to NDT + 300 F marks the separation between material of relatively lowfracture toughness and material of relatively high fracture toughness. If we carry the

4 NAVAL RESEARCH LABORATORY
HIGH ENERGY FULL SHEART TEAiR IFRACTURESLlS. FTP U.T.S.
FRACTURE /
YS. - <1 S FOR YIELD STRENGTH
0E ¾Y.S. INCREASINGU), FLAW SIZESk~~INCREASING7 •
F "zY.S. .AT
SFULL SHEAR TEAR4Y.S. FRACTURES MATERIAL
L _ I I IN.D.T. NDT + 600F NDT +120"F
TEMPERATURE
Fig. 2.- Fracture Analysis Diagram and conceptual modifications for steels of decreasinglevels of fracture toughness in the fully ductile mode - noted as "low energy tear" for thelow levels.
temperature to NDT +600F, a much higher level of fracture toughness is obtainable. TheFracture Analysis Diagram, Fig. 2, clearly illustrates the stress level-indexed increasein critical flaw size and crack arrest temperature (CAT), with increasing temperatureabove the NDT temperature; references (1,2, and 3) provide detailed description of thederivation and use of the NDT indexed, Fracture Analysis Diagram. It is a simple andadequate engineering, fracture-safe design procedure for low strength steels that havea sharply defined transition temperature and high frawcture toughness in the fully ductile(ductile tearing fracture) state. A perfectly logical question would be - do we need anexact procedure for complex structures that are stress analyzable and flaw size inspecta-ble only within crude limits? Moreover, for ordinary steels of low strength level, forwhich this method is clearly applicable, there are no other developed and proven methodsavailable at this time or in the foreseeable near future.
As a second example, let us consider metals that do not develop definite temperaturetransition features; or that develop a gradual "fading out" of such features with increasingstrength level, such as steels that ultimately fall to very low levels of "upper shelf" (ductiletearing) energy. Figure 2 illustrates schematically the basic effect of decreasing ductiletear energy in terms of the Fracture Analysis Diagram (4). From the known 'downwardrotation' of the CAT curve of the diagram, there emerges the possibility of developingand utilizing a simple test method which defines whether or not a steel can propatefractures at levels of general stress below yield, at 6shelf' temperatures of maxil•umfracture toughness. Such a test method could then be used in designating high strengthsteels (or other metals) of ductile tear energy levels that do not require sophisticatedflaw size and stress analyses at, compared to those that would require such analysis. Sucha simple 6first cut* separation is of considerable value and if we had such a test method,we should use it.
NAVAL RESEARCH LABORATORY 5
0 ii
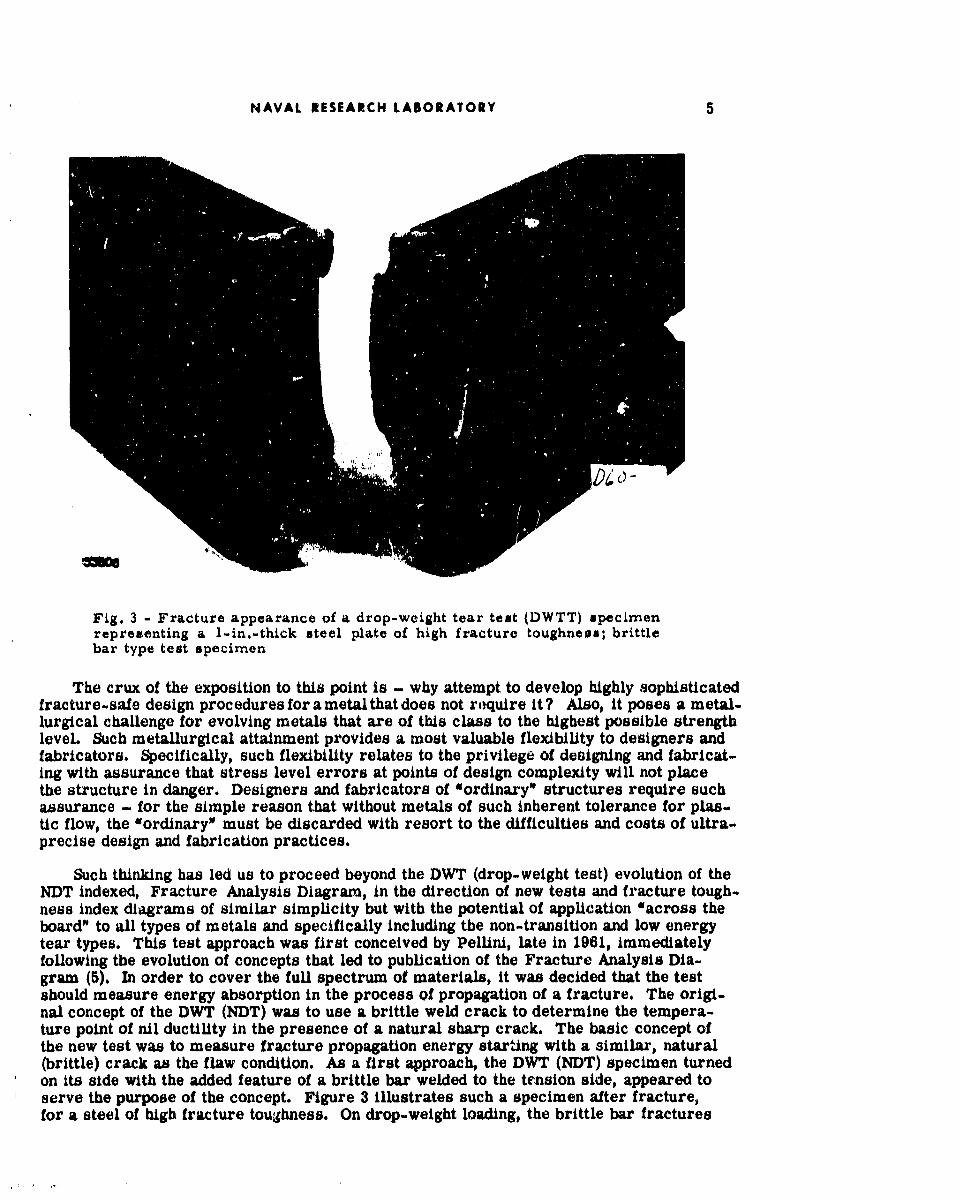
Fig. 3 - Fracture appearance of a drop-weight tear test (DWTT) specimenrepresenting a 1-in.-thick steel plate of high fracture toughness; brittlebar type test specimen
The crux of the exposition to this point is - why attempt to develop highly sophisticatedfracture-safe design procedures for a metal that does not requlre it? Also, it poses a metal-lurgical challenge for evolving metals that are of this class to the highest possible strengthlevel. Such metallurgical attainment provides a most valuable flexibility to designers andfabricators. Specifically, such flexibility relates to the privilege of designing and fabricat-ing with assurance that stress level errors at points of design complexity will not placethe structure in danger. Designers and fabricators of 4ordinary" structures require suchassurance - for the simple reason that without metals of such inherent tolerance for plas-tic flow, the *ordinary" must be discarded with resort to the difficulties and costs of ultra-precise design and fabrication practices.
Such thinking has led us to proceed beyond the DWT (drop-weight test) evolution of theNDT indexed, Fracture Analysis Diagram, in the direction of new tests and fracture tough-ness index diagrams of similar simplicity but with the potential of application 0across theboard" to all types of metals and specifically including the non-transition and low energytear types. This test approach was first conceived by Pellini, late in 1961, immediatelyfollowing the evolution of concepts that led to publication of the Fracture Analysis Dia-gram (5). In order to cover the full spectrum of materials, it was decided that the testshould measure energy absorption in the process of propagation of a fracture. The origi-nal concept of the DWT (NDT) was to use a brittle weld crack to determine the tempera-ture point of nil ductility in the presence of a natural sharp crack. The basic concept ofthe new test was to measure fracture propagation energy starting with a similar, natural(brittle) crack as the flaw condition. As a first approach, the DWT (NDT) specimen turnedon its side with the added feature of a brittle bar welded to the tension side, appeared toserve the purpose of the concept. Figure 3 illustrates such a specimen after fracture,for a steel of high fracture toughness. On drop-weight loading, the brittle bar fractures

6 NAVAL RESEARCH LABORATORY
and transmits a brittle crack through a brittle weld connection to the test material. Fora Mtetal of high fracture toughness in the propagating mode, this results in high energyabsorption in the process of tearing through the test element and a high value of breakingenergy is recorded - for a metal of low fracture toughness characteristics a low valueof breaking energy is recorded. Because of the initial use of drop-weight test equipmentto determine the value of energy absorption, the test method was identified as the drop-weight tear test (DWTT). Extensive testing of a wide variety of metals has been conductedat NRL since 1962 based on this test; with development of experience in its use, modifica-tions of the basic design were evolved aimed at the simplification of specimen preparation.It is one of the principal purposes of this report to present the status of development ofthe DWTT in its various modifications and of the interpretation of the resulting data interms of novel Fracture Toughness Index Diagrams for fracture-safe design. It shouldbe understood that while there has been substantial accomplishments of these aims, bothaspects cited are in a stage of continuing development and refinement. In relation to theseaspects, the following sections of this document must be considered in the nature of aprogress report aimed at indicating the long range practical potentialities of such anapproach. Other test techniques and subject matter bearing on the fracture-safe designsubject are also covered in keeping with the broad objectives of the report.
Inasmuch as the micromechanisms of fracture are important in establishing the levelof energy absorption in fracture propagation, a brief summary will be presented of thisaspect. Also, there are discussions of low cycle fatigue and stress corrosion crackingwhich may result in the enlargement of flaw sizes (slow crack growth) for metals of bothhigh and low fracture propagation resistance. The importance of these additional dis-cussions is to emphasize that what are ordinarily considered IslowM crack growth pro-cesses may be relatively rapid from engineering points of view, under certain conditionsand for specific materials - even for metals of high fracture toughness and thereforehigh resistance to fast fracture propagation. For metals of low resistance to fracturepropagation, minor enlargement of flaw sizes by 1slow5 growth processes may havecatastrophic results.

GENERAL DESCRIPTION OF THE USE AND INTERPRETATIONOF THE DROP-WEIGHT TEAR TEST
The drop-weight tear test (DWTT) may be used to define the temperature region ofsharp rise of the crack arrest temperature (CAT) curve from the lower shelf, commonlyknown as the "Robertson' lower shelf. This is the 5-8 ksi, minimum stress level forfracture propagation that is applicable to temperatures at and below the Fracture AnalysisDiagram, nil-ductility transition (NDT) temperature. It should be understood that arapidly rising CAT curve in the temperature range above the NDT is specific to steelscharacterized by relatively "sharp" transition temperature characteristics. The rate ofrise with temperature for CAT curves is believed to be relatively invariant for lowstrength, steels of the commou structural variety and has been explored primarily for3/4 to 1-in. plates. The CAT curve rise features may be expected (conceptually) todepend to some degree on the relative sharpness of the transition temperature of othertypes of steels. Also, there are indications in the literature that for plates of (3 - 4-in.thickness) the rate of rise is affected (CAT curve moved 20°-30OF to right at the lowend) by the increased plate thickness'. In other words, the CAT curve "fix' deduced fromthe NDT temperature point of the Fracture Analysis Diagram is somewhat open to dis-cussion on points of 'fine' differences. For general engineering use, it is believed torepresent an adequate representation for the common grades of low strength steels thatfeature 'through thickness' fracture toughness uniformity. Metallurgical effects ofincreased thickness are properly accounted for by increase in the NDT temperature andthereby a temperature shift of the Fracture Analysis Diagram.
The DWTT is believed to offer considerable promise in predicting the specific CATcurve rise features of steels without recourse to complex, large scale, crack arrest tests.The complexities of such large scale tests have been the basic reason for the lack ofinformation relative to CAT curves for thick materials, and for the wide variety of newQ&T (quench and temper) low alloy steels. Unless much simpler methods for developingthis information are found, it is unlikely that extensive CAT curve data will be evolvedin the near future, despite its evident need.
The DWTT test is not capable of following the full course of the CAT curve (to itshighest limits) because of the relatively low level of elastic bending stresses in theadvance of the crack front which generally results in 'arrests" at temperatures of 30°-400F above the NDT. This is specifically predictable from the Fracture Analysis Dia-gram CAT curve. At the "toe" portion of the CAT curve, adequate stress levels for DWTTfracture propagation without arrests are available, and the toe region thus is definable,as will be documented in a section to follow. This concept led to the proposal in early1962 by NRL investigators that steels of less than 5/8-in. thickness could effectively beevaluated by the DWTT to determine the toe region of the CAT curve and in effect couldindicate the NDT position, despite the fact that the standard DWT (NDT) test could not beused for "thin' steels. Subsequent NRL experimentation proved this was the case. In1962, a prediction of exact equivalence in DWTT fracture appearance with gas-line bursttests, at temperatures close to the NDT, was made first to Bethlehem Steel Corp. Labora-tory (BSCL) personnel, and then to the Battelle Memorial Institute (BMI) invoitigators ofgas-line steels. In early 1963, the DWTT was again recommended for this application whena review of the NRL studies was givea to the AISI Subcommittee on Line Pipe Researchwhich included representatives from all major line pipe producers (6).
7

8 NAVAL RESEARCH LABORATORY
We must credit BMI and the BSCL investigators for development of proof of thevalue of the DWTT for thin sections (7,8). It was found independently by NRL, BMI, andBSCL that a brittle crack starting element was not needed for the simple purpose ofdetermination of the toe region temperature location of the CAT curve. A sharp notch,such as the pressed knife edge type, suffices. It was also determined that the CAT curvetoe region could be defined by energy absorption measurements or simply by observationof the fracture appearance. With the latter criterion, studies by Battelle and BethlehemInvestigators have shovn that the full scale fracture propagation characteristics of gasline pipe can be predicted from laboratory DWTT test results. Thus, it is now firmlyestablished that the DWTT provides accurate predictions of the CAT curve, toe regiontemperature range for "thin' steels.
We believe, but have not yet proven, that similar, simple CAT curve toe regiondeterminations may be made for the more complex problem of transition temperaturesteels having fracture toughness gradients through the thickness, irrespective of platethickness. This requires that a full thickness test be conducted. In effect, this predic-tion is based on the reasonable concept that the test should integrate the composite frac-ture toughness through the thickness. Accordingly, the DWTT method should be of con-siderable interest for the rapidly evolving family of spray-cooled, low alloy steels whichgenerally feature marked Charpy V (Cv) and DWT determined NDT fracture toughnessgradients from surface to center of the section. These steels are presently being usedwithout the benefit of exact definition of their 6'composite* fracture toughness and aregenerally Indexed by 1/4T (thickness) Cv values of debatable significance. It may alsobe predicted that the DWTT would allow for evaluating the effects of very severe coldwork - a condition for which the use of DWT is not recommended because of the changein HAZ properties adjoining the brittle weld in a direction of improved toughness. Again,this is an unexplored area and the use is offered as a suggestion of potential value.
The NRL efforts following the initial exploratory tests of thin section steelswere directed primarily to problems of evaluating high strength steels, steels of sus-pected low tear energy properties irrespective of strength level, and essentially non-transition metals such as titanium and aluminum. The foremost aim was to develop (asa first step) the DWTT test to a point that it would predict whether or not a particularmetal required stresses above yield for fracture propagation. Also, to determine thedegree of plastic overload that was required for fracture propagation of metals featuringvery high fracture toughness.
To accomplish the above aims, it was necessary to conduct interpretive, correlatingtests on a reasonably iarge section of plate that could be considered as a structure proto-type element. For this purpose, NRL developed the explosion tear test (ETT) whichfeatures a 2T (2 times the thickness) through-crack in a brittle weld &patch' region.Loading is accomplished by bulging to a cylindrical configuration so as to maintain anearly constant stress field ahead of the propagating fracture - ductile or brittle. Figure4 illustrates "flat break" fracture performance (fracture propagated below yield stresses)and Fig. 5, a fracture which required a level of 5% plastic strain for propagation. Alarge number of such tests were conducted to determine the level of plastic strain (mea-sureu by a grid) that was required for propagation of the fracture across the test plate.The general features of this struc ral prototype test will be discussed in detail in a sec-tion to follow.
The strain levels of fracture propagation resistance indicated by the ETT are highlyreproducible and thus provided for correlation with the likewise highly reproducible DWTTenergy values. At the present stage of development, the DWTT energy value is obtainedfirst and is used to closely predict the ETT fracture propagation resistance. All such

NAVAL RESEARCH LABORATORY 9
Fig. 4 - Explosion tear test (ETT) of 1-in. steel plate, illustrating "flat break'performance indicative of fracture propagation at nominal stresses below yieldstrength level
Fig. 5 - Explosion tear test (ETT) of 1-in. steel plate, illustrating performanceindicative of plastic strain requirement for fracture propagation

10 NAVAL RESEARCH LABORATORY
correlation or "indexing" tests for transition temperature type steels have been conductedat temperatures of maximum energy absorption - i.e., at temperatures of the upper shelfof the DWTT vs temperature curve. For non-transition temperature metals, such pre-cautions are not necessary.
The above correlation approach permits comparison of fracture characteristics of abroad spectrum of metals and strength levels at any specific stage of their development.As the particular metal is improved the summary charts clearly indicate the degree ofimprovement. The significance of DWTT energy vs metal yield strength plots whichdefine "upper bound' i.e., presently best attainable properties (plots to be presented) isthat above a specific and riathernarrow "critical' range of yield strength it is not pos-sible to procure a given metal with properties such that fracture propagation would beresisted to above yield stress loading. Below this "critical" strength range level, thebest steels or other metals cited can be expected propagate to fractures only if plasticoverload stress levels are applied. We have taken this Ocritical" range as the point ofseparation between metals of a given family that require fracture mechanics designmethods and metals that do not require such refined procedures. The logic of this sepa-ration is that fracture propagation through elastic load regions is not possible for thelatter type, irrespective of flaw sizes.
Throughout this test program, attempts were made to correlate Cv test data andfatigue cracked C, test data with DWTT values and ETT performance. Within limits,the CV test may be used as a reasonable index; however, there are limitations that willbe discussed.

SIMPLIFIED PROCEDURES FOR "CAT" CURVE DETERMINATIONS
As described previously, the drop-weight tear test (DWTT) may be utilized to definethe temperature region of sharp rise of the crack arrest temperature (CAT) curve fromthe "Robertson" lower shelf. We shall now present data to document that the DWTTexactly indexes the CAT curve indicated by the Fracture Analysis Diagram for the rela-tively simple case of steels featuring through-thickness uniformity; even if conductedas a sub-size design version (small size test piece) using a pressed knife edge, sharpnotch. The importance of conducting full thickness DWTT for determinations of themore mechanically complex, non-homogeneous steels and for otherwise unexplored thicksteels is illustrated by through-thickness sub-size DWTT and by Charpy V (C,) data forsuch steels.
The course of evolution of the notch configuration of the DWTT specimen used as aCAT curve index by BMI, BSCL and NRL followed independent courses, but finallyfocused collectively on the use of a simple mechanical notch. The NRL "brittle bar"type of specimen first used (see detailed description in section on high strength steels)was independently found not to be necessary for the CAT curve "toe region" determinationof thin steels featuring a sharp fracture toughness rise in the transition temperature range.
The two types of notch design evolved by the NRL investigators are illustrated inFig. 6; both types are practical and the choice is simply a matter of preference in prepa-ration. The notch in the top specimen of the figure features brittle TIG weld crack starting,using brittle "feed" wire. It also features "V" side grooving to provide a "point" startingsource to minimize initiation energy. More recently, we have favored the design shown atthe bottom of the figure. This involves a slot of 1/16-in. width made with circular slittingmilling cutter. The bottom of the notch is sharpened to less than 0.001-in. radius bypressing in a knife edge tool to a depth of 0.015-in. This notch differs from the BMIdesign which involves a notch totally formed by the pressing in of a knife edge tool. Thedimensions of the 'standard" reference specimen for CAT curve determinations are5/8 x 1-5/8 x 7 inches with a net width of 1-1/8 inches for the fracture depth. Wedefine this as the standard, 'subsize' DWTT specimen for use whenever a sample iscut from a plate or forging of greater thickness. The 5/8-in. thickness can be reducedto the plate thickness of thinner steels; however, NRL has not devoted appreciableeffort to investigating "thin" steels. Our major concern has been with the potentialsof the sub-size test and the nature of correlation with the CAT curve of the FractureAnalysis Diagram.
Figure 7 (top), illustrates such a correlation for A201B steel (taken from PVRCVessel No. 1 of 2-in. thickness (9,10,11)) for which the DWT indicated a 0°F NDT valueand thereby provided for charting the Fracture Analysis Diagram at the illustrated posi-tion on the temperature axis. The DWTT correspondence shown in Fig. 7 (bottom) ismost striking. The tests were conducted with the NRL pendulum (Charpy-like) machine,now generally utilized for conducting DWTT studies. The data in the figure are for the5/8-in. sub-size DWTT. Note the sharp rise in energy absorption above the NDT temper-ature; also, note that at NDT +400 F and NDT +60° F, the specimens showed arrests asdeduced by examination of the fractured specimens. The arrests are clearly evidenton the fracture surfaces and are indicated by the arrows in Fig. 8.
We are in the process of exploring features of the CAT curve rise, as deduced by the5/8-in. DWTT, for a wide variety of steels. Selected, characteristically different curves
11

12 MAVAL RESEARCH LABORATORY
7"
.i_
BRITTLE WELD NOTCHDWTT (ENLARGED VIEW
OF FRACTURE)
A 7
MACHINED NOTCH (< 0.001-IN. RADIUSDWTT
Fig. 6 - Dimensions and notch details of sub-size (5/8-in. thick) DropWeight Tear Test (DWTT) specimens used for CAT curves, "toe region"determinations. Top specimen has "V" side grooves with abrittle weld;bottom specimen has a machined notch with pressed knife edge sharpening.
are presented in Fig. 9 to illustrate the variety of forms of CAT curve rise that may beobtained. There is a great deal of information that may be "read out" of these curves,with additional examination of the fracture surfaces. The rate of the CAT curve riseabove the NOT and the maximum (shelf) energy attained are obviously different - thesefeatures are evident from the curves in Fig. 9. For example, the low energy valuefeatures of the upper shelf (for ductile tearing) of 4340 are readily tnderstandable andexpected (see section on high strength steels). In all cases, arrests have been evidentin the fracture surfaces at temperatures of NDT + 400 to 600F. A wide selection of steelsare to be investigated by this technique in order to evolve a more complete picture of theDWTT test potentials as a CAT curve determinant. The results shown in Fig. 9 demon-strate that the test can predict the low elastic stress fracture propagation temperatureregion for a wide va. iety of steels that show transition temperature effects; ije., the"=toe region" of the CAT curve. It should be noted that the energy measurement methodcoupled with fracture appearance examination for arrests is the logical and most defini-tive method of using this test. Fracture appearance evaluation of DWTT performancemay be a satisfactory simplified procedure in some cases; however, aa examples, it

NAVAL RESEARCH LABORATORY 13
70T. S. -M-~ -FTP
/ /•,, PLASTIC LOADS
50 DWT- <NT_ I SPmaFlEl FlowSTEL
(0 -6
40---- ~ ELASTIC LOADS
30-
0--0 1- I
20( AT C.POSFRACTURE ANALYSIS10 Cf DIAGRAM FOR
WT NT SPECIFIED A2018 STEEL
0 30 60 120TEMPERATURE (OF)
So DWTT PREDICTION OF uTOE REGION"70- CAT CURVE TEMP. POSITION
FOR SPECIFIED A2018 STEEL.J
Su 500( DWTT FRACTURE400 0 NO ARREST
4•00 • ARREST
W 30 COMPARE WITH
DWT i,,CAT CURVEt NDT SHOWN ABOVE
100-
-80 -60 -40 -20 0 20 40 60 80 100 120 140TEMPERATURE (OF)
Fig. 7 - Illustrating the correspondence betweenthe CAT curve of a AZ01B steel definedby theFracture Analysis Diagram and the CAT curvetemperature location indicated by the sub-sizeDrop Weight Tear Test
would not disclose the dramatic difference in ductile tear energy shown by the 4340 steelas compared to the A302B, or the difference in slopes (more gradual rise of the CATcurve) between the A201B and A302B steels. In general, it appears that steels whichshow a more gradual initial DWTT rise develop a much steeper subsequent rise onreaching arrest temperatures.
Next we shall illustrate the case for use of the DWTT test for steels that show verybroad scatter of Cv data - also steels that have abnormal Cv curve relationship to theNDT temperature. A dramatic illustration of this latter limitation of the Cv test wasdescribed in reference (2) where the NDT temperature of the 2.25%Cr-lMo, Q&T steelfell on the upper shelf of the Cv curve. The reference cited clearly illustrated that theNDT deduced Fracture Analysis Diagram was in exact conformance with burst test resultsof slit flawed air flasks constructed of this material and with CAT data obtained by theisothermal Robertson test of the steels.
We may illustrate both points by presenting data for A387D (2.25%Cr-1%Mo) Q&Tsteel rolled to 4-in. plate thickness. Limitations of the Cv test to indicate a precise

14 NAVAL RESEARCH LABORATORY
KF] A 302 B STEEL (PVRC VESSEL I)
Temp. (F) -20 O(NDT) 20 40 60ENERGY 35 50 100 220 390(FT- LB)
S CRACK ARRESTFig. 8 - Fracture appearance of the 5/8. in. DWTT specimens of A201B steelcorresponding to the data presented in Fig. 7. Note crack arrests developed inthe specimens tested at NDT + 40*F and NDT + 60 0 F.
1000 TYPE Y.S.,STEEL KL CODE /A2018 48 /
800- A302P, 58
4340 140 ------ /I.-
6. 600 -
zIw 5/S400-/I-/
200ACO IE"" " AZIB/ "A:3028
ATEMPERATURE0 1 ..... ---,---I
-140 -120 -80 -40 0 40 s0 120 160 200TEMPERATURE (OF)
Fig. 9 - Illustrating 5/8-in. DWTT energy data definition of CAT curvefeaturea for a variety of steels - A201 B, A302B, and 4340. Drop WeightTest (DWT) determined NDT temperatures are indicated by the arrows.

NAVAL RESEARCH LABORATORY 15
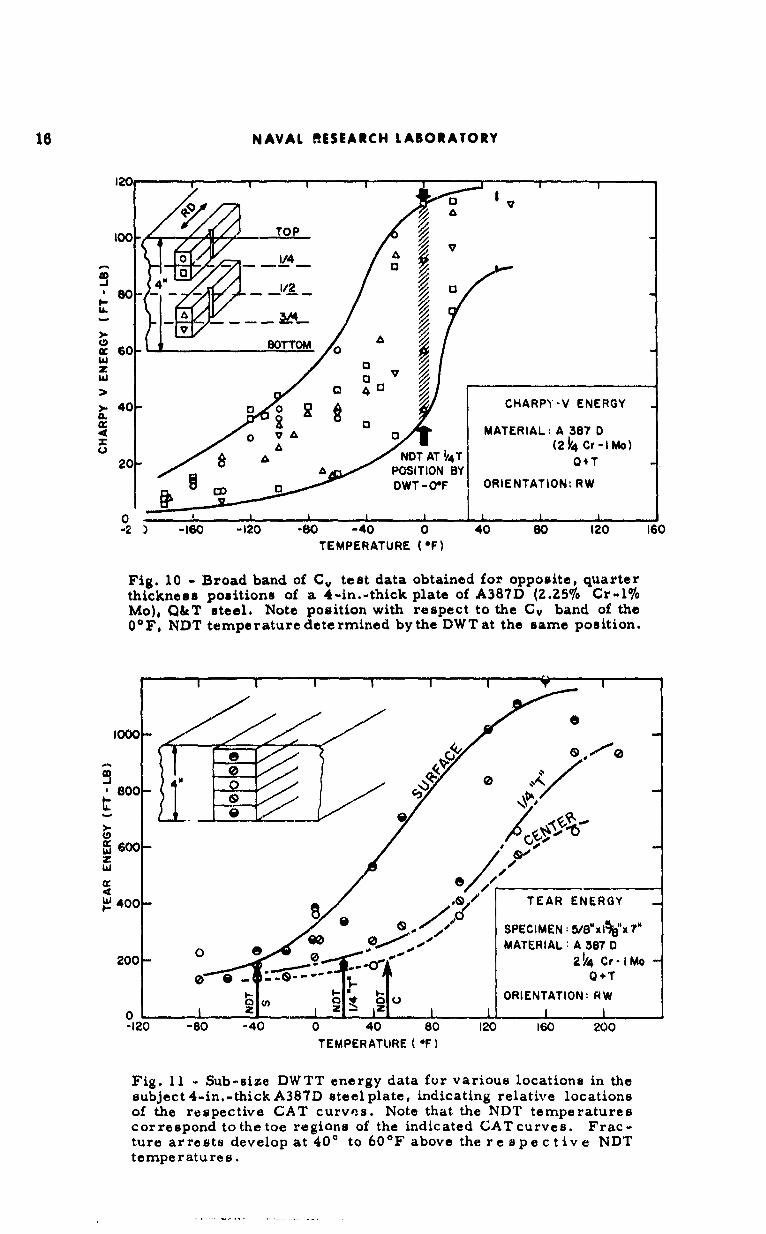
transition temperature index for this steel (even for a single test location in the platethickness) are readily apparent from the data presented in Fig. 10. Only a diffusedpicture of fracture toughness transition is obtained due to the scatter in results for C,specimens which were taken in the standard orientation and at the usually specified 1/4 T(thickness) position. The energy-temperature relationship from the C,, test for this steelwould indicate that the 4-in. thick steel has significant levels of fracture toughness (20-25 ft-lb) at the 1/4 T position for temperatures as low as -140OF, and that full shear Cvfractures are attained at 20°F. Despite the scatter, similar data have been widely con-sidered as representing high fracture toughness characteristics for such steels at sub-zero temperatures. We are alarmed by such broad-brsh use of Cv data for steels thathave not been properly indexed as to the significance of the C, test and particularly forpractices of estimating Cv curves from bands involving such extreme scatter. To docu-ment the basis for this alarm, we illustrate NDT and the DWT1? data for this steel at thesame 1/4 T position, Fig. 11. The NDT is established at 20°F for this position and theCAT curve deduction derived by the DWTT is in accordance with this index - crackarrest properties at this position are not attained until temperatures of 500 to 600 F arereached. Now, there are additional complications in analyzing such a steel - note thatthe NDT of the surface and center materials are -40OF and 500F, respectively. Also,that the DWTT indexed CAT curve temperature location is in conformance with the NDTprediction for these locations. For the surface position, crack arrest characteristicsbegin to show at approximately 00 F and for the center at approximately 800 to 900 F.Obviously, the question that arises is: how does this steel behave as a natural composite,considering the severe nature of the through-thickness, fracture toughness gradients?It may be (or not) that the surface properties will impart a controlling effect rather thanthe center or the 1/4 T positions. The answer to this question in a CAT curve sensemust be related to both the specific nature of the metallurgically dependent gradient andthe mechanical integration effects of such gradients. The example cited appears to indi-cate a rather "shallow" surface of low transition temperature material - the 1/4 T andcenter curves are rather close together. Until we have the answer as to how to evaluatesuch a composite of gradient properties, it is difficult to analyze such a steel on afracture-safe design basis. The industrial practice of analysis based on C, properties,usually a few test specimens taken at 1/4 T position and at a pre-specified temperature,is almost meaningless.
The next obvious step in these explorations is to test such a material using a full,4-in. thickness DWTT to establish a mechanically integrated CAT curve temperaturelocation. Unfortunately, there was insufficient material from this specific steel to con-duct the full thickness test. The data shown in Fig. 11 were obtained recently; to pursuethis matter, samples of the same type of steel and similar types (of other compositionsof the expected gradient type) are being procured to conduct the gradient 5/8-in, thicknesstests plus full thickness tests This is a critically important area of exploration - con-sidering the increasingly expanding use of such materials in recent years for thick sec-tions and very large, highly stressed structures of considerable complexity.
It is obvious that explorations of the use of the DWTT for the above-described pur-poses are yet in the initial phase. However, it is equally obvious that a very excitingpotential exists for the use of this simple test and that it Provides information that isreadily translatable to engineering analysis for fracture-safe design, as has been doneby the Battelle and the Bethlehem investigators for specific types of "thin" line pipesteels (7,8). There is considerable urgency for studies related to thick steels, as wellas to studies to prevent indiscriminate use of the Cv test for thick or thin steels thathave not been examined as to the interpretability of C, test data.
16 NAVAL RESEARCH LABORATORY
120
too- TOP
0 1/4 V
at 60 0
> 40
>-40- a CHARPY -V ENERGY
o0 A MATERIAL: A387 0S20 e A NTAT ý4 T (2Q4 -+TI Ms)
20- =.. ,POSITION BY T
0DWT-O*F ORIENTATION: RW
0 1. I . . I I 1-2 ) -160 -120 -80 -40 0 40 80 120 160
TEMPERATURE (@F)
Fig. 10 - Broad band of C, test data obtained for opposite, quarterthickness positions of a 4-1n.-thick plate of A387D (Z.Z5% Cr-l%Mo), Q&T steel. Note position with respect to the Cv band of the0OF, NDT temperature determined bythe DWTat the same position.
- I . . I 1 I I .. . . I
1000
W 600-W
,w 400-GTEREEY
-...- MATERIAL: A 3870
200 0 2 /4 Cr-IMo MQ+T
ORIENTATION: RW
0 1o i I <> _ , I t I1 I.... I I I
-120 -80 -40 0 40 80 120 160 200
TEMPERATURE (*F)
Fig. 11 - Sub-size DWTT energy data for various locations in thesubject 4-in.-thick A387D steel plate, indicating relative locationsof the respective CAT curves. Note that the NDT temperaturescorrespond to the toe regions of the indicated GAT curves. Frac-ture arrests develop at 40' to 60 0 F above the respective NDTtemperatures.

EVOLUTION OF FRACTURE TOUGHNESS INDEX DIAGRAMFOR HIGH STRENGTH STEELS
As explained in the introduction, one of the major problems in evaluating the fracturetoughness of high strength steels is the marked decrease in the level of energy absorptionthat may be developed at temperatures involving a fully ductile fracture mode. The devel-opment of very low levels of fracture toughness at temperatures above the transition rangeposes problems that cannot be resolved simply by limiting the lowest range of servicetemperatures, as is the case for steels featuring a transition to high levels of fracturetoughness. Decreases of fracture toughness above the transition range may result fromincreasing strength to high levels or as the result of the presence of improper micro-structural aggregations for Q&T steels of intermediate or low strength. Such decreasesare indicated by Charpy V (Cv) curve upper shelf levels and are translatable to a "down-ward rotation* of the Fracture Analysis Diagram, as illustrated in Fig. 2. It should benoted that at strength levels above 220 ksi yield strength (YS) the Cv curves become almost"flat" and are undecipherable with respect to transition temperature features. Tn theinterest of near-term possibilities for the utilization of high strength steels in complexstructures, it became imperative to evolve fracture-safe design principles of the samerelative simplicity as the transition temperature related Fracture Analysis Diagramapproach, but of specific applicability to the case of temperature invariant differences infracture toughness.
From a Navy interest point of view, a decade of evolutionary test developmunt is notpermissible. Some immediate method, even if relatively unsophisticated, is required forthe present and immediate futu,-e co as to provide fracture-safe design guidance for com-plex structures having stress indeterminate regions. Also, to serve as a guide for thedevelopment of optimized metals for structural applications of near-term Navy interest-the long lead time for such developments require definition of practical routes at theearliest possible time. The DWTT, coupled with the explu•ion tear test (ETT), as a cor-relating structural prototype, were therefore evolved concurrently for this purpose andextensive use of the prototype correlation approach was made during the period 1962 tothe present.
The features of the ETT test, which serves as the flaw-containing structural prototype,are illustrated in Fig. 12. The first concept of the use of this test was to evaluate theelf ects of liaws of different sizes-and we continue to have this long term objective. How-ever, more deliberate consideration of "first things first" and experience with the test ledus to considering it in a more restrictive but yet more readily analyzable manner thatwould provide near-term answers to engineering design problems. This was the conceptthat the simplest "first cut" in evaluating fracture toughness of metals for use in complexstructures was obtaining the answer to the simplest "first* question-does a given metalallow fracture propagation at or below yield point stresses, or does it require plasticoverload stresses to propagate the fracture? Also, if the latter is the case-how high aplastic overload is required? The significance of such answers to a design engineer facedwith the development of yield point or higher stresses at points of geometric complexity,for a structure that is designed to operate at below yield levels of nominal stress, arequite obvious. If fractures connot propagate out of the zones of high stress concentration,the structure will remain "positively" safe. If he is faced with military application ques-tions involving a majo r area of the structure being plastically overloaded, he may readilyaccess how high an overload is tolerable before fractures may be expected to propagate.
17

18 NAVAL RESEARCH LABORATORY
EXPLOSION ;
TEAR TEST .,.'•.,!i:•!, ':... ,.• .,
Fig. 1Z - Features of the explosion tear test (ETT)
The ETT is ideally suited to provide such answers because of the "long run, of fracturethat is available for evaluation of fracture propagation resistance. Correlation with theDWTT to predict the ETT performance is considered equivalent to predicting the char-acteristic fracture resistance of the metal in a structure. This is a "simple-minded"-but straightforward and readily analyzable concept and we shall proceed to illustrate thiswith facts and numbers.
The ETT features a through-the-thickness, sharp crack of length equal to 2T (twicethe thickness), developed in tWe plate by a brittle weld "patch" technique. In effect, ashort groove is machined in the plate and refilled with a brittle weld. More recently,with the advent of electron beam welding equipment, it was found that the brittle crackmay be produced with less effort by the use of an electron beam, brittle weld technique,to be described.
The ETT is used for purposes of "indexing" the significance of DWTT energy vs YSsummary plots (to be presented). As points of reference, three levels of 1-in.-thick steelplate ETT performance are illustrated in Fig. 13. The bottommost ETT sample illustrates"flat break" fracture propagation at levels of elastic loading; see also Fig. 4 as anotherexample of "fiat break" with shattering eliminated by the use of a very "light" explosiveblow. The center ETT sample shows a steel that 1alf -ran" the fracture across the plateat 3-5% strain but did not run the fracture significantly at 2-3% strain. Thus, 5-7% strainfor this steel is about the required limit for fracture propagation. The topmost ETTsample (HY-80 steel) shows extreme fracture toughness resistance-five blows cauisedincremental 1/2 to I in. propagation on each blow with resulting 10-12% (plus) deforma-tion. The ETT tests are generally conducted with explosiivo offset load conditions (deter-mined by grid method) that will provide essentially: 1. - zero deformation (elastic loading),2. - 1-2% deformation, 3. - 5-7% deformation, and 4. - 10% (plus) deformation. With theevolution of corielation experience it was found possible to conducet DWTT first and rather

NAVAL RESEARCH LABORATORY 19
Fig. 13 - Illustrating the wide range of fracture propagation resistance observed inETT of I ..in.-thick plate specimens. Top, extreme resistance to propagation; center.fracture propagation requiring approximately 5-7 percent strain; bottom, shatteringat elastic stress levels (flat break).
accurately predetermine the minimum deformation level that should be applied to causethe fracture to propagate extensively across the section. This procedure conservesscarce material and allows for developing more extensive documentation of the ii~exfeatures of the diagrams to be presented.
To date, the ETT correlation work has been concentrated primarily on 1-in.-thickplate materials and tests at 30°F. However, it was ensured that all of the steels con-sidered in the correlations to be presented were tested at their maximum energy (fullyductile) state at this test temperature. This precaution was necessary to avoid compli-cations of the transition range. In other words, the main interest was in assessing thecharacteristics of the retal in its state of highest attainable fracture toughness. Theeffects of transition temperature will be described separately for purposes of clarification.
The value of the DWTT in the work to be described is that: 1. - it provides for inex-pensive, " wass-production" testing required for broad field explorations, 2. - it minimizesthe amount of energy absorbed in initiation of the fracture to a closely similar, low level,for all metals tested, and 3. - it is both feasible and practical for later use for specifica-tion and quality control purposes. These aims were achieved with the ultimate design ofthe DWTT specimens shown at the bottom of Fig. 14 which is readily applicable "acrossthe buardw for evaluations of steels, titanium, and aluminum alloys, and is expected toserve for other materials.

20 NAVAL RESEARCH LABORATORY
BRITTL E-I-
I 8
TI r EMBRITTLED2w E. B. WELD
16
Fig. 14 -DWTT specimen designs for tests attemperatures of maxizi-um fracture energy; (top)welded b rit tlIe bar assembly design; (bottom)electron beam embrittled weld design
The initial DWTT specimen used for steels featured a composite weldment, Fig. 14top, formed by joining a 1 X 3 x 18-in, test plate to a notched, brittle, cast steel bar. Toprovide a brittle crack path extending to the test plate, a brittle electrode (Hardex N-thesame as ordinarily used for DWT) was used to deposit a full-thickness weld approximately4-in, long opposite the notch in the cast bar. The rest of the weld joint consisted of tworoot passes made with conventional electrodes normally employed for welding of the par-ticular test steels.
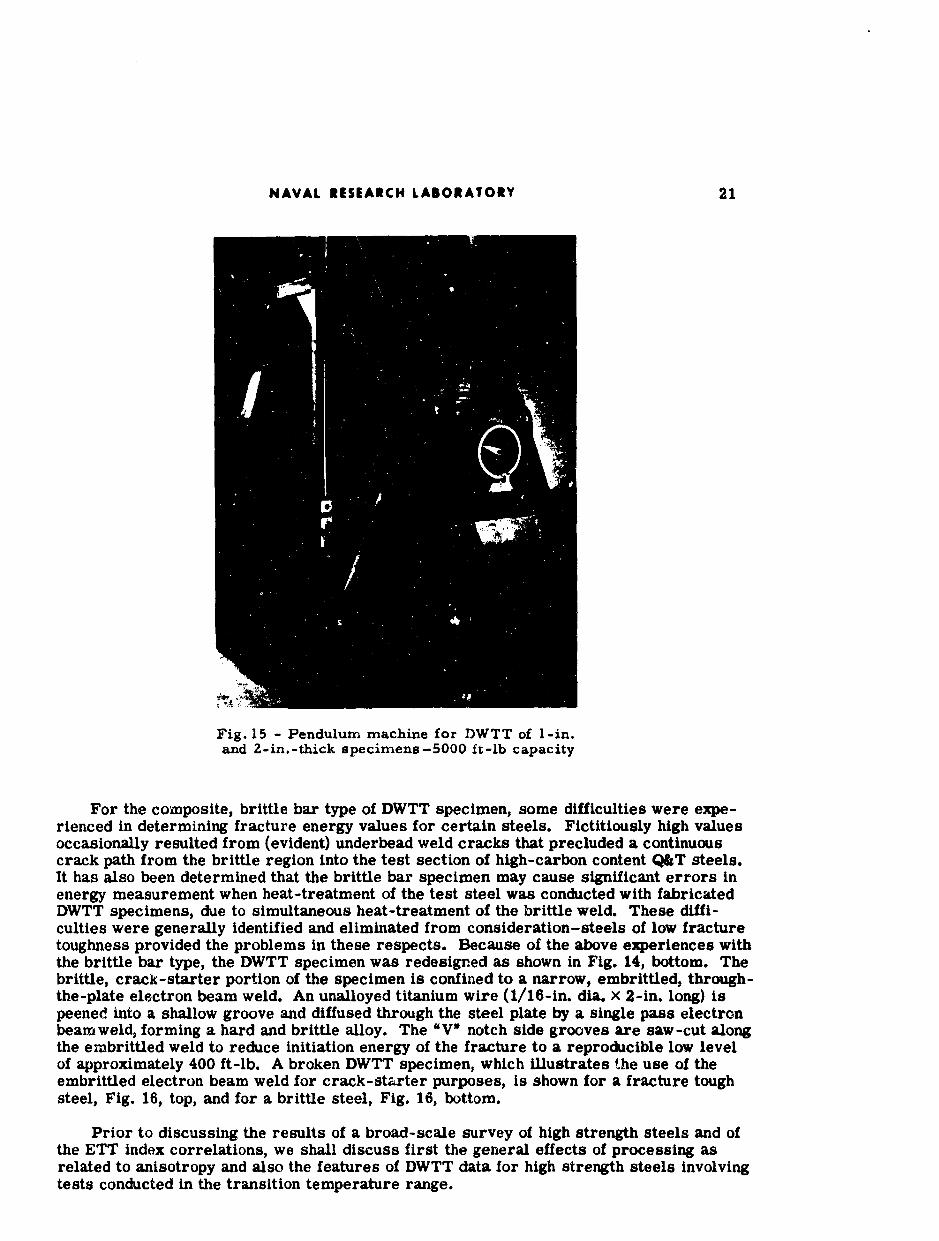
After test temperature conditioning in liquid baths, the DWTT specimen was testedinitially by loading as a simple beam by the action of a falling weight. The DWTT energyvalue for complete fracture of the specimen was obtained by "bracketing' (within ar. incre.ment of 250 ft-lb) tests of several specimens of the same steel. The relatively simpie"bracketing" techniques were originally employed for DWTT in order to take advantage ofexisting drop-weight equipment. Such techn~ques, however, did result in a considerableexpenditure of scarce test material, as well as an excessive amount of time in preparationof the number of specimens required for the determination of each data point. Consequently,a large (5,000 ft-lb capacity) pendulum-type lmp~ct machine, Fig. 15, was designed andconstructed by NRL for continuing DWTT studies of full thickness (1 and 2 inches) highstrength materials. This new equipment (basically a large Charpy machine) also providesfor more exact determinations of the DWTT energy values.
NAVAL RESEARCH LABORATORY 21
Fig. 15 - Pendulum machine for DWTT of 1-in.and 2-in.-thick specimens-5000 ft-lb capacity
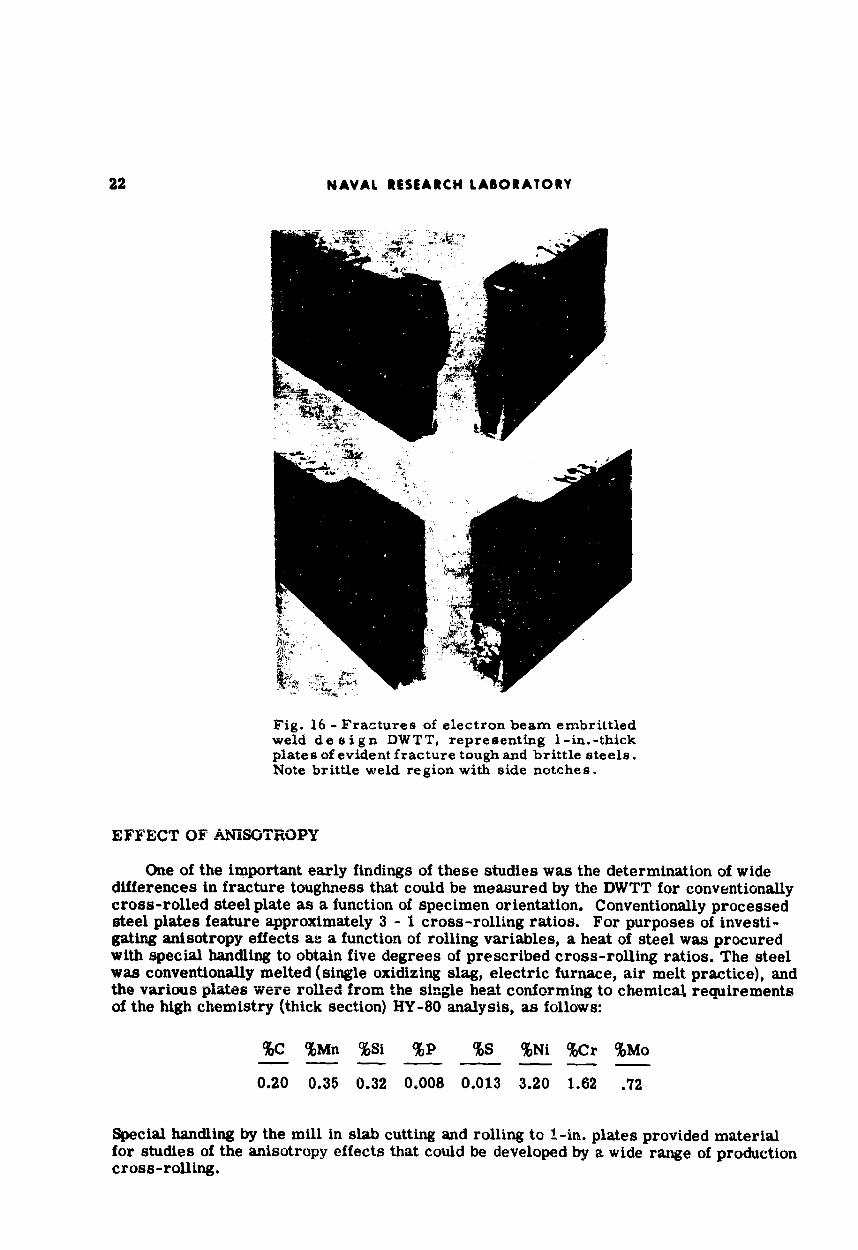
For the composite, brittle bar type of DWTT specimen, some difficulties were expe-rienced in determining fracture energy values for certain steels. Fictitiously high valuesoccasionally resulted from (evident) underbead weld cracks that precluded a continuouscrack path from the brittle region into the test section of high-carbon content Q&T steels.It has also been determined that the brittle bar specimen may cause significant errors inenergy measurement when heat-treatment of the test steel was conducted with fabricatedDWTT specimens, due to simultaneous heat-treatment of the brittle weld. These diffi-culties were generally identified and eliminated from consideration-steels of low fracturetoughness provided the problems in these respects. Because of the above experiences withthe brittle bar type, the DWTT specimen was redesigned as shown in Fig. 14, bottom. Thebrittle, crack-starter portion of the specimen is confined to a narrow, embrittled, through-the-plate electron beam weld. An unalloyed titanium wire (1/16-in. dia. X 2-in. long) ispeened into a shallow groove and diffused through the steel plate by a single pass electronbeamweld, forming a hard and brittle alloy. The "W notch side grooves are saw-cut alongthe embrittled weld to reduce initiation energy of the fracture to a reproducible low levelof approximately 400 ft-lb. A broken DWTT specimen, which illustrates the use of theembrittled electron beam weld for crack-starter purposes, is shown for a fracture toughsteel, Fig. 16, top, and for a brittle steel, Fig. 16, bottom.
Prior to discussing the results of a broad-scale survey of high strength steels and ofthe ETT index correlations, we shall discuss first the general effects of processing asrelated to anisotropy and also the features of DWTT data for high strength steels involvingtests conducted in the transition temperature range.
22 NAVAL RESEARCH LABORATORY
Fig. 16 - Fractures of electron beam embrittledweld design DWTT, representing 1-in.-thickplates of evident fracture tough and brittle steels.Note brittle weld region with side notches.
EFFECT OF ANISOGTROPY
One of the important early findings of these studies was the determination of widedifferences in fracture toughness that could be measured by the DWTT for conventionallycross-rolled steel plate as a function of specimen orientation. Conventionally processedsteel plates feature approximately 3 - 1 cross-rolling ratios. For purposes of investi-gating anisotropy effects aa a function of rolling variables, a heat of steel was procuredwith special handling to obtain five degrees of prescribed cross-rolling ratios. The steelwas conventionally melted (single oxidizing slag, electric furnace, air melt practice), andthe various plates were rolled from the single heat conforming to chemical requirementsof the high chemistry (thick section) HY-80 analysis, as follows:
%C %Mn %Si %P %S %Ni %Cr %Mo
0.20 0.35 0.32 0.008 0.013 3.20 1.62 .72
Special handling by the mill in slab cutting and rolling to 1-in. plates provided materialfor studies of the anisotropy effects that could be developed by a wide range of productioncross-rolling.
NAVAL RESEARCH LABORATORY 23
The effects of test specimen fracture orientation and degree of cross-rolling onfracture toughness properties are illustrated by the data shown in Fig. 17 for two extremecases of cross-rolling. The top and bottom curves depict the extreme differences in frac-ture toughness that may be developed in the fiber (weak) direction and in the trans-fiber(strong) direction for straight-away rolling (essentially no cross-rolling). The two direc-tions defined as "weak' and "strong" may be recognized by the ASTM* method as respec-tively the WR and RW directions. The effects were explored over a range of strengthlevels indicated in the figure. It is apparent that straight-away rolling of steel plateresults in a relatively low fracture toughness in the fiber (weak) direction and muchhigher fracture toughness in the trans-fiber (strong) direction. As depicted by the centercurve in Fig. 17, essentially equivalent (isotropic) fracture toughness properties aredeveloped in both directions for highly (1 - 1) cross-rolled plate. In general, the resultsof these tests (not all cross-rolling ratios are presented herein) showed that for any givenstrength level, an increase in weak direction and a decrease in strong direction fracturetoughness occurs with increasing degrees of cross-rolling. Full (1 - 1) cross-rolling isrequired for the attainment of the maximum possible level of fracture toughness in abiaxial sense - i.e., to eliminate a weak direction. The relative importance of attaining 1 - 1cross-rolling to maximize fracture toughness depends on the strength level. For example, thehigh level of tearing energy inherent to commercially processed HY-80 at the 80-90 ksiYS level causes no concern with respect to the weak direction of poorly cross-rolledmaterial, because even the weak direction features a relatively high fracture toughness.However, the same may not be said for steels of higher strength levels-for these there islittle tearing energy to spare and the presence of a weak direction is highly detrimental.
In heat-treatment studies conducted for a wide variety of steels, all were shown toexhibit decreasing levels of fracture toughress with increasing strength. The generaleffect is such that as the strength level of a given material is increased, a point is reachedwhere the weak direction of a poorly cross-rolled material drops to low toughness levelscorrelating to fracture propagation at elastic load levels at much lower strength levelsthan for the strong direction. Accordingly, practical considerations dictate that the weakdirection of fracture resistance of a material should be taken as the criteria of referencerelating to the suitability of the steel for structures involving multi-directional loading.
For special design cases, the high fracture toughness inherent of the transverse direc-tion may be a desirable factor and straight-away rolled steels may be desired for suchpurposes. For example, consider an insert section in a gas line pipe for fracture arrestpurposes-the most economical approach would be to utilize a straight-away rolled Q&Tsteel with the fiber direction in the hoop orientation. Thus, the fracture is forced topropagate through material of higher fracture toughness than would b,' attainable by 1 - 1cross rolling. Highly cross-rolled steel would not be desired for special applicationsinvolving unique restrictions of fracture paths.
*It is recognized that the ASTM suggested method for describing specimen orientationand fracture directions in rolled plate provides for exact definition of all possiblesituations and is to be preferred. The method described in Materials Research andStandards, Vol. 1, No. 5, May 1961, uses the letter R (direction of principal rolling),W (plate width), and T (plate thickness) to describe the six possible orthogonal frac-ture directions. We support and ordinarily use this method. However, throughout thisreport we are concerned with only two fracture directions-the "weak" direction, wherethe fracture propagation is parallel to the principal rolling direction (WR), and the"strong" direction (RW), where the fracture propagation is perpendicular to the principalrolling direction. For descriptive simplicity and additionally for purposes of emphasis,the terminology of "weak" and "strong" fracture directions are used in this report.

24 NAVAL RESEARCH LABORATORY
80000 SPECIALLY ROLLED 8& HEAT TREATED- HY-80 STEELS
7000
6000 1"STRONG n,
"*• ROLLINGI- •!30:1 1:1 RATIO (L/T)
5000- '1WEAK1 RI
0wz
4000-
M - -20-0
1000
0
OI1 I _ I 1 .I I I80 100 120 140 160 180 200
YIELD STRENGTH (KSI)
Fig. 17 - Relationships of DWTT energy to yield strength involving variousconditions of fracture orientation and cross-rolling practices for a conven-tional melt practice, HY-80 type steel
It should be emphasized that the data to be presented in summary data charts to followalways relate to the lowest level of fracture toughness in the plate, i.e., the "weak" direc-tion of the rolled plate, providing such a direction exists. Plates of special 1 - 1 crossrolling presented in these charts reflect the benefit of such practices. The point to bemade is that a fracture toughness value for a steel plate of a given YS cannot be consideredas to its relative value compared to another steel of the same strength value without knowl-edge of both the test orientation and the degree of cross rolling. It would be very simpleto show one steel as being "very glamorous" compared to another by using straight-awayrolling and then testing in the transverse direction. This information was basic to the"sorting out" and frame-of-reference evaluation of steels on the comparable basis that is

NAVAL RESEARCH LABORATORY 25
presented in this report. This consideration of details eliminated what previously was achaotic condition for inter -comparison of steels. Studies of orientation effects and thedecision to compare on the weak direction basis represented was our first step in theevolution of summary data charts based on broad-scope evaluation of steels, as well asfor the other metals covered in this report.
DWTT TESTS IN THE TRANSITION TEMPERATURE RANGEOF HIGH STRENGTH STEELS
As indicated by very low slope, essentially "flat" C, energy transition curves, thebest of the ultra-high strength steels do not exhibit the distinct transition temperaturebehavior which characterizes the best steels of less than 180 ksi YS. Low slope, lowshelf, Q&T steels may be obtained at strength levels of 90-120 ksi YS, but these are steelsof the commercially cost-competitive "low alloy" or lean analysis type. The DWTT frac-ture toughness properties of the best of the lower strength steels are highly temperaturedependent in the transition range. It is such a sharp effect of temperature on fracturetoughness that provides for the success of the standard drop-weight test in determiningthe NDT temperature.
It should be cautioned that the summary data to be presented in the diagrams to followshould not be extrapolated to structural applications which involve service temperatureslower than the maximum energy, ductile tear temperatures to which they are intended toapply. We have used the general designation of "shelf" temperatures to characterize thiscondition. Results of investigations of the effect of temperature on DWTT fracture tough-ness propcrties of high strength steels will now be presented to clarify this point. Theeffect is illustrated by DWTT results obtained for three specially melted and processedsteels of HY-80 composition, heat treated to strength levels of approximately 110, 130, and150 ksi yield strengths. The melt processing for these steels comprised vacuum ladledegassing and special control carbon deoxidation. A series of weak direction, DWTT speci-mens were prepared from each plate and DWT were also conducted in accordance withstandard procedures (3) to determine the respective NDT temperatures. The DWTT wereconducted at various temperatures from 30°F (on-the-shelf temperature for all of thesamples) down to the NDT temperature of each respective steel.
The decrease in DWTT energy levels exhibited by these steels with decreasing testtemperature is presented in Fig. 18. At test temperatures of approximately 40 "F abovetheir respective NDT temperature, the DWTT energy values for each steel increaseslightly from the low value obtained at NDT temperatures. At approximately 500 to 60°Fabove their respective NDT temperature, a sharp increase in DWTT energy is obtained,approaching 50% to 75% of the maximum values developed by the steels at the 30OF (on-the-shelf) position. Because of the difficulty of fracture appearance definition for suchsteels, arrests could not be clearly defined; however, the rapid rise in the curve is initself an indication of a sharp increase in the CAT curve. In all cases, at test tempera-tures of approximately 100 to 1200F above the NDT temperatures, these steels attaintheir maximum (shelf) fracture toughness. The relationships in the toe region of thecurves are in general agreement with the concept of DWTT utilization as a CAT curvelocator, as discussed in one of the previous sections.
Correlations of C upper shelf energy (to be described) with DWTT upper shelf valueshave been surprisingly good and documentation of the significance of Cv shelf energy values(100% shear fractures) have been established for steels by correlation with DWTT resultsand ETT tests. However, investigations of the effects of temperature on DWTT and Cvtest energies in the transition temperature range indicate that the Cv test can be highlymisleading for cases involving mixed fracture of the Cv specimens. Figure 19 summarizes

26 NAVAL RESEARCH LABORATORY
6000
SPECIALLY PROCESSED ANDHEAT TREATED HY-80 STEEL
5000
_j ROLLINGDIRECTION
4000
Z HY -110
4 3000IJJl
UjU
S2000 MY-1500~
1000N
NOT NOT
0I 1 I I N T 1N I 1 I I 1 I-200 -160 -120 -80 -40 0 40
TEST TEMPERATURE (MF)
Fig. 18 - illustrating the decrease in DWTT energy from the fully ductile to NDTtemperatures for various strength levels of a special melt practice, HY-80 type steel
the C, and DWTT data developed for the same 110 ksi YS steel shown in Fig. 18. Thefigure illustrates that the scatter range of Cv values at any test temperature is consid-erably larger for strong direction tests than is the case for weak direction tests. At theNDT temperature of -170 0 F, the average Cv values are 46 and 84 ft-lb respectively forthe two directions of testing. It should be recognized that these apparently "high" Cnumbers do not signify fracture tough performance of this steel at its NDT temperatureas would be the case for similar Cv energy numbers when referenced as shelf-level tem-perature values. Of particular significance are the data for test temperatures rangingfrom -100° to 40°F. In this temperature range, the averagn weak-direction CV valuedrops only 10 ft-lb (from 70 to 60 ft-lb) but the DWTT value is seen to drop drasticallyfrom 2500 to 600 ft-lb. Fracture appearance ratings of the Cv specimens tested in thistemperature range disclosed 95% shear fracture at -100°F and 65% shear fracture at-140 0 F. From these data it should be cautioned that high Cv energy values for test speci-mens featuring the presence of cleavage (values in the transition range) are not necessarilyindicative of high toughness. This is a "fine" but important point to be considered in inter-preting Cv test values and adds to the complications of using the C, test. In other words,

NAVAL RESEARCH LABORATORY 27
I' THICK SPECIALLY PROCESSED AND HEAT TREATEDSTEELS OF HY-80 COMPOSITION
120 X, C "TRONGr 6000
X • • X X
100 X x5000X NDT=.xx"-100% SHEAR IN Cv FRACTURES
_J4 80- OCv"WEAK" 4000
0 0
"' xo6__0-/- "WEAK" "S60 3000 cr
> x NDT H 10
40 -200 -M0-2 8 4 0 80 40
-200 -160 -120 -80 -40 0 40 80
TEST TEMPERATURE (OF)
Fig. 19 - Comparison of DWTT and C, data for the steel of Fig. 18that was heat treated to 110-kai YS
do not use the C -DWTT correlations to be presented in the following charts without dueconsideration that these must be C, shelf values, for all steels featuring definite tempera-ture transition features. This caution does not apply to the essentially "f1at" Cv curves.
FRACTURE TOUGHNESS INDEX DIAGRAM FORHIGH STRENGTH STEELS
Broad-scope DWTT studies of steels, coupled with ETT correlations have resultedin evolving DWTT energy vs YS Fracture Toughness Index Diagrams (FTID), reiating toproperties of the steel above the transition range. All tests were conducted at 30*F andmet this criteria. Such a diagram relating specifically to 1-in. -thick steel plates is pre -sented in Fig. 20. Correlations with ETT data served to index the strain levels for frac-ture propagation to specific DWTT energy levels, irrespective of yield strength. Thesecharts are intended to serve as basic guidelines indicating the relative resistance tofracture propagation for steels of specific DWTT energy levels. The strain levels indi-cated on the charts relate to the ETT index of performance. The shaded region from1000 to 1250 ft-lb is used to denote the range of DWTT energy level separating materialscapable of E' r propagation of fractures at elastic stress levels from the materials thatrequire small plastic strain overloads for ETT propagation of fracture.

28 NAVAL RESEARCH LABORATORY
Z8
j +- 4)4
W~ 0
SWWg 0
(o 0
wq''Nn. I. o
(30 $
0 1
~~~~ 0()4 Q00
~0
w -8
0 0 0 0o0th-
(S81-.L~~~~~) AOJ3N P. .HIM OiQd

NAVAL RESEARCH LABORATORY 29
The curves shown in Fig. 20 also separate the data points into characteristic groupsrelating to the processing variables (melting practice and/or cross-rolling). For eachcharacteristic group of steels, a wide range of fracture toughness may be developed bydifferent alloy steels of the same YS level. The maximum level for each grouping asdepicted by the related curves, indicate that fracture toughness decreases with increasingstrength level for all categories. The limiting ceiling curves for each group have beendesignated as the "optimum materials trend line* (OMTL) for the group. The individualOMTL may be recognized as the reference "yardstick' for evaluation of steels of theparticular category with respect to the practicable upper limit of fracture toughness forany given strength level. Of particular interest is the fact that the highest or "ceiling*curve in Fig. 20 depicts the apparent presently attainable upper limits of fracture tough-ness for any strength level. The "ceiling" curve is attained by special melt practices and1 - 1 cross-rolling of the new alloy steels developed within the past five to seven years.Note that all data relate to 1-in.-plate thickness.
One of the recent highlights of these studies has been the determination of the bene-ficial effects of special melting and rolling processes on the DWTT and CV shelf fracturetoughness properties of the "new" steels in the 150+ ksi YS when compared to the bestpractice for the "old" types. The "old" types are generally characterized as Ni-Cr-Mocomposition of the HY-B0 type, heat treated to a range of intermediate strength levelsand the well-known 4330 - 4340, H-11, D-b, etc., types, heat treated in the range of 160to 220 ksi YS. The "new" types (of matching strength) include the families of maragingand 9Ni-4Co varieties. The OMTL indicated in Fig. 20 for the "old' high strength steelalloys, that have long been in use for high sty )ngth applications, represent vacuumconsumable-electrode-remelt (CER) practice and I - 1 cross-rolling. Thus, the illus-trated OMTL for the "old" steels is the best attainable for the noted strength levels. Thevalues developed for best practice of these steels are of significantly lower toughnesslevels than those of best practice for the recently developed "new" steels.
The data given in Fig. 20 are particularly significant to general conclusions that maybe derived with respect to steels of 180+ kai YS. Note the shaded region denoting the DW'. rprediction of change from elastic to plastic loading requirements for fracture propagation,located in the 180/220-ksi YS range. Also, the "boxes' that have been drawn to enconmpassthe population of steel data points above rnd below 200 ksi YS. Major implications areimmediately apparent from consideration of these data: 1. - Above 200 ksi YS, the pre-ponderance of steels reside in "box" regions of the FTID where propagation of fractureat elastic stress levels should be expected and are so confirmed by ETT results. It isthus considered that valid fracture mechanics toughness measurements should be obtain-able for these steels. 2. - In the 180/220 ksi YS levels, many of the "old" steel types arealso characterized by similar low resistance to fracture propagation so as to predict validfracture mechanics determinations. 3. - The upper "box" of the diagram encompassesmany of the "new" steels which are characterized by higher DWTT toughness. These steels,by FTID correlation have been shown to resist propagation of fracture unless subjected toat least 2 -5% levels of plastic strain. The sharp change in population from the low fractureresistance "box" to that of the high fracture resistance "box' of the FTID is clearly in con-currence with the YS location of the "upsweep" of the K Ic upper bound (OMTL) curvesshown in Fig. 1. This observation explains why it becomes impossible to obtain valid KICvalues below the 200 to 180-ksi YS levels for the best quality steels of this thickness.
From these studies of high strength steel, it has become clear that the fracture tough-ness of steels at a particular strength level is critically related not only of the compositionof the steel, but also the process history. Data for a particular analysis and thickness arerelatively meaningless without simultaneous definition of the process practices. Tt is alsonecessary to specify the test direction with respect to the rolling direction. Ir general, thek'haracterization of relative fracture toughness for specified directions and process con-ditions has evolved as a major contribution of this program which clarifleo a otherwise
30 NAVAL RESEARCH LABORATORY
completely confusing picture of relative fracture toughness quality for particular com-positions and strength levels. In the absence of this spectrum of data, it would not bepossible to "index* the quality of a particular stebl with respect to others.
APPLICABILITY OF Cv TEST
The standard method for evaluating fracture toughness available generally to industryhas been the C. test. Correlatinr .••ween the DWTT and the C, tests have provided ameans of calibrating the significance of the standard industry test within the describedlimitations. Figure 21 depicts the general relationship between DWTT and C, data forthe steels studied to date. It should be emphasized again that the surprisingly good cor-relation of DWTT energy values with C, values applies to shelf level temperatures-i.e.,the correlation relates to tests at temperatures of maximum energy for both the C V andDWTT.
A summary of such 300 F C v tests for steel is presented ,n Fig. 22, as a function ofthe yield strength of the test material. The curves in this figure separate the data intocharacteristic groups relating to the processing variables which are closely similar totho•-.- illustrated in Fig. 20. The DWTT and ETT index procedure was used to evolve thischart to FTID status. It is significant ÷, note from repetition of the "two boxes, of popu-lation, that the C , test also charactei -es a high population density of steels in the 200/220ksi YS range as materials capable of propagating fractures at elastic stress levels. Also,that many steels of 180/220-ksi YS ..nge may be attainable with fracture resistance toabove YS levels. These data provide for the useful application of C, tests for high strengthsteels in fracture-safe design analysis by terms of simple FTID reference.
CONSIDERATION OF FATIGUE CRACK MODIFIED Cv TESTS
Of the variety of steels surveyed in these studies, 34 high strength steels were selectedfor fatigue crack modified, C v testing in order to determine whether an improved correla-tion definition would result. The steels were chosen to include both low and high toughnesslevels, covering the spectrum of yield strengths ranging from 80 to 280 ksi. All weretested using the standard C, test specimen and two modifications - a fatigue crack inducedat the root of the standard Cv notch aad the same fatigue cracked specimen with the addi-tional feature of notching the two sides of the test bar. Two types of loading, standardimpact and slow-bending, were used for the modified C, tests. The slow bend tests wereconducted by courtesy of the Republic Steel Corp. Laboratory in a cooperative test programon this item (12).
The principal effects of fatigue cracking alone or fatigue cracking with the addition ofside notches, are to lower the Cv test energy values. The effect was shown to be indepen-dent of the type or toughness level of the steels. When the steels were ranked in decreas-ing order of toughness, Fig. 23, on a basis of the conventional Cv test data and on the basisof data from the modified specimens, the relative orders were essentially the same, irre-spective of the test specimen used. Minor exceptions occurred only in the results of slowoend tests. Generally, the results of the modified C, testing program for the subject 34high strength steels, indicated no particular vilue or necessity for use of fatigue crackmodified Cv testing for evaluation of fracture toughness at temperatures of maximumenergy. As a disadvantage, the use of notching procedures more severe than those of theconventional Charpy tests, causes a reduction of energy values such that discriminationbetween low energy value steels is seriously reduced, aggravating an already difficultproblem of interpreting the Cv test.

NAVAL RESEARCH LABORATORY 31
Wu u ow.o
N cc
4)) U
CD fo
.z 02
LJ.
,4. 4.
00
e.4
UU
_ 0 0 (D 0-
(81-idJ) A083N3 A - Add8'HO doO2

32 NAVAL RESEARCH LABORATORY
z 0
w~ CCaLj - 14 4
cr r 0004 OD
cl~~. > -L
0 ZR M c cow r W0) f) U (ADU) 04Cc ~ ~ ~ ~ ~ D 0 JL 0 w0-Q va-m4c
IL U ) U) i inN<wc
W W~ O. 4 .4
4'~C w-
* CM
0~. Li!;b8 Z 0* 1 ;4_. u
(S81-id)~LL 4)33AA8~od

NAVAL RESEARCH LABORATORY 33
130 •
120- HIGH STRENGTH STEELS
lO . CHARPY TESTS
00-- • NRL STD CvNRL FATIGUE CRACKED Cv(FCv)
U90 go REP ST'L. SLOW BEND FC v3O* F
>o 60- 0 REP ST'L.SLOW BEND FCv 900F
w 70 - a A Az Auw 5o "0 "o3
'40
20 -Imuo °'
3 0 A * .20 AA10 -00£ D1 1 1 1 1 1 1 1 I+ I I l i # i
0 2 4 6 8101214 18 20 22 24 26 28 30 3234(-BEST) RELATIVE RANK (Cv)
Fig. 23 - Results of conventional, fatigue cracked, and fatigue cracked plus sidenotched modified C, tests of high strength steels, ranked in decreasing order of
fracture toughness

EVOLUTION OF FRACTURE TOUGHNESS INDEX DIAGRAMFOR TITANIUM ALLOYS
At the start of the NRL investigation of titanium alloys of plate thickness in 1962, areview of the literature was made to establish the extent of available fracture toughnessinformation. Except for a few 1-in. thick plates that had been investigated by Charpy V(C) tests, drop-weight tests (DWT), and explosion crack starter tests by Wiliner andSullivan (13), there were very little additional data. Moreover, the first contacts withthe industry disclosed that the effects of specimen orientation were generally ignoredresulting in various alloys being reported to have surprisingly high Cv values in plateform. Further investigation revealed that the high values resulted from orienting thespecimen so that the notch was parallel to the plate surface. From the total availableinformation, the relative Cv values of various alloys of similar strength levels and therelation to processing practices could not be determined - this situation could bedescribed as most confusing.
The literature review also indicated that fracture mechanics tests had been conductedprimarily for alloys in the sheet thickness range and for materials of ultra-high strength.To this date, the available information on plane-strain fracture toughness for plates of3/4 to 1-in. thickness is inadequate to prepare a chart of KI C vs yield strength (YS), ashas been presented for steels in Fig. 1. Our present program includes obtaining datathat would provide for the preparation of such a chart in terms of upper bound KIC values.It is also of interest to determine the range of YS at which questionable KIC values areobtained because of experimental difficulties deriving from plastic deformation of thecrack tips, and below which plane strain fracture toughness cannot be measured bocauseof high fracture toughness. It will be shown that the fracture toughness index diagram(FTID) for titanium alloys indicates tiat this range may be expected to be in the 125-130ksl YS level for the majority of the better alloys of 1-in. plate thickness. Our initial workon K1 c plane strain fracture measurement was aimed at 1-in. thick plates of 105-120 ksiYS. It was found that at room temperature valid Kzc values could not be obtained becauseof the excessive fracture toughness of the alloys investigated. As a next step, attentionis being directed to alloys of 130-150 ksi YS level
A large body of Cv data developed by NRL tests during the past three years is sum-marized in Fig. 24 as a function of broad YS ranges. It is apparent from these data thatthe Cv transition occurs over a very wide range of temperatures (-2000/-3000 F to+2000/+3000F). Accordingly, such transition features are considerably different fromthe rapidly failing C, curves (sharp transition) developed by steels of low or intermediatestrength leveL Electron microscope fractographic studies of Cv fracture surfaces pro-vide a partial explanation in that the fracture mode for all specimens involved in thebands of Fig. 24, at high or low temperatures, is "dimpled rupture,' i.e., a ductile (non-cleavage) fracture mode. The size and fine features of the dimples may charge withdecreasing Cv energy, but the basic nature of the fracture mode is not changed. The com-parative general features of C, curves and fractographic appearance for steels, titanium,and aluminum are discussed in a subsequent section of this report. Contrasted to thelow or intermediate strength level steels, the basic problem in using C. energy as ameasure of fracture toughness for titanium alloys is the lack of an abrupt Cv temperaturetransition in conjunction with the low C v energy values for the moderately high strengthmaterials.
34

NAVAL RESEARCH LABORATORY 35
90
870
60
-3
z 50-
1540- Fig. 24 - Generalized relationships of> C,, energy decrease with decreased
S 30 temperature, representing variousbroad ranges of yield strength for I-I" 2 -35 YS1111
Z ,in. thick titanium alloy plate20-
o JMI fa - p T ,10-
-400 -300 -200 -100 0 100 200 300 400TEMPERATURE (OF)
Charpy curves resulting from fatigue-precracked specimens have not provided amore discriminating interpretation of the CV test for titanium alloys. The use of theprecracked specimen shifts the C, curve to generally lower energy values. The curveslie slightly below, but are essentially parallel to those of the standard specimen for thesame material - no other features of the curves are accentuated. A typical example ofthis is seen in Fig. 25 which presents standard and precracked Cv curves for low inter-stitial Ti-6AI-2Mo and high interstitial Ti-13V-llCr-3A1.
The relationship (at 30' F) between Cv energy and DWTT energy for a variety of 1-in. thick titanium alloy plate material is shown in Fig. 26. Although this relationship wasdeveloped for a single temperature of primary interest, it could also be developed for anyother temperature. Because of the absence of a change in the fracture mode with tempera-ture, the critical necessity of comparison of test specimen results at 'shelf" positionsdescribed for steels does not enter the titanium alloy picture. For purposes of evaluatingthe rather gradual effects of temperature on the fine scale differences of the commonductile fracture mode, DWTT temperature effects studies will be conducted in the neaifuture. The general low slope of the correlation band, Fig. 26, below 2500 ft-lb DWTTenergy implies rather inaccurate prediction of DWTT (or ETT performance) from C,o datafor high strength titanium alloys. We have concluded that C, data for titanium are usefulonly for "broad brush" separation of brittle alloys from high toughness alloys and torestablishing broad trends in heat-treatment studies of materials in the intermediatestrength range. Similarly, the use of C, tests should not be ruled out for specificationpurposes aimed at quality control on the basis of simple separation of fracture toughmaterial from material that is accidently contaminated so as to result in low fracturetoughness.
The DWTT specimen size for titanium is 1 x 5 x 17 inches. The 1-1,2-in, deep,brittle weld, crack starting element is made by diffusing iron, nichrome, or stainlesssteel wire into the material, using an electron beam welding technique similar to thatdescribed In the steel section. This technique was first developed for preparation oftitanium DWTT specimens and has been used exclusively since the beginning of the .nves-tigations of this metal.
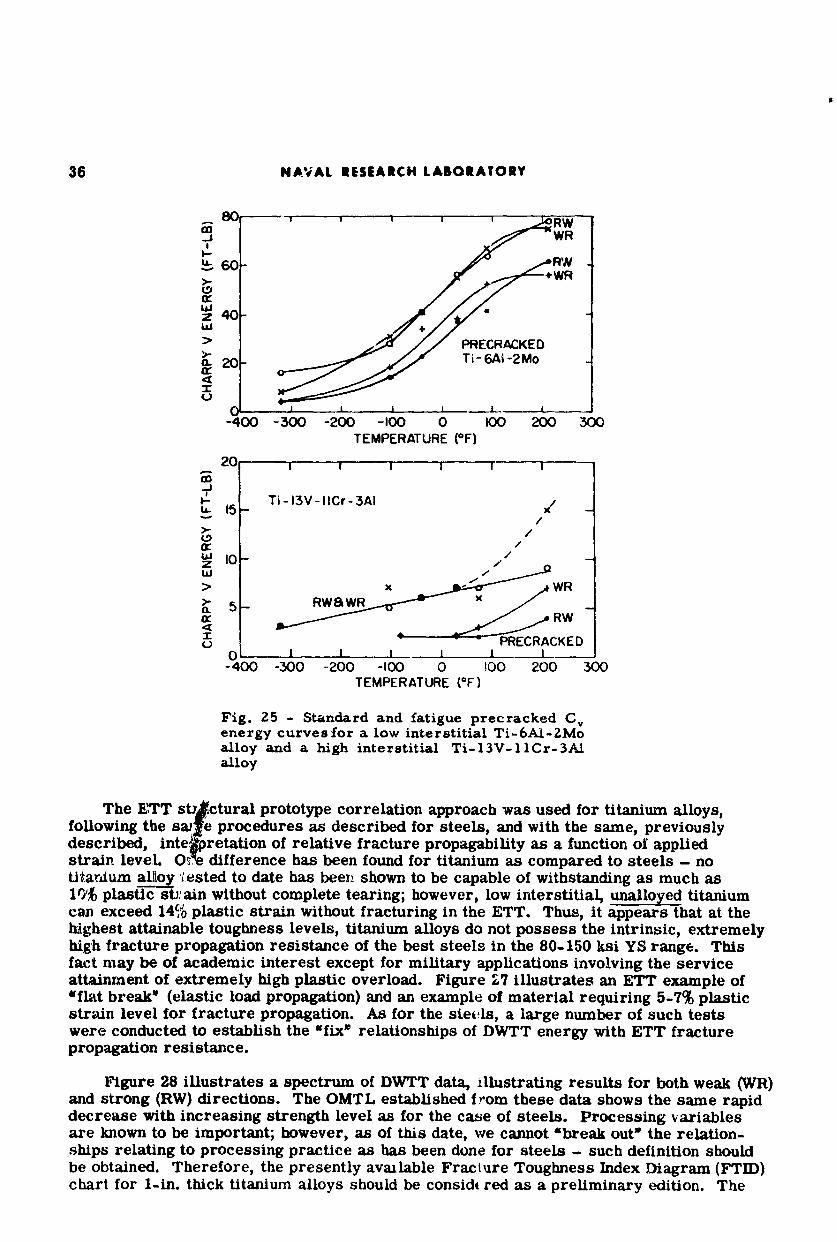
36 NAVAL RESEARCH LABORATORY
S0 - ' I I R W
SWRI-
60- RRW"+WR
Wz 40 "Wa
> PRECRACKED0" 20Ti-6AI -2Mo
(•I I I I
-400 -300 -200 -100 0 1OO 200 300TEMPERATURE (OF)
20
Ti-13V-IICr-3A1 /h 15- x -
"-- //
>" /LaJ
>x WR>- 5- RWaWR>" •RW
.-) PRECRACKEDSI I1
-400 -300 -200 -100 0 !00 200 300TEMPERATURE (OF)
Fig. 25 - Standard and fatigue precracked C,energy curves for a low interstitial Ti-6A1-ZMoalloy and a high interstitial Ti-13V-llCr-3A.alloy
The kIT st, ctural prototype correlation approach was used for titanium alloys,following the sale procedures as described for steels, and with the same, previouslydescribed, inte tretation of relative fracture propagability as a function of appliedstrain level Ote difference has been found for titanium as compared to steels - notitarzium alloy Iested to date has been shown to be capable of withstanding as much as1'f plastic styain without complete tearing; however, low interstitial, unalloyed titaniumcan exceed 14% plastic strain without fracturing in the ETT. Thus, it appears that at thehighest attainable toughness levels, titanium alloys do not possess the intrinsic, extremelyhigh fracture propagation resistance of the best steels in the 80-150 ksi YS range. Thisfact may be of academic interest except for military applications involving the serviceattainment of extremely high plastic overload. Figure '7 illustrates an ETT example of'flfat break' (elastic load propagation) and an example of material requiring 5-7% plasticstrain level for fracture propagation. As for the steels, a large number of such testswere conducted to establish the "fix" relationships of DWTT energy with ETT fracturepropagation resistance.
Figure 28 illustrates a spectrum of DWTT data, illustrating results for both weak (WR)and strong (RW) directions. The OMTL established from these data shows the same rapiddecrease with increasing strength level as for the case of steels. Processing variablesare known to be important; however, as of this date, we cannot "break out' the relation-ships relating to processing practice as has been done for steels - such definition shouldbe obtained. Therefore, the presently available Fracture Toughness Index IDiagram (FTID)chart for 1-in. thick titanium alloys should be considt red as a preliminary edition. The
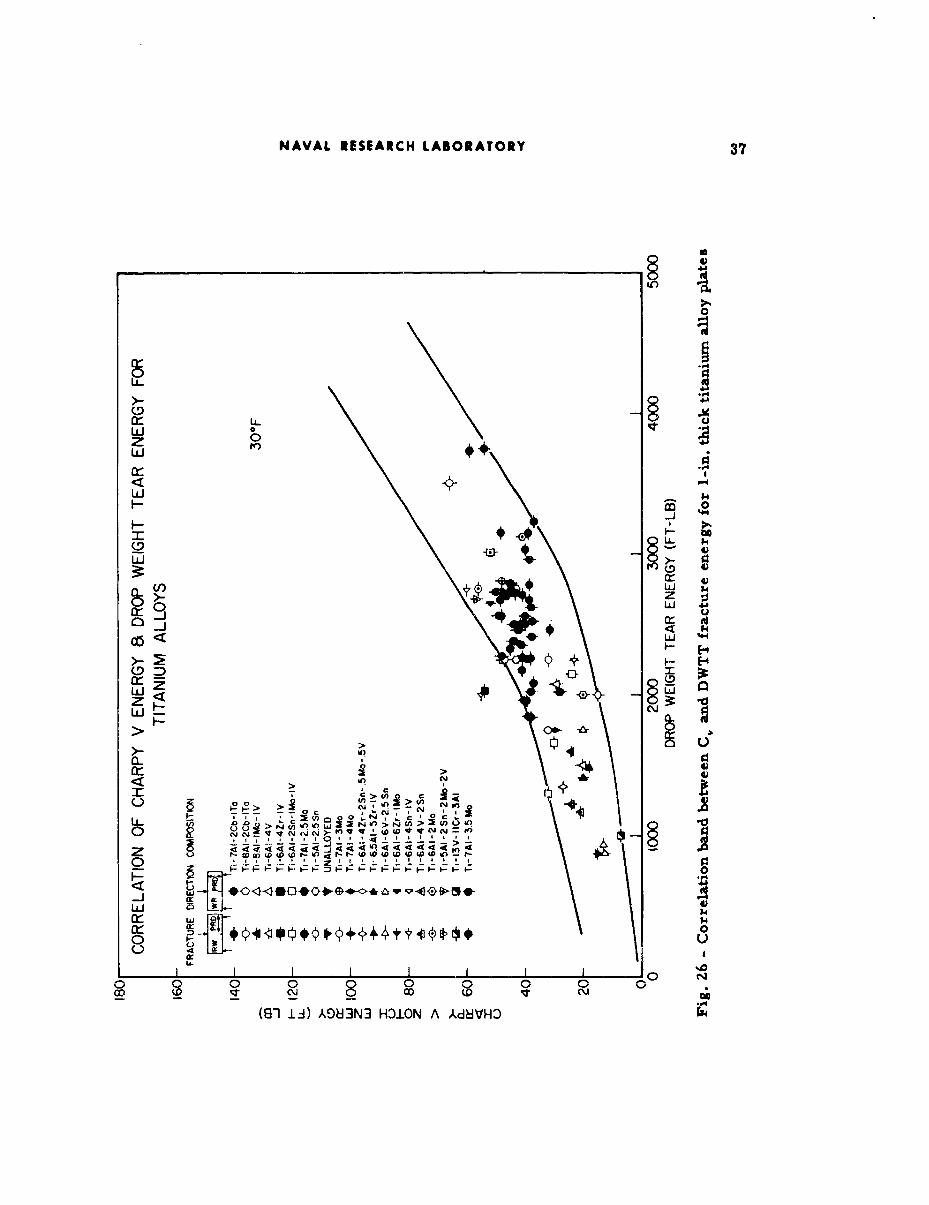
NAVAL RESEARCH LABORATORY 37
Lo
0
F- 0
LU
3:::U) w
x0 0
a -0Ar t
LI
(~> u-->__~-
CI > Ir 41 I I
H-
W ODQ o< P 04D4 0( 0 108 , P
T-I IIoi a a5
(9-1 iz) AS0IJN3 HDION A Ad8VHD
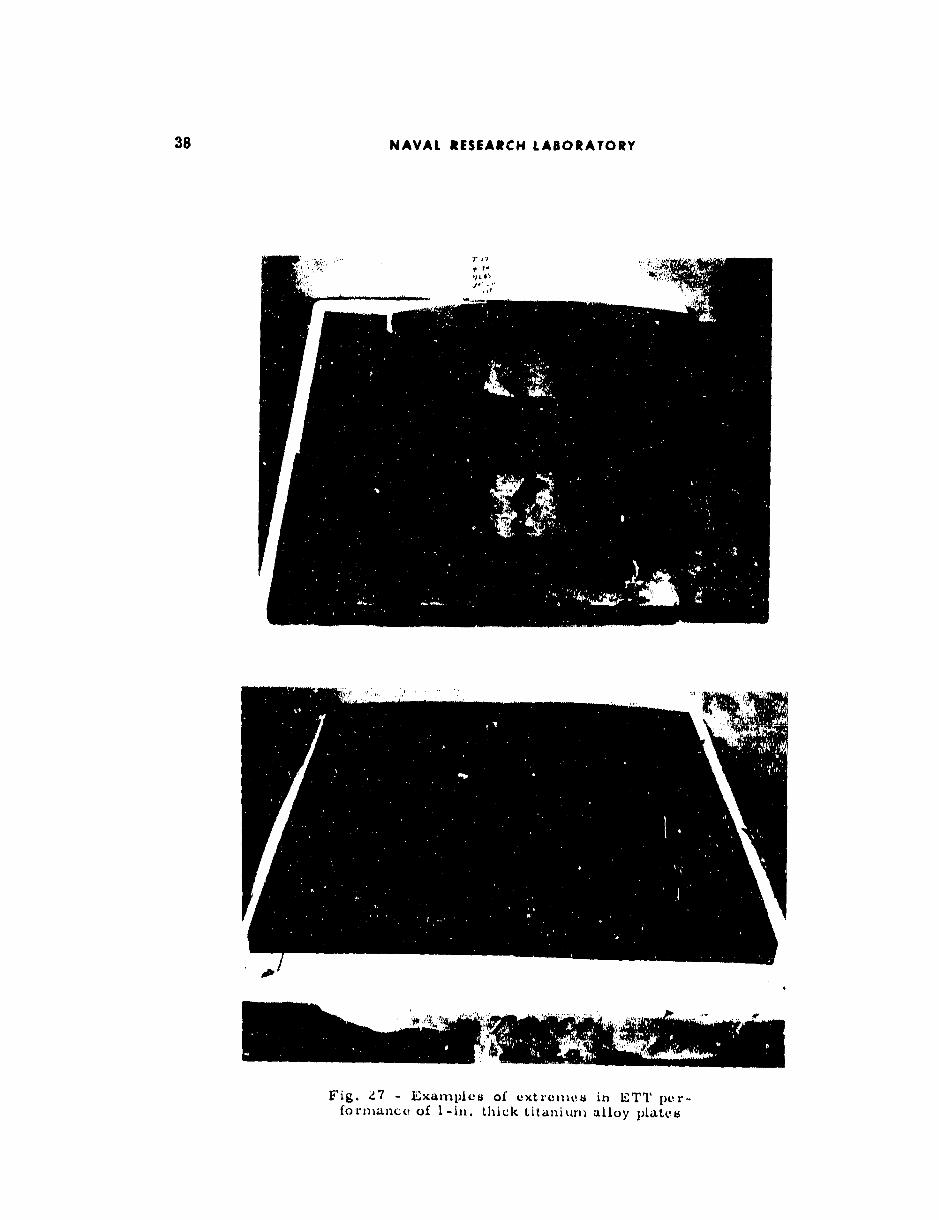
38 NAVAL RESEARCH LABORATORY
Fig. ?.7 -ExaMPICS of ouxtretneu in EI'TT pr-fo Vmance of I -itt. thick titani urm alloy plates8

NAVAL RESEARCH LABORATORY 39
(S8l-li) A983N3 A Ad&VHO JO 3SNVH0 0
1 0
'I -RI• ea
'no >I
> NoQ '+" +5 - +
(/ H2
os*
J~
Z wr
4~)
(SOl-.L4) AOU3N3 HV3 )1O3M dOblO

40 NAVAL RESEARCH LABORATORY
diagram shows that materials of below 1500-1700 ft-lb DWTT energy "break flat" in theETT and thus should be expected to propagate fractures through elastic load regions.Above 1500-1700 ft-lb DWTT energy, plastic strain overload is required to propagatefractures, and the relative level of DWTT energy is indicative of the relative level ofplastic strain required. For example, above 2000 ft-lb DWTT energy, 3-5% plastic strainwould be required, while above 2500 ft-lb DWTT energy, 5-7% plastic strain would berequired. This information was basic to the Navy decision to consider 2000 ft-lb DWTTenergy as a minimum desirable requirement for titanium alloys used in structures thatare not strictly stress analyzable - it guarantees (with a margin) the use of titaniumalloys that will not propagate fractures tbrough elastic load regions.
The cross, wer point of the Oflat break" limit, indexed at 1500-1700 ft-lb DWTTenergy, with the OMTL indicates that all presently known alloys of above 140 ksi YSshould be expected to propagate fractures through elastic load regions. Such materialsshould definitely be analyzed in fracture mechanics terms. On the basis of populationdensity (the "two block" analysis described for steels), most materials between 120 and140 ksi YS should also be expected to propagate fractures at elastic stress levels, unlessthe material has been metallurgically and process *optimized" to the highest attainablelevel of toughness. At strength levels below 120 ksi YSO a wide variety of alloys shouldbe expected to require major plastic overload for fracture propagation and should not beanalyzable by the present procedures of fracture mechanics. In fact, this has been ourexperience, as described previously. It saiould be cautioned that data described above
4,ate to 1-in. thick plate material
The DWTT provides a moans of assessing the fracture toughness of weld metaldeposits. Such tests have been conducted for titanium welds. The results are now usedroutinely an a guide in improving fracture toughness of welds by stress relief annealsand aging treatments. The 'weld" DWTT specimen involves two halves of the DWTTspecimen welded together across the 5-in. dimension, using a simple weld Jointconfiguration, such as a single or double Vee. The 1-1/2-in. deep, brittle crack starterweld is located on the central axis of the test weld. Examples of weld metal fracturetoughness determinations using the DWTT are presented for several alloys and treatmentsin the table below.
Weld Metal Fracture Toughness Properties (DWTT)
Alloy As Anneal AgeAllo Deposited(oM (ft-lb) Tonip/Tine. (ft- lb) 10m/Tm (ft- lb)
Ti-6Al-2Mo 1500 1800uF/lhwVac 1540-1600l5UuF/lhrVac 1100"F/2hr 17801800 JO F•irVac 1200 "F/2hr 2800
Ti.TAI-2Cb-ITa 29002780
Ti-T-Mo 1400 1775 "F/1brAC - 1200'F/2hr 1100I1MIG WIE LDS - W, me plate lprOlportiom with oinlilar heat treatilivits exceed
4500 ft-lb.
2 MIG WLDS - Base plato propcilte ,•10-,&0U it-lb.SElB WI.AI,DS - Base plate properties with lminlar heat t-reatuxent L800 ft-lb.
(Shouild be conaiderod expluoratory).

NAVAL NRESEARC4 LABORATORY 41
DWTT data for titanium welds are very limited at present but with the proce&,,technique now established, rapid collection of data is possible and it is planned to 4, vFTID charts for titanium alloy weld metal. This will then provide a reference oyardstick"to evaluate the merits of various welding practices, which is required to further optimizeweld procedures. The metallurgist and the research welding engineer may then assessnew welding techniques and new weld metal alloys with the aim of satisfying the need forhigher strength and higher toughness weld metal for use in complex structural applica-tions. The same can be said for titanium alloy and processing optimization studies nowunderway for the base plate.
In the near future, these studies will include 2 to 3-in. thick titanium alloy plates andwelds. Also, additional attention will be given to fracture mechanics studies of the highstrength, relatively brittle alloys and welds of the 130-150 ksi YS range for 1 to 3-in. plates.Explosion bulge and drop-weight bulge tests are also planned for purposes of evaluating HAZ(heat-affected-zone) properties. The bulge test techniques are described in a section tofollow.

EVOLUTION OF FRACTURE TOUGHNESS INDEXDIAGRAM FOR ALUMINUM ALLOYS
Fracture toughness information for aluminum alloys in thick sections has beenlimited primarily to circular notch tests conducted over a wide range of strength levelsand to fracture mechanics cests for the high strength, relatively brittle alloys. TheCharpy V (C,) test has generally been disregarded for good reasons, as shown in Fig. 29.The Cv curves are "flat" and the values are very low, even for low strength alloys. Ineffect, Cv test data have been considered undecipherable even for purposes of relativefracture toughness discrimination and we would concur with this opinion at this date. Itshould be noted that NRL electron microscope fractographic studies have disclosed that"dimple rupture" is the basic fracture mode over the entire range tf the Cv tests shownin Fig. 29,
60 ALUMINUM
50
40
I- 30
38 YS
10 .- IV
. .. 76 b YS
0 -- - I --300 -200-o00 0 600 ýW 300 400
Fig. 29 - GCanrali eatures of Gv ernrgy curvemfor aluminuiu alloy plate
The NRL approach to investiyating aluminum alloys followed the already-describedp .Locedures for steels and titanium alloys, The drop-weight tear test (DWTT) energyrelationshlip to C, energy for aluminum ailoys is shown in Fig. 30 in comparison to thepreviou.-ly described correlation bands for st.els and titanium alloys. It is apparent fromthis figure tPat the very low C,, energy values that pose difficulties of discriminationbetween a!toys .e ' eplhced by an expanded range of DWTT energy, Thus, the DWTTprovides a nim :is of fracture toughness discrimination that the Cv test does not. Thesame statemeint applies to the low (' vialuc range of steels and titanium alloys.
The ordinarily 'jrefnrred method of evaluating fracture toughness of aluminum alloys,the notch-strength rat! ) determined for c0rcular, sharp-notched tensile test specimens,has be i correlated to DWTT results as a point of reference with the existing bulk of datain the tierature. 'The u.orrelation band is presented in Fig. 31. The notch-strength ratio
42

NAVAL RESEARCH LABORATORY 43
180
-160 - HIGH STRENGTH STRUCTURAL MATERIALS
- 140 120H -"
1I20-fi
010 .10I00 .000
Z80 01- 0W 11.0 •
> 60 00 ,.-<STEEL ZONE
20X _, --- r TITANIUM (ALL POINTS)
-ALUMINUM ZONE
0 1000 2000 3000 4000 5000 6000 7000DROP WEIGHT TEAR ENERGY (FT-LBS)
Fig. 30 - Correlatlonb between Cv enerl, a•nd DWTT energy for -lusninum alluysas compared to other high stongth structural materials
appears to have a slightly more definable relationship to the DWTT energy than the CVtest energy, as is evident from the slope of the C, band at the top of the figure. Notethat the data band includes teots of both simple machine-notched and fatigue cracked,circular notch specimens, as well as specimens of longitudinal and transverse orienta-tion, In general, it appears that the circular sharp notch tenslle test does not providefor a "fine" discrimination of fracture toughness such as is possible with the DWTT.
The aluminum alloy DWTT measures 1 - 5 - 17 itiches. Phosphor bronze wire isdiffused into the material using the previously-described electron beam welding techniqueto provide a 1-1/2-i,. deep, through-thickness brittle weld for crack initiation purposes.As a matter of interest, !ess than 80 ft-lb energy is required to initiate fracture in thebrittle weld.
A very preliminary Fracture Toughness Index Diagram (FTID) chart for 1-1n, thick,commercially produced aluminum plates is presented in Fig. 32. As for the case ofsteels and titanium alloys, the diagram relates DWTT energy to ETT performanco at30'F. A relatively small number of alloys are represented in the DWTT energy - YSspectrum of data points. The alloy designations and temper conditions are listed besidethe data points. An OMTL could be defined only fGr the strong (RW) fracture toughnessdirection because of the limited data available. The weak direction (WR) fracture tough-ness properties are considerably lower at all L t the highest strength levels, indicatingconsiderable anisotropy in the plate material, he ETT performance indicates that mate-rials with less than 200-300 ft-lb DWTT energy will 'break flat," i.e., propagate fractures,under eleastic loading conditions. Figure 33 provides an example of such performance inthe ETT compared to a condition of high resistance to fracture propagation. For mate-rials of above 200-300 ft-lb DWTT energy, plastic overload is required for fracture propa-gation in the ETT. Materials having DWTT energies above 700-800 ft-lb require over 10%plastic strain for fracture propagation in the ETT.

44 NAVAL RESEARCH LABORATORY
40
ALUMINUM ALLOYS 'A" 50 308
2.2 ik 508601YIt5086 .05086
5 5088
02024.•6o6, •6,24006602024 0
22190
z *FATIGUE- CRACKED- TRANSVERSE SPECIMEN• @- FATIGUE -CRACKED -LONGITUDINAL SPECIMEN4 UNFATIGUED - TRANSVERSE SPECIMEN
1,0 -.4 UNFATIGUED-LONGITUDtNAL SPECIMEN
00
,000 2000 3000
DROP WEIGHT TEAR ENERGY (FT-LBS)
Fig. 31 - Circular, sharp notch tensile test, notch-strength ratio relationshipsto DWTT energy for 1-in, thick aluminum alloy plate. Cv test relationshipsshown for comparison.

NAVAL RESEARCH LABORATORY 45
3000 5086-4ý,H112 iALUMINUM ALLOYS
ONE INCH PLATES
FRACTURE DIRECTION
LL 06S2000- 5086 R W
S............. T 511H0212
5456-4-WH 321 ~W
ZWRW
W 6061 OPTIMUM MATERIALS
E6061 TREND LINET651
z: ioo 10% +STRAIIN556H2
0-3-9% STRAIN 70
GENERALLY FAT BREAKIWITH SHATTER OR T2§o " X E SV FRACTURET8
_0 10 20 30 40 50 60 70 80
YIELD STRENGTH (KSI)
Fig. 32 - Preliminary Fracture Toughness Index Diagram (FTID) chart for 1-in.thick aluminum alloy plate. Alloy designations and tempers are indicated with datapoints. The OMTL relationship to yield strength is based on the strong directionof fracture propagation in this case because of limited data points.
The cross-over point of the lower limit band of the FTID chart (separating elasticlevel fracture propagation from plastic overload requirements for fracture propagation)with the strong direction OMTL indicates that in the range of 60-80 ksi YS most alloysshould be expected to propagate fractures at elastic. stress levels. In the 50-60 ksl YSrange, there is a suggestion that optimized alloys - if well cross-rolled - may riseabove this low level of fracture resistance. At strength levels below 50 ksi YS, it appearsreadily possible to develop a wide range of alloys which will require plastic defoemationoverload for fracture propagation.
At this point we should make a "fine' point of distinction - despite the fact that thedescribed plastic overloads are required, the intrinsic energy absorption in fracture prop-agation is relatively low for aluminum as compared to that for steels and titanium alloys.Thus, engineering judgment may be required to ussess if fracture safety is indeed attainedfor special cases where large regions of a structure may be subjected to plastic overload(say explosive attack). In such an event a large region of rupture may result, thus weaken-ing the structure, such as a s.,•-P deck.. Obviously, if the structure is not subjected toextensive regions of plastic overloads, this point is of academic importance. For thegeneral engineering case, separation between fracture-safe and potentially fracture prop-agating alloys may be made on the usual basis. That is, if fractures do not propagate atelastic stress levels, the structure will be fracture-safe despite the development of plasticflow at geometric points that are stress indeterminate. The special case referred toabove may be expected to apply to any material that features very low specific energyabsorption - despite the fact that general plastic overload is required for fracture propa-gation. Another example of this case is the development of a very large crack in a struc-ture (say a very long weld crack flaw) which automatically results in plastic overload atthe crack ends regions (not only the crack tip) from a strictly P/A (load/section area -
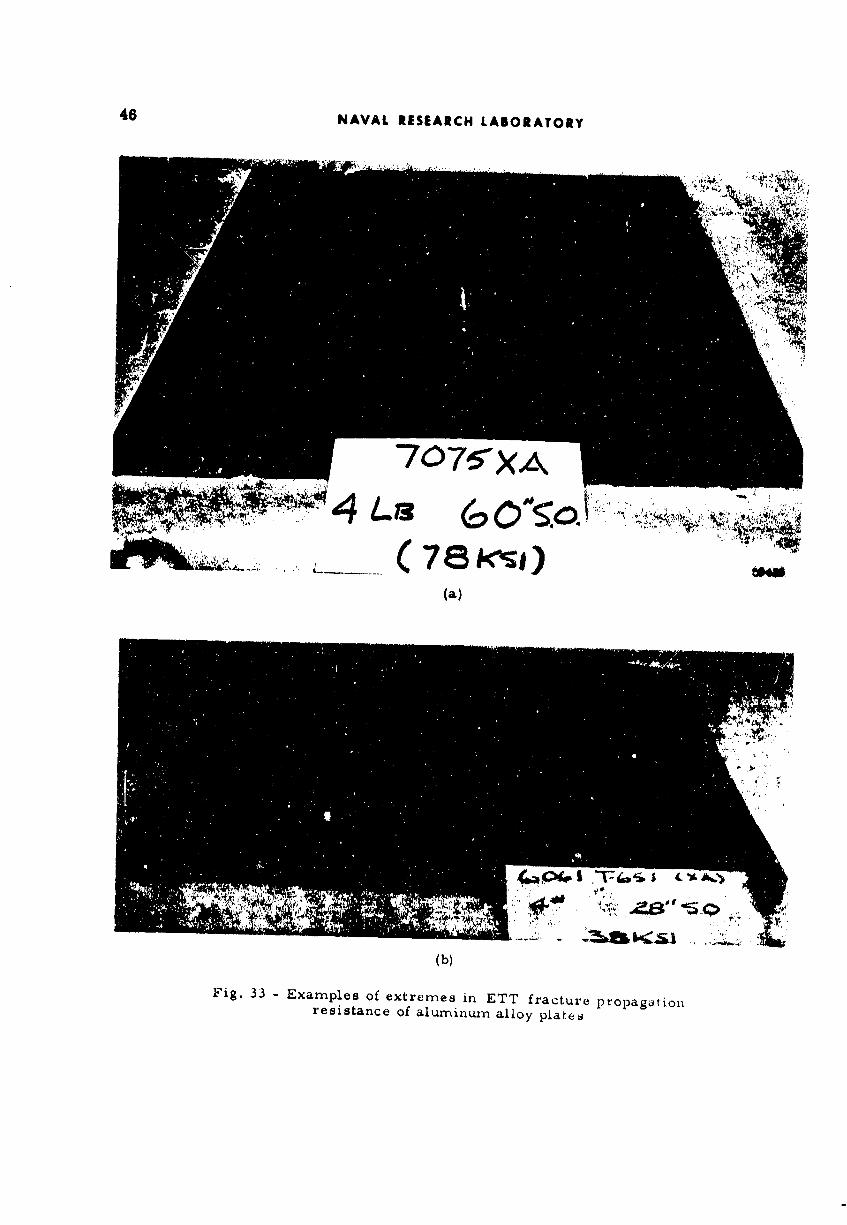
46 NAVAL RESEARCH LABORATORY
7 0 75-XA
(a)
(b)
Fig. 33 E xamnples of extremes in ETT fracture propagationresistance of aluminw-n alloy plates

NAVAL RESEARCH LABORATORY 47
local nominal stress) point of view - as has been discussed for internally pressured andpneumatically loaded pressure vessels (1,2). Such a situation may occur if an extensiveweld rupture should develop in a ship deck. The question then involves a change in gen-eral level of P/A and plastic overload, although not a subject of initial design, becomesa fact due to the accident. For such unusual situations, high specific energy absorptionplays a part, as well as the plastic overload requirement for fracture propagation. Thisproblem is of concern to designers of military ships and of pneumatically loaded pressurevessels.
It should be noted that the commercial alloys investigated to date have shown markedanisotropy with respect to fracture propagation resistance in the 6weak as compared to the"strong* direction. Again, thes.- studies have aot been carried to the same limits of finedistinction as made for the steels, and the present FTID chart is considered a crude firstedition. We are proceeding to test thick section aluminum plates and welds, and bulgetests for evaluation of the performance of HAZ (heat-affected-zone), as is being done forsteels and titanium alloys.

CONSIDERATION OF THICKNESS EFFECTS
The drop weight tear test may be "scaled up" to evaluate the combined metallurgicaland mechanical effects of increased thickness. By the use of large drop-weight test equip-ment and the *bracketing" technique for determining energy absorption, there is no prac-tical limit of thickness that may be evaluated. Figure 34 illustrates a 2-in. thick titaniumalloy DWTT specimen. Figure 35 is a photograph of the NRL 180,000 ft-lb energy drop-weight machine (6-ton weight with a 15-ft-drop height). Depending on the fracture energyabsorption of the test material, it may be possible to test plate sections of 6-in. or greaterthickness with relative ease, as compared to any other known test.
A program aimed at tests of thick steels, titanium, and aluminum alloys is now in itsearly stages of development, with material ranging from 2 to 4 inches in thickness. Thisprogram will include tests of "composite* materials comprised of high strength coresand lower strength (higher fracture toughness) roll-bonded surface layers. It will alsoinclude thick welds produced by various processes. Because of limited data obtained todate, we are not prepared to present thickness effects at this time. However, it is clearthat the test procedures are practical and will be analyzable in the usual terms of:1. - high fracture toughness sufficient to preclude fracture propagation at elastic stresslevels, and 2. - low fracture toughness that permits fracture propagation at elasticstress levels.
A plate specimen similar to the explosion tear test (ETT) with a central crack flaw,loaded by the drop of the large weight impacting on ani aluminum striker pad, schematic
Fig. 34 - Electron beam embrittled weld DWTTspecimen scaled for test of Z-in. thick titaniumalloy
48

NAVAL RESEARCH LABORATORY 49
Fig. 35 -NRL 180,000 it-lb drop-weighttest machine designed %jr thick sectionDWTT and for drop-weight bulge tests
DEFORMATION -TEST PLATEA v7 IO N
i
---- ALUMINIUM PAL)
Fig. 36 - Schernatic illustration ofdrop-weight -loaded versioxý of ETT

50 NAVAL RESEARCH LABORATORY
2 4),
U,
Q~ 4)
4) 4)
0 V4) N 4
- IA? M
U. 0 P I
zS .43L
V U~
F-..F-
LA ,d/) U
'* U U
U) C- 4
IN ý
U) 0--z
r ~*- i
0 000 0-40C\9 0 'D
(S81-d) Ad3N3A-AdVHO

NAVAL RESEARCH LABORATORY 51
drawing shown in Fig. 36, is in initial trial stages for use in providing correlations offracture propagability for thick sections under conditions of elastic and plastie loads.The metallurgical effects to be expected for increased thickness may be substantial inmany cases. A *rough' index of thickness effects may be deduced from conP,,lrison ofC, data with the previously presented OMTL base line data for I-in. steel plutes (Fig.37). The thickness effects data for the two steels illustrated were obtained by the U.S.Steel Research Laboratory under the BUSHIPS-U.S. Steel research contracts. Theseresults are intended only to illustrate possible thickness effects - the specific valuesfor the materials are not necessarily representative of the best that are attainable forthick steels and should be considered in such terms. Metallurgical, compositional,processing, and heat-treatment variables may be adjusted to minimize the decrease infracture toughness with increased thickness. The main point to be made is that all ofthese effects require exhaustive evaluation and definition. The improvements attainedshould be based on evaluations of full thickness DWTT performance to provide a moreexact intercomparison than that developed by Cv, data taken at some arbitrary positionin the thick plate section, as discusuied previously,
This phase of the studies is expected to be time consuming from all points of view;however, to existence of practical test techniques should provide impetus for such studieswhich heretofore have been avoided because of test inadequacies.

EVALUATION AND C'ONTROL OF Wi•L,+.) METAL PROPERTIES
Wv are cntvrlng a• era in which a multiplicity of weld tecl•nlquus may be used toproduce wolds In thick sections o( high strength steels, tlhnlunt, trod aluminum. It iu•,Iready known, from llnlited weld DW"fT •iata Of i.la. thlc+k•ess specimens •md from Cvdeterminations of thick section welds, that the wold tvclmlque as well an tht• weld a.z•aly-:,is (as deposltod), are mutu•tlly Intvracting tu•d critical lJ• vst•.bllshislg the l•vvl of frac-ture toughness - sm•ll •nounta of 02, N•, H•, etc., may bc highly d+.,trimt:ntal for highstrength met•u. For explor•tlon• of evolutionary dvvvlopmont possibilities •u•d •diructionseeking• in optimizing wold fracture toughno,'•s, relatively slmpit.' test procedures '.,rer+•quirvd, Test finesse that requires resu•'ch laboratory tecimiques must be relegated tometals that approach low fracture toughness Ivvels (at the optimum) and thurefort) rt:(luiresuch mcasurvmm•t precislom Again, it DWTT c• dmnonstratv conslst,,,nt attamabllltyof high fr'•tcture touglmuus for specific weldlx|g prucvdureu trod aUoys• it may not by =•uc-vssary to conduct specially pruciso frttcturv toughness tests; i. fact• it ratty not be pos-sible to obtain valid numbers uf fracture moth'.talcs type. The l>oini of view is - that forthe wields, its for tltu bas• metLtl, tile rely of thL• m•htllur•ist is to evolvv mctallurglc•tl•md proct)sslng methods whlcl) in fact provide hlgt• fracture ttmghnvss tu the higltestatt•==ablu strength lvvvis. Abuvu tlmsu strot=gth lvvvis, it bl, c,)mus t=ecvusary to v•crcisvtile usual chLmgu.over to l)recisv me•tsuru:nv|•t •td to build "p't)cisv" structures to p¢o-vent lr•cturvs that ratty follow wt)ld paths. Figure 3• illustrates ex;unplvs of Cv energyvalues att.l.ablv for wolds l=• 1/2 tu 1.in, thick steel pltttvs, as rvfvrvs=ct•d to the FTID.OMTL ch•'ts ha' l-In. thick steel plates prostrated l•l Fig, 22. There is •t sugt•.vt+tlon Inthese d=tt• tirol weld tout;Imuus (is= multi-pass weldh=g) i'or high strm=gth steel•, may attainlllghur vttlues thm• tht• lJase mt)tal toughness as suction slzt•s are ire'ceased, The fulltldcknuss DWTT should allow for dlscrimi•mti==g cumparlsons over a whlt• ra=•l,•t)uf weldthlclu=u=s for all structural materials of interest, The impo£'tam•€• of it=tt:t:£'ated •v,.tlua+tluns uf meta.llurgicai a•td meel•anical effects uf increased tlliclutvss for w¢.Ids cam•ot byowrumpimsi',ud, Any laboratu£'y vqullmlu|R (o£' crtu=v yard) that pt!rmltu tht+ druppl|tg ofa Is.rue wvlgl•t frmn a v•trlablv ht)Ight p£.uvidus tile £'•qulrt+d capabilities lO•' su{'h •xpltn'a.tory vvaluatto• •u•d l)roeuSs devulopme•t• uf wolds,
It sl•Jul.d bu rucogslizt•d that •t groat d•)al ,Jr' cxacti•g metallurgical al•d proces• {:o•l=.trul hi the •hop must be exorcised l• cuntrullttg weld metal ln'opertle• to ret• tq)thnizvdIn'opw'tivs that are •tchivvt•d by laboratory i•wvstigatluns. The higher tlle st£'e•gth it)eel,tht, more rigorous must hi+ the ct)ntrol over tlt¢ p£'ocodui't)'• - this applies tu siv•Is, titan-lure, and alumlt•utn alloys. Su•+'h £'equix'mnut•ts unavoidably h)ad to tile dix'vctiom• of aulu-rustic, dow•-i£mxd wielding for the ltigh m•d ult£'a-h•gh strength ravages of the subject metals,A alorv exact det'i•Itlo• would bu that for •tny •hara•terlstlc fmnily of alloys within age•t:rie metal group, the need for exact control is accentuated as tile strm•gth level r•geof chtmgc from tht: abuvt;-ylvid to the below-yleld f£'•u.turt, l)ropat;•ttlolt ch;traett)•'Istlcs ispassed. 'l'ht: chang•J point varies with family; for eXaml)Iv, in Fig. 38 the Ni-Cr-Mo cotn-!•sltio•) MIG wvId ftuniiy "as deposltt'd•' shows a sharp c h•t,;e in fracture toughness inthe rang|., of 130-150 ksl YS. The 12% Ni, maraKing slvi.,l MIG-TIG wold f•tnily "as air)d"apparently enters Iltt) c£.itlcal r;uigv of ci•;u•gt) i• the 160-190 ksl YS level, As alx addliionalexample, the Ni-Cr.Mo COml)ositio• of th,)stick electrode f•unlly *as doposltt)d" does (•otm•tch thv MIG process capabilitlvs of the same composltlotls. Now, all of the propertiesb.tvt,•,-t,.,*-..6,,,4 (•,•. 4h,, ,,% o• 4 ,.,,.1,,6,, d•,4,-•.,,,,,, |•,• .. Iv,'•'=•,,,'•u +,, ,+,• •a,•r• ,,•,,•,.. to u,,,,,-,•=,u, ¢ss•ntlally •abu=utu=-y px'udu¢'•u wrie=•.These data should not be t'a.kc:• :is x=•cessarlly repruse•=tatiw of vertleal o¢ shop weldedproperties. The importtmco of a r•fi•rekxco diagrmn to s•rvc a• a =yardstick" for evalua..tion of sp•clfic processes and welding prot, t)durl)s becomes evld•nt from these discussions.
52

NAVAL RESEARCH LABOUN7CdR( 53
w
V I .4
(04
~~4-4
'46)
J, .41
'k-I
00
(S81.Lk98S3N3 A-Ad8VHO J*0

54 NAVAL RESEARCH LABORATORY
However, weld propertie4 are determined during the "act of welding" and retention ofoptimum characteristics may require exact shop control. The degree of control that isrequired is determined by the "margin" between the desired design value based on labo-ratory optimized procedures and values that may be obtained in the shop. This statementis particularly important for the case of strength levels which fall in the 50-150 ksi Ain.plane strain K,, territory. A slight doviation in procedures and an expected 100+ Kvalue can slip to 40 or less, thus decreasing the critical flaw size from the inspectableto the uninspectable range. Such a case is a considerably different order of productioncontrol problem as compared to the case of a 30-40 ksi lower strength weld of the samegeneric family which could be laboratory optimized to have high DWTT values and, there-fore, a considerable 6margin" for statistical variance in production. Each situation mustbe analyzed on its own merits; however, itbecomes clear that complex structures cannotbe built using weld metal that has minimal "margin" features - the fra .re toughnessmargin for such structures must be substantial if shop welding is to be practical. The'old time" supervisory welding metallurgist merely had to assure himself that the welderused the proper electrode and was occasionally "qualified." The high strength materialswelding supervision control is orders of magnitude more involved and demanding ofexactness. "Old line" shops that attempt to enter this field must drop preconceived notionsof welding know-how. Past experience with low strength steel becomes of no consequence;education in the new field of high strength materials must 'start from scratch" - theresults of reliance on old experience may be catastrophic in both a structural and finan-cial sense.
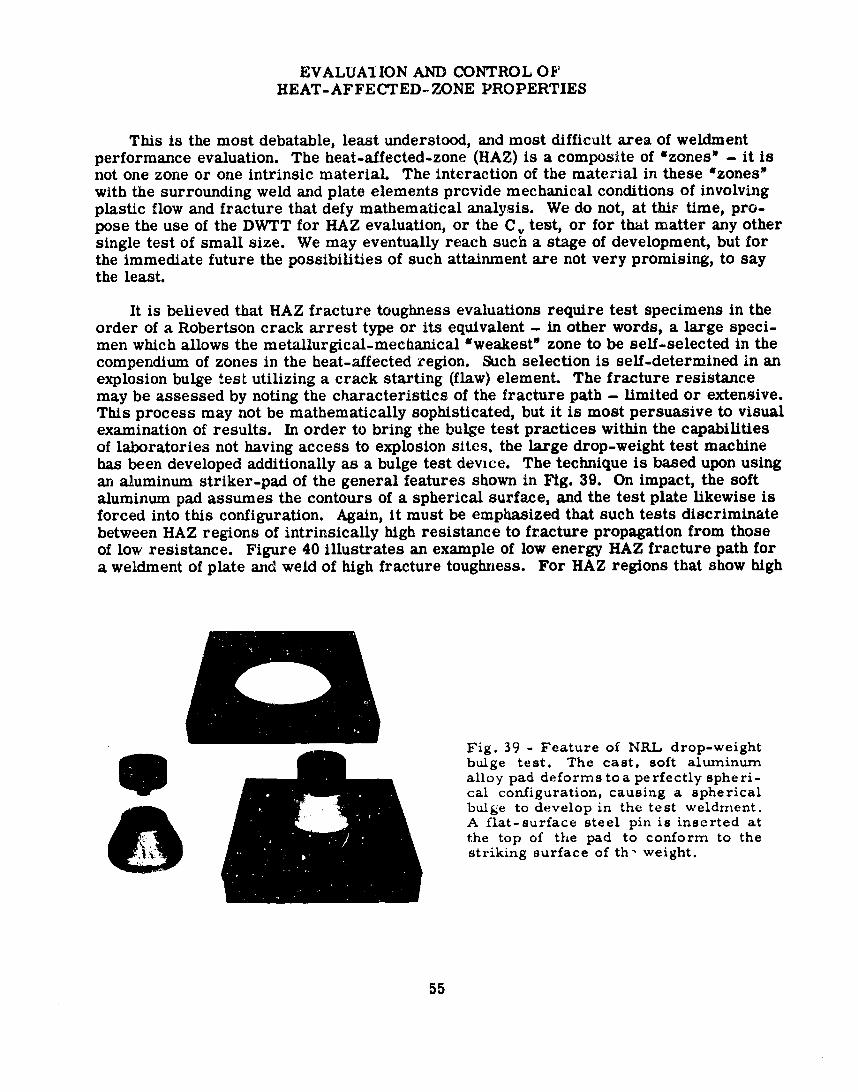
EVALUAIION AND CONTROL OFHEAT-AFFECTED- ZONE PROPERTIES
This is the most debatable, least understood, and most difficult area of weldmentperformance evaluation. The heat-affected-zone (HAZ) is a composite of 4zones' - it isnot one zone or one intrinsic materiaL The interaction of the material in these 'zones"with the surrounding weld and plate elements prcvide mechanical conditions of involvingplastic flow and fracture that defy mathematical analysis. We do not, at thiF time, pro-pose the use of the DWTT for HAZ evaluation, or the C, test, or for that matter any othersingle test of small size. We may eventually reach such a stage of development, but forthe immediate future the possibilities of such attainment are not very promising, to saythe least.
It is believed that HAZ fracture toughness evaluations require test specimens in theorder of a Robertson crack arrest type or its equivalent - in other words, a large speci-men which allows the metallurgical-mechanical 'weakest" zone to be self-selected in thecompendium of zones in the heat-affected region. Such selection is self-determined in anexplosion bulge test utilizing a crack starting (flaw) element. The fracture resistancemay be assessed by noting the characteristics of the fracture path - limited or extensive.This process may not be mathematically sophisticated, but it is most persuasive to visualexamination of results. In order to bring the bulge test practices within the capabilitiesof laboratories not having access to explosion sites, the large drop-weight test machinehas been developed additionally as a bulge test device. The technique is based upon usingan aluminum striker-pad of the general features shown in Fig. 39. On impact, the softaluminum pad assumes the contours of a spherical surface, and the test plate likewise isforced into this configuration. Again, it must be emphasized that such tests discriminatebetween HAZ regions of intrinsically high resistance to fracture propagation from thoseof low resistance. Figure 40 illustrates an example of low energy HAZ fracture path fora weldment of plate and weld of high fracture toughness. For HAZ regions that show high
Fig. 39 - Feature of NRL drop-weight
bulge test. The cast, soft aluminumalloy pad deforms to a perfectly sphe ri-cal configuration, causing a sphericalbulge to develop in the test weldment.A flat-surface steel pin is inserted atthe top of the pad to conform to thestriking surface of th- weight.
55

56 NAVAL RESEARCH LABORATORY
Fig. 40 -Illustrating the case of low fractureenergy propagation by NAZ path in a weidmentof high strength steel featuring high fracturetoughness plate and weld metal
fracture propagation resistance, there is no need to attempt obtaining exact numericalevaluation of fracture toughness, if such could be done. Mathematical evaluation proce-dures, as may-be evolved, can best be saved for HAZ conditions that intrinsically cannotbe made reasonably fracture resistant by metallurgical procedural control, Again, theargument is not against using sophisticated mathematical techniques but to reserve thesefor the HAZ with properties that require such treatment.
Drop-weight bulge test screening can readily establish if high HAZ fracture toughnessis attainable by any of the many options of metallurgical and weld processing methodology.When attained with sufficient margin to allow for manufacturing variables, it becomespossible to exercise practical control over the welding operation to ensure reproducingweidments of reliable HAZ properties. With the move to automatic (more reproducible)welding techniques, the promise of this simple approach becomes possible with narrowerlimits on the "margins" required. The discussions of procedural controls presented inthe section on weld metal properties may properly be repeated at this point, for the caseof the HAZ of weldments.
MICROMECHANISMS OF FRACTURE PROCESSES
Electron microscope fractography has become a standard tool for understanding thenature of the micromechanisms of fracture that are associated with the fracture toughnessproperties measured for the high strength materials described in this report. We do notpropose to extensively document these studies in this report. Excellent references as toprocedural techniques and interpretive procedures have been issued by Beachem (14,15,16), based on NRL studies.
It should be understood that the classical concept of fracture propagation, in the senseof physical separation of the metal at the exact point of the crack tip, is not a factual rep-resentation of the micromechanism of fracture except for materials of extreme brittle-ness, such as glass and ceramics. In fact, the energy absorption process in fracturepropagation is involved with the genesis and growth of defects, cleavage fissures, voids,grain boundary separations, etc. in advance of the crack tip. All such processes involvea certain degree of plastic flow, even for metals of high relative brittleness. It is thedegree of plastic flow in advance of the crack tip that determines the energy absorptionof the fracturing process. In fracture mechanics terminology, the plastic flow zone at thecrack tip is termed "the process zone" and the mathematical idealization tihat is madeinvolves considering the "effective" length of the crack a,; including the "process zone"to its calculated center-point position. The plastic zone in advance of the crack tip isidealized as being of circular cross section. With increasing fracture toughness, theplastic zone size increases and presents difficulties of mathematical analysis and therebydifficulties of experimental definition of the plane strain fracture toughness.
The extent of growth of the plastic zone with increasing stress intensity is determinedby micro-processes of fracture at the sub-optical microscopic level of resolution. Becauseof its inherently high resolution capabilities and high depth of focus, the electron micro-scope is eminently suited to examination of film replicas of the fracture surfaces. Suchexaminations provide post-fact analyses of the fine details of the genesis and growth ofmicro-fractures in the plastic zone during its growth and to the point of macroscopic rup-ture in advance of the crack tip. Such knowledge provides a guide for establishing thebasic nature of the processý.s which control the plastic zone size and thereby the energyabsorption of the material. These guides also provide information to the physical metal-lurgist that is useful in optimizing the toughness level of the metal.
In a brief introductory form, we shall compare C curve energy data to the basicmicro-fracture modes for various metals. Figure 41villustrates the sharp temperaturetransition (HY-80 steel) which is associated with a change from dimple rupture fractureof high energy absorption (involving the genesis and growth of spherical voids in theplastic zone) to low energy absorption cleavage fracture (involving microscopic flat frac-ture regions with "river patterns"). This figure also illustrates that as the Cv curve"rotates" downward to a low shelf energy and to a low slope appearance, the basic causefor this effect could be due to various basic microfracture mechanisms. For example itmay be due to development of dimple rupture of "rudimentary" form - that is, the spher-ical voids in the plastic zone begin to form but do not progress very far before the con-necting "bridges" are broken. Or it may be due to grain boundary separation, basicallyinvolving weakening of grain boundaries by preferential precipitates or other microstruc-tural embrittling agents. It may also be due to the development of "quasi-cleavage" - not
57
58 NAVAL RESEARCH LABORAT4)RY
80- a T STEELS
160-HY-80
140-
120DIMPLED GRAINRUPTURE BOUNDARY DIMPLED.SEPARATION RUPTUREloo-
mJ CLEAVAGE QUASI-
I-- 80- CLEAVAGE8- !LiL
o60-
40- 200 YS Q a T STEELS
20-,
C .. . { I0
-300 -200 -100 0 100 200 300 4000 F
Fig. 41 - Electron microscope fractographs illustrating variousrnic romechanis ms of fracture of steels in relation to C curves-approx. 4000X V
true cleavage on specific crystal planes but "flattish" break regions, perhaps the ultimateform of rudimentary evolution of dimples that do not enlarge significantly before ruptureoccurs.
Figure 42 illustrates the result of studies on maraging steels. At intermediate levelsof yield strength, a sharp transition temperature effect is noted, consequent to a changefrom dimple rupture fracture to quasi-cleavage fracture. At high levels of yield strength,characteristically flat, low energy Cv curves are cbtained. The dimple rupture mode offracture is retained over the entire temperature range shown but with change to the rudi-mentary form with decreasing temperature.
Figure 43 illustrates the case for titanium alloys taken from an earlier version ofthe Cv summary bands shown in the titanium section. In all cases, the fracture mode isnoted to be dimple rupture; however, for specimens of high CV energy the dimples arelarge and quite distinct, while those of low CV energy show dimples of rudimentary form.
Figure 44 illustrates the case for aluminum alloys. The aluminum matrix grainsalways show fracture of dimple rupture type, but with the fine details and size of the dim-ples changing with decreasing Cv energy. The high strength alloys also show cleavagefracture of second phase particles which may serve as crack initiation agents at a micro-scopic level.

NAVAL RESEARCH LABORATORY 59
140 MARAGING
120 150 YS
QUASI- CLEAVAGE
lo-
80-
S60 -
40- LOW HIGHTEMP TEMP.
20_
-300 -200 -100 0 100 200 300 400
OF
Fig. 42 - Micromechanisms of fracture for maraging steelsin relation to C curves-approx. 4000XV
60 NAVAL RESEARtCH LABOR~ATORY
70- TITANIIIM
LOW TEMPHGHTM60--
50-QJX
M 40--j
,I30-
20 - .
I /O
-300 -200 -100 0 100 200 300 400OF ---
Fig. 43 - Micromechanisms of fracture for titanium alloysin relation to C Vcurve s-approx. 4000X

NAVAL RESEARCH LABORATORY 61
60 ALUMINUM
50
40-
> LOW HIGHTEMR TEMP
2038 YS
78.5 YSI I I I I I
-300 -200 -100 0 100 200 300 400OF
Fig. 44 - Micromechanisms of fracture for aluminum alloysin relation to C curves-approx. 4000XV
Now, there are some surprises - in the presence of water and for tests involving"slow" growth propagation of fracture, such as stress corrosion cracking tests (SCC) orlow cycle fatigue tests, the basic microscopic mode of fracture may be changed from thatobserved in C v, DWTT or "dry" fracture mechanics tests, all of which may be representedas relating to the general "fast" mode of fracture propagation. An outstanding example isthat of titanium -7AI-2Cb-ITa alloys, which under the conditions of water environment,involving both static SCC tests and low cycle fatigue tests (17), showed a dramatic decreasein resistance to fracture propagation of the "slow mode" compared to tests conducted inair. Examination of the fracture surfaces for the "wet" tests indicated a change in frac-ture mode to quasi-cleavage fracture. The point to be emphasized is that quasi-cleavagefractures have not been observed for titanium alloys in the absence of a water (or moistair) environment. The environmental effects are both time and stress intensity dependent.
Thus, environmental effects may change the nature of the microscopic fracture modesand promote instability (that is, growth) of flaws that otherwise would not propagate. Highstrength steels and aluminum alloys are similarly susceptible to such environmentaleffects involving slow crack growth. The slow growth fracture propagation processes andthe nature of environmental effects will be discussed in the two sections to follow. Theseprocesses are not to be confused with the "fast" fracture propagation discussed in theprevious sections of this report, but nevertheless they present serious problems of analy-sis of fracture safety, as will be discussed.
Electron microscope fractographic techniques provide a tool for metallurgical under-standing of causative effects for low enei-gy fracture and thereby suggest procedures forevolving metallurgical improvements.
IMPLICATIONS OF STRESS-CORROSION-CRACKING ASPECTS
A specific flaw in a given metal and at a specified sub-critical stress level may beconsiderable "stable," i.e., nonpropagating if the material is used in a "dry air" environ-ment. For materials that are not sensitive to change in environment from dry air, towater or moist air, the fracture toughness measured under normal laboratory atmos-pheric conditions provides adequate information of flaw stability (no extension or increasein flaw size expected) at the specified sub-critical stress intensity conditions. For illus-tration of the potentially dramatic effects of stress corrosion cracking (SCC), let us nowconsider a 1-in. thick plate of 7-2-1 titanium alloy (7A1, 2Cb, 1Ta) of 107 ksi yieldstrength (YS) that, as measured by the drop-weight tear test and as evaluated by theexplosion tear test, shows resistance to fracture propagation to stresses considerablyabove YS levels. Thus, even for relatively large flaws such material would have "stable"nonpropagating fracture properties at all levels of elastic stress. As described, frac-ture mechanics tests of the 7-2-1 titanium alloy resulted in inability to define a planestrain fracture toughness because of high fracture toughness. As the K I (stress intensity)level is increased for a fatigue crack (notched) specimen, a point will be reached wherethe crack tip "dimples," indicating plastic flow in advance of the crack tip and roundingof the notch tip. Thus, the determination of a valid K C (critical) plane strain fracturetoughness cannot be made. Now, the 7-2-1 alloy (at least in certain heat treatment andprocess conditions) happens to be highly sensitive to SCC. The same notched specimen,if loaded in sea water will propagate SCC fracture from the fatigue crack tip at stressintensity levels that may be relatively low. The SCC propagation is 'slow" in the sens"that it does not involve a fast running (spontaneous) fracture across the test section o..through a structural member. Nevertheless, it can occur at rates of "inches per minuteor hour" which becomes "fast" in a structural engineering sense. Such crack propaga-tion processes in fracture rpechanics terminology are termed "sub-critical crack growth"which translates to growth (movement) of the crack at stress intensities that would notprovide "pop-in" or fast extension of the fracture in the usual sense. Thus, we can beinvolved in situations where the material is fracture-safe in an "inert" environment butnot in an environment that catalytically promotes 'slow" growth extension of the crack.For some high strength steels, ordinary tap water or "moist" air may be sufficientlyactive agents for promoting sub-critical SCC crack growth. Aluminum alloys may besimilarly affected.
The SCC characteristics of the 7-2-1 titanium alloy were first discovered byB.F. Brown of NRL late in 1964 in the course of extensive investigation of SCC, sub-critical crack growth characteristics of a wide range of materials, including steels,titanium and aluminum alloys (18). This discovery was surprising because titaniumalloys had previously been considered immune to SCC.
Brown's experiments were conducted using a simple cantilever loading equipment,shown in Fig. 45 (19). The cantilever specimen, shown in Fig. 46 (left) features afatiguecrack notch and is located at the position of the plastic "cell" container for "flowing"synthetic sea water, actual sea water, or any other liquid of choice, as illustrated inFig. 46. The stress intensity applied to specimen is defined by equation "1" of Fig. 46(20). The load level is adjusted by shot placed in the bucket at the end of the lever arm.The thickness "B" is adjusted to the fracture mechanics requirements of retaining asharp crack front (elimination of dimpling at the crack tip). Such adjustments are pos-sible within limits determined by the level of K1 c fracture toughness. Materials of verylow KIC values may require a 'B" of only 1/4-in. while materials of higher K 1 , value
62

NAVAL RESEARCH LABORATORY 63
Fig. 45 - NRL cantilever test rack designed by B. F. Brown for evalu-ating SCC susceptibilities of metals at known levels of plane strainstress intensity. The fatigue-cracked test specimen is located at thepoint of connection to the vertical frame member.
may require "B" of 1 to 1-1/2-in. to retain plane strain conditions. At some point thedry test K I C value may become sufficiently high that a valid K1 c number cannot beobtained and side growing is then used as an equivalent of increased thickness, againwithin limits defined by fracture mechanics principles.
The importance of Brown's approach is that It does not rely on obtaining an exact"dry' K I value but in determining the "wet" value for long term, sustained load. Thus,materials which do not allow for obtaining usual accurate K values may, if SCC results,be measured accurately for the "wet" value. In such a case the dry test values are simplyreported as a fractuiee strength of "lower bound,* undefinable fracture mechanics signifi-cance. The important aspect is whether or not the wet environment causes a decrease inthe resistance of the metal to propagation of the sharp fatigue crack. Brown's experi-mental approach involves first obtaining the "dry" value of K ,, or the breaking strengthif an accurate "dry" number is not obtainable. This is then followed by *wet" tests atvarious levels of stress intensity to determine the time required to obtain definite move-ment of the crack by SCC if the material is so susceptible. The movement of the crack is
64 NAVAL RESEARCH LABORATORY
FATIGUE71-aCRACK
L _
B.2o.j -b
4.12 M ý/-I
_b<
Kj= - x Eq. 1)BD312
aD K-1 l.2ro"2 b (Eq.2)
(a) ysCANTILEVER SPECIMEN (b)
TENSILE SPECIMEN WITH"THUMBNAIL" SHAPED SURFACE
CRACK
Fig. 46 - Details of the fatigue-cr,&'ked specimen devised by B. F. Brown for usein the cantilever test rack. The "thumbnail" crack, tensile test specimenhas beenused for SCC studies by other investigators, but is less desirable for screeningpurposes. Respective equations for calculations of stress intensity are indicated.
100- 4340 STEELYS. v 215 KSI
80
o60
40
20 NL
B3REAK0 - I .A L i 1 LI 1 1l _
O 100 200 300 400 500 600 700 300 900 000
TIME TO FRACTURE (MINUTES)
Fig. 47 - Illustrating the general nature ofrelationships of (K 5 ) stress intensity to timefor SCC propagation; data relate to4340 steelof approximately 215-ksi YS
indicated by dial gages placed on the lever arm. Figure 47 illustrates data for a SAE 4340steel of approximately 215 ksi YS; Fig. 48 presents similar data for a highly SCC sus-ceptible type of 7-2-1 titanium alloy. It should be noted that the SCC susceptibilities ofthe 7-2-1 and other titanium alloys varies widely with composition and processing prac-tices; this, essentially is a "worst" case example.
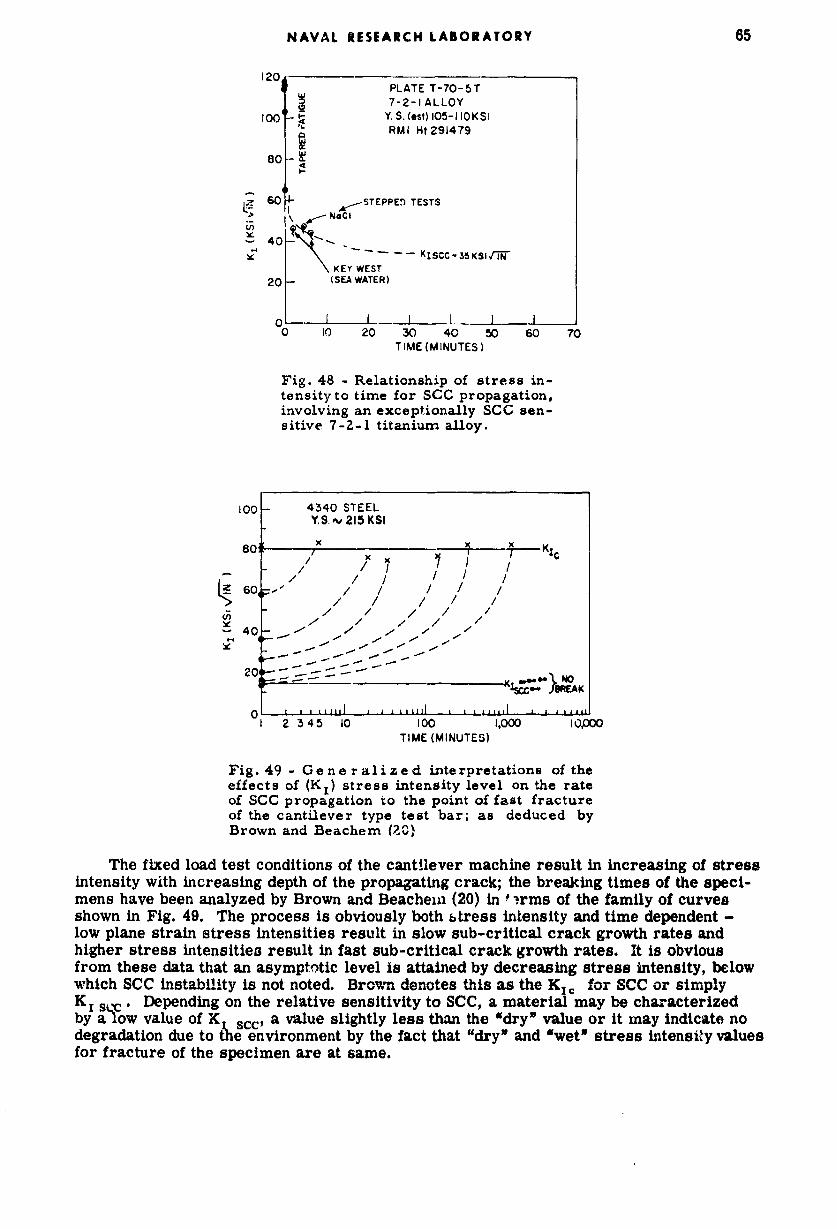
NAVAL RESEARCH LABORATORY 65
120 PLATE T-70-5T
:D 7-2-1 ALLOY100 L S2 Y. S. (est) 105-110OKSI
RMI Ht 291479
80-
60 4- -- STEPPE) TESTSi .-- ~ <NaC
"40 T-S• KEY WES --- KISCC..S5KSI[IW-
KEY WEST KSC3gj-N
20- (SEA WATER)
, I I II J - ]0 10 20 30 40 50 60 70
TIME (MINUTES)
Fig. 48 - Relationship of stress in-tensityto time for SCC propagation,involving an exceptionally SCC sen-sitive 7-2-1 titanium alloy.
100- 4340 STEELY.S.,v 215 KSI
80 80i I / K/// / / I /L 0 / // / / ,/ /
u, ' / / / /v/ / / / /
S40 -i / / / /40-
- - .-
20 -- Kt
--- LýJ REAK
0 1 A1111 A 1111 I I £11
1 2 345 10 100 1,000 I OPO0TIME (MINUTES)
Fig. 49 -G e n e r a i z e d interpretations of theeffects of (K,) stress intensity level on the rateof SCC propagation to the point of fast fractureof the cantilever type test bar; as deduced byBrown and Beachem (ZO}
The fixed load test conditions of the cantilever machine result in increasing of stressintensity with increasing depth of the propagating crack; the breaking times of the speci-mens have been analyzed by Brown and Beachein (20) in # irms of the family of curvesshown in Fig. 49. The process is obviously both btress intensity and time dependent -low plane strain stress intensities result in slow sub-critical crack growth rates andhigher stress intensities result in fast sub-critical crack growth rates. It is obviousfrom these data that an asymptotic level is attained by decreasing stress intensity, belowwhich SCC instability is not noted. Brown denotes this as the KI C for SCC or simplyKI s 'c Depending on the relative sensitivity to SCC, a material may be characterizedby alow value of K scc, a value slightly less than the "dry" value or it may indicate nodegradation due to &he environment by the fact that "dry* and 'wet" stress intensity valuesfor fracture of the specimen are at same.

66 NAVAL RESEAIRCH LABORATORY
For the case of the cited, highly SCC sensitive type of 7-2-1 titanium alloy of 107 ksiYS, the KI scc is 35 ksi fi--. By application of the standard fracture mechanics calcu-lations applicable to the case of a long flaw (depth to length ratio of 1 to 10), commonlyknown as the "worst case," the following relationships of stress level and flaw size forSCC propagation may be calculated:
a 0.2 ) a = critical crackdepth
= applied nominalstress
SCC Critical FlawNominal Stress Level CCrtclFaDepth for 10-1 Ratio Flaw
1/4 yield stress 0.45-in.
1/2 yield stress 0.11-in.
3/4 yield stress 0.05-in.
at yield stress 0.02-in.
Discussions with experts in the field of fracture mechanics indicate that the K sccvalue may be used as equivalent to a valid KI value obtained by usual test procedures.However, it is granted that verification of the exactness of the calculations may requiremore precise definition by the tensile test, thumbnail surface crack method, as illus-trated in Fig. 46 (right). If these values are essentially correct, as believed by fracturemechanics experts, the fracture safety of such a material becomes critically dependenton the environment.
These facts point to the importance of considering possible SCC sensitivity of mate-rials in fracture-safe design. Returning to Fig. 1, it may be noted that the best steelsindicated by the ban.ds are SCC sensitive. In particular, for steels featuring the highestyield strengths and concurrently K values of less than say 160 ksi CYii, SCC degrada-tion effects are known to be quite severe, requiring fracture mechanics calculations based on thelow value K I s,, numbers rather than on the conventionally determined KIc nuiabers notedin Fig. 1. This fact is emphasized by the bold arrows pointing down and to the left in thesubject figure. It should be noted additionally that 'wet" environments may relate to"moist" air and not necessarily to immersion in water.
From preliminary screening, the best quality steels appear to be SCC insensitivebelow approximately 175 ksi YS and generally increase in SCC sensitivity with increasedYS above this level. Brown's dramatic finding that titanium alloys of 105-120 ksi YSmay, under certain conditions, be highly SCC sensitive effectively moves the fracturepropagation resistance of such materials from above YS levels to very low elastic stresslevels. The difference being that while fast, "unstable" fracture propagation is not pos-sible as defined by the FTID, relatively "slow" (inches per minute or hour) fracturepropagation by SCC in water or possibly even in moist air may become possible. Forsuch conditions the structure may be expected to fail by SCC due to elastic load stressesor even due to residual fabrication stresses.
Because of the critical importance of information on the SCC susceptibilities of highstrength structural materials (including base metal, welds, and HAZ) a broadscope programof screening and categorization of the materials described in this report will be conductedby Brown and coworkers. It should be noted that an alloy such as 7-2-1 which may behighly susceptible, can be modified by composition and process history adjustments togreatly alleviate, if not possibly entirely eliminate SCC susceptibilities. This is an areaof part",cular emphasis in the present research program for titanium alloys. It repre-sents another aspect of the optimization process in the evolution of fracture-safe materials.

IMPLICATIONS OF LOW CYCLE FATIGUECRACK PROPAGATION ASPECTS
There are two basic aspects of the low cycle fatigue crack growth problem for struc-tures subjected to nominal elastic loads. One aspect relates to the enlargement of smallflaws initially present in the structure and the other to the development of such flaws ininitially flaw-free regions. In the presence of flaws the "incubation" period for initiationof a fatigue crack is eliminated. Metals which feature high rates of fatigue crack growthare greatly dependent on the incubation period for retention of reasonable low cycle life.If this period is eliminated by flaws, the effect on total cycles to failure can be drastic.Our point of view is that the incubation period cannot be "relied upon" for all types ofstructures and metals - particularly, it cannot be relied upon for complex structures.In general, whether or not it can be relied upon is a matter of engineering judgment;however, the data to be presented may cause considerable 'qualms , to those who wouldlike to utilize the incubation period "across the board' for all types of metals and struc-tures. We shall now discuss this subject in the same general manner of concept plusdata used in the previous sections.
For brittle materials, low cycle fatigue crack growth provides for the attainment ofthe critical instability flaw size for the existing level of nominal stress; the result maythen be the initiation of a "fast" fracture which propagates through the structure. Accord-ingly, for such metals the low cycle fatigue life of structures, which initially containbarely-subcritical flaws, may be a few cycles ! For materials of high fracture toughness,low cycle fatigue crack growth at points of stress concentration may result in a gradualslowing down of the fatigue crack as regions of low stress are entered or in the loss ofnet section which results in increasing the nominal stress and thereby may introduceplastic overload stress conditions. Plastic overload fracture propagation for pneumati-cally loaded pressure vessels provides a special case if the fatigue crack is long com-pared to the thickness of the section. In such a case (see discussions in references (1,2)),the plastic overload occurs at the crack tip regions due to local 'bulging" of the pressurevessel in the flaw-weakened region, and rupture may occur even though the design nominalhoop stress level is low.
The philosophy that the flaw growth rate is the crucial factor in determining the lowcycle life to the point of structural failure was inherent to the NRL selection of a crackpropagation test for low cycle fatigue studies. Such studies are being conducted "acrossthe board" for the various materials of interest. For simplicity, a strain range index ofmechanical conditions was chosen because it is the only index that can always be measuredby strain gaging after "shake-down" of a complex structure. At positions of geometriccomplexity, the stress conditions existing after fabrication are changed by the applications of
S proof tests or after several cycles of service loading, Le., 'shake-down." Thus, strainmeasurements at critical points in a structure can provide meaningful information eventhough the specific stress level may be indeterminate.
to At the present stage of development of these studies, the information obtained relatesto fatigue crack growth rates (FCGR) for a specific condition of loading. The crack growthrates provide a screening index of metals that may be expected to have very low, inter-mediate, or high orders, of *low cycle" fatigue crack growth characteristics. The trans-lation of this information to exact predictions of cycle life is highly dependent on thespecific features of the structure and the environment. Considerable accumulation ofdata for tests conducted under a wide range of loading conditions would be required to
67
* . '

68 NAVAL RESEARCH LABORATORY
evolve more exact definition of structural life, providing the structure is in fact strainrange analyzable at critical locations. Considering the ordinary accuracy of determina-tion of levels of strain concentration for specific points of design complexity, it is notnecessary to develop test criteria that are more rigorous than the capability to analyzethe structure. For example, in pressure vessels the best possible theoretical attainmentof nozzle design configuration represents a strain intensification in the order of twotimes (2X) the nominal hoop stress level. Ordinary nozzle design may easily approachstrain intensification levels in the ord•,r of 4X, and higher "X" values may be attainedfor more complex structural configurations. These are the general guidelines used bythe design trade involved with ordinary structures for which exact strain gage analysesof the finished product are not made. Such analyses, combined with data to be presented,are adequate for placing the cycle life of such structures in "decade" steps - such as100, 1000, 10,000 or 100,000 cycles to failure. These "rough cuts" are all that is required,or could be obtained, for most engineering structural applications.
The question to be answered by the compilation of fatigue test data is - for a givenmetal, in Z given environment, what is the expected cycle life considering the genralfeatures of the structure at points of stress intensification? The NRL strain rarg• pro-cedure for determining FCGR is designed to provide for broad range screening of metalswith sufficient information to answer such questions in the stated manner. The problemof refining the answer lies more in the area of accuracy of indexing the structural designfeatures than in the area of laboratory test refinenment.
Tests of structural configurations are an essential part of the refinement studies.The PVRC pressure vessel test series (9,10,11) represent such an approach to the prob-lem involving configuration studies as well as studies of low cycle life based on laboratorytests. The configuration studies separated cycles to propagate a crack through the pres-sure vessel wall, as well as cycles to fatigue crack initiation. These procedures haveserved very well for use with low strength steels at temperatures above the NDT for whichthere is considerable remaining life after the crack incubation period. As we considermetals of higher strength levels, laboratory test data based solely on life-to-fatigue-crack-initiation become inadequate. The reason for this is that in the fracture tough temperaturerange, low strength materials feature rather long initiation periods plus rather slowFCGR. The metals of high strength discussed in this report have greatly reduced liferemaining after fatigue crack initiation, even at temperatures of maximum fracturetoughness. The FCGR may become rapid, particularly if environmental effects enter -accordingly, the FCGR becomes a crucial matter of investigation.
Recognizing these aspects of the problem, the NRL approach was specifically tailoredto providing definition of FCGR in preference to the us ual laboratory studies of "cycles-to-first-cracking.* The test development was initiated in 1963, and is now consideredsufficiently evolved to proceed on a broad base "across the board" screening of materialsof interest.
Plate specimens are cyclically loaded by machines, such as shown in Fig. 50, usinga fully-reversed (balanced ±) cycle, with a mean strain of 0. The "starting" fatigue crackis developed by a machined notch in the center of the test section as illustrated in theclose-up photograph, Fig. 51. Following the initiation of the crack, measurements ofcrack growth rates are established for specific strain ranges. The strain range is moni-tored with a film-type strain gage at the surface of the specimen. The surface lengthof the crack is precisely measured with an optical micrometer to 0.0001-in. Constantstrain range conditions are maintained by adjusting (decreasing) deflection as the crackgrows.
It has been determined from these studies that for a specific environment and strainratio, the growth rate of low cycle fatigue cracks is critically dependent upon the appliedtotal (elastic plus plastic) strain range, as expressed by the relationship:

NAVAL RESEARCH LABORATORY 69
Fig. 50 - General features of low-cycle fatigue test equipment
/4 q
Fig. 51 -Low-cycle fatigue test specimen. Note central -machinednotch to facilitate crack initiation and foil-type strain gage formonitoring strain range.

70 NAVAL RESEARCH LABORATORY
dL/dN = C(ET)'
where L = total crack length
N = cycles of loading
E T = total strain range
m = exponent
C = constant.
By establishing the validity of this relationship, the NRL studies simplified the evaluationof factors such as mean strain and environment by reducing the data to straight lines ona log-log graph. For a specific type of metal, such as Q&T steel of HY-80 composition,FCGR data on a total .Arain range basis are apparently independent of yield strength (YS)and fracture toughness. This is illustrated 'n Fig. 52 by the FCGR data for the subjectsteel heat treated to 80, 130, and 150 ksi YS which fall upon a common curve.
This basic interrelationship establishes the fact that low cycle fatigue rapidly entersthe picture of the useful life of structures with the use of steels of high YS. As the YSof materials increases, the value of attainable E (elastic strain) increases to a point thatsmaller amounts of EP (plastic strain) can be tolerated for a given life, and finally to apoint that no ec can be tolerated. This is illustrated by the FCGR relationships for steelsranging 48 ksi YS (A201B) to 212 ksi YS (D6AC). For easier interpretation of low cyclelife data, the FCGR is presented as a function of the ratio of total strain range to the pro-portional limit strain range. Since the proportional limit strain corresponds to the strainat yield in a conventional tension test, comparisons in Fig. 53 are essentially on a YSbasis, and the ratio value of 1.0 corresponds to YS loading fo: .11 materials and test con-ditions cited. Plotting in this form provides for evolving the .harts to the status of refer-ence diagrams to be noted as Index of Structural Fatigue Life (ISFL). This is attained bythe addition of index estimates of cycle life based on the cycles to growth of very largeflaw sizes. From these index points of reference, shown on the right scale of Fig. 53, itmay be interpreted that limited fatigue lives (less than 1000 cycles) can be expected forstructures of 200 ksi YS steels if a small flaw and plastic strains are present.
In comparing the FCGR curves for various materials, we may take the HY-80 (air)curve as a point of reference; this material requires cycling in the plastic range to develophigh FCGR of 100/200 microinches per cycle. In synthetic seawater, the same FCGR maybe attained at stresses slightly below yield, Fig. 54. It is noted that the effect of maximumstrain level (maximum stress for ± loading of zero mean strain) is quite large since theFCGR is related to the 4th power of the strain range (m = 4 in the equation cited). Thehigh strength nonferrous alloys generally feature 6 to 8 power relationships, which accountfor the steepness of the titanium alloy (air and saltwater) curves. The subject titaniumalloy tested in air shows the same 100/200 microinches/inch FCGR at high elastic stresslevels as the HY-80 shows in salt water; however, it should be noted that this is the cross-ing point of the two curves, the slopes are different.
The titanium alloy shows not only increased FCGR in saltwater as compared to air,but also a "break-away" point. At maximum stress levels of approximately 0.6 of yield,the fatigue crack stops propagating in the ordinary, gradual stepwise fashion and begiksto "sprint+" e~rraticlly, indicating a SCC (stress corrosion cracking) rupturing mechanism.resulting effectively in unmeasurably fast FCGR. In fact, the fractures under these con-ditions are not propagating by the classic fatigue process and are more aptly described asSCC fractures. Electron microscope fractographs are presented in Fig. 55 showing thefracture surfaces produced by classical fatigue crack pr opagation (left and quasi-cleavage(right) characterizing the SCC fractures above the subject "break-away" point.
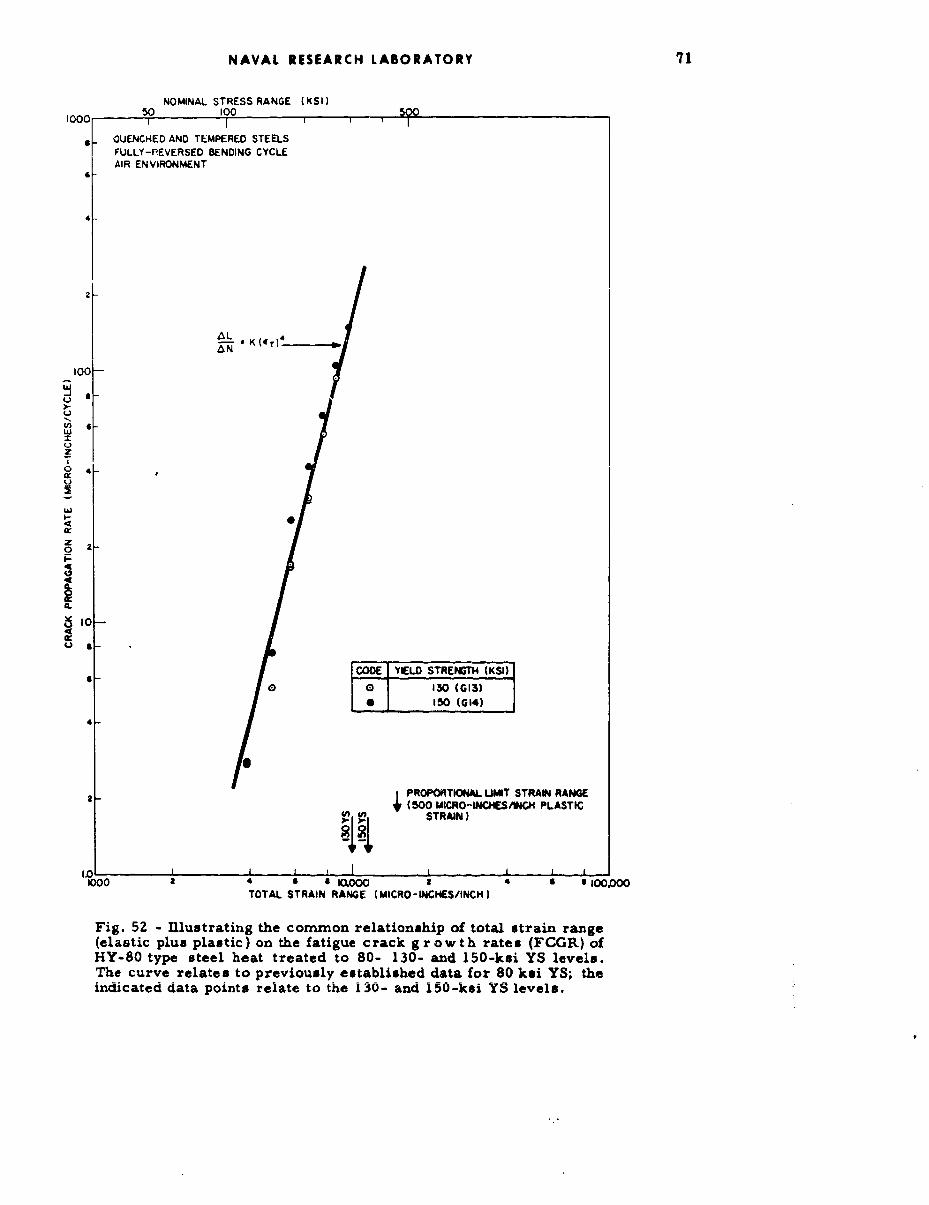
NAVAL RESEARCH LABORATORY 71
NOMINAL STRESS RANGE (KSI)1000 5 0 100lOI I I
OU.NCHED AND TEMPERED STEELSFULLY-PEVERSED BENDING CYCLEAIR ENVIRONMENT
4-
2-
A-- S K •]
100
Wz
W
z
0(.
10-
iCODE YIELD STRENGTH'IKSI)
4
0 130 (G03)4
SPROPORTONAL LIMIT STRAIN RANG)
• STAIN(500 MtCRO-INC4ESAINCH PLASTIC
IQC U) STRAJIN)l
I000 4 0 14,000TOTAL STRAIN RANGE (MICROT-INCHES/INCH
Fig. 52 - Illustrating the common relationship of total strain range(elastic plus plastic) on the fatigue crack g r owth rates (FCGR) ofHY-80 type steel heat treated to 80- 130- and 150-ksi YS levels.The curve relates to previously established data for 80 ksi YS; theindicated data points relate to the 130- and 150-ksi YS levels.

"72 NAVAL RESEARCH LABORATORY
I,0000 K T T---r--TT---Fr rT rTTTTT-T-rf
LESS THAN
1000- H 1000CYCLES
I- U.
lIo0 -- 10,000
CYCLES M
N - I--
- t-.
L..
LUU
10 IHf4 100,000-- CYCLES O.
I NOTE- PROPORTIONAL LIMIT0I IS DEFINEO AS 500 XIAJI MICROINCHES PER
INCH PLASTIC STRAIN zI RANGE
ELASTIC STRAIN RANGE PLASTIC STRAIN RANGE
0.1 0.2 04 06 0.8 1.0 2.0 4.0 10RATIO OF TOTAL STRAIN RANGE TO PROPORTIONALLIMIT STRAIN RANGE
Fig. 53 - Effect of increasing yield strength onthe low-cycle fatigue crack growth rates ofsteels covering a wide range of strength levels.By cross-referencing the relativc levels ofelastic and plastic stress (plotted on the strainrange axis) to the approximate number of cyclesrequired for the growth of a 1-in. crack (plottedon the crack growth rate axis), a simple chartIndex of Structural Fatigue Life may be deducedin decade steps for each material. Note thatrapidly increasing FCGR may be expected in astructure after the flaw size has attained growthto 1-in. size.
In Fig. 56, the low cycle fatigue characteristics of two high strength aluminum alloysare compared to those of HY-80 steel. The FCGR curves for the aluminum alloys have amuch steeper slope and thereby indicate greater sensitivity to strain range than the HY-80steel. The effects of such high sensit!vity are most apparent when one considers that theISFL drops from 10,000 cycles to less than 1,000 cycles if the loads peak at 70% of theYS rather than approximately 50% of the YS. It may be noted by comparison at the FCGR

NAVAL RESEARCH LABORATORY 73
LESS THAN
000 I I j1I IJ -I i 11 1 '000'¶ CYCLES
1O,._ 1,,,, 0 ,'I I -
3/ I
z. I"
10> $o - I 100Io.ooo -.. I NOTE: CYCLES
•1 / PROPORTIONAL LIMIT STRAINRANGE IS DEF'INED AS 5t00Il 1 MICRO-INCHES/INCH PLASTIC
Ii ISTRAIN RANGE
EATCSTRAIN RANGE.,,,, PLASTIC STrRAIN RAN-E
1.c-l 1 • I i iLl I I I u uI I10.1 0.2 0.4 0.8 0.8 1.0 2.0 4.0 6.0 6t.0 10.0 .
RATIO OF TOTAL STRAIN RANGE TOPROPORTIONAL LIMIT STRAIN RANGE
i Fig. 54 - Comparison of the low-cycle fatigue crack growthrates of 7-2-1 titanium alloy to those of HY-80 steel in airand in salt water environments. Arrows indicate rapid,
S~fracture propagation by SOC (break-away point) for 7-2-1S~titanium alloy in salt water.
curves for 7079 aluminum alloy in air and saltwater, that this alloy is also sensitive toaqueous environments; however, a =brea~k-away' point, such as observed for the 7-2-1titanium alloy, was not observed. The high exponents for FCGR relationships of aluminumalloys indicate that this metal is highly sensitive to design stress, and life in the lowcycle fatigue range may drop to low values for high stresses. L
There are other practical engineering generalizations that may be made from thedata shown in Figs. 53, 54, and 56. The HY-80 steel may be expected to condone regions",of plastic strain concentration with retention of relatively long, low cycle life (say 10,000 •to 20,000 cycles at points of high (X) strain concentration). Moreover, extensive fractureextension by fatigue will be allowed without collapse of the structure due to fast fracturei.propagation because# of the high fracture toughness of HY-80 steel. Such test predictionshave been proven out in large scale model tests. Metals having 8 to 8 power strain range
.......-..-..

74 NAVAL RESEARCH LABORATORY
$4 -
4).-4
4O~44
-4)
4 ) U). 0 * **0
C)
OD ufnla
0

NAVAL RESEARCH LABORATORY 75
LESS1000. =I. I
CYCLES
~10ICYCLES
NOTEPFO0ALUTSRA AGISwEIE S50MCOIC
INCHPLASIC SRAINRANG
T, 1.0 4
RAI OF'~ TOTA STANRNET RPRIOA TSRI AG
Fi.5 o-yl fa igu rc rwhrae f22 n7079h almiu alloy c oH -0sel oe in-
crae slpe
sensitivity ~2, toFGSol b xetdude h aecndtost ae eylmtd
hi0 IX factoTs.These~~~~~~~~~PRPRTOA datT STaAI Resmaie osgiytaoyl atigue atopriual
britlemealshaing. 56g -Low-cyclne fatigue racktgrowt proaatiof chr024isic aor
aeplictivnsity tomplGex shouculdres Ileced undber thetsaiecnditingsafto havedery limityced
"Xfatgecodtorsnshol be reduced atutrs lois poucibless sevene for teueo fracture toughmeasFo~rtemetals ofic 6r nto envpowmertll sensitivitte. Itntials, fofaiucractuetuhes istoe initiste
"Themim"iem dthat mayt be summaideed to sigif othat lowcycl ftigen "actnion,* partbicnlrl

76 NAVAL RESEARCH LABORATORY
crucial or merely bothersome. These other aspects additionally emphasize that it is mostdifficult to conceive practical use of high strength brittle metals, except with structuralperftecticn as the sole safeguard. For such metals, the attainment of reasonable guaranteeof structural perfection presents vexing and difficult problems of design and quality con-trol carried to the ultimate possible limits.

STATISTICAL PROBLEMS IN APPLICATIONS OFLOW FRACTURE TOUGHNESS METALS
If we return to the upper bound curve of Fig. 1, it is apparent that there are definiterelationships between critical flaw sizes and yield strength levels for steels in the rangeof 200 to 250 ksi yield strength (YS). These data apply to 1/2 to 1-in. thick steels - forthicker steels the relationships may be expected to move in the direction shown in Fig. 57.The shift to lower KI C values and thereby to smaller critical flaw sizes may be expectedto be relatively minor for the steels in 180 to 200 ksi YS range but relatively major forsteels of progressively higher strength levels, as indicated by the bold arrows.
ISO I TEST DATA#STIALEEMATES OF UPPER 0OUN0"
,' .(KST FORRIOUS CLASSES6/ Of TO I' STEEL PLATES)
S140 -
WIDE VARIETYIOF *LEAN ALLOY' 0 T
X 120 - STRUCTUhAL STEELPLATE WELD -HAZ
. • /INCREASING THICKNESSZ oo/I, S "EW" STEELS100: 116MARAGINO N .P.9-4
DECREASING TEMP.IN AA3DIENTTEMP. RANGE80 /
o / /l
,.60 /i i
'IZ ~/ /FETO
W s2-, INC.€REASED " O"8STEELS
STHICKNE38 4M3-4i385-H-il
EXPECTED D-6 ,ETC.,
80 100 120 140 160 180 200 220 240 260 280 300YIELD STRENGTH (KSI)
Fig. 57 - Illustrating the expected degrees of decrease of plane strainfracture tbughness (K,,) of high strength steels with increased thick-ness. Also, the potentially low values that may be obtained in plate,weld. and HAZ of various commercial "lean" alloy Q&T steels of rela-tively low strength level. Major reductions of alloy content, compared tooptimized Ni-Cr-Mo compositions, result in marked reduction of "'shelflevel" fractiv-r toughness, particularly for I-IkZ regiorns of weldm'nents.
77
78 NAVAL IRESEARCH LABORATORY
Now, let us consider the fabrication of a large structure - say a large motor casecomposed of a large number of high strength steel plates, insert forgings, and welds. Con-sidering only the plates, it is well known that melt, process and heat treatment responsevariables will unavoidably result in a Gaussian distribution of YS values and a similar dis-tribution of Kx, fracture toughness values. The insertion in the subject rocket case ofmembers of different thickness - say at heads as compared to the cylinder, at 'YI rings,at ports and openings, etc., implies that the gaussian distributions will be expanded, notonly with respect to YS but also with respect to the K, fracture toughness, Fig. 57. Fromthese considerations a very real engineering question arise as "how to cope* with such amultiplicity of analytical problems presented by the range of strength and fracture tough-ness characteristics involved in a single structure. This problem is quite different fromthat of a single component item for which it may be assumed that a unique YS and a uniqueplane strain fracture toughness may be determined. Actually, this is not quite so even forsuch a single item because of producibility variables - in any event we shall emphasizethe multicomponent case for purposes of discussion.
The question is - do we design based on the low end of the frequency distributioncurve, the median or the high end? Or - do we specify different criteria for differentlocations as a function of thickness and potential flaw orientation? Such questions pre-sent severe and difficult problems of analysis. For example, if the high end of the dis-tribution range is taken as a conservative approach for a steel of nominal (median value)of say 240 ksi YS, it will result in lack of flaw size inspectability capability because thefrequency distribution range will involve the potential presence of higher strength levelsof very low KIC values. Also, the thicker members may likewise have low K C valuesas compared to the Fig. 1, 240 ksi steel chart index value of K1 C. If any other point(median or low end) is taken it will result in unrealistically optimistic analyses ofcritical flaw sizes. It appears that such dcomposite* construction at the stated "nominal"high yield stress levels is unrealistic and fracture safety may be assured only by hydro-test procedures; perhaps including repeat tests which involve accepting the possibility offatigue failure of the "few cycle" life range, if slightly sub-critical flaws are present.This problem is further compounded in hydrotest because both low cycle fatigue crackgrowth rates and the short time maintaining of static proof loading are environmentallysensitive to stress corrosion cracking flaw growth. It would appear more practical andcertainly more astute engineering, to "back-off" to a lower nominal strength level forwhich there is a much higher inherent iracture toughness and to recover structural effi-ciency by "working" the metal to slightly higher levels of elastic stress. Each case mustbe analyzed separately and with a fund of statistical knowledge of the YS and K I fracturetoughness frequency distribution ranges involved. It becomes clear that the requiredsophistication for multicomponent construction based on very high strength low fracturetoughness metals is considerably beyond any that has been candidly described in theliterAture - but it is a fact of life that must be faced.
The statistical type problems are not restricted to the ultra-high strength range -they are inherent to any strength range ior which the particular metal has plane strainfracture toughness in the 40 to 160 K I C (approximate) range and for which there is asensitivity to zompositional and process variables. The lean alloy Q&T steels that haveemerged as articles of commerce may have fracture toughness falling in this range (seeFig. 57 - left side plats), depending on spvcific thickness, temperature variations fromsummer to winter, weld quality, and HAZ characteristics. The HAZ regions of suchsteels may involve low energy fracture propagation characteristics that essentially elimi-nate temperature effects - i.e., low slope, very low shelf value Charpy V curves. Becauseof the very "lean" levels of alloy content of certain of these steels and marginal or eveninadequate metallurgical weldability of specific types, the best that can be obtained forHAZ toughness is difficult to retain in the shop without rigorous technical supervision ofthe welding processes. We must leave the problem of analyzing the potential statistical,fracture toughness variations in complex structures composed of such 'lean alloy" Q&Tsteels to those who have pertinent, valid data on the subject. Again, we would prefer to

NAVAL RESEARCH LASORATORY 79
identify and then use metals that do not involve statistical base metal and HAZ variationswhich may Odip* into the low fracture toughness regime, if it can be avoided econmnicaly.Again, the analysis that such approach is, in fact, to the best interest of the particularstructure must be made from an engineering basis - do we need to avoid such possibilitiesor it is possible to accept them? This is not our decision, but we wish to call attention tothis problem area. For low alloy Q&T steels in present commercial use the question oftenarises for a structure "in being" as to the 'estimated" level of HAZ fracture toughness.The answer to this question is - that it depends on the welding technique, not the weldingtechniques supposedly specified, but those that were actually used in the shop by thewelder. The nature of the control problem is all too evident to those that are acquaintedwith the varieties of such steels on the market and with the variety of welding shops thatutilize such steels in complex structures.

SUMMARIZATION OF TECHNOLOGICAL IMPLICATIONS
It may be noted that this report emphasizes philosophy as well as the presentation ofspecific data and test procedures. The problem of practical, fracture-safe design of abroad spectrum of structures, involving a broad spectrum of materials is fortunatelydefinable into various *compartments" that require somewhat different, but fortunately,basically straight-forward solutions. The specific lnforymation required for each com-partment and the specifics of the use of the resulting information are intimately inter-twined. Engineering evaluation difficulties based on present limitations of even existingknowledge may have the appearance of chaos in the high strength metals field to thefrustrated designer requiring exact information, or may simply appear as the evidentneed for more time to evolve additional information to the metallurgist, the welding engi-neer and to the specialist in structural mechanics. In great part, the 'apparencies" ofchaos result from basically similar technological situations in other fields, generalizedas "chaos in the brickyard*-each investigator is busy in his compartment producing themost polished and perfect "brick,* i.e., papers on specific technical subjects. However,these single "bricks" which provide the basic substance required to evolve the total tech-nological structure are simply placed randomly in the literature "brick pile.,,
This report attempts to select out compartments, identify the individual elements oftechnical knowledge within the compartments and systematically evolve an integration ofthe product of the various compartments. It is only by this means that the full picturecan emerge of the evolution of fracture-safe design processes, of the promise and limita-tions of existing materials, and of the road to improvements. It is important that suchintegrations be made by those who are fortunate by being broadly involved with the multi-faceted aspects of the total problem. The socially stimulated "publish or perish" desireto publish in terms of discourse with one's peers in the field leads to a situation such asdescribed by Shaw for the washerwomen of Cardiff, "who earned a precarious living takingin each other's washing." In our collective field 'here has been too much attention to debateand discourse on details between experts and too little to candid explanation of the statusin any given compartment, Isolation in compartments can lead to "tube vision" and toignoring of what is going on in other co-mpartments. It is utterly unreasonable to expectthat the ultimate engineering user of the information can afford the time to read, integrateand assess the conflicting idealogies of the separate compartments, representing literallyhundreds of papers. Library archives or computerized literature searches are not theanswer-there is too much "tube vision" bias in the product of the individual compart-ments. Such integrations of philosophy and of the product of interrelated compartments,as is attempted in this paper, are ordinarily unpublishable in the usual literature outletsbecause the generally available publications are reserved for "bricks" of effort. Thereis a real need to counter this situation and the initiative must be taken by collective actionof groups active in various broad areas of technical effort.
We have taken such initiative as a matter of basic duty and because it is more satisfy-ing to discuss the tctal picture-while not initially intended, the integration that has evolvedleads to the delivery of specific summary messages of various types to several audiences.These are as follows:
1. To Desi ex s - Moving to the use of high strength metals demands an entirelynew perspective of the properties of the materials and a new respect for the critical
80

NAVAL RESEARCH LABORATORY 81
nature of the integration of knowledge of structural mechanics and of metals properties.Despite the fact that this paper may have to be read several times to grasp the extent ofthe necessary integration; such minimal comprehension is critically necessary. Experi-ence with low strength metals cannot be relied upon and in fact, can be highly misleadingfor this new field.
2. To Investigators and Users of Fracture Mechanics - The case for fracturemechanics in its present state is perfectly valid for the best of metals of the higheststrength range or for poor quality metals in lower strength ranges. However, theresourcefulness of the metallurgist and welding engineer in developing best materials tosome limit of high strength that do not require such elegant treatment should not be dis-counted. Also, it should be recognized that mathematical treatment requires a corollaryof stress analyzability for the structures. It is not to be expected that all structures willbe designed and fabricated to provide for such treatment. The purpose of fracturemechanics is fulfilled for situations involving metallurgical failure to producc materialsof high fracture toughness. Do not expect to impose or use rigorous mathematical pro-cedures for materials that do not require it. Lastly, do not attempt to report or use"lower bound,* plane strain fracture toughness numbers for materials of high fracturetoughness. Recognize that "no* numbers are obtained and thereby avoid confusion. Theusu•al rationalization that, at least, these represent conservative lower bound levels ofhigher values that actually cannot be measured is unworthy of any method that is basedon calculations using exact numbers. There are too many amateurs entering the scenewho conduct invalid fracture mechanics tests-these should either be 'educated' or theirproduct excised from the literature, lest they hopelessly muddle what is a promisingfuture for fracture mechanics.
3. To Investigators of Engineering Test Approaches for Fracture-Safe Design - Thedesigner and fabricator of complex structures has a critical need for such information.This report amply documents what can be done in the simplest possible manner if fracturetough materials are used. This area of effort should be expanded to develop such proce-dures to greater finesse, to evolve an understanding of the significance of classical engi-neering test methods and to add to the investigation of newly developed test methods. Theultimate promises of such approaches are just as exciting and valuable as those of themathematical calculation techniques; moreover, the latter have real limitations for thepresent and the foreseeable future. It is time to recognize that activity An this field is ascientifically defensible course of action.
4. To Metallurgists and Welding Engineers - The comprehensive summarizationsof fracture toughness indices for high strength base metal, welds, and HAZ that areevolving will provide "yardstick' comparison of specific capabilities. As chaos of inter-comparison i- replaced by "frames of reference,' the course of action will becomeclearer, individual attainment of success more documentable and individual failures moreglaring. Unless, an adequate comprehension of the scope of the problem is attained, out-of-dateness for work in the high strength metals field will be inevitable.
5. To Fabricators - As middlemen between the designers, the metals producers,the welding engineers and the users, you are in a difficult situation. Not all fabricationof high strength materials must move in the direction of precise aerospace practices.This report summarizes strength levels and fracture toughness "transition" points belowwhich continuance of high quality, 'ordinary' fabrication is acceptable as compared tolevels that require shifting to more exotic types of construction. Be certain not to attemptto use ordinary fabrication for materials that do not allow for such. Similarly, do not bepushed to exotic, expensive construction practices for materials that do not require it.Again, it is essential that the contents of this document be understood before decisionsare made affecting costs or reputation. Mistakes in either direction can be financiallyruinous.

82 NAVAL RESEARCH LABORATORY
In closing, we shall repeat that this report must be studied carefully and assimilatedin an integrated fashion. The various separate sections should then merge into a coherentwhole. It is this awhole* that must be understood before collective progress can be madefrom a basis of engineering realities.
Any one intending to cope with, or compete in, the production and utilization of highstrength metal structures cannot afford to understand less, even if the understanding insome cases represents awareness of limitations rather than exact knowledge. The reportrepresents a first edition on the subject, a subsequent edition is planned for a later datewith more philosophy, more information and hopefully more refined procedures than ispossible at this date. We have a serious concern-the pace towards widespread use of•igh strength metals with limited and/or misleading knowledge is much too rapid forcomfort. Because of this it is to be expected that there will be lively activity in "failureanalyses" and most likely, the usual assessment of cause as being due to accidental orunforeseen errors ! However, it is hoped that some of this unproductive activity will beeliminated by the expositions of this text.

REFERENCES
1. Pellini, W.S., and Puzak, P.P., 6Fracture Analysis Diagram Procedures for theFracture-Sale Erg'lreering Design of Steel Structures," NRL Report 5920, March 15,1963, and Weldingr Research Council Bulletin Series No. 88, May 1963
2. Pellini, W.S., and Puzak, P.P., 'Practical Considerations in Applying LaboratoryFracture Test Criteria to the Fracture-Safe Design of Pressure Vessels,* NRLReport 6030, November 5, 1963; also, Trans. of the ASME, Series A, Journal ofEngineering for Power, October 1964, pp. 429-443
3. NavShips 250-634-3, 'Method for Conducting Drop-Weight Test to Determine Nil-Ductility Transition Temperature of Ferritic Steels,* August 21, 1962; also ASTME208-63T, 'Tentative Method for Conducting Drop-Weight Test to Determine Nil-Ductility Transition Temperature of Ferritic Steels,* 1963
4. Pellini, W.S., and Puzak, P.P., 'Factors that Determine the Applicability of HighStrength Quenched and Tempered Steels to Submarine Hull Construction," NRLReport 5892, December 5, 1962
5. Pellini, W.S., Steele, L.E., and Hawthorne, J.R., "Analysis of Engineering and BasicResearch Aspects of Neutron Embrittlement of Steels,' NRL Report 5780, April 17,1962; also, The Welding Journal 41 (No. 10) 455s, October 1962
6. Puzak, P.P., 'Advances in Fracture-Safe Design for Structural Steels - 1943-1963,1Oral presentation at Special Conference of AISI Subcommittee on Line Pipe Research,Pittsburgh, Pa., April 29, 1963; no manuscript available
7. Elber, R.J., and McClure, G.M., 'Laboratory Fracture Tests - Their Relation toFull-Scale Properties," Oil and Gas Journal, September 23, 1963
8. Brubaker, E.H., and Dennison, J.D., "Use of the Battelle Drop-Weight Tear Testfor Determining the Notch Toughrness of Line Pipe Steel,' Presented at the SeventhMechanical Working Conference of the Metallurgical Society of AIME, Pittsburgh,Pa., January 19, 1965
9. Lange, E.A., and Klier, E.P., 'A Study of Fracture Development and MaterialsProperties in PVRC Vessels 1 and 2,1 The Welding Journal 41 (No. 2) 53s to 61s,February 1962
10. Kooistra, L.F., Lange, E.A., and Pickett, A.G., 'Full-Size, Pressure-Vessel Testingand Its Application to Design,' Trans. of ASME, Journal of Engineering for Power,VoL 86, Series A, No. 4, October 1964
11. Lange, E.A., Pickett, A.G., and Wiley, R.D., 'Failure Analysis of PVRC VesselNo. 5. Part I - Study of Materials, Properties and Fracture Development," WeldingResearch Council Bulletin No. 98 August 1964
83

84 NAVAL RESEARCH LABORATORY
12. Pellini, W.S., Goode, R.J., Huber, R.W., Howe, D.G., Judy, R.W., Puzak, P.P.,Lloyd, K.B., Lange, E.A., DeFelice, E.A., Crooker, T.W., Morey, R.E., Chapin, E.J.,and McGeady, L.J., OMetallurgical Characteristics of High Strength Structural Mate-rials (Sixth Quarterly Report)," NRL Report 6258, December 1964
13. Willner, A.R., and Sullivan, V.E., 'Metallurgical Investigation of Titanium Alloysfor Application to Deep-Diving Submarines," DTMB Progress Report 1482, Decem-ber 1960
14. Beachem, C.D., gElectron Fractographic Studies of Mechanical Fracture Processesin Metals," TRANS of the ASME, Journal of Basic Engineering, 1964
15. Bcachem, C.D., and Meyn, D.A., 'Illustrated Glossary of Fractographic Terms,"NRL Memorandum Report 1547, June 1964
16. Beachem, C.D., Brown, B.F., and Edwards, A.J., 'Characterizing Fractures byElectron Fractography, Part XII. Illustrated Glossary, Section 1, Quasi Cleavage,"NRL Memorandum Report 1432, June 1963
17. Judy, R.W., Jr., Crooker, T.W., Morey, R.W., Lange, E.A., Beachem, C.D., andGoode, R.J., 'Fractography Analysis of Ti-7Al-2Cb-lTa and Ti-6A1-4V FracturesDeveloped in 'Wet Fatigue'," (pending publication as an NRL report)
18. Brown, B.F., et al, 'Marine Corrosion Studies, Third Interim Report of Progress,"(pending publication as an NRL report)
19. Brown, B.F., 6A New Stress-Corrosion-Cracking Test Procedure for High-StrengthAlloys," to be presented at 68th Annual Meeting of ASTM, June 13-18, 1965, Lafayette,Indiana (pending ASTM publication)
20. Brown, B.F., and Beachem, C.D., 'A Study of the Stress Factor in Corrosion Crack-ing by Use of the Pre-Cracked Cantilever Beam Specimen," to be presented byG.R. Irwin at Joint 'SEMAINE de la CORROSION" (held by International Committeeon Thermodynamics and Electrochemistry and The European Federation on Corrosion),June 7-11, 1965, Brussels, Belgium