Sr and Nd isotope ratios and REE abundances of … Journal, Vol. 34, pp. 407 to 427, 2000 407 Sr and...
21
Geochemical Journal, Vol. 34, pp. 407 to 427, 2000 407 Sr and Nd isotope ratios and REE abundances of moraines in the mountain areas surrounding the Taklimakan Desert, NW China QING CHANG, 1,3 TAKASHI MISHIMA, 1,3 SADAYO YABUKI, 2 YOSHIO TAKAHASHI 3 and HIROSHI SHIMIZU 3 * 1 Department of Environmental Science, Graduate School of Science and Technology, Kumamoto University, Kumamoto 860-8555, Japan 2 The Institute of Physical and Chemical Research (RIKEN), Saitama 351-0198, Japan 3 Department of Earth and Planetary Sciences, Graduate School of Science, Hiroshima University, Higashi-Hiroshima 739-8526, Japan ( Received March 29, 2000; Accepted August 28, 2000) The first systematic data of Sr and Nd isotopic ratios, REE abundances, major element and mineral compositions are reported for the Chinese moraines from the western Kunlun Mts. and southern and north- ern flanks of the Tianshan Mts. and soils from the Tibet Plateau. This study was conducted in order to characterize the isotopic and geochemical features of these moraines and soils, which are considered as possible sources of the Taklimakan Desert sands. The moraines and the desert sands consist of quartz and feldspar as dominant minerals, but the former have higher clay and mica and lower carbonate mineral abundances than the latter. In spite of the wide variation, average values of most major elements of the moraines are generally similar to those of the Taklimakan Desert sands, except for CaO depletion and K 2 O enrichment in the moraines. Sr and Nd isotopic ratios are also highly variable for moraines, particularly from the Tianshan northern flank, while those for the desert sands show restricted values. In the Sr-Nd isotopic diagram, the Taklimakan Desert sands are plotted in the narrow field overlapped by both the moraine matrices from the western Kunlun Mts. and from the Tianshan southern flank. In addition, it is noted that average value of Nd isotopic ratios for the moraines is clearly higher than those for the desert sands. Two Tibetan soils of this study show wide variation in mineral composition and major element compositions (SiO 2 = 75% and CaO =1.5% for one sample and SiO 2 = 44% and CaO =31.8% for the other). However, Sr isotopic ratios of both soils are similar to those of the desert sands and their Nd isotopic data are slightly smaller than the desert sands. These results suggest moraine matrices from both the western Kunlun Mts. and the Tianshan southern flank and the Tibetan soils as possible sources for the Taklimakan Desert sands. mineralogical and sedimentological features of the Taklimakan Desert sands confirmed the impor- tance of glacial activity besides aeolian activity in the homogenization of the Taklimakan Desert sands (Honda and Shimizu, 1998). However, di- rect investigation on the moraine deposits sur- rounding the Taklimakan Desert has been very scarce. The Taklimakan Desert, located in the central of Tarim Basin in northwest China, is the largest sand desert in China, with a total area about I NTRODUCTION Glacial moraines in the surrounding mountain areas of the Taklimakan Desert are expected to bear important information on source material composition and formation mechanism of the desert sand. Glacial grinding has been proposed to be a main mechanism responsible for the for- mation of fine particles in huge amounts and large distribution scale (Smalley, 1966; Smalley and Vita-Finzi, 1968). Recent study on geochemical, *Corresponding author (e-mail: [email protected])
Transcript of Sr and Nd isotope ratios and REE abundances of … Journal, Vol. 34, pp. 407 to 427, 2000 407 Sr and...

Geochemical Journal, Vol. 34, pp. 407 to 427, 2000
407
Sr and Nd isotope ratios and REE abundances of moraines in themountain areas surrounding the Taklimakan Desert, NW China
QING CHANG,1,3 TAKASHI MISHIMA,1,3 SADAYO YABUKI,2 YOSHIO TAKAHASHI3 and HIROSHI SHIMIZU3*
1Department of Environmental Science, Graduate School of Science and Technology, Kumamoto University,Kumamoto 860-8555, Japan
2The Institute of Physical and Chemical Research (RIKEN), Saitama 351-0198, Japan3Department of Earth and Planetary Sciences, Graduate School of Science, Hiroshima University,
Higashi-Hiroshima 739-8526, Japan
(Received March 29, 2000; Accepted August 28, 2000)
The first systematic data of Sr and Nd isotopic ratios, REE abundances, major element and mineralcompositions are reported for the Chinese moraines from the western Kunlun Mts. and southern and north-ern flanks of the Tianshan Mts. and soils from the Tibet Plateau. This study was conducted in order tocharacterize the isotopic and geochemical features of these moraines and soils, which are considered aspossible sources of the Taklimakan Desert sands. The moraines and the desert sands consist of quartz andfeldspar as dominant minerals, but the former have higher clay and mica and lower carbonate mineralabundances than the latter. In spite of the wide variation, average values of most major elements of themoraines are generally similar to those of the Taklimakan Desert sands, except for CaO depletion and K2Oenrichment in the moraines. Sr and Nd isotopic ratios are also highly variable for moraines, particularlyfrom the Tianshan northern flank, while those for the desert sands show restricted values. In the Sr-Ndisotopic diagram, the Taklimakan Desert sands are plotted in the narrow field overlapped by both themoraine matrices from the western Kunlun Mts. and from the Tianshan southern flank. In addition, it isnoted that average value of Nd isotopic ratios for the moraines is clearly higher than those for the desertsands. Two Tibetan soils of this study show wide variation in mineral composition and major elementcompositions (SiO2 = 75% and CaO =1.5% for one sample and SiO2 = 44% and CaO =31.8% for theother). However, Sr isotopic ratios of both soils are similar to those of the desert sands and their Ndisotopic data are slightly smaller than the desert sands. These results suggest moraine matrices from boththe western Kunlun Mts. and the Tianshan southern flank and the Tibetan soils as possible sources for theTaklimakan Desert sands.
mineralogical and sedimentological features of theTaklimakan Desert sands confirmed the impor-tance of glacial activity besides aeolian activityin the homogenization of the Taklimakan Desertsands (Honda and Shimizu, 1998). However, di-rect investigation on the moraine deposits sur-rounding the Taklimakan Desert has been veryscarce.
The Taklimakan Desert, located in the centralof Tarim Basin in northwest China, is the largestsand desert in China, with a total area about
INTRODUCTION
Glacial moraines in the surrounding mountainareas of the Taklimakan Desert are expected tobear important information on source materialcomposition and formation mechanism of thedesert sand. Glacial grinding has been proposedto be a main mechanism responsible for the for-mation of fine particles in huge amounts and largedistribution scale (Smalley, 1966; Smalley andVita-Finzi, 1968). Recent study on geochemical,
*Corresponding author (e-mail: [email protected])

408 Q. Chang et al.
337,000 km2. Unlike other sand deserts in theworld, it is enclosed by high mountains, i.e., theTianshan Mts. in the north and the Kunlun andAltun Mts. in the south and southeast (Fig. 1). Inthese mountains, the glaciation was inferred to beextensive and much larger in the late Pliocene andPleistocene than present (Zheng et al., 1990;Xinjiang Institute of Geography, 1986). Largerglaciers including big ice cap occupying the mainKunlun Mts. formed during Middle Pleistocene(Zheng et al., 1990; Derbyshire, 1996). The ex-istence of Late Pleistocene glacial deposits of ap-proximately 60 m in thickness, on the southernflank of the Tianshan Mts., was reported by theXinjiang Institute of Geography (1986). It is alsoreported that multiple glaciations had occurredduring the Pleistocene in Kunlun Mts. with gla-cier extent changing from restricted valleys asmountain glaciation to large areas as ice sheet gla-ciation (Derbyshire, 1996). The widespread gla-ciation in these mountain areas as well as the closelocation and large altitude gap between the desert
and the mountain areas further enhances the prob-ability that a huge quantity of sand grains was prin-cipally derived from detrital sediments producedby glacial grinding in the surrounding mountainareas.
Sr and Nd isotopic compositions of sedimentsmay provide useful information about their sourcematerials. Liu et al. (1994) measured the Rb-Sr,Sm-Nd and La-Ce isotopic compositions for theloess, loess-like, desert sand and river depositscollected from the southwest Taklimakan Desert.They showed that the desert sands of theTaklimakan Desert and loess of the Loess Plateauare indistinguishable in Nd isotopic and chemicalcompositions, and suggested a desert origin forthe Chinese loess and the Taklimakan Desert asthe source area. Isotopic study on moraine ma-trix, representing average components of glacialgrinding products, is expected to shed insight intothe source and formation and homogenous mecha-nism of desert sands and loesses. Limited investi-gations on the moraine deposits of these areas had
Fig. 1. Location of the Taklimakan Desert, Tianshan Mountains and Kunlun Mountains, with sampling sites.
Sr and Nd isotope and REE abundances of moraines, NW China 409
been done thus far. Ishii et al. (1995) studied thedistribution, petrologic features and oxygen iso-tope composition of moraine deposits surround-ing the Taklimakan Desert. Matsuhisa et al. (1996)compared the δ18O values of quartz in loess, mo-raine and basement rock of Tarim Basin, and pro-posed a descriptive model concerning derivationof sand grains, i.e., fine particles could be formedinitially by glacial erosion then deposited as mo-raine matrix and finally transported to the desert.
Until the present, systematic geochemical andSr-Nd isotopic study has not been carried out forthe Chinese moraines. Knowledge on source ma-terials of the Taklimakan Desert sands is still verypoor. In this paper, we presented new results of Srand Nd isotopic compositions, REE abundances,major element and mineral compositions formoraines in surrounding mountain areas of theTaklimakan Desert as well as for the TaklimakanDesert sands. Surface soil samples from the north-west Tibet Plateau were also analyzed. Accumu-lation of these geochemical and isotopic data willgive information on the relative contribution ofthe moraines against other possible sources to theTaklimakan Desert sands, even though some un-certainties of the extent of the Pleistocene glacia-tion in the Kunlun and Tianshan Mts. are present.
SAMPLES AND ANALYTICAL METHODS
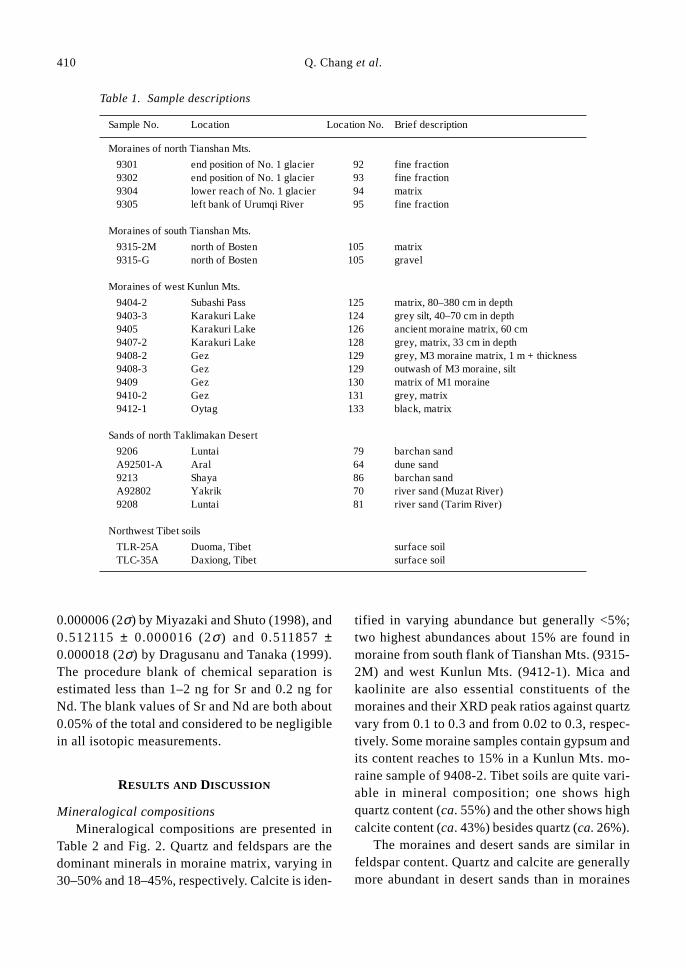
The moraine matrix in the surrounding moun-tain areas of Taklimakan Desert is mainly the mix-ture of basement rock detritus derived from gla-cial grinding and sedimentation. It represents anaverage composition of sedimentary rocks (chieflysandstone, shale and limestone) from Precambrianto Quaternary ages and granitic rocks from theProterozoic to Cretaceous (Bureau of Geology andMineral Resources of Xinjiang Uygur Autono-mous Region, 1993). The moraine samples of thisstudy were collected from Gez and Karakuri Lakeareas in west Kunlun Mountains, and Bosten andNo. 1 Glacier areas in the south and north flanksof Tianshan Mountains (Fig. 1 and Table 1). Sur-face soil samples from northwest Tibet Plateauwere collected at Duoma and Daxiong. In addi-
tion, three desert sand and two river sand samplesfrom the northern part of the Taklimakan Desertwere examined to complement the limited exist-ing reference data for the Taklimakan Desert sand(Liu et al., 1994; Tanaka et al., 1990). The possi-ble size effects on isotopic ratio and REE concen-tration are examined in this study for size frac-tions relatively coarser (from >500 µm to 32–20µm) than those in previous studies (e.g., Basile etal., 1997 and Asahara et al., 1999 for Sr isotope;Goldstein et al., 1984 and Grousset et al., 1992for Nd isotope).
Major element abundance was determined us-ing X-ray fluorescence spectrometer (XRF,Shimadzu VF-320A) by the method given byHonda and Shimizu (1998). Repeated analyses ofstandard rocks showed the precision to be betterthan 1% for SiO2 and 3–5% for other major ele-ments. Mineralogical composition of powderedsample was determined by X-ray diffraction(XRD, Mac Science M18XHF-SRA 1180) andchecked by microscopic examination for coarsergrains. Mineral abundance was estimated from thebest fitting of major elements composition withthe XRD identification.
Concentrations of REE, Rb and Sr were deter-mined by inductively coupled plasma massspectrometer (ICP-MS, VG PQ3), and Sr and Ndisotopic ratios were measured by thermal ioniza-tion mass spectrometer (TIMS, VG Sector-54)with three Faraday collectors at the Institute ofPhysical and Chemical Research. The analyticalmethods were given in Shimizu et al. (2000). Ana-lytical uncertainties are 3% for Rb and Sr con-centrations and 5% for most REE. Blanks on REEdetermination were less than 0.1% of measuredvalues of all REE. The measured isotopic ratioswere normalized to 86Sr/88Sr = 0.1194 and 146Nd/144Nd = 0.7219. The average for the NBS987strontium standard was 0.71024 ± 0.00002 (2σ,n = 18), and for JNdi-1 neodymium standard ofGeology Survey of Japan (Tanaka et al., 1996) was0.51210 ± 0.00001 (2σ, n = 15) during the meas-urement. The 143Nd/144Nd ratios for the JNdi-1standard and La Jolla standard have been reportedto be 0.512106 ± 0.000003 (2σ) and 0.511851 ±
410 Q. Chang et al.
Table 1. Sample descriptions
Sample No. Location Location No. Brief description
Moraines of north Tianshan Mts.
9301 end position of No. 1 glacier 92 fine fraction9302 end position of No. 1 glacier 93 fine fraction9304 lower reach of No. 1 glacier 94 matrix9305 left bank of Urumqi River 95 fine fraction
Moraines of south Tianshan Mts.
9315-2M north of Bosten 105 matrix9315-G north of Bosten 105 gravel
Moraines of west Kunlun Mts.
9404-2 Subashi Pass 125 matrix, 80–380 cm in depth9403-3 Karakuri Lake 124 grey silt, 40–70 cm in depth9405 Karakuri Lake 126 ancient moraine matrix, 60 cm9407-2 Karakuri Lake 128 grey, matrix, 33 cm in depth9408-2 Gez 129 grey, M3 moraine matrix, 1 m + thickness9408-3 Gez 129 outwash of M3 moraine, silt9409 Gez 130 matrix of M1 moraine9410-2 Gez 131 grey, matrix9412-1 Oytag 133 black, matrix
Sands of north Taklimakan Desert
9206 Luntai 79 barchan sandA92501-A Aral 64 dune sand9213 Shaya 86 barchan sandA92802 Yakrik 70 river sand (Muzat River)9208 Luntai 81 river sand (Tarim River)
Northwest Tibet soils
TLR-25A Duoma, Tibet surface soilTLC-35A Daxiong, Tibet surface soil
0.000006 (2σ) by Miyazaki and Shuto (1998), and0.512115 ± 0.000016 (2σ) and 0.511857 ±0.000018 (2σ) by Dragusanu and Tanaka (1999).The procedure blank of chemical separation isestimated less than 1–2 ng for Sr and 0.2 ng forNd. The blank values of Sr and Nd are both about0.05% of the total and considered to be negligiblein all isotopic measurements.
RESULTS AND DISCUSSION
Mineralogical compositionsMineralogical compositions are presented in
Table 2 and Fig. 2. Quartz and feldspars are thedominant minerals in moraine matrix, varying in30–50% and 18–45%, respectively. Calcite is iden-
tified in varying abundance but generally <5%;two highest abundances about 15% are found inmoraine from south flank of Tianshan Mts. (9315-2M) and west Kunlun Mts. (9412-1). Mica andkaolinite are also essential constituents of themoraines and their XRD peak ratios against quartzvary from 0.1 to 0.3 and from 0.02 to 0.3, respec-tively. Some moraine samples contain gypsum andits content reaches to 15% in a Kunlun Mts. mo-raine sample of 9408-2. Tibet soils are quite vari-able in mineral composition; one shows highquartz content (ca. 55%) and the other shows highcalcite content (ca. 43%) besides quartz (ca. 26%).
The moraines and desert sands are similar infeldspar content. Quartz and calcite are generallymore abundant in desert sands than in moraines

Sr and Nd isotope and REE abundances of moraines, NW China 411
(Fig. 3), whereas mica and kaolinite are less abun-dant in desert sands (Table 2). Higher calcite con-tents in the desert sands than in moraines suggestan addition of secondary calcite to the desertsands. It is also found that dolomite occurs morecommonly in the desert sand than in moraine. Hotand dry desert environments may favor the for-mation of dolomite from the evaporation of Mgrich saline solution (Deer et al., 1992). Low con-tent of mica and kaolinite in the desert sands rela-tive to moraines is likely to be the result of parti-cle sorting.
Mg-Fe chlorite, amphibolite, epidote andopaque minerals such as hematite are also ob-
served in the moraine samples by microscopy ob-servation and EPMA determination. They arerarely observed in the desert sands.
In the Taklimakan Desert sands of this study,quartz, feldspars and calcite are the main constitu-ent commonly associated with mica and kaolinite.Quartz, feldspars and calcite contents are 40–50%,15–25% and 5–30%, respectively. These mineralcompositions for the sands from north side of theTaklimakan Desert are similar to those from southand central parts of the Taklimakan Desert (Hondaand Shimizu, 1998), showing homogeneity in min-eral compositions in the Taklimakan Desert.
Table 2. Mineral composition (%) and XRD peak ratios against quartz for the Kunlun and Tianshan Mts. moraines,the Taklimakan Desert sands and Tibet soils
(a)Numbers in brackets are point-counting results.(b)Others include dolomite (mainly in the desert sands), kaolinite, mica, chlorite, hematite, epidote and amphibole minerals.(c)Q = quartz, Pl = plagioclase, Kf = K-feldspar, Cal = calcite, Gy = gypsum, Dol = dolomite, Mi = mica, Ka = kaolinite.

412 Q. Chang et al.
Major element compositionsMajor element data are given in Table 3 and
average upper continental crust (UCC; Taylor andMcLennan, 1985) normalized values are shownin Fig. 4. The sands from northern part of theTaklimakan Desert have very similar major ele-ment compositions to those from the south and
central parts of the desert; all showing higher CaOcontent and lower Na2O and K2O content againstUCC.
Compared with the Taklimakan Desert sands(this study; Honda and Shimizu, 1998), the mo-raine samples are more heterogeneous (Fig. 4).The UCC-normalized values for the moraine
Fig. 2. Mineral compositions of the moraines, the desert sands and northwest Tibet soils.
Fig. 3. (a) Quartz versus feldspar, and (b) quartz versus calcite abundance diagrams for the moraines and thedesert sands. Data of southwest Taklimakan Desert sands are from Honda and Shimizu (1998).

Sr and Nd isotope and REE abundances of moraines, NW China 413
Tabl
e 3.
M
ajor
ele
men
t co
mpo
siti
ons
(%)
of t
he m
orai
nes,
Tak
lim
akan
Des
ert
sand
s an
d Ti
bet
soil
s
(a) F
e 2O
3 a
s to
tal
iron
.(b
) LO
I =
los
s on
ign
itio
n at
980
°C f
or 2
hou
rs.
Tota
l is
cal
c ula
ted
on a
LO
I-fr
e e b
asis
.(c
) CIA
: c h
e mic
al i
nde x
of
alte
rati
on,
[CIA
= A
l 2O
3/(A
l 2O
3 +
CaO
* +
Na 2
O +
K2O
), N
e sbi
tt a
nd Y
oung
, 19
82].

414 Q. Chang et al.
samples are 0.9–1.1 for SiO2, 0.2–3.5 for CaO,0.7–1.1 for Al2O3, 0.4–2.3 for TiO2, MgO and to-tal iron as Fe2O3, 0.3–1.0 for Na2O and 0.5–1.6for K2O. In accordance with the mineral compo-sition difference between the moraines and desertsands, average CaO content are higher in the desertsands, and K2O, Al2O3 and Fe2O3 are higher inthe moraines (Fig. 5(a)). In spite of these differ-ences and great heterogeneity, the average valuesof most major elements for 15 moraine samplesshow a general resemblance with the desert sands(Fig. 5(a)). This suggests that fine-grained sub-glacial deposits could be the source for theTaklimakan Desert sands. Regional variation ofthe major element compositions seems unclearbetween the Tianshan and Kunlun Mts. (Fig. 5(b)).
The correlation between Fe2O3 and MgO wasclearly different for the moraines and desert sands(Fig. 6). Moraines show significant positive cor-relation between the two elements; the desert sands
show relatively higher MgO in respect to Fe2O3
and poor correlation between them, indicating thatFe and Mg are hosted in different minerals in thesetwo sediments. Mineral composition data havesuggested abundant chlorite and amphibole min-erals in moraines and higher dolomite content inthe sands. Relatively low Fe2O3 of desert sandsthan the moraines and loess (Figs. 6 and 4) mayimply the preferential distribution of chlorite dur-ing wind sorting of fine grains. However, furtherstudy on detailed mineral composition data ofChinese loess is needed to support such explana-tion.
Moraines differ from the desert sands in ratiosof SiO2/Al2O3 and K2O/Na2O as shown in Fig. 7.K2O/Na2O ratios are generally greater than 1.0 inthe moraines, but less than 1.0 for the desert sands.This difference may be due to higher mica con-tents in the moraines than in the desert sands. SiO2/Al2O3 ratios of moraines vary from 3.8 to 5.6,
Fig. 4. UCC-normalized major element composition for the moraines, desert sands and loesses. The data ofsouthwestern and central Taklimakan Desert sands are from Honda and Shimizu (1998) and the Luochuan loessare from Gallet et al. (1996). Average UCC values are from Taylor and McLennan (1985).

Sr and Nd isotope and REE abundances of moraines, NW China 415
being slightly higher than that of UCC but clearlylower than those of the Taklimakan Desert sands.Higher kaolinite content in the moraines than inthe desert sands is consistent with lower SiO2/Al2O3 ratios in the former than in the latter. XRDpeak ratios of kaolinite/quartz in the morainespositively correlate with CIA (chemical index ofalteration; Nesbitt and Young, 1982) values, as
shown in Fig. 8. CIA was calculated as CIA =[Al2O3/(Al2O + CaO* + Na2O + K2O)] × 100, inmolecular proportion, where CaO* is the amountof CaO in silicate. CaO* was calculated afterHonda and Shimizu (1998), assuming the Ca:Naratio in plagioclase to be 1:3. CIA values ofmoraines vary from 47 to 71 (Table 3), which areconsistent with typical values of Pleistocene till
Fig. 5. Comparisons of average major element compositions (a) between the moraines and the Taklimakan Desertsands (this study and Honda and Shimizu, 1998), and (b) between moraines from the Kunlun and Tianshan Mts.Error bars correspond to 1σ level.
Fig. 6. MgO vs. total iron diagram for the moraines and the Taklimakan Desert sands, showing that MgO andFe2O3 are associated in different minerals in the moraine and the desert sand.

416 Q. Chang et al.
Fig. 7. Plot of SiO2/Al2O3 ratio against K2O/Na2O ratio for the Kunlun and Tianshan Mts. moraines and theTaklimakan Desert sands (this study and Honda and Shimizu, 1998).
Fig. 8. Kaolinite/quartz XRD peak intensity ratiosagainst CIA value for the Kunlun and Tianshan Mts.moraines.
CIA value originally indicates the degree ofalteration of feldspars to clay minerals. However,moraines generally suffer from little chemicalweathering, and kaolinite in the moraines isthought to be derived from sedimentary rocks be-fore glacial moraine deposition. Therefore, largevariations of CIA value and kaolinite content inthe moraines reflect poor homogenization of gla-cial grinding process.
Rare earth element (REE) abundancesREE abundance data are given in Table 4 and
chondrite-normalized patterns are shown in Fig.9. All samples including the moraines, desert sandsand soils show light REE enriched patterns withnegative Eu anomalies, which are similar to thatof UCC (Taylor and McLennan, 1985). Morainesamples show wide variations in (La/Yb)N andEu/Eu* ratios with lower values in contrast to re-stricted and higher values for the TaklimakanDesert sand and Tarim loess (Liu et al., 1993) (Fig.10(a)). Moreover, moraines from the north flankof the Tianshan Mts. tend to have smaller (La/Yb)N
ratios than those from the western Kunlun Mts.and southern flank of the Tianshan Mts. The
matrix and glacial clays (Nesbitt and Young,1982). This range partly overlaps that of theTaklimakan Desert sands (e.g., 52–56 in this studyand the values reported by Honda and Shimizu,1998) and on average, is slightly lower than thatof loess of the Loess Plateau (Gallet et al., 1996).

Sr and Nd isotope and REE abundances of moraines, NW China 417
Tabl
e 4.
R
EE
abu
ndan
ces
(ppm
) of
the
Kun
lun
and
T ian
shan
Mts
. m
orai
nes,
Tak
lim
akan
Des
ert
sand
s an
d Ti
bet
soil
s

418 Q. Chang et al.
Fig. 9. Chondrite-normalized REE patterns of the Kunlun and Tianshan Mts. moraines, the Taklimakan Desertsands and Tibet soils. REE abundances in the Leedey chondrite (Masuda et al., 1973; Masuda, 1975) are used fornormalization. For comparison the average REE composition of UCC (Taylor and McLennan, 1985) is shown asdashed line.
loesses of the Loess Plateau (Gallet et al., 1996,1998) show slightly lower (La/Yb)N ratio but simi-lar Eu/Eu* value to the Taklimakan Desert sandsand Tarim loess. The Tibet soils are similar to theTaklimakan Desert sands and the Tarim loess inthe (La/Yb)N and Eu/Eu* ratios. The (La/Yb)N
ratio difference among the moraines, desert sandsand loesses might be due to the grain-size differ-ence and associated mineral sorting among thesesamples, as discussed below.
REE abundance variation with grain size frac-tions for the Kunlun moraine 9412-1 is given inTable 5 and the variation of (La/Yb)N ratio andNd abundance with grain size is traced in Fig.10(b). From the fraction >500 µm to the 20–32µm fraction, (La/Yb)N ratios and Nd abundancesincrease by a factor of 1.9 and 2.4, respectively.(La/Yb)N ratios and Nd abundances are 8.5 and17 ppm for the former fraction and 16 and 41 ppmfor the latter fraction, while the 9412-1 whole rock

Sr and Nd isotope and REE abundances of moraines, NW China 419
Fig. 10. Plots of (La/Yb)N-Eu/Eu* and (La/Yb)N-Nd abundances for the Kunlun and Tianshan Mts. moraines andthe Taklimakan Desert sands. Data of Loess Plateau are from Gallet et al. (1996); Tarim Basin loess and south-western Taklimakan Desert sand from Liu et al. (1993).
Fig. 11. εNd(0)-87Sr/86Sr plot for the Kunlun and Tianshan Mts. moraines, the Taklimakan Desert sands and Tibetsoils. The data of desert sands from the southwestern Taklimakan Desert (Liu et al., 1994) and those of Luochuanloesses (Gallet et al., 1996) are also plotted.

420 Q. Chang et al.
Tabl
e 5.
RE
E a
bund
ance
s (p
pm)
of d
iffe
rent
gra
in s
ize
frac
tion
s of
the
wes
t K
unlu
n M
ts. m
orai
ne s
ampl
e 94
12-1
sample has (La/Yb)N ratio of 9.7 and Nd abun-dance of 20 ppm. Grain sizes of the TaklimakanDesert sands and the Loess Plateau loesses arechiefly 60–250 µm and 10–40 µm (e.g., Hondaand Shimizu, 1998). Our result suggests somemodifications in REE features by grain size sort-ing, which might take place during formation ofthe desert sand and loess from moraine. The modi-fication in mineral composition during grain sizesorting might responsible for the REE featuresdifferences among these deposits. It is noted thatthe variations of (La/Yb)N ratios and Nd abun-dances with grain size are comparable to thoseobserved for the moraines and desert sands. There-fore, if the modification in REE feature with grainsize sorting is considered, estimation of source forthe desert sand and loess by direct comparison of(La/Yb)N ratio and REE abundance is difficult.
Nd and Sr isotopic compositionsNd and Sr isotopic data are given in Table 6.
For convenience in comparison, 143Nd/144Nd ra-tios are reported as εNd notation (DePaolo andWasserburg, 1976). The present-day εNd(0) val-ues are calculated by using the CHUR 143Nd/144Nd= 0.512638 (Jacobsen and Wasserburg, 1980).
Moraine deposits are highly variable in bothSr and Nd isotopic compositions, compared withthe desert sands (Fig. 11). In particular, morainesfrom the northern flank of Tianshan Mts. showextremely wide variations in 87Sr/86Sr ratio from0.717 to 0.801 and εNd(0) value from –1.9 to–11.0. Moraines from the western Kunlun Mts. arerelatively less variation in 87Sr/86Sr ratios andεNd(0) values, with 87Sr/86Sr ratios varying from0.710 to 0.727 and εNd(0) values from –6.6 to–11.0, plotted in the lower 87Sr/86Sr ratio field thanthe moraines from the Tianshan north flank. Twomoraine samples from south slope of the TianshanMts., matrix and gravel samples (9315-2M and9315-G), show different 87Sr/86Sr ratios of 0.714and 0.728 with similar εNd(0) values of –9.2 and–10.6. In the εNd(0)-87Sr/86Sr diagram, the morainematrix sample (9315-2M) from south flank of theTianshan Mts. is plotted in the field of morainesfrom the western Kunlun Mts., while the moraine

Sr and Nd isotope and REE abundances of moraines, NW China 421
Table 6. Sr and Nd isotopic compositions of the Kunlun and Tianshan Mts. moraines, Taklimakan Desert sandsand Tibet soils
Errors of isotopic ratios are 2σm and correspond to the last significant figures.
gravel sample (9315-G) from the Tianshan southslope is in the moraines from Tianshan north flank.Two Tibet soils have 87Sr/86Sr ratios of 0.716 and0.714 and εNd(0) values of –10.9 and –12.1, plot-ted in the lower εNd(0) field than the westernKunlun moraines and the Taklimakan Desert sands(Fig. 11).
The Taklimakan Desert sands are restrictive inSr and Nd isotopic compositions, with 87Sr/86Srratios between 0.713 and 0.716 and εNd(0) valuesaround –10.4. These isotopic data are essentiallythe same with those reported for the sand fromsouthwestern Taklimakan Desert (Liu et al., 1994),suggesting isotopic homogeneous feature for allTaklimakan Desert sands.
Sr isotopic ratios in the moraine and desertsand samples seem to depend on CaO content andSr abundance as shown in 87Sr/86Sr-1/Ca and87Sr/86Sr-1/Sr diagrams (Figs. 12(a) and (b)). Thedata suggest a component having high Ca and Srcontents with low 87Sr/86Sr ratio around 0.710. Inaddition, it is noted that Sr abundance in the desertsand samples have small range between 240 and275 ppm irrespective of the large variation of CaOcontent (6–30%, Fig. 12(c)). This observationimplies low Sr contents in the secondary carbon-ates added to the desert sands.
Sr and Nd isotopic ratios of different grain sizefractions of the moraine 9412-1 are given in Ta-ble 7 and in Fig. 13, where 87Sr/86Sr ratios decrease

422 Q. Chang et al.
Fig. 12. (a) 87Sr/86Sr vs. 1/Ca, (b) 87Sr/86Sr vs. 1/Sr, and (c) CaO vs. Sr diagrams for the Kunlun and TianshanMts. moraines and the Taklimakan Desert sand of this study.
from 0.7111 in 125–180 µm fraction to 0.7106 in20–32 µm fraction with constant εNd(0) valuesbetween –10.5 and –11.0. As shown in the εNd(0)-87Sr/86Sr diagram (Fig. 11), however, the Sr andNd isotopic ratio variation with grain sizes issmall, compared with the wide variations of theseratios among moraine samples. Therefore, the
variation of isotopic ratio with grain size is negli-gible in discussing the source materials for theTaklimakan Desert sands.
In the εNd(0)-87Sr/86Sr diagram (Fig. 11), theTaklimakan Desert sands are included in the fieldoverlapped by both the moraines from westernKunlun Mts. and the Tianshan southern flank, but

Sr and Nd isotope and REE abundances of moraines, NW China 423
Fig. 13. Variation of 87Sr/86Sr ratios and εNd(0) valueswith change of grain sizes (in µm) of the Kunlun mo-raine sample 9412-1. Error bars are measurement er-rors in 2σ.
separated from that of the Tianshan northern flankmoraines. In addition, it is noted that the average87Sr/86Sr ratios for the moraines from westernKunlun Mts. and from the Tianshan south flankare similar to that of the Taklimakan Desert sands,but the corresponding εNd(0) values for themoraines are about 2ε unit higher than for thesands (Fig. 14). The εNd(0) value discrepancy be-tween the moraines and the desert sands suggestsa contribution from other sources for theTaklimakan Desert sands. One possibility is thecontribution from the Tibet soils, which havesmaller εNd(0) value but similar 87Sr/86Sr ratio tothe Taklimakan Desert sands. The mixture betweenthe Tibet soils and the moraines from the westernKunlun Mts. and the Tianshan south flank willyield the 87Sr/86Sr ratio similar to those of the end-members and εNd(0) value between them (Fig. 14).Mixing calculation (Langmuir et al., 1978) usingthe average values of Sr and Nd isotopic and abun-dance data of the Kunlun moraines and Tibet soilsshows that the Sr and Nd isotopic ratios for theca. 2:3 mixture of the moraines and the Tibet soilsgenerally agree with those for the desert sands.However, the Sr abundances calculated from themixing model are lower in 30% than the observedvalues for the desert sands. Particle sorting andthe addition of secondary calcite into the sandscould explain the Sr abundance discrepancy. As
Table 7. Sr and Nd isotopic data of different grain size fractions of the Kunlun Mts. moraine sample 9412-1
Errors are 2σm and correspond to the last significant figures.

424 Q. Chang et al.
Fig. 15. Map showing Nd and Sr isotopic compositions of the moraines and Taklimakan Desert sands. Numbersare location number and those in boxes are the values of εNd(0) and 87Sr/86Sr. Data of desert sand of southwesternTaklimakan are from Liu et al. (1994).
Fig. 14. Histograms of 87Sr/86Sr ratios and εNd(0) values for the moraines, desert sands and Tibet soils.
Sr and Nd isotope and REE abundances of moraines, NW China 425
shown in Table 7, particle sorting has greater ef-fect on Sr and Nd abundances than on the isotopiccompositions. Although a statistical significanceof the average isotopic values of the moraines isunclear because of wide variation of individualdata, and the number of Tibet sample is limited,the mixing calculation suggests one of the possi-ble models. In conclusion, these results imply thatKunlun Mts. and southern flank of Tianshan Mts.probably serve as source region for the desert sand,and that the Tibet Plateau also has made a consid-erable contribution to the Taklimakan Desert. Itseems quite natural from the geographical view-point that the Nd and Sr isotopic data for theTaklimakan Desert sands fall not in the field forthose from the northern flank of the Tianshan Mts.,but in the field for the moraine matrix from thewestern Kunlun Mts. and southern flank of theTianshan Mts. (Figs. 11 and 15).
SUMMARY
This paper reported the first systematic dataof Sr and Nd isotopic compositions, REE andmajor element abundances and mineral composi-
tion for the Chinese moraines from the westernKunlun Mts. and the Tianshan Mts., which arepossible sources for the Taklimakan Desert sandand Chinese loess. The data were also reportedfor the soils from the northwest Tibet and thedesert sands and river sands from the north sideof the Taklimakan Desert. The results are summa-rized in Table 8. The following conclusions canbe drawn from the present results.
1. Quartz and feldspars are the main constitu-ent minerals both in the desert sands and in mo-raine deposits, although the desert sands showslightly higher quartz content than the moraines(40–50% for the desert sands and 30–50% for themoraines). Higher calcite contents in the desertsands (>5%) than in the moraines (<5%) are ob-served, suggesting an addition of secondary cal-cite to the desert sands. Mica and clay mineralcontents are higher in the moraines.
2. Major element compositions of themoraines show wider variations than those of thedesert sands. The average values of most majorelements show general agreement between themoraines and desert sands, although CaO enrich-ment and K2O depletion are observed in the desert
NTM = northern Tianshan Mts., STM = southern Tianshan Mts., WKM = western Kunlun Mts., NTD = northern TaklimakanDesert, CSWTD = central and southwestern Taklimakan Desert. Number in bracket is average value.(a)Data for central and southwest Taklimakan Desert are from Honda and Shimizu (1998), Liu et al. (1993, 1994).
Table 8. Summary of mineralogical and geochemical features for the moraines, Taklimakan Desert sands andnorthwestern Tibet soils

426 Q. Chang et al.
sands, compared with the moraines. Morainesshow lower SiO2/Al2O3 ratio than the desert sands.These minor differences in major element com-positions might be explained by the minor differ-ence in mineral compositions between themoraines and desert sands; higher mica andkaolinite contents and lower calcite contents inthe former than in the latter.
3. Moraines show REE features similar tothose of desert sand and loess, with some differ-ence in inclination of REE patterns. For the mo-raine sample, however, finer grain size fractionstend to have larger inclination in REE patterns andhigher REE abundances than the coarser fractionsby a factor around 2, suggesting minor modifica-tions in REE features by grain size sorting. Thisresult implies that estimation of sources for thedesert sands and loesses is hard by simple com-parison of inclination in REE patterns and REEabundance.
4. Moraine deposits are highly variable inboth Sr and Nd isotopic compositions, comparedwith the Taklimakan Desert sands. 87Sr/86Sr andεNd(0) vary from 0.717 to 0.801 and from –1.9 to11.0 for the Tianshan north flank moraines, from0.714 to 0.728 and from –9.2 to –10.6 for theTianshan south flank moraines and from 0.710 to0.727 and from –6.6 to –11.0 for the Kunlunmoraines. The Taklimakan Desert sands show nar-row ranges of 87Sr/86Sr ratios between 0.713 and0.716 and εNd(0) values around –10.4, plotted nearthe moraine matrix sample from the Tianshansouth flank and in the lower εNd(0) region of thewestern Kunlun moraines in the 87Sr/86Sr-εNd(0)diagram. The Nd isotopic data of the TaklimakanDesert sands are slightly higher than those of theTibet soils. These isotopic data imply that theTaklimakan Desert sands were derived not fromthe Tianshan north flank moraines, but from theTianshan south flank moraines, the Kunlunmoraines and the Tibet soils.
5. Our mineralogical and isotopic data as wellas chemical data for the desert sands from the northside of the Taklimakan Desert are essentially iden-tical to those for the desert sands from the southand central parts of the Taklimakan Desert, show-
ing specifically the homogeneity of theTaklimakan Desert sands.
Acknowledgments—We are grateful to T. Ishii (Geo-logical Survey of Japan) for offering the moraine anddesert sand samples and helpful information on them.S. Yoneda and H. Ozaki (National Science Museum)and Y. Shibata and H. Ishisako (Hiroshima University)are appreciated for their helps on mass spectrometeranalysis and electron microprobe analysis. We thankC. Dragusanu (Hiroshima University), M. Honda (In-stitute of Physical and Chemical Research) and S.Nohda, H. Shibuya and H. Matsuda (Kumamoto Uni-versity) for their valuable discussions. The manuscriptis greatly improved based on detailed reviews and con-structive comments from B.-m. Jahn and an anonymousreviewer. This study is supported by a Grant-in-Aid forScientific Research from the Ministry of Education,Science, Sports and Culture of Japan. Part of this studywas performed through Special Coordination Funds forpromoting Science and Technology of STA (Scienceand Technology Agency), the Japanese Government.
REFERENCES
Asahara, Y., Tanaka, T., Kamioka, H., Nishimura, A.and Yamazaki, T. (1999) Provenance of the northPacific sediments and process of source materialtransport as derived from Rb-Sr isotopic systemat-ics. Chem. Geol. 158, 271–291.
Basile, I., Grousset, F. E., Revel, M., Petit, J. R.,Biscaye, P. E. and Barkov, N. I. (1997) Patagonianorigin of glacial dust deposited in East Antarctica(Vostok and Dome C) during stages 2, 4 and 6. EarthPlanet. Sci. Lett. 146, 573–589.
Bureau of Geology and Mineral Resources of XinjiangUygur Autonomous Region (1993) Regional Geol-ogy of Xinjiang Uygur Autonomous Region. Geol.Pub. House, Beijing, 841 pp. (in Chinese with Eng-lish abstract).
Deer, W. A., Howie, R. A. and Zussman, J. (1992) AnIntroduction to the Rock-Forming Minerals. 2nd ed.,Longman Scientific & Technical, 647 pp.
DePaolo, D. J. and Wasserburg, G. J. (1976) Inferencesabout magma sources and mantle structure from vari-ations of 143Nd/144Nd. Geophys. Res. Lett. 3, 743–746.
Derbyshire, E. (1996) Quaternary glacial sediments,glaciation style, climate and uplift in the Karakoramand northwest Himalaya: review and speculations.Palaeogeogr. Palaeoclimatol. Palaeoecol. 120, 147–157.
Dragusanu, C. and Tanaka, T. (1999) 1.57-Ga

Sr and Nd isotope and REE abundances of moraines, NW China 427
magmatism in the south Carpathians: implication forthe Pre-Alpine basement and evolution of mantleunder the European continent. J. Geol. 107, 237–248.
Gallet , S. , Jahn, B.-m. and Torii , M. (1996)Geochemical characterization of the Luochuan loess-paleosol sequence, China, and paleoclimatic impli-cations. Chem. Geol. 133, 67–88.
Gallet, S., Jahn, B.-m., Lanoe, B. Van Vliet, Dia, A.and Rossello, E. (1998) Loess geochemistry and itsimplications for particle origin and composition ofthe upper continental crust. Earth Planet. Sci. Lett.156, 157–172.
Goldstein, S. L., O’Nions, R. K. and Hamilton, P. J.(1984) A Sm-Nd isotopic study of atmospheric dustand particulates from major river systems. EarthPlanet. Sci. Lett. 70, 221–236.
Grousset, F. E., Biscaye, P. E., Revel, M., Petit, J. R.,Pye, K., Joussaume, S. and Jouzel, J. (1992) Antartic(Dome C) ice-core dust at 18 k.y. B.P.: Isotopic con-straints on origins. Earth Planet. Sci. Lett. 111, 175–182.
Honda, M. and Shimizu, H. (1998) Geochemical, min-eralogical and sedimentological studies on theTaklimakan Desert sands. Sedimentology 45, 1125–1143.
Ishii, T., Isobe, I., Mizuno, K., Kanai, Y., Matsuhisa,Y., Mizota, C., Qian, Y. B., Terashima, S. andOkumura, K. (1995) Study of the formation processesand sedimentary environments of surface geologicalfeatures in desertic areas of China, with special ref-erence to the characteristics and origin of eoliansediments. Bull. Geol. Surv. Japan 46, 651–685 (inJapanese with English abstract).
Jacobsen, S. B. and Wasserburg, G. J. (1980) Sm-Ndisotopic evolution of chondrites. Earth Planet. Sci.Lett. 50, 139–155.
Langmuir, C. H., Vocke, R. D., Jr., Hanson, G. N. andHart, S. R. (1978) A general mixing equation withapplication to Icelandic basalts. Earth Planet. Sci.Lett. 37, 380–392.
Liu, C. Q., Masuda, A., Okada, A., Yabuki, S., Zhang,J. and Fan, Z.-L. (1993) A geochemical study of loessand desert sand in northern China: implications forcontinental crust weathering and composition. Chem.Geol. 106, 359–374.
Liu, C. Q., Masuda, A., Okada, A., Yabuki, S. and Fan,Z.-L. (1994) Isotopic geochemistry of Quaternarydeposits from the arid lands in northern China. EarthPlanet. Sci. Lett. 127, 25–38.
Masuda, A. (1975) Abundances of monoisotopic REE,consistent with the Leedey chondrite values.
Geochem. J. 9, 183–184.Masuda, A., Nakamura, N. and Tanaka, T. (1973) Fine
structures of mutually normalized rare-earth patternsof chondrites. Geochim. Cosmochim. Acta 37, 239–248.
Matsuhisa, Y., Mizota, C., Faure, K. and Qian, Y. B.(1996) Homogenization processes of fine particlesin the arid regions of western China, inferred fromoxygen isotope composition of quartz. Abstracts ofTodai International Symposium on Cosmochronologyand Isotope Geoscience, 29–32.
Miyazaki, T. and Shuto, K. (1998) Sr and Nd isotoperatios of twelve GSJ rock reference samples.Geochem. J. 32, 345–350.
Nesbitt , H. W. and Young, G. M. (1982) EarlyProterozoic climates and plate motions inferred frommajor element chemistry of lutite. Nature 299, 715–717.
Shimizu, H., Yoshimura, J., Yamashita, M., Takahashi,K. and Adachi, M. (2000) Rb-Sr isotopic and REEgeochemistry on garnet-biotite granodiorite clastsfrom the Permian Kozaki Formation, Kumamoto,Southwest Japan: A slightly enriched initial Sr iso-tope ratio and M-type REE tetrad pattern. Geochem.J. 34, 101–120.
Smalley, I. J. (1966) The properties of glacial loess andthe formation of loess deposits. J. Sedimentary Pe-trology 36, 669–676.
Smalley, I. J. and Vita-Finzi, C. (1968) The formationof fine particles in sandy deserts and the nature of‘desert’ loess. J. Sedimentary Petrology 38, 766–774.
Tanaka, T., Ando, N., Kamioka, H. and Togashi, S.(1990) Chemical compositions and 138Ce/142Ce,143Nd/144Nd and 87Sr/86Sr ratios of Takla MakanDesert sand. J. Mass Spectrom. Soc. Japan 38, 133–141.
Tanaka, T., Tanimizu, M., Asahara, Y., Yonezawa, C.,Togashi, S. and Kamioka, H. (1996) A variety of143Nd/144Nd ratios among six high purity neodym-ium oxide reagents. J. Mass Spectrom. Soc. Japan44, 79–83.
Taylor, S. R. and McLennan, S. M. (1985) The Conti-nental Crust: Its Composition and Evolution.Blackwell Scientific Publications, 312 pp.
Xinjiang Institute of Geography, Chinese Academy ofSciences (1986) The Evolution of Tianshan Moun-tains. Science Press, Beijing, 188 pp. (in Chinese).
Zheng, B., Jiao, K., Ma, Q., Li, S. and Fushimi, H.(1990) The evolution of Quaternary glaciers and en-vironmental changes in the West Kunlun Mountains,Western China. Bull. Glacier Res. 8, 61–72.


![HGF — PEL Atmosphere Workshop II [1ex] WP1100 — …P. Hedelt, DLR–PF, Diploma Thesis, 2006 Analysis of CO2 SWIR region: isotope abundances, field-of-view, tangent altitudes,](https://static.fdocuments.in/doc/165x107/5febcc0b07e9b422411e775b/hgf-a-pel-atmosphere-workshop-ii-1ex-wp1100-a-p-hedelt-dlrapf-diploma.jpg)