Sqm corp pres adr_1
17
Bank of New York ADR Conference November 28-29, 2016
-
Upload
sociedadquimicaminiera -
Category
Investor Relations
-
view
96 -
download
0
Transcript of Sqm corp pres adr_1
Bank of New York ADR ConferenceNovember 28-29, 2016

2Corporate Presentation / Third Quarter 2016
Statements in this presentation concerning the Company’s business outlook or future economic performances, anticipated profitability, revenues, expenses, or other financial items, anticipated cost synergies and product or service line growth, together with other statements that are not historical facts, are “forward-looking statements” as that term is defined under Federal Securities Laws.
Any forward-looking statements are estimates, reflecting the best judgment of SQM based on currently available information and involve a number of risks, uncertainties and other factors that could cause actual results to differ materially from those stated in such statements.
Risks, uncertainties, and factors that could affect the accuracy of such forward-looking statements are identified in the public filing made with the Securities and Exchange Commission, and forward-looking statements should be considered in light of those factors.
Important Notice
3Corporate Presentation / Third Quarter 2016
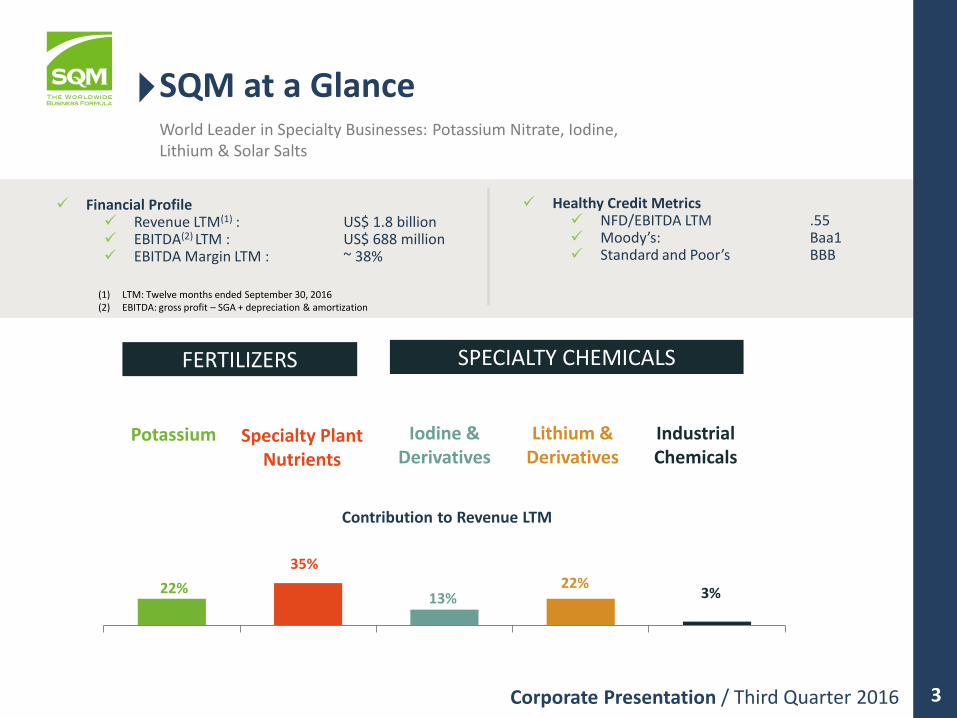
(1) LTM: Twelve months ended September 30, 2016(2) EBITDA: gross profit – SGA + depreciation & amortization
FERTILIZERS SPECIALTY CHEMICALS
Specialty Plant Nutrients
Potassium Iodine & Derivatives
Lithium & Derivatives
Industrial Chemicals
Financial Profile Revenue LTM(1) : US$ 1.8 billion EBITDA(2) LTM : US$ 688 million EBITDA Margin LTM : ~ 38%
World Leader in Specialty Businesses: Potassium Nitrate, Iodine, Lithium & Solar Salts
35%
13%22%
3%22%
SQM at a Glance
Healthy Credit Metrics NFD/EBITDA LTM .55 Moody’s: Baa1 Standard and Poor’s BBB
Contribution to Revenue LTM

4Corporate Presentation / Third Quarter 2016 Sodium nitrate + Potassium chloride = Potassium nitrate + (Sodium chloride) Know How – Exploration, Process and Logistics
Caliche ore is only found in Chile
The world’s largest deposits of nitrates and iodine
Proprietary mining rights pursuant to exploitation concessions
High concentrations of potassium and lithium
High evaporation rates
Production rights are pursuant to a lease agreement with CORFO until 2030
Technology and experience to efficiently operate
Caliche Ore
Salar Brines
High-quality reserves low-cost operations
Natural Resources and Experience
+NaNO3
KCl= KNO3
Sustainable Operations in the North of Chile.

Arbitration: CORFO and SQM
CORFO Alleges SQM Position
SQM incorrectly determined lease payments, andunderpaid CORFO US$8.9 million (2009-2014)
• All payments were made appropriately
International reference price for KCL (used inorder to calculate lease payments) should havebeen used for all potassium salts, without makingcorrections to reflect for potassium content
• Per contract, CRU British Sulfur determines reference price• Agreement states that unit of K content must be taken into
consideration• CRU has determined reference price for all potassium
products
Lease agreement reference price for lithium should be based on sales to non-related customers and not average price to all customers
• Parties previously discussed reference pricing, and agreed on lease payments based on average price from all customers.
• Average price referenced in bullet above based on all customers has benefited CORFO over life of contract
SQM did not properly construct/replace property markers per agreement
• Mining properties are fully protected from legal point of view• Responsibility belongs to property owner (CORFO), and has
never been transferred by CORFO to SQM• SQM has offered to construct and replace markers
As a result of these allegations, CORFO is calling for early termination of the lease agreement
SQM has fully complied with all contractual obligations with CORFO over the life of the contract
5
August 2016: CORFO formally initiated second arbitration regarding Project Agreement against SQM
Sept 2016: SQM formally initiated third arbitration against CORFO to look at the total period
May 2014: Arbitration was initiated between SQM and CORFO

6Corporate Presentation / Third Quarter 2016
<3%2015 Market Share(1)
Potassium
392mmLTM Revenues
US$
1.450kMT
LTM(2) Sales Volumes
7%YTD Contribution to
Gross Profit
SQM Highlights
Low-cost producer of potassium chloride
Brazil remains the most important market for SQM sales
Flexibility to produce potassium chloride, potassium sulfate,
and potassium nitrate depending on market needs
Effective capacity ~ 2.0 million MT
Sintoukola project in the Republic of Congo: US$20 million
investment for 17% ownership stake
Potassium Chloride: Industry Dynamics
Potassium chloride is the most commonly used
potassium-based fertilizer
2016 est. global demand: ~60 million MT(1)
Major players in Belarus, Canada, and Russia
Slight price recovery expected Q42016
(1) SQM estimates(2) LTM: Twelve months ended September 30, 2016

7Corporate Presentation / Third Quarter 2016
47%2015 KNO3 Market Share(1)
Specialty Plant Nutrition
636mmLTM Revenues
US$
846kMT
LTM Sales Volumes (2) (3)
29%YTD Contribution to
Gross Profit
SQM Highlights
Access to reserves of potassium and nitrate
Developed distribution network and diverse customer base
Lower price elasticity relative to potassium chloride
Focus on water soluble segment
KNO3 capacity expansion
Increase 1 million 1.5 million MT/year
200K MT from increased efficiency at existing plants (2016-2017)
300K MT from new plant (operating mid-2018; estimated capex US$140 million)
Industry Dynamics
Potassium nitrate (KNO3) provides unique benefits: Chlorine-free, water soluble, and fast absorption.
Demand drivers: Higher cost of land, water scarcity, increased demand for higher quality crops
2015 global potassium nitrate demand: ~1 million MT(1)
Water soluble segment drives demand growth
(1) SQM estimates. Excludes Chinese KNO3 market.(2) LTM: Twelve months ended September 30, 2016(3) SPN sales volumes include KNO3 and other specialty fertilizers

8Corporate Presentation / Third Quarter 2016
26%2015 Market Share(1)
Iodine and Derivatives
238mmLTM Revenues
US$
9.9kMT
LTM(2) Sales Volumes
7%YTD Contribution to
Gross Profit
SQM Highlights
Low-cost producer
Developed distribution and sales network
Effective capacity ~10,000 MT per year
Prices have been decreasing. Lower average prices expected in 2016.
Industry Dynamics
Main uses: X-ray contrast media, LCD, pharmaceuticals and sanitizers
Global demand: CAGR of ~3% for the period 2004-2015(1)
Expected global demand 2016: ~34,000 MT(1)
Limited sources of iodine worldwide:
Chile 56% (SQM 26%)
Japan (including recycling) 31%
Total recycling 18%
(1) SQM estimates(2) LTM: Twelve months ended September 30, 2016

9Corporate Presentation / Third Quarter 2016
26%2015 Market Share(1)
Lithium and Derivatives
401mmLTM Revenues
US$
46kMT
LTM(2) Sales Volumes
53%YTD Contribution to
Gross Profit
SQM Highlights
Leading lithium chemicals producer in the world and lowest cost producer(1).
Current lithium carbonate plant capacity: 48K MT/year. New lithium hydroxide plant – increasing total capacity to over 13k MT/year
Industry Dynamics
Main uses: batteries, lubricant, glass, pharmaceuticals. Future potential related to batteries for e-cars.
2015 global lithium chemicals demand: 155K MT(1).
Demand growth of ~12-13% expected in 2016(1).
Expect new supply in 2017
(1) SQM estimates(2) LTM: Twelve months ended September 30, 2016
Higher sales volumes expected in 2016: +20%
Minera Exar JV in Argentina:
Total capacity 50K MT/year
First stage 25K MT; estimated capex US$425 million pre-VAT
Start production by 2019
Li

10Corporate Presentation / Third Quarter 2016
Industrial Chemicals
61mmLTM Revenues
US$
75kMT
LTM(1) Sales Volumes
3%YTD Contribution to
Gross Profit
SQM Highlights
Operational flexibility with certain industrial sodium and potassium nitrate products
Solar Salts:
SQM produces both potassium nitrate and sodium nitrate, the two raw materials in solar salt production
2016 solar salts volumes expected to reach 40K MT
Industry Dynamics
Various traditional uses for industrial nitrates related to glass, metal treatment, water treatment, and explosives
Solar Salts:
Intl. Energy Association expects installed capacity of concentrated Solar Power (CSP) to double by 2020, and supply 20% of the world electricity by 2050.
As a reference, a 50MW parabolic trough CSP plant with 7.5 hours of indirect storage requires about 30K MT of solar salts
Projects being developed globally
(1) LTM: Twelve months ended September 30, 2016

SQM Strategic Goals Initiatives to Reach Goal
SPN: Continue to add value to KNO3 market • Build new NPK plants and form new strategic partnerships• Aggressive investment in market development. New
products, new uses new customers in diverse regions
Potash: Be a very low-cost producer • Extend Lean implementation in all our plants• Evaluate new projects at low end of cost curve
Lithium: Grow and diversify geographically • Develop 50,000 MT project in Argentina• Analyze other opportunities to supply growing market
Iodine: Increase market share • Ensure operational optimization between nitrates and iodine• Promote R&D for new uses in the market• Continue to develop downstream market through
partnership with Ajay Chemicals
Solar Salts: Achieve at least 200K MT/year by 2020 • Provide a full service for solar salt projects, leveraging production and logistics experience
New Business • Metal exploration: gold, copper, zinc within our current natural resources
• Analyze diverse natural resources around the world, engaging ONLY where we believe we will have sustainable competitive advantages
Strategic Plan: Looking towards the future
Goal: To increase EBITDA to over US$1 billion by 2020
11

12Corporate Presentation / Third Quarter 2016
Capital Expenditures
Growth Plans
2016: ~US$20 investment in Elemental Minerals
2016-2017: Lithium Hydroxide Expansion: ~US$30 million
2016-2018: Potassium Nitrate Expansion: ~US$140 million
2016-2019 (first stage): Chaucharí – Olaroz project in Argentina - ~US$425 million + ~US$250 million (pre VAT) for stages I and II, respectively. (50/50 JV: SQM will be responsible for 50% of the capex)
$ 0
$ 50
$ 100
$ 150
$ 200
$ 250
2014 2015 2016
Mantenance Argentina Lithium Hydroxide Congo Others
Capex
Historical maintenance Capex ~US$100-120 million
US$
Mill
ion

13Corporate Presentation / Third Quarter 2016
Market conditions
Iodine prices
Potash prices
Arbitration with CORFO
Provisional Dividend US$225 to be paid in December 2016
JV to develop Caucharí-Olaroz lithium project
Strong demand growth in lithium market higher volumes and prices
Potassium nitrate capacity expansion: positioned to supply growing solar salts and water soluble fertilizer markets
Strong cost position
Strong balance sheet
Other Relevant Topics
Ownership Structure(1) Dividends
Other Considerations
SQM Business Opportunities
Pampa Group
and Kowa Group 32%
Potash Corp 32%
Bank of New York
(ADRs)23%
Others Chile 13%
(1) As of June 30, 2016
14Corporate Presentation / Third Quarter 2016
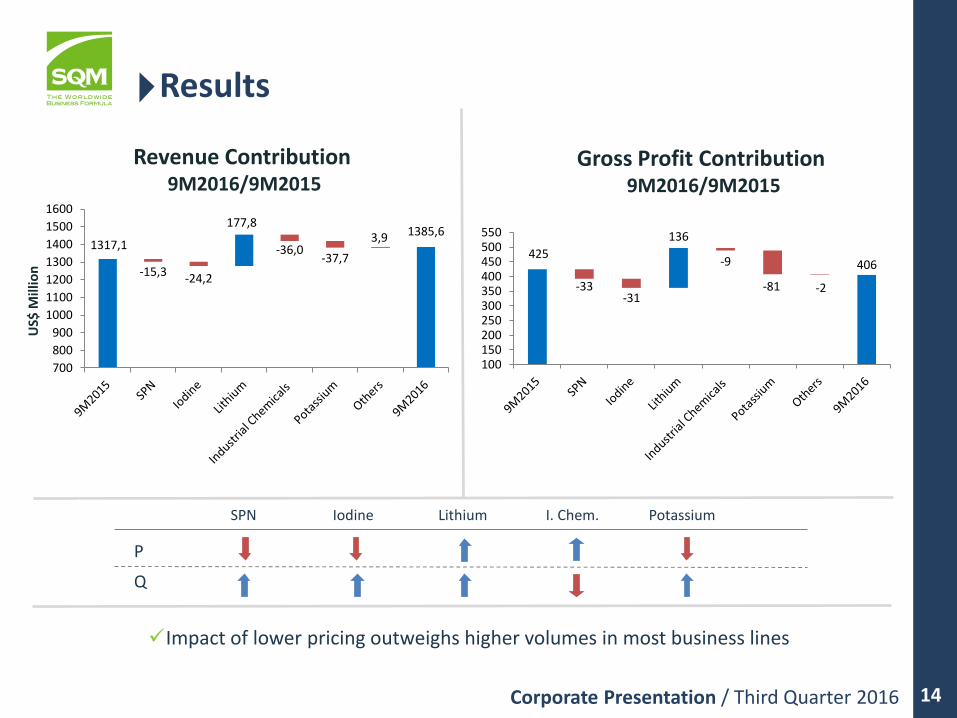
Revenue Contribution 9M2016/9M2015
Results
US$
Mill
ion
Gross Profit Contribution 9M2016/9M2015
Impact of lower pricing outweighs higher volumes in most business lines
SPN Iodine Lithium I. Chem. Potassium
P
Q
1317,11385,6
-15,3-24,2
177,8
-36,0-37,7
3,9
700
800
900
1000
1100
1200
1300
1400
1500
1600
425406
-33-31
136
-9
-81 -2
100150200250300350400450500550

Prices vs. EBITDA Margin
Cost savings initiatives have protected margins, despite lower pricing environment in most
business lines
48%44%
40%
35% 35%38%
44%40% 39%100,0
69,5
0%
10%
20%
30%
40%
50%
60%
0
20
40
60
80
100
120
140
160
IH 12 IIH 12 IH 13 IIH 13 IH 14 IIH 14 IH 15 IIH 15 IH 16
EBITDA Margin Potash Price Iodine Price
Lithium Price Average Price Trend
Prices (Base 100) vs. EBITDA Margin (%)
Pri
ces
Bas
e 1
00
1H
20
12
= 1
00
15

16Corporate Presentation / Third Quarter 2016
(1) Net income for LTM September 2016 includes one-time charge of US$32.8 million related to stopping of our train that runs between Coya Sur and Tocopilla. Net income for 2015 includes one-time charge of US$57.7 million related to restructuring iodine and nitrates facilities
(2) EBITDA: Gross Profit – administrative expenses + depreciation & amortization(3) Net Financial Debt: interest bearing debt net of cash and cash equivalents, considering the effects of derivatives
Revenues Net Income(1)
EBITDA(2)/Revenues NFD(3)/EBITDA
Financial Performance
2.1452.429
2.2032.014
1.728 1.797
0
500
1.000
1.500
2.000
2.500
3.000
2011 2012 2013 2014 2015 LTMSep 16
US$
Mill
ion
543
649
467
296
213 242
0
100
200
300
400
500
600
700
2011 2012 2013 2014 2015 LTMSep 16
US$
Mill
ion
45% 46%
38% 37%42%
38%
2011 2012 2013 2014 2015 YTD
0,79x 0,83x
1,06x 1,03x
0,73x
0,55x
2011 2012 2013 2014 2015 YTD

Contact Information:
Gerardo Illanes: VP of Finance and IR,[email protected]
Kelly O’Brien: Head of Investor Relations, [email protected]