SQL V12 User Guide.pdf - Liveware Publishing
720
ReportWorks Version 12 SQL Edition User Guide
Transcript of SQL V12 User Guide.pdf - Liveware Publishing

ReportWorks Version 12 SQL Edition User Guide

COPYRIGHT
©2008 Liveware Publishing Inc.
All rights reserved.
Liveware Publishing Inc.
1506 Society Drive Claymont, DE 19703
This manual is copyrighted and all rights are reserved. This document may not, in whole or part, be copied, photocopied,
reproduced, translated, or reduced to any electronic medium or machine readable form without the prior written consent of
Liveware Publishing Inc.
Printed in the United States of America
Trademarks and Acknowledgments
R&R Report Writer is a trademark of Liveware Publishing Inc.
Portions of the imaging technology of this product are copyrighted by Lead Technologies, Inc.
.
All Avery product code numbers are trademarks of the Avery Dennison Corporation.
All other product names and logos in this manual are used for
identification purposes only and may be trademarks or registered trademarks of their respective companies.
Chapter 1 Using Menus and Dialogs
Introduction (Using Menus and Dialogs)
R&R for SQL Report Designer is an information access and reporting tool that enables you to produce custom reports to select, analyze, summarize, and present data from your tables in a variety of ways. After you have developed a custom report, you can display it on screen or print it with any combination of fonts and print styles that your printer supports.
This chapter describes all components of the Report Designer window and explains commands and dialog boxes. This information is presented in the following sections:
Understanding the Main Window
Selecting from Menus
Using Report Designer Dialog Boxes
Using Command-Line Switches

Chapter 1: Using Menus and Dialogs
R&R ReportWorks SQL User Manual Page 2
Understanding the Main Window
When you run Report Designer, the startup dialog displays. After you have selected a report to edit or a starting point for creating a new report, the main window appears. This window contains the following components:
A Title Bar;
A Menu Bar containing File, Edit, View, Insert, Format, Options, Database, Calculations, and Help selections;
A Standard Toolbar of buttons for running Report Designer commands;
A Formatting Toolbar of buttons and edit boxes for formatting fields and specifying other layout settings;
A Work Space with horizontal and vertical rulers;
A Status Bar.
In addition, the window includes an edit cursor, a blinking vertical line that shows the insertion point for placing objects. Figure 1.1 illustrates a sample window.
You can access all commands from the Menu Bar; the Toolbars give you quick access to commonly used commands. When you position the cursor over each of the Toolbar buttons, a ToolTips help label appears explaining its purpose.
You can display Report Designer in a maximized window or re-size the window as necessary. To re-size the window, follow the procedures in your Windows documentation.
Figure 1.1 Main Window

Chapter 1: Using Menus and Dialogs
R&R ReportWorks SQL User Manual Page 3
Using the Menu Bar
The Menu Bar contains the "top-level" commands: File, Edit, View, Insert, Format, Options, Database, Calculations, and Help. You can select a command on this menu in any of the following ways:
Click on it;
Type Alt plus the underlined letter in the command;
Press F10, use the cursor keys to highlight the command, and press Enter.
Selecting any one of these commands displays a menu of additional commands that open dialog boxes or perform specific actions on selected objects or lines. See the Selecting from Menus section for a summary of each command menu.

Chapter 1: Using Menus and Dialogs
R&R ReportWorks SQL User Manual Page 4
Using the Standard Toolbar
For many commands, you can select a Standard Toolbar button instead of selecting from the Menu Bar (use View ⇒ Toolbars to turn the Standard Toolbar display on or off). Clicking on one of these buttons either executes a command or opens a dialog in which you can select or change various options.
Figure 1.2 identifies the Menu Bar command (and associated shortcut key if applicable) that corresponds to each Standard Toolbar button.
Toolbar Button
Menu Bar Command
Shortcut Key
File ⇒ New Ctrl+N
File ⇒ Open Ctrl+O
File ⇒ Save Ctrl+S
File ⇒ Print Ctrl+P
File ⇒ Print Preview
Edit ⇒ Cut Ctrl+X
Database ⇒ View Result Set
File ⇒ Export
Edit ⇒ Copy Ctrl+C
Edit ⇒ Paste Ctrl+V
Edit ⇒ Undo Ctrl+Z
Edit ⇒ Redo Ctrl+Y
Insert ⇒ Line
Insert ⇒ Box
Insert ⇒ Picture
Insert ⇒ Chart
Database ⇒ Master Table
Database ⇒ Relations
Database ⇒ Sort Order
Database ⇒ Group Order

Chapter 1: Using Menus and Dialogs
R&R ReportWorks SQL User Manual Page 5
Database ⇒ Filter
Calculations ⇒ Calculated Field
Calculations ⇒ ParameteRR Field
Calculations ⇒ Total Field
Figure 1.2 Toolbar Buttons and Corresponding Commands

Chapter 1: Using Menus and Dialogs
R&R ReportWorks SQL User Manual Page 6
Using the Formatting Toolbar
The Formatting Toolbar (see Figure 1.3) that optionally displays below the Standard Toolbar provides a quick way of formatting fields and text in your report. After you select one or more items on the report layout, you can specify font, point size, style, and alignment by using the list boxes and buttons on this bar.
In some cases you may want to hide the Formatting Toolbar — for example, if you want to display more of the report layout without having to scroll. You use View ⇒ Toolbars to control display of the Formatting Toolbar. Click the check box next to "Formatting" to turn the bar on (checked) or off (empty).
Figure 1.3 Formatting Toolbar
Figure 1.4 briefly explains each item on the Formatting Toolbar.
Toolbar Item Purpose
Font Apply a font to one or more selected fields
Size Select or enter a size for the current font
Style Buttons B for Bold, I for Italic, U for Underline
Alignment Buttons
Non-word-wrapped fields: Left, Center, Right; word-wrapped fields: Left, Right, Justified
Trim Button Turns automatic trim on or off
Trashcan Button
Deletes currently selected item(s) or restores most recently "trashcanned" item(s)
Auto/Freeform Button
Toggles between Automatic\Freeform line height (see Chapter 3, "Working with Bands")
Snap-To-Grid Button
Turns snap-to-grid on or off
Suppress Record Lines
Toggles between display/non-display of record band lines

Chapter 1: Using Menus and Dialogs
R&R ReportWorks SQL User Manual Page 7
Compress Record/Group
Lines
Toggles between display/non-display of record lines that contain only empty fields
Field Names Toggles between display of fields as field names or format symbols
Figure 1.4 Formatting Toolbar Items

Chapter 1: Using Menus and Dialogs
R&R ReportWorks SQL User Manual Page 8
Using the Bold, Italic, and Underline Buttons
The style and underline buttons (B, I, and U) serve as toggles that turn each style on or off. For example, to make a selected item bold, click the Bold button. To remove the bold style, click the same button. The item’s representation on the layout changes to indicate the selected style. You can apply more than one style to the same item. (Bold or Italic will print only if available for the currently selected font.)

Chapter 1: Using Menus and Dialogs
R&R ReportWorks SQL User Manual Page 9
Using the Alignment Buttons
Report Designer assigns a default alignment to each field when it is inserted on the layout. The default alignment is based on the field’s data type.
Numeric fields are right-aligned;
Memo fields are word-wrapped, left-aligned;
All other fields are left-aligned.
The R&R Data Dictionary can also be used to set a default alignment and field size. If a data dictionary display option has been set, then R&R will use the data dictionary settings rather than the default setting.
To find out the alignment of any field on the layout, select it; on the Formatting Toolbar, the button for the current alignment will be "pressed in." (Note that for character and memo fields, the first character of the field symbol represents the field’s alignment.)
To change field alignment, select the field and click one of the alignment buttons (Align Left, Center, Align Right, or Justify). You can also use the Alignment tab; to access the Alignment tab, select the field and press F9 (or right-click on the field and select Properties); then select the Alignment tab.
See Chapter 4, "Working with Fields," for more information about alignment and alignment symbols.

Chapter 1: Using Menus and Dialogs
R&R ReportWorks SQL User Manual Page 10
Using the Other Formatting Buttons
The remaining items on the Formatting Toolbar provide quick access to common formatting and editing tasks:
The Trim button controls automatic trimming of blank space between fields on the same line. You can also control trim using the Alignment tab (select Format ⇒ Properties, then select the Alignment tab).
The Trashcan button provides a quick way of clearing selected objects or restoring the most recently "trashcanned" item(s).
The Auto/Freeform button toggles between Auto and Freeform line height type for a line or group of lines (see Chapter 3, "Working with Bands," for an explanation of Automatic and Freeform line height).
The Snap-To-Grid button turns snap-to-grid on or off.
The Suppress Record Lines button toggles between display/non-display of record band lines.
The Compress Record/Group Lines button toggles between display/non-display of record band lines that contain only empty fields.
The Field Names button toggles between display of fields as field names or format symbols.

Chapter 1: Using Menus and Dialogs
R&R ReportWorks SQL User Manual Page 11
Changing Horizontal and Vertical Ruler Settings
Calibrated horizontal and vertical rulers help you place fields, text, and objects at specific positions on the report layout. There are 4 available rulers. Horizontal rulers may be displayed at the top and the bottom of the layout window. Vertical rulers may be displayed at the left and right of the layout window.
The left, right, or center alignment point for a selected item is marked by a location indicator on the horizontal ruler. Vertical position is marked by a darkened band in the Band Area.
In addition to selecting which rulers to display, you can also control the calibration of the rulers. The default setting for both the Horizontal and the Vertical Ruler Spacing is 10; you can select a setting from 4 through 30. This setting controls the number of ruler increments per inch on each ruler. Note that the Ruler Spacing settings control only the spacing of the report layout rulers (since the fonts actually applied to fields in the report control the print spacing).
When the grid is turned on, the ruler settings determine the horizontal and vertical grid spacing for Freeform lines. For Automatic lines, the horizontal ruler setting determines the horizontal grid spacing; the vertical grid spacing is determined by the height of the largest font on each line. See Chapter 3, "Working with Bands," for an explanation of Automatic and Freeform line height.
To change the calibration of the rulers, right-click on either ruler or press F8 to display the Ruler Spacing dialog (see Figure 1.5).

Chapter 1: Using Menus and Dialogs
R&R ReportWorks SQL User Manual Page 12
Figure 1.5 Ruler Spacing Dialog Box
Using the Horizontal or Vertical Spacing slider control, select a ruler spacing from 4 through 30 units per inch. Specify a lower number to display a coarser ruler scale; specify a higher number to display a finer ruler scale.
You can use either the mouse or the keyboard to change ruler settings: Click to the left or right of the slide pointer to decrease
(left) or increase (right) the setting by 4 units at a time. Drag the slider to change the setting in 1-unit increments.
Use the left or right cursor key to decrease (left) or increase (right) the setting by 2 units at a time. Use Page Up or Page Down to decrease (PgUp) or increase (PgDn) the setting by 4 units at a time.
Chapter 1: Using Menus and Dialogs
R&R ReportWorks SQL User Manual Page 13
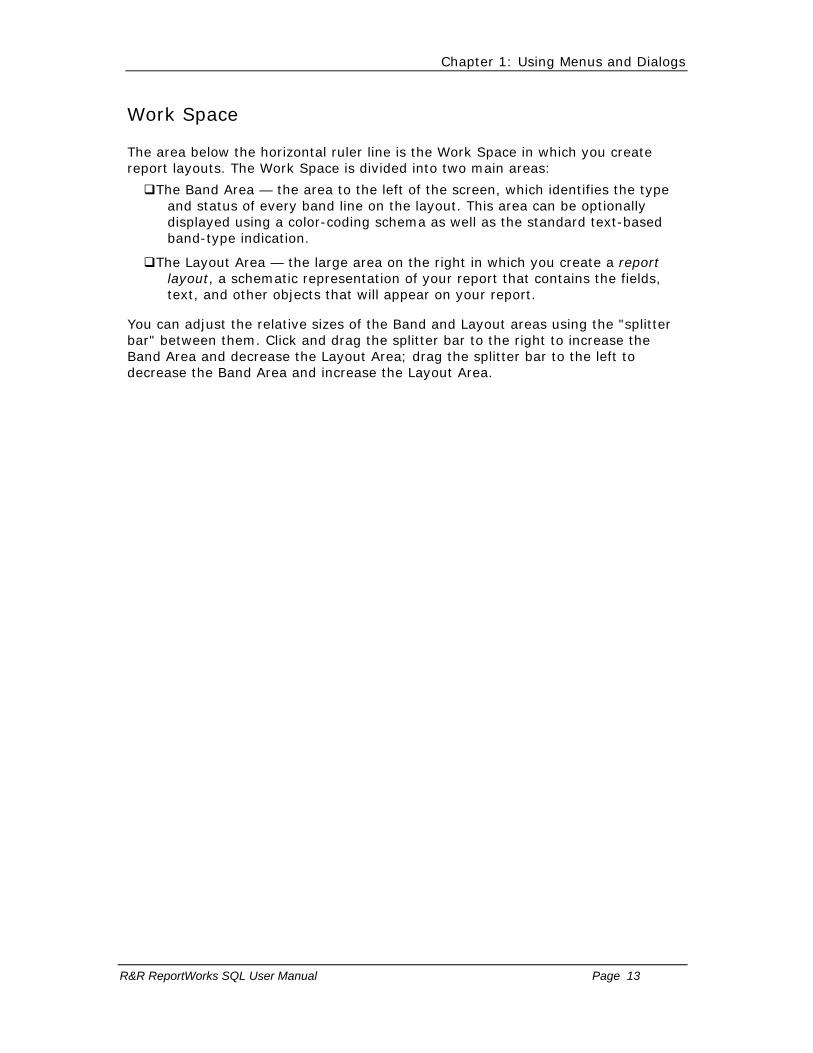
Work Space
The area below the horizontal ruler line is the Work Space in which you create report layouts. The Work Space is divided into two main areas:
The Band Area — the area to the left of the screen, which identifies the type and status of every band line on the layout. This area can be optionally displayed using a color-coding schema as well as the standard text-based band-type indication.
The Layout Area — the large area on the right in which you create a report layout, a schematic representation of your report that contains the fields, text, and other objects that will appear on your report.
You can adjust the relative sizes of the Band and Layout areas using the "splitter bar" between them. Click and drag the splitter bar to the right to increase the Band Area and decrease the Layout Area; drag the splitter bar to the left to decrease the Band Area and increase the Layout Area.

Chapter 1: Using Menus and Dialogs
R&R ReportWorks SQL User Manual Page 14
Band Area
The Layout Area consists of one or more bands, each with characteristics that define how the data in that band will be presented when the report is run. As Figure 1.1 on page 4 illustrates, the Band Area contains a band-type indicator for each band in the Layout Area. Band-type indicators, which Report Designer automatically displays when you create, insert, or move lines, identify whether a line is part of the report’s Title, Page Header, Group Header, Record band, Group Footer, Summary band, or Page Footer. The name of the band type will always be displayed (just once per band type) on the bottom-most band of that type. For example, if you have three Record band lines on the layout, the third one will contain the text "Record." To make it easier to visualize bands by type, you can enable the display of color-coded band lines using the Options ⇒ Preferences dialog. To select one or more lines, click or drag the mouse in the Band Area.
The narrow channel at the right edge of the Band Area is the Line Status Area. This area provides the following information:
Up and down arrows in the Line Status Area indicate the top and bottom border of any Freeform line (for a full explanation of Freeform lines, see Chapter 3, "Working with Bands").
A question mark indicates that a logical field or a no records found type has been assigned to control printing of that line. (See Chapter 3, "Working with Bands," for information about controlling line printing.)

Chapter 1: Using Menus and Dialogs
R&R ReportWorks SQL User Manual Page 15
Layout Area
The Layout Area typically contains text, which will appear in the report exactly as typed, and data fields, which are represented on the layout either by field symbols such as <xxxxxx (character data) and 99999 (numeric data) or by field names (if the Field Names setting has been enabled on the View menu). This area can also contain lines, boxes, bitmapped graphic images, and other objects.
The Layout Area can be scrolled both vertically and horizontally. You can create report layouts up to a maximum of 256 lines; the maximum layout width is determined by the page layout settings. You will see an R on the Horizontal Ruler that represents the position of the right margin. The area to the right of the margin indicator is shaded gray. You can place fields within the gray area; however, those fields might not display on a printed page depending on your printer settings. To set the right margin, select File ⇒ Page Setup.
See Chapter 4, "Working with Fields," for information about adding text and fields to a report layout. See Chapter 12, "Adding Lines, Boxes, and Shading," for information about drawing lines and boxes. For an explanation of inserting and sizing images, see Chapter 15, "Inserting Bitmapped Images."

Chapter 1: Using Menus and Dialogs
R&R ReportWorks SQL User Manual Page 16
Using the Status Bar and Scroll Bars
Immediately below the Work Space is the Status Bar, which displays information about current operations and/or the position of a selected item. At the bottom and right of the main window are the horizontal and vertical scroll bars, which enable you to scroll the Work Space up and down, left and right.
Status Bar
When you are working in the Layout Area, the Status Bar identifies the position of the edit cursor on the layout and indicates whether the "Caps Lock" or "Num Lock" key on your keyboard is on. In addition, the Status Bar may contain descriptions of command options, prompts telling you what action to take, or information about the currently highlighted field.
Scroll Bars
Use the horizontal and vertical scroll bars to scroll the Work Space. Both the Band Area and the Layout Area can be scrolled vertically. However, only the Layout Area can be scrolled horizontally, since the information in the Band Area is relevant to the entire width of the report layout. For information about scrolling an application window, see your Windows documentation.

Chapter 1: Using Menus and Dialogs
R&R ReportWorks SQL User Manual Page 17
Selecting from Menus
You execute commands by selecting from menus or clicking buttons and then using dialog boxes to provide additional information required by some commands. Operation of Report Designer menus and dialog boxes follows the Windows conventions explained in the following sections.
The Menu Bar is the main menu, from which you select the command menus you want to use. For example, selecting File in the Menu Bar will display the File menu. You can open a command menu from the Menu Bar in any of the following ways:
Click on the command name;
Press F10 (or Alt) and type the accelerator key for the command (the underlined letter in the command name — for example, F for File or E for Edit);
Press F10, use the cursor keys to highlight a command name, then press Enter.
After opening a command menu, you can select a command from that menu in any of these ways:
Click on the command name;
Type the accelerator key for the command;
Use the cursor keys to highlight a command; then press Enter.
For example, after opening the File menu, you can select "New" by clicking on it, by typing N, or by highlighting the command and pressing Enter. Cancel a command selection by clicking outside the menu box or by pressing Esc.
You can also execute some commands directly from the keyboard, without using the Menu Bar, by typing a shortcut key combination. For example, you can execute Format ⇒ Properties by pressing F9.
At some points, one or more commands on the Menu Bar or in the command menus will be dim, indicating that they are not available.

Chapter 1: Using Menus and Dialogs
R&R ReportWorks SQL User Manual Page 18
File Menu
Use the File menu to do the following:
Create, open, close, save, print, or preview a report;
Enter or edit comments for the current report;
Set a designer or runtime password for the report;
Define the page setup;
Manage data source connections;
Export a report to an Active X Viewer, HTML, plain text, database, result set database, worksheet, text data, Rich Text Format (RTF), or Word Merge file or to an Excel 5.0 PivotTable or Chart;
Send a report via email;
Exit Report Designer.
Selecting File displays a menu of choices; selecting a choice either opens a dialog or executes a command. Figure 1.6 summarizes the actions these menu choices perform.
Command Purpose
New (Ctrl+N) Create an Auto-SQL report (Report Designer will dynamically define the SELECT)
New User-SQL Create a User-SQL report (the user directly enters the SELECT)
Open (Ctrl+O) Open or delete report; copy report to another library; select a library
Close Close Report
Data Source Connections
Connect and disconnect data sources
Save (Ctrl+S) Save a report
Save As Save a report with a different name or in a different library
Properties Enter comments for current report
Page Setup Specify paper size, margins, orientation
Security Set password for designer and runtime report access
Print Preview Display the current report on the screen
Print (Ctrl+P) Print using the current printer, select a different printer, or change print options
Export Output report data to a plain text, database, result set database, worksheet,

Chapter 1: Using Menus and Dialogs
R&R ReportWorks SQL User Manual Page 19
text data, HTML, RTF, or Word merge file; or to an ActiveX Viewer file; Optionally send export file to email recipient
Export OLE Output report data to an Excel 5.0 PivotTable or Chart
Send Send a report via email
Exit (Alt+F4) Leave Report Designer and return to Windows
Figure 1.6 File Menu Choices
Note that the Page Setup settings for paper size, margins, and orientation apply only to the current report and are saved with it.

Chapter 1: Using Menus and Dialogs
R&R ReportWorks SQL User Manual Page 20
Edit Menu
The Edit menu provides choices for modifying reports — cutting and pasting, copying, deleting, moving, and so on. Figure 1.7 summarizes the purpose of each Edit menu choice.
Command Purpose
Undo (Ctrl+Z) Undo last change to layout
Redo (Ctrl+Y) Repeat last change to layout
Cut (Ctrl+X) Remove selected item(s) and save to memory
Copy (Ctrl+C) Copy selected item(s) to memory
Paste (Ctrl+V) Paste item(s) saved to memory
Clear Erase selected object(s)
Paste Clipboard Image
Paste graphic image from clipboard
Paste Special Link or embed an object from the clipboard
Move Fields (F7) Move selected field(s) or band line(s) using cursor keys
Duplicate Fields (Shift+F7)
Copy selected field(s) for movement using cursor keys
Links Display and modify existing links in a report
Object Modify the selected OLE object
Figure 1.7 Edit Menu Choices

Chapter 1: Using Menus and Dialogs
R&R ReportWorks SQL User Manual Page 21
View Menu
Use the View menu to do the following:
Turn Standard Toolbar display on or off;
Turn Formatting Toolbar display on or off;
Turn ToolTips display on or off;
Enable horizontal/vertical rulers display; adjust ruler calibration;
Turn grid display on or off;
Display fields either as symbols or as field names.
By default, the Toolbars and rulers are displayed; fields are represented by symbols on the layout; and the grid is shown. To change these settings, select View; then select the item to change.
Command Purpose
Toolbars Hide or show the Standard and Formatting Toolbars; enable or disable ToolTips display
Rulers… Select ruler display and calibration
Grid Hide or show the grid
Field Names Display fields as symbols or as names
Figure 1.8 View Menu Choices

Chapter 1: Using Menus and Dialogs
R&R ReportWorks SQL User Manual Page 22
Toolbar and ToolTips Settings
A check mark next to either "Standard" or "Formatting" on the Toolbars dialog means that the item is currently displayed. To turn off display of either, select the appropriate item.
A check mark next to the "ToolTips" item on this dialog means that a help label will display when you position the cursor over one of the toolbar items. To turn off display of these labels, click the box to remove the check mark.

Chapter 1: Using Menus and Dialogs
R&R ReportWorks SQL User Manual Page 23
Horizontal and Vertical Rulers
To turn on or off the display of the horizontal or vertical ruler, select Ruler. A check mark next to a ruler indicates that display is currently turned on.
Chapter 1: Using Menus and Dialogs
R&R ReportWorks SQL User Manual Page 24
Grid
To help you align objects on the report layout, you can enable a grid consisting of a series of dots. The grid spacing is determined by the settings for the horizontal and vertical rulers. To control the grid display, select View ⇒ Grid; a check mark appears when this setting is on. When the Snap-To-Grid setting is on, items that you insert or move will "snap" to the nearest grid mark. See the Format Menu section of this chapter for information about turning the Snap-To-Grid setting on or off.

Chapter 1: Using Menus and Dialogs
R&R ReportWorks SQL User Manual Page 25
Field Names
Fields can be represented on the layout either by field names or by symbols (such as >xxxxx) that identify field type and alignment. By default, each field is represented by symbols. To display field names instead, turn on the View ⇒ Field Names setting. As a result, each field’s name is shown at the field’s location (depending on field width, the entire name may not appear).
Chapter 1: Using Menus and Dialogs
R&R ReportWorks SQL User Manual Page 26
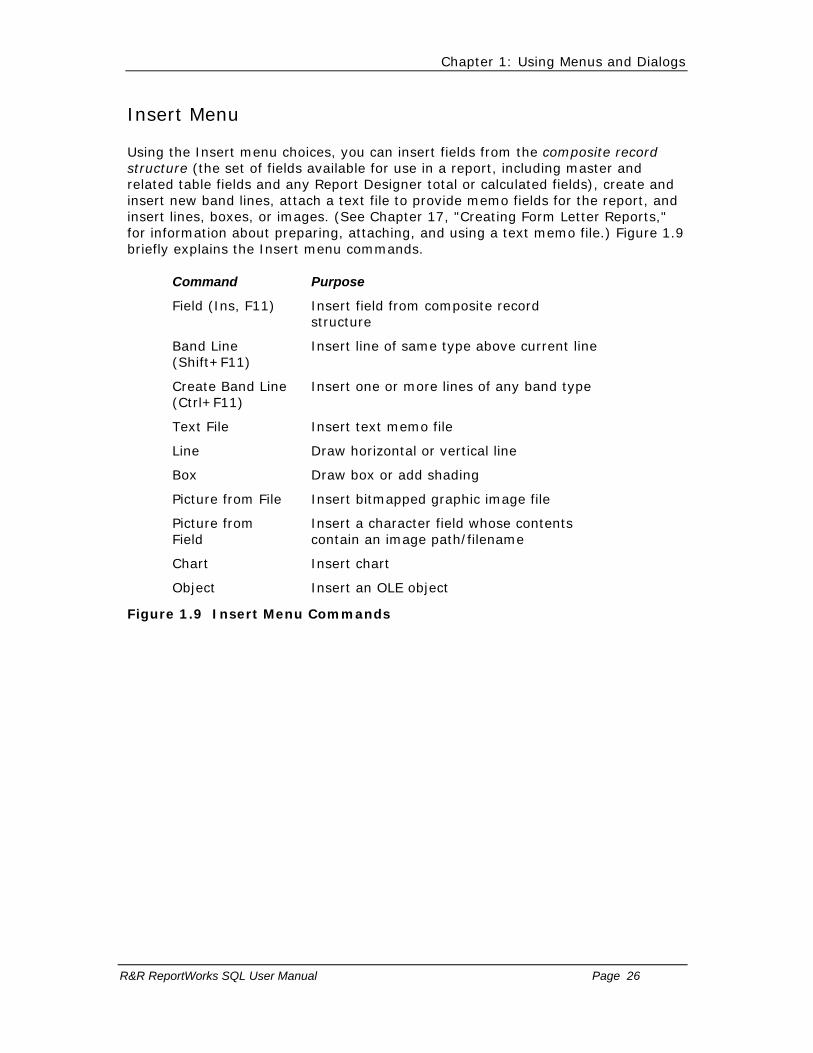
Insert Menu
Using the Insert menu choices, you can insert fields from the composite record structure (the set of fields available for use in a report, including master and related table fields and any Report Designer total or calculated fields), create and insert new band lines, attach a text file to provide memo fields for the report, and insert lines, boxes, or images. (See Chapter 17, "Creating Form Letter Reports," for information about preparing, attaching, and using a text memo file.) Figure 1.9 briefly explains the Insert menu commands.
Command Purpose
Field (Ins, F11) Insert field from composite record structure
Band Line (Shift+F11)
Insert line of same type above current line
Create Band Line (Ctrl+F11)
Insert one or more lines of any band type
Text File Insert text memo file
Line Draw horizontal or vertical line
Box Draw box or add shading
Picture from File Insert bitmapped graphic image file
Picture from Field
Insert a character field whose contents contain an image path/filename
Chart Insert chart
Object Insert an OLE object
Figure 1.9 Insert Menu Commands
Chapter 1: Using Menus and Dialogs
R&R ReportWorks SQL User Manual Page 27
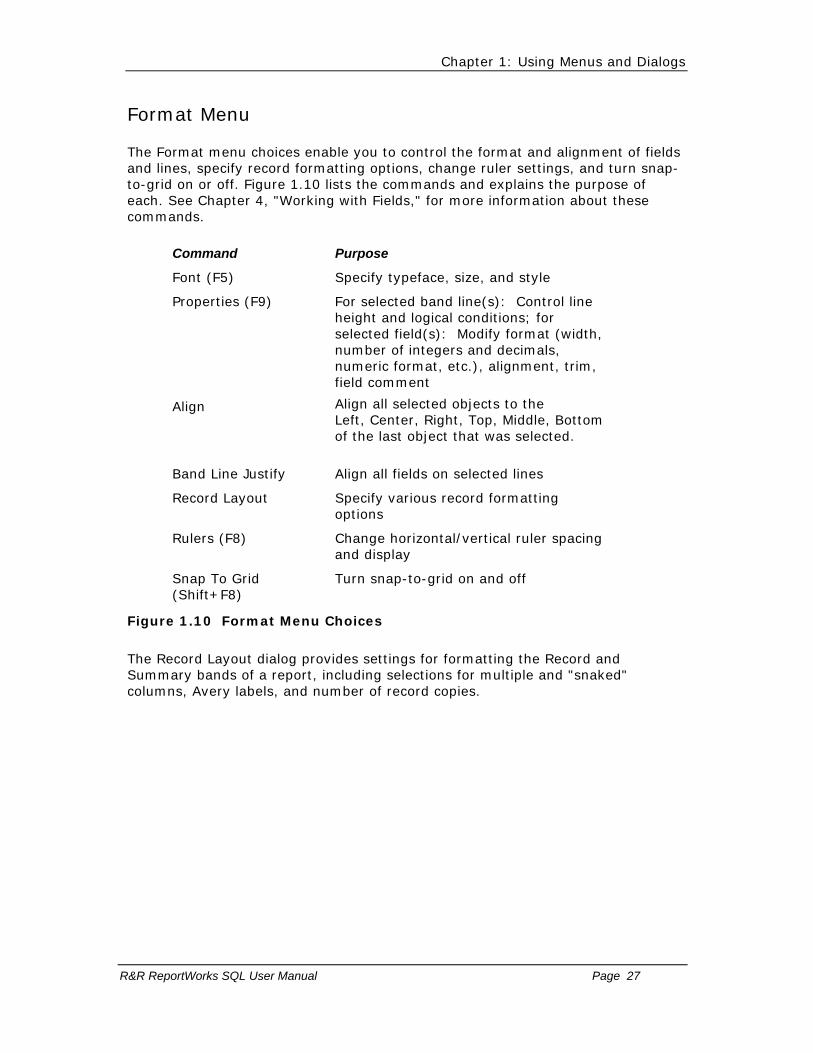
Format Menu
The Format menu choices enable you to control the format and alignment of fields and lines, specify record formatting options, change ruler settings, and turn snap-to-grid on or off. Figure 1.10 lists the commands and explains the purpose of each. See Chapter 4, "Working with Fields," for more information about these commands.
Command Purpose
Font (F5) Specify typeface, size, and style
Properties (F9) For selected band line(s): Control line height and logical conditions; for selected field(s): Modify format (width, number of integers and decimals, numeric format, etc.), alignment, trim, field comment
Align Align all selected objects to the Left, Center, Right, Top, Middle, Bottom of the last object that was selected.
Band Line Justify Align all fields on selected lines
Record Layout Specify various record formatting options
Rulers (F8) Change horizontal/vertical ruler spacing and display
Snap To Grid (Shift+F8)
Turn snap-to-grid on and off
Figure 1.10 Format Menu Choices
The Record Layout dialog provides settings for formatting the Record and Summary bands of a report, including selections for multiple and "snaked" columns, Avery labels, and number of record copies.

Chapter 1: Using Menus and Dialogs
R&R ReportWorks SQL User Manual Page 28
Options Menu
The Options menu includes the following choices: Preferences, Default Settings, File Settings, and Data Source (see Figure 1.11).
Command Purpose
Preferences Turn scroll bars on and off; enable colors for band area/preview; enable colors for total and group field dialogs; control result of selecting File ⇒ New; specify data source defaults; specify display of report dictionary descriptions in field lists; specify Auto Save settings
Default Settings
Set paper size, margins, font, spacing, logical strings
File Settings Specify default report image and template folders; default text file extensions;
Chart Settings Specify defaults for Font and Palette for charts
Figure 1.11 Options Menu Choices
You use the Preferences dialog box to control the display of horizontal and vertical scroll bars and to specify what action Report Designer will take when you select File ⇒ New. See Chapter 5, "Setting Defaults," for more information about the Preferences dialog.
The Default Settings dialog controls global settings for paper size, margins, font and point size, font color, ruler spacing, logical strings, and snap-to-grid. These settings apply to all new reports. The Default File Settings dialog enables you to set default data, library, and image directories; specify default file extensions for text memo and image files; and specify a default report dictionary and report dictionary index.
Select Options ⇒Preferences Data Source to specify defaults to control access to your data sources. You can change the data source defaults at any time during a Report Designer session.
See Chapter 5, "Setting Defaults," for more information about changing defaults using these dialogs.

Chapter 1: Using Menus and Dialogs
R&R ReportWorks SQL User Manual Page 29
Database Menu
Use the Database menu choices to specify the tables from which data will be drawn for a report, to sort and group that data, to create filters that select specific records, to display the SQL SELECT statement for the current report, and to define a data governor to limit the number of rows retrieved from the database while you are designing a report. Figure 1.12 summarizes the Database choices for an Auto-SQL report.
Command Purpose
Master Table Select or change master table (Auto-SQL reports only)
Joins Select, edit, and remove table joins
Sort Order Select fields to control report sort order
Group Order Select fields to group report data
Filter Specify selection conditions to filter records
Show SQL Display SQL SELECT statement; copy SELECT
Limit Result Specify maximum number of rows to retrieve
View Result Set View all fields used in the report in a database browser window.
Figure 1.12 Database Menu Choices
For User-SQL reports, the Database menu choices differ slightly. See Chapter 6, "Selecting Data," and Chapter 18, "Creating User-SQL Reports," for information about Auto-SQL and User-SQL reports.

Chapter 1: Using Menus and Dialogs
R&R ReportWorks SQL User Manual Page 30
Calculations Menu
The Calculations menu choices enable you to create and edit calculated fields, total fields, ParameteRR fields, and User-Defined Functions (UDFs), as well as purge a report of any unused total and/or calculated fields.
Command Purpose
Calculated Field Create and edit calculated fields
Total Field Create and edit total fields
ParameteRR Field Create a field whose final value will be determined at report execution time
User Function Create and edit User-Defined functions
Auto Total Create totals for all selected fields
Purge Calculations Remove all unused fields
Figure 1.13 Calculations Menu Choices
You use the Calculated Fields dialog box to create fields whose values are computed as a report is generated, rather than being retrieved from the database. You use the Total Fields dialog to create fields that contain summary information such as a subtotal or grand total figure; Report Designer calculates the value of such a field according to the total options you select. You can create total and calculated fields, insert them in reports, and manipulate them just as you do data and text fields.
You use the ParameteRR Fields dialog to create fields whose values can be modified via a ParameteRR Value Entry screen when the report is executed.
To edit a total, calculated, or ParameteRR field that has been inserted on the layout, simply select the field and press F2 to display the Edit Total, Edit Calculation, or Edit ParameteRR dialog box.
You use the User Function dialog to create UDFs to process data according to an expression or formula that you define. You can create UDFs to perform complex operations and then use those UDFs in calculated field expressions in any report.
The Auto Total dialog enables you to select multiple fields on the layout and have Report Designer automatically create totals for those fields and insert the totals on a new band line.
Use the Purge Calculations command to remove any unused total, calculated fields, or ParameteRR fields from the report definition. Removing unused fields can speed up report generation and reduce the amount of memory required.
Chapter 1: Using Menus and Dialogs
R&R ReportWorks SQL User Manual Page 31
Using Report Designer Dialog Boxes
Like other Windows applications, Report Designer uses dialog boxes to request and display information related to a specific command.
Many of the dialog boxes in Report Designer are standard Windows dialog boxes. For example, the File ⇒ New dialog box is like the File New dialog in many Windows applications.
Other dialog boxes are unique to Report Designer, since they request information specific to report generation. For example, the Database ⇒ Filter dialog box requests information that enables Report Designer to construct a filter selecting specified records for a report.
You can move around in a dialog box using either the mouse or the keyboard. Using a mouse, simply click on any option to make it active. Using the keyboard, tab from option to option or press Alt plus the underlined letter in the option you want to select. When an option is active, it is marked by a highlight or dotted rectangle.

Chapter 1: Using Menus and Dialogs
R&R ReportWorks SQL User Manual Page 32
List and Edit Boxes
A list box is any vertical list from which you select a setting, file, or other item. Many dialog boxes contain edit boxes in which you can enter text such as paths, file names, field names, or numeric values. In some cases, an edit box and list box are combined so that you can either select from the list or type your choice in the edit box (such boxes are sometimes referred to as "combo boxes").
List Boxes
Some list boxes open automatically when you select a command or item; on some dialog boxes, you must first click the scroll arrow next to an item to open a list box containing choices for that item. To select a choice from a list box, either click on the choice or use the cursor keys to highlight it. From the keyboard, you can select a field from a field list box by typing the first letter of the field name until the field is highlighted on the list.
Note that the complete field name (or the report dictionary comment for that field, if there is one) is displayed in the Status Bar when a field is highlighted in the field list box.
Edit Boxes
To enter or modify text in an edit box, move the edit cursor (the vertical bar) to the box either by clicking in the box or tabbing to it. Any characters you type will be inserted at the position of the edit cursor. If the text in a box is currently selected, characters you type will replace that text.
For more information on Windows text editing operations, see your Windows documentation.
Buttons and Check Boxes
Most dialog boxes have command buttons: rectangular, labeled boxes that look like three-dimensional buttons on many displays. The most common command buttons are the OK and Cancel buttons you see in dialog boxes to indicate whether the application should accept the information in the dialog box.
Some dialog boxes have option buttons: small circles with an option name beside them. These buttons (also referred to in some Windows applications as "radio buttons") represent mutually exclusive options, only one of which can be selected at a time. When an option is selected, its circle is black.
Check boxes function as toggles to turn a setting on or off. When there is an X in the box next to an item, that setting is on.

Chapter 1: Using Menus and Dialogs
R&R ReportWorks SQL User Manual Page 33
Selecting a Command Button
Using a mouse, select a command button by clicking on it. From the keyboard, tab to the button and press the spacebar. For those commands with an underlined letter, you can type Alt plus the underlined letter. If a command button is dim, it is currently unavailable.
Selecting an Option Button
Using a mouse, select an option button by clicking on it. Using the keyboard, tab to the button that is currently on and press ↑ or ↓ to select a different button. For those options with an underlined letter, you can type Alt plus the underlined letter to turn an option button on or off. If an option button is dim, it is currently unavailable.
Check Boxes
Using a mouse, click on a check box item to turn it on or off. Using the keyboard, tab to a check box and press Spacebar to turn it on or off. For those options with an underlined letter, you can type Alt plus the underlined letter to turn a check box on or off.

Chapter 1: Using Menus and Dialogs
R&R ReportWorks SQL User Manual Page 34
Using Command-Line Switches
You can include one or more switches in the command line you use to execute Report Desinger. Using command-line switches provides a quick way of opening a specific report, specifying a master table for creation of a blank or instant report, or loading a Dynamic Link Library (DLL) at startup. Figure 1.15 explains the command switches.
Switch Purpose
/L<library file> Applies only to reports that have been saved in a report library file. Specifies the report library containing the report identified with the /R switch. Substitute the name of the library file for <library file>.
/R<report name>
Specifies the report to be opened. Substitute the name of the report you want to open for <report name>. Can be used in conjunction with /L to open a report from a library.
/T<table name>
Specifies that Report Designer create a blank report using <table name> as the master table. Substitute the full path and name of the table you want to use for <table name>.
/I<table name> Specifies that Report Designer create an Instant Report using <table name> as the master table. Substitute the full path and name of the table you want to use for <table name>.
/G Prints the report specified with /R to the saved printer or to a disk file (if the report was saved with a "Print to File" destination).
/D<DLL name> Causes Report Designer to load the Dynamic Link Library (DLL) substituted for <DLL name>. You can use this switch to improve performance of reports containing calculated fields that use the CDLL() function.
/S<script file> Causes Report Designer to open and process the specified ReportScript file. Note that use of this switch overrides the /L, /R, /T, and /I switches.
Figure 1.15 Command-Line Switches

Chapter 2 Managing Reports
Introduction (Managing Reports)
This chapter explains the basic procedures for creating and managing reports, report templates, and report libraries and for documenting reports. This information is presented in the following sections:
Creating and Modifying Reports
Using Report Wizards
Documenting Reports and Templates

Chapter 2: Managing Reports
R&R ReportWorks SQL User Manual Page 36
Templates
A template is simply a report definition with a specialized purpose: to serve as the common starting point for a series of reports. When you create a new report using a template, R&R opens a copy of the template report as a new untitled report. If the template was saved without a master table, you are prompted to select a master table.
You can create and modify templates the same way you do reports.
You can save your templates in a specific template folder to keep them separate from your reports. In Options File Settings you can set the location of your default template directory. When you create a new report using a template, R&R will look in this template directory for report files. As a result, you can easily save, retrieve, manage, and distribute templates. In this chapter, explanations of procedures for managing reports apply also to templates, except as noted.

Chapter 2: Managing Reports
R&R ReportWorks SQL User Manual Page 37
Instant Reports
If you create a report by selecting Instant Report on the File ⇒ New dialog, Report Designer generates an Instant Report layout for you automatically. The Instant Report layout includes the following items:
All fields in the master table (or as many as will fit horizontally on the layout);
Calculated fields for master table name, date, time, page number, and number of records printed;
Calculated fields for query expression and report name are created but not placed on the layout;
Grand totals of all numeric fields that have decimal places.
In many cases, you can use the Instant Report layout as a starting point for creating your own layouts.

Chapter 2: Managing Reports
R&R ReportWorks SQL User Manual Page 38
Auto-SQL and User-SQL Reports
You can create a report in any of the following ways:
♦ Build the report definition interactively using Report Designer menus and dialogs to select a master table, specify table joins, specify sorting and grouping, define filters, and so on. These reports, referred to as Auto-SQL reports, are explained in Chapter 6, "Selecting Report Data."
♦ Directly enter and modify a select statement that Report Designer then sends to your SQL database software. These reports, referred to as User-SQL reports, are explained in Chapter 18, "Creating User-SQL Reports."

Chapter 2: Managing Reports
R&R ReportWorks SQL User Manual Page 39
Creating and Modifying Reports
You develop a report by specifying the arrangement and analysis of data from your database. The following sections explain how to create and manage Auto-SQL reports. For instructions on creating and managing User-SQL reports, see Chapter 16, "Creating User-SQL Reports."
Chapter 2: Managing Reports
R&R ReportWorks SQL User Manual Page 40
Creating and Saving a Report
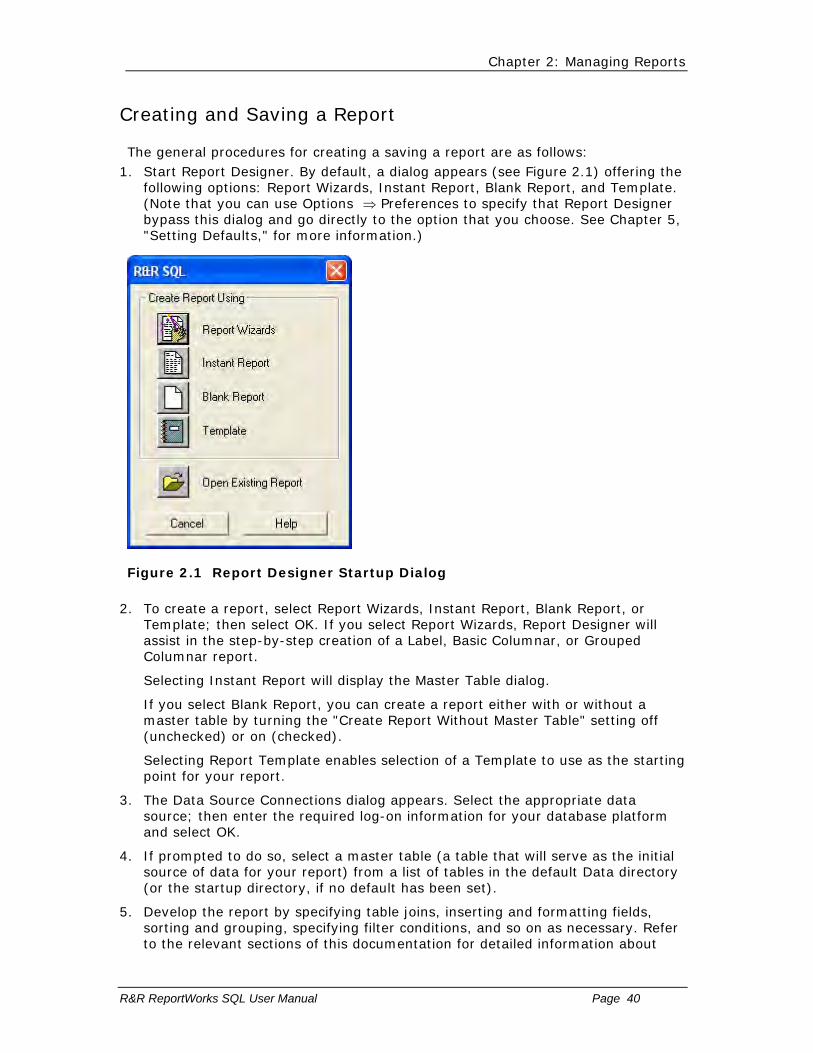
The general procedures for creating a saving a report are as follows: 1. Start Report Designer. By default, a dialog appears (see Figure 2.1) offering the
following options: Report Wizards, Instant Report, Blank Report, and Template. (Note that you can use Options ⇒ Preferences to specify that Report Designer bypass this dialog and go directly to the option that you choose. See Chapter 5, "Setting Defaults," for more information.)
Figure 2.1 Report Designer Startup Dialog
2. To create a report, select Report Wizards, Instant Report, Blank Report, or Template; then select OK. If you select Report Wizards, Report Designer will assist in the step-by-step creation of a Label, Basic Columnar, or Grouped Columnar report.
Selecting Instant Report will display the Master Table dialog.
If you select Blank Report, you can create a report either with or without a master table by turning the "Create Report Without Master Table" setting off (unchecked) or on (checked).
Selecting Report Template enables selection of a Template to use as the starting point for your report.
3. The Data Source Connections dialog appears. Select the appropriate data source; then enter the required log-on information for your database platform and select OK.
4. If prompted to do so, select a master table (a table that will serve as the initial source of data for your report) from a list of tables in the default Data directory (or the startup directory, if no default has been set).
5. Develop the report by specifying table joins, inserting and formatting fields, sorting and grouping, specifying filter conditions, and so on as necessary. Refer to the relevant sections of this documentation for detailed information about

Chapter 2: Managing Reports
R&R ReportWorks SQL User Manual Page 41
developing a report.
6. To save the report, select File ⇒ Save. Enter a name for the report. A report file name can have up to 250 characters, and the default file name extension is .RSW.

Chapter 2: Managing Reports
R&R ReportWorks SQL User Manual Page 42
Report Security
When you create a report you may want to limit the kind of modification and viewing access that users may have to that report. Before saving a report, you can use the File->Security command to set a Designer and/or a Runtime password for a report.
If a report has a runtime password, then any user who wishes to simply run the report must supply the correct runtime password.
If a report has a designer password, then any user who wishes to view or modify the report in the Report Designer must supply the correct designer password.
You may set either password or may set both passwords. If both are set, you can choose different passwords for each type of access.
This password may be up to 30 characters in length. There is not limit to which characters are used. Passwords are case-sensitive. When you enter a password, your input is masked on the display.
When a password(s) has been set in File Security, when the report is save (via Save or Save As) you will be asked to Verify the password(s) by re-entering it. The report will not be saved unless the password(s) correctly matches the password(s) that was set in File Security.
When you open a report in the report designer or at runtime that has a password set, you will be given a screen to enter to the password. This password must match the password that is saved in the report.
IMPORTANT NOTE OF CAUTION: Once a report is saved with a password, it can only be opened if that password is correctly entered.
There is no facility available to recover a lost password.
If you set a password for a report, it is strongly suggested that you print your Report Specifications before saving the report and keep this information in a secure place. Any Designer or Runtime password will be printing in the header area of the report specification. You will then have a record of the password(s) that has been set for the report.
Note that password information is NOT saved to the Report Librarian.
Reports with a saved password cannot be converted to any other format using the ReportWorks Report Converter.

Chapter 2: Managing Reports
R&R ReportWorks SQL User Manual Page 43
Using a Template to Create a Report
After you have created and saved a template, you can retrieve it to use as the basis for one or more reports.
To use a template to create a report, do the following: 1. Select File ⇒ New. On the startup dialog, select Template.
2. Report Designer lists the templates in the default template folder, if one has been defined (see Chapter 5, "Setting Defaults," for information about setting a default template folder). If the template file you want to use is in another location, first select the appropriate folder.
3. Select the template that you want to use as the starting point for your report and select OK.
If the template report was saved without a master table, you will be prompted to select a master table.
The report will then be opened as a new Untitled report rather then using the name of the selected template.
4. Modify the report definition as necessary. When you are done, select File ⇒ Save to save the report.
5. Enter a name for the report. A report name can have up to 250 characters, and the default extension is .RSW.

Chapter 2: Managing Reports
R&R ReportWorks SQL User Manual Page 44
Saving a Report Template
A report template is exactly the same as a regular report and can in fact be opened and saved as a regular report. Typically a template report is initially created as blank report and the Create report without master table box is checked. Design changes are then made (such as adding a company logo to the Page Header) and the report is saved to the directory that is set as the Default Template directory in Options->File Settings.
When you then create a new report using the Create Report Using Template option, R&R will display the available reports that are in the template directory as the default location. When you select a report that does not contain a master table, you are then prompted to select a master file because you are using the Open using Template option. And the new report will have an Untitled report name.

Chapter 2: Managing Reports
R&R ReportWorks SQL User Manual Page 45
Modifying Reports
After you have created and saved a report, you can open it, modify it, and run it at any time.
To open an existing report, do the following: 1. If a layout is currently displayed, save it if necessary. Select File ⇒ Open (or
press Ctrl+O). The names of the compound files (default extension RSW) and library files (extension RP6 for report libraries, RT6 for template libraries), if any, in the current location are listed.
2. If necessary, select another folder to display report files in a different location.
3. To open a report file, simply highlight the report name in the displayed list and select Open.
To open a report from a library, highlight the library name and select Open. Then highlight the report name and select OK.
The report you selected is opened and displayed. After modifying a report, you can re-save it in the current location or select/open another location in which to save it. Note that Version 9 and above no longer supports saving reports into .RP6 report libraries.
If the selected report was saved with a Designer password, you will be prompted to enter than password. The password you enter must match the saved password in order to open the report.

Chapter 2: Managing Reports
R&R ReportWorks SQL User Manual Page 46
Using Report Wizards
Report Wizards provide the capability of creating three common types of instant reports (Labels, Basic Columnar, or Grouped Columnar) without having to navigate through Report Designer’s menus and dialog boxes. The Wizard dialogs lead you through several simple steps in the preparation of each report type, giving you the opportunity to preview the report output.
To use the Report Wizards, select File ⇒ New and select "Report Wizards" on the New dialog. After you select a data source and a master table, the initial Report Wizard dialog appears (see Figure 2.2). To see sample output for each of the report types, right-click on the appropriate illustration.
Figure 2.2 Initial Report Wizard Dialog
To create a report using Report Wizards, do the following: 1. Click on the illustration of the report type you want to create (or tab to the
report type and press Enter).
2. Follow the instructions on the dialog box (or in the on-line help) for each step of developing the report.
To move from one dialog to the next, select the Next button at the bottom; to change selections in a previous dialog, select the Back button.
3. When you are done, select Finish.
4. If you left the "Preview the report when finished" setting on (the default), the report preview window appears; if you turned that setting off, the Report Designer layout window appears. If necessary, you can make additional changes to the report before printing.
5. Save the report.
The Report Wizards make use of the ReportScript mechanism (explained in Chapter 6 of the Developing Applications documentation) to pass a user-specified
Chapter 2: Managing Reports
R&R ReportWorks SQL User Manual Page 47
report specification to the main Report Designer executable. Visual Basic source code for the Report Wizards is available on request from Liveware Publishing Inc..; you can use this code to modify the Report Wizards or to create your own Wizards.
Chapter 2: Managing Reports
R&R ReportWorks SQL User Manual Page 48
Using the Label Wizard
Creating a report using the Label Wizard involves three steps:
• Selecting and Arranging Data
• Determining Printing Order
• Specifying Label Type or Dimensions.
The dialog box for each step has Help, Cancel, Back, Next, and Finish buttons at the bottom.
Step 1 in defining a label report involves selecting fields and placing them in the desired locations in the Label Format box.
In Step 2, you select one or more fields to establish the order in which report data will be sorted.
Step 3 enables you either to select a predefined Avery label type or to specify user-defined label dimensions.
Chapter 2: Managing Reports
R&R ReportWorks SQL User Manual Page 49
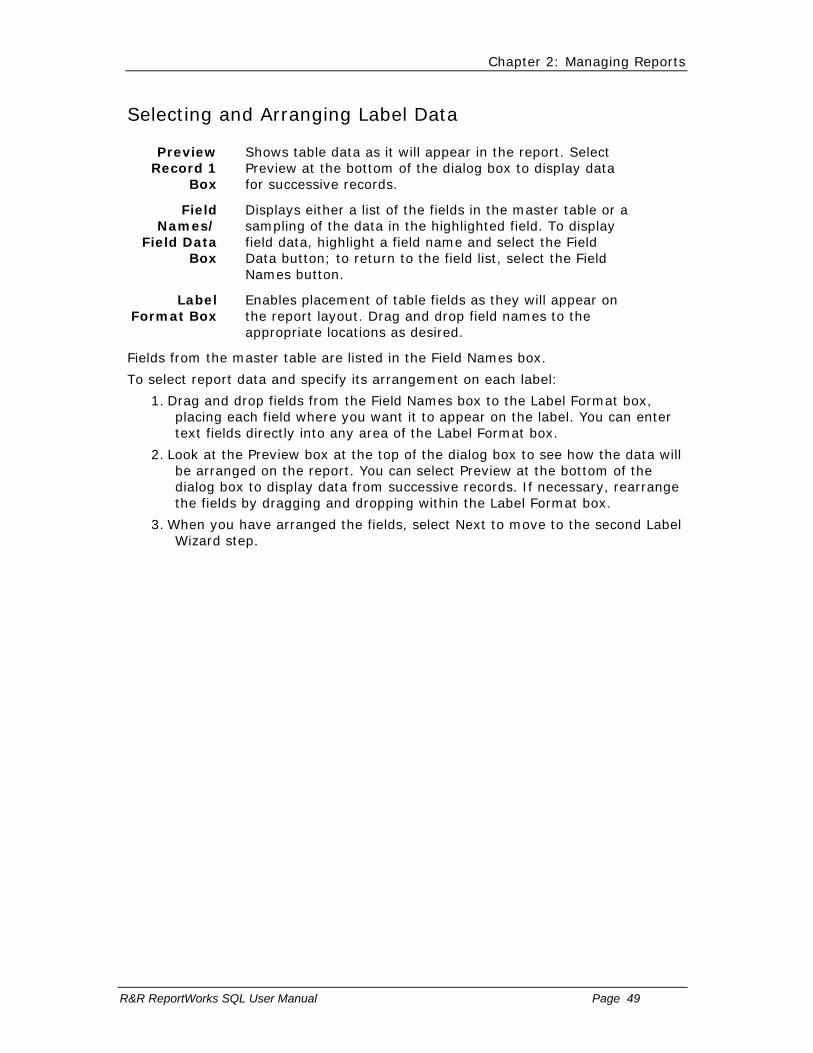
Selecting and Arranging Label Data
Preview Record 1
Box
Shows table data as it will appear in the report. Select Preview at the bottom of the dialog box to display data for successive records.
Field Names/
Field Data Box
Displays either a list of the fields in the master table or a sampling of the data in the highlighted field. To display field data, highlight a field name and select the Field Data button; to return to the field list, select the Field Names button.
Label Format Box
Enables placement of table fields as they will appear on the report layout. Drag and drop field names to the appropriate locations as desired.
Fields from the master table are listed in the Field Names box.
To select report data and specify its arrangement on each label:
1. Drag and drop fields from the Field Names box to the Label Format box, placing each field where you want it to appear on the label. You can enter text fields directly into any area of the Label Format box.
2. Look at the Preview box at the top of the dialog box to see how the data will be arranged on the report. You can select Preview at the bottom of the dialog box to display data from successive records. If necessary, rearrange the fields by dragging and dropping within the Label Format box.
3. When you have arranged the fields, select Next to move to the second Label Wizard step.

Chapter 2: Managing Reports
R&R ReportWorks SQL User Manual Page 50
Determining Printing Order
Field Names/
Field Data Box
Displays either a list of the fields in the master table or a sampling of the data in the highlighted field. To display field data, highlight a field name and select the Field Data button; to return to the field list, select the Field Names button.
Sort in Order
By Box
Drag and drop one or more fields into this box to specify the order in which records will be printed.
Order of 1st Sort Field
Box
Shows a sampling of the order in which data from the first Sort field will be arranged in the report.
To specify the order in which data from the selected fields will be arranged in your report:
1. Drag and drop one or more fields from the Field Names box to the Sort in Order By box. A sampling of sorted data from the first field is displayed in the Order of 1st Sort Field Box.
2. To change sort field selections, you can either highlight a field in the Sort in Order By box and select press Delete on the keyboard or select Clear to start over.
3. After establishing sort order, select Next to move to the next Label Wizard dialog box.
Chapter 2: Managing Reports
R&R ReportWorks SQL User Manual Page 51
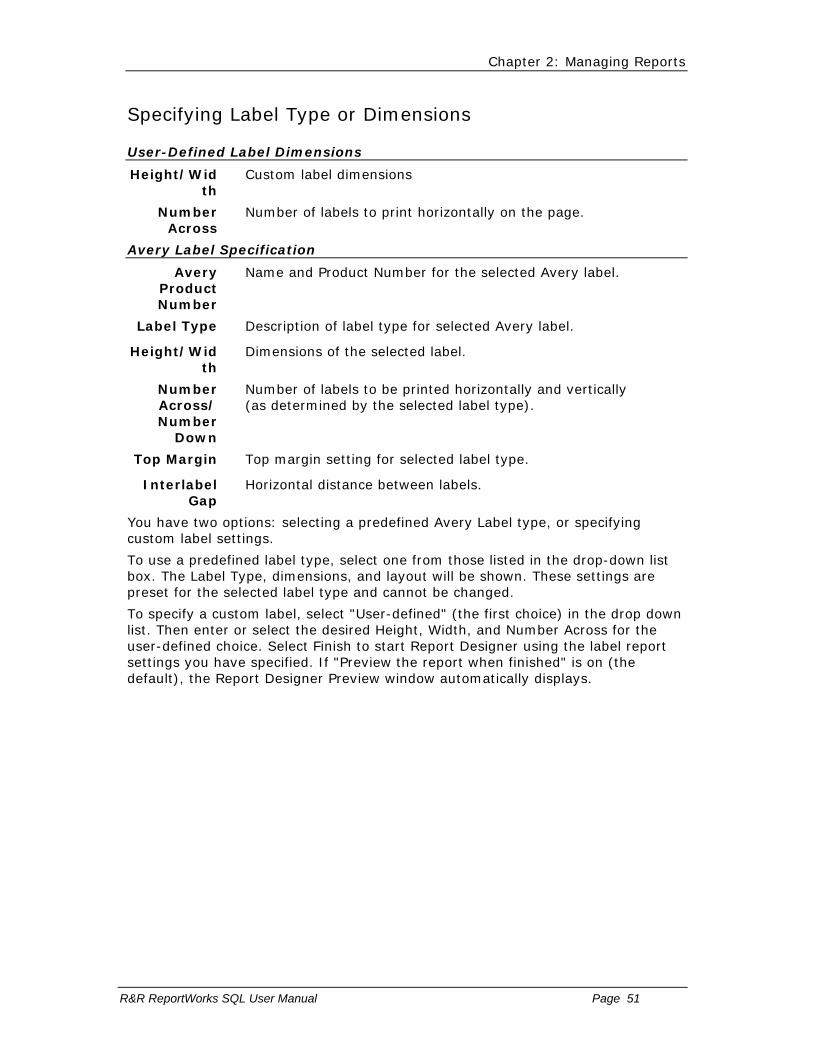
Specifying Label Type or Dimensions
User-Defined Label Dimensions
Height/Width
Custom label dimensions
Number Across
Number of labels to print horizontally on the page.
Avery Label Specification
Avery Product Number
Name and Product Number for the selected Avery label.
Label Type Description of label type for selected Avery label.
Height/Width
Dimensions of the selected label.
Number Across/ Number
Down
Number of labels to be printed horizontally and vertically (as determined by the selected label type).
Top Margin Top margin setting for selected label type.
Interlabel Gap
Horizontal distance between labels.
You have two options: selecting a predefined Avery Label type, or specifying custom label settings.
To use a predefined label type, select one from those listed in the drop-down list box. The Label Type, dimensions, and layout will be shown. These settings are preset for the selected label type and cannot be changed.
To specify a custom label, select "User-defined" (the first choice) in the drop down list. Then enter or select the desired Height, Width, and Number Across for the user-defined choice. Select Finish to start Report Designer using the label report settings you have specified. If "Preview the report when finished" is on (the default), the Report Designer Preview window automatically displays.

Chapter 2: Managing Reports
R&R ReportWorks SQL User Manual Page 52
Using the Basic Columnar Wizard
Creating a report using the Basic Columnar Wizard involves four steps:
Selecting and Arranging Data
Defining Totals
Determining Printing Order
Specifying Band Areas
The dialog box for each step has Help, Cancel, Back, Next, and Finish buttons at the bottom.
Step 1 in defining a basic columnar report involves selecting fields and placing them in the desired locations in the Report Format box.
In Step 2, you can define grand totals for any numeric fields you selected in Step 1.
In Step 3, you select one or more fields to establish the order in which report data will be sorted.
Step 4 enables you to specify which band areas will be included in the finished report.

Chapter 2: Managing Reports
R&R ReportWorks SQL User Manual Page 53
Selecting and Arranging Data
Field Names/
Field Data Box
Displays either field names for the master table or data for the highlighted field.
If field names are displayed, select the Field Data button below the list to display data for the currently highlight field.
If field data is displayed, select the Field Names button below the list to display field names.
Note that if a Report Dictionary file is available, the dictionary description for the highlighted field is shown just below the Field Data/Field Names button.
Report Format Box
Displays the column headings and fields as you have defined them for the report layout.
To select and arrange data for a basic columnar report:
1. Drag Fields (or double click) from the Field Names list to the Report Format box. If you drop a field over an existing field, the layout is adjusted by shifting the existing fields.
2. If "Use Field Names as Headings" is checked, the layout headings will initially be the same as the field names. You can either edit the existing headings or replace them.
3. Adjust the fields within the Report Format box as necessary. To remove a field or heading, you can simply drag it to the Trashcan.
4. When you are done arranging the data, select Next.

Chapter 2: Managing Reports
R&R ReportWorks SQL User Manual Page 54
Defining Totals
Numeric Fields
Highlight a numeric field in the drop-down list and select the total type: Sum, Average, Minimum, or Maximum.
To create a grand total for any of the numeric fields in your report:
1. Highlight the field name in the Numeric Fields drop-down list.
2. Select the total type from those displayed: Sum, Average (Avg), Smallest Value (Min), or Largest Value (Max). To turn off a totaling option after specifying one, highlight the field and select None.
3. After defining totals, select Next.

Chapter 2: Managing Reports
R&R ReportWorks SQL User Manual Page 55
Determining Printing Order
Field Names/
Field Data Box
Displays either field names for the master table or data for the highlighted field.
If field names are displayed, select the Field Data button below the list to display data for the currently highlight field.
If field data is displayed, select the Field Names button below the list to display field names.
Note that if a Report Dictionary file is available, the dictionary description for the highlighted field is shown just below the Field Data/Field Names button.
Sort in Order By
Drag and drop (or double-click) one or more fields from the Field Names list to specify the order in which data will appear in your report.
Order of 1st Sort Field
Shows a sampling of the order in which data from the first Sort field will be arranged in the report.
To specify the order in which data from the selected fields will be arranged in your report:
1. Drag and drop one or more fields from the Field Names box to the Sort in Order By box. A sampling of sorted data from the first field is displayed in the Order of 1st Sort Field Box.
2. To change sort field selections, you can highlight a field in the Sort in Order By box, and select press Delete on the keyboard. (You can also select Clear to start over.)
3. After establishing sort order, select Next to move to the next Wizard dialog box.

Chapter 2: Managing Reports
R&R ReportWorks SQL User Manual Page 56
Specifying Band Areas
Your report may have the following:
A Title area which prints once at the beginning of your report
A Summary area which prints once at the end of your report (and has the grand totals you specified)
A Group Header area for your group field and group headings
A Page Footer that prints at the bottom of each page
If you have specified totals, they will appear in the Group Footer (for group totals) and in the Summary area (for grand totals). Check the boxes under "Bands" to have Report Designer define these areas within your report. If a Band box is not checked, Report Designer will not define this area as part of your report.
Enter the title for your report within the area "Enter a Title Here". The Title Area also specifies the table used for your report (left justified) and today’s date (right justified). You can drag the table name and/or the date to the trash can if you do not want them printed as part of your report.

Chapter 2: Managing Reports
R&R ReportWorks SQL User Manual Page 57
Using the Grouped Columnar Wizard
Creating a report using the Basic Columnar Wizard involves four steps:
• Selecting and Arranging Data
• Defining Totals
• Determining Printing Order
• Specifying Band Areas
The dialog box for each step has Help, Cancel, Back, Next, and Finish buttons at the bottom.
Step 1 in defining a grouped columnar report involves selecting fields and placing them in the desired locations in the Report Format box.
In Step 2, you can define grand totals for any numeric fields you selected in Step 1.
In Step 3, you select one or more fields to establish the order in which report data will be sorted.
Step 4 enables you to specify which band areas will be included in the finished report.

Chapter 2: Managing Reports
R&R ReportWorks SQL User Manual Page 58
Selecting and Arranging Data
Field Names/
Field Data Box
Displays either field names for the master table or data for the highlighted field.
If field names are displayed, select the Field Data button below the list to display data for the currently highlight field.
If field data is displayed, select the Field Names button below the list to display field names.
Note that if a Report Dictionary file is available, the dictionary description for the highlighted field is shown just below the Field Data/Field Names button.
Group Header
Drag and drop a field from the Field Names list to serve as the field that will be used to group records in the report
Report Format Box
Displays the column headings and fields as you have defined them for the report layout.
To select and arrange data for a grouped columnar report:
1. Drag and drop a field from the Field Names list to the Group Header box. Report Designer will use the data in the field to group the records in your report.
2. Drag Fields (or double click) from the Field Names list to the Report Format box. If you drop a field over an existing field, the layout is adjusted by shifting the existing fields.
3. If "Use Field Names as Headings" is checked, the layout headings will initially be the same as the field names. You can either edit the existing headings or replace them.
4. Adjust the fields within the Report Format box as necessary. To remove a field or heading, you can simply drag it to the Trashcan.
5. When you are done arranging the data, select Next.

Chapter 2: Managing Reports
R&R ReportWorks SQL User Manual Page 59
Defining Totals
Numeric Fields
Highlight a numeric field in the drop-down list and select the total type: Sum, Average, Minimum, or Maximum.
To create a grand total for any of the numeric fields in your report:
1. Highlight the field name in the Numeric Fields drop-down list.
2. Select the total type from those displayed: Sum, Average (Avg), Smallest Value (Min), or Largest Value (Max). To turn off a totaling option after specifying one, highlight the field and select None.
3. After defining totals, select Next.
Chapter 2: Managing Reports
R&R ReportWorks SQL User Manual Page 60
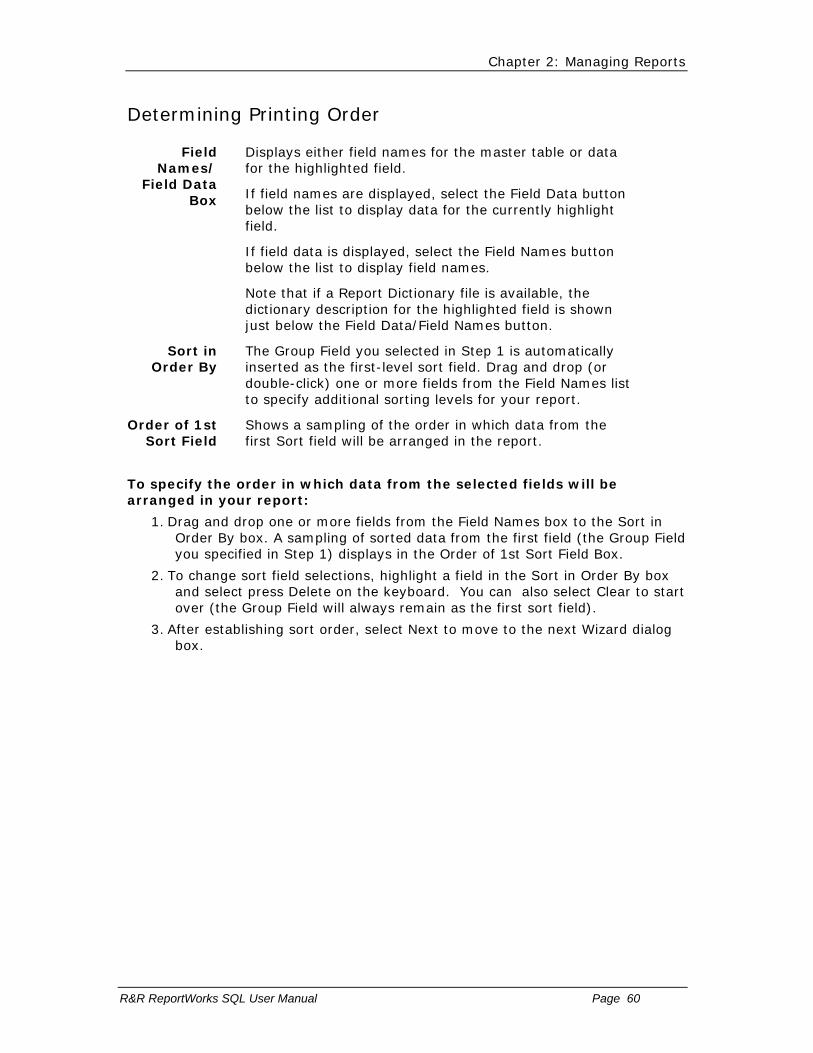
Determining Printing Order
Field Names/
Field Data Box
Displays either field names for the master table or data for the highlighted field.
If field names are displayed, select the Field Data button below the list to display data for the currently highlight field.
If field data is displayed, select the Field Names button below the list to display field names.
Note that if a Report Dictionary file is available, the dictionary description for the highlighted field is shown just below the Field Data/Field Names button.
Sort in Order By
The Group Field you selected in Step 1 is automatically inserted as the first-level sort field. Drag and drop (or double-click) one or more fields from the Field Names list to specify additional sorting levels for your report.
Order of 1st Sort Field
Shows a sampling of the order in which data from the first Sort field will be arranged in the report.
To specify the order in which data from the selected fields will be arranged in your report:
1. Drag and drop one or more fields from the Field Names box to the Sort in Order By box. A sampling of sorted data from the first field (the Group Field you specified in Step 1) displays in the Order of 1st Sort Field Box.
2. To change sort field selections, highlight a field in the Sort in Order By box and select press Delete on the keyboard. You can also select Clear to start over (the Group Field will always remain as the first sort field).
3. After establishing sort order, select Next to move to the next Wizard dialog box.

Chapter 2: Managing Reports
R&R ReportWorks SQL User Manual Page 61
Specifying Band Areas
Your report may have the following:
A Title area which prints once at the beginning of your report
A Summary area which prints once at the end of your report (and has the grand totals you specified)
A Group Header area for your group field and group headings
A Page Footer that prints at the bottom of each page
If you specify totals, they will appear in the Group Footer (for group totals) and in the Summary area (for grand totals). Check the boxes under "Bands" to have Report Designer define these areas within your report. If a Band box is not checked, Report Designer will not define this area as part of your report.
Enter the title for your report within the area "Enter a Title Here". The Title Area also specifies the table used for your report (left justified) and today’s date (right justified). You can drag the table name and/or the date to the trash can if you do not want them printed as part of your report.

Chapter 2: Managing Reports
R&R ReportWorks SQL User Manual Page 62
Documenting Reports and Templates
To document the content and layout of a report or template, you can add unique identifying information using the File Properties dialog, as well as display or print a report specification, which provides a complete description of the report or template.
The Report Librarianä utility program (RL.EXE) uses the information contained within a report specification and automatically updates a set of Report Librarian databases each time that a report is saved. You can then use Report Librarianä to manage and run reports

Chapter 2: Managing Reports
R&R ReportWorks SQL User Manual Page 63
Adding File Properties Information
Using File ⇒ Properties, you can add identifying information to a report such as author name, keywords, title, subject, and explanatory comments. This information is saved with the report.
To add or edit File Properties entries, do the following: 1. Open the report or template and select File ⇒ Properties. The report name is
shown at the top of the File Properties dialog (see Figure 2.3), originator of the current report is shown in the Author box, and the Title entry defaults to the full path and name of the report.
Figure 2.3 File Properties Dialog
2. In the Comments box, enter a text explanation (up to 255 characters) to be attached to the report or template.
3. The Author box shows the name of the current report’s author (if you are creating a new report, this defaults to your log-on name). Edit this entry as necessary.
4. In the Keywords box, enter one or more words that could be used with a file browser to locate this report file. Separate multiple keyword entries with spaces.
5. The Title entry defaults to the full path and name of the report; edit this entry as necessary.

Chapter 2: Managing Reports
R&R ReportWorks SQL User Manual Page 64
6. In the Subject box, enter a subject line identifying report content.
7. Select OK. When you save the report or template, the File Properties information is saved with it.

Chapter 2: Managing Reports
R&R ReportWorks SQL User Manual Page 65
Printing a Report Specification
To document the content and layout of the current report, you can display or print a complete description of it.
This report specification includes information about:
Header information
Report Writer and operating system version.
Unique report serial number (used by Report Librarian).
Report name and date/time last saved.
The R&R internal report version.
The report comment (if any).
Any Designer or Runtime Password.
The SQL SELECT statement;
Format information
� Print options including, report copies, page range and paper source.
� Page size, margins, orientation and ruler settings.
� Record layout information.
� Selected Export Options such as file name and export type.
Database information
� Names and locations of tables, text memo files, and image files used by the report;
Filter information
� Filter (if any);
� Field Information
� All fields in the composite record structure;
� Position, width, data type, format, font, trim setting, and color of all fields on the layout;
� Names and sizes of all fonts used in the report;
� Names, locations, sizes, and scaling settings of bitmapped images;
� For vertical and horizontal lines: size, thickness, and color;
� For boxes: size, border thickness and color, foreground and background color, number of included sides, and pattern;
� Names and expressions of all calculated, total, and ParameteRR fields;
� Field Data types of database fields used in the report;
� Line Information
� Any conditional line printing settings;
� Sort/Group Information

Chapter 2: Managing Reports
R&R ReportWorks SQL User Manual Page 66
� Sort/group field selections and settings;
� Regional Settings
Windows Regional settings in effect for the current report;
To print or display a detailed report specification: 1. Select File ⇒ Print. The Print dialog box appears.
2. In the "Print What" list box, select Report Specification.
3. Select Preview to display the report specification; select Print to send it to the currently selected printer (for printed output, Report Designer uses a fixed-pitch font on the current printer).

Chapter 3 Working with Bands
Introduction (Working with Bands)
This chapter explains how to create band areas; insert, move, and copy band lines; and specify and modify band line properties. This information is presented in the following sections:
Creating Bands and Inserting Band Lines
Manipulating Band Lines
Modifying Band Line Characteristics
Specifying Conditional Line Printing

Chapter 3: Working with Bands
R&R ReportWorks SQL User Manual Page 68
Selecting Band Lines
To work with one or more band lines, you must first select the line or lines you want to operate on. For example, to apply a particular font to all the fields on several lines, you select the lines and then apply the appropriate font to them as a group. When a line is selected, the line type indicator in the Band Area is highlighted.
With the mouse: Click on the appropriate line in the Band Area. To select multiple lines, Ctrl-click on each line. If the lines are contiguous, drag the mouse up or down in the Band Area until all lines are highlighted.
From the keyboard: Position the cursor on a line and press Shift+Spacebar to select it. To extend the selection to other lines, press ↑ or ↓. After marking the line(s), press Enter. When you are finished working with the selected lines, press Esc to unmark them.
Chapter 3: Working with Bands
R&R ReportWorks SQL User Manual Page 69
Displaying the Band Line Properties Dialog
You access most band line settings through the Band Line Properties dialog box. To display this dialog to format a single line, either select the line you want to modify and select Format ⇒ Properties (or press F9) or right-click on the line in the Band Area and select "Properties" from the menu.
If you select multiple lines to modify, you must select Format ⇒ Properties (or press F9), since right-clicking and then selecting "Properties" displays the Band Line Properties dialog for a single line only.
Chapter 3: Working with Bands
R&R ReportWorks SQL User Manual Page 70
Creating Bands and Inserting Band Lines
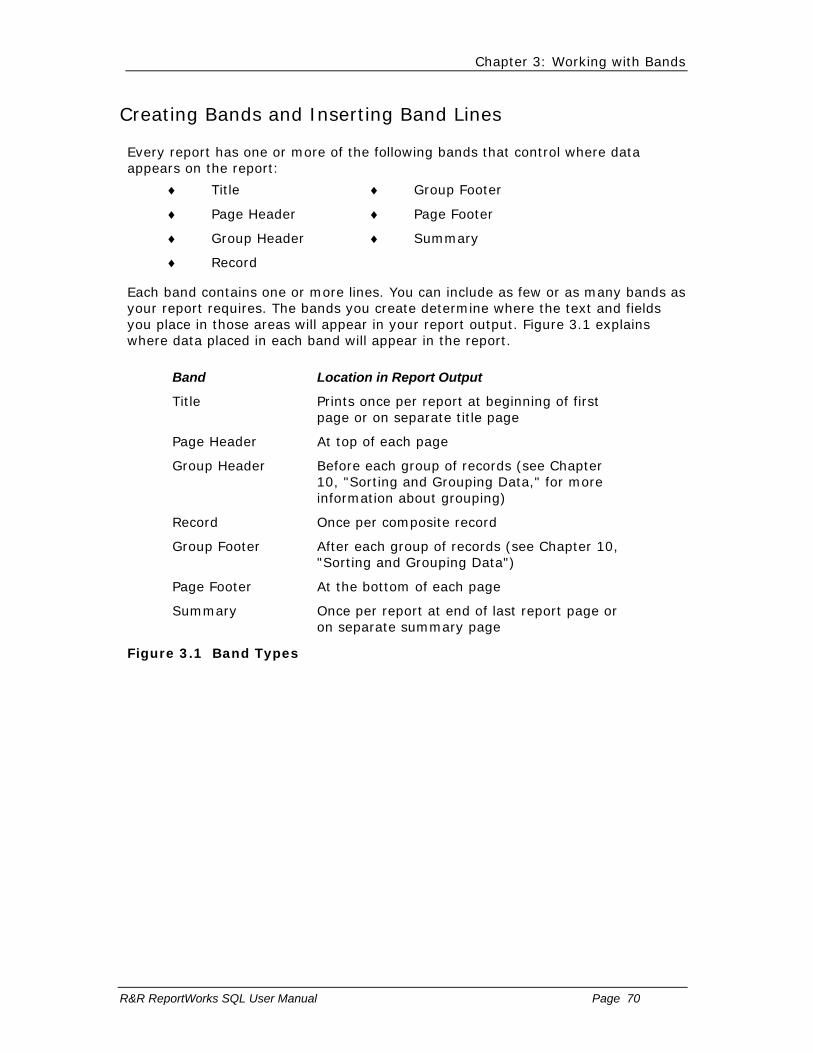
Every report has one or more of the following bands that control where data appears on the report:
♦ Title ♦ Group Footer
♦ Page Header ♦ Page Footer
♦ Group Header ♦ Summary
♦ Record
Each band contains one or more lines. You can include as few or as many bands as your report requires. The bands you create determine where the text and fields you place in those areas will appear in your report output. Figure 3.1 explains where data placed in each band will appear in the report.
Band Location in Report Output
Title Prints once per report at beginning of first page or on separate title page
Page Header At top of each page
Group Header Before each group of records (see Chapter 10, "Sorting and Grouping Data," for more information about grouping)
Record Once per composite record
Group Footer After each group of records (see Chapter 10, "Sorting and Grouping Data")
Page Footer At the bottom of each page
Summary Once per report at end of last report page or on separate summary page
Figure 3.1 Band Types

Chapter 3: Working with Bands
R&R ReportWorks SQL User Manual Page 71
Creating a Band
To create a band, select Insert ⇒ Create Band Line, press Ctrl+F11, or double-click in the Band Area to display the Create Band Line dialog (see Figure 3.4). Then do the following:
1. In the "Number to Create" box, enter the number of lines you want to insert in the band area you are creating.
Figure 3.4 Create Band Line Dialog Box
2. Choose the Line Placement radio button. If you opened the dialog from a selected band line, then you can choose to create the new line(s) above or below the current line. Or you can choose the select band button. When select band is enabled, the buttons in the Line Type frame will be active.
3. Select a band line type for the new band line(s). To determine the appropriate band type based on where you want the data to appear in the report, refer to Figure 3.1.
4. If you want to specify any additional band line properties such as height or any special conditions, check the Define Additional Band Line Properties checkbox at the bottom of the dialog.
5. Select Create. Report Designer inserts the line or lines of the specified type in the appropriate place on the layout. If the Define Additional Properties box was checked, the Band Line Properties dialog will be immediately displayed.
6. If you have enabled Colored Bands/Preview on the Preferences dialog, the Band Area of the report layout displays color-coding as well as the name of

Chapter 3: Working with Bands
R&R ReportWorks SQL User Manual Page 72
the band type. Note that the name of the Band type displays only once and will be on the bottom-most band line of that type. Color-coding, however, extends to all of the band lines of that type.
Band Type Color
Title Pink
Page Header Dark pink
Group 1 Header Peach
Group 2 Header Chartreuse
Group 3–8 Header Yellow
Record Light gray
Group 3–8 Footer Light green
Group 2 Footer Green
Group 1 Footer Dark green
Summary Light pink
Page Footer Light blue

Chapter 3: Working with Bands
R&R ReportWorks SQL User Manual Page 73
Inserting Single Band Lines
To insert lines one at a time in the current band: 1. Position the edit cursor in the band where you want to add the line(s).
2. Select Insert ⇒ Band Line (or press Shift+F11).
Report Designer inserts a new line of the same band type above the current line. Repeat this procedure to add additional lines to the current band.
Chapter 3: Working with Bands
R&R ReportWorks SQL User Manual Page 74
Inserting Multiple Band Lines
To insert multiple lines in any band on the layout: 1. To insert the new lines above or below an existing line, position the edit
cursor on that line.
2. Select Insert ⇒ Create Band Line (or press Ctrl+F11) to display the Create Band Line dialog (see Figure 3.4).
3. In the "Number to Create" edit box, enter or select the number of new lines you want to insert in a single location.
4. In the "Line Placement" group box, select one of the option buttons to indicate where you want to insert the new lines:
Above Current Line inserts the new line(s) above the current line.
Below Current Line inserts the new line(s) below the current line.
Select Band allows you to select a specific band in which to insert the new line(s), regardless of the current line. Select a band type from the drop-down list.
If you select a band type that currently exists on the layout, Report Designer inserts the new line(s) below the last line in that band.
If you select a band type that does not exist on the layout, Report Designer adds the band to the report and inserts the specified number of lines.
5. Check the Define Additional Band Line Properties box if you want to specify any special conditions for the new lines.
6. Select OK to insert the new line(s).
Report Designer inserts the new line(s) in the location you indicated.

Chapter 3: Working with Bands
R&R ReportWorks SQL User Manual Page 75
Inserting Page Breaks
To insert page breaks in your report, you use the Create Band Line dialog to place a new-page line where you want the break to occur. You can place a new-page line anywhere on the layout; note, however, that Report Designer ignores new-page lines in certain bands, such as a Page Header/Footer or a swapped Group Header/Footer (see Chapter 10, "Sorting and Grouping Data," for information on swapped Headers and Footers).
Figure 3.5 explains where you should insert new-page lines to produce page breaks in the appropriate places.
Position of New-Page Line on Report Layout
Resulting Page Break in Report
Last line in Title band After title
Last line in Group Footer band After group
Last line in Record band After each record
First line in Summary band Before summary
Figure 3.5 Common Locations for New-Page Lines
To insert a page break, do the following:
1. Select Insert ⇒ Create Band Line (or press Ctrl+F11).
2. In the Line Placement group box, specify where you want the new-page line to be inserted (Above Current Line, Below Current Line, or in a selected band area).
3. Check the Define Additional Band Line Properties box at the bottom of the dialog;
4. Press Create to create the line and open the Band Line Properties dialog.
5. Turn on the "New Page Line" setting on the Type tab; an X appears in the box indicating that the line will be made is a new-page line.
6. Select OK. Report Designer inserts a dashed line in the specified area of your report layout, indicating a page break.
You can move, copy, or delete a new-page line like any other line on a report layout.
You can also produce conditional page breaks by assigning a logical control field to a new-page line. For example, if some of your purchase orders require an additional page for footnotes and others do not, you can specify that the inserted new-page line will cause a page break only when the control field contains a specified value. For more information on how to use logical control fields, see the section Specifying Conditional Line Printing in this chapter.
Chapter 3: Working with Bands
R&R ReportWorks SQL User Manual Page 76
Manipulating Band Lines
After you have created bands and inserted additional lines as needed, you can copy or move one or more lines (and all fields on those lines) to other locations on the layout; you can also delete band lines.

Chapter 3: Working with Bands
R&R ReportWorks SQL User Manual Page 77
Copying or Moving Band Lines
To copy or move one or more lines (and all fields currently on those lines), do the following:
1. Select the line or lines to be copied or moved. To copy the lines, select Edit ⇒ Copy or the Copy button (or press Ctrl+C). To move the lines, select Edit ⇒ Cut or the Cut button (or press Ctrl+X).
2. Position the edit cursor where you want to copy or move the lines. Select Edit ⇒ Paste Lines or the Paste button (or press Ctrl+V).
Figure 3.6 Paste Lines Dialog
3. The Paste dialog (see Figure 3.6) presents the following options: Above Current Line, Below Current Line, and Select Band. Selecting Above or Below pastes the line(s) either above or below the current line. The band type of the pasted lines will be the same as that of the current line.
Choosing Select Band lists all available band types. If you select a band type that currently exists on the layout, the pasted lines will be appended to that band. If the band type does not exist, Report Designer will create the band and paste the lines there.

Chapter 3: Working with Bands
R&R ReportWorks SQL User Manual Page 78
Deleting Band Lines
Deleting differs from cutting in that you cannot then Paste the line or lines elsewhere on the report. If you delete lines by mistake, however, you can select Edit ⇒ Undo Last Clear (Ctrl+Z) or select the Trashcan button again to re-insert the lines in their original position.
Use any one of the following methods to delete one or more lines (and all fields on the line or lines):
Select the lines and select Edit ⇒ Clear;
Select the lines and select the Trashcan button ( );
Select the lines and press the Delete key.

Chapter 3: Working with Bands
R&R ReportWorks SQL User Manual Page 79
Modifying Band Line Characteristics
After you have created and inserted band lines, you can modify the following characteristics of those lines:
Justify all fields on selected line(s);
Trim blank space between fields;
Specify Automatic or Freeform line height.
The following sections explain how to perform these procedures.

Chapter 3: Working with Bands
R&R ReportWorks SQL User Manual Page 80
Justifying All Fields on One or More Lines
You can position (or justify) all the fields on one or more lines as a unit, without changing the spacing between the fields.
To justify all the fields on one or more lines: 1. Select the lines you want to justify. The lines need not be contiguous — for
example, you can click on Line 1 and then Control-click Lines 2, 4, and 7 to select them.
2. Select Format ⇒ Band Line Justify to display the Band Line Justify dialog.
3. Select Left, Center, or Right justification and then select OK. Report Designer justifies the fields within the margins of your report.
If any line you justify contains only a single field or a single series of trimmed fields, the format of that field or series of fields will also be set to the specified alignment, so that the data will be appropriately aligned within the field width.
For example, if you select Center to center a line containing a single field, the format of that field will be changed to centered. If you center a line that contains a series of trimmed fields, the format of the first field in this series will be changed to centered. Since the format of the first field controls the behavior of the entire series of fields, the trimmed data from all the fields will be centered within the fields’ collective width.
Note that if more than one record is being printed horizontally across the page, justification of Record lines is based on the record width rather than the right margin. See Chapter 14, "Printing Reports," for information about printing multiple records across the page.

Chapter 3: Working with Bands
R&R ReportWorks SQL User Manual Page 81
Controlling Automatic Trim
To control whether Report Designer removes or retains blank space between fields on selected lines in your report, select one of the Trim settings on the Alignment tab. To access the Trim settings, select the field and press F9 to display the Properties tabbed dialog; then select the Alignment tab.
When you specify "Print at End of Previous Field," Report Designer removes blank space (other than space inserted in text fields by means of pressing the spacebar) between the beginning of a field and the end of the previous field on that line. When you specify "Print at Field Position," Report Designer retains blank space between the fields. The default value is "Print at Field Position."
To apply automatic trim to one or more fields on a line or to remove it from a field or fields:
1. Select the fields whose trim you want to control.
2. Press F9 (or select Format ⇒ Properties). Select the Alignment tab.
3. In the Trim box, select "Print at Field Position" to retain blank spaces between adjacent fields (the default); select "Print at End of Previous Field" to remove blank spaces between adjacent fields.
4. Select OK.

Chapter 3: Working with Bands
R&R ReportWorks SQL User Manual Page 82
Auto-Trim Examples
The ability to trim blank space allows you to place fields on the report layout so that they will not be separated by spaces. For example, if you have specified "Print at End of Previous Field" as the trim setting, PAGE·999 on a report layout will print as PAGE 2 instead of PAGE 2. Also, when the trim setting is "Print at End of Previous Field," first- and last-name fields on a line will print without space between them. For example, <xxxxxxxxxxxx·<xxxxxxxxxx will print as William Hickock instead of William Hickock.

Chapter 3: Working with Bands
R&R ReportWorks SQL User Manual Page 83
Auto-Trim and Field Alignment
When you place a series of fields so that they will trim, these fields become a single field for the purposes of field alignment. The entire series of fields takes on the alignment (that is, left-aligned, centered, or right-aligned) of the first field in the group.
For example, if you have a series of fields on a Title line, the alignment of these fields within their collective field width depends on the alignment of the first field. If it is centered, the trimmed data from all the fields will be centered within the fields’ collective width. You can then use the Format ⇒ Band Line Justify "Center" setting to center this series of fields between the margins of the page. The result will be a title that is centered on the report page, no matter what fonts are applied to the fields.
Chapter 3: Working with Bands
R&R ReportWorks SQL User Manual Page 84
Specifying Band Line Height
Report Designer provides two line height types: Automatic (the default) and Freeform. For any line with an Automatic height setting, Report Designer adjusts line height to accommodate the largest font on the line. For a Freeform line, you can either specify a height on the Band Line Properties dialog or adjust line height as necessary on the layout.
To specify the height of any line(s) in your report, select the line or lines and open the Band Line Properties dialog (see Figure 3.7). Select the appropriate item (Automatic or Freeform) in the Height group box.
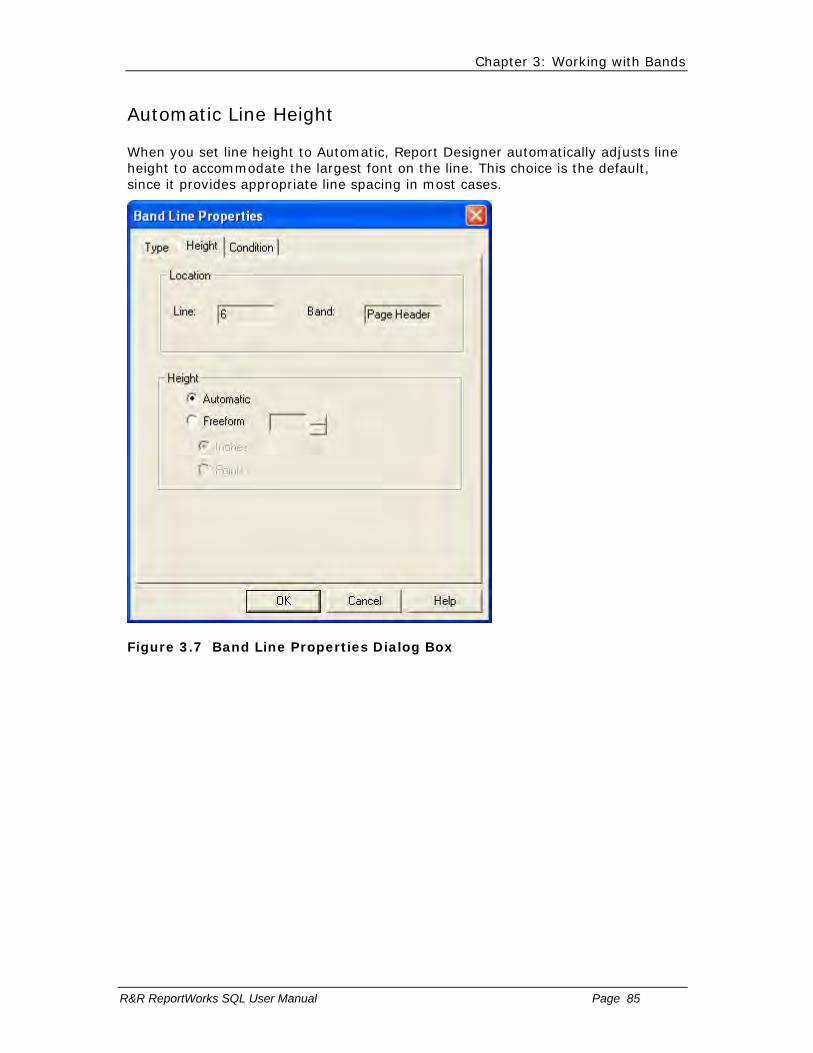
Chapter 3: Working with Bands
R&R ReportWorks SQL User Manual Page 85
Automatic Line Height
When you set line height to Automatic, Report Designer automatically adjusts line height to accommodate the largest font on the line. This choice is the default, since it provides appropriate line spacing in most cases.
Figure 3.7 Band Line Properties Dialog Box

Chapter 3: Working with Bands
R&R ReportWorks SQL User Manual Page 86
Freeform Line Height
For any line with a Freeform height setting, you can specify a line height in inches or points on the Band Line Properties dialog. On the layout, a Freeform line is indicated by up and down arrows in the Line Status Area (the narrow channel at the right edge of the Band Area).
Freeform lines are useful for areas of a report where you plan to insert images, since you can adjust the height of the line to accommodate any image you insert on it. (Note that a Freeform line will not expand to accommodate an image or a word-wrapped field placed on it; you must specify a Height for the Freeform line that is sufficient for the maximum number of lines that the image or word-wrapped field will occupy in the report output.)
Switching Between Freeform and Automatic
You can change a line’s type from Automatic to Freeform or from Freeform to Automatic using either of the following methods.
Select one or more lines and select Format ⇒ Properties (or press F9). On the Band Line Properties dialog, select Freeform in the Height group box and enter or select the appropriate line height. Then select OK.
Select one or more lines and select the Auto/Freeform Line button on the
Formatting Toolbar ( ). For a single selected line, this button acts as a toggle — a Freeform line becomes Automatic, and an Automatic line becomes Freeform.
If you selected multiple lines, selecting the Auto/Freeform Line button will have one of the following results:
♦ If all selected lines are Automatic, they become Freeform.
♦ If all selected lines are Freeform, they become Automatic.
♦ If the selected lines are a mixture of Automatic and Freeform, they all become Automatic.
Adjusting the Height of a Freeform Line
You can adjust the height of a Freeform line in either of two ways:
To size a Freeform line on the layout, click and hold on the top or bottom arrow in the Line Status area; the cursor changes to an arrow (either or depending on whether you clicked on the top or bottom of the line). Drag the cursor up or down as necessary to increase or decrease the line height; when the line is the desired height, release the mouse.
To size a Freeform line to an exact measurement in inches or points, open the Band Line Properties dialog (either right-click on the line and select Properties or select multiple lines and press F9). In the Band Line Properties dialog, select Inches or Points in the Height box; then select a measurement. Note that if Format ⇒ Snap to Grid has been enabled, Freeform line heights can be set only to the current grid increments. For finer control, turn off Snap to Grid before adjusting line height.
Chapter 3: Working with Bands
R&R ReportWorks SQL User Manual Page 87

Chapter 3: Working with Bands
R&R ReportWorks SQL User Manual Page 88
Specifying Conditional Line Printing
To print a line or lines only under certain conditions, select a control field from the Logical Field list box on Condition tab of the Band Line Properties dialog by using the [..] to display the Select Logical Field dialog. This setting enables you to use any field in the composite record structure (except a page total) as a control field to trigger line printing. Report Designer places a question mark in the Line Status area to indicate that a logical field has been assigned to control printing.
After selecting a control field, you can turn on either "Print When True" or "Print When False." If you specify "Print When True," the line or lines will print only when the control field contains a "true" value (see Figure 3.8). If you specify "Print When False," the line or lines print only when the control field contains a "false" value.
Data Type True Value False Value
Logical True False
Character Not empty Empty
Numeric Not empty, Non-zero Empty or zero
Date Not empty Empty
Memo Not empty Empty
Figure 3.8 Print Values for Control Fields
For example, in invoices that subtotal line item amounts before calculating tax, you might not want a subtotal to print if there is only one line item. In this case, you could suppress printing of the Group Footer line containing the SUBTOTAL field by proceeding as follows. First, create a total field called ITEMS, which counts the number of line items for each order. Next, create a logical calculated field called PRINT that controls printing of the subtotal Group Footer line. If the value in this field is true, the line will print. If the value is false, the line will be suppressed. The expression for this field is:
ITEMS>1
To assign the control field to the Group Footer line, select the line and open the Band Line Properties dialog. Open the Logical Field list box to display the names of all fields that can be used to control printing. Select PRINT; then select OK. When the report prints, the Group Footer line will print only when the value in the PRINT field is true, in other words only when the invoice contains more than one line item. (To specify that the line print only when the control field value is false, select "Print When False" on the Band Line Properties dialog.)
Although logical fields are typically used as control fields, you can use character, numeric, date, or memo fields as well. The value that triggers line printing varies depending on the data type of the control field you use, as Figure 3.8 illustrates.
To remove a logical condition, first select the line or lines. Select Format ⇒ Properties (or press F9); the name of the field assigned to control printing of the selected line(s) appears in the Logical Field box. Open the Logical Field list and select "None"; then select OK.
Note that you can create a logical field directly from the Line Properties dialog by

Chapter 3: Working with Bands
R&R ReportWorks SQL User Manual Page 89
clicking on the Calc. Field button below the Logical field control buttons.

Chapter 3: Working with Bands
R&R ReportWorks SQL User Manual Page 90
No records found Title band lines
By default, when a report is run and no records are found that meet the report conditions, R&R displays a "No Records Found" error dialog box rather than producing report output.
If you would rather produce a printed report when no records are found, you can create a Title band and on the Type tab of the Band Line Properties dialog you can check the Print only when no records are found box.
This checkbox that it available for Title band lines.
When this box is checked, the title band will print both in the designer and at runtime only when no records are found. This allows you display and print any on a no records found Title lines when no records are found that meet the report conditions. A no record found line is ignored when records are found.
When Print when No records found has been assigned to a Title line, Report Designer places a question mark (?) in the Line Status area for that line.
Chapter 4 Working with Fields
Introduction (Working with Fields)
This chapter explains how to insert, move, copy, and format fields in reports. This information is provided in the following sections:
Manipulating Fields
Applying Fonts, Styles, Effects, and Colors
Formatting and Sizing Fields
Specifying Alignment
Controlling Automatic Trim
Adding Total, Calculated, or ParameteRR Comments

Chapter 4: Working With Fields
R&R ReportWorks SQL User Manual Page 92
Selecting Fields
In order to modify fields that have been inserted on the layout, you must first select them. Follow these procedures to select a field or group of fields:
With the mouse: Click on the field to select it. To select additional fields, Control-click on each. If the fields to be selected are in the same section of the layout, you can also select them by dragging the mouse to form a rectangle that touches each field you want to select. (Note that the rectangle does not have to completely enclose the fields to be selected; as long as part of the rectangle touches a field, the field will be selected.)
From the keyboard: Tab to the field and press Spacebar to select it. To select additional fields, tab to each and press Ctrl+Spacebar to select.

Chapter 4: Working With Fields
R&R ReportWorks SQL User Manual Page 93
Methods of Applying Field Characteristics
After you have selected individual fields or groups of fields on a report layout, you can use either the Font and Properties dialogs or the Formatting Toolbar buttons to control the following characteristics:
� Font and point size;
� Font Style (regular, bold, italic), Effect (strike-out, underline), and Color;
� Field width and format;
� Alignment (left, center, right, justified);
� Automatic trim ("Print at Field Position" or "Print at End of Previous Field");
� For total, calculated, and ParameteRR fields, field Comment (a brief annotation attached to the field).
You can access the Font dialog in any of the following ways: select the field and press F5; select the field and select Format ⇒ Font; or right-click on the field and select Font.
Use any of the following methods to access the Properties tabbed dialog, which has tabs for Width/Format, Alignment, and Comment: select the field and press F9; select the field and select Format ⇒ Properties; or right-click on the field and select Properties.
You can quickly apply any font, font style, or alignment (except Word-wrap) using the Formatting Toolbar. Figure 4.1 shows the Formatting Toolbar options and identifies the purpose of each.
Figure 4.1 Format Options in Formatting Toolbar
Chapter 4: Working With Fields
R&R ReportWorks SQL User Manual Page 94
Manipulating Fields
After you have created bands by inserting band lines on your layout, you can insert or type fields on those lines. You can then copy or move a field or group of fields anywhere on the layout.
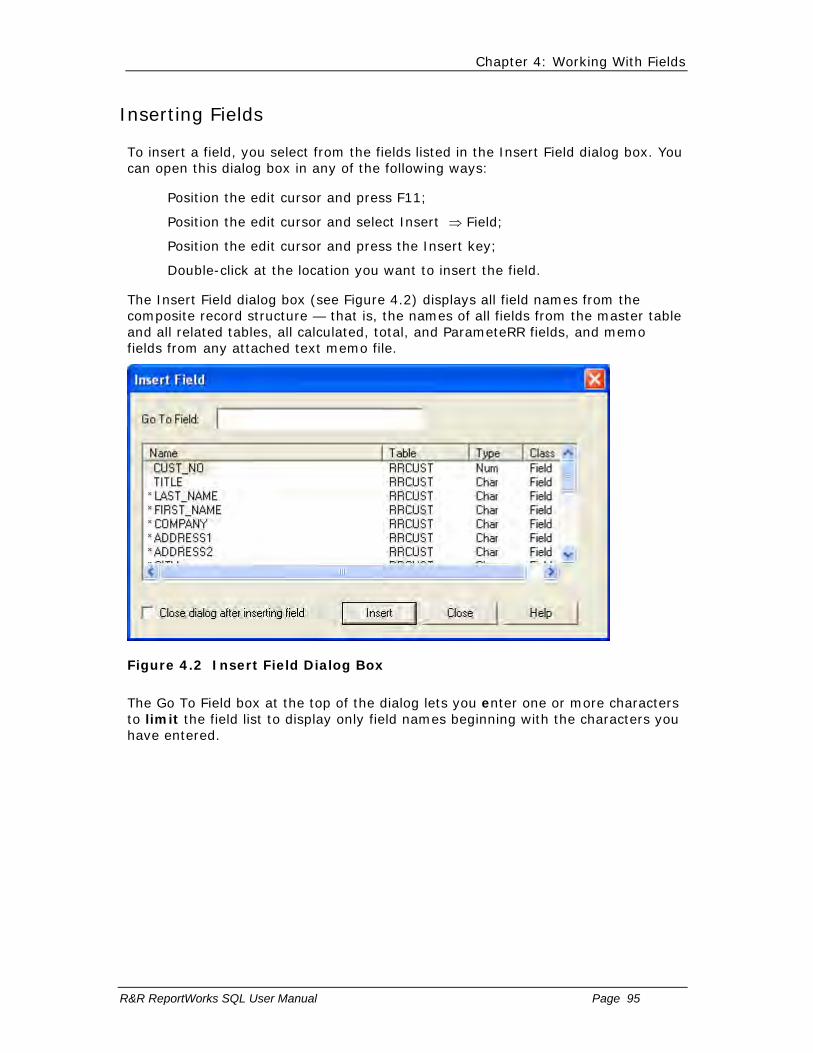
Chapter 4: Working With Fields
R&R ReportWorks SQL User Manual Page 95
Inserting Fields
To insert a field, you select from the fields listed in the Insert Field dialog box. You can open this dialog box in any of the following ways:
� Position the edit cursor and press F11;
� Position the edit cursor and select Insert ⇒ Field;
� Position the edit cursor and press the Insert key;
� Double-click at the location you want to insert the field.
The Insert Field dialog box (see Figure 4.2) displays all field names from the composite record structure — that is, the names of all fields from the master table and all related tables, all calculated, total, and ParameteRR fields, and memo fields from any attached text memo file.
Figure 4.2 Insert Field Dialog Box
The Go To Field box at the top of the dialog lets you enter one or more characters to limit the field list to display only field names beginning with the characters you have entered.

Chapter 4: Working With Fields
R&R ReportWorks SQL User Manual Page 96
Press backspace to clear the box and display all fields.
The field list section lists the name and description, table alias name, data type and class for each field that is available for placement of the report layout.
o An asterisk * before a field name indicates that the field is currently used within the report.
o Click on a column heading to sort the list by that column.
o Click on a sorted column heading to reverse the sort order.
o Click on a column header separator bar to resize a column.
o Use arrow keys or the scrollbars to scroll through the list.
o You can select a field name and then drag it from the list onto the report layout.
o Double-clicking on a field is the equivalent of pressing the Insert button.
By default, the Insert Field dialog will remain open after you have inserted a field to enable selection and insertion of several fields in succession. When you are finished inserting fields, select Close. To specify instead that the Insert Field dialog close after you have inserted a field, click the check box next to "Close Dialog After Inserting Field." As a result, the Insert Field dialog will close after you select and insert a field.
To include text in a report (for example, to insert column headings), simply position the cursor where you want the text to begin and type it. You can edit existing text on the layout by selecting it and then using the F2 function key. For large text selections, create a separate text file and attach it to your report as a text memo file (see Chapter 19, "Creating Form Letter Reports," for information about creating and attaching a text memo file).

Chapter 4: Working With Fields
R&R ReportWorks SQL User Manual Page 97
Right Click Options
You can right click on anywhere on the report layout to bring up a popup menu of available options. If you right click after selecting a field on the layout, the available menu choices will operate on that selected field.
Figure 4.1 Right Click menu options
Command Purpose
Cut Removes the selected object and copies it to memory
Copy Copies the selected object to memory
Paste Pastes any objects in memory to the current location
Clear Removes the selected object
Font… Available for text, database and R&R computed fields
Brings up the font dialog for the selected field
Expression… Available for calculated, total and parameteRR fields
Brings up the edit dialog for the selected field
Total… Available for text, database and R&R computed fields
Brings up a New Total with the current field selected as the target field to be totaled.
Dictionary Available for database and calculated fields that have been defined in the R&R Data Dictionary.
Brings up the dictionary Field Detail dialog where you can view and edit the current dictionary definition.
Properties… Brings up the Properties dialog for the selected field.

Chapter 4: Working With Fields
R&R ReportWorks SQL User Manual Page 98
Copying Fields
You can copy any field and insert the copy in a new position anywhere on the layout. To copy a field:
1. Select the field or fields you want to copy.
2. Select Edit ⇒ Copy or press Ctrl+C.
Report Designer copies and stores the selected fields.
3. To place the field copy, position the edit cursor at the new location.
4. Select Edit ⇒ Paste Objects or press Ctrl+V.
Report Designer pastes the copied fields at the cursor position.
When you copy a field, the original field remains in position. The field copy retains all characteristics (width, format, font, and attribute) of the original. You can change any of these characteristics for the copy without affecting the original.

Chapter 4: Working With Fields
R&R ReportWorks SQL User Manual Page 99
Moving Fields
You can move any field or group of fields on the layout to another location. If you are moving multiple fields, the fields retain their positions relative to one another when you move them.
To move one or more fields:
1. Select the field or fields you want to move.
2. Move the field(s) in any of these ways:
♦ Drag the field(s) to the new location and release the mouse.
♦ Select Edit ⇒ Move Fields (or press F7). Use the cursor keys to position the field(s) at the new location; then press Enter.
♦ Select Edit ⇒ Cut (or press Ctrl+X). Position the edit cursor where you want to insert the field(s) and select Edit ⇒ Paste Objects (or press Ctrl+V).
Report Designer moves the field or group of fields to the new location. If you used drag-and-drop or Edit ⇒ Move Fields (F7), you can undo the move and return the field(s) to the original position by selecting Edit ⇒ Undo Last Move.
When you paste a group of fields, the alignment of the topmost field in the group determines the starting point of the paste location. If the topmost field is left-aligned, its left edge will be positioned at the edit cursor; if it is center-aligned, it will be centered on the edit cursor position; and if it is right-aligned, its right edge will be positioned at the edit cursor. The other fields in the group will maintain their positions relative to the topmost field.
Note that you may first have to insert additional lines in a band so that you can copy fields to a line or lines of the proper type.
Chapter 4: Working With Fields
R&R ReportWorks SQL User Manual Page 100
Deleting Fields
To delete one or more fields from the layout:
1. Select the field or fields you want to delete.
2. Delete the fields in any of these ways:
♦ Select Edit ⇒ Clear;
♦ Select the Trashcan button ( );
♦ Press the Delete key.
Deleting differs from cutting in that you cannot then Paste the fields elsewhere on the report. If you delete fields by mistake, however, you can select Edit ⇒ Undo Last Clear (Ctrl+Z) or select the Trashcan button again to re-insert the fields in their original positions.
NOTE Deleting database fields from the layout does not remove them from your database; they are simply erased from the report layout. Deleting calculated, total, and ParameteRR fields you created in Report Designer does not remove them from the composite record structure. You can use Field ⇒ Insert to replace any database, calculated, total, or ParameteRR field you deleted from the layout.

Chapter 4: Working With Fields
R&R ReportWorks SQL User Manual Page 101
Applying Fonts, Styles, Effects, and Colors
When you print a report, the text and data print in a particular type and size of print. This combination of typeface and type size is referred to as a font. Depending on the currently selected printer, you can access a range of fonts to vary the style and size of selected areas of your reports. For example, you could use a large font for report titles and a smaller font for record areas.
With many fonts you have the additional option of applying styles (bold and italic), effects (strikeout and underline), and color to further emphasize specific fields or areas of a report. By combining fonts, styles, effects, and colors, you can enhance the appearance and improve the readability of report output.

Chapter 4: Working With Fields
R&R ReportWorks SQL User Manual Page 102
Font Characteristics
When you apply fonts to fields in a report, you select fonts by typeface name (such as Times New Roman or Helvetica) and point size. The following characteristics of the fonts you select can affect the placement and alignment of fields in your report output.
Spacing and Pitch
Fonts that have characters of equal widths are called monospaced (or fixed-pitch) fonts. The character spacing of a monospaced font is expressed as pitch, the number of characters per horizontal inch. You can calculate the pitch of a monospaced font by dividing 120 by the point size. For example, the pitch of a typical 12-point Courier font is 10 (120/12 points = 10 pitch).
Fonts that have characters of different widths are called proportional fonts. Since a proportional font does not have a fixed number of characters per inch, it does not have an absolute pitch.
Point Size
A font’s point size refers to its height measured in points (1 point = 1/72 inch). For example, the body text of this manual is printed in a 12-point font; the distance from the top of the highest character to the bottom of the lowest character is 12 points (12/72 inch). Some fonts (referred to as bitmapped fonts) are available only in predetermined point sizes. Other fonts (often called scalable or outline fonts), such as TrueType fonts, are available in almost any point size.
Specifying Font, Styles, Effects, and Color
The range of fonts available to be applied to report fields depends on the current printer and the fonts installed for that printer. See your Windows documentation for information about selecting printers.
When a field is selected, its current font is identified by typeface name (for example, Times New Roman) in the Formatting Toolbar, and the size is shown in points. You can apply any font that is available on the current printer.

Chapter 4: Working With Fields
R&R ReportWorks SQL User Manual Page 103
Default Font Assignments
Initially, fields that you insert on the report layout are assigned either a 12-point Arial (TrueType) font or your default font and point size (if defaults have been specified using Options ⇒ Default Settings). If the current printer does not support your default font, Report Designer assigns the first font in the Font list for that printer.
You can use the Options ⇒ Default Settings dialog box to change Report Designer’s default font and point size assignments. Refer to Chapter 5, "Setting Defaults," for instructions. If you change the default font after creating a report, only those fields you insert after that change will be assigned the new default.

Chapter 4: Working With Fields
R&R ReportWorks SQL User Manual Page 104
Specifying Font and Point Size
To change the font and point size for one or more fields on the current report layout, do the following:
1. Select the field or fields you want to change.
2. Select Format ⇒ Font. Select a font from the Font menu (see Figure 4.3.
3. Select a point size from the Size list. If the font you selected is scalable and the point size you want is not displayed, enter the desired point size.
4. Select OK.
Figure 4.3. Font Dialog
Chapter 4: Working With Fields
R&R ReportWorks SQL User Manual Page 105
Specifying Styles and Effects
In addition to specifying size, with many fonts you can also apply bold, italic, strikeout, or underline (or a combination of these). Bold and italic styles are not available with all fonts; refer to your printer or font documentation for information about styles.
To apply one or more styles or effects, select a field or group of fields and select the B, I, and/or U button. You can also select Format ⇒ Font and choose a style from the Font Style list (Bold, Italic, or Bold Italic for most fonts, and Strikeout or Underline from Effects; then select OK.

Chapter 4: Working With Fields
R&R ReportWorks SQL User Manual Page 106
Specifying Color
The default color for any inserted field is black. You can specify a different field color either by setting a default color on the Default Settings dialog (accessed by selecting Options ⇒ Default Settings) or by applying a color to a field or group of fields. If you change the default, the new default color will be applied to any fields you add after making the change; however, fields currently on the layout are not affected.
To specify a color for a selected field or group of fields, do the following: 1. Select the field or fields and select Format ⇒ Font (or press F5).
2. Open the Color list box. Select a color from those listed.
3. Select OK; the color is applied to the selected field(s).
You must have a color printer in order to produce color output. If you apply colors to fields and then print the report on a monochrome printer, the printer will convert those colors either to black or to some level of gray scale (depending on the printer). For example, on most laser printers a field formatted as yellow will print light gray.

Chapter 4: Working With Fields
R&R ReportWorks SQL User Manual Page 107
Formatting and Sizing Fields
Field format refers to:
� The width of a character, memo, or logical field;
� The numeric format (currency, percentage, and so on) and number of integer and decimal places for numeric fields;
� The format and arrangement of month, day, and year for date fields;
� The format and arrangement of month, day, year, hours, minutes, and seconds for datetime fields.
A field’s format is usually displayed in the Status Bar when the field is highlighted. To change field format, use the Width tab (for character, memo, and logical fields) or Format tab (for all other field types) on the Field Properties tabbed dialog (select the field and press F9 to display the Properties tabbed dialog).
Any formats you apply affect only the way a field prints or displays; Report Designer uses unformatted field values in sorting, filters, totals, and calculations. For example, formatting a three-decimal-place numeric field to display only two decimal places will not cause Report Designer to ignore the thousandths value in sorts, filters, totals, and calculations that involve that field. Formatting a date field with an abbreviated format that doesn’t show the year will not cause Report Designer to ignore the year value if the field is used in a sort, filter, total, or calculation.

Chapter 4: Working With Fields
R&R ReportWorks SQL User Manual Page 108
Specifying Character, Memo, or Logical Field Width
When you first insert a character, memo, or logical field on the report layout, Report Designer assigns a field width based on the maximum width of the data in your database. If this field width is not appropriate for one or more fields, you can modify it either by sizing the field(s) directly on the layout or by using the Width tab on the Field Properties tabbed dialog.

Chapter 4: Working With Fields
R&R ReportWorks SQL User Manual Page 109
Sizing a Field on the Layout
To change the width of a character or memo field directly on the layout, select the field and drag one of the field "handles" either left or right as necessary to increase or decrease field width.
Chapter 4: Working With Fields
R&R ReportWorks SQL User Manual Page 110
Sizing a Field Using the Width Tab
To change the width of a character or memo field using the Properties tabbed dialog, select the field and press F9. On the Width tab, either select Characters and enter the maximum number of characters for the field data or select Inches (or Centimeters, depending on your Windows configuration) and enter the maximum width for the data.
The unit of measurement that you select — Characters or Inches/Centimeters — determines how the data in the field will print or display.
• If you specify field width in Characters, Report Designer will always print or display all of the data in the field up to the number of characters specified. As a result, the width of the field may vary depending on what font you have applied to it.
• If you specify field width in Inches (or Centimeters), Report Designer will always print or display the field up to that size, regardless of the width of the data itself. Any data that does not fit within the specified field width will be truncated (or wrapped, if word-wrap format has been applied).

Chapter 4: Working With Fields
R&R ReportWorks SQL User Manual Page 111
Specifying Date Formats
Report Designer provides 24 options for formatting dates. Figure 4.4 lists and gives examples of the basic date format options.
When you insert a date field on a new report layout, it is assigned the current Windows Regional date format. When you insert a date field on a previously saved report that you have retrieved for editing, the field is assigned the Windows Regional date format that was in effect when the report was saved. Note that you can change the default Regional date format by opening the report and then opening the Windows Control Panel and making a change that will cause the OK button to be enabled. When there is a Control Panel change while the report is open, the report inherits this new setting and will retain it when the report is saved.
Format Meaning Example
dd-mmm-yy Day-Month-Year 07-Mar-96
dd-mmmm-yyyy Day-Month-Year 07-March-1996
dd-mmm Day-Month 07-Mar
mmm-yy Month-Year Mar-96
mmm-yyyy Month-Year Mar-1996
mmmm d, yyyy Month Day, Year March 7, 1996
d mmmm yyyy Day Month Year 7 March 1996
mmmm yyyy Month Year March 1996
mmmm d Month Day March 7
d mmmm Day Month 7 March
mm/dd/yy Month/Day/Year 03/07/96
mm/dd/yyyy Month/Day/Year 03/07/1996
dd/mm/yy Day/Month/Year 07/03/96
dd/mm/yyyy Day/Month/Year 07/03/1996
dd.mm.yy Day.Month.Year 07.03.96
dd.mm.yyyy Day.Month.Year 07.03.1996
yyyy-mm-dd Year-Month-Day 1996-03-07
yy-mm-dd Year-Month-Day 96-03-07
mm/dd Month/Day 03/07
dd/mm Day/Month 07/03
dd.mm Day.Month 07.03
mm-dd Month-Day 03-07
Long Intn’l Windows Regional Long Format
Thursday, March 7, 1996

Chapter 4: Working With Fields
R&R ReportWorks SQL User Manual Page 112
Short Intn’l Windows Regional Short Format
3/7/1996
Figure 4.4 Date Formats
To change the format of a date field, select the field and press F9. On the Format tab, select from the menu displayed. A sample of the format you select is shown at the bottom of the dialog box. Select OK or Apply.
Note that display formats do not affect the sort order. Even if you have selected a date format that doesn’t show the year, Report Designer still sorts dates chronologically.
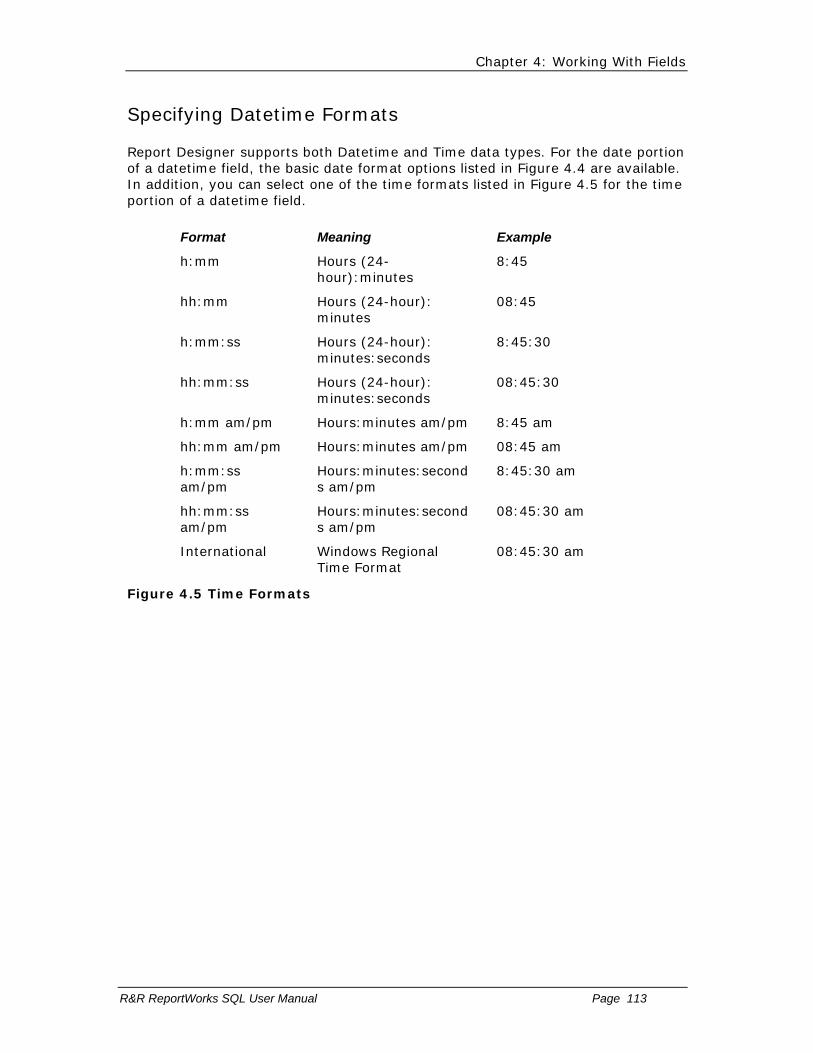
Chapter 4: Working With Fields
R&R ReportWorks SQL User Manual Page 113
Specifying Datetime Formats
Report Designer supports both Datetime and Time data types. For the date portion of a datetime field, the basic date format options listed in Figure 4.4 are available. In addition, you can select one of the time formats listed in Figure 4.5 for the time portion of a datetime field.
Format Meaning Example
h:mm Hours (24-hour):minutes
8:45
hh:mm Hours (24-hour): minutes
08:45
h:mm:ss Hours (24-hour): minutes:seconds
8:45:30
hh:mm:ss Hours (24-hour): minutes:seconds
08:45:30
h:mm am/pm Hours:minutes am/pm 8:45 am
hh:mm am/pm Hours:minutes am/pm 08:45 am
h:mm:ss am/pm
Hours:minutes:seconds am/pm
8:45:30 am
hh:mm:ss am/pm
Hours:minutes:seconds am/pm
08:45:30 am
International Windows Regional Time Format
08:45:30 am
Figure 4.5 Time Formats
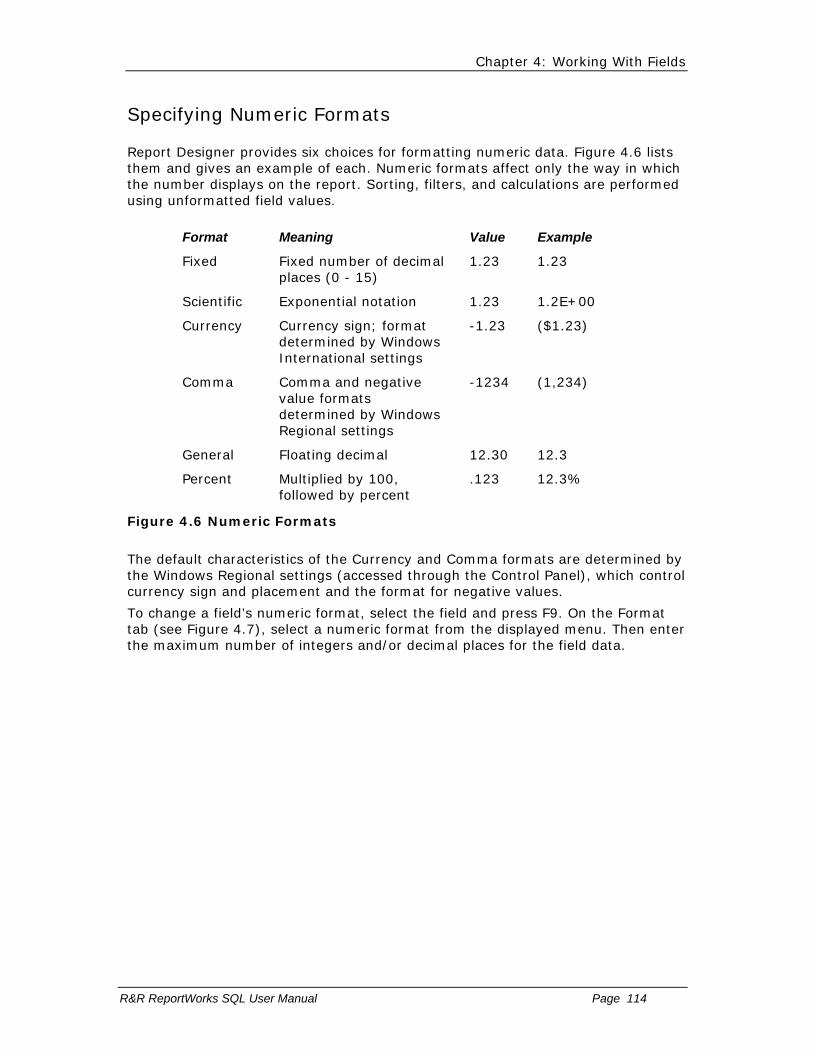
Chapter 4: Working With Fields
R&R ReportWorks SQL User Manual Page 114
Specifying Numeric Formats
Report Designer provides six choices for formatting numeric data. Figure 4.6 lists them and gives an example of each. Numeric formats affect only the way in which the number displays on the report. Sorting, filters, and calculations are performed using unformatted field values.
Format Meaning Value Example
Fixed Fixed number of decimal places (0 - 15)
1.23 1.23
Scientific Exponential notation 1.23 1.2E+00
Currency Currency sign; format determined by Windows International settings
-1.23 ($1.23)
Comma Comma and negative value formats determined by Windows Regional settings
-1234 (1,234)
General Floating decimal 12.30 12.3
Percent Multiplied by 100, followed by percent
.123 12.3%
Figure 4.6 Numeric Formats
The default characteristics of the Currency and Comma formats are determined by the Windows Regional settings (accessed through the Control Panel), which control currency sign and placement and the format for negative values.
To change a field’s numeric format, select the field and press F9. On the Format tab (see Figure 4.7), select a numeric format from the displayed menu. Then enter the maximum number of integers and/or decimal places for the field data.

Chapter 4: Working With Fields
R&R ReportWorks SQL User Manual Page 115
Figure 4.7 Format Tab for Numeric Field
When you select Fixed, Scientific, Currency, Comma, or Percent, you can also specify between 0 and 15 decimal places. Note that the number of integer places plus the number of decimal places cannot exceed 19.

Chapter 4: Working With Fields
R&R ReportWorks SQL User Manual Page 116
Show Zero Option
For any numeric format, you can turn the "Show Zero" option on or off. To print or display the value in the field, even if it is zero, turn on "Show Zero." To print or display spaces when a field value is zero, turn off "Show Zero." If the value in the field is blank, this option has no effect; that is, blank values always display and print as blank.
When "Show Zero" is turned off for a field, zero values are not included in counts and averages. Blank fields are never included.

Chapter 4: Working With Fields
R&R ReportWorks SQL User Manual Page 117
Leading Zeros Option
When you have selected Fixed as the numeric format and 0 as the number of decimal places, you can then turn the "Leading Zeros" option on or off. To display leading spaces, turn "Leading Zeros" off. For example, if you have 876 in a field of 5 integer places, Report Designer displays the number as 876. To change leading spaces to zeros, turn "Leading Zeros" on. For example, if you have 876 in a field of 5 integer places, Report Designer displays the number as 00876.
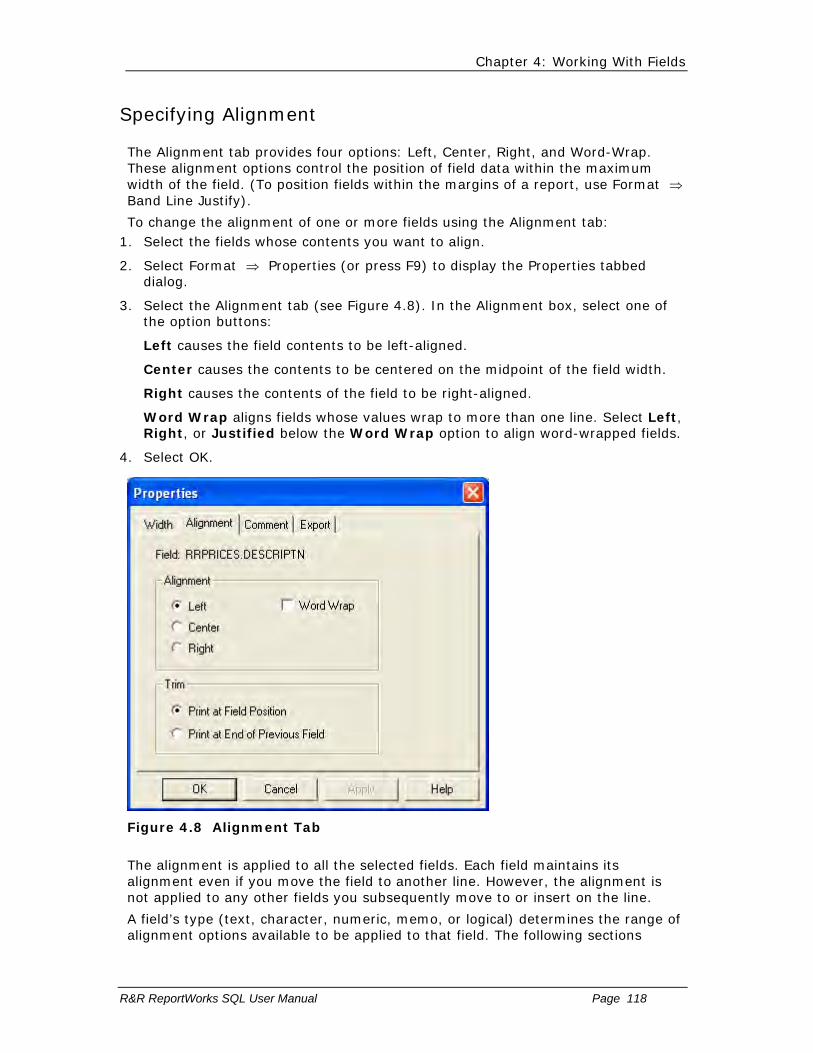
Chapter 4: Working With Fields
R&R ReportWorks SQL User Manual Page 118
Specifying Alignment
The Alignment tab provides four options: Left, Center, Right, and Word-Wrap. These alignment options control the position of field data within the maximum width of the field. (To position fields within the margins of a report, use Format ⇒ Band Line Justify).
To change the alignment of one or more fields using the Alignment tab: 1. Select the fields whose contents you want to align.
2. Select Format ⇒ Properties (or press F9) to display the Properties tabbed dialog.
3. Select the Alignment tab (see Figure 4.8). In the Alignment box, select one of the option buttons:
Left causes the field contents to be left-aligned.
Center causes the contents to be centered on the midpoint of the field width.
Right causes the contents of the field to be right-aligned.
Word Wrap aligns fields whose values wrap to more than one line. Select Left, Right, or Justified below the Word Wrap option to align word-wrapped fields.
4. Select OK.
Figure 4.8 Alignment Tab
The alignment is applied to all the selected fields. Each field maintains its alignment even if you move the field to another line. However, the alignment is not applied to any other fields you subsequently move to or insert on the line.
A field’s type (text, character, numeric, memo, or logical) determines the range of alignment options available to be applied to that field. The following sections
Chapter 4: Working With Fields
R&R ReportWorks SQL User Manual Page 119
explain the field alignment options and identify which ones are valid for each field type.
Chapter 4: Working With Fields
R&R ReportWorks SQL User Manual Page 120
Applying Left, Center, or Right Alignment
You can assign Left, Center, or Right alignment to text, date, and numeric fields. The alignment you specify determines how Report Designer calculates the starting or ending position of the field data on the printed report.
To specify alignment for a field, select the field and press F9 to display the Properties tabbed dialog. On the Alignment tab, select Left, Center, or Right; then select OK.

Chapter 4: Working With Fields
R&R ReportWorks SQL User Manual Page 121
Positioning of Left-Aligned Data
Report Designer starts printing a left-aligned field at the position occupied by the left edge of the field on the layout. For example, if the first letter of a left-aligned text field begins at two inches on the layout, Report Designer will start printing two inches from the left margin. Depending on the font applied, the position of the last character in the field data will vary.

Chapter 4: Working With Fields
R&R ReportWorks SQL User Manual Page 122
Positioning of Right-Aligned and Centered Data
Report Designer starts printing a right-aligned field so that it ends at the position occupied by the right edge of the field on the report layout. For example, if the last letter of a text field is at two inches on your layout, Report Designer will adjust the starting point of the text, depending on the field’s font, so that the field ends two inches from the left margin. The position of the first character in the field depends on the font applied to the field. Similarly, the position of data within centered fields is determined by the position of the middle character of the field value.

Chapter 4: Working With Fields
R&R ReportWorks SQL User Manual Page 123
Applying Word-Wrap Alignment
You can assign Word-wrap alignment to character, text memo, and logical fields. If you select Word-wrap format, data for that field will continue to print on subsequent lines after the data fills the field width on the first line.
To specify word-wrap alignment for a character, memo, or logical field, select the field and press F9. On the Alignment tab, select "Word-wrap" and specify whether the word-wrapped field will be left, right, or fully justified. Then select OK.
After you specify an alignment, the field symbol on the report layout changes to indicate the new alignment. Figure 4.9 lists the available alignment formats and their symbols and gives an example of each.
Alignment Symbol Example
Left < (Left Angle) <xxxxxxxxxxxxx New York
Center ^ (Circumflex) ^xxxxxxxxxxxxx New York
Right > (Right Angle) >xxxxxxxxxxxxx New York
Word-Wrap, Left Justify
« (Left Chevron) «mmmmmmmmmmmmm New York City is the largest city in the U.S.A.
Word Wrap, Right Justify
» (Right Chevron) »mmmmmmmmmmmmm New York City is the largest city in the U.S.A.
Word Wrap, Full Justify
= (Double Line) =mmmmmmmmmmmmm New York City is the largest city in the U.S.A.
Figure 4.9 Alignment Options
Chapter 4: Working With Fields
R&R ReportWorks SQL User Manual Page 124
Word-Wrap Format
Word-wrap is useful for formatting long character fields, which can be wrapped down the page or broken up into separate lines by inserting new-line characters as line terminators. Word wrap is also the default format for text memo fields and long character fields.
Word-wrap is controlled by the following rules:
� Any field that is on the same line as the word-wrapped field is printed in the column in which it has been placed on the layout. The positions of fields that do not extend beneath the word-wrapped field on subsequent lines are not affected.
� For word-wrapped fields in Page Header and Page Footer bands, Report Designer truncates the data to fit within the band area. For example, data for a word-wrapped field on line 2 of a 3-line Page Header wraps only for the remaining line. Data for fields placed on line 3 (the line below the word-wrapped field) is not printed, since the Page Header band is fixed in length.
� For word-wrapped fields in any other band, Report Designer prints all the data, inserting as many additional lines as necessary. The data continues to wrap from one line to the next within its field width until it is all printed.

Chapter 4: Working With Fields
R&R ReportWorks SQL User Manual Page 125
Aligning Multiple Fields
The Format menu has an Align item that allows you to align multiple selected objects on the report layout.
For example you could select 3 fields on 3 separate band lines and then choose Format->Align Left to move the first two selected objects to have the same left edge as the last selected object.
Chapter 4: Working With Fields
R&R ReportWorks SQL User Manual Page 126
Controlling Automatic Trim
By default, Report Designer will print or display a field in the position where it has been inserted on the layout. You can specify that Report Designer remove blank space (other than spaces inserted with the spacebar) between fields, regardless of how far apart those fields are on the line.
If you want two fields to print without intervening space, select the field on the right and press F9 to open the Properties tabbed dialog. In the Trim box at the bottom of the Alignment tab, select the "Print at End of Previous Field" option and select OK. When you print or display the report, the fields will have no space between them, even if they are separated by space on the report layout.
The ability to trim blank spaces enables you to eliminate space between fields whose data varies in width. For example, data from first- and last-name fields on the same line will print with no space between if you have selected "Print at End of Previous Field" for the last-name field.
You can include a single space between fields by inserting a text field consisting of one space and setting the trim for that field to "Print at End of Previous Field."

Chapter 4: Working With Fields
R&R ReportWorks SQL User Manual Page 127
Adding Total, Calculated, or ParameteRR Comments
You can enter a brief comment (up to 100 characters) to serve as a "plain English" explanation of a total, calculated, or ParameteRR field. When a field has a comment attached to it, that comment is displayed in the Status Bar when the field is highlighted.
(Note that if there is a report dictionary attached to the report, this tab displays the text of the report dictionary Comment field for any selected database field. Display of Comment text for database fields is read-only, however; you must use your database software to edit database field comments.)
To enter or edit a comment for a field, select the field and press F9. On the Comment tab, enter or edit the field comment in the Comment box. Then select OK or Apply.
You can also add or edit a comment for a field by selecting the Comment button on the Calculated Field, Total Field, or ParameteRR Field dialog.
See Chapter 7, "Working with Calculated Fields," Chapter 8, "Working with Total Fields," and Chapter 9, "Working with ParameteRR Fields" for more information about field expressions and comments.

Chapter 5 Setting Defaults
Introduction (Setting Defaults)
This chapter explains how to change default settings — settings that Report Designer uses automatically unless you override them for each report. This chapter includes the following sections:
Changing Display Preferences
Changing Layout and Formatting Settings
Specifying Default Directories and Extensions
Changing Data Source Defaults
Changing Regional Settings
Modifying Report Designer's Case Sensitivity

Chapter 5: Setting Defaults
R&R ReportWorks SQL User Manual Page 129
Changing Display Preferences
You can use the View menu and the Options ⇒ Preferences dialog to modify default display characteristics in any of the following ways:
• Turn on or off the display of scroll bars, toolbars, rulers, or grid;
• Specify that fields be represented on the layout as field names rather than symbols;
• Specify what action Report Designer should take when you select File ⇒ New;
• Specify whether Report Designer displays field descriptions, or both in field lists.
• Specify whether field name listings will be initially sorted by name.
• Specify whether backup copies of reports will automatically be created as design changes are made.
The following sections explain how to make these changes. In each case, the change takes effect for the current session and becomes the default for future sessions.

Chapter 5: Setting Defaults
R&R ReportWorks SQL User Manual Page 130
Changing Settings with the View Menu
You use the View menu command to turn on or off the display of the toolbars and rulers; to turn on or off display of the ruler grid; and to change the representation of fields on the layout.
Figure 5.1 shows the Report Designer window with the Standard Toolbar, Formatting Toolbar, Horizontal and Vertical Rulers, and Field Names settings turned on.
Figure 5.1 Report Designer Window Showing View Menu Choices

Chapter 5: Setting Defaults
R&R ReportWorks SQL User Manual Page 131
Horizontal and Vertical Rulers
You can use the View Rulers menu choice to display the Rulers dialog where you can choose whether or not to display each of the horizontal and vertical rulers. The spacing tab of the Rulers dialog allows you to adjust ruler spacing. You can also use Format ⇒ Rulers, or right-clicking on any displayed ruler or selecting F8 to display the Rulers Dialog.

Chapter 5: Setting Defaults
R&R ReportWorks SQL User Manual Page 132
Controlling Grid Display
You can also choose to show or hide the grid, which consists of a series of dots spaced according to the "Units per inch" settings specified for the rulers. You can use the grid to help you more accurately place fields and images. To turn on the grid, select View ⇒ Grid; a check mark appears next to the setting when it is on.

Chapter 5: Setting Defaults
R&R ReportWorks SQL User Manual Page 133
Changing Field Display
The Field Names item in the View menu controls how the fields display in the Layout Area. By default, each field is represented by symbols that indicate the field’s data type and alignment. To display field names, rather than representative symbols, select Field Names. As a result, each field’s name is shown in a box at the field’s location (depending on the field width, the entire field name may not appear).

Chapter 5: Setting Defaults
R&R ReportWorks SQL User Manual Page 134
Changing Preferences Dialog Box Settings
Use the Preferences dialog box (see Figure 5.2) to control display of scroll bars, to enable color-coding, to specify the starting point for new reports, specify data source defaults, select the content of field lists and enable automatic saving of the current report.
Figure 5.2 Preferences Dialog Box

Chapter 5: Setting Defaults
R&R ReportWorks SQL User Manual Page 135
Changing Scroll Bar Displays
By default, Report Designer displays horizontal and vertical scroll bars. To remove the scroll bars from the display, select Options ⇒ Preferences (see Figure 5.2). In the Display section of the Preferences dialog box, turn off Horizontal or Vertical Scroll Bar. When you are finished making changes, select OK.

Chapter 5: Setting Defaults
R&R ReportWorks SQL User Manual Page 136
Specifying Starting Point for New Report
You use the Options ⇒ Preferences dialog box to specify the starting point for new reports.
The File New group box on this dialog offers the following options:
Display Dialog
Report Wizards
Instant Report
Blank Report
Template
With the default setting of "Display Dialog," each time you select File ⇒ New, Report Designer will display a dialog enabling you to choose the starting point for creating the report (Report Wizards, Instant Report, Blank Report, or Template).
If you select "Report Wizards," at File ⇒ New Report Designer will execute its Report Wizards tool, which leads you step-by-step through the creation of one of three types of instant report (Labels, Basic Columnar, or Grouped Columnar). See the Using Report Wizards section of Chapter 2, "Managing Reports," for more information.
Selecting "Instant Report" will cause Report Designer to prompt for selection of a master table at File ⇒ New and then create an Instant Columnar report. Report Designer’s Instant Report places all fields from the selected master table (or as many as will fit) on the layout, with column titles inserted for each field. The Instant Report also includes Report Designer calculated fields for date, time, page number, and number of records printed, as well as grand totals of numeric fields that have decimal places.
Selecting "Blank Report" will cause Report Designer to prompt for selection of a master table at File ⇒ New. To create a blank report with no master table, simply select OK. To create a blank report with a master table, first turn off the "Create Report Without Master Table" setting; then choose a table and select OK. In each case, Report Designer will create a blank report layout consisting of one record line.
Selecting "Template" will cause Report Designer to display a list of report templates in the default template folder. You can then select a template and use it as the starting point for your new report. See the Using a Template to Create a Report section of Chapter 2, "Managing Reports," for more information.

Chapter 5: Setting Defaults
R&R ReportWorks SQL User Manual Page 137
Specifying the Content of Field Lists
In the Field Lists tab you can specify whether Report Designer optionally displays report dictionary field descriptions/field comments along with the actual field name in field list dialogs.
Checking the Sort field names box will set the initial default display of field lists to alphabetical order by field name rather than displaying fields in their database table order. Within a field list dialog you can additional click on any column heading to sort by that column.

Chapter 5: Setting Defaults
R&R ReportWorks SQL User Manual Page 138
Auto Save
When auto recovery is enabled, R&R saves a copy of the current report in the same directory as the original at the designated interval. This file uses the current report’s file name preceded by "Autosave-" It also writes the name of the saved file in the RSW.INI file. Should there be a problem causing R&R closes unexpectedly, the next time that you open the Report Designer, you will be asked if you want to open the auto saved file. This file will contain all of the changes to the file that was open in your last designer session as of the last recovery point.
Check the Save AutoRecover box to automatically save any changes to a backup copy the report that is currently being edited. You can specify a recovery interval of 1 to 120 minutes between each save to the auto save file.

Chapter 5: Setting Defaults
R&R ReportWorks SQL User Manual Page 139
Changing Layout and Formatting Settings
To change Report Designer defaults for paper size, margins, logical strings, ruler spacing, font, and snap-to-grid, select Options ⇒ Default Settings.
The changes you make in this dialog box (see Figure 5.3 )will then apply globally to all newly created reports.

Chapter 5: Setting Defaults
R&R ReportWorks SQL User Manual Page 140
Paper Size
Default: Letter. Use this setting to specify paper size for printed output.
To select a different size, open the Paper Size list box. Then select the paper size you want from the displayed list (which is based on the current Windows printer).
Some printers allow you to specify a custom paper size (instead of a predefined size). For those printers, you specify the dimensions for the custom size on the Paper tab of the Properties tabbed dialog for the printer (select File ⇒ Print; then select the Properties button). Note that many Windows printer drivers do not support custom paper sizes.
Figure 5.3 Default Settings Dialog Box

Chapter 5: Setting Defaults
R&R ReportWorks SQL User Manual Page 141
Margin Settings
Enter values to specify the amount of space at the top, bottom, left, and right of the report page (default value for each: 0.50 inches). On the layout, the right margin is indicated on the ruler by the letter R and the area to the right of the right margin is shaded grey.
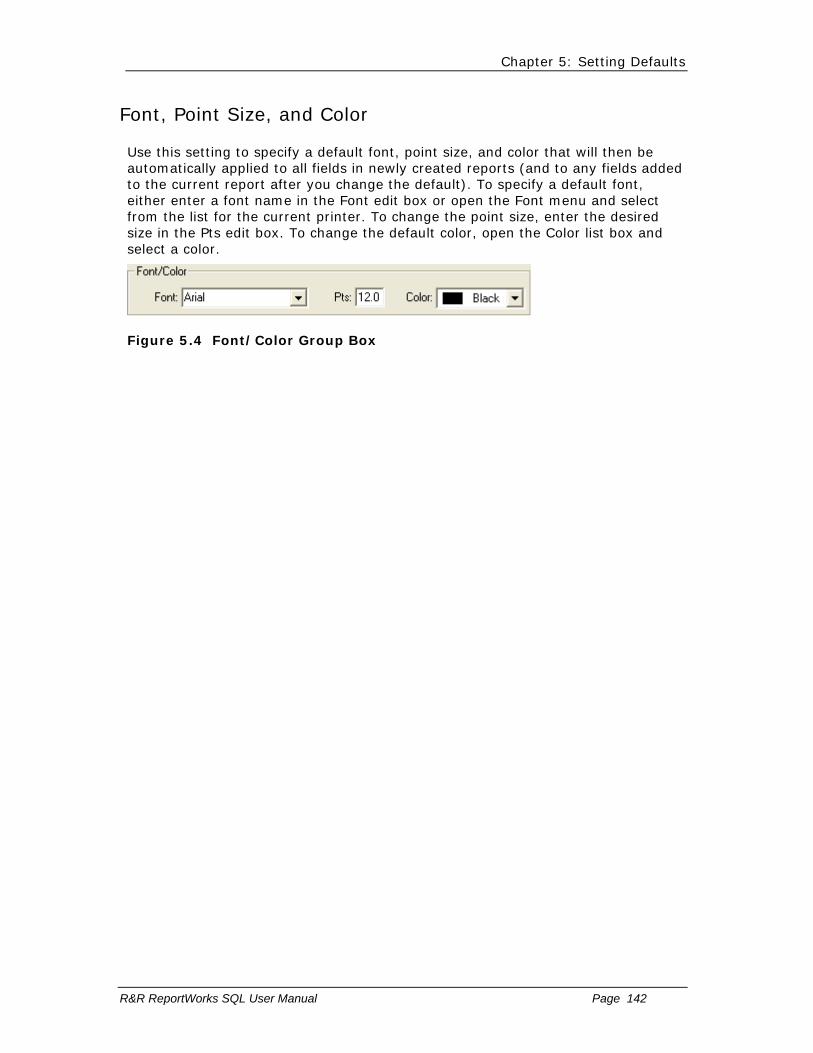
Chapter 5: Setting Defaults
R&R ReportWorks SQL User Manual Page 142
Font, Point Size, and Color
Use this setting to specify a default font, point size, and color that will then be automatically applied to all fields in newly created reports (and to any fields added to the current report after you change the default). To specify a default font, either enter a font name in the Font edit box or open the Font menu and select from the list for the current printer. To change the point size, enter the desired size in the Pts edit box. To change the default color, open the Color list box and select a color.
Figure 5.4 Font/Color Group Box

Chapter 5: Setting Defaults
R&R ReportWorks SQL User Manual Page 143
Ruler Spacing and Snap-To-Grid
The default setting for both the Horizontal and the Vertical Ruler Spacing is 10; you can select a setting from 4 through 30. This setting controls the number of ruler increments per inch on each ruler. Note that the Ruler Spacing settings control only the spacing of the report layout rulers (since the fonts actually applied to fields in the report control the print spacing).
For band lines with a Freeform line height, the ruler settings determine the horizontal and vertical spacing of the layout grid. For lines with an Automatic line height, the horizontal spacing of the grid is determined by the ruler setting; the vertical grid spacing is determined by the height of the largest font on each line.
When Snap-To-Grid is on (indicated by an x in the Snap-To-Grid box), objects on the layout will "snap" to the grid marks when inserted, moved, or sized. To turn off this default setting, click the Snap-To-Grid box to remove the x. You can also control this setting for individual reports with the Format ⇒ Snap-To-Grid command (Shift+F8) or the Snap-To-Grid button on the Formatting Toolbar.

Chapter 5: Setting Defaults
R&R ReportWorks SQL User Manual Page 144
Specifying Logical Strings
By default, logical field results will print or display as T for True and F for False. To specify a different string for either True or False, select Options ⇒ Default Settings. In the Logical Strings box, either open the menu and select a string or enter the string in the data-entry area.

Chapter 5: Setting Defaults
R&R ReportWorks SQL User Manual Page 145
Specifying Default Directories and Extensions
You use the Options ⇒ File Settings dialog to specify the following:
Folder locations for your report, image, and template files;
File-name extensions for text memo files;
Figure 5.5 Default File Settings Dialog
Changes you make to these settings are written to RSW.INI and take effect for the current Report Designer session and all future sessions.

Chapter 5: Setting Defaults
R&R ReportWorks SQL User Manual Page 146
Specifying Report, Image, and Template Folders
Use the Options ⇒ File Settings dialog to specify a default report, image, or template folder. Initially, if no defaults are defined Report Designer looks for all files in the current folder.
You can specify default locations so that Report Designer will search in the following locations for the files it needs:
Report: Location of report files
Image: Location of bitmapped image files
Template: Location of Report Designer templates
To set a default for each of these folders, select Options ⇒ File Settings. Then click the button to the right of the menu choice to display a Browse for Folder dialog where you can select the desired location. Make other changes in the dialog box as necessary; then select OK.
Default Report Folder
To specify a default folder in which Report Designer will search for and store report files, enter the full directory path in the Report Folder data-entry box. The folder you specify provides the starting location for report file selection.
Default Image Folder
Specify a folder where Report Designer will initially search for bitmapped image files when you select Insert ⇒ Picture (or the Picture button).
Default Template Folder
Specify a folder in which Report Designer will look for and save report templates.

Chapter 5: Setting Defaults
R&R ReportWorks SQL User Manual Page 147
Specifying Text File and Memo File Extensions
You can use the Default File Settings dialog box to specify default file-name extension for text files. As a result of setting this default, Report Designer will initially search for and display only files with the default extension when you are selecting a text file.
The default memo file-name extension you specify controls which files display for selection when you use the Insert ⇒ Text File command to include a text memo file in a report. For example, if the text memo files you will be using in reports have TXT extensions, specifying TXT as the Memo File Extension ensures that Report Designer will initially display files with a TXT extension when you are selecting a text memo file.

Chapter 5: Setting Defaults
R&R ReportWorks SQL User Manual Page 148
Changing Data Source Defaults
To specify defaults to control access to your data sources, select Options ⇒ Preference and then select the Data Source tab to open the Data Source dialog (see Figure 5.6). Figure 5.7 explains the data source defaults.
Figure 5.6 Data Source Dialog
Creating Reports
Allow Choice of Data Source
Allows you to select a data source after selecting File ⇒ New and add or remove data source connections using File ⇒ Data Source Connections.
Always Use Data Source
Specifies a default data source; as a result, you will not be prompted to choose a data source when you create a new report.
Opening Reports
Allow Choice of Data Source
Allows you to change an existing report’s data source when you open the report.
Use Report’s Data Source
Prevents you from changing an existing report’s data source.
Figure 5.7 Data Source Defaults
You can change the data source defaults at any time during a session. Report Designer initially sets the data source defaults to "Allow Choice of Data Source" for Creating Reports and "Use Report’s Data Source" for Opening Reports. This allows you to select any available data source when creating a new report, but prohibits you from changing the data source for a saved report.

Chapter 5: Setting Defaults
R&R ReportWorks SQL User Manual Page 149
If you always use a single data source, you can choose "Always Use Data Source" for new reports and specify your standard data source as the default, then select "Use Report’s Data Source" as the default for saved reports. This combination provides the greatest restriction on your access to data sources. Report Designer will automatically connect to the default data source when you create or open a report, bypassing the data source selection dialogs. In addition, the File ⇒ Data Source Connections choice will be disabled, preventing you from adding or removing data source connections.
Selecting "Allow Choice of Data Source" as the default for both new and saved reports gives you the greatest flexibility in accessing data sources. You can select any available data source for a new report, change the data source for a saved report, and add and remove data source connections while using Report Designer.

Chapter 5: Setting Defaults
R&R ReportWorks SQL User Manual Page 150
Changing Regional Settings
Report Designer uses the Regional settings currently set in your Windows configuration. These settings include the following:
Unit of measurement (inches or centimeters);
Date format;
Currency format;
Number format.
Since all Regional settings are controlled by the current Windows configuration, you must use the Regional Settings option on the Control Panel to change any of these settings. See your Windows documentation for instructions.
The following sections explain the effects of Windows Regional settings on Report Designer layout display and field formats.

Chapter 5: Setting Defaults
R&R ReportWorks SQL User Manual Page 151
Unit of Measurement
The unit of measurement used by Report Designer (inches or centimeters) is determined by your Windows configuration. The Windows "Measurement system" setting determines whether the following will display in inches or centimeters:
Horizontal position indicator in Report Designer Status Bar;
Margin settings;
Character field width setting specified with Format ⇒ Field;
Line height;
Record width/height.
Chapter 5: Setting Defaults
R&R ReportWorks SQL User Manual Page 152
Date, Currency, and Number Formats
The Windows Regional Date, Currency, and Number format settings determine the initial field formats for date and numeric fields in Report Designer. You can change field formats within Report Designer using Format ⇒ Properties.
Note that the "Position of currency symbol" and "Negative number format settings in the Windows Regional Currency dialog must be consistent — that is, if you select a currency setting that specifies a trailing symbol, you must also select a negative number format that specifies a trailing symbol.

Chapter 5: Setting Defaults
R&R ReportWorks SQL User Manual Page 153
Modifying Report Designer's Case Sensitivity
By default, Report Designer distinguishes between upper- and lower-case letters when sorting or comparing character data in Database ⇒ Sort Order and Group Order operations, filters, and calculations (that is, these operations are case sensitive).
To change this default behavior for sorting and comparing character data, use any text editor to edit RSW.SRT, the file that controls Report Designer’s case sensitivity. This file is included with Report Designer but is not installed by Setup; copy the file to the System folder of the program directory. Directions for editing the file are contained within the file itself.
Chapter 6 Selecting Report Data
Introduction (Selecting Report Data)
This chapter explains how to create an Auto-SQL report by using Report Designer menus and dialogs to select the files that provide data for the report. This information is presented in the following sections:
Introduction to Database Joins
Sample Database Joins
Creating a Database Join
Creating a Multi-Field Join
Editing A Join
Deleting a Join
Limiting Report Results
Changing the Master Table
You can create a report in any of the following ways:
♦ Build the report definition using Report Designer menus and dialogs to select a master table, specify table joins, specify sorting and grouping, develop filters, and so on. These reports are referred to as Auto-SQL reports.
♦ Enter and modify a SELECT statement that Report Designer then sends to your SQL software. These reports are referred to as User-SQL reports.
♦ From Data Access, either drag and drop a query onto a Report Designer layout or use Send To to start Report Designer and generate an Instant Report from a Data Access query. The resulting report is a type of User-SQL report.
This chapter explains the procedures for creating an Auto-SQL report. User-SQL reports are explained in Chapter 18.

Chapter 6: Selecting Report Data
R&R ReportWorks SQL User Manual Page 155
Introduction to Database Joins
Report Designer produces reports using information stored in your database. All reports include information from at least one table (called a master table), which can be either a base table or a virtual table (view). In addition to the master table, reports can also draw information from up to 99 additional tables called related tables that are joined to the master table or to each other. (Note that your database software may place limits on the maximum number of table joins).
To generate a report that uses information from more than one table, you define database joins among the tables you want to use. After you create a join, Report Designer can access data from the related table. For example, if you define a join that links an employee table and a department table, Report Designer can find information about each employee’s department by matching the department number in the employee table with the department number in the department table.
In any database join, the table used to initiate the join is called the controlling table; the other table is called the related table.

Chapter 6: Selecting Report Data
R&R ReportWorks SQL User Manual Page 156
Join Fields
To define a database join, you first select a join field from the controlling table. The initial join field you select determines which data from the controlling table will be used to search for matching records in the related table. You can use two types of join fields:
� A data field from the controlling table that contains the same type of data as the join field from the related table. For example, if your employee table and your benefits table both include fields for social security number, you can use this field as the join field.
� A calculated field based on the data in the controlling table. The value of this calculated field must also be the same as the value of the join field from the related table. For example, if the controlling table has FIRSTNAME and LASTNAME fields and the related table has a field that contains both first name and last name, you can create a calculated join field whose expression concatenates the first and last name fields in the controlling table.
You can use a calculated field as a join field only when the expression can be evaluated by your database software. A calculated field that is database-evaluatable is marked with an x in the field list. When you define a calculated field you plan to use as a join field, you can use the SQLEXP( ) function to force Report Designer to send it to your database software for evaluation. For more information about the SQLEXP( ) function, see Chapter 9, "Using Functions."
The initial join field and the join field in the related table must be the same data type, but the fields do not have to have the same name.

Chapter 6: Selecting Report Data
R&R ReportWorks SQL User Manual Page 157
Multi-Field Joins
You can join tables on more than one pair of join field values. For example, suppose you have an EMP table containing FNAME (first name) and LNAME (last name) fields and a BENEFITS table containing FIRST (first name) and LAST (last name) fields. You can join the EMP table and the BENEFITS table using the concatenation of first and last names. You can create up to a maximum of 10 multi-field join pairs.

Chapter 6: Selecting Report Data
R&R ReportWorks SQL User Manual Page 158
Composite Record Structure
After you define a database join, Report Designer updates the composite record structure that contains all the fields from all the tables used in the report, including any total and calculated fields created in Report Designer.
For example, to create a report that uses a customer table for name and address information and an orders table for order information, you might define a join that links the customer and orders tables, using customer number as the join field. This join results in a composite record structure like the one illustrated in Figure 6.1.
Fields in CUSTOMER Table
Fields in ORDERS Table
Fields in Composite Record Structure
CUSTOMER NUMBER CUSTOMER CODE CUSTOMER NUMBER
COMPANY ORDER NUMBER COMPANY
ADDRESS ORDER DATE ADDRESS
CITY TERMS CITY
STATE SHIPPING STATE
CODE CODE
CUSTOMER CODE
ORDER NUMBER
ORDER DATE
TERMS
SHIPPING
Figure 6.1 Sample Composite Record Structure
Chapter 6: Selecting Report Data
R&R ReportWorks SQL User Manual Page 159
Types of Database Joins
The type of join you define controls how Report Designer searches for corresponding records in the related tables. You can define two types of database joins in Report Designer:
� Exact
� Approximate
�

Chapter 6: Selecting Report Data
R&R ReportWorks SQL User Manual Page 160
Exact Joins
In an exact join, Report Designer searches for all the records in the related table that match the join field value in the controlling table. In some cases, this search results in a one-to-one match between records in the two tables. In other cases, Report Designer may find many records in the related table that match the controlling join field value.
Exact joins can be based on any type of field except a logical or text memo field.

Chapter 6: Selecting Report Data
R&R ReportWorks SQL User Manual Page 161
Approximate Joins
As noted previously, in an Approximate join, Report Designer searches the related table for the record(s) containing the join field value nearest to the value in the controlling table join field. You select High Match or Low Match to specify retrieval of records with either the nearest higher or the nearest lower related value.
For example, suppose you have two tables: an ORDERS table containing customer order data and a DISCOUNT table that establishes a discount schedule based on quantity purchased. The ORDERS table includes a QUANTITY field that identifies the total number of items ordered by a given customer.
The DISCOUNT table contains two fields: one for maximum order quantity (MAXQTY) and one for corresponding discount percentages (DISC). These fields contain the following values:
MAXQTY DISCOUNT
999 .0
4999 .05
14999 .10
99999 .15
These values specify a discount for each quantity range: orders with a quantity of 0 through 999 receive no discount, those with a quantity of 1000 through 4999 receive a 5 percent discount, and so on.
To create an invoice report that calculates the appropriate discount, you would specify an Approximate High-Match join using ORDERS.QUANTITY and DISCOUNT.MAXQTY as join fields. As a result, Report Designer will match each QUANTITY value with the nearest higher MAXQTY value.
For example, if the QUANTITY value is 10,000, Report Designer will match it to the next higher MAXQTY value, 14,999, and therefore assign the 10 percent discount for that record.
Chapter 6: Selecting Report Data
R&R ReportWorks SQL User Manual Page 162
Including Unmatched Records
You can control what action Report Designer should take when there are no matching records in the controlling and related tables. "None" is the default Include Unmatched Records setting; if Report Designer doesn’t find a match between the controlling table join field value and the related table join field value, it eliminates the entire composite record from the report.
You can select from two other alternatives in the Include Unmatched Records group box:
� On Left: Report Designer includes NULL values in the composite record when it finds no records in the related table that match the controlling table join field value. As a result, the report will contain spaces where data from the related table would ordinarily print.
� On Right: Report Designer includes NULL values in the composite record when it finds no records in the controlling table that match the related table join field value. As a result, the report will contain spaces where data from the controlling table would ordinarily print.
The following sections provide examples of how each Unmatched Records setting might be used.

Chapter 6: Selecting Report Data
R&R ReportWorks SQL User Manual Page 163
None
In an invoice report, suppose you defined a join between a customer table and an orders table. You might select "None" as the Include Unmatched Records setting so that Report Designer will print invoices only for those customers who have placed orders. Report Designer simply leaves out any composite record that has no order data.
On Left
Suppose you have an ORDERS table consisting of customer order records and a CUST table containing customer names and addresses. You define a join between ORDERS as the controlling table and CUST as the related table. If you want to include customer information even for those customers who have no entry in the ORDERS table, select "On Left."
On Right
Suppose you defined a database join between an employee table (the controlling table) and an employee dependents table. For those employees who have no dependents, you still want to print the employee information; therefore, you would select "On Right" as the Include Unmatched Records setting.

Chapter 6: Selecting Report Data
R&R ReportWorks SQL User Manual Page 164
Case Sensitivity in Database Joins
If your database software treats character field joins case-sensitively, then by default Report Designer distinguishes between upper and lower case data when joining tables (that is, Report Designer is case sensitive when joining tables). For example, Report Designer will not recognize a match between an employee name stored as Smith in an employee table and the same employee name stored as SMITH in a benefits table.
You can change this default case sensitivity behavior by editing RSW.SRT, the file that determines how Report Designer handles case when sorting and comparing character data. Instructions for editing RSW.SRT (a plain text file) are contained within the file itself.

Chapter 6: Selecting Report Data
R&R ReportWorks SQL User Manual Page 165
Sample Database Joins
The following sections provide examples of these types of database joins:
� One-to-One Exact Join
� One-to-Many Exact Join
� Approximate Joins
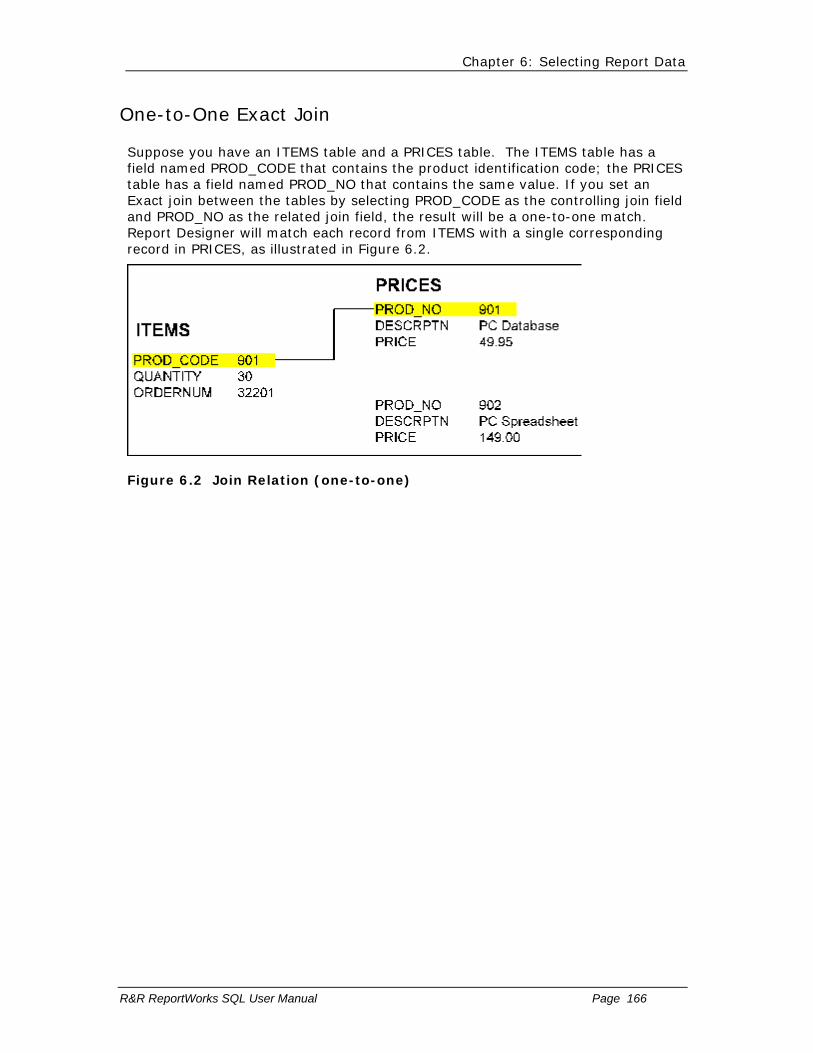
Chapter 6: Selecting Report Data
R&R ReportWorks SQL User Manual Page 166
One-to-One Exact Join
Suppose you have an ITEMS table and a PRICES table. The ITEMS table has a field named PROD_CODE that contains the product identification code; the PRICES table has a field named PROD_NO that contains the same value. If you set an Exact join between the tables by selecting PROD_CODE as the controlling join field and PROD_NO as the related join field, the result will be a one-to-one match. Report Designer will match each record from ITEMS with a single corresponding record in PRICES, as illustrated in Figure 6.2.
Figure 6.2 Join Relation (one-to-one)
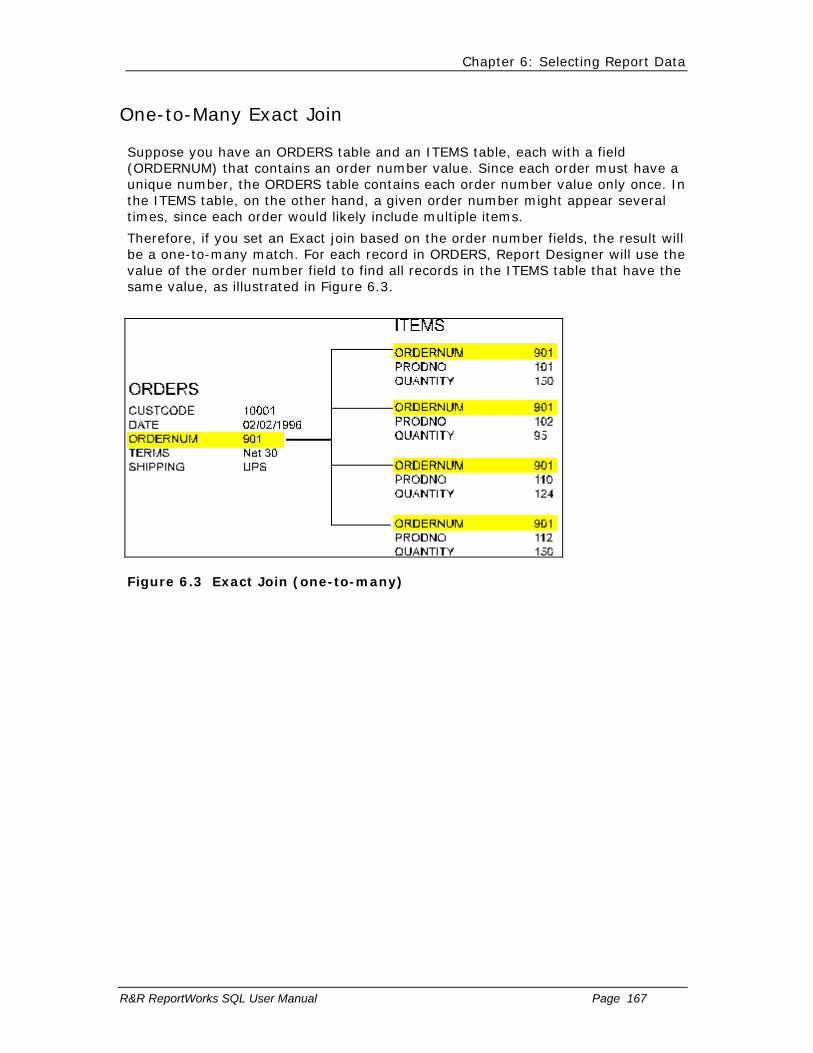
Chapter 6: Selecting Report Data
R&R ReportWorks SQL User Manual Page 167
One-to-Many Exact Join
Suppose you have an ORDERS table and an ITEMS table, each with a field (ORDERNUM) that contains an order number value. Since each order must have a unique number, the ORDERS table contains each order number value only once. In the ITEMS table, on the other hand, a given order number might appear several times, since each order would likely include multiple items.
Therefore, if you set an Exact join based on the order number fields, the result will be a one-to-many match. For each record in ORDERS, Report Designer will use the value of the order number field to find all records in the ITEMS table that have the same value, as illustrated in Figure 6.3.
Figure 6.3 Exact Join (one-to-many)
Chapter 6: Selecting Report Data
R&R ReportWorks SQL User Manual Page 168
Approximate Joins
As noted previously, in an Approximate join, Report Designer searches the related table for the record(s) containing the join field value nearest to the value in the controlling table join field. You select High Match or Low Match to specify retrieval of records with either the nearest higher or the nearest lower related value.
For example, suppose you have two tables: an ORDERS table containing customer order data and a DISCOUNT table that establishes a discount schedule based on quantity purchased. The ORDERS table includes a QUANTITY field that identifies the total number of items ordered by a given customer.
The DISCOUNT table contains two fields: one for maximum order quantity (MAXQTY) and one for corresponding discount percentages (DISC). These fields contain the following values:
MAXQTY DISCOUNT
999 .0
4999 .05
14999 .10
99999 .15
These values specify a discount for each quantity range: orders with a quantity of 0 through 999 receive no discount, those with a quantity of 1000 through 4999 receive a 5 percent discount, and so on.
To create an invoice report that calculates the appropriate discount, you would specify an Approximate High-Match join using ORDERS.QUANTITY and DISCOUNT.MAXQTY as join fields. As a result, Report Designer will match each QUANTITY value with the nearest higher MAXQTY value.
For example, if the QUANTITY value is 10,000, Report Designer will match it to the next higher MAXQTY value, 14,999, and therefore assign the 10 percent discount for that record.
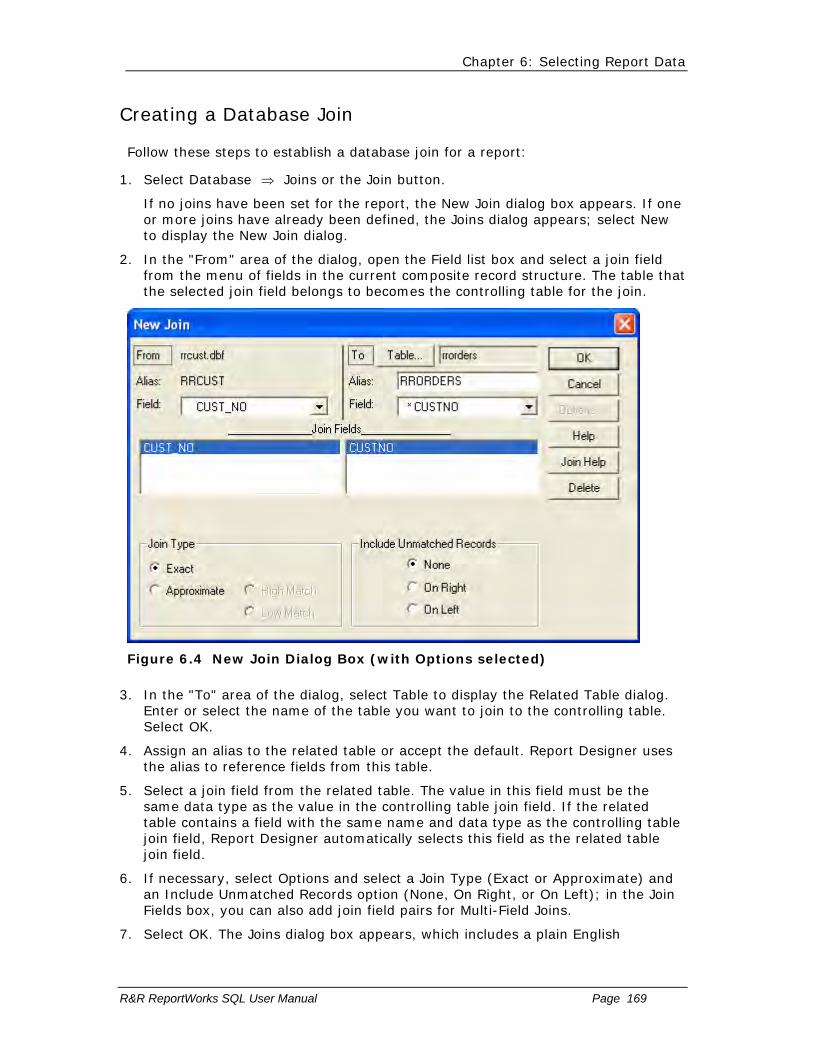
Chapter 6: Selecting Report Data
R&R ReportWorks SQL User Manual Page 169
Creating a Database Join
Follow these steps to establish a database join for a report:
1. Select Database ⇒ Joins or the Join button.
If no joins have been set for the report, the New Join dialog box appears. If one or more joins have already been defined, the Joins dialog appears; select New to display the New Join dialog.
2. In the "From" area of the dialog, open the Field list box and select a join field from the menu of fields in the current composite record structure. The table that the selected join field belongs to becomes the controlling table for the join.
Figure 6.4 New Join Dialog Box (with Options selected)
3. In the "To" area of the dialog, select Table to display the Related Table dialog. Enter or select the name of the table you want to join to the controlling table. Select OK.
4. Assign an alias to the related table or accept the default. Report Designer uses the alias to reference fields from this table.
5. Select a join field from the related table. The value in this field must be the same data type as the value in the controlling table join field. If the related table contains a field with the same name and data type as the controlling table join field, Report Designer automatically selects this field as the related table join field.
6. If necessary, select Options and select a Join Type (Exact or Approximate) and an Include Unmatched Records option (None, On Right, or On Left); in the Join Fields box, you can also add join field pairs for Multi-Field Joins.
7. Select OK. The Joins dialog box appears, which includes a plain English

Chapter 6: Selecting Report Data
R&R ReportWorks SQL User Manual Page 170
description of the join you set.
8. Select Close.
Chapter 6: Selecting Report Data
R&R ReportWorks SQL User Manual Page 171
Creating a Multi-Field Join
You can join tables on more than one pair of join field values. To create a table join based on two pairs of join field values:
1. Select Database ⇒ Joins or the Join button.
If no joins have been set for the report, the New Join dialog box appears. If one or more joins have already been defined, the Joins dialog appears; select New to display the New Join dialog.
2. In the "From" area of the dialog, open the Field list box and select a join field from the menu of fields in the current composite record structure. The table that the selected join field belongs to becomes the controlling table for the join.
3. In the "To" area of the dialog, select Table to display the Related Table dialog. Enter or select the name of the table you want to join to the controlling table. Select OK.
4. Report Designer assigns a default alias to the related table; if necessary, type a different alias.
5. Select a join field from the related table. The value in this field must be the same as the value in the controlling table join field.
6. If necessary, select Options and select a Join Type (Exact or Approximate) and an Include Unmatched Records option (None, On Right, or On Left).
7. In the Join Fields box, click in the area immediately below the join field pair you just set. Select a second pair of join fields from the controlling ("From") and related ("To") tables.
8. Select OK. The Joins dialog box appears, which includes a plain English description of the join you set.
9. Select Close.

Chapter 6: Selecting Report Data
R&R ReportWorks SQL User Manual Page 172
Editing A Join
To edit an existing database Join: 1. Select Database ⇒ Joins.
The Joins dialog box appears.
Figure 6.5 Joins Dialog
2. Highlight the join you want to change and select Edit to display the Edit Join dialog.
3. As necessary, change the selections in the From and To areas of the dialog.
4. To change the Join Type and/or Include Unmatched Records settings or to select additional join fields for a Multi-Field Join, select Options (if you are editing a multi-field join, the Options portion of the dialog is already displayed).
5. When you finish making changes, select OK; then select Close.

Chapter 6: Selecting Report Data
R&R ReportWorks SQL User Manual Page 173
Deleting a Join
To delete an existing database join: 1. Select Database ⇒ Joins. The Joins dialog box appears.
2. Highlight the join you want to remove and select Delete.
If the related table controls another join, Report Designer will not allow you to delete the selected join. In this case, you must first delete the secondary join.
3. Select OK; then select Close. Note that calculated and total fields that depend on a join you delete will be removed from the report.
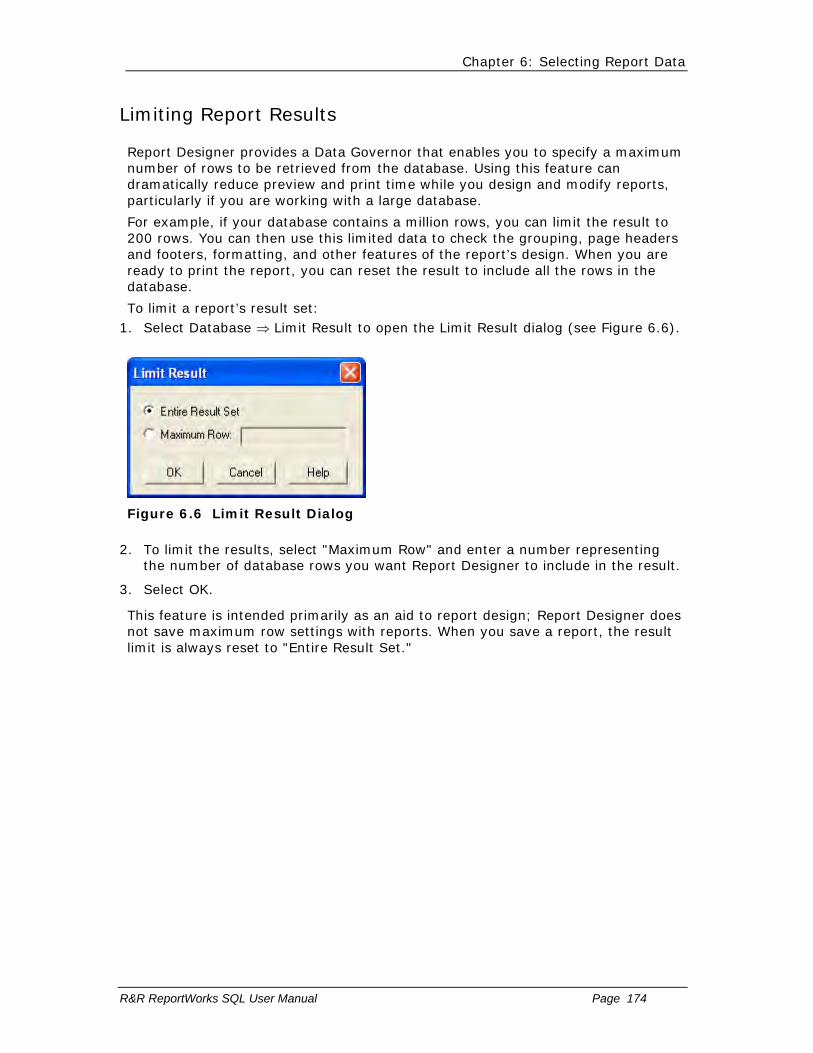
Chapter 6: Selecting Report Data
R&R ReportWorks SQL User Manual Page 174
Limiting Report Results
Report Designer provides a Data Governor that enables you to specify a maximum number of rows to be retrieved from the database. Using this feature can dramatically reduce preview and print time while you design and modify reports, particularly if you are working with a large database.
For example, if your database contains a million rows, you can limit the result to 200 rows. You can then use this limited data to check the grouping, page headers and footers, formatting, and other features of the report’s design. When you are ready to print the report, you can reset the result to include all the rows in the database.
To limit a report’s result set: 1. Select Database ⇒ Limit Result to open the Limit Result dialog (see Figure 6.6).
Figure 6.6 Limit Result Dialog
2. To limit the results, select "Maximum Row" and enter a number representing the number of database rows you want Report Designer to include in the result.
3. Select OK.
This feature is intended primarily as an aid to report design; Report Designer does not save maximum row settings with reports. When you save a report, the result limit is always reset to "Entire Result Set."

Chapter 6: Selecting Report Data
R&R ReportWorks SQL User Manual Page 175
Sorting and Filtering on Limited Results
Report Designer always performs sorting locally when a result limit has been set, since otherwise the database software might sort the entire database before returning the limited number of rows, slowing retrieval time. Keep this in mind when you define sort fields. Since Report Designer is sorting on the limited result, the output may not always be what you expect.
For example, you may be reporting on a 50-row table of STATES in which the state names are stored in order alphabetically, from Alabama to Wyoming. If you specify a row limit of 5, Report Designer will retrieve the first 5 rows of the table and then sort them. If you specify descending sort order, you may expect to see Wyoming in the output, but the result will include California through Alabama.
If the report includes a filter, the number of result rows might be further reduced by the filter, since Report Designer applies some filters locally. If the filter is applied locally, the selection conditions will be applied to the limited result set.

Chapter 6: Selecting Report Data
R&R ReportWorks SQL User Manual Page 176
Changing the Master Table
The table that serves as the initial source of data for a report is called the master table; you select this table when you first create a report. After defining a report, you can select a different master table. The structure of the new master table must match the structure of the master table it is replacing. If fields from the old master table are not in the new master table, those fields will be removed from the report.
NOTE: If your report contains fields from the old master table that do not appear in the new master table, Report Designer lists the fields that will be removed from your report layout and gives you the option of confirming or canceling the change.
To change the master table for a report: 1. Select Database ⇒ Master Table. On the Master Table dialog, the current
master table name appears in the Master Table group box.
Figure 6.7 Master Table Dialog Box
2. Select Table to display the Master Table file selection dialog.
3. Select a table file from this dialog box, then select OK. The Master Table dialog box reappears. The new master table name is displayed in the Master Table group box.
4. If necessary, type an alias for the master table in the Alias edit box. Report Designer uses the alias to uniquely identify the master table. You can accept the default value or enter an alternative alias. You are required to use an alternative alias only if another table used in the current report has already been assigned the default alias.
By default, Report Designer uses the file name of the master table as its alias. However, if you are using more than one table with the same name, you must specify a unique alias. Report Designer uses the alias whenever it displays a list of fields, so that you can identify the table that contains the field.
5. Select OK. If changing the master table will remove fields from the composite record structure, Report Designer lists those fields. Select OK to change to the selected table (the listed fields are removed); select Cancel to retain the former master table.
Chapter 7 Working with Calculated Fields
Introduction (Calculated Fields)
This chapter explains how to develop and use calculated fields in Report Designer. This information is presented in the following sections:
Creating a Calculated Field
Modifying a Calculated Field
Copying a Calculated Field
Purging Unused Calculated Fields
Using Database-Evaluatable Expressions
Calculated Field Expression Syntax
Report Designer enables you to create fields called calculated fields whose values are calculated as a report is generated, rather than being retrieved from the database. After you have defined a calculated field, you can:
Insert it on a report layout;
Use it as a join field (if it is evaluatable by the database software);
Use it as a sort field;
Include it in a report filter;
Use it in other calculated or total field expressions.
Here are just a few examples of how you can use calculated fields:
In an invoice report, you can create a calculated field that multiplies the value in a PRICE field by the value in a QUANTITY field. You can insert this field in the Record band of the report to provide a line item total.
In an accounts receivable report, you can create a calculated field that subtracts the value in a DUEDATE field from the value in a TODAY field. You can use this field in a filter to print a report of all invoices more than 30 days outstanding.
In a sales report, you can create a calculated field that computes monthly sales and use that field in creating various total fields to provide summary information for the year.

Chapter7: Working with Calculated Fields
R&R ReportWorks SQL User Manual Page 178
Creating a Calculated Field
To create a new calculated field: 1. Select Calculations ⇒ Calculated Field or click the Calc button
on the Standard Toolbar.
If no calculated fields have been defined for the current report, the New Calculation dialog appears. If one or more calculated fields have already been defined, select New in the Calculated Fields dialog to display the New Calculation dialog (see Figure 7.1).
Figure 7.1 New Calculation Dialog Box
2. In the Calculated Field Name edit box, type a unique field name of up to 30 characters.
3. In the Expression edit box, define the expression using any combination of the following methods:
� Type all or part of the expression directly in the Expression edit box.
� Insert a field name by selecting the Fields… button to bring up the field list.
� Insert a function by double-clicking on an item in the Functions list.

Chapter7: Working with Calculated Fields
R&R ReportWorks SQL User Manual Page 179
� Insert an operator by selecting the Operator buttons.
� Insert an existing calculated field expression or the condition expression for an existing conditional total by selecting the Calc Expression button to display the Calc Expression dialog.
� Insert a user-defined function formula by selecting the User Function Formula button to display the User Functions dialog.
� Use the Replace button to display the Replace calculated expression dialog. This allows you to find and replace text within the current calculated expression.
4. Select the Verify button to determine whether the expression syntax is correct.
Report Designer displays a message box describing what, if any, syntax errors it found in the expression.
5. When the expression is correct, select OK.
Chapter7: Working with Calculated Fields
R&R ReportWorks SQL User Manual Page 180
Entering a Field Name
In the "Calculated Field Name" edit box, enter a field name of up to 30 characters. The name can contain letters, numbers, or the underscore character; it must start with a letter. The field name must be unique in this report and cannot contain spaces.
By using a combination of upper and lower case, you can enter calculated field names that are easily distinguishable from the names of table fields.

Chapter7: Working with Calculated Fields
R&R ReportWorks SQL User Manual Page 181
Entering a Field Expression
Enter the expression for a calculated field using either or both of the following methods:
Type the expression directly in the Expression edit box.
Use the list menus and buttons to select from available fields, functions, operators, calculated field expressions, or user-defined function expressions.
The expression for a calculated field is a formula that determines how the field’s value is calculated. For example, the value of a calculated field whose expression is QUANTITY * PRICE will be the value in the QUANTITY field multiplied by the value in the PRICE field.
See the Calculated Field Expression Syntax section of this chapter for information about the components and the structure of Report Designer expressions.
The following sections describe techniques you can use to construct calculated field expressions in Report Designer.
Chapter7: Working with Calculated Fields
R&R ReportWorks SQL User Manual Page 182
Typing the Expression
You can type a calculated field expression by entering the field names, constants, operators, and/or functions that make up the expression directly in the Expression edit box. If the expression contains a predefined or user-defined function, you can type as few as the first four letters of the function (for example, cmon for CMONTH). As you enter the expression, you can format it for better readability by using Ctrl+Tab to indent and Ctrl+Enter to start a new line.
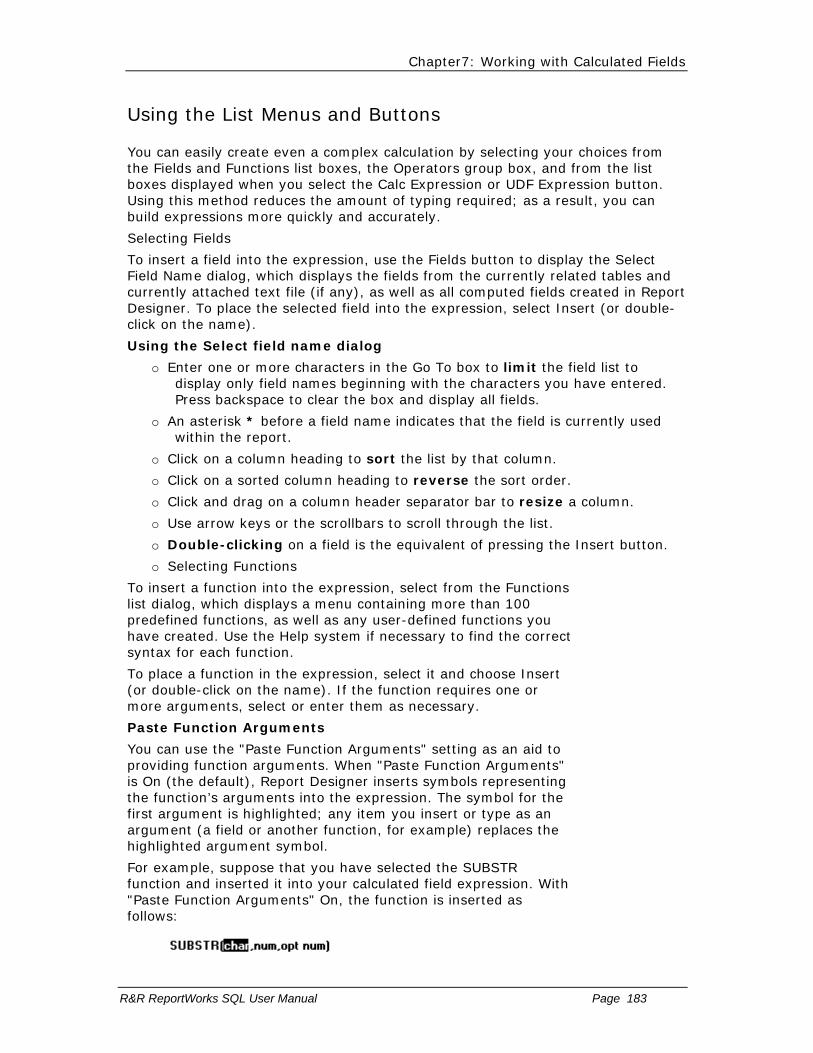
Chapter7: Working with Calculated Fields
R&R ReportWorks SQL User Manual Page 183
Using the List Menus and Buttons
You can easily create even a complex calculation by selecting your choices from the Fields and Functions list boxes, the Operators group box, and from the list boxes displayed when you select the Calc Expression or UDF Expression button. Using this method reduces the amount of typing required; as a result, you can build expressions more quickly and accurately.
Selecting Fields
To insert a field into the expression, use the Fields button to display the Select Field Name dialog, which displays the fields from the currently related tables and currently attached text file (if any), as well as all computed fields created in Report Designer. To place the selected field into the expression, select Insert (or double-click on the name).
Using the Select field name dialog
o Enter one or more characters in the Go To box to limit the field list to display only field names beginning with the characters you have entered. Press backspace to clear the box and display all fields.
o An asterisk * before a field name indicates that the field is currently used within the report.
o Click on a column heading to sort the list by that column.
o Click on a sorted column heading to reverse the sort order.
o Click and drag on a column header separator bar to resize a column.
o Use arrow keys or the scrollbars to scroll through the list.
o Double-clicking on a field is the equivalent of pressing the Insert button.
o Selecting Functions
To insert a function into the expression, select from the Functions list dialog, which displays a menu containing more than 100 predefined functions, as well as any user-defined functions you have created. Use the Help system if necessary to find the correct syntax for each function.
To place a function in the expression, select it and choose Insert (or double-click on the name). If the function requires one or more arguments, select or enter them as necessary.
Paste Function Arguments
You can use the "Paste Function Arguments" setting as an aid to providing function arguments. When "Paste Function Arguments" is On (the default), Report Designer inserts symbols representing the function’s arguments into the expression. The symbol for the first argument is highlighted; any item you insert or type as an argument (a field or another function, for example) replaces the highlighted argument symbol.
For example, suppose that you have selected the SUBSTR function and inserted it into your calculated field expression. With "Paste Function Arguments" On, the function is inserted as follows:

Chapter7: Working with Calculated Fields
R&R ReportWorks SQL User Manual Page 184
In this example, the symbols in parentheses after the function name represent the arguments to SUBSTR: "char" represents a required character argument; "num" a required numeric argument, and "opt num" an optional numeric argument.
If you select a character field as the first argument, the field name replaces "char" in the expression. You can then supply the other function arguments as needed.
When "Paste Function Arguments" is Off, Report Designer inserts function names without supplying argument symbols. Instead, the function name is inserted followed by open/close parentheses — for example, SUBSTR( ).
Selecting Operators
To insert an operator into the expression, click on the appropriate operator from the Operator group box. See Figures 7.3, 7.4, 7.5, 7.6, and 7.7 in this chapter for explanations of these operators and descriptions of their use in expressions.
Copying Other Calculated Expressions
You can easily copy other calculated field expressions; as a result, in some cases you can simply modify an existing expression rather than starting from scratch. To insert the expression of a calculated field that you have previously defined or the condition expression of a conditional total, select the Calc Expression button. Report Designer displays a list of calculated fields and conditional total fields; as you highlight each field name, the field’s expression is also shown. Select the field whose expression you want to copy and select OK (or double-click on the field name).
Selecting a UDF Expression
To insert the expression of a user-defined function (UDF), select User Function Expression. Report Designer displays a list box of UDF names. As you move the cursor from name to name, each UDF’s expression displays. Select the UDF expression you want to insert and select OK (or double-click). For more information on UDFs, see Chapter 9, "Using Functions."

Chapter7: Working with Calculated Fields
R&R ReportWorks SQL User Manual Page 185
Replacing text within a Calculated Expression
You can find and replace text within the current calculated expression. This can be a particularly useful feature if you have created a new calculation by copying the expression of an existing calculation. Select the part of the expression that you wish to replace and then click Replace. Your highlighted text is the default Find What value. You can enter a different string in the Find What box or can select a previous value using the arrow key. In the Replace with box, enter the replacement text. You can then use the buttons at the bottom of the dialog to replace, replace all, find the next occurrence or close/cancel the dialog accepting or ignoring any changes.

Chapter7: Working with Calculated Fields
R&R ReportWorks SQL User Manual Page 186
Verifying Expression Syntax
When you have completed your expression, select Verify. If you have entered an expression incorrectly (for example, if you have used an unrecognized field or operator), Report Designer will notify you with an error message. When possible, the cursor will also be positioned to the place in the expression where the error occurred. Edit the existing expression. When the expression is complete and correct, select OK.

Chapter7: Working with Calculated Fields
R&R ReportWorks SQL User Manual Page 187
Copying a Calculated field
In the Calculated Fields dialog, you can select a field and then use the Copy button to create a new calculation whose name will be blank and whose expression will be the same as the original field.

Chapter7: Working with Calculated Fields
R&R ReportWorks SQL User Manual Page 188
Modifying a Calculated Field
You can use either of the following methods to open the Edit Calculation dialog box to modify a calculated field:
Either right-click on the field and select Expression or select the field and press F2.
Select Calculations ⇒ Calculated Field and select the field to edit from the list box. Then select Edit.
The Edit Calculation dialog is the same as the New Calculation dialog, except that it shows the selected field’s name and displays its expression in the Expression edit box.
1. Select Calculations ⇒ Calculated Field to display the Calculated Fields dialog.
2. In the Fields list, select the name of the calculated field you want to edit.
3. Select the Edit button to display the Edit Calculation dialog.
4. In the Calculated Field Name edit box, edit the field name if you want to change it.
5. In the Expression edit box, position the cursor where you want to make a change. Edit the expression using any combination of the following methods:
Edit all or part of the expression by typing your changes directly in the Expression edit box.
Insert a field name by selecting the Fields button and then selecting a field from the field list.
Insert a function by selecting the Functions button and then selecting a function from the field list.
Insert an operator by selecting the Operator buttons.
Insert an existing calculated field expression or a condition expression for an existing conditional total by selecting the Calc Expression button to display the Calc Expression dialog.
Insert a user-defined function formula by selecting the User Function Formula button to display the User Functions dialog.
Use the Replace button to find and replace text within the expression.
6. Select the Verify button to determine whether the expression syntax is correct. If Report Designer finds a syntax error in the expression, it displays a message box describing the error.
7. Select OK to confirm the changes or select the Cancel button to close the dialog box without making any changes to the calculated field.
If the calculated field’s data type changes as the result of

Chapter7: Working with Calculated Fields
R&R ReportWorks SQL User Manual Page 189
editing and the field is used in another calculated field expression, Report Designer displays a list of calculated fields that will be affected by your change. The fields on this list will either change their data types or become impossible for Report Designer to evaluate as a result of your change.
At this point, you can select Cancel to cancel the change or OK to make the change. Selecting OK will cause the affected fields that Report Designer cannot evaluate to be flagged with question marks in the Field Menu. If the flagged fields are used in your report, you will have to edit their expressions before you can print or view the report.
If the field you are editing is used as a join field, appears in a filter, or is totaled, you will not be allowed to change the data type of its result.
NOTE Report Designer estimates the widths of calculated fields and does not automatically reset a field’s width when it has been edited. Therefore, after editing a calculated field, you may need to adjust its width using the Width tab on the Properties tabbed dialog (select the field and press F9). For instructions on changing field width, see Chapter 4, "Working with Fields."

Chapter7: Working with Calculated Fields
R&R ReportWorks SQL User Manual Page 190
Adding a Field Comment
You can enter a brief comment (up to 100 characters) to serve as a "plain English" explanation of a calculated field. To do so, select Calculations ⇒ Calculated Field, highlight the field name, and select Comment to display the Field Comment dialog. Enter the explanation in the Comment box and then select OK. When a calculated field has a comment attached to it, the text of that comment is displayed in the Status Bar when the field is highlighted.
You can also enter or edit a field comment using the Comment tab on the Properties tabbed dialog (select the field and press F9).

Chapter7: Working with Calculated Fields
R&R ReportWorks SQL User Manual Page 191
Deleting a Calculated Field
To delete a calculated field: 1. Select Calculations ⇒ Calculated Field to display the
Calculated Fields dialog.
2. In the Fields list, select the name of the calculated field you want to delete.
3. Select the Delete button.
If the calculated field you selected is used in any total fields or in other calculated fields, these fields will be deleted as well. In this case, Report Designer displays the Delete Calculation dialog box with a list of all the fields that will be deleted. You can confirm or cancel the deletions.
You cannot delete any calculated field that is used as a join field.
4. Select Close.

Chapter7: Working with Calculated Fields
R&R ReportWorks SQL User Manual Page 192
Adding calculations to the Data Dictionary
R&R allows you to add certain calculations to the Data Dictionary so that they will be available for use in other reports. Only those fields that contain fields from a single table along with any operators or R&R functions are available for addition to the data dictionary. To add a calculated field to the dictionary, select Calculations ⇒ Calculated Field, and then highlight the field name. If the field is eligible for dictionary addition, the Add to Dict button will be available for selection. If the field already exists in the dictionary, you will get a Duplicate Entry error box. If the field is successfully added, you will be returned to the Calculated Field dialog without any displayed message.

Chapter7: Working with Calculated Fields
R&R ReportWorks SQL User Manual Page 193
Purging Unused Calculated Fields
To remove all unused calculated fields from your report definition: Select Calculations ⇒ Purge Calculations.
The Purge Calculations dialog box appears (see Figure 7.2).
Figure 7.2 Purge Calculations Dialog
Click the Purge Unused Calculated Fields check box.
Select OK.
Report Designer lists the fields that will be removed from the report definition and prompts you to confirm.
Select OK to remove the listed fields or Cancel to return to the Purge Calculations dialog without removing the fields.

Chapter7: Working with Calculated Fields
R&R ReportWorks SQL User Manual Page 194
Using Database-Evaluatable Expressions
Whenever possible, Report Designer will generate a database-evaluatable translation of a calculated field’s expression. As a result, the calculations specified by such an expression are performed directly by the database software. A calculated field consisting of a database-evaluatable expression is marked with an x in field lists and in the field’s expression as shown on the Status Bar and the Field Properties dialog.
You can select a database-evaluatable calculated field as the controlling table join field when defining a table join. Also, filtering and sorting on database-evaluatable calculated fields is much more efficient than filtering and sorting on calculated fields with expressions that Report Designer cannot translate for evaluation by the database.
Report Designer includes the actual database-evaluatable translations of such calculated fields in the Report Specification (which you can print or preview by selecting "Report Specification" from the Print menu on the Report Designer File ⇒ Print dialog).

Chapter7: Working with Calculated Fields
R&R ReportWorks SQL User Manual Page 195
Calculated Field Expression Syntax
An expression is a formula that Report Designer uses to compute the value of a calculated field using fields, constants, operators, and functions. For example, the expression SUBTOTAL*DISCNT calculates discount by multiplying the value in the subtotal field by the value in the discount rate field.
To take another example, the following expression calculates the number of months between the dates in the PAYDATE and INVDATE fields:
MONSBTWN(PAYDATE,INVDATE)
Calculated field expressions can contain functions, operators, constants, database fields, memo fields, total fields, and other calculated fields. Report Designer provides standard arithmetic, string, relational, logical, and date operators, as well as use of parentheses. In addition, you can define your own user-defined functions (UDFs) that can be saved and used in any report just like predefined functions.
The following sections explain calculated field expressions by:
� Describing the types of expressions;
� Explaining the parts of an expression: fields, constants, operators, and functions;
� Explaining how Report Designer handles errors in evaluating expressions.

Chapter7: Working with Calculated Fields
R&R ReportWorks SQL User Manual Page 196
Types of Expressions
Expressions are classified by the data type of the results they produce. Based on this categorization, you can develop character, numeric, date, datetime, logical, and memo expressions.
Chapter7: Working with Calculated Fields
R&R ReportWorks SQL User Manual Page 197
Character Expressions
A character expression produces characters or character strings. For example, "Dear "+FIRSTNAME–"," is a character expression. The character string it produces will be a salutation such as "Dear John,". Note that character strings can also include numbers and punctuation marks.

Chapter7: Working with Calculated Fields
R&R ReportWorks SQL User Manual Page 198
Numeric Expressions
A numeric expression produces numbers. For example, 3%TOTAL is a numeric expression. The number it produces will be 3 percent of the value of the TOTAL field. Numeric expressions can also be used as logical expressions; a logical expression is considered to be true when it has a non-zero value and false when it has a zero value.

Chapter7: Working with Calculated Fields
R&R ReportWorks SQL User Manual Page 199
Date Expressions
A date expression produces dates. For example, ORDERDATE+30 is a date expression. The date it produces will be 30 days later than the date in the ORDERDATE field.
Chapter7: Working with Calculated Fields
R&R ReportWorks SQL User Manual Page 200
DateTime Expressions
A datetime expression produces a date that additionally includes a time component. A date time expression has components for day, month, year, hour, minute, second.

Chapter7: Working with Calculated Fields
R&R ReportWorks SQL User Manual Page 201
Logical Expressions
A logical expression produces a logical value of true or false. For example, BALANCE>100 is a logical expression. The expression produces a true value if the value in the balance field is greater than 100, a false value if the balance is less than or equal to 100. Logical expressions can also be used as numeric expressions. In this case, the true value is one and the false value is zero.
Chapter7: Working with Calculated Fields
R&R ReportWorks SQL User Manual Page 202
Memo Expressions
A memo expression produces a memo field. Only expressions that contain memo fields can produce memo fields. For example, you can use the IIF( ) function to return one of two memo fields based on a specified condition.
The following expression means that if the balance equals zero, return the THANKS memo field; otherwise, return the SENDCASH memo field:
IIF(BALANCE=0,THANKS,SENDCASH)

Chapter7: Working with Calculated Fields
R&R ReportWorks SQL User Manual Page 203
Parts of an Expression
Expressions are made up of one or more of the following:
� Fields
� Constants
� Operators
� Functions
� Wildcards
For example, in the expression SUBTOTAL*DISCNT, SUBTOTAL and DISCNT are fields and * is the multiplication operator. In the expression ADDDAYS(INVDATE,30), ADDDAYS is a function that adds a given number of days to a date, INVDATE is a field, and 30 is a constant. Each of these components is explained in more detail in the following sections.
Chapter7: Working with Calculated Fields
R&R ReportWorks SQL User Manual Page 204
Fields
Expressions can include data fields of any type (character, numeric, logical, date, datetime, memo), total fields, and other calculated fields. For example, in the expression SUBTOTAL*DISCNT, the SUBTOTAL field might be a total field that sums line item totals.
The expression for a calculated field can even contain the calculated field itself. For example, you can create a calculated field called RUNTOTAL that keeps a running total of the AMOUNT field by using the expression RUNTOTAL+AMOUNT. The name of the calculated field is used in the expression that defines it.
Field Names with Table Aliases
If several tables contain fields with the same name, the field name used in an expression must be preceded by a table alias. For example, if your report uses a customer table and a product table that both have a field called NAME, the NAME field must be preceded by a table alias that identifies the table it belongs to. If RRCUST and RRPROD are the table aliases, you would enter either
RRCUST.NAME or RRPROD.NAME in the expression.
To ensure that appropriate aliases are used, select field names from the Fields list box (rather than typing the field names).
Field Names with Special Characters
If an expression contains the name of a field that includes one of the special characters listed below, you must precede the character with a backslash to indicate that the character is part of the field name. For example, to include the EMP# field in a calculated field expression, you must type EMP\#.
Include a backslash before each of the following characters if it appears in a field name:
+ - / * ^ % ( ) , = # < > $ ! " ' [ (space)
If you insert a field whose name includes any special characters that could be interpreted as operators in the expression (for example % or >), Report Designer will automatically insert a backslash before the special character to indicate that the character is part of the field name.

Chapter7: Working with Calculated Fields
R&R ReportWorks SQL User Manual Page 205
Constants
A constant is a value you specify as part of an expression. For example, if the expression for a field that calculates interest is balance times interest rate, the figure that represents the interest rate can be a constant. In the expression BALANCE*.08, .08 is the interest rate constant.
Report Designer recognizes five types of constants:
� Numeric constants
� Character constants
� Logical constants
� Date constants
� DateTime constants
� Numeric Constants
Numeric Constants
A numeric constant is a number that may contain a decimal point and may be preceded by a plus or minus sign. For example, 3.1415927 can be used as a constant in expressions that require the value of pi to seven decimal places.
Character Constants
A character constant is any character or string of characters in the ANSI character set, enclosed in double quotes, single quotes, or square brackets. For example, the expression "Dear "+FIRSTNAME–"," or 'Dear '+FIRSTNAME–',' will return a value like "Dear John,".
Note that if you use a backslash, question mark, or asterisk in a character value that is the right-hand element in a comparison, you must precede the special character with a backslash to tell Report Designer to treat the character literally, For example, use FIELD = "\*" to test for records in which FIELD contains only an asterisk. Without the backslash, Report Designer will treat an asterisk to the right of the operator as a wildcard character.
Logical Constants
A logical constant is a true or false value; for example, .T. for true and .F. for false. Upper or lower case may be used. Valid logical constants are .T., .F., True, False, On, Off, Yes, No.
For example, the following expression will return a true value if the value in the CHILDREN field is greater than 0, and a false value if it is less than or equal to 0:
IIF(CHILDREN>0, .T. , .F. )

Chapter7: Working with Calculated Fields
R&R ReportWorks SQL User Manual Page 206
Date Constants
You can produce date constants using the following format: {<date-value>}
For example, the following expression adds 30 days to the literal date enclosed in curly braces:
ADDDAYS({06/17/2001},30)
You can also use the CTOD( ) (character to date) function, which converts character strings into dates, to produce date constants. For example, in the following expression, the CTOD( ) function turns the two strings in quotation marks into date constants, which are then subtracted to calculate the number of days between the two dates:
CTOD("3/17/2001")–CTOD("1/1/2001")
Note that although you can enter a date constant using only a two-digit year, R&R will evaluate the two digits as being within the current century at the time the expression is created and will automatically expand the two digits to four digits. So in the year 2001, an entry of {01/01/96} will become {01/01/2096} when the expression is saved.
For more information on CTOD, refer to Chapter 10, "Using Functions."
DateTime Constants
You can produce datetime constants using the following format: {<date-value> <time-value}
for example the constant {01/01/2005 12:00:00 PM} would evaluate to the date time constant of January first 2005 at noon.

Chapter7: Working with Calculated Fields
R&R ReportWorks SQL User Manual Page 207
Operators
Operators are symbols that perform operations within an expression. For example, in the expression SUBTOTAL*DISCNT, the asterisk is a symbol that performs the operation of multiplication.
Report Designer provides five types of operators:
Arithmetic
Relational
Date/Date Time
Logical
Character (string)
Arithmetic Operators
Report Designer provides the arithmetic operators shown in Figure 7.3.
Operator
Description
+ Addition
- Subtraction
/ Division
* Multiplication
% Percentage
^ or ** Exponentiation
( Open parenthesis for grouping
) Close parenthesis for grouping
Figure 7.3 Arithmetic Operators
The addition, subtraction, division, and multiplication operators are used in Report Designer expressions just as they are used in algebraic expressions. The percentage operator is used as if it were "percent of," as in the expression 10 % 25 = 2.5. The numbers on either side of the percent sign are multiplied together and divided by 100.
The exponentiation operator, which raises a quantity to a specified power, is placed after the quantity and before the power, as in the following expression for calculating the balance of a compound interest account:
BALANCE*(1+INTEREST)^PERIODS

Chapter7: Working with Calculated Fields
R&R ReportWorks SQL User Manual Page 208
The parenthesis operators are used to group operations, indicating the order in which they will be performed or evaluated.
Without parentheses, arithmetic expressions are evaluated by Report Designer in the following order:
1. Unary plus and minus (positive and negative signs)
2. Exponentiation
3. Multiplication, Division, and Percentage
4. Addition and Subtraction
For example, the expression 1+4/2 results in 3 rather than 2.5 because division is performed before addition.
If an expression contains several operators that have the same precedence, the operations are performed left to right. For example, in the expression 1+4/2*6/3, the division and multiplication operations are performed left to right before the addition operation is performed. The first operation is 4/2, resulting in 2; the second operation multiplies 2 by 6, resulting in 12; the third operation divides 12 by 3, resulting in 4; the last operation adds 1 to 4, resulting in 5.
By using parentheses, you can deviate from the standard order of evaluation. Report Designer performs operations within parentheses first. For example, the result of 1+4/2 is 3, but the result of (1+4)/2 is 2.5 because Report Designer performs the operation in parentheses first.
If parentheses are nested or embedded, as in the expression 3*((1+4)/2), the operation in the most deeply embedded parentheses is performed first. In this case, the first operation is 1+4, the second is 5/2, and the third is 3*2.5.
Date/DateTime Operators
Report Designer provides the date operators shown in Figure 7.4.
Operator Description
+ Addition of days to a date. For example, ORDERDATE+30
– Subtraction of days from a date or subtraction of one date from another. For example, DUEDATE–CURDATE
( Open

Chapter7: Working with Calculated Fields
R&R ReportWorks SQL User Manual Page 209
parenthesis for grouping
) Close parenthesis for grouping
Figure 7.4 Date Operators
These date operators are supplemented by a number of predefined date functions such as ADDDAYS( ), ADDMONS( ), and ADDWKS( ) that are explained in Chapter 9, "Using Functions."
Character Operators
Report Designer provides the string operators shown in Figure 7.5 to be used with character data.
Note that both + and – "add" strings together. The only difference between the two operators is that – removes the trailing spaces from the string that precedes it.
Operator Description
+ Concatenation, the joining of two character strings into one. For example, FIRSTNAME+LASTNAME
– Concatenation after removing trailing spaces from the string before the operator. For example, FIRSTNAME–" "+LASTNAME
( Open parenthesis for grouping
) Close parenthesis for grouping
Figure 7.5 Character (String) Operators
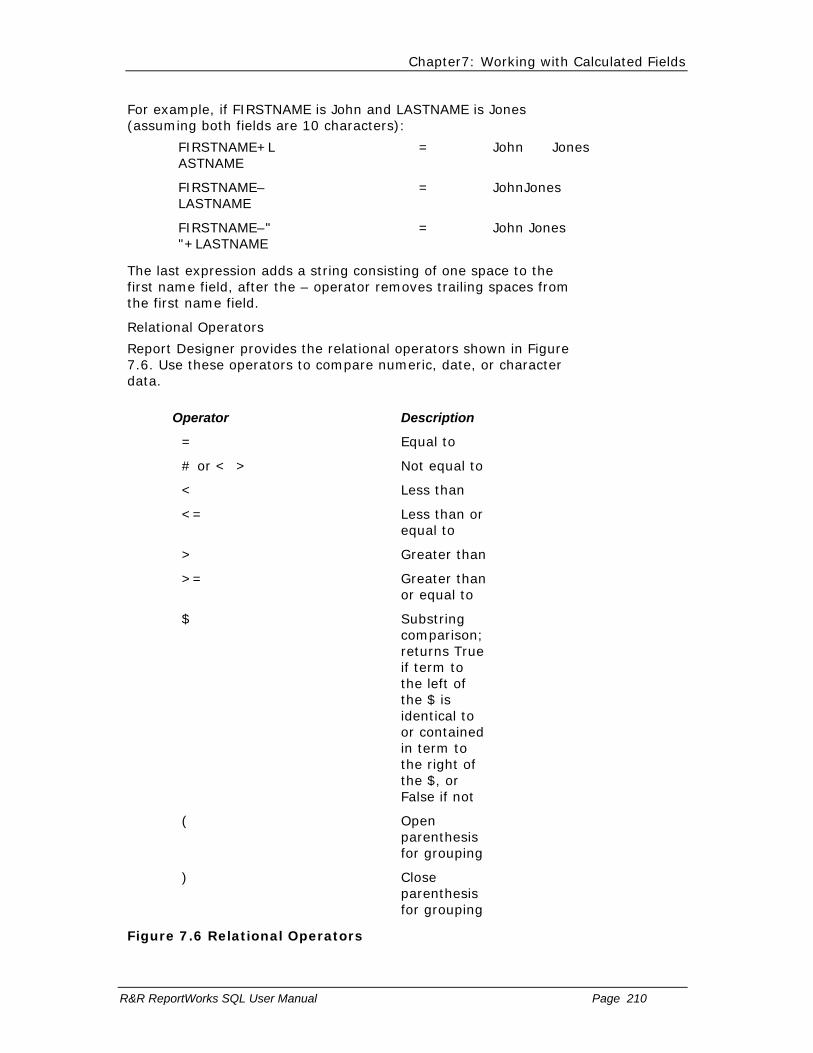
Chapter7: Working with Calculated Fields
R&R ReportWorks SQL User Manual Page 210
For example, if FIRSTNAME is John and LASTNAME is Jones (assuming both fields are 10 characters):
FIRSTNAME+LASTNAME
= John Jones
FIRSTNAME–LASTNAME
= JohnJones
FIRSTNAME–" "+LASTNAME
= John Jones
The last expression adds a string consisting of one space to the first name field, after the – operator removes trailing spaces from the first name field.
Relational Operators
Report Designer provides the relational operators shown in Figure 7.6. Use these operators to compare numeric, date, or character data.
Operator Description
= Equal to
# or < > Not equal to
< Less than
<= Less than or equal to
> Greater than
>= Greater than or equal to
$ Substring comparison; returns True if term to the left of the $ is identical to or contained in term to the right of the $, or False if not
( Open parenthesis for grouping
) Close parenthesis for grouping
Figure 7.6 Relational Operators
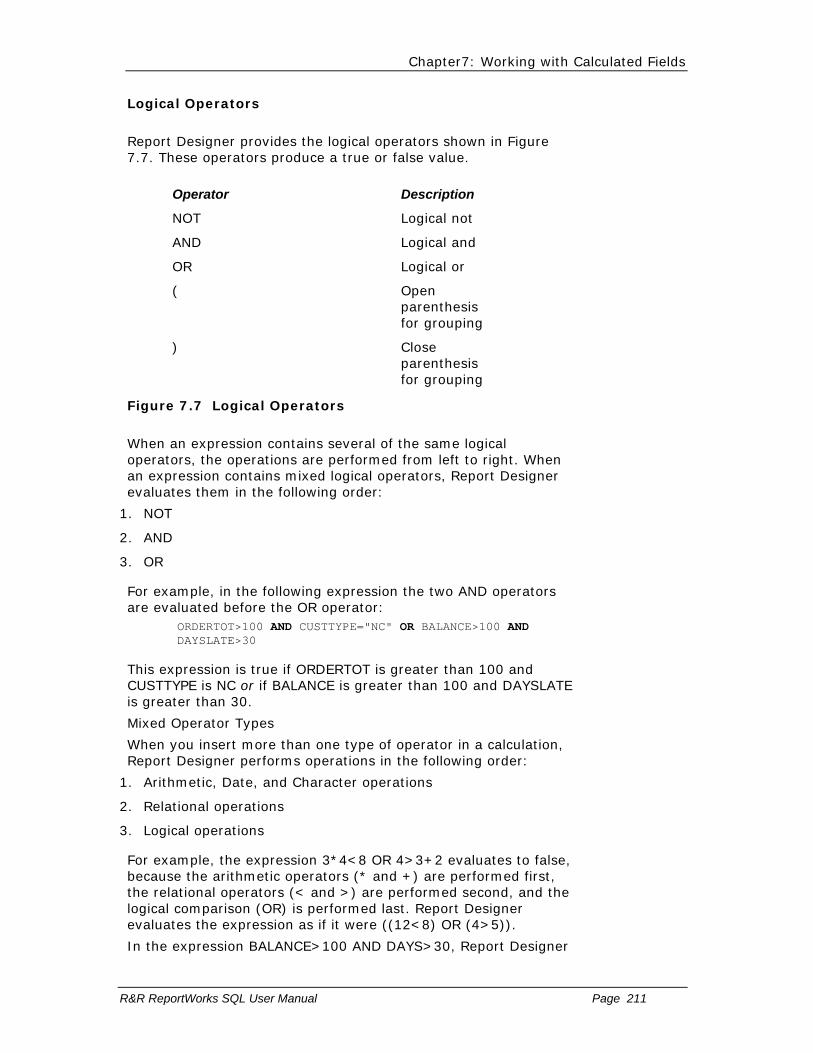
Chapter7: Working with Calculated Fields
R&R ReportWorks SQL User Manual Page 211
Logical Operators
Report Designer provides the logical operators shown in Figure 7.7. These operators produce a true or false value.
Operator Description
NOT Logical not
AND Logical and
OR Logical or
( Open parenthesis for grouping
) Close parenthesis for grouping
Figure 7.7 Logical Operators
When an expression contains several of the same logical operators, the operations are performed from left to right. When an expression contains mixed logical operators, Report Designer evaluates them in the following order:
1. NOT
2. AND
3. OR
For example, in the following expression the two AND operators are evaluated before the OR operator:
ORDERTOT>100 AND CUSTTYPE="NC" OR BALANCE>100 AND DAYSLATE>30
This expression is true if ORDERTOT is greater than 100 and CUSTTYPE is NC or if BALANCE is greater than 100 and DAYSLATE is greater than 30.
Mixed Operator Types
When you insert more than one type of operator in a calculation, Report Designer performs operations in the following order:
1. Arithmetic, Date, and Character operations
2. Relational operations
3. Logical operations
For example, the expression 3*4<8 OR 4>3+2 evaluates to false, because the arithmetic operators (* and +) are performed first, the relational operators (< and >) are performed second, and the logical comparison (OR) is performed last. Report Designer evaluates the expression as if it were ((12<8) OR (4>5)).
In the expression BALANCE>100 AND DAYS>30, Report Designer

Chapter7: Working with Calculated Fields
R&R ReportWorks SQL User Manual Page 212
evaluates the relational operators (>) first. Both conditions must be true for the expression to be true; that is, the balance must be greater than 100 and the number of days must be greater than 30.
In the expression CTOD("7/1/96")<DATE+30, Report Designer adds DATE+30 first and then compares the result to the date returned by the CTOD( ) (character to date) function. Therefore, the expression is true only when DATE+30 results in a date that is later than 7/1/96.

Chapter7: Working with Calculated Fields
R&R ReportWorks SQL User Manual Page 213
Functions
Functions perform special operations such as converting data from one data type to another, calculating the elapsed time between dates, changing number formats, and conditionally returning values.
A single function can serve as a calculated field expression, or several functions can be included within a single expression. For example, to include the system date in a report, you can create a calculated field called SYSDATE, whose expression is DATE( ). Inserting this field on a report layout causes the system date to print or display when the report is generated.
On the other hand, an expression can consist of a number of functions that can be nested or embedded within each other. For example, the expression CMONTH(DATE( ))+", "+STR(YEAR(DATE( )),4) contains four functions. The DATE( ) function returns the system date in the format 11/04/2005. The CMONTH( ) function returns the name of the month of the date supplied by DATE( ). The YEAR( ) function returns the four-digit year of the date supplied by DATE( ). The STR( ) function converts this numeric year value to a four-character string, so that it can be concatenated with the name of the month string and the character constant ", ". On 11/04/2006, the value returned by the expression is November, 2006.
Report Designer provides you with over 100 predefined functions, as well as the ability to create and save your own user-defined functions. For information on creating your own functions, see Chapter 9, "Using Functions."

Chapter7: Working with Calculated Fields
R&R ReportWorks SQL User Manual Page 214
Wildcard Characters
You can use wildcards for pattern matching in calculated field expressions that compare dates. For example, the expression DATE={01/*/2001} will match any date in January of 2001.
In conjunction with the LIKE( ) function, you can also use wildcards for pattern matching in character strings. For example, the expression LIKE("Hen*",NAME) will match any value of NAME starting with "Hen", including names such as Henrietta, Henry, and Henderson.
Figure 7.8 lists the wildcard characters used to define patterns in expressions. For more information about wildcards, see Chapter 11, "Creating Filters."
Character Meaning
_ or ? In a character expression, matches any single character in the same position in the field.
% or * In a character expression, matches any group of characters (including no characters).
* or @ In a date expression, * matches any value in that part of the date (e.g. 01/*/2006); @ matches any value that corresponds to that part of the system date (e.g. @/10/2006).
Figure 7.8 Wildcards in Expressions
You can use date wildcards in calculated fields that use functions (for example, CTOD("@/*/2004")). In relational expressions, use date wildcards for pattern matching in the right side of the expression; wildcard characters in the left side of the expression are treated as literals.
You can also use date wildcards in calculated field expressions that use the functions CASE( ) and INLIST( ). In the following example, the function INLIST( ) uses the first argument as the test value and compares it with each value in the list:
INLIST(DATE,{*/10/2004},{3/*/2004})
When a match is found, INLIST( ) returns the number corresponding to the position of the matching value in the list. If the value of DATE is the 10th of any month in 2004, INLIST( ) returns 1; if the value of DATE is any day in March of 2004, INLIST( ) returns 2. If no match is found, INLIST( ) returns 0.

Chapter7: Working with Calculated Fields
R&R ReportWorks SQL User Manual Page 215
Error Conditions in Evaluating Expressions
If Report Designer encounters an error in evaluating a calculated field expression, when you print or preview a report it displays asterisks as the error value in the field and in any fields that reference the calculated field. For example, if Report Designer tries to evaluate a date expression that adds a specified number of days to an empty date field, it will display **/**/** as the result, since it cannot produce a proper date.
To take another example, if Report Designer tries to evaluate a numeric expression that requires it to divide by zero, it will display asterisks as the result, since division by zero is an undefined operation. If this calculated field were totaled, the total value would also display as asterisks.
The standard error value sorts as the last value in an ascending sort or the first value in a descending sort.
Chapter7: Working with Calculated Fields
R&R ReportWorks SQL User Manual Page 216
Customizing Error Values
You can create your own error values for specific expressions by using the IIF and ERROR functions. If you know that an expression may result in an error, you can specify the error value that will display. For example, the expression (AVERAGE=INVAMT/QUANTITY), which divides total invoice amount by quantity ordered, will result in an error when the quantity ordered is 0. To print 0 instead of the standard error value of asterisks, you can use the following expression.
IIF(ERROR(AVERAGE),0,AVERAGE)
If evaluation of the AVERAGE field results in an error, then ERROR(AVERAGE) will be true, leading the IIF function to return 0. If evaluation of the AVERAGE field does not result in an error, ERROR(AVERAGE) will be false, leading the IIF function to return the result of the AVERAGE expression.
To print a string instead of a number as an error value, you might use an expression like:
IIF(ERROR(AVERAGE),"N/A",STR(AVERAGE))

Chapter7: Working with Calculated Fields
R&R ReportWorks SQL User Manual Page 217
Field Width Errors
Asterisks in a numeric calculated or a total field may also indicate the field width is not large enough to accommodate the result. Report Designer estimates the number of characters required for each calculated and total field based on the fields and functions used in the expression. You may need to adjust this width using the Width tab on the Properties tabbed dialog, especially if you have edited the expression since the initial field width estimate was established. See Chapter 4, "Working with Fields," for information on changing field width.
Chapter 8 Working with Total Fields
Introduction (Working with Total Fields)
Total fields are those fields that contain summary information such as subtotal and total figures. The value of a total field is calculated by Report Designer according to the total options you select. You can create total fields, insert them in reports, and manipulate them just as you do data and text fields.
This chapter explains how to create and use total fields in Report Designer. This information is presented in the following sections:
Creating and Editing Totals
Copying a Total Field
Customizing Totals
Using Total Fields in Reports
Using Totals in Calculations
Sorting and Filtering on Totals
Chapter 8: Working with Total Fields
R&R ReportWorks SQL User Manual Page 219
Creating and Editing Totals
You can define summary information such as totals and averages for any field (except text memo fields) in the composite record structure. Once you define a total field, you can insert it in your report layout or use it as part of a calculated field or another total field.
You can modify existing total fields by using any of the following methods to open the Edit Total dialog:
• Select the field and press F2;
• Right-click on the field and select Expression;
• Select Calculations ⇒ Total Field (or click the Totals button) and double-click the name of the field to be edited.
You can also use the Multi Edit and Edit Reset buttons in the Total Fields dialog to modify existing totals.
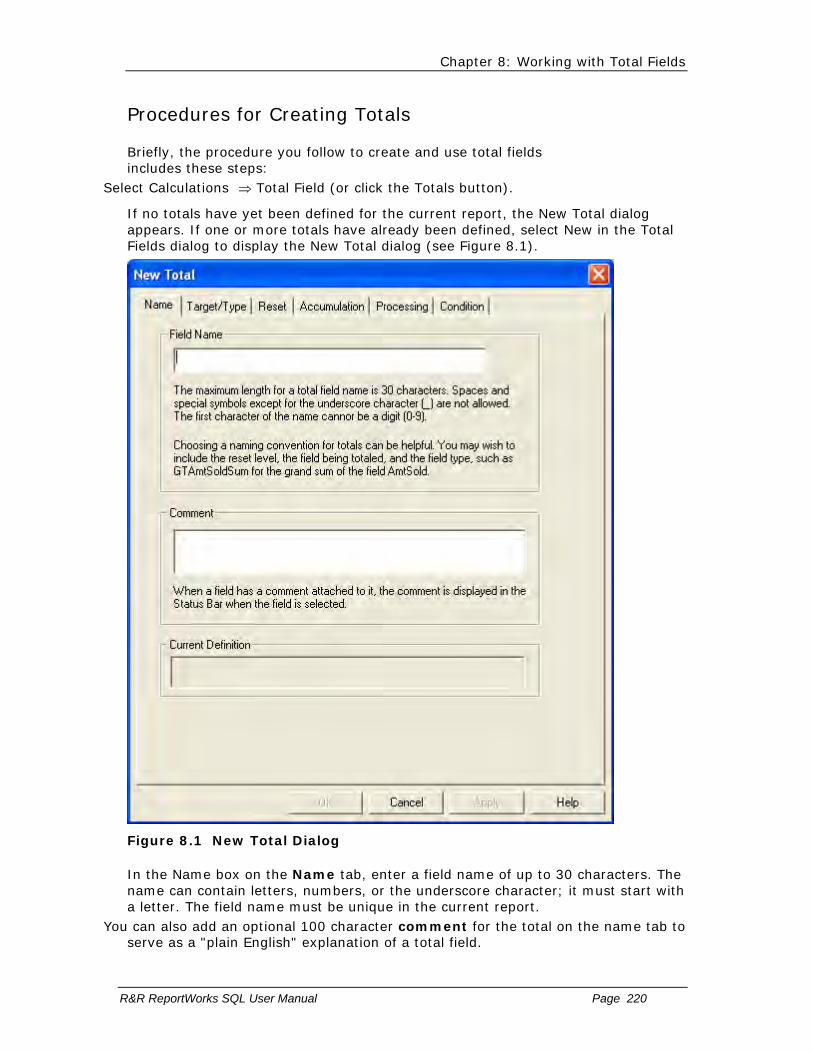
Chapter 8: Working with Total Fields
R&R ReportWorks SQL User Manual Page 220
Procedures for Creating Totals
Briefly, the procedure you follow to create and use total fields includes these steps:
Select Calculations ⇒ Total Field (or click the Totals button).
If no totals have yet been defined for the current report, the New Total dialog appears. If one or more totals have already been defined, select New in the Total Fields dialog to display the New Total dialog (see Figure 8.1).
Figure 8.1 New Total Dialog
In the Name box on the Name tab, enter a field name of up to 30 characters. The name can contain letters, numbers, or the underscore character; it must start with a letter. The field name must be unique in the current report.
You can also add an optional 100 character comment for the total on the name tab to serve as a "plain English" explanation of a total field.
Chapter 8: Working with Total Fields
R&R ReportWorks SQL User Manual Page 221
On the target/type tab, select the total type radio button to select from the available choices of Count, Sum, Average, Minimum, Maximum, Standard Deviation, and Variance. Figure 8.2 explains each of the total types.
To select the Field to be totaled, click the field selection button […]to display the select target field dialog where you select the field whose values will be totaled.
On the Reset tab, select when to reset the total: at the end of the report (Grand), at the end of each page, or after the last record in a numbered group (for any one of 8 groups).
Optionally select the Accumulation tab to change the accumulation frequency. The default accumulation frequency is Every composite, which is appropriate for most totals
Optionally select the Processing tab. The default processing mode is Running which is appropriate for most totals.
Optionally select the Condition tab to make this total a conditional total. On the Total Condition dialog enter an expression (referred to as a condition expression) that specifies the circumstances in which Report Designer will calculate this total (see the Entering a Condition Expression section of this chapter for more information about conditional totals).
The following sections explain each of these steps in detail.

Chapter 8: Working with Total Fields
R&R ReportWorks SQL User Manual Page 222
Entering a Total Field Name
In the Name edit box, enter a field name of up to 30 characters. The name can contain letters, numbers, or the underscore character; it must start with a letter. The field name must be unique.
By using a combination of upper and lower case, you can enter total field names that are easily distinguishable from the names of table fields.

Chapter 8: Working with Total Fields
R&R ReportWorks SQL User Manual Page 223
Selecting a Total Type
Select a total type from the Type Tab. The available choices are: Count, Sum, Average, Minimum, Maximum, Standard Deviation, or Variance (see Figure 8.2 for an explanation of these total types).
Select To Produce
Count Count of the records that contain data in the field. Records that contain no data in the selected field (that is, the field is blank or contains a zero formatted with "Show Zero" turned off) are not included in the count.
Sum Sum of the values in a numeric or logical field for all records containing data. (True = 1; False = 0).
Average Average (mean) of the values in a numeric or logical field for all records that contain data. Records in which the field is blank or contains a zero formatted with "Show Zero" turned off are not included in the average.
Minimum Lowest value for a numeric field, false for a logical field if any records contain false values, earliest date for a date field, first value in alphabetical order for a character field. Only records containing data are considered.
Maximum Highest value for a numeric field, true for a logical field if any records contain true values, latest date for a date field, last value in alphabetical order for a character field. Only records that contain data are considered.
Std Deviation For numeric fields, the square root of the variance. Standard deviation is calculated using the following formula, where n is the total number of values, vi is the ith
value, and avg is the average of all values:

Chapter 8: Working with Total Fields
R&R ReportWorks SQL User Manual Page 224
Variance For numeric fields, the average of NUMBER2 minus (average of NUMBER)2, where NUMBER is a numeric field and the average is computed based on the number of records totaled (not including records with blanks or zeros formatted with "Show Zero" turned off ). See the formula illustrated in the explanation of Standard Deviation. Both variance and deviation measure the degree to which individual field values vary from the average of all values totaled.
Figure 8.2 Total Choices
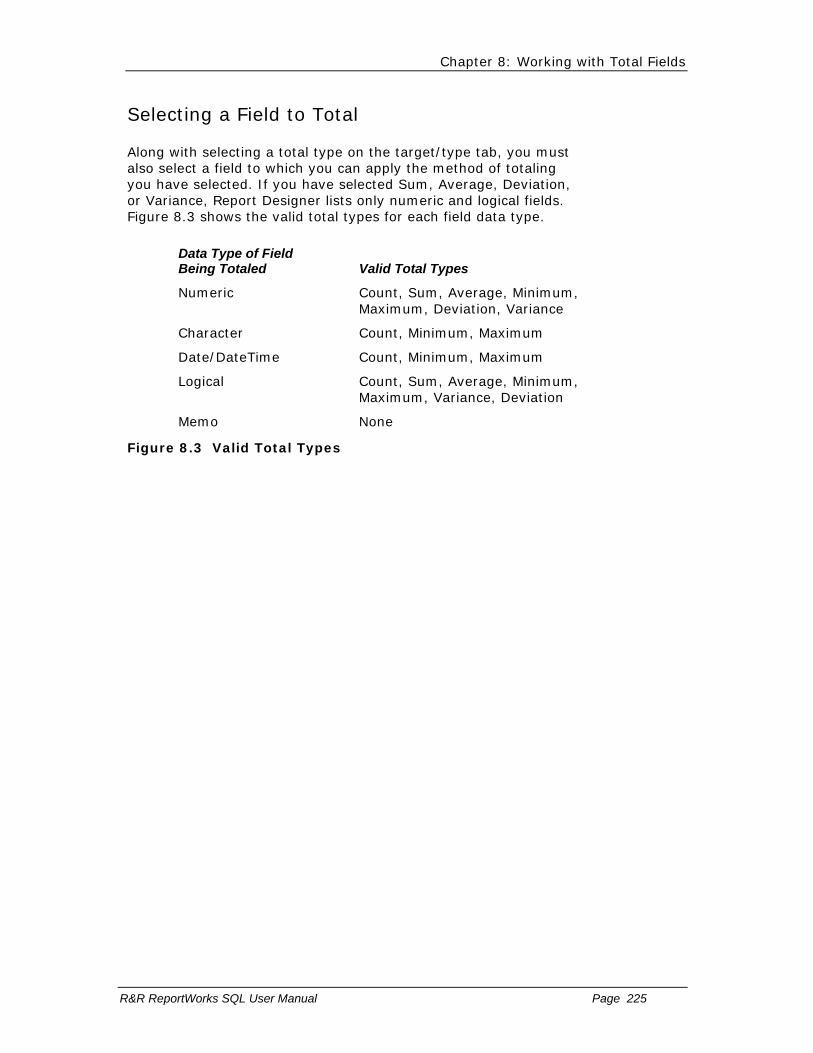
Chapter 8: Working with Total Fields
R&R ReportWorks SQL User Manual Page 225
Selecting a Field to Total
Along with selecting a total type on the target/type tab, you must also select a field to which you can apply the method of totaling you have selected. If you have selected Sum, Average, Deviation, or Variance, Report Designer lists only numeric and logical fields. Figure 8.3 shows the valid total types for each field data type.
Data Type of Field Being Totaled
Valid Total Types
Numeric Count, Sum, Average, Minimum, Maximum, Deviation, Variance
Character Count, Minimum, Maximum
Date/DateTime Count, Minimum, Maximum
Logical Count, Sum, Average, Minimum, Maximum, Variance, Deviation
Memo None
Figure 8.3 Valid Total Types

Chapter 8: Working with Total Fields
R&R ReportWorks SQL User Manual Page 226
Selecting a Total Reset Level
Next, select a total reset level on the Reset tab (see Figure 8.4). Your choice determines when Report Designer resets the value of the total field to zero. If you reset on a group field, Report Designer produces group subtotals. If you select Page Total, Report Designer produces page subtotals. If you select Grand Total, Report Designer produces grand totals for the entire report.
For example, if STATE is your first group field, you can select 1) STATE to calculate total sales by state. In this case, Report Designer produces a subtotal of sales and resets this subtotal to zero whenever a new state group begins.
Select To Produce a
Grand Total Total for the entire report
Page Total Page total for each page in the report
Numbered Group Field Subtotal for each new group
Figure 8.4 Total Reset Options

Chapter 8: Working with Total Fields
R&R ReportWorks SQL User Manual Page 227
Editing a Total Field
To edit a total field that has been inserted on the layout, first either select the field and press F2 or right-click on the field and select Expression to display the Edit Total dialog (this dialog is the same as the New Total dialog, except that it shows the name and settings for the total currently being edited).
To edit a total field that is not on the layout, first select Calculations ⇒ Total Field or the Totals button on the Standard Toolbar. On the Total Fields dialog (see Figure 8.5), double-click the name of the field to be edited to display the Edit Total dialog.
Figure 8.5 Total Fields Dialog Box
After you have opened the Edit Total dialog, follow these steps to edit the total field:
On the Name tab you can change the name or add/change the comment for the total.
On the Target/Type tab you change the field to be totaled, the total type
On the Reset tab you can change the reset level.
On the Accumulation tab you can change the accumulation frequency.
On the Processing tab you can select a processing option (Running or Pre-processed)
On the Condition tab you can change or enter a condition expression.
When you have made all necessary changes to the total field, select OK on the Edit Total dialog; then select Close.

Chapter 8: Working with Total Fields
R&R ReportWorks SQL User Manual Page 228
Note that you can select the Edit Reset button on the Total Fields dialog (Figure 8.5) to change the reset level of all fields that reset at a particular level. For example, if you select "Page total" in the Change From box and "DESCRIPTN" in the Change To box on the Edit Reset dialog, all fields previously defined to reset at the end of each page would instead reset when the value of the DESCRIPTN field changed.

Chapter 8: Working with Total Fields
R&R ReportWorks SQL User Manual Page 229
Creating AutoTotals for Multiple Fields
You can select multiple fields on the layout and have Report Designer automatically create totals for those fields and insert the totals on a new band line.
To create totals for multiple fields: 1. Highlight all of the fields you want Report Designer to create
totals for (Ctrl-click on each field).
2. Select Calculations ⇒ Auto Total to display the Auto Total dialog.
3. On the Auto Total dialog, select a total type and reset level for the totals to be created. Note that only total types valid for all selected fields are available for selection.
4. When you are finished defining the totals, select OK. Report Designer assigns a name to each of the total fields in the batch. The name is in the form Totalnnnnn, where nnnnn is a number in the range 00001 to 99999 and is incremented by 1 for each total in the batch. (If necessary, you can change the field names individually later using Calculations ⇒ Total Field Edit.)
Report Designer creates the totals and inserts them in a band appropriate for the reset level you specified (Summary band for Grand totals, Page Footer for Page totals, and Group Footer for Group totals).

Chapter 8: Working with Total Fields
R&R ReportWorks SQL User Manual Page 230
Multi Editing Totals
In the Total Field dialog, the Multi Edit button allows you to select several total fields and then make the same edit changes to each one. Multi Edit has the same tabbed format as is available for creating or editing a single totals. The only difference is that in place of the name tab there is a selection dialog where you can select one or more totals and change the properties of each within a single dialog.
For example you could select a Group1, Group2 and Grand Total that sum the numeric field QTYSOLD and change the sum to be an average.
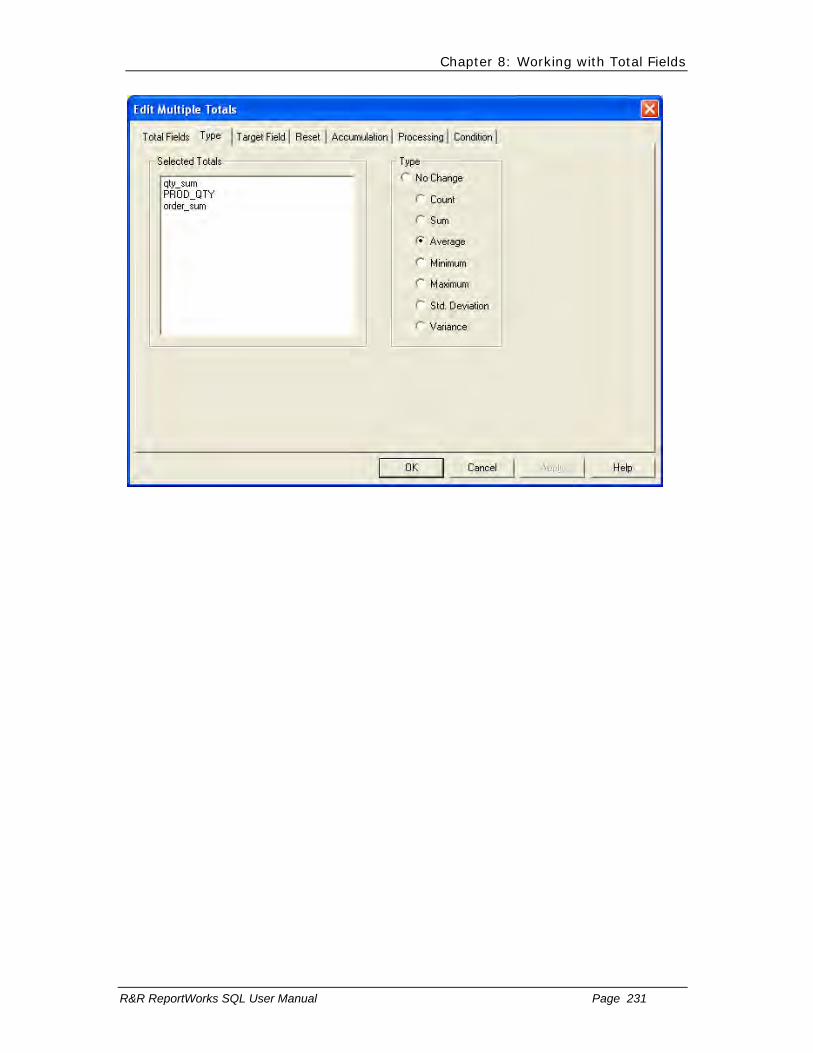
Chapter 8: Working with Total Fields
R&R ReportWorks SQL User Manual Page 231
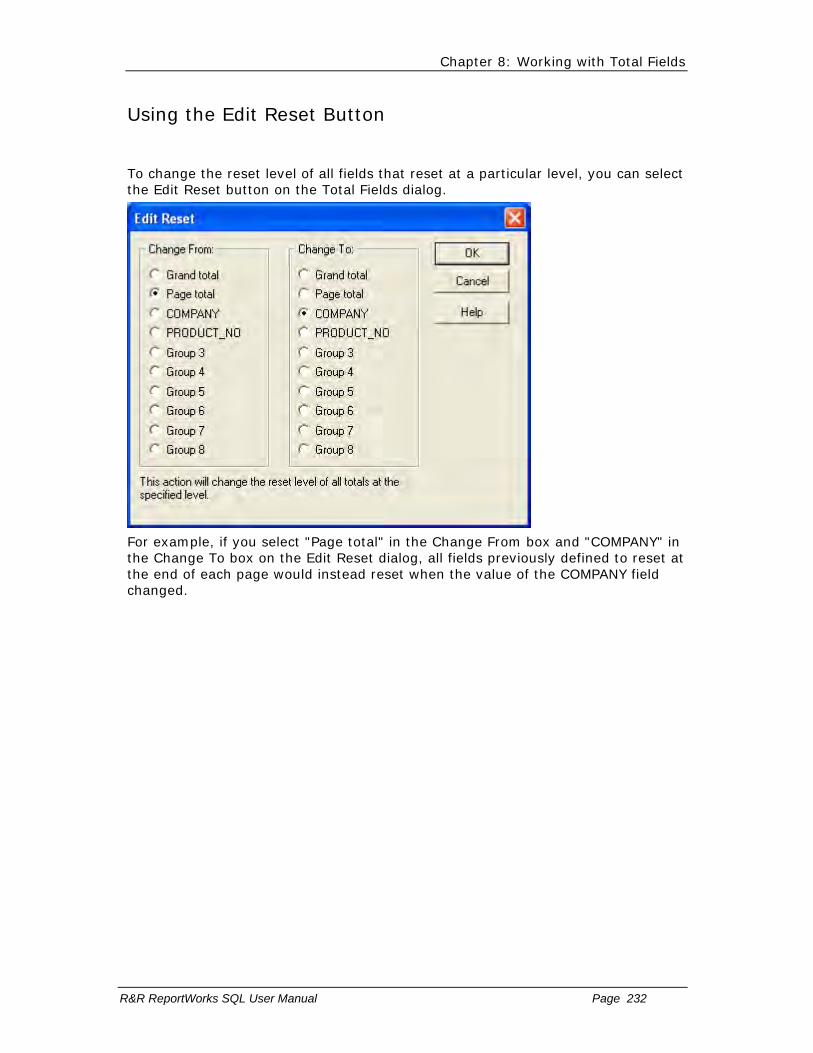
Chapter 8: Working with Total Fields
R&R ReportWorks SQL User Manual Page 232
Using the Edit Reset Button
To change the reset level of all fields that reset at a particular level, you can select the Edit Reset button on the Total Fields dialog.
For example, if you select "Page total" in the Change From box and "COMPANY" in the Change To box on the Edit Reset dialog, all fields previously defined to reset at the end of each page would instead reset when the value of the COMPANY field changed.

Chapter 8: Working with Total Fields
R&R ReportWorks SQL User Manual Page 233
Copying a Total Field
In the Total Fields dialog, you can select a field and then use the Copy button to create a new total whose name will be blank and whose settings will be the same as the original field.

Chapter 8: Working with Total Fields
R&R ReportWorks SQL User Manual Page 234
Deleting a Total Field
To delete a total field: 1. Select Calculations ⇒ Total Field to display the Total Fields
dialog (Figure 8.5).
2. In the Fields list, select the name of the total field you want to delete.
3. Select Delete.
If the total field you selected is used in any calculated fields or other total fields, these fields will be deleted as well. In this case, Report Designer shows you a list of all the fields that will be deleted and asks you to confirm or cancel the deletions. Note that you cannot delete any total field that is used as a join field.
4. Select Close.
If you delete a total that is used in a filter, you must edit the filter.
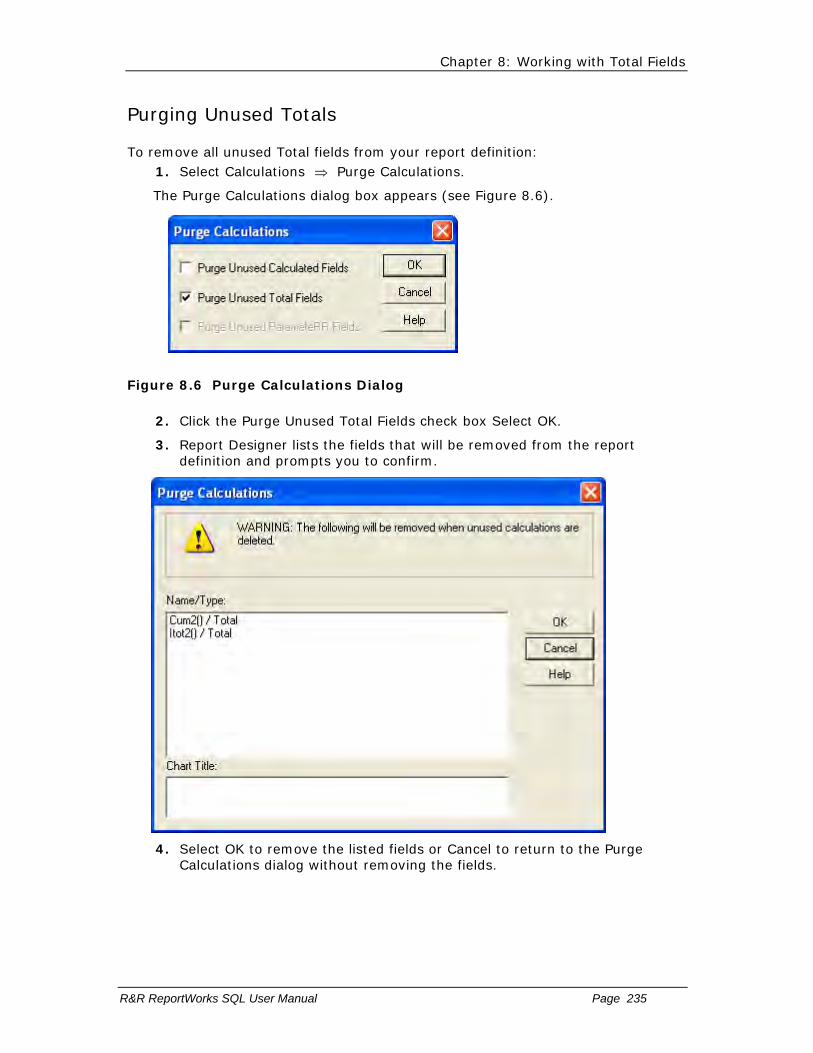
Chapter 8: Working with Total Fields
R&R ReportWorks SQL User Manual Page 235
Purging Unused Totals
To remove all unused Total fields from your report definition: 1. Select Calculations ⇒ Purge Calculations.
The Purge Calculations dialog box appears (see Figure 8.6).
Figure 8.6 Purge Calculations Dialog
2. Click the Purge Unused Total Fields check box Select OK.
3. Report Designer lists the fields that will be removed from the report definition and prompts you to confirm.
4. Select OK to remove the listed fields or Cancel to return to the Purge Calculations dialog without removing the fields.

Chapter 8: Working with Total Fields
R&R ReportWorks SQL User Manual Page 236
Customizing Totals
When you create a total field, Report Designer automatically adopts a default method of accumulating the total value and a default mode of total processing. This default behavior is appropriate for most total values. However, you can select use the New/Edit Total dialog to change this default behavior.
Totals may also optionally use a conditional expression to control the circumstances in which the total will be calculated.
You can also set an optional comment for a totals.
The following sections explain how to use the optional total elements of accumulation frequency,total processing, condition and comment.
Chapter 8: Working with Total Fields
R&R ReportWorks SQL User Manual Page 237
Specifying a Total Accumulation Frequency
When you create a total field, Report Designer automatically sets the accumulation frequency of the total according to the default rules defined in the next section. This accumulation frequency determines how often Report Designer adds to the total as the report is processed.
The accumulation frequency automatically set by Report Designer is appropriate for most commonly generated totals. However, the Accumulation setting (accessed by selecting Options on the New/Edit Total dialog) gives you the flexibility to override the automatic frequency to handle special cases.

Chapter 8: Working with Total Fields
R&R ReportWorks SQL User Manual Page 238
Changing the Total Accumulation Frequency
Figure 8.6 illustrates a situation in which you might want to change the total accumulation frequency. Suppose you want two different totals: a count of distinct products and a count of sales transactions. Counting the Product field will give you the total sales transactions. With an accumulation frequency of "Every composite," Report Designer will add to the product count every time it reads a record, resulting in a count of five.
To get the first total, a count of distinct products sold, you can use the Accumulation setting to change the accumulation frequency of the Product count field. If PRODUCT is the first group field, you would set the accumulation frequency to 1)PRODUCT. Using this method of accumulation frequency, Report Designer will add to the product count every time the value in the Product group field changes, resulting in a count of two.
Product Quantity Date
PC Com 10 01/02/96
PC Com 20 01/02/96
PC Com 5 01/25/96
PC Graphics 25 01/02/96
PC Graphics 10 01/30/96
Figure 8.6 Sample Report
You can change the accumulation frequency to any of the following:
� Every composite — accumulates total once per composite record
� 1 through 8 — accumulates total once per selected group
� Once per page — accumulates total once per page
You can see what accumulation frequency is assigned to any total field inserted on the report by looking at the Expression that displays in the Total Fields dialog box or in the Status Bar when the field is highlighted. For example, the following Expression indicates that the total field provides a grand count of the PRODUCT field accumulated every time the value of the PRODUCT field changes:
Count(PRODUCT,Grand,PRODUCT,Running)

Chapter 8: Working with Total Fields
R&R ReportWorks SQL User Manual Page 239
Default Accumulation Frequency Rules
When you create a total field, Report Designer automatically sets the accumulation frequency to either once per record or once per group according to the following rules:
� Totals of totals are accumulated when the field being totaled resets. This accumulation frequency also applies to totals of calculated fields that are derived from totals.
� Counts of group fields are accumulated once per group.
� Totals of all other fields are accumulated after each record.
Chapter 8: Working with Total Fields
R&R ReportWorks SQL User Manual Page 240
Selecting a Total Processing Option
By default, Report Designer calculates the value of a total progressively as it reads each record that contributes to the total. This default processing enables you to see the running value of the total at any point in the report. For example, you can create an invoice with a running total of line amounts by putting an invoice group total field on a Record line in the report.
However, Report Designer allows you to change this processing mode so that the total value is pre-processed — that is, the value is computed before the report records are output. This pre-processing mode enables you to have access to the final value of the total earlier than it would ordinarily be calculated. As a result, you can place such a total field anywhere in the report, even at the beginning. Any total field except those listed in the Restrictions on Pre-Processed Totals section in this chapter can be designated as pre-processed.
In order to change Report Designer’s method of total processing for a given total field, select the Processing tab from the New/Edit Total dialog and then select a processing method:
� Running — Report Designer’s default method of total processing, in which a total is calculated progressively as each record contributing to the total is read.
� Pre-processed — A method of calculating the value of a total field by performing a preliminary read-through of the data to accumulate totals designated as pre-processed.
You can see what processing mode is assigned to any total field by looking at the Expression that displays in the Total Fields dialog box or in the Status Bar when the field is highlighted. For example, the following Expression indicates that the field provides a pre-processed grand count of the CUST_NO field:
Count(CUST_NO,Grand,Every,Pre-processed)

Chapter 8: Working with Total Fields
R&R ReportWorks SQL User Manual Page 241
When To Use Pre-Processed Totals
You should specify that a total be pre-processed when you want to:
� Place a grand total field in the Title band or a group total in a Group Header band of a report.
� Create a calculated field such as a "percent-of-total" field that compares a value in each record to a final value based on all records in a group or report.
� Use a total field to sort a report.
� Use a total field in a filter.
For example, the report excerpt in Figure 8.7 illustrates the use of pre-processed totals in Group Headers, sorting, and calculated fields. This report contains two total fields that have been designated as pre-processed. The first field, PRODCNT, counts the number of orders for each product. This field is pre-processed so that it can appear in the Group Header ("There are PRODCNT orders for PRODUCT.").
The second field, PRODSUM, sums the number of units ordered for each product. This field is pre-processed so that it can appear in the Group Header ("A total of PRODSUM units were ordered."), be used to sort the report in descending order based on total number of units sold, and be used in the calculated field expression that produces the figures in the "Percent of Units Ordered" column on the report.
Note that defining pre-processed totals affects the performance of your report, since Report Designer must read through records twice: once to calculate pre-processed totals and once to perform other calculations (if any) and generate the report. Also, the temporary files that Report Designer creates to generate pre-processed totals can in some instances be quite large.
WEEKLY PRODUCT ORDER SUMMARY There are 10 orders for PC Database. A total of 315 units were ordered. Order Number Quantity Percent of Units Ordered 32205 50 15.9% 32202 50 15.9% 32207 45 14.3% 32210 45 14.3% 32201 30 9.5% 32211 25 7.9% 32216 25 7.9% 32208 20 6.3% 32206 15 4.8% 32214 10 3.2% There are 6 orders for PC Spreadsheet. A total of 90 units were ordered. Order Number Quantity Percent of Units Ordered

Chapter 8: Working with Total Fields
R&R ReportWorks SQL User Manual Page 242
32205 30 33.3% 32212 15 16.7% 32206 15 16.7% 32210 10 11.1% 32203 10 11.1% 32202 10 11.1%
Figure 8.7 Sample Report Using Pre-Processed Totals

Chapter 8: Working with Total Fields
R&R ReportWorks SQL User Manual Page 243
Restrictions on Pre-Processed Totals
Pre-processed totals are accumulated in a single preliminary pass through the data that, for reasons of performance, does not involve page formatting. For this reason, the following types of total fields cannot be designated as pre-processed:
� Pagination-related totals — These totals include page totals, totals whose accumulation frequency has been set to once per page, and totals involving calculated fields that use PAGENO( ). This restriction results from the exclusion of page formatting from the preliminary total evaluation process.
� Totals of certain pre-processed totals — These totals include any total-of-total fields where the total-of-total accumulates more frequently than the field being totaled resets (for example, a grand total, accumulating once per composite, of a pre-processed group one subtotal). This restriction results from the fact that pre-processed totals are evaluated in a single extra pass. For totals such as these to be pre-processed, two extra passes would be required: one for the first pre-processed total and another for the field that totals it.
� Totals that reset or accumulate on group fields that are themselves pre-processed totals (or calculated fields whose expressions include pre-processed totals). This restriction is also a result of the single pass used to accumulate pre-processed totals. For such fields, two passes would be required.

Chapter 8: Working with Total Fields
R&R ReportWorks SQL User Manual Page 244
Entering a Condition Expression
For any total field, you can specify a condition expression that controls the circumstances in which Report Designer will calculate that total. To do so, you select the Condition tab on the New/Edit Total dialog and enter a valid expression to control the total field. Syntax for a condition expression is the same as that for calculated field expressions.
To specify a conditional total, follow these steps: 1. On the New/Edit Total dialog, select the Condition tab.
2. Press the Edit button to display the Conditional Expression dialog.
3. Enter the condition expression. You can build the expression by selecting from fields, operators, expressions, and UDFs.
4. When the expression is complete, select Verify to ensure that the syntax is correct; then select OK. The condition expression is displayed in the Condition box.
For example, suppose you have a report that summarizes product sales. The report includes a QUANTITY field containing the number of items for each order. You can create a conditional total that provides the total number of items ordered for each product number. To create such a conditional total for items with product number 901, you would first create a total named Tot901 (for example) that is a Grand Sum of the QUANTITY field. You would then select Condition and enter the following condition expression:
PRODUCT_NO = "901"
You could then place the TOT901 field in the report’s Summary area to provide a grand total of items ordered for that product code. You could create similar conditional total fields for all remaining product numbers.
To see whether a condition has been attached to a total field, look at the Expression description that displays in the Status Bar when the field is highlighted. If a condition expression is attached, the description includes "Conditional."

Chapter 8: Working with Total Fields
R&R ReportWorks SQL User Manual Page 245
Adding a Field Comment
You can enter a brief comment (up to 100 characters) to serve as a "plain English" explanation of a total field. To do so, select Calculations ⇒ Total Field, highlight the field name, and select Edit. On the Name tab of there is a Comment box. Enter the explanation in the Comment box and then select OK. When a total field has a comment attached to it, that comment is displayed in the Status Bar when the field is highlighted.
You can also enter or edit a field comment using the Comment tab on the Field Properties tabbed dialog (select the field and press F9).
Chapter 8: Working with Total Fields
R&R ReportWorks SQL User Manual Page 246
Using Total Fields in Reports
After you define a total field, you can insert it on the report layout just as you insert any other field. Where you place a total field on your layout usually depends on the reset level you have selected.
To insert a total field, double-click on the layout, select Insert Field, or press F11. Select from the list of database, total, and calculated fields.
Since Report Designer calculates totals cumulatively as it reads each record that contributes to the total, the total field’s final value is not available until the last record being totaled has been read (unless you defined the field as a pre-processed total).
For this reason, you typically place total fields on lines that correspond to their reset levels as follows:
Place a group total on a Group Footer band line of the same level as the total’s reset level (for example, put a total that resets on the ORDER_NO field on a Group Footer band line associated with the ORDER_NO field).
Place a page total on a Page Footer band line.
Place a grand total on a Summary band line.
Each of these placement options is explained in more detail in the following sections, along with the option of placing a total field so that you can see the progressive accumulation of its value.
Note that the Processing setting (accessed by selecting Options on the New/Edit Field Total dialog box) enables you to create pre-processed totals that make a field’s "final" value available for use earlier than it would ordinarily be calculated.
When a total field is highlighted on the layout, the Status Bar displays a description of the field using the following syntax: type (field, reset, accumulation, processing,[conditional])
In this total description, "type" indicates the total type (for example, Sum); "field" is the name of the field being totaled; "reset" indicates when the total is reset to zero; "accumulation" indicates the frequency with which the total is added to; "processing" indicates when the total value is computed — before records are output (Pre-processed) or progressively as records are read (Running); and "conditional" (if present) indicates that a condition expression has been attached to the total.

Chapter 8: Working with Total Fields
R&R ReportWorks SQL User Manual Page 247
Inserting Group Totals
A group total field is typically placed on a Group Footer band line defined at the same level as the field’s reset level. For example, if you selected a group field as the reset level for a total, you will usually place the total on a Group Footer band line associated with the same field.
Figure 8.8 shows a report layout that contains a total of the AMOUNT field. The group field selected as the reset level for the total is CUST_ID. Each line marked 1GF-CUST_ID is a Group Footer band line associated with CUST_ID. The second of these lines contains the total field selected to reset each time the value of CUST_ID changes.
Figure 8.8 Report Layout for Group Total
The layout in Figure 8.8 produces the report excerpt in Figure 8.9.
Customer Item Quantity Amount Joyce Adams 903 36 $216.00 901 24 $96.00 Customer Total: $312.00 Fred Anderson 910 18 $162.00 902 12 $60.00 901 36 $144.00 Customer Total: $366.00
Figure 8.9 Report with Group Totals
A total is produced for each new group of records, that is, every time the value of the CUST_ID field changes.
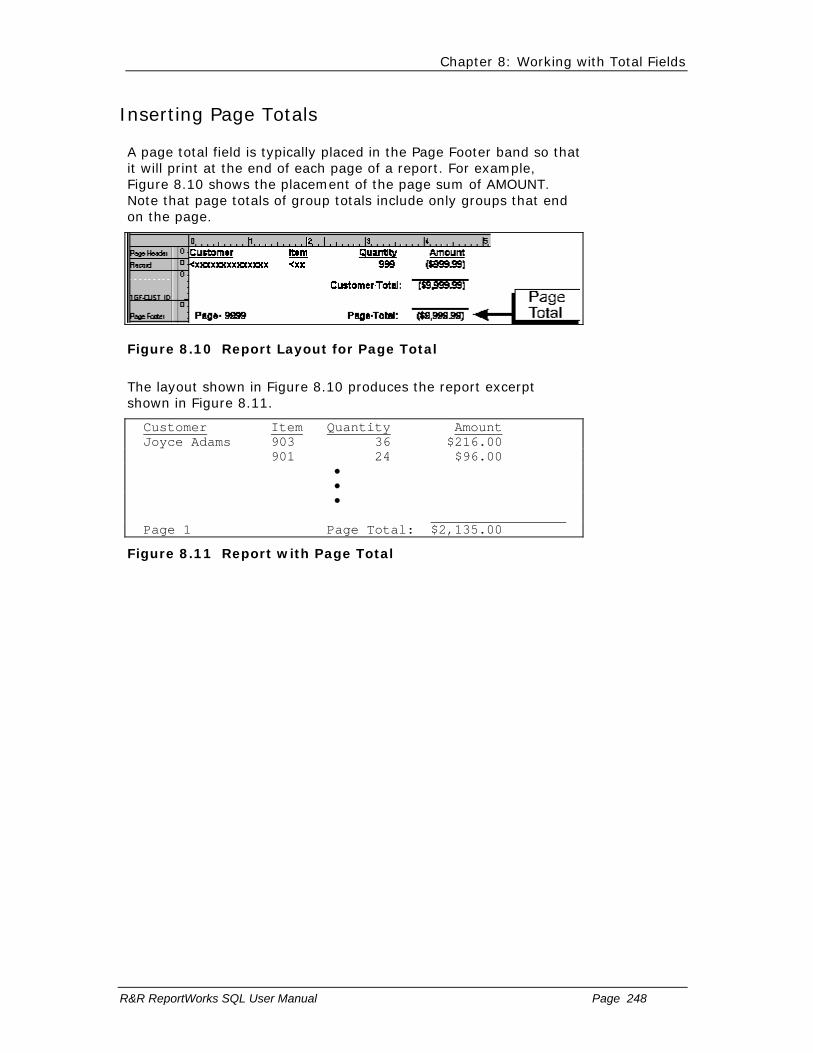
Chapter 8: Working with Total Fields
R&R ReportWorks SQL User Manual Page 248
Inserting Page Totals
A page total field is typically placed in the Page Footer band so that it will print at the end of each page of a report. For example, Figure 8.10 shows the placement of the page sum of AMOUNT. Note that page totals of group totals include only groups that end on the page.
Figure 8.10 Report Layout for Page Total
The layout shown in Figure 8.10 produces the report excerpt shown in Figure 8.11.
Customer Item Quantity Amount Joyce Adams 903 36 $216.00 901 24 $96.00 • • • Page 1 Page Total: $2,135.00
Figure 8.11 Report with Page Total
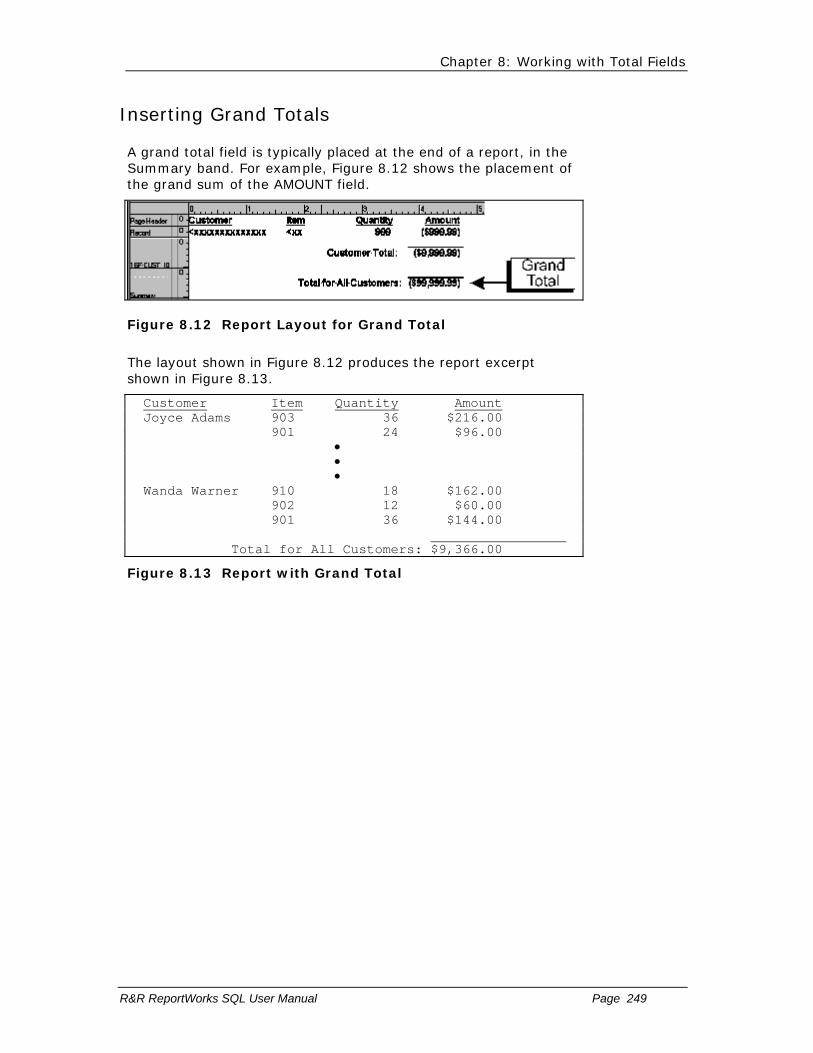
Chapter 8: Working with Total Fields
R&R ReportWorks SQL User Manual Page 249
Inserting Grand Totals
A grand total field is typically placed at the end of a report, in the Summary band. For example, Figure 8.12 shows the placement of the grand sum of the AMOUNT field.
Figure 8.12 Report Layout for Grand Total
The layout shown in Figure 8.12 produces the report excerpt shown in Figure 8.13.
Customer Item Quantity Amount Joyce Adams 903 36 $216.00 901 24 $96.00 • • • Wanda Warner 910 18 $162.00 902 12 $60.00 901 36 $144.00 Total for All Customers: $9,366.00
Figure 8.13 Report with Grand Total

Chapter 8: Working with Total Fields
R&R ReportWorks SQL User Manual Page 250
Displaying Progressive Accumulation
You can also place total fields on lines where they will display the progressive accumulation of the total value as records, groups, or pages are processed. For example, you might create a total field with Grand Total as the reset level and place it on any Group Footer or Record line (placing it on a Record line will give you the maximum amount of detail). For example, Figure 8.14 shows the placement of a Grand Total field that accumulates the amount owed.
Figure 8.14 Report Layout for Progressive Total
The report layout shown in Figure 8.14 produces the report excerpt shown in Figure 8.15. Note that placing the total field on a Record line displays the progressive accumulation of the Grand Total as each record is evaluated.
Customer Amount Due Total Owed Joyce Adams $162 $162 $60 $222 $144 $366 Fred Anderson $138 $504 $117 $621 $108 $729 •
Figure 8.15 Report with Progressive Total

Chapter 8: Working with Total Fields
R&R ReportWorks SQL User Manual Page 251
Using Totals in Calculations
After you create a total field, you can use it in calculated field expressions, as well as create other totals based on it. For example, if you created a total field, ORDERTOT, that sums the line items on an invoice, you could create a calculated field to compute a 5 percent sales tax. You could also create a Grand sum of the ORDERTOT field to calculate the value of all invoices generated as the report was run.
The sales tax calculation based on the ORDERTOT field would typically be placed in the ORDERNO Group Footer or, if each invoice were a separate page, in a Page Footer line.

Chapter 8: Working with Total Fields
R&R ReportWorks SQL User Manual Page 252
Sorting and Filtering on Totals
In many cases, you can sort and filter on total fields. The following sections explain how to use totals in sorting and filtering and identify restrictions that Report Designer imposes in using totals in sorts and filters

Chapter 8: Working with Total Fields
R&R ReportWorks SQL User Manual Page 253
Sorting on Totals
You can sort on any total field that has been designated as pre-processed using the Processing setting on the New/Edit Total dialog. For example, to produce a report listing products sorted by total number of orders, you would first create a pre-processed order total field. Then, you would select the Sort button to specify the order total field as the first sort field. (See Figure 8.7 for an example.)
You can also sort on calculated fields whose expressions include pre-processed totals, unless the expressions also include table fields. For example, you can sort on a calculated field whose expression uses a pre-processed customer total field and a pre-processed order total field (e.g. ORD_TOT/CUST_TOT). However, due to the nature of Report Designer’s total processing, you cannot sort on a calculated field that figures a percent-of-total by dividing a table field by a pre-processed total (e.g. ITEMCOST/ORD_TOT). (See Chapter 10, "Sorting and Grouping Data," for more information on sorting on pre-processed totals.)

Chapter 8: Working with Total Fields
R&R ReportWorks SQL User Manual Page 254
Filtering on Totals
When you filter on a total field (or on a calculated field whose expression includes a total field), records that do not satisfy the conditions established by the filter will not contribute to the total. For this reason, total field filters might not select the records you expect unless you designate the total fields as pre-processed. For example, to print only those invoices for amounts over $1,000, make the invoice total pre-processed and define a filter condition that selects all records in which the value of this total field is greater than 1000. (See the section on filter techniques in Chapter 11, "Creating Filters)."
Two restrictions apply to Report Designer’s total processing:
You can filter on a pre-processed total only if no other pre-processed total is defined at a higher (more inclusive) reset level. For example, you cannot filter on a pre-processed group total if the report also contains pre-processed grand totals.
You cannot filter on running totals if your report contains any pre-processed totals.
Chapter 9 Working with ParameteRR Fields
Introduction
This chapter explains how to develop and use ParameteRR fields. This information is presented in the following sections:
Creating a Basic ParameteRR Field
Using the ParameteRR Field Dialog
Using the ParameteRR Value Entry Screen
Modifying a ParameteRR Field
Copying a ParameteRR Field
Purging Unused ParameteRR Fields

Chapter 9: Working with ParameteRR Fields
R&R ReportWorks SQL User Manual Page 256
Overview
Report Designer includes a field type called a ParameteRR field. ParameteRR fields are an extension of R&R calculated fields and are designed to provide users of reports with an internally generated dialog to control the entry and validation of report data. A ParameteRR Value Entry dialog will appear just before any report is printed, exported or previewed both in the Report Designer and within Runtime so that the report user can easily make any required changes.
ParameteRR fields are available for use in a report just as would an R&R calculated field. They can be used in other calculations and even totals and essentially behave in the same way as an equivalent calculated field constant. So if the ParameteRR field asks the user to enter a date and 12/31/2004 is input, this would be the equivalent of a calculated field with expression {12/31/2004}.
Beginning in Version 11, a new list type of parameteRR is also available. List parameteRRs allow you to define a list of available values for a parameteRR. When the report is executed, users can then select a value from a list of choices to use as the current value in the report.
Since the report data is not evaluated until after parameteRRs are input, parameteRR fields can be used on the report layout, in calculated field expressions or as part of a query so that the dynamic parameteRR values will drive the report results.
ParameteRR Usage Examples
Here a few examples of how you can use ParameteRR fields.
Probably the most typical use of a parameteRR field would be as a comparison value in a query. For example you might create two date parameteRR fields named StartDate and EndDate and then set up a query where OrderDate (a date field in your database) is greater than or equal to StartDate and OrderDate is less than or equal to EndDate.
When the report is run, the user will be prompted to enter the StartDate and EndDate Values. Once the user OK’s these entries, the query will be processed and only those OrderDate records that are within the date range will be selected.
Another use of ParameteRR fields might be to control the sort of a report. For example you might have an Employee List report that you might want to sort by just last name or by Department and then last name. You could set up a character parameteRR field that would prompt the user to enter either NAME or DEPT and then could use a calculated field that depends on the ParameteRR field as the sort field for the Report. Several of the reports that are included in the Report Librarian™ use this technique.
ParameteRR fields can also be used to print information such the name of the user running the report or a title entry for the start of the report. You could also have band lines within the report whose print condition depends on a parameteRR field entry. For example you could ask the user to select whether they want to see detail or summary information and then have the record band lines of the report only print if the selection was detail.

Chapter 9: Working with ParameteRR Fields
R&R ReportWorks SQL User Manual Page 257

Chapter 9: Working with ParameteRR Fields
R&R ReportWorks SQL User Manual Page 258
Using the ParameteRR Field Dialog
The ParameteRR Fields dialog lists all available ParameteRR fields in the current report.
Figure 9.1. Parameter Field Dialog
The Go to Field box allows you to enter one or more characters to limit the field list to display only field names beginning with the characters you have entered. Press backspace to clear the box and display all fields.
The field list displays the Name and description, and data type and numbered runtime display order for each parameteRR field.
An asterisk * before a field name indicates that the field is currently used within the report.
Click on a column heading to sort the list by that column.
Click on a sorted column heading to reverse the sort order.
Select and drag a column header separator bar to resize a column.
Use arrow keys or the scrollbars to scroll through the list.
You can select a field name and then drag it from the list onto the report layout.
The default value box shows the current default value for the selected field.
The Move Up and Move Down buttons you can control the order that ParameteRRs will appear in the ParameteRR Value Entry screen when the report is executed.
Selecting the Close button closes this dialog.

Chapter 9: Working with ParameteRR Fields
R&R ReportWorks SQL User Manual Page 259
The New button brings you to the New ParameteRR field dialog.
The Edit button brings up the Edit ParameteRR field dialog for the currently selected field. You can also edit a ParameteRR field by selecting it on the report layout screen and the pressing F2.
The Copy button allows you to create a new parameteRR having the same properties as the currently selected parameteRR field.
The Delete Button deletes the currently selected parameteRR field without giving a confirmation prompt.
The Comment Button allows you to enter a brief comment (up to 100 characters) to serve as a "plain English" explanation of a parameteRR field. Enter the explanation in the Comment box and then select OK. When a parameteRR field has a comment attached to it, the text of that comment is displayed in the Status Bar when the field is highlighted. You can also enter or edit a field comment using the Comment tab on the Properties tabbed dialog (select the field and press F9).

Chapter 9: Working with ParameteRR Fields
R&R ReportWorks SQL User Manual Page 260
Creating a ParameteRR Field
To create a new ParameteRR field:
1. Select Calculations->ParameteRR Field or click the ParameteRR button on the Standard Toolbar.
If no parameteRR fields have been defined for the current report, the New ParameteRR dialog appears. If one or more parameteRR fields have already been defined, select New in the Calculated Fields dialog to display the New ParameteRR dialog (see Figure n.n).
The New ParameteRR field dialog has 4 available tabs.
Name
Value
Presentation
Validation or List Validation
The available settings for each of these tabs will be described below.
Chapter 9: Working with ParameteRR Fields
R&R ReportWorks SQL User Manual Page 261
ParameteRR Name Tab Settings
The ParameteRR name tab allows you to define the name and optional display caption of a parameteRR field.
Name
You must type a unique valid R&R field name In the Field Name edit box. A parameteRR field name can be up to 30 characters in length. It can contain letters, numbers, or the underscore character; it must start with a letter. The field name must not be the same as any database or other R&R computed field in this report and cannot contain spaces.
Display Caption
The optional display caption will be used in place of the ParameteRR’s field name in the field list section of the ParameteRR Value entry dialog. Note that you can use freely use spaces and punctuation. So you could name a ParameteRR field STARTDATE but could use a display caption of Starting Date.
If you leave this box blank, R&R will use the parameteRR field name when prompting for a value in the ParameteRR value entry screen.
Chapter 9: Working with ParameteRR Fields
R&R ReportWorks SQL User Manual Page 262
ParameteRR Value Tab Settings
The parameteRR value tab sets the data type of the parameteRR field, its default value, options regarding its runtime behavior and whether it will use a validation list to set its available values.
Data Type
In the Data Type list box, you must select a data type for the parameteRR. The available choices are:
o Character
o Numeric
o Date
o Date/Time
Default Value
Based on the data type selection, you then enter a default value for the field. The default value will be used as the value of the field within the report unless it is updated via the ParameteRR value entry screen when the report is executed.
Character Default
A character default is any character or string of characters in the ANSI character set. You may leave this box empty to supply a blank string.
Numeric Default
A numeric constant is a number that may contain a decimal point and may be preceded by minus sign. For example, 3.1415927 can be used as a constant in expressions that require the value of pi to seven decimal places. To set a blank numeric default, you must enter a 0 as the default and then format the field to not display zero.
Date Default
A date default may be entered in the current windows short date format using / separators such as 11/11/2004 or may be selected using the calendar button to bring up a calendar control. Use the arrows in the calendar header to scroll by month. Click on the year in the header to use the year spin control. Select a date from the calendar by clicking on the day.
R&R supports dates in the range Mar 1, 1600 to Dec 31, 2999.
Datetime Default
A date time default is entered just as for a date but with the additional selection of a time component. You must provide a date before adjusting the time. When you create a new date time default the time portion defaults to the current system time. You can manually enter any part of the time or can select a time part (use

Chapter 9: Working with ParameteRR Fields
R&R ReportWorks SQL User Manual Page 263
the right and left arrows to select each of the time components) and then use the spin controls to change the selected time part.
Logical Default
A logical constant is a true or false value that is selected via a radio button.
Options Checkboxes
Replace Default with Runtime Input Value
If this box is checked, the saved ParameteRR default value will be replaced with the user input value that is entered via the ParameteRR Value Entry dialog. This setting will only take effect if the report is being run within the report designer.
Note that if the current value is replaced with an input value and you want that change to be preserved for future R&R sessions, you will need to save the report prior to exiting the designer. By default this box is un-checked when a new parameteRR field is created.
Prompt at Runtime
When this box is checked (and the parameteRR field is actually used in within the report), this ParameteRR field will appear in the ParameteRR Value Entry dialog that is presented prior to report output. If it is unchecked, it will not appear in the input dialog and will instead take it’s default value automatically. By default this box is checked when a new parameteRR field is created.
List Validation Checkbox
Define Validation List
Check this box to define a list of available parameteRR values in place of setting a default value. When this box is checked, the default section of this tab is cleared. When define validation list is checked, the validation tab will then allow you to define the list of available values based upon the selected data type. Note that the validation list checkbox is disabled when the selected data type for the parameteRR is logical since a logical field already has only 2 available values.

Chapter 9: Working with ParameteRR Fields
R&R ReportWorks SQL User Manual Page 264
ParameteRR Presentation Tab Settings
The presentation tab sets the format of a parameteRR field when it is presented in the ParameteRR Value entry screen and the appearance of the field when placed on the report layout. It also allows you to define the instructions that will be presented to the user when this parameteRR is displayed in the ParameteRR value entry screen at runtime.
Display Format
Format controls the presentation format of a parameteRR field when it is presented in the ParameteRR Value entry screen and the appearance of the field when placed on the report layout.
The appearance of the display format box is dependent on the data type that was selected on the Value tab. The initial format choice will be based on the entry that was made for the default value. Use the Edit button to make changes to the displayed format.
Character Field Format
For character fields, a character width is set in number of characters.
Figure 9.2. Format Character ParameteRR Dialog
Numeric Field Format
For numeric fields you can choose the number of integer and decimals places to display. It also provides the same Numeric display formats that are available for all numeric fields.
These are Fixed, Scientific, Currency, Comma, General, Percent. You can also select whether leading zeros should be displayed.
For numeric fields, ParameteRR Value entry is not limited to the width set here however any number that is entered that is greater than the width will display as ***’s in the Present Value parameterr display box at runtime.

Chapter 9: Working with ParameteRR Fields
R&R ReportWorks SQL User Manual Page 265
Figure 9.1. Format Numeric ParameteRR Dialog
Date and Date/Time Field Format
Date and Date/Time fields can be set to any of the available date formats.
Figure 9.1. Format Date ParameteRR Dialog

Chapter 9: Working with ParameteRR Fields
R&R ReportWorks SQL User Manual Page 266
Figure 9.2. Format Date/Time ParameteRR Dialog
Logical Field Format
The edit format button is not functional for logical fields. Instead, the default logical values for True and False that have been set in Options Default Settings will be presented as radio button choices in the Parameter Value Entry screen.
Instructions
The optional instructions text box is available for all data types and is the text that will be displayed in the instructions box on the ParameteRR Value Entry screen.
This field can contain multiple lines of text. You can use CTL+ENTER to begin a new line.

Chapter 9: Working with ParameteRR Fields
R&R ReportWorks SQL User Manual Page 267
ParameteRR Validation Tab Options
The validation tab allows you set a validation expression for non-list parameteRR’s that will control the range of values that a user may enter at runtime. At Parameter Value Entry, this expression will be evaluated using the input value and if it does not evaluate to a true condition, the user will receive an error message and will not be allowed to proceed with report execution until a valid value is entered.
Validation Expression
A validation expression is an optional property for a ParameteRR field. The validation expression is used to control the range of values that a user may enter for this field at runtime. At Parameter Value Entry, this expression will be evaluated using the input value and if it does not evaluate to a true condition, the user will receive an error message and will not be allowed to proceed with report execution.
When you click the Edit button for validation, you will be presented with an Edit Parameter Validation dialog that is similar to that for an R&R calculated field.
Figure 9.3. Edit ParameteRR Validation Dialog
Chapter 9: Working with ParameteRR Fields
R&R ReportWorks SQL User Manual Page 268
The main differences are:
• The available field list only includes ParameteRR field names.
• You cannot use R&R or database field names in the expression. This is because parameteRR fields must be evaluated before report execution and are really whole report rather than record dependent.
• The expression must evaluate to a logical true or false value or you will receive the following error: Validate Expression must be logical type.
Here are some examples that show ParameteRR validation expressions and their meaning.
Examples:
Inlist(PARAM1, "Curly","Larry","Moe")
User must enter either Curly Larry or Moe in text box for character parameteRR PARAM1
PARAM2<>5
User cannot enter 5 as the numeric value for numeric parameteRR PARAM2
Inrange(PARAM3({12/01/2005},{12/31/2005})
Date must be in December 2005 for date parameteRR PARAM3
Once you have entered your expression, OK will evaluate the expression and then return you to the Edit ParameteRR dialog and the validation expression will be displayed.
The Delete button for Validation will allow you to delete any Validation expression.
Optional Error Message
The optional error string edit box is available for all data types and is the text that will be presented to the user in a dialog box when a user’s ParameteRR field entry at runtime results in an error.
This field can contain multiple lines of text. You can use CTL+ENTER to begin a new line.
Here is an example of an error box that would appear if a user entered a value of less than 100 when the validation expression was:
NUM_PARAMETERRR>100
And the error message was set to You must enter a number that is greater than 100!

Chapter 9: Working with ParameteRR Fields
R&R ReportWorks SQL User Manual Page 269
Figure 9.4. Custom Error Dialog

Chapter 9: Working with ParameteRR Fields
R&R ReportWorks SQL User Manual Page 270
ParameteRR List Validation Tab
If the Define Validation list box is checked on the Value tab, the validation tab allows you to define the list of available values for the ParameteRR field.
The items in the validation list will be presented in the ParameteRR value entry box when the report is executed. The list will be shown in the order set in this dialog and the default item will be initial selected value.
The validation list dialog has two sections. The upper section displays the current list and action buttons to modify the list. The lower section is used to add or edit a selected value.
When you create a new validation list, the only available button is the New button that allows you to add an item to the list.
Figure 9.5. New parameteRR validation list
When you click the New button, the New List item section is enabled. In value box you enter a list item. The format of this entry depends on the data type of the parameteRR field. It uses the same format as is available for entering a

Chapter 9: Working with ParameteRR Fields
R&R ReportWorks SQL User Manual Page 271
parameteRR default value.
The description box allows you to enter an up to 30 character description for each list value. This description will be displayed when the parameteRR selection list is displayed when the report is executed.
Use the Add button to add the current item to the list.
Once the list contains an item, the Edit and Delete buttons are enabled. These allow you to edit or delete the selected list item. The Move Up and Move Down buttons at the side of the list allow you to change the order is which the list items are displayed. The Default button allows you to Set/Reset an item as the default selection. When an item is set as the default, a checkmark appears before its value in the value list.
Figure 9.6. ParameteRR validation list with default selection

Chapter 9: Working with ParameteRR Fields
R&R ReportWorks SQL User Manual Page 272
Using the ParameteRR Value Entry Screen
When you select File Print, File Print Preview, File Export or Database View Result Set from the Main Menu or select their corresponding toolbar buttons, if any ParameteRR fields have been defined and used in the report, a ParameteRR Value Entry dialog box will be presented. This dialog will list each ParameteRR field (whose Prompt at runtime box was enabled) in the order set in the Calculations->ParameteRR Fields menu. You can then edit the values of any of the displayed values.
The following example will show the definition of 6 parameteRR fields and the corresponding ParameteRR Value Entry screen that is generated based on these definitions.
Figure 9.8. Example ParameteRR Fields Dialog
Selecting File->Print, File->Print Preview, File->Export or Database->View Result Set from the Main Menu in this Example report will bring you to the following Parameter Value Entry screen.
To accept all of the current default values for the listed parameteRR fields, you can press OK and the report will execute. Pressing Cancel gives a Report Canceled dialog and returns you to the Report Layout.
Typically one of more of the listed parameteRR’s will be changed prior to clicking OK to run the report.

Chapter 9: Working with ParameteRR Fields
R&R ReportWorks SQL User Manual Page 273
Figure 9.9. Example ParameteRR Value Entry dialog
The ParameteRR List
The ParameteRR Value Entry screen consists a list box at the top of the screen. In the left column are the Display Caption values for each parameteRR that is used in the report and designated with a Prompt at Runtime checkbox enabled. If a display caption has not been defined, then the actual parameteRR field name will be used. The right column contains the current formatted value of each parameteRR. You can select a ParameteRR to modify by mouse clicking in either list box or by using the Up and Down arrows on the keyboard.
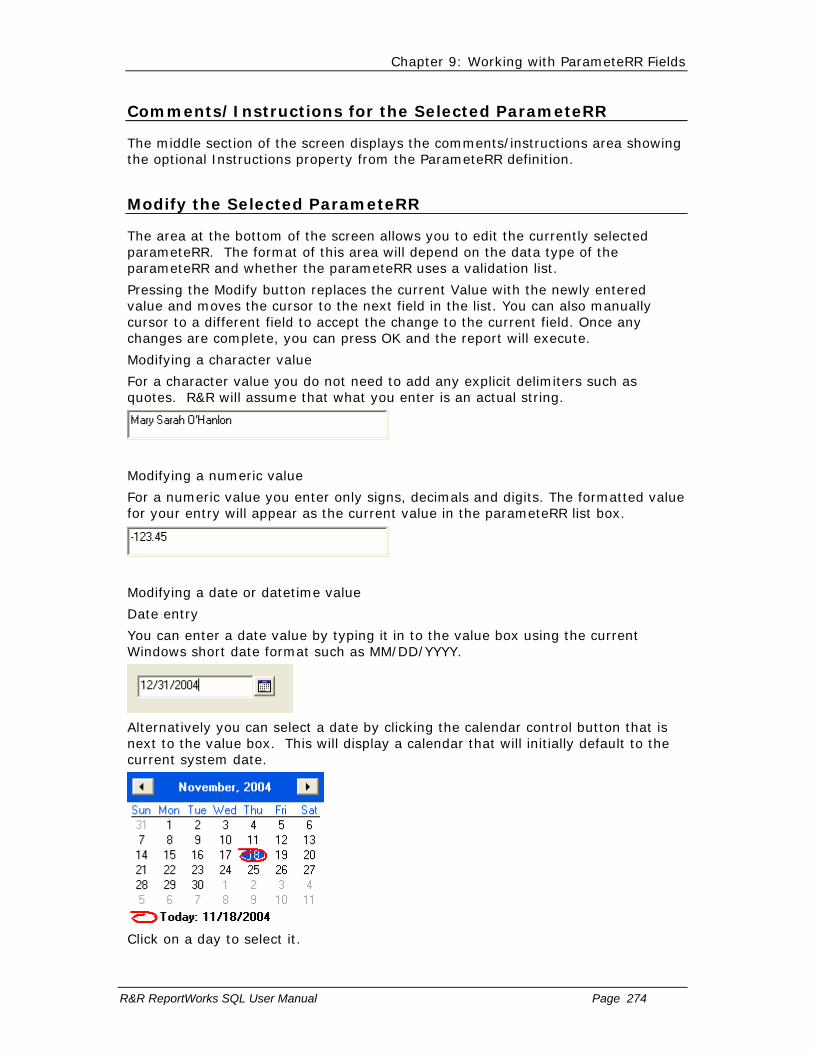
Chapter 9: Working with ParameteRR Fields
R&R ReportWorks SQL User Manual Page 274
Comments/Instructions for the Selected ParameteRR
The middle section of the screen displays the comments/instructions area showing the optional Instructions property from the ParameteRR definition.
Modify the Selected ParameteRR
The area at the bottom of the screen allows you to edit the currently selected parameteRR. The format of this area will depend on the data type of the parameteRR and whether the parameteRR uses a validation list.
Pressing the Modify button replaces the current Value with the newly entered value and moves the cursor to the next field in the list. You can also manually cursor to a different field to accept the change to the current field. Once any changes are complete, you can press OK and the report will execute.
Modifying a character value
For a character value you do not need to add any explicit delimiters such as quotes. R&R will assume that what you enter is an actual string.
Modifying a numeric value
For a numeric value you enter only signs, decimals and digits. The formatted value for your entry will appear as the current value in the parameteRR list box.
Modifying a date or datetime value
Date entry
You can enter a date value by typing it in to the value box using the current Windows short date format such as MM/DD/YYYY.
Alternatively you can select a date by clicking the calendar control button that is next to the value box. This will display a calendar that will initially default to the current system date.
Click on a day to select it.

Chapter 9: Working with ParameteRR Fields
R&R ReportWorks SQL User Manual Page 275
To scroll by month, use the left and right arrow keys on the calendar header or click on the month name to display the month list.
To scroll by year, click on the year in the header to display spin controls to the right of the year.
Time Entry
You can enter a time value by typing it in to the value box using the current Windows time format such as HH:MM:SS AM. A new time entry will initially default to the current system time.
You can also use the spin control to adjust the time. Click the control arrows to initially adjust the hours. To then adjust any of the other components, use the left and right arrows to select the component and then use the spin arrows to scroll through the available choices.
Selecting a logical value
For a logical value selection is made usingTrue/False radio buttons.

Chapter 9: Working with ParameteRR Fields
R&R ReportWorks SQL User Manual Page 276
Selecting a list value
A list parameteRR will be displayed as a scrollable list of values and descriptions. The currently selected value will have a checkmark in the select box that appears before each listed value. To select a different value, click the mouse in the checkbox for that item.

Chapter 9: Working with ParameteRR Fields
R&R ReportWorks SQL User Manual Page 277
Error Conditions
After you press OK, report execution if all listed parameteRRs have current values that do not result in errors.
An error can be returned either because the value you have entered is illegal for that data type (for example entering the date 2/29/2005 would return and error because 2005 is not a leap year) or because a parameteRR does not pass its validation condition.
When a parameteRR is defined, a validation condition can be set to control the range of values that can be used for that field. For example you could have a numeric parameteRR where an integer between 10 and 100 is required. If you try to enter the value 500 for this parameteRR, an error dialog will be displayed.
This error dialog will either be a generic message:
or it may be a custom error message that was designed specifically for this parameteRR.
You must correct any errors for report execution to proceed.
Pressing the Cancel button at any time from the ParameteRR value entry screen gives a Report Canceled dialog and returns you to the Report Layout.

Chapter 9: Working with ParameteRR Fields
R&R ReportWorks SQL User Manual Page 278
ParameteRR Time Out
The parameteRR value entry screen has a built in timeout function. If a ParameteRR screen is open for two minutes without user interaction, we now display a brief notice box saying that the screen will close unless the OK button is selected.
If OK is not selected, the report is run using the current parameteRR default values.

Chapter 9: Working with ParameteRR Fields
R&R ReportWorks SQL User Manual Page 279
Modifying a ParameteRR Field
You can use either of the following methods to open the Edit ParameteRR dialog box to modify a ParameteRR field:
• Either right-click on the field and select Expression or select the field and press F2.
• Select Calculations->ParameteRR Field and select the field to edit from the list box. Then select Edit.
The Edit ParameteRR dialog is the same as the New ParameteRR dialog, except that it shows the selected field’s name and displays its default value and any other optional properties that had been previously set.
Once the Edit ParameteRR dialog is displayed, you can then change any of its property values. See the sections above for details on entering values for each of the required and optional parameteRR properties.
Press OK to accept the changes or Cancel to exit without accepting any changes.

Chapter 9: Working with ParameteRR Fields
R&R ReportWorks SQL User Manual Page 280
Copying a ParameteRR field
In the ParameteRR Fields dialog, you can select a field and then use the Copy button to create a new parameteRR whose name will be blank and whose settings will be the same as the original field.

Chapter 9: Working with ParameteRR Fields
R&R ReportWorks SQL User Manual Page 281
Purging Unused ParameteRR Fields
To remove all unused calculated fields from your report definition:
1. Select Calculations Purge Calculations.
The Purge Calculations dialog box appears (see Figure 9.8).
Figure 9.7. Purge Calculations Dialog
Click the Purge Unused ParameteRR Fields check box (a checkmark then appears in the box).
Select OK.
Report Designer lists the fields that will be removed from the report definition and prompts you to confirm.
Select OK to remove the listed fields or Cancel to return to the Purge Calculations dialog without removing the fields.
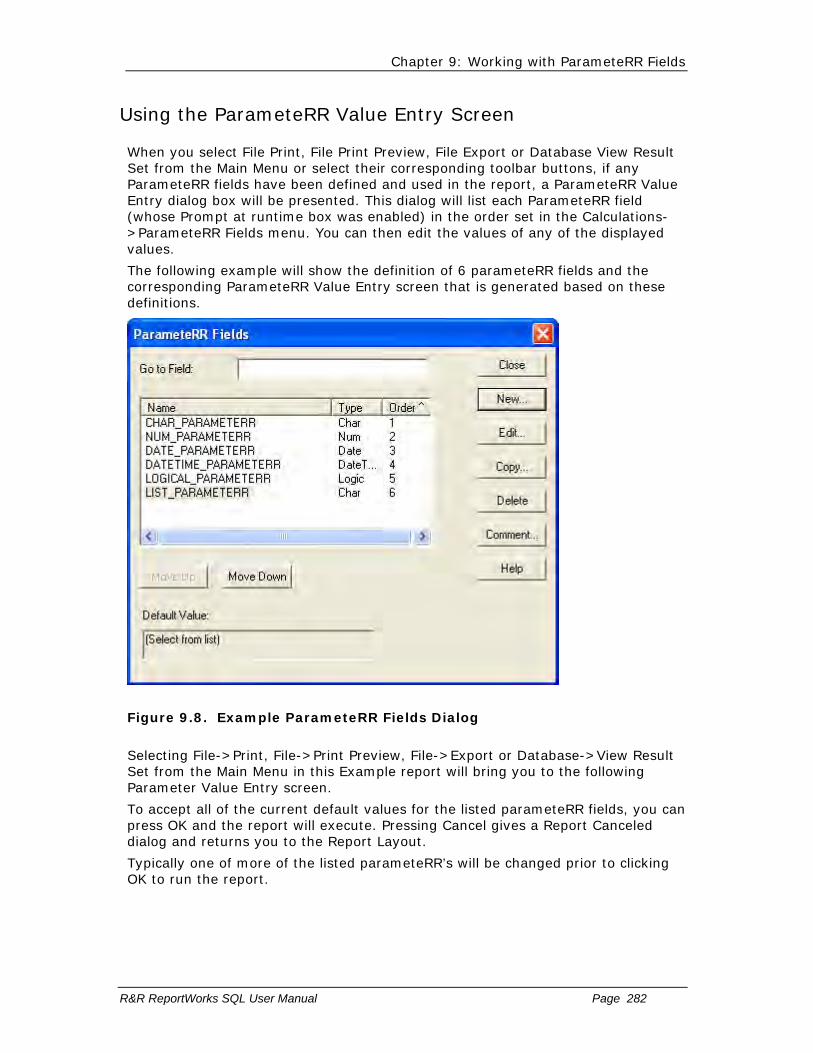
Chapter 9: Working with ParameteRR Fields
R&R ReportWorks SQL User Manual Page 282
Using the ParameteRR Value Entry Screen
When you select File Print, File Print Preview, File Export or Database View Result Set from the Main Menu or select their corresponding toolbar buttons, if any ParameteRR fields have been defined and used in the report, a ParameteRR Value Entry dialog box will be presented. This dialog will list each ParameteRR field (whose Prompt at runtime box was enabled) in the order set in the Calculations->ParameteRR Fields menu. You can then edit the values of any of the displayed values.
The following example will show the definition of 6 parameteRR fields and the corresponding ParameteRR Value Entry screen that is generated based on these definitions.
Figure 9.8. Example ParameteRR Fields Dialog
Selecting File->Print, File->Print Preview, File->Export or Database->View Result Set from the Main Menu in this Example report will bring you to the following Parameter Value Entry screen.
To accept all of the current default values for the listed parameteRR fields, you can press OK and the report will execute. Pressing Cancel gives a Report Canceled dialog and returns you to the Report Layout.
Typically one of more of the listed parameteRR’s will be changed prior to clicking OK to run the report.

Chapter 9: Working with ParameteRR Fields
R&R ReportWorks SQL User Manual Page 283
Figure 9.9. Example ParameteRR Value Entry dialog
The ParameteRR List
The ParameteRR Value Entry screen consists a list box at the top of the screen. In the left column are the Display Caption values for each parameteRR that is used in the report and designated with a Prompt at Runtime checkbox enabled. If a display caption has not been defined, then the actual parameteRR field name will be used. The right column contains the current formatted value of each parameteRR. You can select a ParameteRR to modify by mouse clicking in either list box or by using the Up and Down arrows on the keyboard.
Comments/Instructions for the Selected ParameteRR
The middle section of the screen displays the comments/instructions area showing the optional Instructions property from the ParameteRR definition.
Modify the Selected ParameteRR

Chapter 9: Working with ParameteRR Fields
R&R ReportWorks SQL User Manual Page 284
The area at the bottom of the screen allows you to edit the currently selected parameteRR. The format of this area will depend on the data type of the parameteRR and whether the parameteRR uses a validation list.
Pressing the Modify button replaces the current Value with the newly entered value and moves the cursor to the next field in the list. You can also manually cursor to a different field to accept the change to the current field. Once any changes are complete, you can press OK and the report will execute.
Modifying a character value
For a character value you do not need to add any explicit delimiters such as quotes. R&R will assume that what you enter is an actual string.
Modifying a numeric value
For a numeric value you enter only signs, decimals and digits. The formatted value for your entry will appear as the current value in the parameteRR list box.
Modifying a date or datetime value
Date entry
You can enter a date value by typing it in to the value box using the current Windows short date format such as MM/DD/YYYY.
Alternatively you can select a date by clicking the calendar control button that is next to the value box. This will display a calendar that will initially default to the current system date.
Click on a day to select it.
To scroll by month, use the left and right arrow keys on the calendar header or click on the month name to display the month list.
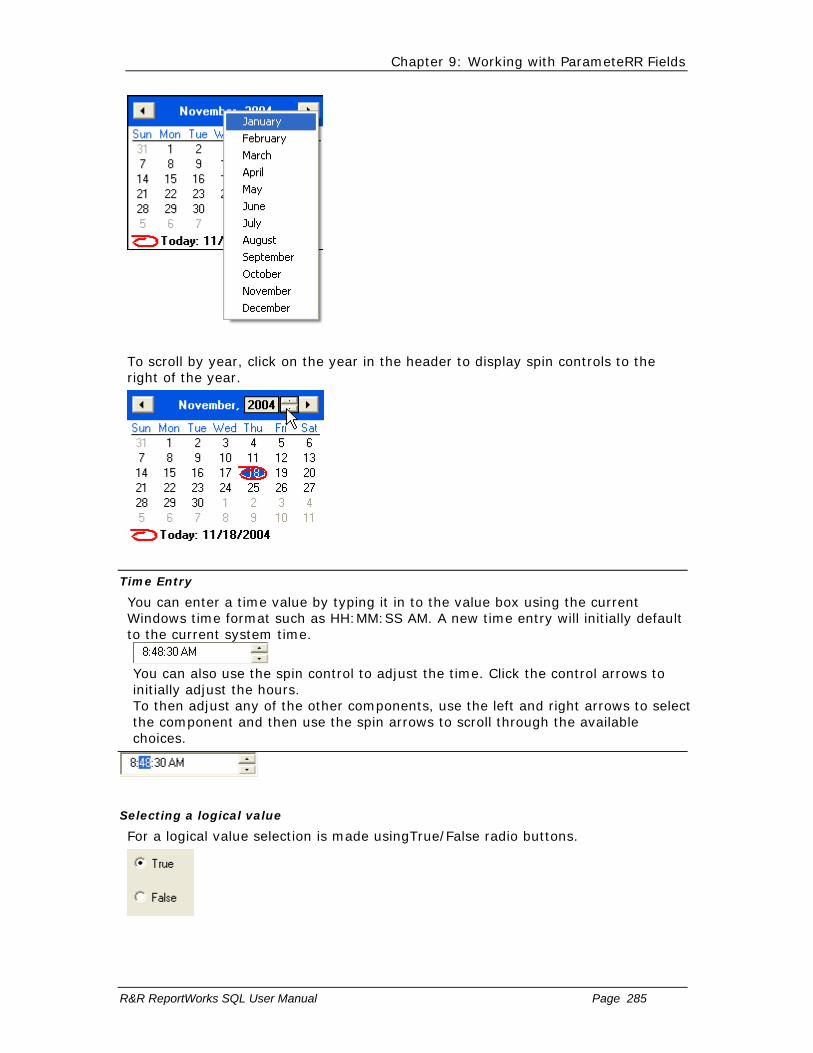
Chapter 9: Working with ParameteRR Fields
R&R ReportWorks SQL User Manual Page 285
To scroll by year, click on the year in the header to display spin controls to the right of the year.
Time Entry
You can enter a time value by typing it in to the value box using the current Windows time format such as HH:MM:SS AM. A new time entry will initially default to the current system time.
You can also use the spin control to adjust the time. Click the control arrows to initially adjust the hours. To then adjust any of the other components, use the left and right arrows to select the component and then use the spin arrows to scroll through the available choices.
Selecting a logical value
For a logical value selection is made usingTrue/False radio buttons.

Chapter 9: Working with ParameteRR Fields
R&R ReportWorks SQL User Manual Page 286
Selecting a list value
A list parameteRR will be displayed as a scrollable list of values and descriptions. The currently selected value will have a checkmark in the select box that appears before each listed value. To select a different value, click the mouse in the checkbox for that item.
Error Conditions
After you press OK, report execution if all listed parameteRRs have current values that do not result in errors.
An error can be returned either because the value you have entered is illegal for that data type (for example entering the date 2/29/2005 would return and error because 2005 is not a leap year) or because a parameteRR does not pass its validation condition.
When a parameteRR is defined, a validation condition can be set to control the range of values that can be used for that field. For example you could have a numeric parameteRR where an integer between 10 and 100 is required. If you try to enter the value 500 for this parameteRR, an error dialog will be displayed.
This error dialog will either be a generic message:
or it may be a custom error message that was designed specifically for this parameteRR.
You must correct any errors for report execution to proceed.

Chapter 9: Working with ParameteRR Fields
R&R ReportWorks SQL User Manual Page 287
Pressing the Cancel button at any time from the ParameteRR value entry screen gives a Report Canceled dialog and returns you to the Report Layout.

Chapter 9: Working with ParameteRR Fields
R&R ReportWorks SQL User Manual Page 288
ParameteRR Time Out
The parameteRR value entry screen has a built in timeout function. If a ParameteRR screen is open for two minutes without user interaction, we now display a brief notice box saying that the screen will close unless the OK button is selected.
If OK is not selected, the report is run using the current parameteRR default values.

Chapter 10 Using Functions
Introduction (Using Functions)
Report Designer offers over 100 predefined functions you can use in calculated field expressions. A predefined function is a formula that performs a specified operation such as returning the system date or the current page number. Full explanations of all predefined functions are provided in the Alphabetical List of Functions section of this chapter.
You can also define and save your own user-defined functions (UDFs) that can be used in any report just like predefined functions. For information about UDFs, see the Using User-Defined Functions section of this chapter.

Chapter 10: Using Functions
R&R ReportWorks SQL User Manual Page 290
Alphabetical List of Functions
Figure 10.2 lists and briefly describes the predefined functions, using the abbreviations listed in Figure 10.1 to indicate the input and output data type of each expression. Note that the N data type accommodates any numeric value.
Abbreviation Refers To A A table alias C A character expression D A date expression DT A datetime expression I An item (interval, numeric, character, date,
memo, or logical) L A logical expression N A numeric expression T A time expression
Figure 10.1 Abbreviations for Function Data Types
Brackets around the abbreviation for an input argument (for example [A]) indicate that the argument is optional.

Chapter 10: Using Functions
R&R ReportWorks SQL User Manual Page 291
Function Description Input Type
Output Type
ABS Returns absolute value N N ADDDAYS Adds number of days to date D,N D ADDMONS Adds number of months to date D, N D ADDWKS Adds number of weeks to date D, N D ADDYRS Adds number of years to date D, N D AGED Determines aged status of date D,N,N L ASC Converts character to numeric code C N AT Searches substring C, C, [L] N CAPFIRST Converts first letter to upper case C,[C] C CASE Returns result based on value of item I,I,[I,...]d
efault I
CDLL Enables calling of a DLL-based function
C, C, C C
CDOW Converts day of date to character D C CHR Converts numeric code to character N C CMONTH Converts month of date to character D C COPY Returns number of copy currently
printing none N
CTDT Converts character value to datetime C DT CTOD Converts character to date C D CTOS Converts character interval to seconds C DT CTOT Converts character value to time C DT DATE Returns system date none D DAY Returns day-of-month number D N DAYSBTWN Calculates number of days between
dates D, D N
DOW Calculates day-of-week number D N DQTR Calculates date of first day of quarter D D DTEADD Adds specified interval to datetime I,N,DT DT DTEDIFF Calculates difference between
datetime values I,DT,DT N
DTEPART Returns specified interval as an integer
I,DT N
DTOC Converts date to character string D, [N] C DTTOC Converts datetime to character string DT C ERROR Returns true if item has error value I L EXP Calculates the value of e**n N N FLIP Swaps words before and after a
character C, C C
FUTURE Determines whether date is in the future
D, [N] L
HALF Returns calendar half-year of date D N IIF Selects one of two expressions I, I, I I INLIST Looks up value in list of values I, [I,...] N INRANGE Determines if value is within range I, I, I L INT Discards digits to right of decimal N N

Chapter 10: Using Functions
R&R ReportWorks SQL User Manual Page 292
Function Description Input Type
Output Type
ISALPHA Determines if first character is a letter C L ISLOWER Determines if first character is lower
case C L
ISNULL Determines if field contains NULL value
C L
ISUPPER Determines if first character is upper case
C L
LASTPAGE Returns total number of pages in report
None N
LEFT Selects substring starting at left C, N C LEN Calculates length of string or field C N LIBNAME Returns full path of current report
library none C
LIKE Determines if second value matches pattern
C,I L
LOG Returns natural logarithm N N LOWER Converts upper to lower case C C LTRIM Removes leading blanks C C MAX Returns higher of two values N, N N MIN Returns lower of two values N, N N MOD Returns the remainder of division N, N N MONLEN Returns number of days in month D N MONSBTWN Calculates months between two dates D, D N MONTH Returns month-of-year number D N NDOW Returns date of next specified DOW D,N D NOW Returns the date and time the report
was started. none DT
OVER Determines whether date is past specified number of days
D,N L
PAGENO Returns current report page number none N PAST Determines whether date is in the
past D,[N] L
PDOW Returns date of previous specified DOW
D,N D
PERCOMP Correctly evaluates calculations in certain multiple-scan reports
PREVIOUS Returns value in previous composite record
I I
QTR Calculates calendar quarter of date D N QUERY Returns current filter expression none C RECNO Returns composite record number [A] N REPLICATE Repeats character expression C, N C REPNAME Returns name of current report [N] C REPORTPAGE
Returns consecutive physical page number based on entire report
RIGHT Selects substring ending at right C, N C RIPARAM Returns value of Viewer parameter C C ROUND Rounds off number N, N N

Chapter 10: Using Functions
R&R ReportWorks SQL User Manual Page 293
Function Description Input Type
Output Type
RR Disables calculated field formula translation
I none
RRUNIN Returns 1 or RI_ID value in Viewer none N RTRIM Removes trailing blanks C C SOUNDEX Returns value of string based on
sound C, [C] C
SPACE Produces a string of blank spaces N C SPELLNUM Spells a number N C SQLEXP Convert string to evaluatable
expression C C,N,D, or
L SQRT Calculates square root N N STOC Converts seconds to character string DT C STR Converts number to character N, [N],
[N] C
STRCOUNT Returns number of occurrences of substring
C,C,[L] N
STRREP Replaces one substring with another C,C,C [L] C STRSEARCH Returns starting position of nth
substring C,C,N,[L] N
STUFF Replaces part of string with new string C, N, N, C
C
SUBDAYS Subtracts number of days from date D, N D SUBMONS Subtracts number of months from
date D, N D
SUBSTR Selects substring C, N, [N] C SUBWKS Subtracts number of weeks from date D, N D SUBYRS Subtracts number of years from date D, N D TIME Returns system time none C TODATE Converts datetime to date DT D TOTIME Converts datetime to time DT T TRANSFORM Returns formatted character data C or N, C C TRIM Removes trailing blanks C C TTOC Converts time to character DT or T C TTOS Converts a time value to seconds DT N UDFNAME Returns pathname of UDF library none C UPPER Converts lower to upper case C C VAL Converts character string to number C N WDCOUNT Returns number of words in string C, [C] N WEEK Calculates week-of-month for date D N WKSBTWN Calculates weeks between two dates D, D N WORD Returns nth word of a character string C, N, [C] C YEAR Returns year number of date D N YRSBTWN Calculates years between two dates D, D N
Chapter 10: Using Functions
R&R ReportWorks SQL User Manual Page 294
ABS
Returns the absolute value of a numeric expression. The result is a positive number.
Syntax:
ABS(N), where N is any numeric expression.
Example:
To calculate the absolute value of the difference between two numeric fields NUM1 and NUM2, create the field:
ABS(NUM1 – NUM2)
If the value of NUM1 is 50 and the value of NUM2 is 100, then the value of ABS(NUM1 – NUM2) is 50.

Chapter 10: Using Functions
R&R ReportWorks SQL User Manual Page 295
ADDDAYS
Calculates a date by adding a number of days to a date. Note that you can also add dates by using the + operator.
Syntax:
ADDDAYS(D,N) where D is a date expression and N is a numeric expression representing a number of days.
Example:
To calculate the date a payment is due by adding the payment terms (NET) to the date the product was ordered (ORDERDATE), create the field:
ADDDAYS(ORDERDATE,NET)
If the value of NET is 30 and ORDERDATE is 4-1-2001, then the value of ADDDAYS(ORDERDATE,NET) is 5-1-2001.

Chapter 10: Using Functions
R&R ReportWorks SQL User Manual Page 296
ADDMONS
Calculates a date by adding a number of months to date.
Syntax:
ADDMONS(D,N) where D is a date expression and N is a numeric expression representing a number of months.
Example:
To calculate the date of the final payment of a loan by adding the number of months (TERMS) to the starting date of the loan (LOANINIT), create the field:
ADDMONS(LOANINIT,TERMS)
If the value of LOANINIT is 01/10/2001 and the value of TERMS is 48, then ADDMONS returns 01/10/2005.

Chapter 10: Using Functions
R&R ReportWorks SQL User Manual Page 297
ADDWKS
Calculates a date by adding a number of weeks to a date.
Syntax:
ADDWKS(D,N) where D is a date expression and N is a numeric expression representing a number of weeks.
Example:
To calculate a date for a return visit to the doctor by adding the number of weeks to the current appointment date (CURDATE), create the field:
ADDWKS(CURDATE,6)
If the value of CURDATE is 01/10/2001, then ADDWKS returns a value of 02/21/2001.

Chapter 10: Using Functions
R&R ReportWorks SQL User Manual Page 298
ADDYRS
Calculates a date by adding a number of years to a date.
Syntax:
ADDYRS(D,N) where D is a date expression and N is a numeric expression representing a number of years.
Example:
To calculate a follow-up date for an inoculation by adding the number of years of immunity (IMMUNYRS) to the most recent inoculation date (INOCDATE), create the field:
ADDYRS(INOCDATE,IMMUNYRS)
If the value of INOCDATE is 04/01/2000 and IMMUNYRS is 7, then this calculated field yields 04/01/2007.
Chapter 10: Using Functions
R&R ReportWorks SQL User Manual Page 299
AGED
Returns logical True if date is aged between specified values.
Syntax:
AGED(D,N1,N2) where D is a date expression and N1 and N2 are numeric expressions representing numbers of days.
Example:
To print an overdue notice if a payment is between 30 and 60 days after the order date, use the following expression:
IIF(AGED(ORD_DATE,30,60), "Payment is now overdue. Please remit now to avoid a late penalty.", "")

Chapter 10: Using Functions
R&R ReportWorks SQL User Manual Page 300
ASC
Converts the first character of a string of characters to its numeric value. This function is the opposite of CHR.
Syntax:
ASC(C) where C is a character expression.
Example:
To convert the first character of a product code (PRODCODE) to its numeric value, create the field:
ASC(PRODCODE)
If the value of PRODCODE is ABC, then ASC returns the numeric value of the letter A, which is 65 (decimal).

Chapter 10: Using Functions
R&R ReportWorks SQL User Manual Page 301
AT
Searches for a substring within a character expression and returns the number of the starting position of the substring within the expression or 0 if the substring is not found.
Syntax:
AT(C1,C2,L) where C1 is the substring character expression and C2 is the character expression within which the substring is to be located. The optional logical argument L controls the case sensitivity of the function. When L is true, the function is case sensitive; when it is false, the function is case insensitive. When this argument is not provided, the function uses the COMPARECASE case sensitivity setting in the RSW.SRT file (see Chapter 5, "Setting Defaults," for information about configuring Report Designer’s case sensitivity).
Example:
The following expression returns 11 since 'substring' starts at the 11th character in 'this is a substring':
AT('substring','this is a substring')

Chapter 10: Using Functions
R&R ReportWorks SQL User Manual Page 302
CAPFIRST
Converts the first character of each word in a character string to upper case and any other character to lower case. A word is a group of contiguous characters followed by a space, a hyphen, or any user-designated characters.
Syntax:
CAPFIRST(C1,C2) where C1 is a character expression and C2 is an optional character expression that specifies the word break character(s), the character(s) marking word separations. If C2 is absent, Report Designer uses the space and hyphen characters to determine word breaks. If you supply C2, Report Designer uses only C2 to determine word breaks (see WDCOUNT for an example).
Example:
The expression: CAPFIRST("tHiS iS aN exAMple.") returns: This Is An Example.

Chapter 10: Using Functions
R&R ReportWorks SQL User Manual Page 303
CASE
Returns a result based on the value of an item. You can use CASE instead of a nested IIF expression to return results conditionally when there is more than one condition.
Syntax:
CASE(I, value-1, result-1,...,value-n, result-n, default) where all values must be of the same data type as I (item); and all results must be of the same data type, which may be different from the data type of the item. If item is equal to value-1, Report Designer returns result-1; if equal to value-n, Report Designer returns result-n, and so on. If item is not equal to any listed value, Report Designer returns default. This function selects on the basis of equality. Memo fields may be used as results, but not as test values.
Example:
To assign different strings based on the value of PRODCODE, create the field:
CASE(PRODCODE, "101", "Desk chair", "102", "Printer stand", "103", "File cabinet", "")
This CASE expression is simpler than but equivalent to the following nested IIF expression:
IIF(PRODCODE = "101", "Desk chair", IIF(PRODCODE = "102", "Printer stand", IIF(PRODCODE = "103", "File cabinet", "")))

Chapter 10: Using Functions
R&R ReportWorks SQL User Manual Page 304
CDLL
Enables calling of a DLL-based function from within a report. You might use CDLL( ) when you want to write a DLL-based function to perform an operation that Report Designer’s functions don’t support, such as a trigonometric operation. CDLL( ) also gives you access from Report Designer to functions that are used by other elements of your application, since DLLs are available to all parts of a Windows application.
Syntax:
CDLL(string1,string2,string3) where string1 is the name of the DLL that contains the function, string2 is the name of the function, and string3 is an argument being passed to the DLL function.
Example:
For example, the calculated field expression:
CDLL("CONVERTS.DLL","MILES_KILO",STR(DISTANCE))
uses the STR function to convert the value of DISTANCE into a character string and passes the string value to the MILES_KILO function in CONVERTS.DLL, which converts the distance in miles to kilometers.
CDLL( ) expects a boolean return value from the called DLL function: true to indicate the function executed successfully; false to indicate an error. If the DLL returns a false value, CDLL( ) returns an error string. If the DLL function executes successfully, it should overwrite its input string with the output string to be returned by the Report Designer CDLL( ) function. Report Designer passes the input and output strings using an 8000-byte buffer. (For more information about CDLL( ), see the Developing Applications documentation.)

Chapter 10: Using Functions
R&R ReportWorks SQL User Manual Page 305
CDOW
Returns the name of the day of the week of a given date.
Syntax:
CDOW(D) where D is a date expression.
Example:
To print or display the day of the week for a date field INITDATE, create the field:
CDOW(INITDATE)
If the value of the INITDATE field is 03/17/2001, then CDOW yields "Saturday."

Chapter 10: Using Functions
R&R ReportWorks SQL User Manual Page 306
CHR
Converts a numeric value to one character based on the character set of the font applied to the field; that is, constitutes a change in data type from numeric to character. You can use CHR to print or display a character for which there is no keyboard representation (for example, the bullet character). This function is the opposite of ASC.
Syntax:
CHR(N) where N is an integer from 1 to 255.
Example:
CHR(212) returns the trademark symbol (™) when the Symbol font is applied to the field.

Chapter 10: Using Functions
R&R ReportWorks SQL User Manual Page 307
CMONTH
Returns the name of the month of a given date.
Syntax:
CMONTH(D) where D is a date expression.
Example:
To print or display the name of the month for a field INITDATE, create the field:
CMONTH(INITDATE)
If the value in the INITDATE field is 04/01/2001, then CMONTH yields April.
Chapter 10: Using Functions
R&R ReportWorks SQL User Manual Page 308
COPY
Returns number of the report copy currently being printed.
Syntax:
COPY( ), no arguments.
Example:
If you are printing 12 copies of a report, you can include the number of each report copy in a Footer line. Create a calculated field that contains the COPY( ) function and insert the field on the Footer line:
-------- Copy ## of 12 --------
For the third copy, this line produces:
-------- Copy 3 of 12 --------

Chapter 10: Using Functions
R&R ReportWorks SQL User Manual Page 309
CTDT
Converts a date or datetime character expression to a datetime value.
Syntax:
CTDT(C) where C is a character expression representing a date or datetime. The expression must be entered in the format specified by the Windows International date setting, using spaces, hyphens (- ), slashes(/), or periods (.) as separator characters. Report Designer’s date range is 03/01/1600 through 12/31/2400.
Example:
CTDT("12/20/2000") returns a datetime value of 12/20/2000 12:00:00am. Note that a 2-digit year will be automatically expanded to a 4-digit year in the current century.

Chapter 10: Using Functions
R&R ReportWorks SQL User Manual Page 310
CTOD
Converts a date entered or stored as a character expression to date data type. If applied to an invalid date string, CTOD produces the error value. You can substitute a wildcard of * or @ for the month, day, and/or year. Since wildcard dates are used only for selection purposes (that is, in filters), Report Designer will display them as asterisks if you insert them on the report layout.
Syntax:
CTOD(C) where C is a character expression representing a date. The expression must be entered in the format specified by the Windows International date setting, using spaces, hyphens (-), slashes (/), or periods (.) as separator characters. Report Designer’s date range is 03/01/1600 through 12/31/2400. Note that a 2-digit year will be automatically expanded to a 4-digit year in the current century.
Example:
CTOD("12/20/2000") returns a date of 12/20/2000 (when the Windows date format is set to "Short").
Example:
Define a field to use in a filter. Name the field FILTDATE:
CTOD(STR(INVMONTH,2)+"/*/2000")
If INVMONTH is 7, the value of FILTDATE is then " 7/*/2000" and a filter can be used to select all records for the month of July 2000.
Chapter 10: Using Functions
R&R ReportWorks SQL User Manual Page 311
CTOS
Converts a character expression to a number of seconds using the format specified as the second argument to the function. You can use this function to convert a character field value that represents a time interval (rather than an absolute time) into a number of seconds.
Syntax:
CTOS(C,Keyword) where C is a character expression representing a time interval and Keyword specifies how the function will interpret the input value. Valid Keywords are as follows:
Keyword Meaning hh Hours mm Minutes ss Seconds hh:mm Hours:Minutes hh:mm:ss Hours:Minutes:Seconds mm:ss Minutes:Seconds
If no Keyword is specified, the default is hh:mm:ss (hours:minutes:seconds).
Example:
Assume that you have a CHARSEC field that contains character values representing a number of seconds. For a CHARSEC value of 30:30, the field CTOS(charsec,mm:ss) would return a numeric value of 1830, since the mm:ss keyword tells CTOS to interpret 30:30 as 30 minutes:30 seconds. The field CTOS(charsec,hh:mm:ss) would return a numeric value of 109800, since the hh:mm:ss keyword tells CTOS to interpret 30:30 as 30 hours:30 minutes.
Chapter 10: Using Functions
R&R ReportWorks SQL User Manual Page 312
CTOT
Converts a character expression representing a time of day to a time field. You can use this function to convert a character field value that represents an absolute time into an appropriately formatted time field.
Syntax:
CTOT(C) where C is a character expression representing a time of day. The character expression must be in either 24-hour format or in 12-hour format with am, pm, or international time suffixes.
Example:
Assume that you have a CHARTIME field that contains character values representing a time of day. For a CHARTIME value of "0:20", the field CTOT(chartime) would return a time value of 12:20:00am. For a CHARTIME value of "8:20pm" the field CTOT(chartime) would return a value of 8:20:00pm.

Chapter 10: Using Functions
R&R ReportWorks SQL User Manual Page 313
DATE
Returns the system date at the time the report was started. This date is maintained by your computer or entered when you start your computer.
Syntax:
DATE( ) no arguments
Example:
To print/display the date in a Header line, create a field SYSDATE where SYSDATE is a calculated field that contains the function DATE( ), and then insert the field into a Header line:
--------- Date printed: mm/dd/yy ---------
This line then produces:
--------- Date printed: 4/1/2001 ---------
Chapter 10: Using Functions
R&R ReportWorks SQL User Manual Page 314
DAY
Returns the number of the day in the month.
Syntax:
DAY(D) where D is a date expression.
Example:
To print or display the day of the month for each invoice date INV_DATE, create the field:
DAY(INV_DATE)
If the value of INV_DATE is 01/16/2001, DAY(INV_DATE) returns 16.

Chapter 10: Using Functions
R&R ReportWorks SQL User Manual Page 315
DAYSBTWN
Calculates the number of days between two dates. This date difference is derived by subtracting D2 from D1.
Syntax:
DAYSBTWN(D1,D2) where D1 and D2 are both date expressions.
Example:
To calculate the number of days between the date a payment is due (DUEDATE) and the current system date DATE( ), create the field:
DAYSBTWN(DATE( ),DUEDATE)
Sample Data:
DATE( ) DUEDATE DAYSBTWN(DATE( ),DUEDATE)
4/23/2000 4/13/2000 10 4/12/2000 4/12/2000 0 4/13/2000 4/23/2000 –10

Chapter 10: Using Functions
R&R ReportWorks SQL User Manual Page 316
DOW
Converts the day-of-week of a given date expression to a number from 1 to 7. Sunday is day 1, Monday is day 2, etc.
Syntax:
DOW(D) where D is a date expression.
Example:
To convert the day of the week for a field INVDATE to its numeric form, create the field:
DOW(INVDATE)
Sample data:
INVDATE Day # 01/11/2001 5 01/13/2001 7 01/15/2001 2

Chapter 10: Using Functions
R&R ReportWorks SQL User Manual Page 317
DQTR
Returns the date of the first day of the calendar quarter for a given date. (See also the QTR function.)
Syntax:
DQTR(D) where D is a date expression.
Example:
To calculate the first day of the quarter for the date in a date field INITDATE, create the following field:
DQTR(INITDATE)
If the value of INITDATE is 5-4-2001, then DQTR(INITDATE) yields 4-1-2001, the first day of the second quarter.

Chapter 10: Using Functions
R&R ReportWorks SQL User Manual Page 318
DTEADD
Adds a specified interval to a datetime.
Syntax:
DTEADD(I,N,DT) where I specifies the interval to be added, N is how many of the specified intervals to add, and DT is the datetime expression being added to. The following table lists time periods and corresponding intervals; for this function, y (Day of Year) and w (Weekday) are equivalent to d (Day):
Interval Time Period yyyy Year q Quarter m Month y Day of Year d Day w Weekday ww Week h Hour n Minute s Second

Chapter 10: Using Functions
R&R ReportWorks SQL User Manual Page 319
DTEPART
Returns as an integer the specified part of a given datetime expression. Valid interval values are the same as those for the DTEADD function.
Syntax:
DTEPART(I,DT) where I is the interval and DT is the datetime expression.
Example:
If the date portion of a datetime field named DTEND is 04/06/2001, the expression DTEPART(ww,DTEND) produces a value of 14, indicating the 14th week of the year.

Chapter 10: Using Functions
R&R ReportWorks SQL User Manual Page 320
DTOC
Converts a date expression to a character expression in the format specified by the Windows Regional date setting. When the optional numeric argument is 1, DTOC returns a character string in the format yyyymmdd (useful for sorting by date).
Syntax:
DTOC(D,N) where D is a date expression and N is an optional numeric expression.
Example:
The expression DTOC(DATE) yields the following sample results when the Windows date format is "Short" and Day and Month leading zeros are specified:
DATE Character Conversion 01/10/2001 "01/10/2001" 01/13/2001 "01/13/2001"
By using 1 as the numeric argument, you can use a simple DTOC expression like DTOC(DATE,1) to replace expressions like the following:
STR(YEAR(DATE))+STR(MONTH(DATE))+STR(DAY(DATE))

Chapter 10: Using Functions
R&R ReportWorks SQL User Manual Page 321
DTTOC
Converts a datetime expression to a character string.
Syntax:
DTTOC(DT) where DT is a datetime expression.
Example:
To convert the date and time values of a datetime field named DTEND to character strings, create a calculated field with the expression DTTOC(DTEND).

Chapter 10: Using Functions
R&R ReportWorks SQL User Manual Page 322
ERROR
Returns logical true if the input item has the "error value" or logical false if not. Report Designer represents an error value as asterisks. This function allows you to define and use your own error return value. For example, you may want to print "You have an error" instead of a string of asterisks.
Syntax:
ERROR(I) where I can be any data type.
Example:
To print 0 instead of * as the error value for the numeric field AMOUNT, create the following field:
IIF(ERROR(AMOUNT),0,AMOUNT)
Use this calculated field instead of AMOUNT.

Chapter 10: Using Functions
R&R ReportWorks SQL User Manual Page 323
EXP
Calculates the value of e**n where e is the base of natural logarithms.
Syntax:
EXP(N) where N is a numeric expression.
Example:
To determine the value of e**2.000, create the following field:
EXP(2.000)
The result is 7.3891
Chapter 10: Using Functions
R&R ReportWorks SQL User Manual Page 324
FLIP
Exchanges the data before a specified character with the data following the character. Commonly used to flip last name with first name based on a comma between the two parts of the name. See examples.
Syntax:
FLIP(C1,C2) where C1 and C2 are character expressions. C1 is the character expression to flip and C2 is the "flip character," often a comma.
When C2 is a comma, FLIP eliminates the leading and trailing spaces for the part following the comma and puts a space between the flipped parts. See examples.
C2 may also include an asterisk before or after the flip character. The asterisk causes Report Designer to return only part of C1. Placing an asterisk after the flip character returns only the data after the flip character. Placing an asterisk before the flip character returns only the data before the flip character. See examples.
Example:
To flip the data in a FULLNAME field from last-name, first-name order to first-name last-name order:
FLIP(FULLNAME,',')

Chapter 10: Using Functions
R&R ReportWorks SQL User Manual Page 325
FUTURE
Returns logical True if supplied date is in the future and logical False if not. If the optional argument "1" is included, the current date is considered to be in the future.
Syntax:
FUTURE(D,[1]) where D is a date expression and 1 is an optional numeric argument that causes the current date to be considered as in the future.
Example:
To determine whether the value in a field named DUE_DATE is in the future, use the following expression:
FUTURE(DUE_DATE)

Chapter 10: Using Functions
R&R ReportWorks SQL User Manual Page 326
HALF
Returns the calendar half-year of the specified date. If date is in the range January 1 to June 30, this function returns 1; if in the range July 1 to December 31, it returns 2.
Syntax:
HALF(D) where D is a date expression.
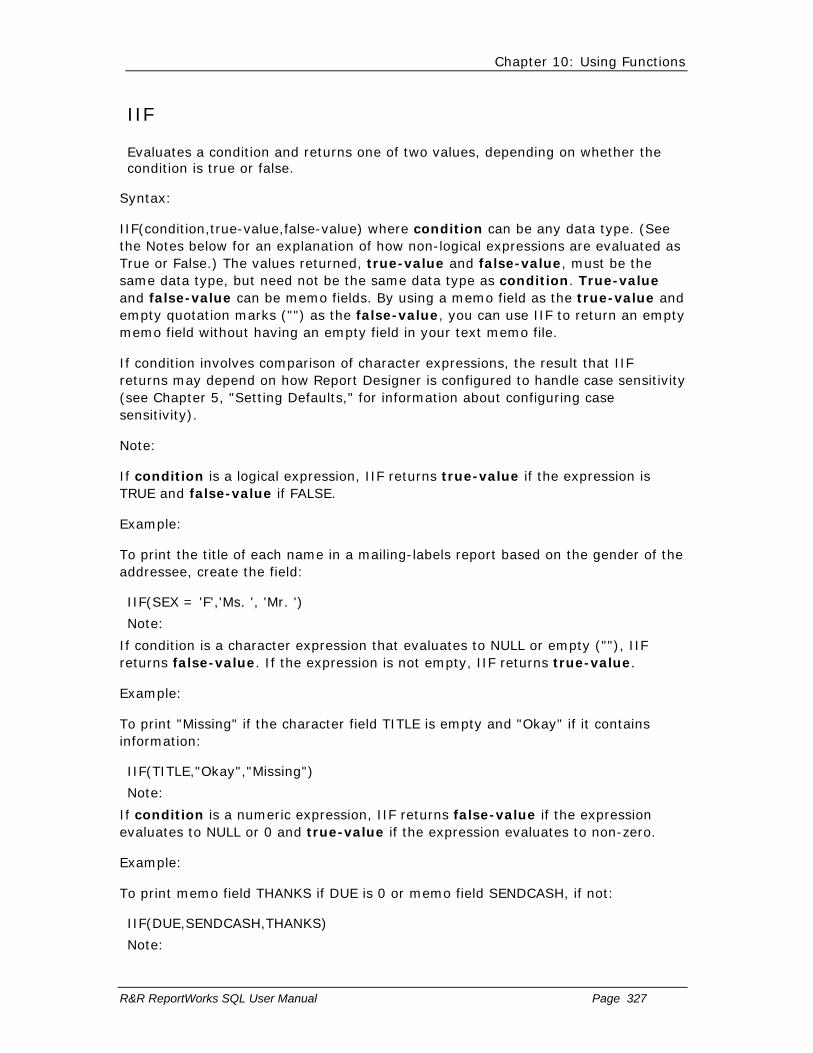
Chapter 10: Using Functions
R&R ReportWorks SQL User Manual Page 327
IIF
Evaluates a condition and returns one of two values, depending on whether the condition is true or false.
Syntax:
IIF(condition,true-value,false-value) where condition can be any data type. (See the Notes below for an explanation of how non-logical expressions are evaluated as True or False.) The values returned, true-value and false-value, must be the same data type, but need not be the same data type as condition. True-value and false-value can be memo fields. By using a memo field as the true-value and empty quotation marks ("") as the false-value, you can use IIF to return an empty memo field without having an empty field in your text memo file.
If condition involves comparison of character expressions, the result that IIF returns may depend on how Report Designer is configured to handle case sensitivity (see Chapter 5, "Setting Defaults," for information about configuring case sensitivity).
Note:
If condition is a logical expression, IIF returns true-value if the expression is TRUE and false-value if FALSE.
Example:
To print the title of each name in a mailing-labels report based on the gender of the addressee, create the field:
IIF(SEX = 'F','Ms. ', 'Mr. ')
Note:
If condition is a character expression that evaluates to NULL or empty (""), IIF returns false-value. If the expression is not empty, IIF returns true-value.
Example:
To print "Missing" if the character field TITLE is empty and "Okay" if it contains information:
IIF(TITLE,"Okay","Missing")
Note:
If condition is a numeric expression, IIF returns false-value if the expression evaluates to NULL or 0 and true-value if the expression evaluates to non-zero.
Example:
To print memo field THANKS if DUE is 0 or memo field SENDCASH, if not:
IIF(DUE,SENDCASH,THANKS)
Note:

Chapter 10: Using Functions
R&R ReportWorks SQL User Manual Page 328
If condition is a date expression that evaluates to empty (for example, a date field that contains no date within it), IIF returns false-value; otherwise, IIF returns true-value.
Example:
To return logical T if DATE contains data or logical F if not.
IIF(DATE,.T.,.F.)
Note:
If condition is a memo field, IIF returns true-value if the memo field contains characters, even if the characters are only spaces and tabs. Otherwise, IIF returns false-value.
Example:
To return the string "See Comment" if COMMENT contains characters and the string "No Comment" if COMMENT does not contain characters:
IIF(COMMENT, "See Comment", "No Comment")
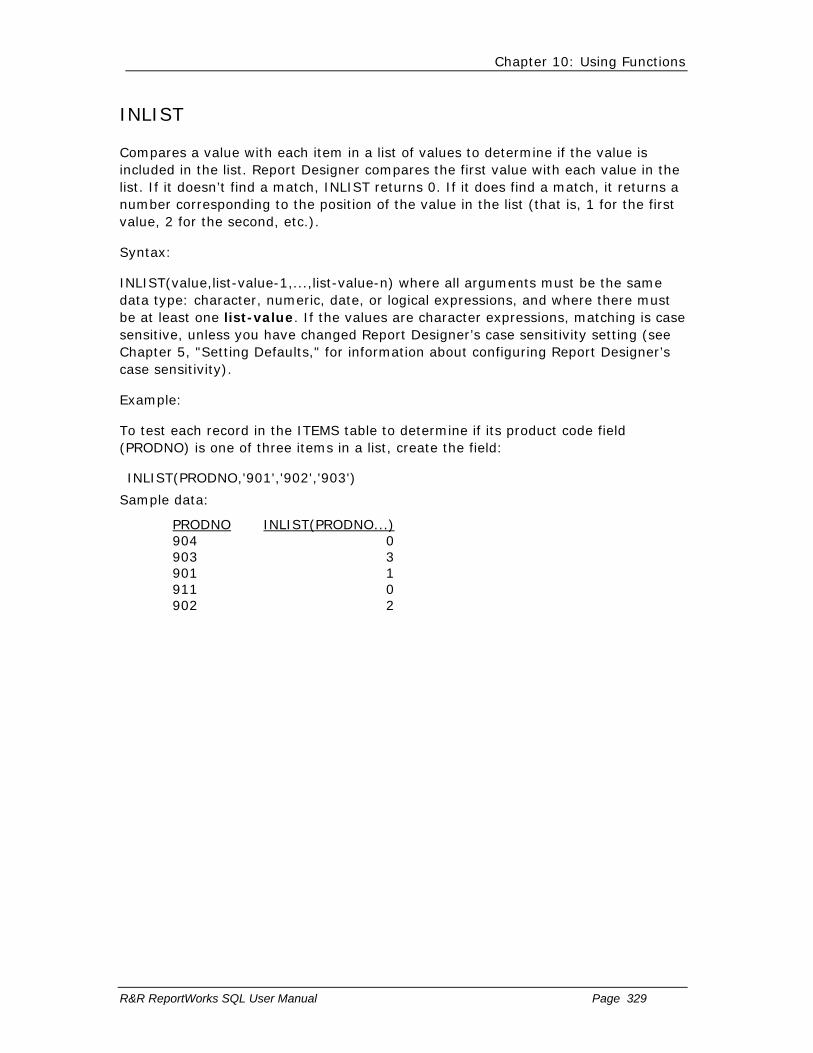
Chapter 10: Using Functions
R&R ReportWorks SQL User Manual Page 329
INLIST
Compares a value with each item in a list of values to determine if the value is included in the list. Report Designer compares the first value with each value in the list. If it doesn’t find a match, INLIST returns 0. If it does find a match, it returns a number corresponding to the position of the value in the list (that is, 1 for the first value, 2 for the second, etc.).
Syntax:
INLIST(value,list-value-1,...,list-value-n) where all arguments must be the same data type: character, numeric, date, or logical expressions, and where there must be at least one list-value. If the values are character expressions, matching is case sensitive, unless you have changed Report Designer’s case sensitivity setting (see Chapter 5, "Setting Defaults," for information about configuring Report Designer’s case sensitivity).
Example:
To test each record in the ITEMS table to determine if its product code field (PRODNO) is one of three items in a list, create the field:
INLIST(PRODNO,'901','902','903')
Sample data:
PRODNO INLIST(PRODNO...) 904 0 903 3 901 1 911 0 902 2

Chapter 10: Using Functions
R&R ReportWorks SQL User Manual Page 330
INRANGE
Determines if a value is within a specified range of values. Returns logical True if the value is equal to or greater than the lowest value and equal to or less than the highest value. Returns False if not.
Syntax:
INRANGE(value,low-value,high-value) where all arguments must be the same data type; character, numeric, date, or logical expressions. If the values are character expressions, matching is case sensitive, unless you have changed Report Designer’s case sensitivity setting (see Chapter 5, "Setting Defaults," for information about configuring Report Designer’s case sensitivity).
Example:
To determine if the price of each item in a PRICES table is within the range of 4.95 and 6.95, create the field:
INRANGE(LISTPRICE,4.95,6.95)
Sample data:
PRODNO LISTPRICE INRANGE(LISTPRICE...) 903 12.95 F 901 6.95 T 902 5.00 T 904 4.95 T

Chapter 10: Using Functions
R&R ReportWorks SQL User Manual Page 331
INT
Converts a numeric expression to an integer by discarding all digits to the right of the decimal point.
Syntax:
INT(N) where N is a numeric expression.
Example:
INT(NUMBERS)
Sample data:
NUMBERS INT(NUMBERS) 14.345 14 45.543 45 62.987 62

Chapter 10: Using Functions
R&R ReportWorks SQL User Manual Page 332
ISALPHA
Determines if the first character of a character expression is any upper or lower case letter, including non-English letters. Returns logical True if yes; False if not.
Syntax:
ISALPHA(C) where C is a character expression.
Example:
To determine in which records the character field PARTNO begins with a letter, create the field:
ISALPHA(PARTNO)
Sample data:
PARTNO ISALPHA(PARTNO) abcd T 1bc2 F z101 T

Chapter 10: Using Functions
R&R ReportWorks SQL User Manual Page 333
ISLOWER
Determines if the first character of a character expression is a lower case letter, including non-English letters. Returns logical True if yes; False if not.
Syntax:
ISLOWER(C) where C is a character expression.
Example:
To determine in which records the character field PARTNO begins with a lower case letter, create the field:
ISLOWER(PARTNO)
Sample data:
PARTNO ISLOWER(PARTNO)
ABCDE F abcde T

Chapter 10: Using Functions
R&R ReportWorks SQL User Manual Page 334
ISNULL
Determines if the specified field contains the NULL value. Returns logical True if yes; False if no.
Syntax:
ISNULL(fieldname) where fieldname is a field defined in one of the tables used in the report.

Chapter 10: Using Functions
R&R ReportWorks SQL User Manual Page 335
ISUPPER
Determines if the first character of a character expression is an upper case letter, including non-English letters. Returns logical True if yes; False if not.
Syntax:
ISUPPER(C) where C is a character expression.
Example:
To determine in which records the first character of character field PARTNO is in upper case, create the field:
ISUPPER(PARTNO)
Sample data:
PARTNO ISUPPER(PARTNO) AbCdE T aBCde F

Chapter 10: Using Functions
R&R ReportWorks SQL User Manual Page 336
LEFT
Selects a specified number of characters starting from the left-most character of a character expression.
Syntax:
LEFT(C,N) where C is a character expression and N is a numeric expression for the number of characters to select.
Example:
To create a field PARTNO to contain the first 4 characters of the field PARTID, use LEFT as follows:
LEFT(PARTID,4)
Sample data:
PARTID PARTNO abcdyy abcd abefxx abef
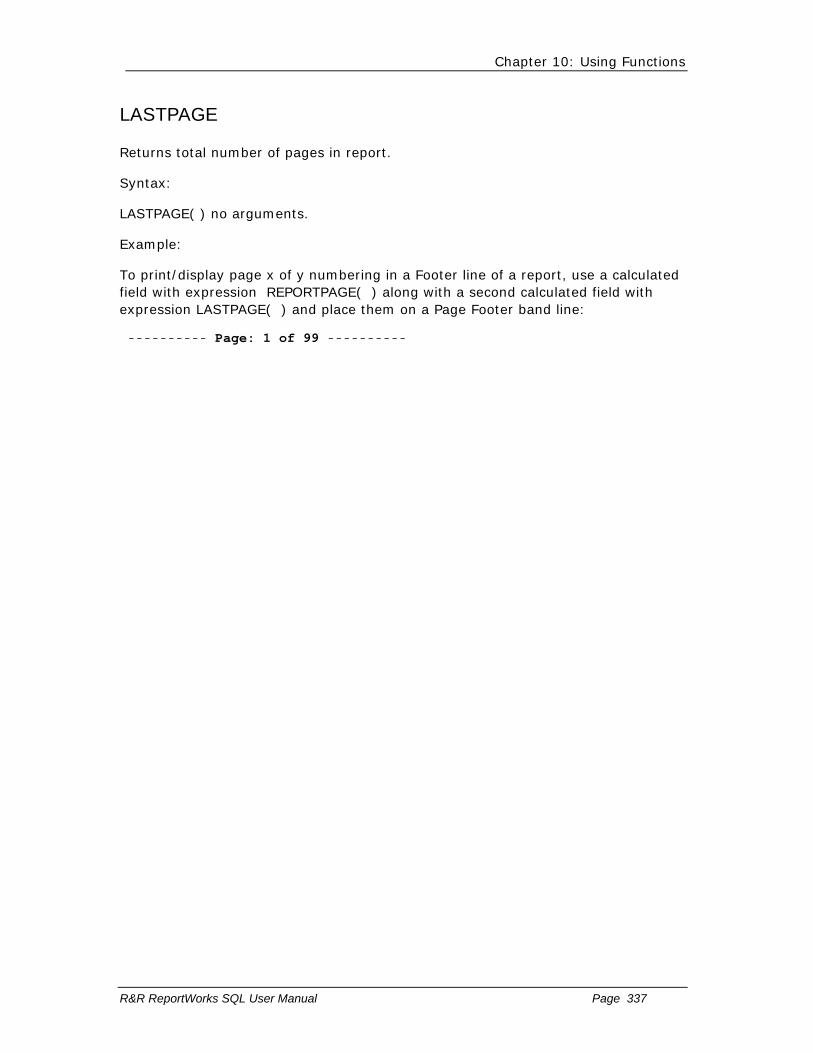
Chapter 10: Using Functions
R&R ReportWorks SQL User Manual Page 337
LASTPAGE
Returns total number of pages in report.
Syntax:
LASTPAGE( ) no arguments.
Example:
To print/display page x of y numbering in a Footer line of a report, use a calculated field with expression REPORTPAGE( ) along with a second calculated field with expression LASTPAGE( ) and place them on a Page Footer band line:
---------- Page: 1 of 99 ----------

Chapter 10: Using Functions
R&R ReportWorks SQL User Manual Page 338
LEN
Calculates the length of a character expression. Trailing spaces, if any, are counted. Length of a null string is zero.
Syntax:
LEN(C) where C is a character expression.
Example:
To produce a list of authors (AUTHORS) and titles (TITLES) with a dot leader (...) between them, use LEN with REPLICATE and RTRIM as follows:
AUTHOR–REPLICATE(".",60–LEN(AUTHOR–RTRIM(TITLE)))+RTRIM(TITLE)
Sample report (using a monospaced font):
Barr.............Handbook of Artificial Intelligence Nierenberg..........How to Read a Person Like a Book Wiener...................................Cybernetics

Chapter 10: Using Functions
R&R ReportWorks SQL User Manual Page 339
LIBNAME
If the current report was opened from a report library, LIBNAME returns the full path and name of that report library file. If the current report was saved as a compound file document, this function returns an empty string.
Syntax:
LIBNAME( ), no arguments.
Example:
To include the complete path and name of the report library file, create a calculated field consisting only of LIBNAME( ). Then insert the field in an appropriate area of the report.
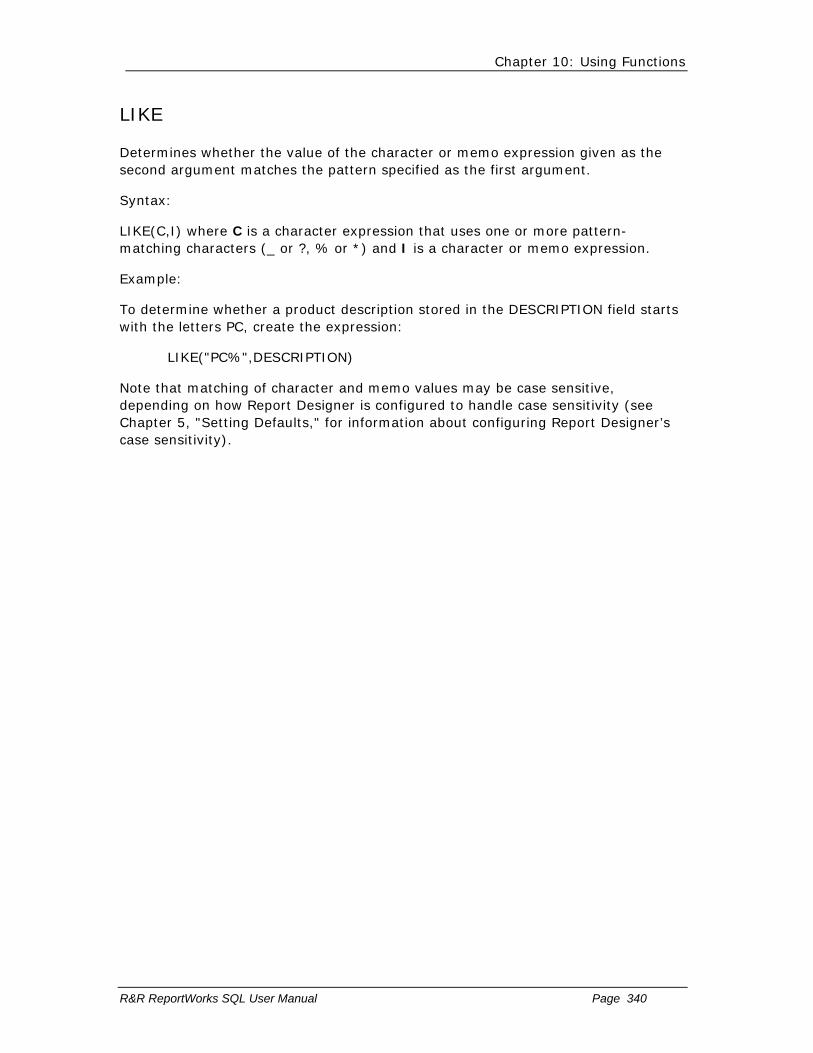
Chapter 10: Using Functions
R&R ReportWorks SQL User Manual Page 340
LIKE
Determines whether the value of the character or memo expression given as the second argument matches the pattern specified as the first argument.
Syntax:
LIKE(C,I) where C is a character expression that uses one or more pattern-matching characters (_ or ?, % or *) and I is a character or memo expression.
Example:
To determine whether a product description stored in the DESCRIPTION field starts with the letters PC, create the expression:
LIKE("PC%",DESCRIPTION)
Note that matching of character and memo values may be case sensitive, depending on how Report Designer is configured to handle case sensitivity (see Chapter 5, "Setting Defaults," for information about configuring Report Designer’s case sensitivity).
Chapter 10: Using Functions
R&R ReportWorks SQL User Manual Page 341
LOG
Calculates the natural logarithm of a given number. If applied to a negative number or zero, LOG produces the error value.
Syntax:
LOG(N) where N is a numeric expression.
Example:
To determine the natural log of 7.3891, create the field LOG(7.3891), which returns a value of 2.0000. To determine the natural log of 8 times 12, create the field LOG(8*12), which returns a value of 4.5643

Chapter 10: Using Functions
R&R ReportWorks SQL User Manual Page 342
LOWER
Converts upper case letters to lower case letters.
Syntax:
LOWER(C) where C is a character expression.
Example:
To convert the upper case letters in a character field PRODCODE, create the field:
LOWER(PRODCODE)
Sample data:
PRODCODE LOWER(PRODCODE)
ABCD abcd ABCE abce

Chapter 10: Using Functions
R&R ReportWorks SQL User Manual Page 343
LTRIM
Removes the leading spaces from a character expression. Use this function to remove leading spaces that result from using the STR function, for example.
Syntax:
LTRIM(C) where C is a character expression.
Example:
To left justify the page number field (PAGE) in a document index, create the calculated field:
LTRIM(STR(PAGE,5))
Sample data:
Topic Page Word truncation 12 Word-wrap 8

Chapter 10: Using Functions
R&R ReportWorks SQL User Manual Page 344
MAX
Determines the higher value of two numeric expressions.
Syntax:
MAX(N1,N2) where N1 and N2 are numeric expressions.
Example:
To prevent the discounted price from going below $10, create the field:
MAX(DISCPRICE,10)
Chapter 10: Using Functions
R&R ReportWorks SQL User Manual Page 345
MIN
Determines the lower value of two numeric expressions.
Syntax:
MIN(N1,N2) where N1 and N2 are numeric expressions.
Example:
To prevent discounts of greater than 50%, create the field:
MIN(DISCRATE,50)

Chapter 10: Using Functions
R&R ReportWorks SQL User Manual Page 346
MOD
Calculates the remainder of a division. Returns the number representing the remainder of one numeric expression divided by another. If used with zero as the denominator, MOD produces the error value.
Syntax:
MOD(N1,N2) where N1 and N2 are numeric expressions. N1 is the dividend, and N2 is the divisor.
Example:
To convert data in a field SIZE that is expressed in inches to data expressed in yards and inches, create the field:
MOD(SIZE,36)
Sample data:
Data Yards Inches SIZE INT(SIZE/36
) MOD(SIZE,3
6) 38 1 2 72 2 0 7 0 7 119 3 11

Chapter 10: Using Functions
R&R ReportWorks SQL User Manual Page 347
MONLEN
Returns the number of days in the month for the specified date.
Syntax:
MONLEN(D) where D is a date expression.
Example:
The expression MONLEN({9/01/1996}) returns 30, the number of days in the month of September.

Chapter 10: Using Functions
R&R ReportWorks SQL User Manual Page 348
MONSBTWN
Calculates the number of full months between two dates. This date difference is derived by subtracting D2 from D1.
Syntax:
MONSBTWN(D1,D2) where D1 and D2 are date expressions.
Example:
To calculate the number of months between the starting date of a contract (STARTDATE) and the ending date (ENDDATE), create the field:
MONSBTWN(ENDDATE,STARTDATE)
Sample data:
ENDDATE STARTDATE MONSBTWN(ENDDATE,STARTDATE) 03/14/2001
12/10/2000 3
03/02/2001 12/10/2000
2
12/10/2000 03/10/2001
–3

Chapter 10: Using Functions
R&R ReportWorks SQL User Manual Page 349
MONTH
Returns the number of the month of a date expression.
Syntax:
MONTH(D) where D is a date expression
Example:
To print the month number of dates in the date field STARTDATE, create the field:
MONTH(STARTDATE)
Sample data:
STARTDATE MONTH(STARTDATE) 12/10/2001 12 04/23/2001 4

Chapter 10: Using Functions
R&R ReportWorks SQL User Manual Page 350
NDOW
Returns the next date of the day-of-week number that is supplied as its second argument.
Syntax:
NDOW(D,N) where D is a date expression and N is a numeric expression specifying day-of-week (with 1 being Sunday, 2 Monday, etc.).
Example:
To determine the date of the next Saturday following STARTDATE, use an expression like the following:
NDOW(STARTDATE,7)

Chapter 10: Using Functions
R&R ReportWorks SQL User Manual Page 351
NOW
The NOW( ) function was added to return the date and time the report was started. This provides the date and time in a single field of type date-time, making it easier to manipulate.
Syntax:
NOW( ), no arguments

Chapter 10: Using Functions
R&R ReportWorks SQL User Manual Page 352
OVER
Returns logical True if more than a specified number of days have passed since the supplied date.
Syntax:
OVER(D,N) where D is a date expression and N is a numeric expression specifying number of days.
Example:
To print a message indicating that a payment is past due, use an expression like the following:
IIF(OVER(DUE_DATE,90),"Payment is now overdue 90 days. A 10 percent penalty will be added if not paid within 10 days."," ")
As a result, the overdue notice will print only for those values of DUE_DATE that are more than 90 days in the past.

Chapter 10: Using Functions
R&R ReportWorks SQL User Manual Page 353
PAGENO
Returns current report page number.
Syntax:
PAGENO( ) no arguments.
Example:
To print/display a page number in a Footer line of a report, create a field PAGENUM to contain PAGENO( ) and use it in a Footer line:
---------- Page: 99 ----------
This line then produces:
---------- Page: 1 ----------

Chapter 10: Using Functions
R&R ReportWorks SQL User Manual Page 354
PAST
Returns logical True if supplied date is in the past and logical False if not. If the optional argument "1" is included, the current date is considered to be in the past.
Syntax:
PAST(D,[1]) where D is a date expression and 1 is an optional numeric argument that causes the current date to be considered as in the past.
Example:
To determine whether the value in a field named DUE_DATE is in the past, use the following expression:
PAST(DUE_DATE)

Chapter 10: Using Functions
R&R ReportWorks SQL User Manual Page 355
PDOW
Returns the previous date of the day-of-week number that is supplied as its second argument.
Syntax:
PDOW(D,N) where D is a date expression and N is a numeric expression specifying day-of-week (with 1 being Sunday, 2 Monday, etc.).
Example:
To determine the date of the Monday immediately preceding STARTDATE, use an expression like the following:
PDOW(STARTDATE,2)
If the value of STARTDATE is 6/02/2001, this expression will produce a value of 05/28/2001, the date of the Monday preceding 6/02/2001.

Chapter 10: Using Functions
R&R ReportWorks SQL User Manual Page 356
PERCOMP
The PERCOMP( ) function was added to help correctly evaluate calculations in some multiple-scan reports. The problem occurs when a report includes a query and has an "unbalanced multiple-scan tree" situation (e.g., master file A scans B, C, and D and scanned file D itself scans file E). In such a situation, a query expression involving fields from files B, C, and E might not be evaluated as frequently as necessary.
Syntax:
PERCOMP(expression)
Example:
If you need to evaluate the expression once per composite record, you can create a calculated field that passes the expression to the PERCOMP () function.
Chapter 10: Using Functions
R&R ReportWorks SQL User Manual Page 357
PREVIOUS
Returns the value of the specified field in the previous composite record. (Note that records that do not satisfy the filter currently in force are not accessible with this function.) This function is useful for suppressing repeating data in fields other than group fields and for performing calculations with fields in different composite records.
Syntax:
PREVIOUS(field name) where field name is the name of any field in the report.
Example:
If your orders table contains fields for customer number (CUSTNO), order number (ORDERNO), and order date (DATE), you can use the PREVIOUS function to calculate the number of days since any customer’s previous order, assuming that orders are sorted by date within customer. The expression for a DAYSINCE field might be:
IIF(PREVIOUS(CUSTNO)=CUSTNO,DATE–PREV(DATE),0)
Translated, this expression means that if the customer number is the same as the customer number in the previous composite record (in other words if Report Designer is reading a record for a second or subsequent order by the same customer), return a value that is the current order date minus the order date in the previous composite record. Otherwise, return 0.

Chapter 10: Using Functions
R&R ReportWorks SQL User Manual Page 358
QTR
Calculates the number of the calendar quarter of a date expression. (See the DQTR function.)
Syntax:
QTR(D) where D is a date expression. 1/1 to 3/31 is Quarter 1; 4/1 to 6/30 is Quarter 2; 7/1 to 9/30 is Quarter 3; 10/1 to 12/31 is Quarter 4.
Example:
To calculate the quarter number of each date in the STARTDATE field, create the field:
QTR(STARTDATE)
Sample data:
STARTDATE QTR(STARTDATE) 12/10/2005 4 04/23/2006 2 09/18/2006 3

Chapter 10: Using Functions
R&R ReportWorks SQL User Manual Page 359
QUERY
Returns the current filter expression.
Syntax:
QUERY( ) no arguments.
Example:
To print or display the current filter, create a calculated field whose expression is QUERY( ) and insert the field. Report Designer will print the filter text using a word-wrapped, left-aligned format with a 50-character width. If no filter is specified, this function returns "Include all records."
Note that this function provides text only for the current filter definition; you cannot use QUERY with any other function or with operators.

Chapter 10: Using Functions
R&R ReportWorks SQL User Manual Page 360
RECNO
Identifies the current composite record number. Composite records are numbered sequentially (starting with 1) after Report Designer does a sort and/or a filter and reads all related records.
Syntax:
RECNO( ), no arguments.
Example:
To number the records in a long report, create a calculated field with the expression RECNO( ). Then place this field on a Record line.

Chapter 10: Using Functions
R&R ReportWorks SQL User Manual Page 361
REPLICATE
Repeats a character expression a specified number of times.
Syntax:
REPLICATE(C,N) where C is the character expression that is to be copied and N is the numeric expression representing the number of copies. The maximum number of characters allowed is 254.
Example:
To print a line of asterisks after each record in a report, create the field:
REPLICATE('*',50)
and include it in a Record line after a line of fields, such as in the following report layout.
Customer Name Order Date Amount <xxxxxxxxxxxxxxxxxxxxxx mm/dd/yy ($999.99) <xxxxxxxxxxxxxxxxxxxxxxxxxxxxxxxxxxxxxxxxxxxxxxxxx
Sample report:
Customer Name Order Date Amount Britten, Jr., Roland 01/10/96 $216.00 ****************************************** Gladdin III, John 01/10/96 $96.00 ****************************************** Adams, Abner N. 01/10/96 $144.00
Chapter 10: Using Functions
R&R ReportWorks SQL User Manual Page 362
REPNAME
Returns as a character string the name of the current report.
Syntax:
REPNAME(N), where N is an optional numeric argument specifying whether the full path and name is returned for a report saved as a compound document file.
For a report saved as a compound document file, if N is absent or 0 (zero), this function returns only the report name; the pathname is not included, and the extension is included only if it is something other than the default of RSW. If N is non-zero, this function returns the full path and name, including extension, for the report file.
For a report saved into a report library, this function always returns the report name, regardless of the presence or value of N.
Example:
To print the report name as a title, create a calculated field consisting only of REPNAME( ). Then place the field in the Title band of the report.

Chapter 10: Using Functions
R&R ReportWorks SQL User Manual Page 363
RIGHT
Selects the right-most specified number of characters of a character expression.
Syntax:
RIGHT(C,N) where C is a character expression and N is a numeric expression that defines the number of characters to select.
Example:
To create a PARTNO field to contain the last 5 characters of the 8-character PARTID field, use RIGHT as follows:
RIGHT(PARTID,5)
Sample data:
PARTID PARTNO ababyyyy byyyy ababzzzz bzzzz abab abab
Chapter 10: Using Functions
R&R ReportWorks SQL User Manual Page 364
REPORTPAGE
Returns consecutive physical page number based on entire report. Similar to PAGENO( ) function except REPORTPAGE( ) does not start re-numbering with a Reset Page group break.
Syntax:
REPORTPAGE( ) no arguments.
Example:
To print/display page x of y numbering in a Footer line of a report, Use a calculated field with expression REPORTPAGE( ) along with a second calculated field with expression LASTPAGE() and place them on a Page Footer band line:
---------- Page: 1 of 99 ----------
Chapter 10: Using Functions
R&R ReportWorks SQL User Manual Page 365
RIPARAM
In reports run with Viewer, returns as a character string the value of a specified character field in the Viewer table or text control file. Returns asterisks for reports run interactively.
Syntax:
RIPARAM(C), where C is a string that is the name of a character field in the Viewer control table or file.
Example:
To include the user-supplied title stored in the TITLE field in the Viewer control table or file, create the field:
RIPARAM("TITLE")

Chapter 10: Using Functions
R&R ReportWorks SQL User Manual Page 366
ROUND
Rounds a numeric expression to a specified number of decimal places.
Syntax:
ROUND(N1,N2) where N1 is the numeric expression to be rounded and N2 is the number of decimal places. Note that N2 may be signed (e.g., ROUND(260,–2) = 300.)
Example:
To round numbers in a numeric field NUMBERS to 0 decimal places, create the field:
ROUND(NUMBERS,0)
Sample data:
NUMBERS ROUND(NUMBERS,0) 23453.3455 23453 (rounds down) 98789.7656 98790 (rounds up)

Chapter 10: Using Functions
R&R ReportWorks SQL User Manual Page 367
RR
Ensures that a calculated field formula is not translated.
Syntax:
RR(I) where I is any field name or expression.
Example:
This function is useful in analyzing report behavior. For example, suppose you have specified a sort on a calculated field whose expression is LASTNAME+FIRSTNAME. If this expression can be translated into a form that is evaluatable by your database software, Report Designer will include an "ORDER BY LASTNAME+FIRSTNAME" in the SELECT sent to the database server.
To force Report Designer to perform this sort locally instead, change the calculated expression to:
RR(LASTNAME+FIRSTNAME)
Chapter 10: Using Functions
R&R ReportWorks SQL User Manual Page 368
RRUNIN
With Viewer, returns 1 if a report is run using a text control file; if using a control table, returns the RI_ID value of the report in that control table.
Syntax:
RRUNIN( ), no arguments.
Example:
If you develop a report that uses RIPARAM to incorporate a user-supplied title, you can use IIF and RRUNIN to specify an alternate title when you run the report interactively. To print "Report Title" instead of the user-specified text supplied by RIPARAM, create the field:
IIF(RRUNIN( ),RIPARAM(TITLE),"Report Title")
Chapter 10: Using Functions
R&R ReportWorks SQL User Manual Page 369
RTRIM
Removes the trailing spaces of a character expression. Since Report Designer automatically trims trailing spaces off all character fields when printing, this function is normally used only to concatenate character fields or to find the length of the actual data in a database field.
Syntax:
RTRIM(C) where C is a character expression.
Example:
In the CUSTOMER table, to print the state next to the city with only a comma and one space between the two fields, create the following field:
RTRIM(CITY)+', '+STATE
Report Designer prints the field as follows:
Detroit, MI Columbia, MO Portland, OR
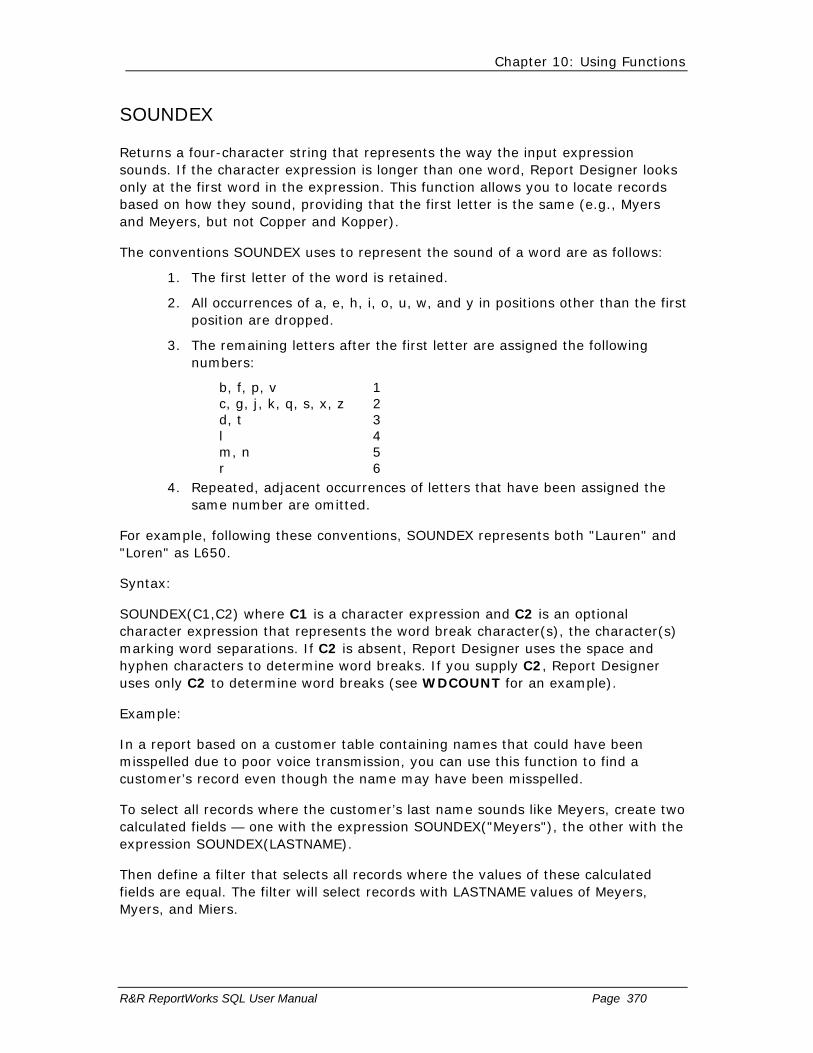
Chapter 10: Using Functions
R&R ReportWorks SQL User Manual Page 370
SOUNDEX
Returns a four-character string that represents the way the input expression sounds. If the character expression is longer than one word, Report Designer looks only at the first word in the expression. This function allows you to locate records based on how they sound, providing that the first letter is the same (e.g., Myers and Meyers, but not Copper and Kopper).
The conventions SOUNDEX uses to represent the sound of a word are as follows:
1. The first letter of the word is retained.
2. All occurrences of a, e, h, i, o, u, w, and y in positions other than the first position are dropped.
3. The remaining letters after the first letter are assigned the following numbers:
b, f, p, v 1 c, g, j, k, q, s, x, z 2 d, t 3 l 4 m, n 5 r 6
4. Repeated, adjacent occurrences of letters that have been assigned the same number are omitted.
For example, following these conventions, SOUNDEX represents both "Lauren" and "Loren" as L650.
Syntax:
SOUNDEX(C1,C2) where C1 is a character expression and C2 is an optional character expression that represents the word break character(s), the character(s) marking word separations. If C2 is absent, Report Designer uses the space and hyphen characters to determine word breaks. If you supply C2, Report Designer uses only C2 to determine word breaks (see WDCOUNT for an example).
Example:
In a report based on a customer table containing names that could have been misspelled due to poor voice transmission, you can use this function to find a customer’s record even though the name may have been misspelled.
To select all records where the customer’s last name sounds like Meyers, create two calculated fields — one with the expression SOUNDEX("Meyers"), the other with the expression SOUNDEX(LASTNAME).
Then define a filter that selects all records where the values of these calculated fields are equal. The filter will select records with LASTNAME values of Meyers, Myers, and Miers.
Chapter 10: Using Functions
R&R ReportWorks SQL User Manual Page 371
SPACE
Produces a character expression made up of a specified number of spaces (blanks).
Syntax:
SPACE(N) where N is a numeric expression representing the number of spaces desired.
Example:
To create an underlined blank space on a report, create a calculated field whose expression is SPACE(99). Insert this field on your report layout and use Format ⇒ Font to apply the underscored style. Then use Format ⇒ Properties to specify the desired width of the field. As long as the field is left-aligned, centered, or right-aligned, your report will contain an underline of the specified width.

Chapter 10: Using Functions
R&R ReportWorks SQL User Manual Page 372
SPELLNUM
Spells the integer part of a numeric expression. The first character of the resulting character string is in upper case; all other characters are in lower case. If the number is negative, Report Designer returns a string that begins with the word "Minus." If the integer part of the number is 0 or if the field is blank, Report Designer returns the string "Zero." If the string exceeds the maximum string length of 254 characters, Report Designer returns a string of asterisks.
Syntax:
SPELLNUM(N) where N is a numeric expression.
Example:
To convert numbers in field NUMBERS into their English equivalents, create the field:
SPELLNUM(NUMBERS)
Sample data:
NUMBERS SPELLNUM(NUMBERS) 0.00 Zero 0.99 Zero 25.01 Twenty-five –5.99 Minus five Blank Zero
Chapter 10: Using Functions
R&R ReportWorks SQL User Manual Page 373
SQLEXP
Uses its string argument as an expression that can be evaluated by the database software. (Note that this function cannot be used in a UDF.)
Syntax:
SQLEXP(C) where C is a string consisting of an expression that is evaluatable by the database software.
Example:
This function can give you access to certain database-specific functions. For example, Microsoft SQL Server provides a function named REVERSE that reverses a character string. To use this function in Report Designer, you could create a calculated field with the following expression:
SQLEXP("REVERSE(LASTNAME)")

Chapter 10: Using Functions
R&R ReportWorks SQL User Manual Page 374
SQRT
Calculates the square root of a non-negative numeric expression. If applied to a negative number, SQRT produces the error value.
Syntax:
SQRT(N) where N is a numeric expression.
Example:
To print the square root of the contents of the numeric field NUMBERS, create the field:
SQRT(NUMBERS)
Sample data:
NUMBERS SQRT(NUMBERS)
9 3 64 8 1024 32
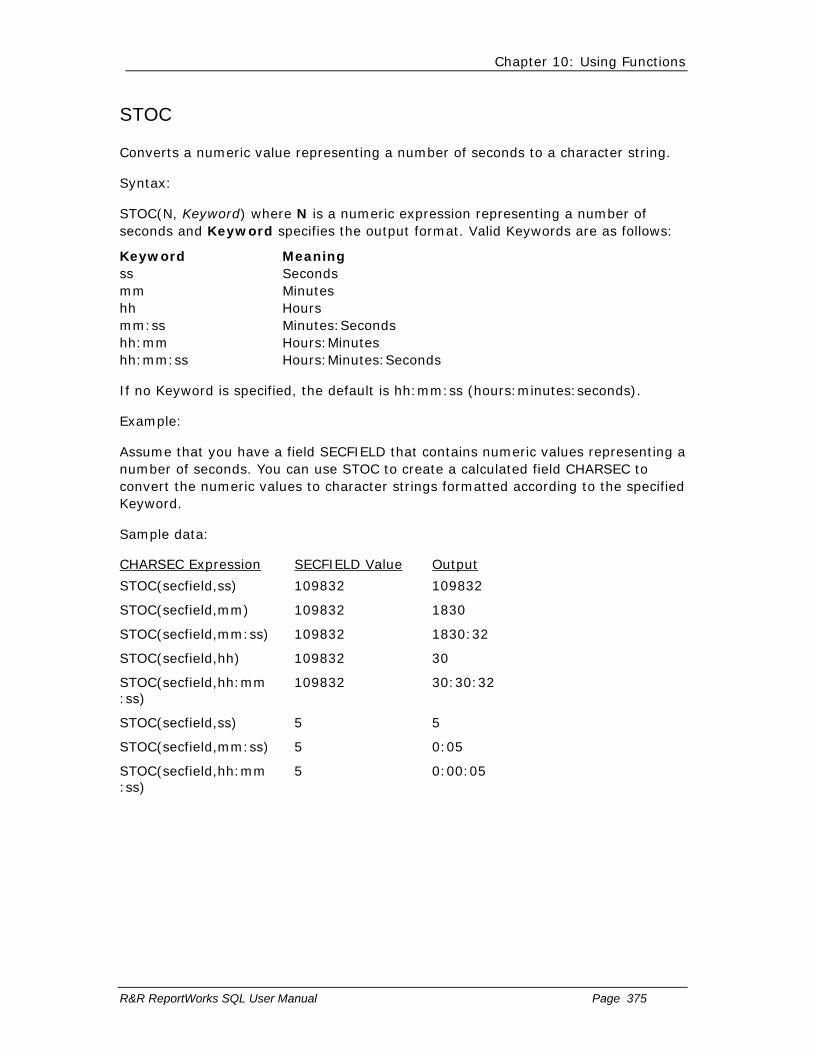
Chapter 10: Using Functions
R&R ReportWorks SQL User Manual Page 375
STOC
Converts a numeric value representing a number of seconds to a character string.
Syntax:
STOC(N, Keyword) where N is a numeric expression representing a number of seconds and Keyword specifies the output format. Valid Keywords are as follows:
Keyword Meaning ss Seconds mm Minutes hh Hours mm:ss Minutes:Seconds hh:mm Hours:Minutes hh:mm:ss Hours:Minutes:Seconds
If no Keyword is specified, the default is hh:mm:ss (hours:minutes:seconds).
Example:
Assume that you have a field SECFIELD that contains numeric values representing a number of seconds. You can use STOC to create a calculated field CHARSEC to convert the numeric values to character strings formatted according to the specified Keyword.
Sample data:
CHARSEC Expression SECFIELD Value Output
STOC(secfield,ss) 109832 109832
STOC(secfield,mm) 109832 1830
STOC(secfield,mm:ss) 109832 1830:32
STOC(secfield,hh) 109832 30
STOC(secfield,hh:mm:ss)
109832 30:30:32
STOC(secfield,ss) 5 5
STOC(secfield,mm:ss) 5 0:05
STOC(secfield,hh:mm:ss)
5 0:00:05

Chapter 10: Using Functions
R&R ReportWorks SQL User Manual Page 376
STR
Converts a numeric expression to a character expression. This function is the opposite of VAL; that is, it constitutes a change in data type from numeric to character.
Syntax:
STR(N1,N2,N3) where all arguments are numeric expressions. N1 is a value to be converted and is required. N2 is an optional argument representing the length of the string in number of characters. N3 is an optional argument representing the number of decimal places.
If the value will not fit in the specified length, the STR function returns a string of asterisks instead.
If you omit the argument N2, STR uses 10 as the default length. If you omit the argument N3, STR uses 0 as the default number of decimal places.
If the value has more decimal places than specified in N3, STR rounds off the number to N3 decimal places.
Example:
To convert a product code field (PRODCODE) from a numeric to a character expression, create the field:
STR(PRODCODE)
Sample data:
PRODCODE STR(PRODCODE) 12345 " 12345" 9912567 " 9912567"
(default length of 10 is used)

Chapter 10: Using Functions
R&R ReportWorks SQL User Manual Page 377
STRCOUNT
Returns the number of times a substring occurs within a character expression.
Syntax:
STRCOUNT(C1,C2,L) where C1 and C2 are character expressions and C1 is a character substring of C2. The optional logical expression L controls the case sensitivity of the function. When L is true, the function is case sensitive; when it is false, the function is case insensitive. Without the third argument, the function uses the COMPARECASE case sensitivity setting in the RSW.SRT file (see Chapter 5, "Setting Defaults," for information about configuring Report Designer’s case sensitivity).
Example:
You might have a ten-character field (RESPONSE) that contains a string of the letters Y and N in either upper or lower case representing Yes and No responses to a questionnaire. To count the number of Yes responses, create a calculated field whose expression is STRCOUNT("Y",RESPONSE).
Chapter 10: Using Functions
R&R ReportWorks SQL User Manual Page 378
STRREP
Replaces each occurrence of a character substring with another and returns the full character string.
Syntax:
STRREP(C1,C2,C3,L) where C1 is the full character expression, C2 is the substring to be replaced, and C3 is the replacement substring. The optional logical expression L controls the case sensitivity of the function. When L is true, the function is case sensitive; when it is false, the function is case insensitive. When this argument is not provided, the function uses the COMPARECASE case sensitivity setting in the RSW.SRT file (see Chapter 5, "Setting Defaults," for information about configuring Report Designer’s case sensitivity).
Example:
To replace every occurrence of the text "CDS" with "Concentric Data Systems" in a character field named COMMENT, create a field with the following expression:
STRREP(COMMENT,"CDS","Concentric Data Systems")

Chapter 10: Using Functions
R&R ReportWorks SQL User Manual Page 379
STRSEARCH
Returns the beginning position of the nth occurrence of a character substring.
Syntax:
STRSEARCH(C1,C2,N,L) where C1 is the substring, C2 is the full character string, and N is the number of the occurrence. If N is negative, STRSEARCH begins its search for the substring’s position at the end of the character string. (Note that the position of the first character in a string is 1, not 0.)
The optional logical expression L controls the function’s case sensitivity. When L is true, the function is case sensitive; when it is false, the function is case insensitive. When this argument is not provided, the function uses the COMPARECASE setting in the RSW.SRT file (see Chapter 5, "Setting Defaults," for information about configuring Report Designer’s case sensitivity).
Example:
To extract the parenthesized nickname from a BOXER_NAME character field, create a field with the following expression:
SUBSTR(BOXER_NAME,STRSEARCH("(",BOXER_NAME,1)+1,
STRSEARCH(")",BOXER_NAME,1)–STRSEARCH(")"BOXER_NAME,1)–1)
For a value of BOXER_NAME such as "Billy (The Bruiser) Johnson", this field will return : (The Bruiser).

Chapter 10: Using Functions
R&R ReportWorks SQL User Manual Page 380
STUFF
Replaces any part of a character expression.
Syntax:
STUFF(C1,N1,N2,C2) where C1 and C2 are character expressions and N1 and N2 are numeric expressions. C1 is the expression to be changed. N1 is the starting position of the replacement. N2 is the number of characters of C1 to be removed. C2 is the replacement expression. The length of C2 need not be the same as N2.
Example:
To change four characters of PRODID to BB, starting with the third character, create the field:
STUFF(PRODID,3,4,'BB')
Sample data:
PRODID STUFF(PRODID,3,4,'BB') JTddddT JTBBT JTdefgT JTBBT

Chapter 10: Using Functions
R&R ReportWorks SQL User Manual Page 381
SUBDAYS
Calculates a date by subtracting a number of days from a date. Note that you can also subtract dates by using the – operator.
Syntax:
SUBDAYS(D,N) where D is a date expression and N is a numeric expression representing number of days to be subtracted.
Example:
To back schedule the beginning date of a project based on the closing date (FINALDATE) and number of days (20) the project will take, create the field:
SUBDAYS(FINALDATE,20)
If FINALDATE is 05/21/2001, then this function yields 05/01/2001 as the starting date for the project.

Chapter 10: Using Functions
R&R ReportWorks SQL User Manual Page 382
SUBMONS
Calculates a date by subtracting a number of months from a date.
Syntax:
SUBMONS(D,N) where D is a date expression and N is a numeric expression representing number of months to be subtracted.
Example:
To back schedule the beginning date of a project based on the closing date (FINALDATE) and number of months (24) the project will take, create the field:
SUBMONS(FINALDATE,24)
If FINALDATE is 01/10/2004, then this function yields 01/10/2002 as the starting date for the project.

Chapter 10: Using Functions
R&R ReportWorks SQL User Manual Page 383
SUBSTR
Extracts a substring from a character expression.
Syntax:
SUBSTR(C,N1,N2) where C is the character expression from which you want to extract a substring. N1 and N2 are numeric expressions. N1 is the starting position for the extraction. N2 is the length of the extraction in number of characters and is an optional argument. If you omit N2, the substring extends to the end of C.
Example:
Suppose you want to extract the four characters representing product code from an eight character product number field (PRODID) and that these four characters begin with the third character in the product number. To do this, create the field:
SUBSTR(PRODID,3,4)
Sample data:
PRODID SUBSTR(PRODID,3,4) JT3A2378 3A23 JT4B6895 4B68

Chapter 10: Using Functions
R&R ReportWorks SQL User Manual Page 384
SUBWKS
Calculates a date by subtracting a number of weeks from a date.
Syntax:
SUBWKS(D,N) where D is a date expression and N is a numeric expression representing number of weeks.
Example:
To back schedule the beginning date of a project based on the closing date (FINALDATE) and number of weeks (10) the project will take, create the field:
SUBWKS(FINALDATE,10)
If FINALDATE is 4/1/2003, then this function yields 1/22/2003 as the starting date for the project.
Chapter 10: Using Functions
R&R ReportWorks SQL User Manual Page 385
SUBYRS
Calculates a date by subtracting a number of years from a date.
Syntax:
SUBYRS(D,N) where D is a date expression and N is a numeric expression representing number of years.
Example:
Stock options are 100% vested four years from the date of grant. Records in the table contain the 100% vested date, DATEVEST. SUBYRS(DATEVEST,4) gives the date the option was granted.

Chapter 10: Using Functions
R&R ReportWorks SQL User Manual Page 386
TIME
Returns the character representation of the system time at the time the report was started. The time is in 24 hour format, hh:mm:ss.
Syntax:
TIME( ), no arguments.
Example:
To print the system time in a Header line, create the field SYSTIME to contain the TIME function:
------ TIME: <xxxxxxx ------
yields the following:
------ TIME: 03:05:51 ------

Chapter 10: Using Functions
R&R ReportWorks SQL User Manual Page 387
TODATE
Converts a datetime expression to a date.
Syntax:
TODATE(DT), where DT is a datetime expression.
Example:
You can use this function to extract just the date portion of a datetime expression. For example, if one of the values of DTEND is 04/06/2001 03:20:45, the expression TODATE(DTEND) would return 04/06/2001 (omitting the time portion of the datetime value).

Chapter 10: Using Functions
R&R ReportWorks SQL User Manual Page 388
TOTIME
Converts a datetime expression to a time.
Syntax:
TOTIME(DT), where DT is a datetime expression.
Example:
You can use this function to extract just the time portion of a datetime expression. For example, if one of the values of DTEND is 04/06/2001 03:20:45, the expression TODATE(DTEND) would return 03:20:45 (omitting the date portion of the datetime value).
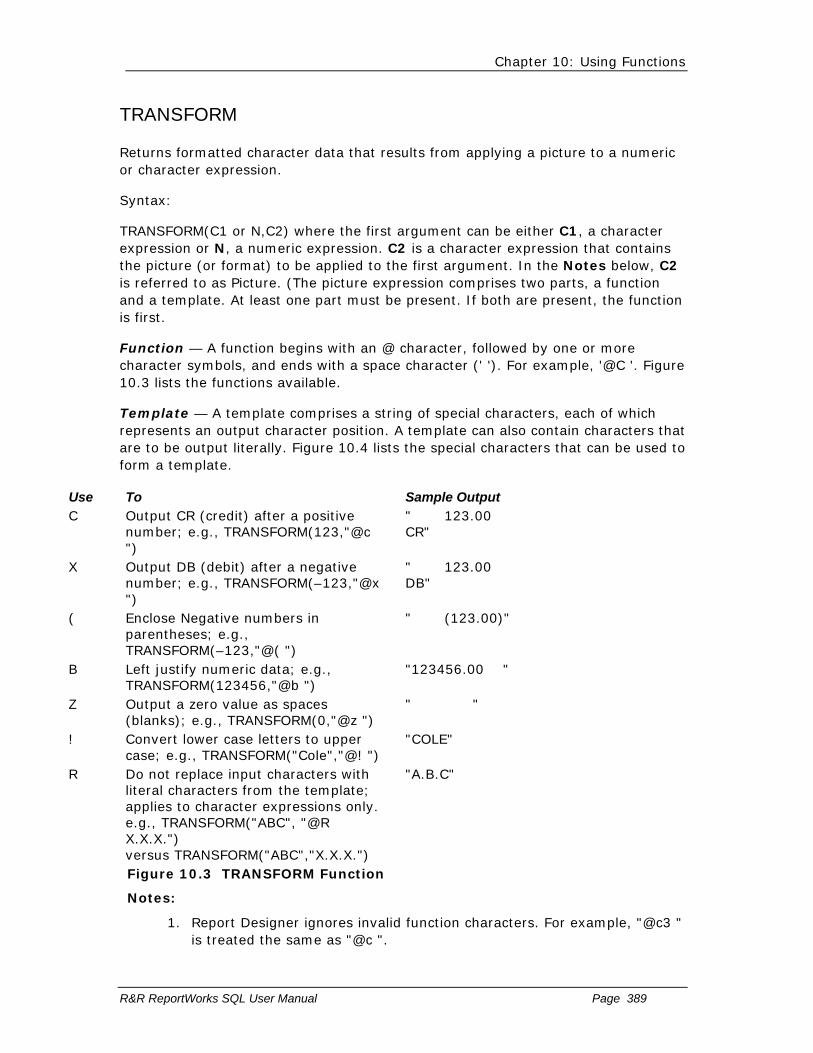
Chapter 10: Using Functions
R&R ReportWorks SQL User Manual Page 389
TRANSFORM
Returns formatted character data that results from applying a picture to a numeric or character expression.
Syntax:
TRANSFORM(C1 or N,C2) where the first argument can be either C1, a character expression or N, a numeric expression. C2 is a character expression that contains the picture (or format) to be applied to the first argument. In the Notes below, C2 is referred to as Picture. (The picture expression comprises two parts, a function and a template. At least one part must be present. If both are present, the function is first.
Function — A function begins with an @ character, followed by one or more character symbols, and ends with a space character (' '). For example, '@C '. Figure 10.3 lists the functions available.
Template — A template comprises a string of special characters, each of which represents an output character position. A template can also contain characters that are to be output literally. Figure 10.4 lists the special characters that can be used to form a template.
Use To Sample Output C Output CR (credit) after a positive
number; e.g., TRANSFORM(123,"@c ")
" 123.00 CR"
X Output DB (debit) after a negative number; e.g., TRANSFORM(–123,"@x ")
" 123.00 DB"
( Enclose Negative numbers in parentheses; e.g., TRANSFORM(–123,"@( ")
" (123.00)"
B Left justify numeric data; e.g., TRANSFORM(123456,"@b ")
"123456.00 "
Z Output a zero value as spaces (blanks); e.g., TRANSFORM(0,"@z ")
" "
! Convert lower case letters to upper case; e.g., TRANSFORM("Cole","@! ")
"COLE"
R Do not replace input characters with literal characters from the template; applies to character expressions only. e.g., TRANSFORM("ABC", "@R X.X.X.") versus TRANSFORM("ABC","X.X.X.")
"A.B.C"
Figure 10.3 TRANSFORM Function
Notes:
1. Report Designer ignores invalid function characters. For example, "@c3 " is treated the same as "@c ".

Chapter 10: Using Functions
R&R ReportWorks SQL User Manual Page 390
2. When Report Designer encounters mutually exclusive characters such as "@(x ", the last function specified overrides any preceding function; i.e., "@(x " behaves as "@x ".
Template Character
Sample Action and Example
Output
Numeric Data
9 or # Substitutes next digit of number, TRANSFORM(123,'99999')
" 123"
$ or * Defines "fill character"; used in place of leading blanks, TRANSFORM(12345,"$9,999,999") TRANSFORM(12345,"*9,999,999")
"$$$$12,345" "****12,345"
. Represents position of decimal point, TRANSFORM(12345,"999,999.99")
" 12,345.00"
, Represents position of comma (or fill character), TRANSFORM(12345,"9,999,999")
" 12,345"
Character Data
X or x Substitutes next character of data, TRANSFORM("Anderson","x x x xx")
"A d r on"
! Substitutes upper case equivalent of next character of data, TRANSFORM("Coleman","!!!!")
"COLE"
Figure 10.4 TRANSFORM Template Characters
Notes:
1. For numeric data, when a function is given without template characters, Report Designer normally outputs ten integer and two decimal places.
2. For character data, Report Designer treats 9, #, $, *, . and , literally when they appear in the template. If the picture argument contains "@R ", literals do not replace characters from the input argument.
For example:
TRANSFORM("Henderson",'xxxxx.xx') produces "Hende.so", but
TRANSFORM("Henderson",'@R xxxxx.xx') produces "Hende.rs".

Chapter 10: Using Functions
R&R ReportWorks SQL User Manual Page 391
TRIM
Removes trailing spaces in a character expression. This function is identical to RTRIM.
Syntax:
TRIM(C) where C is a character expression.
Example:
See RTRIM.

Chapter 10: Using Functions
R&R ReportWorks SQL User Manual Page 392
TTOC
Converts a time expression or the time portion of a datetime expression to a character string.
Syntax:
TTOC(DT) where DT is a datetime or time expression.
Example:
To extract the time portion of the datetime expression DTEND as a character string, create a calculated field with the expression TTOC(DTEND).
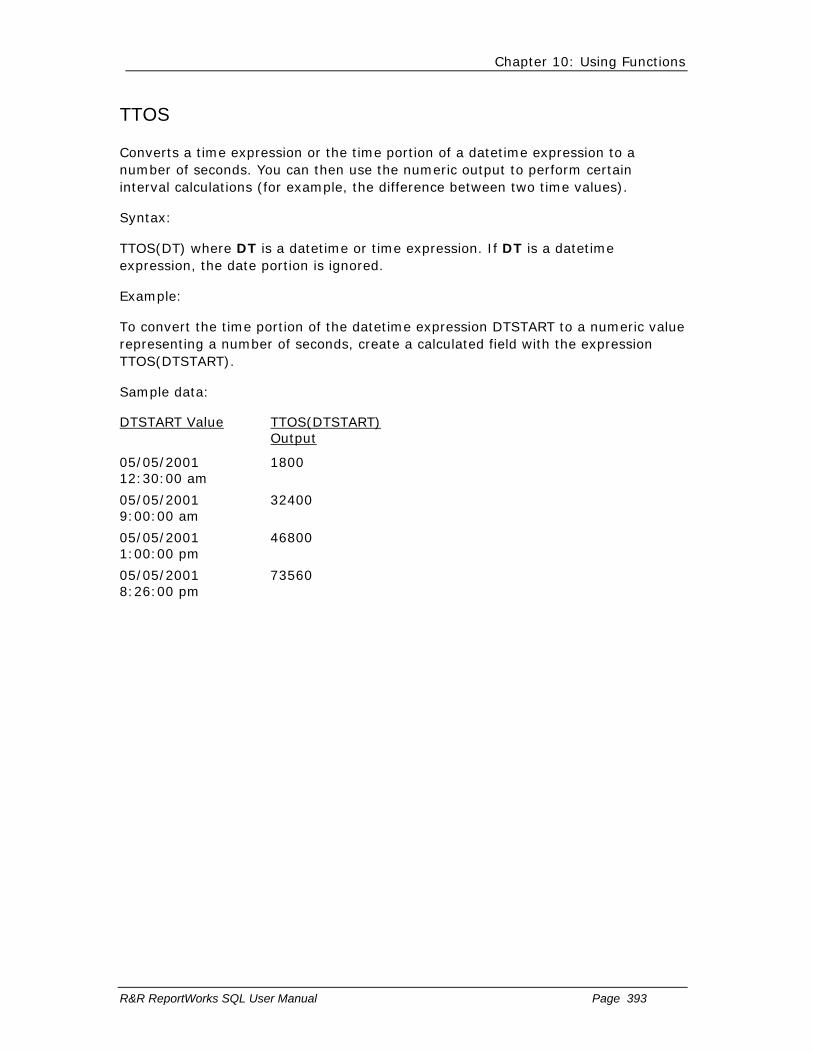
Chapter 10: Using Functions
R&R ReportWorks SQL User Manual Page 393
TTOS
Converts a time expression or the time portion of a datetime expression to a number of seconds. You can then use the numeric output to perform certain interval calculations (for example, the difference between two time values).
Syntax:
TTOS(DT) where DT is a datetime or time expression. If DT is a datetime expression, the date portion is ignored.
Example:
To convert the time portion of the datetime expression DTSTART to a numeric value representing a number of seconds, create a calculated field with the expression TTOS(DTSTART).
Sample data:
DTSTART Value TTOS(DTSTART) Output
05/05/2001 12:30:00 am
1800
05/05/2001 9:00:00 am
32400
05/05/2001 1:00:00 pm
46800
05/05/2001 8:26:00 pm
73560

Chapter 10: Using Functions
R&R ReportWorks SQL User Manual Page 394
UDFNAME
Returns the path and name of the UDF library file.
Syntax:
UDFNAME( ), no arguments.
Example:
To print the path and name of the Report Designer UDF library, create a calculated field consisting only of UDFNAME( ). Then place the field in an appropriate band of the report.

Chapter 10: Using Functions
R&R ReportWorks SQL User Manual Page 395
UPPER
Converts lower case letters of a character expression to upper case letters.
Syntax:
UPPER(C) where C is the character expression you wish to convert to upper case.
Example:
To print the CITY field from the CUSTOMERS table in upper case letters, create the field:
UPPER(CITY)
Sample data:
CITY UPPER(CITY) Columbia COLUMBIA Jefferson City JEFFERSON CITY Kansas City KANSAS CITY
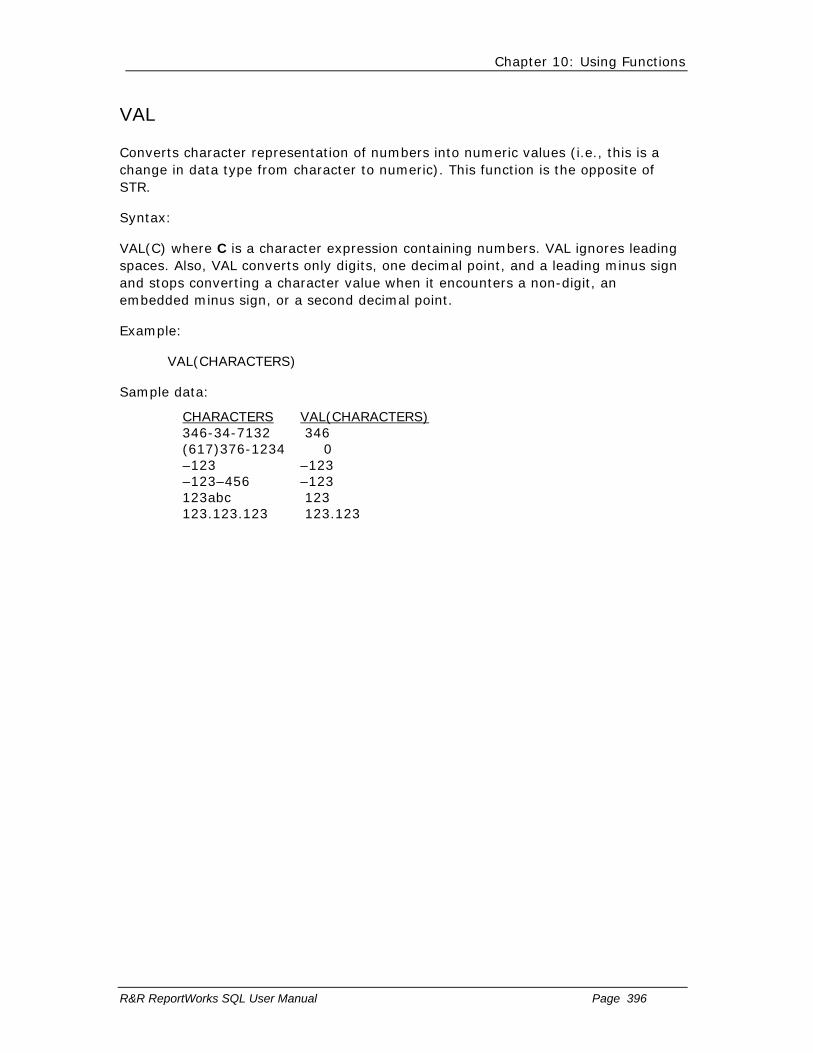
Chapter 10: Using Functions
R&R ReportWorks SQL User Manual Page 396
VAL
Converts character representation of numbers into numeric values (i.e., this is a change in data type from character to numeric). This function is the opposite of STR.
Syntax:
VAL(C) where C is a character expression containing numbers. VAL ignores leading spaces. Also, VAL converts only digits, one decimal point, and a leading minus sign and stops converting a character value when it encounters a non-digit, an embedded minus sign, or a second decimal point.
Example:
VAL(CHARACTERS)
Sample data:
CHARACTERS VAL(CHARACTERS) 346-34-7132 346 (617)376-1234 0 –123 –123 –123–456 –123 123abc 123 123.123.123 123.123
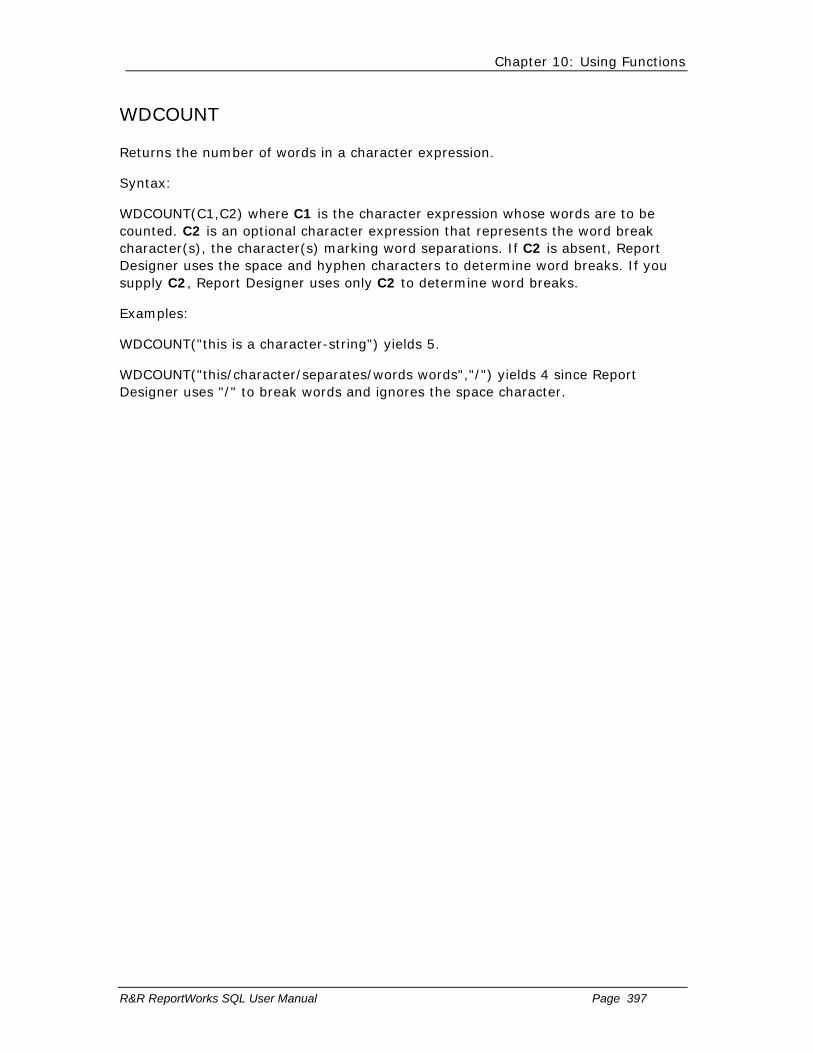
Chapter 10: Using Functions
R&R ReportWorks SQL User Manual Page 397
WDCOUNT
Returns the number of words in a character expression.
Syntax:
WDCOUNT(C1,C2) where C1 is the character expression whose words are to be counted. C2 is an optional character expression that represents the word break character(s), the character(s) marking word separations. If C2 is absent, Report Designer uses the space and hyphen characters to determine word breaks. If you supply C2, Report Designer uses only C2 to determine word breaks.
Examples:
WDCOUNT("this is a character-string") yields 5.
WDCOUNT("this/character/separates/words words","/") yields 4 since Report Designer uses "/" to break words and ignores the space character.

Chapter 10: Using Functions
R&R ReportWorks SQL User Manual Page 398
WEEK
Returns a number representing the week-of-the-month for a date expression. Week numbers, which start at 1, are determined by the calendar date. Weeks begin on Sunday and end on Saturday.
Syntax:
WEEK(D) where D is a date expression.
Example:
To print the week number of the date field DATE from the ORDERS table, create the field:
WEEK(DATE)
Sample data:
DATE WEEK(DATE)
06/28/2001 5 07/07/2001 2 07/28/2001 5

Chapter 10: Using Functions
R&R ReportWorks SQL User Manual Page 399
WKSBTWN
Calculates the number of full calendar weeks between two dates. This date difference is derived by subtracting D2 from D1.
Syntax:
WKSBTWN(D1,D2) where D1 and D2 are date expressions. If the number of days is less than 7, the result is 0.
Example:
To calculate the weeks between the starting date of a contract (STARTDATE) and its completion date (FINALDATE), create the field:
WKSBTWN(FINALDATE,STARTDATE)
Sample data:
FINALDATE STARTDATE WKSBTWN 04/14/2001 04/10/2001 0 04/23/2001 04/07/2001 2 04/28/2001 04/07/2001 3

Chapter 10: Using Functions
R&R ReportWorks SQL User Manual Page 400
WORD
Returns a word based on its place in a character expression. For example, you can use this function to print/display the first or last word in the expression.
Syntax:
WORD(C1,N,C2) where C1 is a character expression (string), N is a numeric expression that represents the number or place of the word in the expression, and C2 is an optional character expression that represents the word break character(s), the character(s) marking word separations. If N is a positive number, Report Designer processes the expression starting at the beginning of the string. If N is a negative number, Report Designer processes the expression starting at the end of the string. For example, when N is 1, Report Designer returns the first word of the expression; when N is –1, Report Designer returns the last word of the expression. When N is 0 or greater than the number of words in the character expression, Report Designer returns an empty character field.
If C2 is absent, Report Designer uses the space and hyphen characters to determine word breaks. If you supply C2, Report Designer uses only C2 to determine word breaks (see WDCOUNT for an example).
Examples:
To print/display the last word in a character field DESCRIPTN, create the expression:
WORD(DESCRIPTN, –1)
Sample data:
DESCRIPTN WORD(DESCRIPTN, –1)
PC Cable Connector Connector PC 3 1/2" Diskettes Diskettes

Chapter 10: Using Functions
R&R ReportWorks SQL User Manual Page 401
YEAR
Returns the year part of a date expression. The result is a four-digit numeric value.
Syntax:
YEAR(D) where D is a date expression.
Example:
To calculate the year number of a date field BIRTHDATE, create the field:
YEAR(BIRTHDATE)
Sample data:
BIRTHDATE YEAR(BIRTHDATE) 12/10/67 1967 11/19/71 1971

Chapter 10: Using Functions
R&R ReportWorks SQL User Manual Page 402
YRSBTWN
Calculates the number of full years between two date expressions; difference is derived by subtracting D2 from D1.
Syntax:
YRSBTWN(D1,D2) where D1 and D2 are date expressions.
Example:
To calculate the age of all employees in a personnel table based on date of birth field (BIRTHDATE) and the current date DATE( ), create the field:
YRSBTWN(DATE( ),BIRTHDATE)
Sample data:
DATE( ) BIRTHDATE YRSBTWN(DATE( ),BIRTHDATE)
03/31/2001
12/10/1965
35
03/31/2001
04/11/1960
40
04/01/2001
07/23/1957
43
04/01/2001
12/05/1951
49

Chapter 10: Using Functions
R&R ReportWorks SQL User Manual Page 403
Using User-Defined Functions
You create UDFs to process field values according to an expression or formula that you define. The ability to define UDFs provides two main advantages:
You can use the UDFs that you develop in any Report Designer report.
Since you define the expression and specify the arguments, you can create UDFs to perform complex operations beyond those available through the use of predefined functions.
After you have created a UDF, it is saved in a file called RSW.UDF, which is created in the Report Designer program directory or in the link directory (if one has been defined). When naming a UDF, you can use lower or mixed case to distinguish its name from the names of predefined Report Designer functions. You can then use the UDF in calculated field expressions in any report just as you would use a predefined function, by typing its name or selecting it from the Function list box.
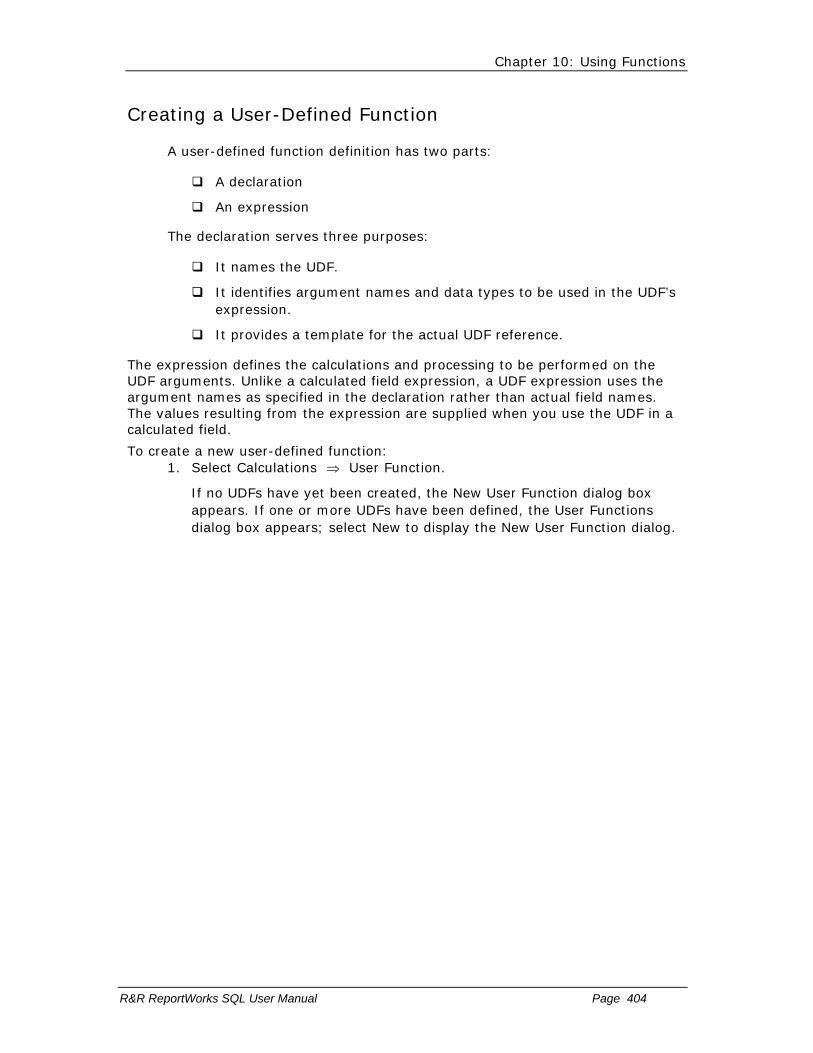
Chapter 10: Using Functions
R&R ReportWorks SQL User Manual Page 404
Creating a User-Defined Function
A user-defined function definition has two parts:
A declaration
An expression
The declaration serves three purposes:
It names the UDF.
It identifies argument names and data types to be used in the UDF’s expression.
It provides a template for the actual UDF reference.
The expression defines the calculations and processing to be performed on the UDF arguments. Unlike a calculated field expression, a UDF expression uses the argument names as specified in the declaration rather than actual field names. The values resulting from the expression are supplied when you use the UDF in a calculated field.
To create a new user-defined function: 1. Select Calculations ⇒ User Function.
If no UDFs have yet been created, the New User Function dialog box appears. If one or more UDFs have been defined, the User Functions dialog box appears; select New to display the New User Function dialog.

Chapter 10: Using Functions
R&R ReportWorks SQL User Manual Page 405
Figure 10.5 New User Function Dialog Box
2. In the User Function Declaration edit box, type a function declaration with the following syntax:
UDFName(ArgType_ArgName1, ArgType_ArgName2, ...)
♦ The UDF name can be up to 20 characters long; the first 4 characters must be unique.
♦ UDF arguments must start with a character that represents the argument data type, followed by an underscore (_).
Use one of the following letters to indicate the argument data type:
C for a character argument D for a date argument L for a logical argument M for a memo argument N for a numeric argument (fixed or floating point)
♦ The first 9 characters of each argument name must be unique and must start with a letter.
3. In the Expression edit box, define the function using any combination of the following methods:

Chapter 10: Using Functions
R&R ReportWorks SQL User Manual Page 406
♦ Type all or part of the expression directly in the Expression edit box.
♦ Insert a predefined function by selecting an item in the Functions list, then selecting the Insert button.
♦ Insert an operator by selecting the Operator buttons.
♦ Insert a calculated field expression by selecting the Calc Expression button to display the Calculated Fields dialog box.
♦ Insert another user-defined function formula by selecting the User Function Formula button to display the User Functions dialog box.
4. Select the Verify button to determine whether the expression syntax is correct. Report Designer displays a message box describing what, if any, syntax errors it found in the expression.
5. Select OK.

Chapter 10: Using Functions
R&R ReportWorks SQL User Manual Page 407
UDF Declaration
A UDF declaration, which can be up to 256 characters long, consists of the following parts:
UDF name in upper, lower, or mixed case;
In parentheses, the data type and name of each argument to be passed to the UDF.
The syntax for the declaration is: udfname(Argtype_ArgName1,Argtype_ArgName2, ...)
For example, the declaration for a sum function that adds two numbers might be SUM(N_A,N_B). Translated, this declaration means that the name of the UDF is SUM. It takes two numeric arguments (represented by N_ ), the first of which will be referred to as A and the second as B in the UDF expression.
To take a more realistic example, the declaration for a function called ISWEEKEND, which determines whether a given date falls on a weekend, might be ISWEEKEND(D_ANYDATE). This declaration means that the ISWEEKEND function takes one date argument, which will be referred to in the UDF expression as ANYDATE.
When you use a UDF in a calculated field expression, you must supply the required arguments that were declared when the UDF was defined. For example, if the UDF declaration specifies one date argument, when you include the UDF reference in a calculated field, you specify one date field as an argument to the UDF.
UDF Names
UDF names can be up to 20 characters long; the first 4 characters must be unique (that is, a UDF name cannot have the same first 4 characters as the name of any other UDF or of any Report Designer function). When you use a UDF in a calculated field expression, you can include just the first 4 characters of the UDF name.
UDF Arguments
UDF arguments represent values that the function will operate on. In the declaration, each argument consists of a letter representing the argument data type, an underscore character (_), and a name.
Use one of the following letters to indicate argument data type:
C for a character argument
D for a date argument
L for a logical argument
M for a memo argument
N for a numeric argument
An argument name, which follows the data type indicator and underscore character, must be unique in the first 9 characters (for example, a declaration such as UDF(C_ARG,N_ARG) is not valid, since both arguments have the same name) and must start with a letter. The name can contain only letters, numbers, and the underscore character.
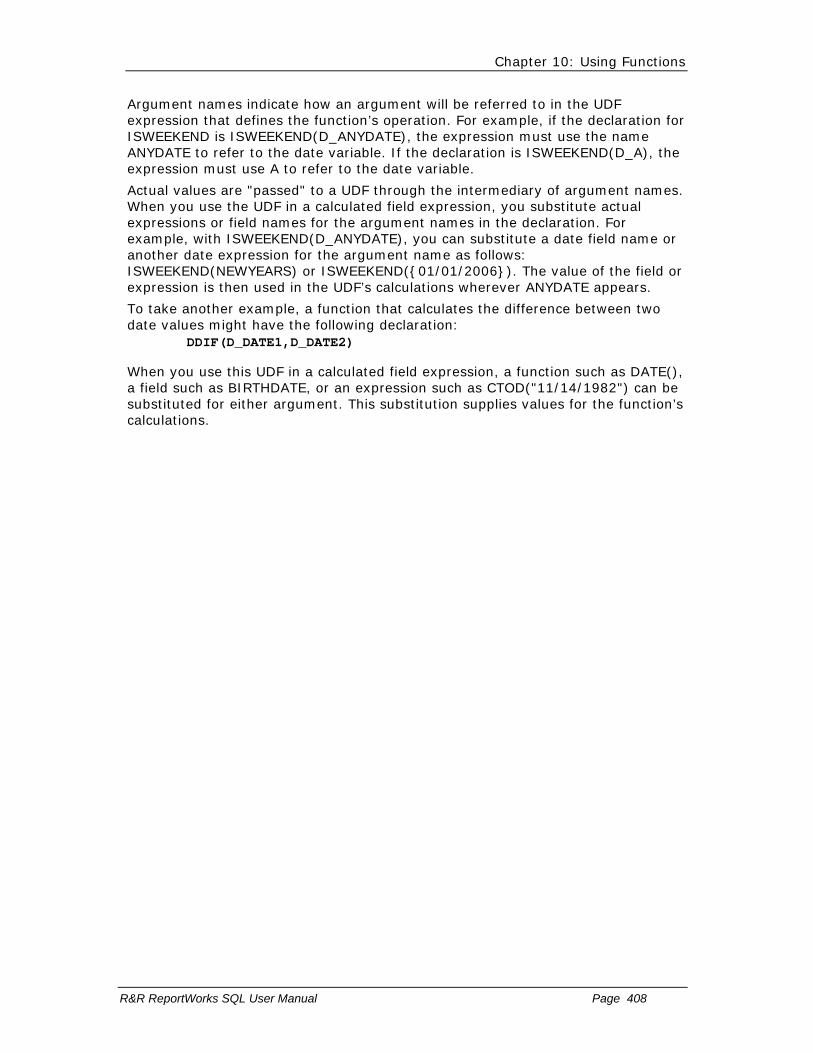
Chapter 10: Using Functions
R&R ReportWorks SQL User Manual Page 408
Argument names indicate how an argument will be referred to in the UDF expression that defines the function’s operation. For example, if the declaration for ISWEEKEND is ISWEEKEND(D_ANYDATE), the expression must use the name ANYDATE to refer to the date variable. If the declaration is ISWEEKEND(D_A), the expression must use A to refer to the date variable.
Actual values are "passed" to a UDF through the intermediary of argument names. When you use the UDF in a calculated field expression, you substitute actual expressions or field names for the argument names in the declaration. For example, with ISWEEKEND(D_ANYDATE), you can substitute a date field name or another date expression for the argument name as follows: ISWEEKEND(NEWYEARS) or ISWEEKEND({01/01/2006}). The value of the field or expression is then used in the UDF’s calculations wherever ANYDATE appears.
To take another example, a function that calculates the difference between two date values might have the following declaration:
DDIF(D_DATE1,D_DATE2)
When you use this UDF in a calculated field expression, a function such as DATE(), a field such as BIRTHDATE, or an expression such as CTOD("11/14/1982") can be substituted for either argument. This substitution supplies values for the function’s calculations.
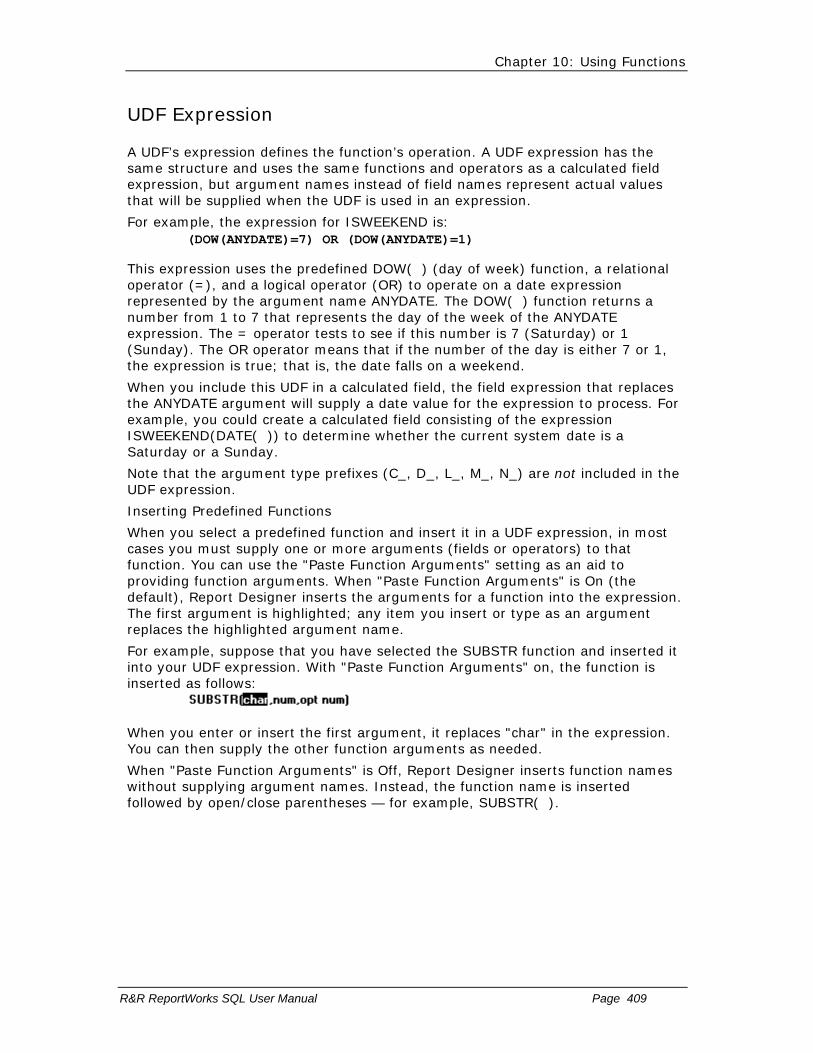
Chapter 10: Using Functions
R&R ReportWorks SQL User Manual Page 409
UDF Expression
A UDF’s expression defines the function’s operation. A UDF expression has the same structure and uses the same functions and operators as a calculated field expression, but argument names instead of field names represent actual values that will be supplied when the UDF is used in an expression.
For example, the expression for ISWEEKEND is: (DOW(ANYDATE)=7) OR (DOW(ANYDATE)=1)
This expression uses the predefined DOW( ) (day of week) function, a relational operator (=), and a logical operator (OR) to operate on a date expression represented by the argument name ANYDATE. The DOW( ) function returns a number from 1 to 7 that represents the day of the week of the ANYDATE expression. The = operator tests to see if this number is 7 (Saturday) or 1 (Sunday). The OR operator means that if the number of the day is either 7 or 1, the expression is true; that is, the date falls on a weekend.
When you include this UDF in a calculated field, the field expression that replaces the ANYDATE argument will supply a date value for the expression to process. For example, you could create a calculated field consisting of the expression ISWEEKEND(DATE( )) to determine whether the current system date is a Saturday or a Sunday.
Note that the argument type prefixes (C_, D_, L_, M_, N_) are not included in the UDF expression.
Inserting Predefined Functions
When you select a predefined function and insert it in a UDF expression, in most cases you must supply one or more arguments (fields or operators) to that function. You can use the "Paste Function Arguments" setting as an aid to providing function arguments. When "Paste Function Arguments" is On (the default), Report Designer inserts the arguments for a function into the expression. The first argument is highlighted; any item you insert or type as an argument replaces the highlighted argument name.
For example, suppose that you have selected the SUBSTR function and inserted it into your UDF expression. With "Paste Function Arguments" on, the function is inserted as follows:
When you enter or insert the first argument, it replaces "char" in the expression. You can then supply the other function arguments as needed.
When "Paste Function Arguments" is Off, Report Designer inserts function names without supplying argument names. Instead, the function name is inserted followed by open/close parentheses — for example, SUBSTR( ).
Chapter 10: Using Functions
R&R ReportWorks SQL User Manual Page 410
Editing a User-Defined Function
To edit an existing user-defined function: 1. Select Calculations ⇒ User Function.
The User Functions dialog box appears.
2. In the Functions list, select the name of the UDF you want to edit.
3. Select the Edit button.
The Edit User Functions dialog box appears.
4. In the User Function Declaration edit box, edit the function name or arguments if you want to change them.
5. In the Expression edit box, edit the expression using any combination of the following methods:
♦ Delete the entire expression by selecting the Reset button.
♦ Edit all or part of the expression by typing directly in the Expression edit box.
♦ Insert a function by selecting an item in the Functions list, then selecting the Insert button.
♦ Insert an operator by selecting the Operator buttons.
♦ Insert a calculated field expression by selecting the Calc Expression button to display the Calculated Fields dialog box.
♦ Insert another user-defined function formula by selecting the User Function Formula button to display the User Functions dialog box.
6. Select the Verify button to determine whether the expression syntax is correct.
Report Designer displays a message box describing what, if any, syntax errors it found in the expression.
7. Select the OK button to confirm the changes or select the Cancel button to close the dialog box without making any changes to the UDF.
If the UDF you are changing will change the data type of another UDF or a calculated field expression in the current report, Report Designer will display a list of UDFs and calculated fields that will become unusable as a result of your change. The items on this list will become impossible for Report Designer to evaluate as a result of your change. At this point, you can select Cancel to cancel the change or OK to make the change. Selecting OK will cause the affected UDFs and fields to be flagged with question marks in field lists. If any flagged UDFs or fields are used in your report, you will have to correct their expressions before you can run the report.
Be very careful about deleting UDFs because they can be used in more than one report. Report Designer cannot notify you of the effect your deletion may have on other reports.

Chapter 10: Using Functions
R&R ReportWorks SQL User Manual Page 411
Deleting a User-Defined Function
To delete a user-defined function: 1. Select Calculations ⇒ User Function.
The User Functions dialog box appears.
2. In the Functions list, select the name of the user-defined function you want to delete.
3. Select the Delete button. If the function you selected is used in another UDF expression or a non-join calculated field, that UDF or calculated field will be deleted as well. In this case, Report Designer shows you a list of all the fields and functions that will be deleted and asks you to confirm or cancel the deletions.
Be very careful about deleting UDFs because they can be used in more than one report. Report Designer cannot notify you of the effect your deletion may have on other reports.
4. Select Close.

Chapter 10: Using Functions
R&R ReportWorks SQL User Manual Page 412
Sample User-Defined Functions
The following sections present examples of user-defined functions and explain the procedures for creating them.
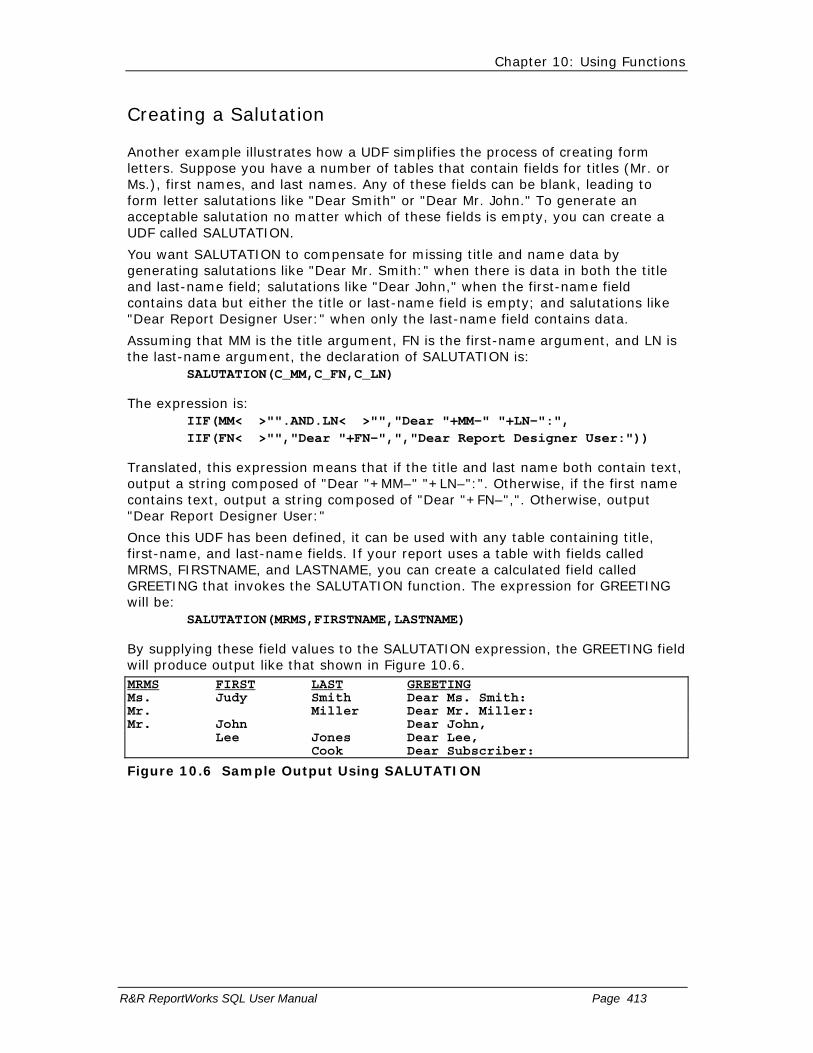
Chapter 10: Using Functions
R&R ReportWorks SQL User Manual Page 413
Creating a Salutation
Another example illustrates how a UDF simplifies the process of creating form letters. Suppose you have a number of tables that contain fields for titles (Mr. or Ms.), first names, and last names. Any of these fields can be blank, leading to form letter salutations like "Dear Smith" or "Dear Mr. John." To generate an acceptable salutation no matter which of these fields is empty, you can create a UDF called SALUTATION.
You want SALUTATION to compensate for missing title and name data by generating salutations like "Dear Mr. Smith:" when there is data in both the title and last-name field; salutations like "Dear John," when the first-name field contains data but either the title or last-name field is empty; and salutations like "Dear Report Designer User:" when only the last-name field contains data.
Assuming that MM is the title argument, FN is the first-name argument, and LN is the last-name argument, the declaration of SALUTATION is:
SALUTATION(C_MM,C_FN,C_LN)
The expression is: IIF(MM< >"".AND.LN< >"","Dear "+MM–" "+LN–":", IIF(FN< >"","Dear "+FN–",","Dear Report Designer User:"))
Translated, this expression means that if the title and last name both contain text, output a string composed of "Dear "+MM–" "+LN–":". Otherwise, if the first name contains text, output a string composed of "Dear "+FN–",". Otherwise, output "Dear Report Designer User:"
Once this UDF has been defined, it can be used with any table containing title, first-name, and last-name fields. If your report uses a table with fields called MRMS, FIRSTNAME, and LASTNAME, you can create a calculated field called GREETING that invokes the SALUTATION function. The expression for GREETING will be:
SALUTATION(MRMS,FIRSTNAME,LASTNAME)
By supplying these field values to the SALUTATION expression, the GREETING field will produce output like that shown in Figure 10.6. MRMS FIRST LAST GREETING Ms. Judy Smith Dear Ms. Smith: Mr. Miller Dear Mr. Miller: Mr. John Dear John, Lee Jones Dear Lee, Cook Dear Subscriber:
Figure 10.6 Sample Output Using SALUTATION

Chapter 10: Using Functions
R&R ReportWorks SQL User Manual Page 414
Calculating Appreciated Value
Another example illustrates the creation of a numeric UDF that calculates the current value of appreciable assets. Since appreciated value depends on original value, interest rate, and the time that has elapsed since the asset was purchased, the declaration for an appreciated value (AV) function is as follows:
AV(N_OV,N_INT,D_DP)
In this declaration, OV represents original value, INT is interest rate, and DP is date of purchase. If yearly interest is converted to daily interest, the expression for the AV function is:
OV*(1+(INT/365))^DAYSBTWN(DATE( ),DP)
Translated, this expression means that appreciated value will be calculated by taking the original value and multiplying it by 1 plus the interest rate divided by 365 (days in a year) raised to a power that is the number of days since the asset was purchased. This number of days is supplied by the DAYSBTWN( ) function, which calculates the number of days between the current date (supplied by the DATE( ) function) and the date of purchase.
When you use this function in a calculated field expression, you replace the OV, INT, and DP arguments with actual expressions. For example, if you have an asset table that includes a COST field containing the asset’s purchase price and a PURDATE field containing the purchase date, you can use the following expression to compute appreciated value at an 8% interest rate:
AV(COST,.08,PURDATE)
Two field names and a constant are substituted for the arguments in AV’s declaration. This substitution supplies values to the expression that calculates appreciated value. To calculate appreciated value at a different interest rate, all you have to do is change the constant.

Chapter 10: Using Functions
R&R ReportWorks SQL User Manual Page 415
Creating and Using a System UDF file
In addition to the standard RSW.UDF user defined function library, Version 10 also support a second SYSRSW.UDF. The SYSRSW.UDF is a read only user function library whose functions can be read and used in reports but whose definitions cannot be edited. Having this secondary UDF library allows developers to distribute a custom UDF file to their users while still allowing those users to maintain their own user defined functions.
To create a SYSRSW.UDF, you first create your functions in the Report Designer that will write them to RR.UDF. Then using Windows Explorer, you simply rename RSW.UDF to SYSRSW.UDF.
When R&R is opened it will first read any user functions from SYSRSW.UDF followed by those from RSW.UDF. Functions from each will appear in any R&R function listing. In the Calculations User Function dialog, functions from both files will be listed and their expressions will appear in the Expression box but the Edit and Delete buttons will not be available for those functions that reside in SYSRSW.UDF.

Chapter 11 Sorting and Grouping Data
Introduction (Sorting and Grouping Data)
This chapter explains how to use the Sort and Group commands to sort and group data in reports. With the Sort command, you can select up to 8 sort fields to determine the order in which data will be presented in a report. With the Group command, you can select up to 8 group fields to group data into categories.
The explanation of sorting and grouping in this chapter is presented in the following sections:
Sorting Data
Grouping Data
Techniques for Sorting and Grouping
For Auto-SQL reports, you use the Sort commands described in this chapter to control the order in which data will be presented in a report. For User-SQL reports, sorting is controlled by the ORDER BY clause in your SELECT statement. For either Auto-SQL or User-SQL reports, you use the Group commands to select group fields to group data into categories.

Chapter 11: Sorting and Grouping Data
R&R ReportWorks SQL User Manual Page 417
Sorting Data
Before you select one or more sort fields, the order of your report data is determined by the order of records in the master table. Selecting sort fields gives you complete control over the order in which data will be presented in a report. The sort order that you establish overrides the database order.
If you select one sort field, the order of data in that field determines the report’s record order. You can select additional sort fields to establish a sorting hierarchy; the number of the sort fields determines the hierarchy. The first sort field determines the highest level sort; the eighth sort field determines the lowest-level sort.
For example, if you select STATE as the first sort field, CITY as the second, and COMPANY as the third, Report Designer sorts data first by state, then by city within each state, then by company within each city.
Note that sorting records in Report Designer affects only the order in which data is presented in reports; it does not affect your tables.

Chapter 11: Sorting and Grouping Data
R&R ReportWorks SQL User Manual Page 418
Selecting Sort Fields
The Database ⇒ Sort Order command enables you to select up to 8 fields for sorting the composite records in your report. When you select a sort field, the order in which Report Designer arranges report records is determined by the order of data in the specified sort field.
For example, suppose the composite record structure includes a SHIP_TYPE field. If you select SHIP_TYPE as a sort field, the report data will be sorted alphabetically by the value found in the SHIP_TYPE field of each composite record.
To specify sort fields:
1. Select Database ⇒ Sort Order (or the Sort button) to display the Sort Order dialog (see Figure 11.1).
Figure 11.1 Sort Order Dialog Box
2. Open the list box for the first sort field by pressing the […] field selection dialog. This menu displays all data fields (except memo fields) from the tables used in the report, as well as certain calculated and total fields.
3. Select a field from this menu to establish the first level of sorting.
4. Select other sort fields as necessary to specify additional sort levels. If the slot where you want to add a sort level is empty, simply open the list box and select a field. To insert a sort level between two existing sort fields, first highlight the field that’s in the slot where you want to insert; then select Insert. The current sort field and those below it will be pushed down one level. The list box for the inserted slot will automatically be opened; select the sort field you want to insert at that level. Then select OK.
5. Select OK to save the new sort order.
Chapter 11: Sorting and Grouping Data
R&R ReportWorks SQL User Manual Page 419
By default, data for the field you select will be arranged in ascending order. Ascending order is alphabetical for character fields, false before true for logical fields, from most negative to most positive for numeric fields, and chronological for date fields. Descending order is the opposite of ascending order. To change to descending order, turn off the "Ascending" setting in the Sort Order column next to the selected field.
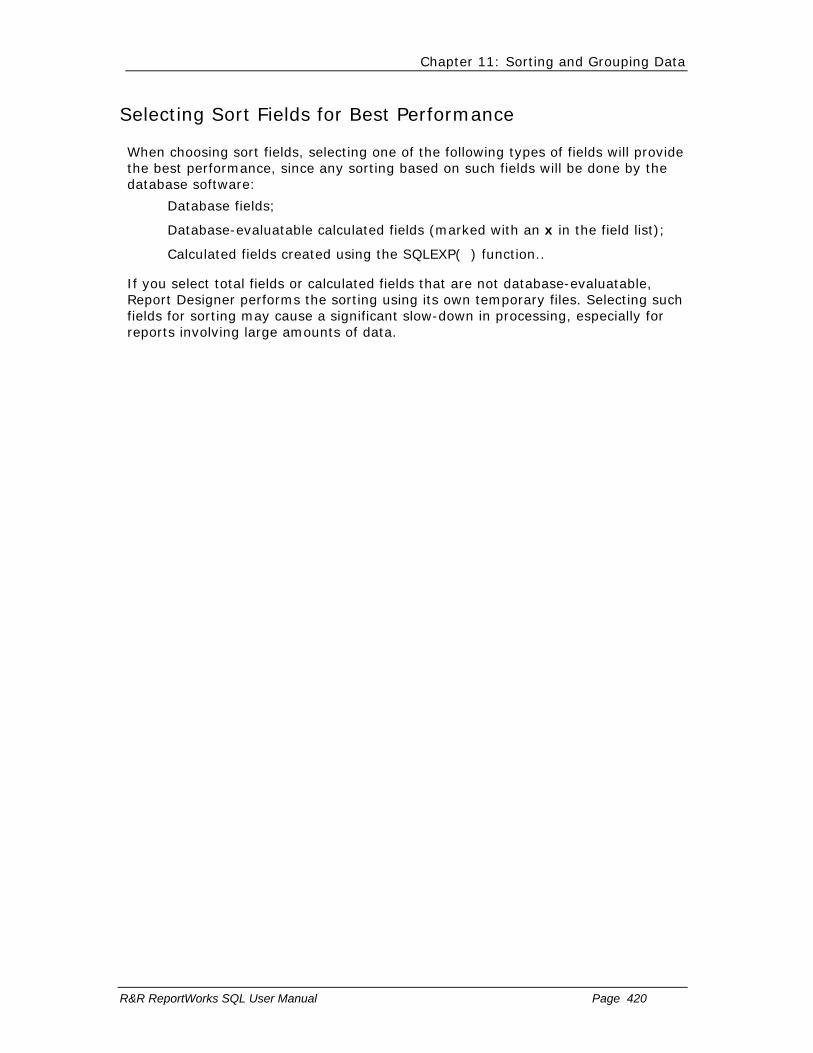
Chapter 11: Sorting and Grouping Data
R&R ReportWorks SQL User Manual Page 420
Selecting Sort Fields for Best Performance
When choosing sort fields, selecting one of the following types of fields will provide the best performance, since any sorting based on such fields will be done by the database software:
� Database fields;
� Database-evaluatable calculated fields (marked with an x in the field list);
� Calculated fields created using the SQLEXP( ) function..
If you select total fields or calculated fields that are not database-evaluatable, Report Designer performs the sorting using its own temporary files. Selecting such fields for sorting may cause a significant slow-down in processing, especially for reports involving large amounts of data.
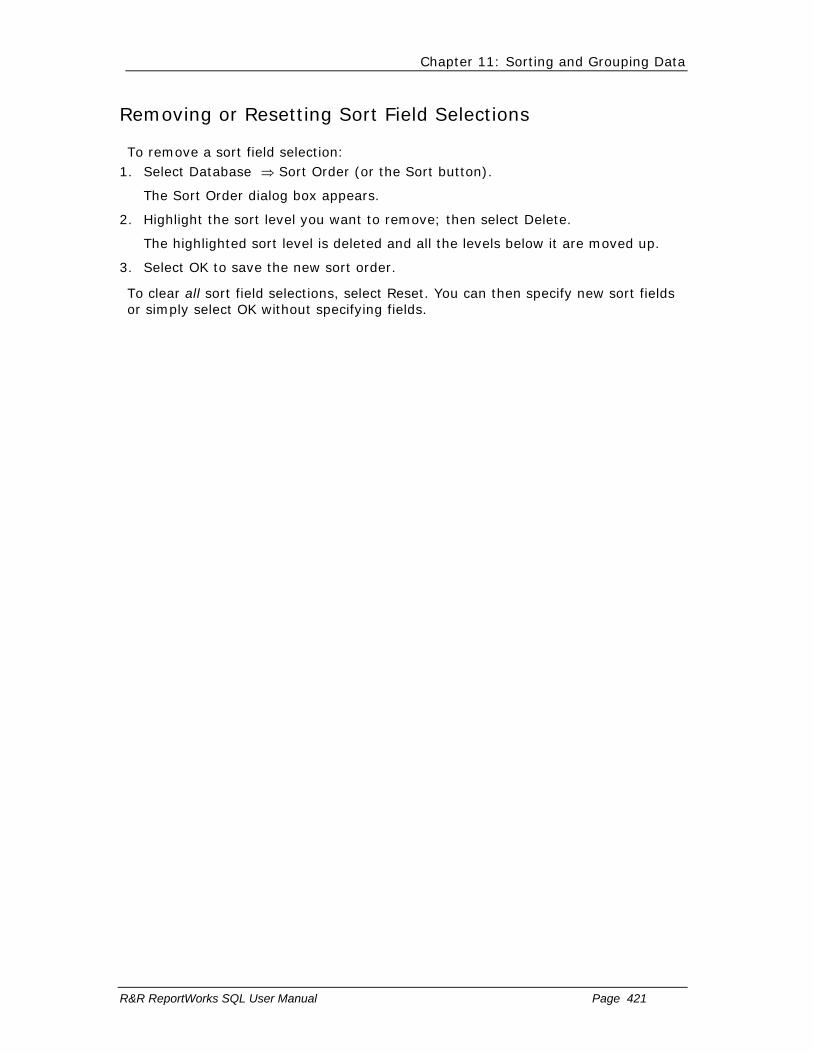
Chapter 11: Sorting and Grouping Data
R&R ReportWorks SQL User Manual Page 421
Removing or Resetting Sort Field Selections
To remove a sort field selection: 1. Select Database ⇒ Sort Order (or the Sort button).
The Sort Order dialog box appears.
2. Highlight the sort level you want to remove; then select Delete.
The highlighted sort level is deleted and all the levels below it are moved up.
3. Select OK to save the new sort order.
To clear all sort field selections, select Reset. You can then specify new sort fields or simply select OK without specifying fields.

Chapter 11: Sorting and Grouping Data
R&R ReportWorks SQL User Manual Page 422
Grouping Data
The Database ⇒ Group Order command enables you to select up to 8 fields for grouping the composite records in your report. By selecting group fields, you can organize the records in your report in up to 8 hierarchical categories. Each category can have an associated Group Header and/or Footer to identify it or to provide summary information about the records in that group.
The number of the group field determines the grouping hierarchy in your report. The first group field selection specifies the most general (most inclusive) grouping level; the eighth group selection specifies the most specific (least inclusive) grouping level.
For example, you might want to group records in a sales report by region, state, city, and product. The report excerpt in Figure 11.2 uses these group fields to report sales at four levels of detail:
1 REGION (1st level) 2 STATE (2nd level) 3 CITY (3rd level) 4 PRODUCT (4th level)
Note that if you do not select group fields for a report, the default group fields will be the same as your sort fields.

Chapter 11: Sorting and Grouping Data
R&R ReportWorks SQL User Manual Page 423
Quarterly Sales Report Region: Northwestern State City Product Sales Alaska Anchorage PC Com $999 PC Database $4,470 PC Spreadsheet $1,490 ------ Total Sales for Anchorage $6,959 Fairbanks PC Database $7,450 PC Publisher $1,245 PC Spreadsheet $1,490 ------ Total Sales for Fairbanks $10,185 Alaska Sales $17,144 . . . NORTHWESTERN REGION SALES $45,859
Figure 11.2 Grouped Report
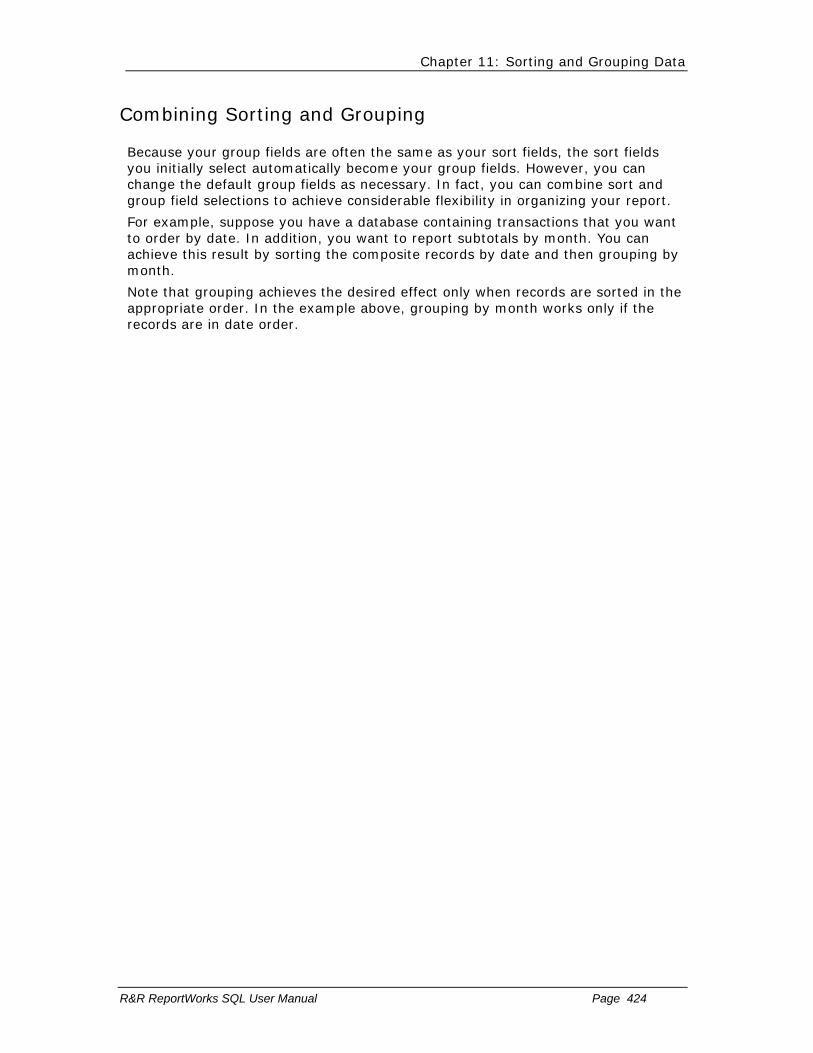
Chapter 11: Sorting and Grouping Data
R&R ReportWorks SQL User Manual Page 424
Combining Sorting and Grouping
Because your group fields are often the same as your sort fields, the sort fields you initially select automatically become your group fields. However, you can change the default group fields as necessary. In fact, you can combine sort and group field selections to achieve considerable flexibility in organizing your report.
For example, suppose you have a database containing transactions that you want to order by date. In addition, you want to report subtotals by month. You can achieve this result by sorting the composite records by date and then grouping by month.
Note that grouping achieves the desired effect only when records are sorted in the appropriate order. In the example above, grouping by month works only if the records are in date order.

Chapter 11: Sorting and Grouping Data
R&R ReportWorks SQL User Manual Page 425
Selecting Group Fields
When you select sort fields, Report Designer automatically makes those fields your group fields. Using the Group Order dialog box, you can change the existing group field selections, insert or delete group fields, and specify options that control how grouped data will be presented in your report.
To add a group level to a report: 1. Select Database ⇒ Group Order, the Group button, or the Group button in
the Sort dialog box to display the Group Order dialog box (see Figure 11.3).
Figure 11.3 Group Order Dialog Box
2. If the slot in which you want to select a field for grouping is blank, select the field name using the […] field selection button next to that slot.
3. To insert a group level above a level for which you have already selected a field, highlight the existing group level; then select the Insert button. The highlighted group level and all the levels below it are moved down, leaving a blank slot. Select a field name from the drop-down list for the blank slot.
4. Select OK to save the new group order.
You can specify up to 8 grouping levels on the Group Order dialog box. Once you have specified multiple group fields, you can insert or remove selections; Report Designer automatically adjusts the remaining group field selections.

Chapter 11: Sorting and Grouping Data
R&R ReportWorks SQL User Manual Page 426
Removing or Resetting Group Field Selections
To remove a group field selection: 1. Select Database ⇒ Group Order (or the Group button).
The Group Order dialog box appears.
2. Highlight the group level you want to remove; then select Delete.
The highlighted group level is removed and all the levels below it are moved up.
3. Select OK to save the new group order.
To clear all group field selections, select Reset. You can then select new group fields or simply select OK without selecting fields.

Chapter 11: Sorting and Grouping Data
R&R ReportWorks SQL User Manual Page 427
Changing Group Options
The Group Order dialog contains the following additional options that provide further control over how grouped data appears on the report:
Print Once Swap Footer
Reset Page Repeat Header
Swap Header
By default, each of these options is Off. To turn an option On for a particular group level, click the box in the appropriate column. The following sections explain each of the group options.

Chapter 11: Sorting and Grouping Data
R&R ReportWorks SQL User Manual Page 428
Print Once
This option enables you to suppress printing of repeating data on Record lines. For example, if you group a report by STATE, and the STATE field has been inserted in the Record band, the same state name will print for each record in a group. By turning on Print Once, you can suppress this repetition and print the state name once only.
By default, data from a selected group field will print on every line that includes that field. To specify that the data from a group field print only once per group, turn on the Print Once option for that group level.
In the report excerpt illustrated in Figure 11.4, Print Once is Off for the customer name group field.
Customer Name Item Quantity Amount Joyce Adams 101 18 162.00 Joyce Adams 103 12 60.00 Joyce Adams 108 36 144.00 ------ Subtotal 366.00 Greg Anderson 102 18 177.00 Greg Anderson 104 64 192.00
Figure 11.4 Report with Print Once Turned Off
Figure 11.5 shows the same report with Print Once turned On.
Customer Name Item Quantity Amount Joyce Adams 101 18 162.00 103 12 60.00 108 36 144.00 ------ Subtotal 366.00 Greg Anderson 102 18 177.00 104 64 192.00
Figure 11.5 Report with Print Once Turned On

Chapter 11: Sorting and Grouping Data
R&R ReportWorks SQL User Manual Page 429
Reset Page
Using the Reset Page setting, you can reset the page number to 1 and start a new page for each group. For example, if you are printing a series of invoices grouped by order number and each invoice contains several pages of items ordered, you can re-start numbering for the first page of each invoice at Page 1.
By default, Report Designer numbers report pages consecutively. To have Report Designer reset the page number returned by the PAGENO( ) function to 1 after the last record of each group, turn on Reset Page for that group level; as a result, each group will automatically begin on a new page. The Reset Page setting also determines what burst levels will be available in Report Designer when the Mail Options setting is selected within File Export.

Chapter 11: Sorting and Grouping Data
R&R ReportWorks SQL User Manual Page 430
Swap Header
When you create a report layout that contains Group Headers, you can use the Swap Header option to print the Group Header instead of the Page Header on pages where the group changes. The Group Header created for swapping must be the same number of lines as the Page Header, since it will substitute for the Page Header on some pages. Group Header and Page Header lines should also have the same line height.
By default, Report Designer prints a Group Header before the first record for each group and places the Page Header at the top of each page. To print the Group Header instead of the Page Header at the top of the first page containing records for a new group, turn on Swap Header for that group level; as a result, each group will automatically begin on a new page.
For example, use the Swap Header option to print sales information grouped by region, with the region name at the top of each page on which a new region begins. By turning Swap Header on, you tell Report Designer to print the Group Header at the top of the first page of the group (each group will begin on a new page) and then print the Page Header at the top of each subsequent page in the group.
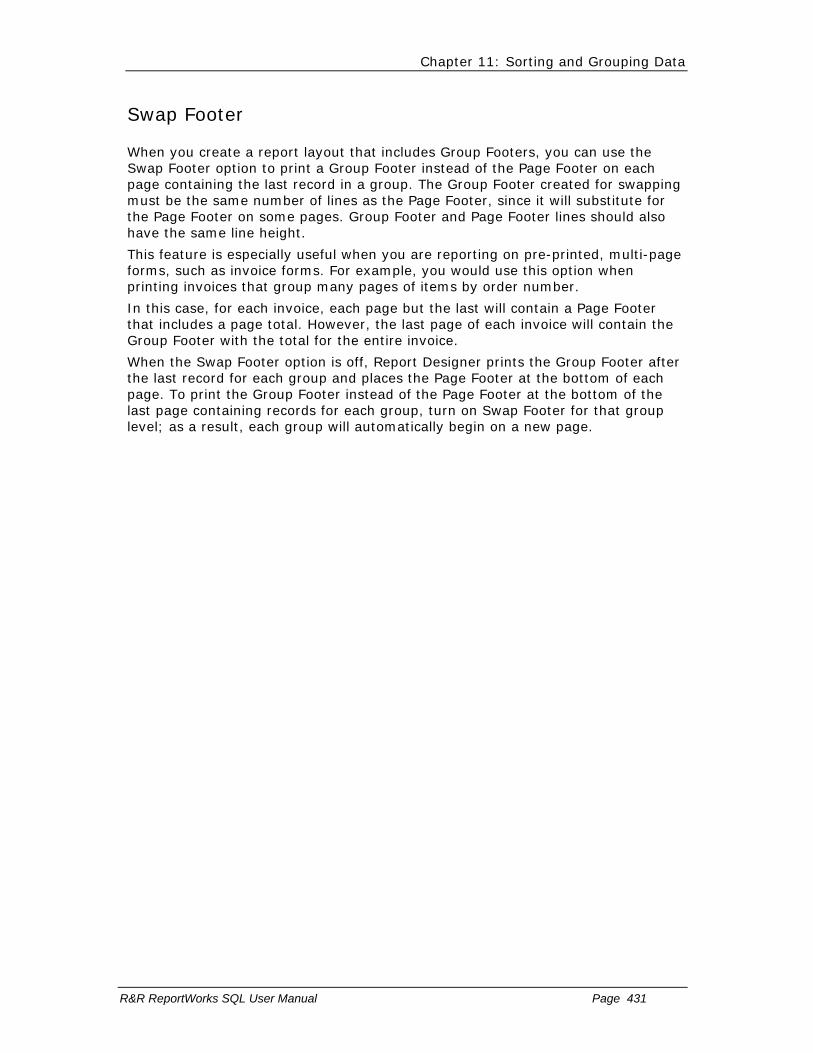
Chapter 11: Sorting and Grouping Data
R&R ReportWorks SQL User Manual Page 431
Swap Footer
When you create a report layout that includes Group Footers, you can use the Swap Footer option to print a Group Footer instead of the Page Footer on each page containing the last record in a group. The Group Footer created for swapping must be the same number of lines as the Page Footer, since it will substitute for the Page Footer on some pages. Group Footer and Page Footer lines should also have the same line height.
This feature is especially useful when you are reporting on pre-printed, multi-page forms, such as invoice forms. For example, you would use this option when printing invoices that group many pages of items by order number.
In this case, for each invoice, each page but the last will contain a Page Footer that includes a page total. However, the last page of each invoice will contain the Group Footer with the total for the entire invoice.
When the Swap Footer option is off, Report Designer prints the Group Footer after the last record for each group and places the Page Footer at the bottom of each page. To print the Group Footer instead of the Page Footer at the bottom of the last page containing records for each group, turn on Swap Footer for that group level; as a result, each group will automatically begin on a new page.
Chapter 11: Sorting and Grouping Data
R&R ReportWorks SQL User Manual Page 432
Repeat Header
This option allows you to reprint a Group Header at the top of the page when a group continues across several pages. When this option is on, each time Report Designer starts a new page it prints a Page Header, if any, and then repeats the Group Header before printing more data within the group. When this option is off, Report Designer prints the Group Header only once at the beginning of each group. You can use this option to reprint column headings contained in a Group Header when the data for that group continues across pages.
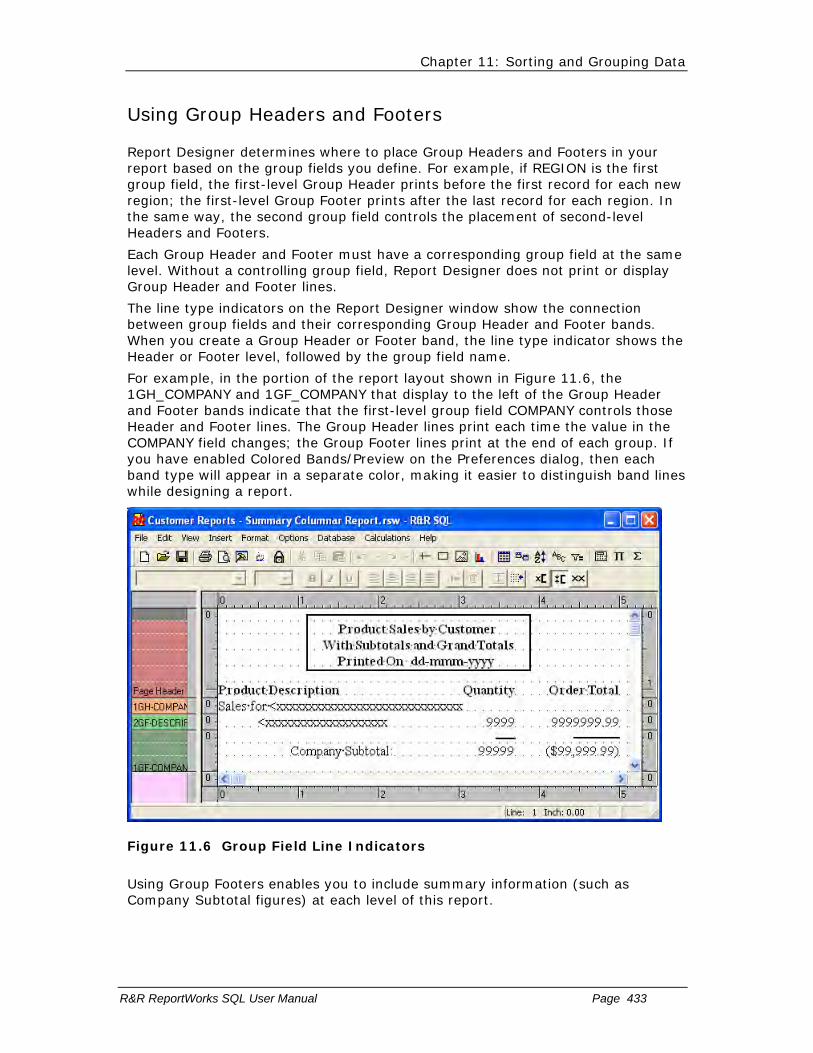
Chapter 11: Sorting and Grouping Data
R&R ReportWorks SQL User Manual Page 433
Using Group Headers and Footers
Report Designer determines where to place Group Headers and Footers in your report based on the group fields you define. For example, if REGION is the first group field, the first-level Group Header prints before the first record for each new region; the first-level Group Footer prints after the last record for each region. In the same way, the second group field controls the placement of second-level Headers and Footers.
Each Group Header and Footer must have a corresponding group field at the same level. Without a controlling group field, Report Designer does not print or display Group Header and Footer lines.
The line type indicators on the Report Designer window show the connection between group fields and their corresponding Group Header and Footer bands. When you create a Group Header or Footer band, the line type indicator shows the Header or Footer level, followed by the group field name.
For example, in the portion of the report layout shown in Figure 11.6, the 1GH_COMPANY and 1GF_COMPANY that display to the left of the Group Header and Footer bands indicate that the first-level group field COMPANY controls those Header and Footer lines. The Group Header lines print each time the value in the COMPANY field changes; the Group Footer lines print at the end of each group. If you have enabled Colored Bands/Preview on the Preferences dialog, then each band type will appear in a separate color, making it easier to distinguish band lines while designing a report.
Figure 11.6 Group Field Line Indicators
Using Group Footers enables you to include summary information (such as Company Subtotal figures) at each level of this report.

Chapter 11: Sorting and Grouping Data
R&R ReportWorks SQL User Manual Page 434
Techniques for Sorting and Grouping
You can use various techniques to obtain further control over the order of report records. For example, you can:
� Sort and group on total fields;
� Sort and group on calculated fields.
These techniques are explained in the following sections.

Chapter 11: Sorting and Grouping Data
R&R ReportWorks SQL User Manual Page 435
Sorting and Grouping with Total Fields
Report Designer allows you to sort and group on total fields, as long as the fields have been designated as pre-processed.
For example, suppose you want to create an orders report that shows total orders by state and within state, by customer. You want to list states in order of decreasing number of orders, and within each state group, you want to list customers in order of decreasing number of orders.
You might create this report as follows: 1. Create the report using STATE and CUSTID as your initial sort and group fields,
so that you can create the group totals you want.
2. Create a total field called STATECNT that is a count of the ORDERNO field reset on the STATE group field. This field will count the number of orders for each state. On the Total Field dialog, select Options and select "Pre-processed" as the Processing type.
3. Create a total field called CUSTCNT that is a count of the ORDERNO field that resets on the CUSTID group field. This field will count the number of orders for each customer. On the Total Field dialog, select Options and select "Pre-processed" as the Processing type.
4. Replace the STATE sort field with the pre-processed STATECNT total field.
5. Replace the CUSTID sort field with the pre-processed CUSTCNT total field.
Note that although your list of sort fields will be STATECNT, CUSTCNT, Report Designer will sort your report as if the sort fields were STATECNT, STATE, CUSTCNT, CUSTID. The STATE and CUSTID fields are implicitly included (even though they do not appear in the list of sort fields) to resolve ties between states that have the same number of orders and between customers that have the same number of orders.
As a general rule, when a pre-processed total field (or calculated field using a pre-processed total) is selected as sort field n, Report Designer inserts an implicit sort field between sort level n and n+1. The implicit sort field is the group field on which the total resets. If your sort field list includes several contiguous pre-processed totals that reset on the same group field, Report Designer inserts the implicit sort field once, after the last of the contiguous totals.
Chapter 11: Sorting and Grouping Data
R&R ReportWorks SQL User Manual Page 436
Sorting and Grouping with Calculated Fields
Report Designer allows you to sort and group on most calculated fields. For example, you could sort and group an orders report by month by creating a calculated field with the expression MONTH(ORD_DATE). Using this expression as the first sort and group field in your report allows you to sort by month, as well as create Group Headers and Footers for each month’s records.
Although you can group on such fields, you cannot use as a sort field any calculated field that:
� Uses the PAGENO, RECNO, or PREVIOUS functions;
� Is self-referencing;
� Is running-total-related.
You can also sort and group on many total-related calculated fields, as long as the total fields used in the calculated field expressions have been designated as pre-processed. For example, you could sort and group a customer report by customer category, using a calculated field that assigned customers to a category based on the total dollar volume of their orders. You might create such a report as follows:
1. Create the report using CUSTID as the first sort and group field.
2. Create a total field called CUST_TOT that is a sum of the ORD_AMT field reset on the CUSTID group field. This field will sum the order amounts for each customer.
3. Use the Options setting on the New/Edit Total Fields dialog to make CUST_TOT a pre-processed total.
4. Create a calculated field called CATEGORY that assigns customers to one of three categories ("High Volume", "Moderate Volume", "Low Volume") based on the value in the CUST_TOT pre-processed total field.
The field might have the following expression:
IIF(CUST_TOT>50000,"High Volume", IIF(CUST_TOT >= 10000,"Moderate Volume", "Low Volume"))
5. Use the Sort command to replace the CUSTID sort field with the CATEGORY field. If you want to sort by customer total within this category, you could add CUST_TOT as the second-level sort field.
6. Use the Group command to insert the CATEGORY field as the first group field, pushing the CUSTID field down one level.
7. Use Calculations ⇒ Total Field to edit the CUST_TOT total field so that it will continue to reset on CUSTID, which is now the second group field.
Although you can group on calculated fields whose expressions include both a pre-processed total field and a database field, you cannot select such fields as sort fields. This restriction is a result of the type of processing that produces pre-processed totals.

Chapter 12 Creating Filters
Introduction (Creating Filters)
This chapter explains how to use Database ⇒ Filter to select the composite records that will be included in a report. With this command, you can define a set of selection conditions called a filter, which is saved with your report. Each time you run the report, Report Designer will include only those records that meet the selection conditions.
Information about defining and using filters is presented in the following sections:
Filter Structure
Defining a Filter
Editing a Filter
Filter Techniques

Chapter 12: Creating Filters
R&R ReportWorks SQL User Manual Page 438
Filter Structure
Each filter consists of one or more conditions that instruct Report Designer to retrieve data selectively based on criteria that you establish. To build a filter condition, you select or enter elements using the Condition dialog explained in the Defining a Filter section of this chapter. Each filter condition consists of three elements:
� A field from the composite record structure;
� A comparison operator such as "equal to" (see Figure 12.1);
� A comparison value, which can be a field, value, list of values, or range to which the value of the first field is compared.
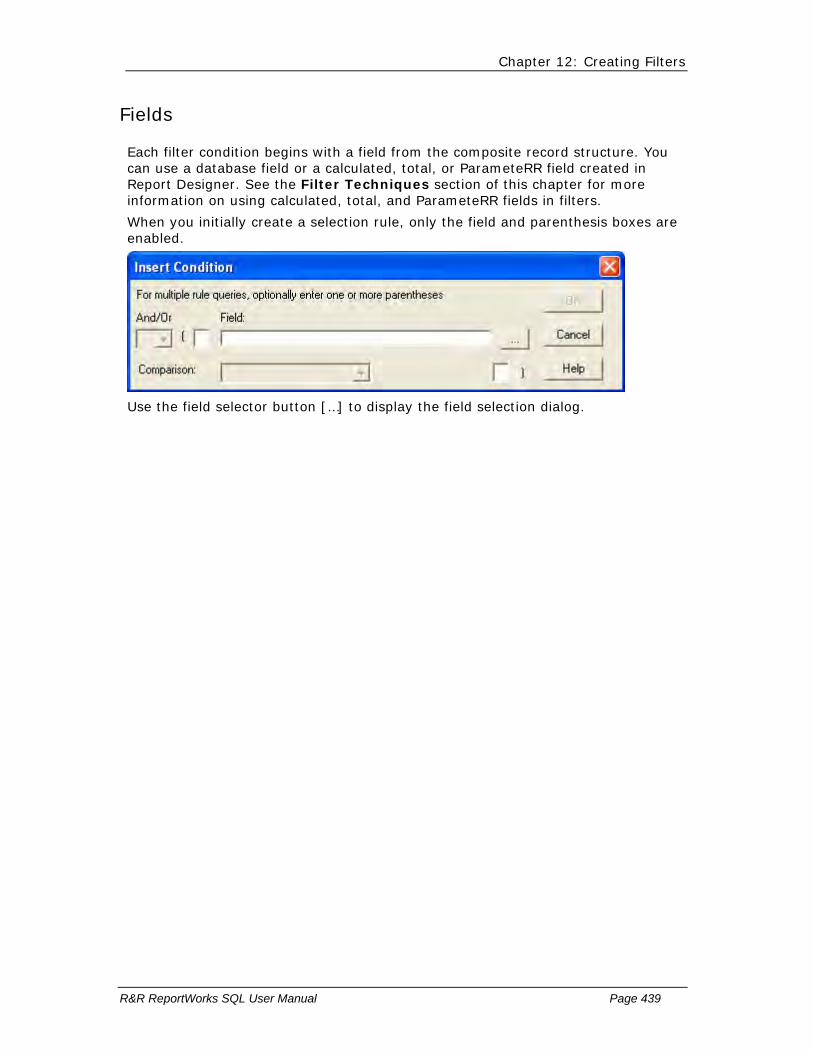
Chapter 12: Creating Filters
R&R ReportWorks SQL User Manual Page 439
Fields
Each filter condition begins with a field from the composite record structure. You can use a database field or a calculated, total, or ParameteRR field created in Report Designer. See the Filter Techniques section of this chapter for more information on using calculated, total, and ParameteRR fields in filters.
When you initially create a selection rule, only the field and parenthesis boxes are enabled.
Use the field selector button […] to display the field selection dialog.

Chapter 12: Creating Filters
R&R ReportWorks SQL User Manual Page 440
Comparison Operators
The second element of every filter condition is a comparison operator, such as "equal to" or "not equal to." Figure 12.1 lists the comparison operators provided by Report Designer.
Operator Field Is Supported Data Types
equal to Equal to entered value or selected field’s value
All
not equal to Not equal to entered value or selected field’s value
All
greater than Greater than entered value or selected field’s value
All except logical
greater than or equal to
Greater than or equal to entered value or selected field’s value
All except logical
less than Less than entered value or selected field’s value
All except logical
less than or equal to
Less than or equal to entered value or selected field’s value
All except logical
in the range Between two entered values or equal to either
All except logical
not in the range Not between two values and equal to neither
All except logical
in the list Equal to one of up to 10 listed values
All except logical
not in the list Not equal to any listed values
All except logical
like Like the entered pattern
Character/memo
not like Not like the entered pattern
Character/memo
is null The NULL value All
is not null Not the NULL value All
Figure 12.1 Comparison Operators

Chapter 12: Creating Filters
R&R ReportWorks SQL User Manual Page 441
For example, the following filter consists of two conditions telling Report Designer to select the records for all cities in California with a population greater than 5000. Include all records where (STATE is equal to "CA") and (POPULTN is greater than "5000")
Because the conditions are joined by "and," Report Designer will retrieve records that satisfy the requirements of both conditions. If these conditions were joined by "or" instead, Report Designer would retrieve all records that satisfy either condition; that is, records in which the value of STATE is "CA" or the value of POPULTN is greater than 5000.
Note that the Field you select controls the list of comparison operators you see. For example, if you select a logical field, only "equal to" and "not equal to" are displayed in the Comparison list.

Chapter 12: Creating Filters
R&R ReportWorks SQL User Manual Page 442
Comparison Values
The compared to area of the Selection Rule dialog dynamically changes based upon the comparison operator and the data type of the selected field.
The following sections describe:
Entering string values
Entering numeric values
Selecting logical values
Selecting date and date/time values
Working with single value operators
Working with list operators
Working with range operators
Note also that the case sensitivity of filter comparisons depends on how Report Designer or your database software is configured for case sensitivity.
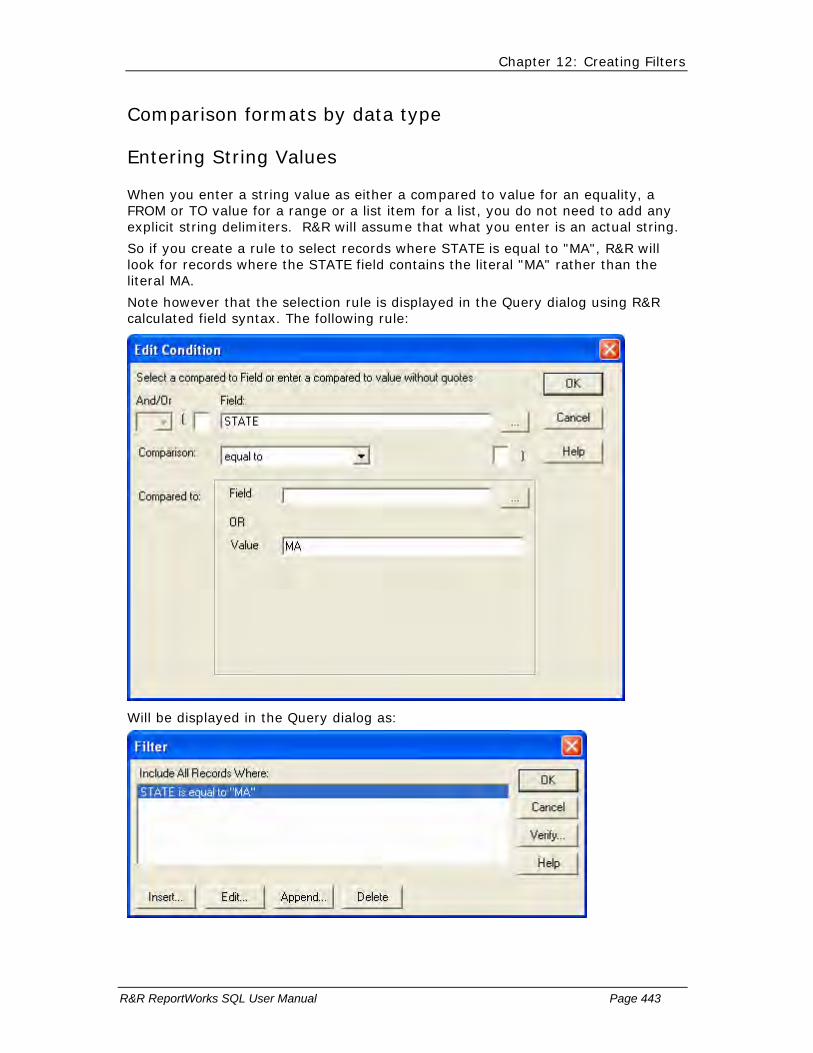
Chapter 12: Creating Filters
R&R ReportWorks SQL User Manual Page 443
Comparison formats by data type
Entering String Values
When you enter a string value as either a compared to value for an equality, a FROM or TO value for a range or a list item for a list, you do not need to add any explicit string delimiters. R&R will assume that what you enter is an actual string.
So if you create a rule to select records where STATE is equal to "MA", R&R will look for records where the STATE field contains the literal "MA" rather than the literal MA.
Note however that the selection rule is displayed in the Query dialog using R&R calculated field syntax. The following rule:
Will be displayed in the Query dialog as:

Chapter 12: Creating Filters
R&R ReportWorks SQL User Manual Page 444
Note that the literal MA is displayed in quoted delimiters.
To select a blank value as a comparison value, you can simply leave the compared to value blank and press OK.

Chapter 12: Creating Filters
R&R ReportWorks SQL User Manual Page 445
Entering Numeric Values
When you enter a numeric value as either a compared to value for an equality, a FROM or TO value for a range or a list item for a list, you enter only signs, decimals and digits.
Chapter 12: Creating Filters
R&R ReportWorks SQL User Manual Page 446
Selecting Logical Values
When a logical field is compared, a comparison value is selected usingTrue/False radio buttons.
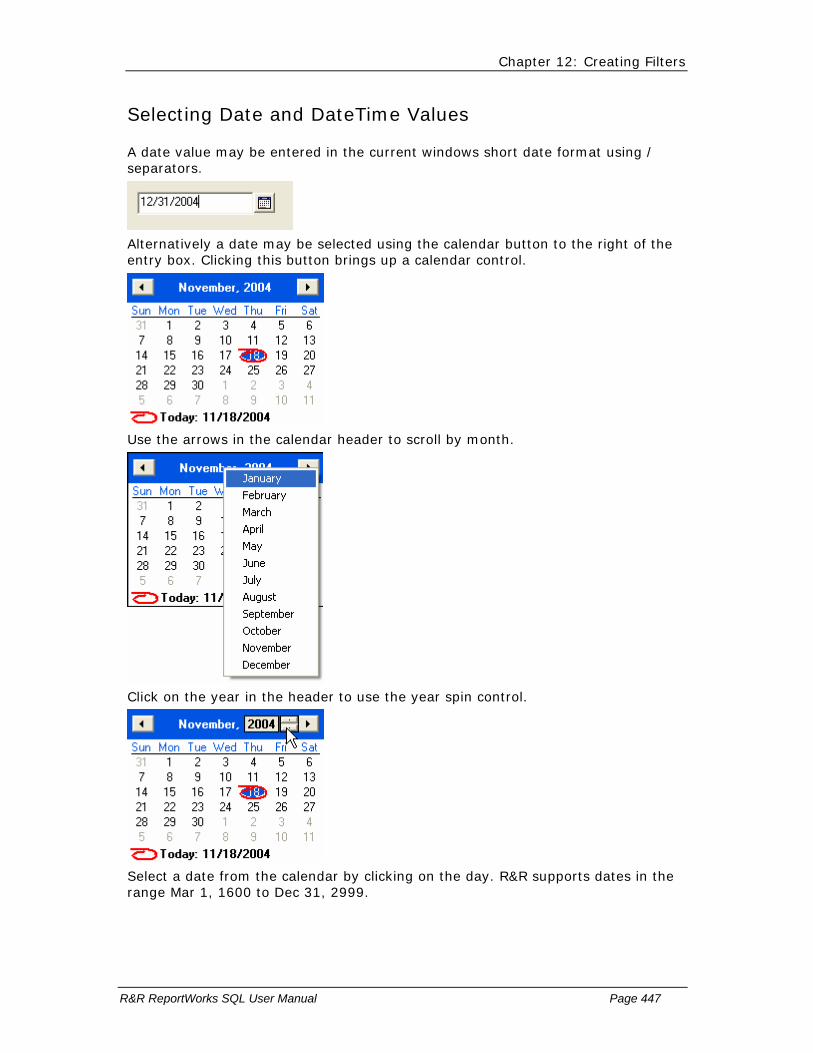
Chapter 12: Creating Filters
R&R ReportWorks SQL User Manual Page 447
Selecting Date and DateTime Values
A date value may be entered in the current windows short date format using / separators.
Alternatively a date may be selected using the calendar button to the right of the entry box. Clicking this button brings up a calendar control.
Use the arrows in the calendar header to scroll by month.
Click on the year in the header to use the year spin control.
Select a date from the calendar by clicking on the day. R&R supports dates in the range Mar 1, 1600 to Dec 31, 2999.

Chapter 12: Creating Filters
R&R ReportWorks SQL User Manual Page 448
A date time value is entered just as for a date but with the additional selection of a time component. You must provide a date before adjusting the time. When you create a new date time default the time portion defaults to the current system time.
You can manually enter any part of the time or can select a time part (use the right and left arrows to select each of the time components) and then use the spin controls to change the selected time part.
Note however that any date/datetime selection rule is displayed in the Filter dialog using R&R calculated field syntax and formats the selected date/datetime using { / / } syntax.

Chapter 12: Creating Filters
R&R ReportWorks SQL User Manual Page 449
Single Value Comparisons
The operators Equal to, Not Equal to, Greater than, Greater than or equal to, Less than, Less than or equal, Like and not like to are all single value operators. This means that they compare the selected field to a single value.
This single value can be either a literal value that you explicitly enter in the selection rule or it can be an existing report field.
The compared to box for a single value comparison operator contains two boxes.
The upper box is a field selection box where you can select an existing field.
The lower box is the value entry box where you can enter a literal value.
Note that you can either select a field OR enter a value. If you first select a field and then enter a value, when you enter the value, the field entry is cleared. It also works the other way around. If you enter a value and then select a field, the value entry is cleared.
See the next sections for information on entering values for each available datatype.

Chapter 12: Creating Filters
R&R ReportWorks SQL User Manual Page 450
Defining a Range of Values
If you have selected "in the range" or "not in the range" to define a range of comparison values you will be given two entry areas to enter the FROM and TO values that will determine the end points of the range. You use the same format for each endpoint as you would enter a single value comparison of that same data type.
If the FROM value is greater than the TO value, R&R will return a "Range out of order" error and will not allow you to proceed.

Chapter 12: Creating Filters
R&R ReportWorks SQL User Manual Page 451
Entering Values in a List
If you have selected "in the list" or "not in the list" as the comparison operator, you can enter multiple comparison values.
The compared to section for list operators has two boxes.
The upper box is where you edit/add a list item. You use the same format for entering as you would enter a single value comparison of that same data type. After make an entry, press the Add button to add the current item to the list.
The list of added items displays in the list box below. You can edit or delete an existing list item by selecting it in the list. Pressing the Delete button immediately removes the item from the list. Pressing Edit moves the selected item to the upper box where you can make your changes and press Add to place the edited item in the list below.
A comparison list can contain up to 25 items.

Chapter 12: Creating Filters
R&R ReportWorks SQL User Manual Page 452
Connectors
You can use "and" and "or" to join conditions in the filter. Joining two or more conditions with "and" means that records must meet the criteria established by all conditions in order to be included in the report. Joining conditions with "or" means that records must meet the criteria for at least one of the conditions in order to be included.
When a filter consists of several conditions joined by the same connector, Report Designer evaluates the filter from left to right. For example, in the following filter, the first "or" is evaluated before the second "or": Include all records where (STATE is equal to "VA")
or where (STATE is equal to "MD") or where (STATE is equal to "DC")
When a filter consists of conditions joined by mixed connectors, Report Designer evaluates the "and" connectors before the "or" connectors, regardless of their order in the filter. For example, the following filter selects records of employees who are single (STATUS=S) and have dependents (DEPEND=Y), as well as records of all employees who are married (STATUS=M):
Include all records where (STATUS is equal to "M") or where (DEPEND is equal to "Y" and where (STATUS is equal to "S")
To change the order in which connectors are evaluated in a filter, you can use parentheses as described in the following section.

Chapter 12: Creating Filters
R&R ReportWorks SQL User Manual Page 453
Parentheses
You can use parentheses to indicate the order for evaluating connectors in a query. If you have more than two query rules and have selected at least one OR operator, you may need to add parentheses to make sure that you are getting the desired result.
For example, the following query consists of two selection rules telling Report Designer to select the records for all cities in California with a population greater than 5000.
Include all records where STATE is equal to "CA" AND POPULTN is greater than "5000"
Because the selection rules are joined by "and," Report Designer will retrieve records that satisfy the requirements of both rules. If these rules were joined by "or" instead, Report Designer would retrieve all records that satisfy either rule; that is, records in which the value of STATE is "CA" or the value of POPULTN is 5000 or higher.
If you are only using AND connectors, no matter how many query rules you might have the order in which they are evaluated does not matter since all conditions must be satisfied for a record to be selected.
However if you have more than two rules and have used both AND and OR operators, then you should add parentheses to make sure that you are getting the desired result.
Let’s return to the above example and says that we want to change our list so that we see cities in California with a population over 5000 or average income of over 100000. So we append a new rule:
Include all records where STATE is equal to "CA"
AND POPULTN is greater than 5000 OR AVGINC is greater than 100000 Without any extra parentheses, the connectors are evaluated in the order
that they are listed. So what we get California cities with a population of greater than 5000 and cities from ALL states having an average income of greater than 100000.
To get what we really want we need to add extra parentheses to group the second and third rules so that the OR happens before the AND. In the second rule we add a ( to the left parenthesis box and in the third rule we add a ) to the right parenthesis box.
Our query then becomes:
STATE is equal to "CA" and ( POPULTN is greater than 5000 Or AVGINC is greater than 100000 )
The connectors within parentheses are evaluated first, from the innermost level of parentheses outward, and from left to right within any set of parentheses. So first we find those records that have a population of greater than 5000 or average income of greater than 100000 and then AND that result so that the state must be California.
To place parentheses in a selection rule, place the edit cursor in the left or right parentheses edit box and type one or more parentheses.

Chapter 12: Creating Filters
R&R ReportWorks SQL User Manual Page 454
If you are using parentheses, you can enter them in any of your query rules. However the total number of left parentheses must match the total number of right parentheses or when you try to OK or Verify the query, you will get an "Unbalanced parentheses" error.
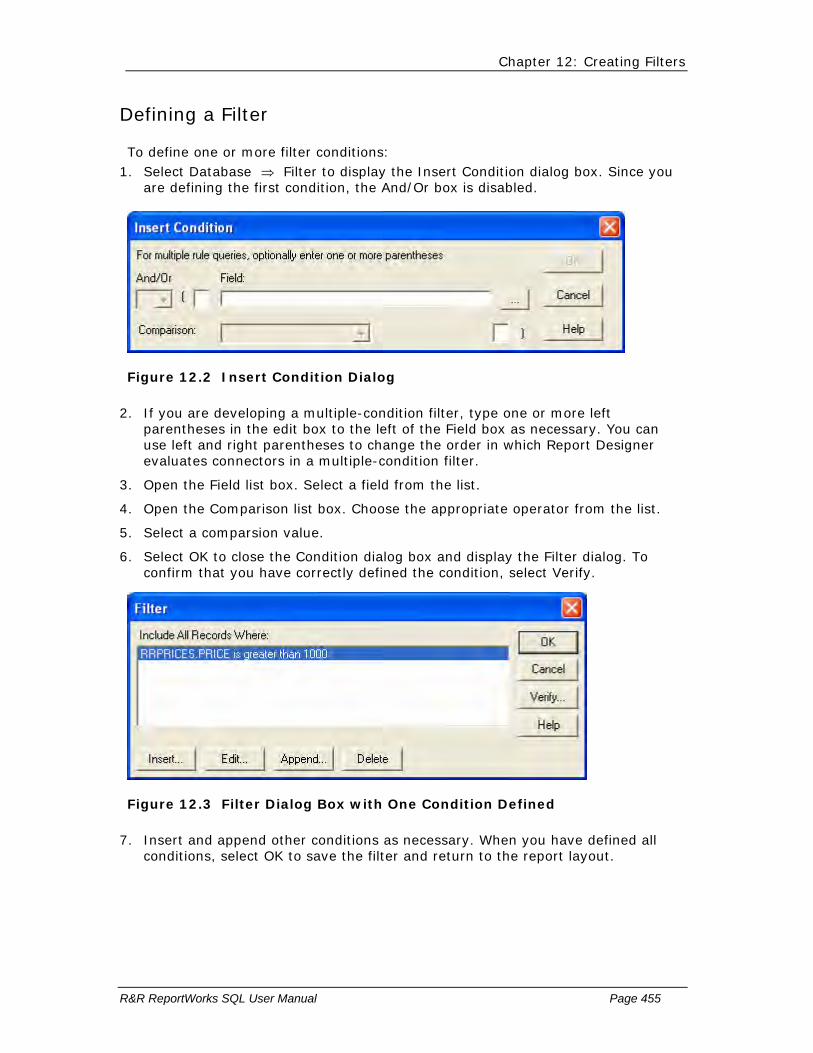
Chapter 12: Creating Filters
R&R ReportWorks SQL User Manual Page 455
Defining a Filter
To define one or more filter conditions: 1. Select Database ⇒ Filter to display the Insert Condition dialog box. Since you
are defining the first condition, the And/Or box is disabled.
Figure 12.2 Insert Condition Dialog
2. If you are developing a multiple-condition filter, type one or more left parentheses in the edit box to the left of the Field box as necessary. You can use left and right parentheses to change the order in which Report Designer evaluates connectors in a multiple-condition filter.
3. Open the Field list box. Select a field from the list.
4. Open the Comparison list box. Choose the appropriate operator from the list.
5. Select a comparsion value.
6. Select OK to close the Condition dialog box and display the Filter dialog. To confirm that you have correctly defined the condition, select Verify.
Figure 12.3 Filter Dialog Box with One Condition Defined
7. Insert and append other conditions as necessary. When you have defined all conditions, select OK to save the filter and return to the report layout.

Chapter 12: Creating Filters
R&R ReportWorks SQL User Manual Page 456
Editing a Filter
You edit filters by modifying existing conditions, adding new conditions, or deleting conditions. Figure 12.4 explains each of the Filter dialog buttons.
Use To
Insert Insert above the currently highlighted condition
Edit Modify the currently highlighted condition
Append Add a condition below existing conditions
Delete Delete the currently highlighted condition
Figure 12.4 Explanation of Filter Dialog Buttons
Chapter 12: Creating Filters
R&R ReportWorks SQL User Manual Page 457
Editing a Filter Condition
To edit a filter condition: 1. Select Database ⇒ Filter to display the Filter dialog box.
2. Highlight the condition you want to modify and select Edit to display the Edit Condition dialog box.
3. Modify the connector, parentheses, Field choice, Comparison operator, and/or Compared To value as necessary.
4. Select OK to complete the definition and return to the Filter dialog. If necessary, select Verify to confirm that you correctly defined the condition.

Chapter 12: Creating Filters
R&R ReportWorks SQL User Manual Page 458
Inserting a Filter Condition
To insert a filter condition: 1. Select Database ⇒ Filter to display the Filter dialog box.
2. Determine where you want to insert the new condition. Highlight the condition that you want to come after the new condition and select Insert to display the Insert Condition dialog.
3. Select or enter the connector, parentheses, Field choice, Comparison operator, and/or Compared To value as necessary.
4. Select OK to complete the definition and return to the Filter dialog. If necessary, select Verify to confirm that you correctly defined the condition.
NOTE: When you insert a condition as the first one in a multiple-condition filter, the condition that was originally first on the list is placed second and is given a default connector of "and." If necessary, you can edit the second condition and select "or" as the connector.

Chapter 12: Creating Filters
R&R ReportWorks SQL User Manual Page 459
Appending a Filter Condition
To add a condition at the end of an existing filter: 1. Select Database ⇒ Filter to display the Filter dialog box.
2. Select Append to display the Append Condition dialog.
3. Enter or select the connector, parentheses, Field choice, Comparison operator, and/or Compared To value as necessary.
4. Select OK to complete the definition and return to the Filter dialog. If necessary, select Verify to confirm that you correctly defined the condition.
Chapter 12: Creating Filters
R&R ReportWorks SQL User Manual Page 460
Deleting a Filter Condition
To delete a filter condition: 1. Select Database ⇒ Filter to display the Filter dialog box.
2. Highlight the condition you want to delete and select Delete. If you delete a condition by mistake, you can select Cancel to undo the deletion.

Chapter 12: Creating Filters
R&R ReportWorks SQL User Manual Page 461
Filter Techniques
In addition to selecting records that match specified database field values, Report Designer filters can select records that match character or date patterns, total field values, and calculated field values. The following sections explain these filter techniques.

Chapter 12: Creating Filters
R&R ReportWorks SQL User Manual Page 462
Pattern-Matching with Wildcard Characters
A pattern-matching filter selects all records where the value in the selected character or date field matches (or doesn’t match) a pattern you enter. You specify a pattern using special characters called wildcard characters.
For example, to select all records where the value in the CITY field starts with the letter H, you can create the following filter:
The asterisk (*) in this filter is a wildcard character that stands for any group of characters, like the asterisk in the DOS command DIR H*.DBF.
Figure 12.5 lists the wildcard characters used to define patterns in filters.
Character Meaning
_ or ? In a character or memo filter, matches any single character in the same position in the field.
% or * In a character or memo filter, matches any group of characters (including no characters).
Figure 12.5 Wildcard Characters
Note that wildcards cannot be used with numeric or logical fields.
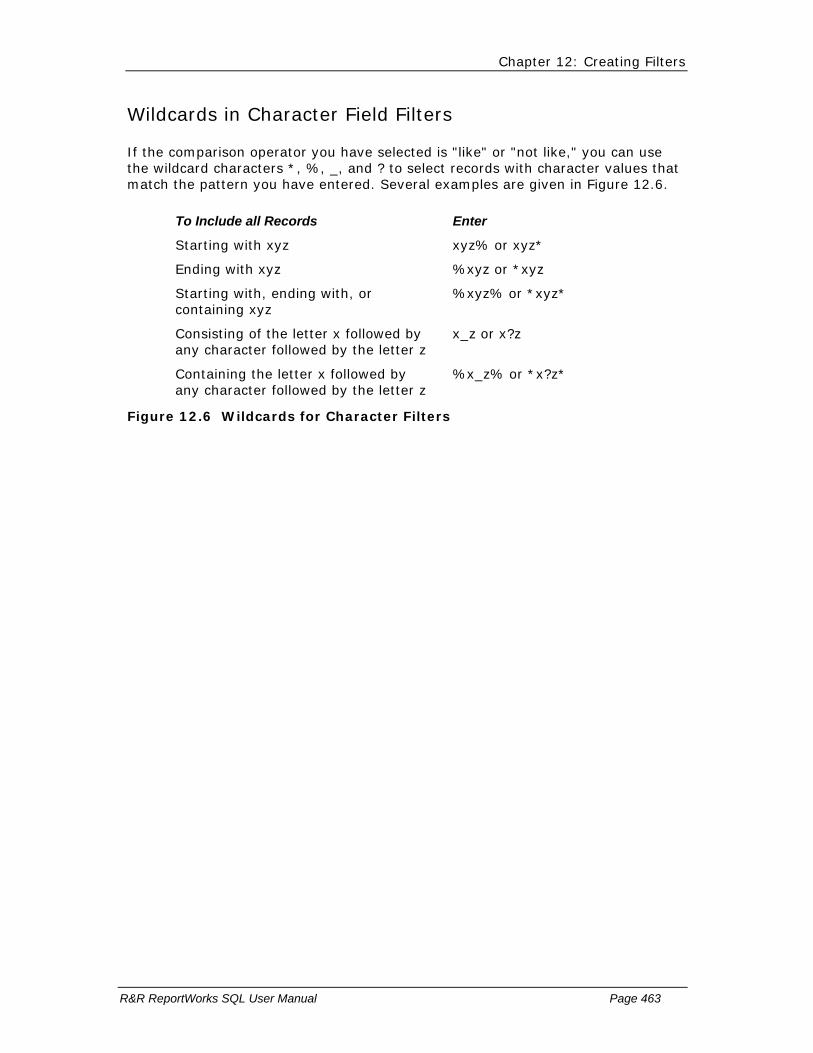
Chapter 12: Creating Filters
R&R ReportWorks SQL User Manual Page 463
Wildcards in Character Field Filters
If the comparison operator you have selected is "like" or "not like," you can use the wildcard characters *, %, _, and ? to select records with character values that match the pattern you have entered. Several examples are given in Figure 12.6.
To Include all Records Enter
Starting with xyz xyz% or xyz*
Ending with xyz %xyz or *xyz
Starting with, ending with, or containing xyz
%xyz% or *xyz*
Consisting of the letter x followed by any character followed by the letter z
x_z or x?z
Containing the letter x followed by any character followed by the letter z
%x_z% or *x?z*
Figure 12.6 Wildcards for Character Filters
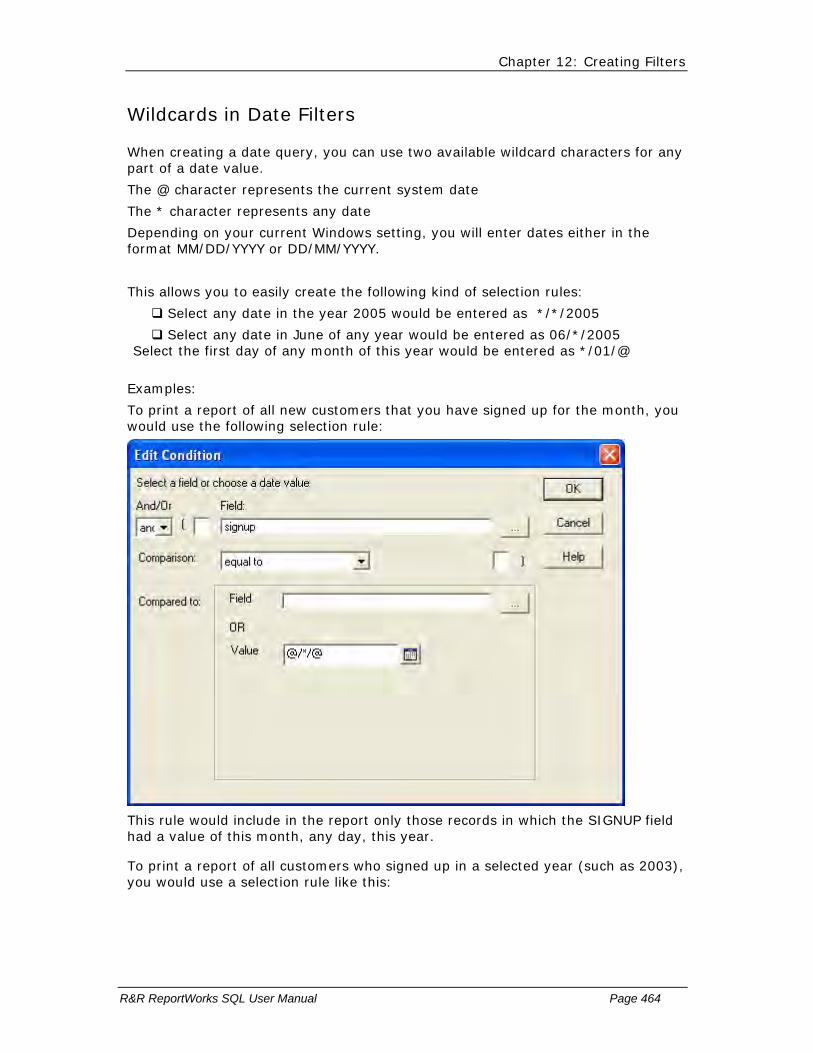
Chapter 12: Creating Filters
R&R ReportWorks SQL User Manual Page 464
Wildcards in Date Filters
When creating a date query, you can use two available wildcard characters for any part of a date value.
The @ character represents the current system date
The * character represents any date
Depending on your current Windows setting, you will enter dates either in the format MM/DD/YYYY or DD/MM/YYYY.
This allows you to easily create the following kind of selection rules:
Select any date in the year 2005 would be entered as */*/2005
Select any date in June of any year would be entered as 06/*/2005 Select the first day of any month of this year would be entered as */01/@
Examples:
To print a report of all new customers that you have signed up for the month, you would use the following selection rule:
This rule would include in the report only those records in which the SIGNUP field had a value of this month, any day, this year.
To print a report of all customers who signed up in a selected year (such as 2003), you would use a selection rule like this:
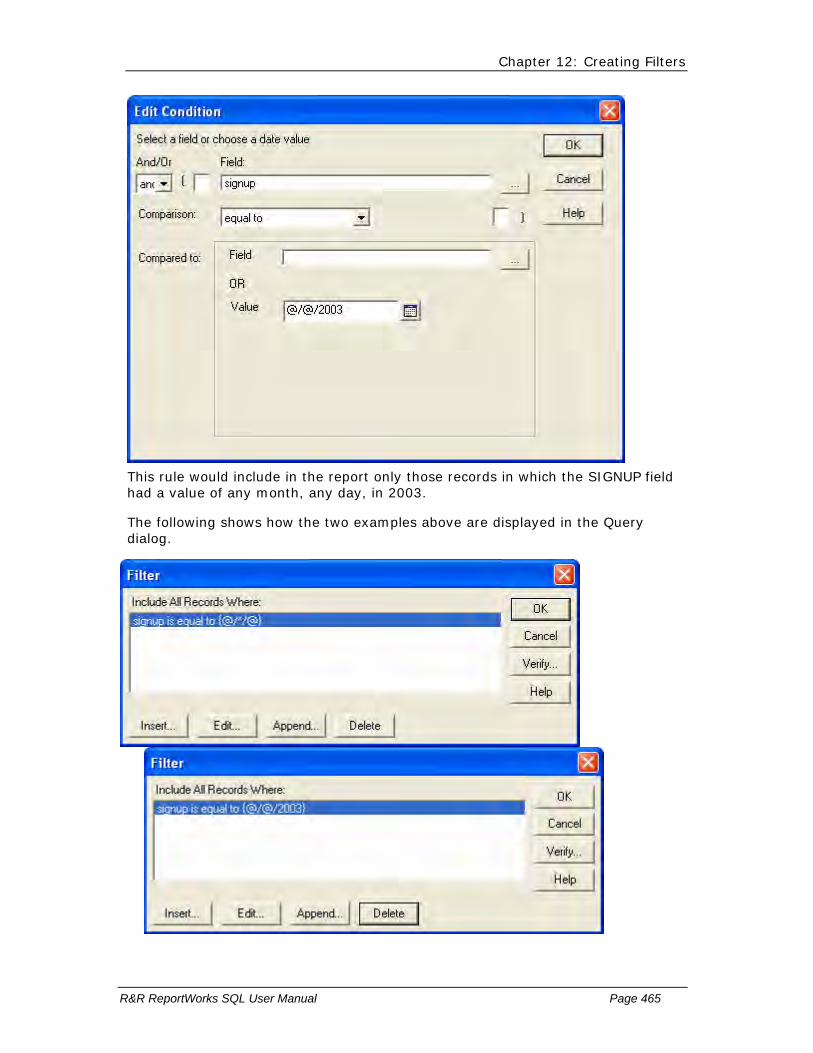
Chapter 12: Creating Filters
R&R ReportWorks SQL User Manual Page 465
This rule would include in the report only those records in which the SIGNUP field had a value of any month, any day, in 2003.
The following shows how the two examples above are displayed in the Query dialog.

Chapter 12: Creating Filters
R&R ReportWorks SQL User Manual Page 466
Wildcards in Memo Field Filters
Report Designer also allows you to use % and * wildcard characters with "like" and "not like" to search for and select records based on text in a memo field. However, the % or * character must be the first or last character of the comparison value.
For example, to include records that contain text starting with the word "Software" in the PROD_NOTES memo field, enter the condition:
Note that memo field filters are based only on the text of the memo field itself, not on any values contained in data fields embedded within the memo.

Chapter 12: Creating Filters
R&R ReportWorks SQL User Manual Page 467
Filtering for Values Containing Special Characters
In some instances you might want to filter for values that contain one of the four wildcard characters or that consist only of spaces or of the NULL value. Procedures for defining such filter conditions are explained in the following sections.
Filtering for Strings Containing Wildcard Characters
Depending on the database software you are using, you may be able to filter for character strings that contain any of the four wildcard characters (_, ?, %, or *).
Filtering for Values Containing Only Spaces
To include or exclude records containing only spaces in a given character field, select "equal to" or "not equal to" as the comparison operator and simply enter one or more spaces in the "Compared To" box (see your database software documentation to determine whether the number of spaces is significant).
Filtering for Values Containing NULL
To include or exclude records containing the NULL value in a given field, select "is null" or "is not null" as the comparison operator.

Chapter 12: Creating Filters
R&R ReportWorks SQL User Manual Page 468
Filtering on Total Values
Report Designer allows you to select records based on certain total field values. The types of total filters allowed depend on whether your report includes totals designated as pre-processed (see Chapter 8, "Working with Total Fields," for information about creating pre-processed totals).
� For reports that have no pre-processed totals defined, you are limited to filtering on Sum or Count total fields that have a reset level of Grand.
� For reports with one or more pre-processed totals, you can filter only on pre-processed totals that reset on the highest (most inclusive) group field for which a pre-processed total has been defined.
Chapter 12: Creating Filters
R&R ReportWorks SQL User Manual Page 469
Running and Pre-Processed Totals
Any total field you create is by default a running total; Report Designer calculates its value cumulatively as it reads each record that contributes to the total. You can create filters using running Counts and Sums with a "Grand" reset level, but these filters may be difficult to formulate since only records that meet the filter conditions contribute to the total. Filters on pre-processed total fields — fields whose final values are calculated before the report records are printed — are much easier to formulate, since all records that contribute to the total will have been read before the filter is applied.
Filters on Running Totals
In reports that contain no pre-processed totals, you can filter on Grand running Sums and Counts. However, since Report Designer tests the current record against the filter before computing the total for that record, the filter will be applied based on the total value as of the previous record. In other words, since the total for the current composite record will not have been calculated before the filter is applied, Report Designer’s decision as to whether to include the record will be based on the total value as of the previous composite record.
For example, when you filter on a running Count total field, the count for the current composite record will not have been calculated before the filter is applied. In order to use the filter to select the first N records, you must specify that the Count field value be less than N rather than less than or equal to N.
To select the first three records using the COUNTER total field, which counts the NAME field, specify the following filter condition: (COUNTER is less than 3)
Without the filter, the report would include the following contributors, sorted by contribution in descending order:
NAME CONTRIBUTION
Warren 150
Clark 125
Mortimer 120
Smith 100
Jones 50
With the filter, the records selected for the report would be:
NAME CONTRIBUTION COUNTER
Warren 150 1
Clark 125 2
Mortimer 120 3 (value of COUNTER field for this record not calculated until after filter is applied)

Chapter 12: Creating Filters
R&R ReportWorks SQL User Manual Page 470
For example, in an invoice report in which each invoice total is a pre-processed, order number group total, you could create a filter that pulls out only those invoice records with totals of $500 or more. In an order list grouped by customer number and containing a pre-processed, customer number group total, you could create a filter that pulls out only those customer records with 10 or more orders. Because of the way in which Report Designer accumulates pre-processed totals, none of the running totals in these reports would be available for filtering. In addition, the filters on the pre-processed order and customer totals would be invalid if either report contained higher level pre-processed totals. An error message notifies you of invalid filters when you try to display or print such a report.
Chapter 12: Creating Filters
R&R ReportWorks SQL User Manual Page 471
Filtering on Calculated Fields
You can select records based on calculated field values except those that:
� Use the PAGENO( ), LASTPAGE( ), REPORTPAGE( ), RECNO( ), or QUERY( ) function
� Use totals that cannot be filtered on (see the section entitled Filtering on Total Values earlier in this chapter)

Chapter 12: Creating Filters
R&R ReportWorks SQL User Manual Page 472
Comparing a Field to an Expression
You can compare a field to an expression by using a calculated or ParameteRR field in a filter. For example, to define a filter that selects all records where the value in the Amount field equals the value of the expression Discount * Rate, create a calculated field named DiscRate whose expression is Discount * Rate. Then select DiscRate( ) as the compared to field value in the filter.

Chapter 13 Creating Charts
Introduction (Creating Charts)
This chapter explains how to create charts that present report data graphically and incorporate them into your reports.
You can choose from a variety of chart types to embed in your reports, including 2-dimensional or 3-dimensional bar, pie, line, and area graphs. You can control all aspects of the embedded chart, such as size, position, text elements, and color.
Information about creating charts is presented in the following sections:
Creating an Embedded Chart
Understanding the Charting Tabbed Dialogs
Modifying a Chart
Sample Charting Scenarios
Special Considerations for Charting
Chapter 13: Creating Charts
R&R ReportWorks SQL User Manual Page 474
Creating an Embedded Chart
You create an embedded chart for a report by specifying a combination of settings from the dialogs (referred as either tabs or property pages) on the charting property sheet. Although the order in which you access the dialog tabs will vary depending on the report and the chart you are creating, in the following procedures the tabs are accessed in the order in which they appear on the charting property sheet.
The following sections explain how to create and embed a chart in the Summary Columnar Report, one of the sample reports that is installed with Report Designer. The resulting chart will show sales by customer, and further broken down by product type, and will appear in each Company footer of the report. The techniques explained here for adding a chart to this sample report can easily be adapted for creating and embedding a chart in any report.

Chapter 13: Creating Charts
R&R ReportWorks SQL User Manual Page 475
Inserting the Chart
In most cases, you will want to insert a chart into a Freeform band line that is large enough to accommodate the entire chart. If necessary you can estimate the area to be occupied by the chart and adjust the band height later.
To insert a chart into the Summary Columnar Report, do the following: 1. Start Report Designer and open the Summary Columnar Report in the Samples
folder.
2. Right-click on the third Company group footer line (the line containing the 1GH-COMPANY label). Select Properties from the menu to display the Band Line Properties dialog.
3. In the Height group box, select Freeform; then enter or select a setting of 5 inches. Select OK.
4. Select Insert ⇒ Create Band Line. In the Line Placement group box, select Below Current Line; then check the New Page Line checkbox. As a result, the data for each company will begin on a new page.
5. Select Insert ⇒ Chart (or select the Chart button on the Standard Toolbar). The cursor changes to a combination of crosshair and a rectangle. Click and drag the chart cursor in the Freeform line of the Company band until the insertion rectangle is approximately 5 inches high and 7 inches wide; then release the mouse.
When you release the mouse, the Chart property sheet appears. The Chart property sheet consists of several tabs; when it first appears, the Type tab is active. In the following sections, you will select a chart type and style; specify the data to be charted; add titles and labels; and specify size, font, and other chart characteristics.

Chapter 13: Creating Charts
R&R ReportWorks SQL User Manual Page 476
Selecting a Chart Type and Style
You can select from one of four chart types, and for each of those types you can specify additional characteristics. You use the Type and Style tabs of the Chart property page to choose the chart elements.
The chart for the Summary Columnar Report will use the default Type of "Bar" and the default Style of "Simple." For charts that you will be developing for your own reports, you can select any one of the four chart types and, depending on the type you select, further modify the appearance and orientation of the selected chart type.
For detailed information about each chart type and the styles that can be applied, see the Understanding the Charting Tabbed Dialogs section in this chapter.

Chapter 13: Creating Charts
R&R ReportWorks SQL User Manual Page 477
Specifying the Data To Be Charted
To select the report data to be included in the chart, first click the Data tab to make it active. Then do the following:
1. In the Fields list box, double-click the "cumul_tot" field to add it to the Selected Fields list box. This field contains totals sales figures for each customer.
2. In the Label Field box, select "COMPANY" (under RRCUST); note that this field name is also inserted automatically as the Sort Field value.
3. The settings in the Sub-category group box enable you to provide a further breakdown of data for each customer. To do so, begin by selecting "order_tot" (under RRITEMS) in the Value box; this field calculates the total amount of each item purchased by a given customer.
4. In the Label Field box (also in the Sub-category group box), select "DESCRIPTN" (under RRPRICES); note that this value is automatically inserted into the Sort box.
5. Click the Combine Dups box to turn this option on; as a result, if a given item (as identified by the "DESCRIPTN" value) appears in more than one order for a single customer, totals for that item will be combined into a single value for that customer.

Chapter 13: Creating Charts
R&R ReportWorks SQL User Manual Page 478
Adding Titles and Labels
The Text tab enables you to add titles, legends, and labels to a chart. Follow these steps to add text elements to the chart for the Summary Columnar Report:
1. In the Chart Title box, type "Customer Sales by Item."
2. In the Category edit box of the Axis Titles group, type "Company"; this will appear as the X-axis label.
3. In the Value edit box, type "Sales in Dollars"; this will appear as the Y-axis label
The default font for text elements is Arial. To select a different font, use the Font tab, as explained in the Specifying Size, Font, and Other Options section.

Chapter 13: Creating Charts
R&R ReportWorks SQL User Manual Page 479
Specifying Size, Font, and Other Options
You use the Options tab to control chart size and anchoring; you use the Font tab to specify a font to be applied to all text elements and to select a color palette for the chart.
To specify or change the chart dimensions, click the Options tab and enter or select Width and Height values. Use the Anchor setting to specify where the chart will be "anchored" in the report: This setting establishes either the top or bottom edge of the chart as the starting position of the chart on the layout (see the Chart Anchoring section for more information).
Use the Font tab to select a font to be applied to all text elements in the chart. The range of available fonts will vary depending on your system configuration and the currently selected printer. You can also use the Font tab to specify a color palette to be used for the chart. See the Font Property Page section for details about the available palettes.

Chapter 13: Creating Charts
R&R ReportWorks SQL User Manual Page 480
Previewing the Completed Report
To preview the placement and appearance of the chart you embedded, select File ⇒ Print Preview (or click the Preview button).
Figure 13.1 shows a zoomed preview of a page from the report.
Figure 13.1 Zoomed Preview of Embedded Chart
Chapter 13: Creating Charts
R&R ReportWorks SQL User Manual Page 481
Modifying an Existing Embedded Chart
To modify an embedded chart, first display the Chart property sheet in either of the following ways:
• Click the chart to select it and choose Format ⇒ Properties;
• Right-click the chart and select Properties.
Using the various tabs of the Chart property sheet, you can change the characteristics of the chart as necessary.
To re-position a chart on the layout, first click to select the chart; then click and drag the chart to the new location. To re-size a chart directly on the layout, first click to select the chart; then click and drag one of the handles that display around the perimeter of the chart.

Chapter 13: Creating Charts
R&R ReportWorks SQL User Manual Page 482
Understanding the Charting Tabbed Dialogs
The following sections explain the settings available on each of the Charting tabbed dialogs (also referred to as property sheets).

Chapter 13: Creating Charts
R&R ReportWorks SQL User Manual Page 483
Using the Type Tab
Use the Type tab to specify the kind of chart you want, whether the chart will be 2-dimensional or 3-dimensional, and whether the chart will include vertical and/or horizontal grid lines. Figure 13.2 describes each of the chart types.
Chart Type
Description
Bar Presents data as a series of bars whose heights are proportional to the values being charted.
Pie Presents each value as wedge that represents the value’s percentage of the overall total. (Note that pie charts are not suitable for representing negative values.)
Line Presents values as a series of points connected by lines, with a separate line for each field value being charted. Line charts are suitable only for charts that will contain at least two data points.
Area Presents values in a manner similar to that of the Line chart, except that the region between the line and the horizontal axis is filled with the same color as the line. (Area charts are not suitable for representing negative values, and should be used only for charts that will contain at least two data points.)
Figure 13.2 Description of Chart Types
By default, each chart type has a flat or two-dimensional appearance. As illustrated in Figure 13.3, you can specify that the chart elements should have a three-dimensional appearance by clicking the 3D box. In addition, you can add horizontal and/or vertical grid lines to the selected chart by clicking the Vertical and/or Horizontal box.

Chapter 13: Creating Charts
R&R ReportWorks SQL User Manual Page 484
Figure 13.3 Chart Type Tab
Chapter 13: Creating Charts
R&R ReportWorks SQL User Manual Page 485
Using the Style Tab
For bar and area charts, you can specify additional characteristics using the Style tab (the Style settings do not apply to line or pie charts). The options available on the Style tab depend on the chart type selected.

Chapter 13: Creating Charts
R&R ReportWorks SQL User Manual Page 486
Style Options for Bar Charts
The following style options are available for bar charts:
• Simple
• Stacked
• Stacked Percentage
• Stacked Floating
Use "Simple" if the chart you are creating will have only one value for each data point; select one of the other styles only if the chart you are creating will contain multiple values for each data point.
Figure 13.4 explains each of these style options.
Style Option Explanation
Simple Represents the multiple values as separate, side-by-side bars.
Stacked Represents the multiple values as a single bar with a separate segment for each value.
Stacked Percentage
A kind of stacked chart in which all bars are the same height, with each segment representing the percentage contribution of that value to the whole.
Stacked Floating A kind of stacked chart in which the first segment is invisible and thereby serves as an offset from the axis at which the second segment begins. (This style is appropriate only when all values will include the same set of bar segments.)
Figure 13.4 Style Options for Bar Charts
Additional style settings in the Orientation box (Horizontal and Vertical) enable you to specify whether the bars of the chart extend upward from the horizontal axis or rightward from the vertical axis.

Chapter 13: Creating Charts
R&R ReportWorks SQL User Manual Page 487
Style Options for Area Charts
The following style options are available for area charts:
• Absolute
• Stacked
• Stacked Percentage
You should select from these styles only if the chart you are creating will contain multiple values for each data point.
Figure 13.5 explains each of these style options.
Style Option Explanation
Absolute Represents each series of values as distances from the horizontal axis; portions of some of the resulting filled areas will be obscured behind other filled areas.
Stacked Represents each series of values as distances above the values from the previous series, giving the appearance of areas stacked on top of each other.
Stacked Percentage
A kind of stacked chart in which the line defining the top area is a horizontal line at 100 percent, and the other areas are scaled appropriately to indicate what percentage of the whole they represent.
Figure 13.5 Style Options for Bar Charts
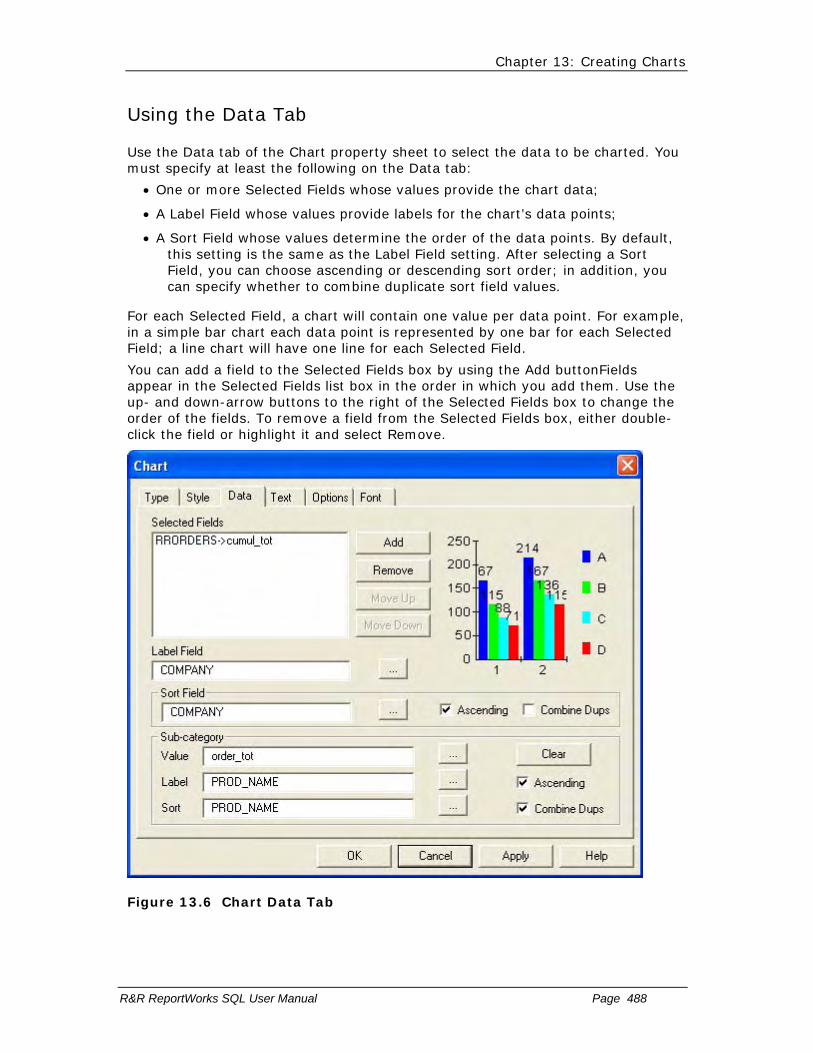
Chapter 13: Creating Charts
R&R ReportWorks SQL User Manual Page 488
Using the Data Tab
Use the Data tab of the Chart property sheet to select the data to be charted. You must specify at least the following on the Data tab:
• One or more Selected Fields whose values provide the chart data;
• A Label Field whose values provide labels for the chart’s data points;
• A Sort Field whose values determine the order of the data points. By default, this setting is the same as the Label Field setting. After selecting a Sort Field, you can choose ascending or descending sort order; in addition, you can specify whether to combine duplicate sort field values.
For each Selected Field, a chart will contain one value per data point. For example, in a simple bar chart each data point is represented by one bar for each Selected Field; a line chart will have one line for each Selected Field.
You can add a field to the Selected Fields box by using the Add buttonFields appear in the Selected Fields list box in the order in which you add them. Use the up- and down-arrow buttons to the right of the Selected Fields box to change the order of the fields. To remove a field from the Selected Fields box, either double-click the field or highlight it and select Remove.
Figure 13.6 Chart Data Tab

Chapter 13: Creating Charts
R&R ReportWorks SQL User Manual Page 489
In addition to the three required items, if you have added only one field to the Selected Field box, you can also specify three fields that describe a Sub-category (see Figure 13.6). The Value Field in the Sub-category box replaces the Selected Field as the source of data. When you specify a Sub-category, you are essentially informing the charting software that the single Selected Field can be thought of as being composed of a series of values of the Sub-category Value Field. In this case, the Selected Field’s values are not actually used at all in preparing the chart, though the Sort and Label Field values associated with the Selected Field are used. A given chart can contain more than one Selected Field or a Sub-category but not both, since the Sub-category Value Field replaces the Selected Field as the source of data. See the Sample Charting Scenarios section for an example that uses the Sub-category concept.
See the Special Considerations for Charting section for more information about re-ordering the Selected Fields.

Chapter 13: Creating Charts
R&R ReportWorks SQL User Manual Page 490
Using the Text, Options, and Font Tabs
The Text tab enables you to add titles, legends, and labels to a chart. The Options tab includes settings for chart size, anchoring, and value range. On the Font tab, you can specify a base font to be used by all text elements of the chart and a color palette that will determine the chart’s colors.
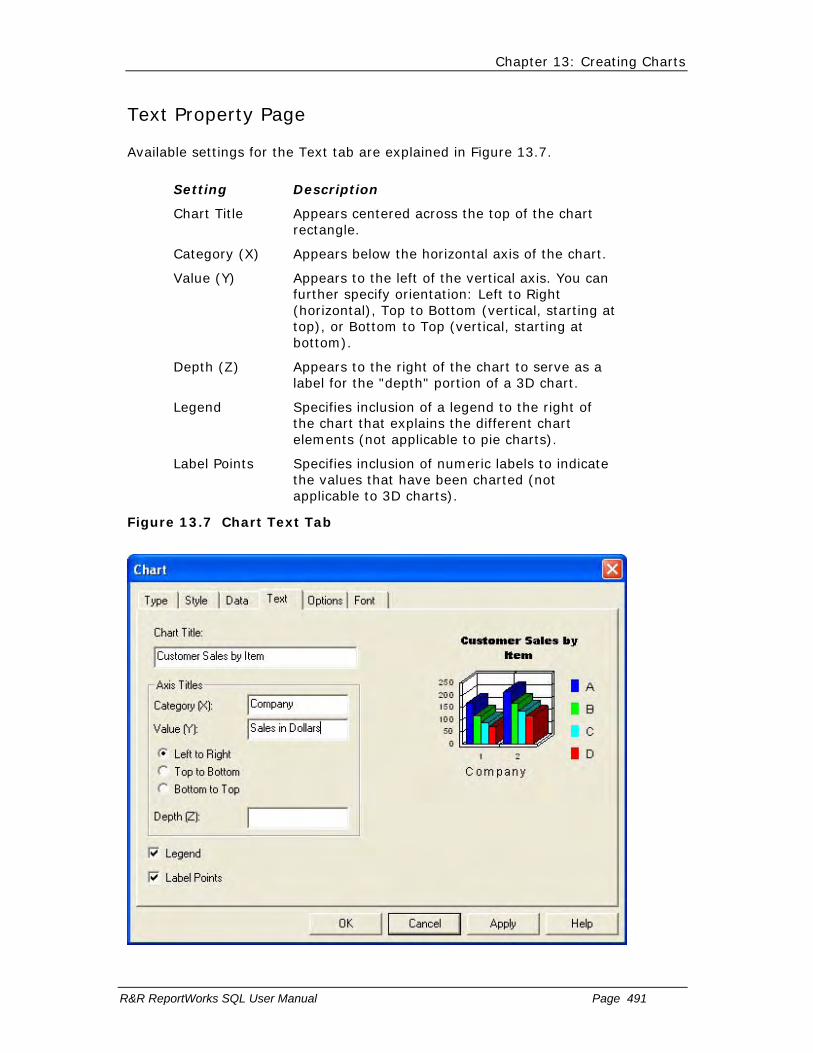
Chapter 13: Creating Charts
R&R ReportWorks SQL User Manual Page 491
Text Property Page
Available settings for the Text tab are explained in Figure 13.7.
Setting Description
Chart Title Appears centered across the top of the chart rectangle.
Category (X) Appears below the horizontal axis of the chart.
Value (Y) Appears to the left of the vertical axis. You can further specify orientation: Left to Right (horizontal), Top to Bottom (vertical, starting at top), or Bottom to Top (vertical, starting at bottom).
Depth (Z) Appears to the right of the chart to serve as a label for the "depth" portion of a 3D chart.
Legend Specifies inclusion of a legend to the right of the chart that explains the different chart elements (not applicable to pie charts).
Label Points Specifies inclusion of numeric labels to indicate the values that have been charted (not applicable to 3D charts).
Figure 13.7 Chart Text Tab

Chapter 13: Creating Charts
R&R ReportWorks SQL User Manual Page 492
Options Property Page
On the Options property page (see Figure 13.9), you can specify:
• A precise Chart Size in inches.
• Whether to Anchor the chart by its top or bottom edge. This setting is relevant only when the chart is not confined to a single band line. See the Special Considerations for Charting section for further discussion of this option.
• A Value Range to use for all instances of a given chart. You can specify either that you want each chart’s value axis to have its own value range (Automatic) suited to the values it contains, or that you want a single value range for all charts. If you want a single value range for all charts, you can specify either that Report Designer should compute a range suitable for all the values present in all instances of the chart in the entire report (Normalize) or that a range of values that you specify should be used instead (User Defined). By default, the value range is Automatic and always includes the value zero. With this default setting, for example, if you are charting a range of values between 1001 and 1009, they will all appear about the same, unless you specify a value range of, for example, 1000 to 1010.
Figure 13.9 Chart Options Tab
Chapter 13: Creating Charts
R&R ReportWorks SQL User Manual Page 493
Font Property Page
On the Font property page, you can specify:
• A Base Font name to use for all text items on the chart.
• A color Palette from which to select colors for use on the chart. The available palettes are:
16-Color, which contains the standard Windows colors
Shades of Gray
Pastels, which contains "washed out" shades of the primary colors
Shades of RGBCMY, which contains various intensities of the primary colors
Rainbow, which contains various shades of a spectrum of colors
Shades of Red
Shades of Green
Shades of Blue
Shades of Cyan
Shades of Magenta
Shades of Yellow
The monochromatic palettes can be used to create "tasteful" charts, but the various shades can be difficult to distinguish from each other in certain types and styles of charts.
Chapter 13: Creating Charts
R&R ReportWorks SQL User Manual Page 494
Sample Charting Scenarios
In this section, we will discuss some sample charting scenarios and describe how to specify the chart, concentrating on the Data property page.

Chapter 13: Creating Charts
R&R ReportWorks SQL User Manual Page 495
Chart of Customer Totals in Summary Band
Suppose you have a report of items purchased, sorted and grouped by invoice number within customer. You have defined "OrdSum," which is a sum of item prices resetting on a change in order number (OrdNum) and which therefore represents the total dollar amount for a given order; and "CustSum," which is a sum of item prices resetting on a change in customer ID (CustID) and which therefore represents the total dollar amount for a given customer.
Insert a chart in the summary band. On the Data page, specify "CustSum" as the Selected Field, "CustSum" as the Sort Field, and "Company" as the Label Field. Do not check the Combine Dups check-box. Do not check the Ascending check-box. If you specify Simple Bar chart as the Type and Style, you will have a chart in the summary band that shows one bar per customer using the values of the CustSum field to determine the bar heights. The bars will be presented in decreasing order of total sales per customer.
If on the Data page, you also specify a Sub-category with a Value field of "OrdSum," a Label Field of "OrdNum," and a Sort Field of "OrdNum," and you change the chart Style to Stacked Bar, the summary will contain a chart with a single bar per customer where each bar is broken into segments representing order totals.

Chapter 13: Creating Charts
R&R ReportWorks SQL User Manual Page 496
Chart of Sales Attributable to Product Line
In the same report as described in the Chart of Customer Totals in Summary Band section, suppose you want a chart in each customer footer showing what percentage of sales for that customer are attributable to each of various product lines. Assume that each item record includes a product-line field (ProdLine) and that each item is in one of six product lines. On the Data page, specify "CustSum" as the Selected Field and "Company" as the Label and Sort Fields. Specify "Price" as the Sub-category Value Field, "ProdLine" as both the Sub-category Label and Sort Fields, and check the Combine Dups check-box. These settings ensure that each product line will have a single pie wedge representing the sum of all contributions of that product line, independent of invoice number. Specify Pie chart on the Type page. In each customer footer, you will see a pie chart depicting the percentage of sales to that customer due to items in each product line.

Chapter 13: Creating Charts
R&R ReportWorks SQL User Manual Page 497
Special Considerations for Charting
In our attempt to provide a maximum of flexibility in our charting support, we have given you control over some aspects of your charts that may puzzle you if you specify "odd" settings. This section describes some of the "tricky" areas and how to think about them.

Chapter 13: Creating Charts
R&R ReportWorks SQL User Manual Page 498
Sort Field & Label Field
Generally speaking, you will want to specify the same field as both the Sort Field and the Label Field. However, you may have occasion to make these two fields distinct. For example, suppose you want to label the bars in a bar chart with the names from a last-name field. However, to ensure that values representing different individuals are separately depicted in the chart, you may want to sort by social-security number or other unique identifier.
Chapter 13: Creating Charts
R&R ReportWorks SQL User Manual Page 499
Combine Dups
When Report Designer collects data for a chart, it stores the values of the Selected Fields, as well as the values of the Label and Sort Fields. Each remembered "value set" actually consists of these three values. The remembered Sort Field values are used to order the data for presentation in the chart. Sometimes multiple value sets will have identical Sort Field values. The Combine Dups setting determines whether such duplicate Sort Field values should be treated as distinct (Combine Dups not checked) or should be combined (Combine Dups checked). When the values of a field that is a sum, a count, or a non-total are combined, the values are simply added together and the number of separate data points decreases accordingly. For total types other than sums or counts, appropriate calculations are done in combining the values.
As a rule of thumb, you will probably want to check the Combine Dups box if the values being charted are two or more levels deeper than the band line in which the chart is anchored, or if the Sub-category Value Field has a group level two or more levels deeper than the Selected Field’s group level.
One way to think of the meaning of checking the Combine Dups check-box is as a request for an implicit total of all values for which the Sort field has the same value. If the data you are charting is such that you would not have duplicate values of the Sort field, the setting doesn’t matter, but if you do expect duplicates, you should (or should not) check the Combine Dups box depending on whether you want each value set having duplicate Sort field values to be treated as part of an implicit total or as a separate value set. Some examples that illustrate the decision process follow.
Here is an example where you would want to check the Combine Dups check-box. Suppose you have a report with group levels of Customer and Order. If you are making a chart of Customer spending patterns by Item, you will expect to have multiple Orders for some Customers in which the same Item was ordered. You would want to combine duplicate values in this case because you want a single value for each Item and Customer, not for each Item and Order. Note that the Item level is at the level of the record band and is two levels down from the Customer level, which is where the chart is located.
Here is an example where you would probably not want to check the Combine Dups check-box: Suppose you have a table that includes electoral votes by state, and you want a chart in the summary band showing the number of electoral votes by state in increasing order of number of votes. There are many states having the same number of electoral votes. If you combine duplicates, there will be fewer bars than states, and the bars representing combined values will depict the total number of electoral votes among all states having that same number of votes. If you were also to label the bars with the number of electoral votes, you might see a bar labeled "9" with a height of 27 because there are three states that have nine electoral votes each. If you were to label the bars with the state name instead, the label would be the name of whichever state happened to come first after the sorting of states by number of electoral votes.

Chapter 13: Creating Charts
R&R ReportWorks SQL User Manual Page 500
Chart Anchoring
The anchor setting specifies whether the top or bottom edge of the chart rectangle should determine the "official" position of the chart on the layout. When a chart is not confined to a single band line, the anchor setting determines whether it "grows up" into areas of the report above the line containing the bottom of the chart rectangle, or "grows down" into areas below the line containing the top of the chart rectangle. You might use this feature by having a group footer consisting of multiple band lines, where the footer text and data are displayed along the left side of the layout and the chart is displayed across the entire footer on the right side of the layout.

Chapter 13: Creating Charts
R&R ReportWorks SQL User Manual Page 501
Significance of the Order of Selected Fields
The order in which the fields appear in the Selected Fields list-box has special significance for certain chart types. In a Simple Bar chart, the first field will appear leftmost among the bars for each data point. In a Stacked Bar chart, the first field will appear on the bottom of the stack of bars for each data point in a Stacked Bar chart. In an area chart, the first field’s area will be drawn first, and as a result will be overlaid by the subsequent fields. If your were plotting a sum, a minimum, a maximum, and an average for each data point, it would make sense to list the fields in the order sum, maximum, average, minimum, so that the tallest area appears farthest back. In a 3D area chart, the 3D area for the first value is also depicted farthest back in the perspective view. Similarly, in a 3D line chart, the "ribbon" representing the first line is depicted farthest back.

Chapter 13: Creating Charts
R&R ReportWorks SQL User Manual Page 502
Group Levels and Charting
A chart of a given Selected Field can vary dramatically depending upon the band line the chart is in. For example, suppose you have a report that includes order, customer, and state group fields. Further suppose that the report includes an order-level total field (OrdTot). If you chart OrdTot as a bar chart in the order-level group footer, each chart will consist of a single bar representing the value of OrdTot for that order. If you move (or copy) the same chart to the customer footer, it will contain a bar for each order from that customer. If you move the same chart to the state footer, it will contain a bar for each order from each customer from that state.
Chapter 14 Adding Lines, Boxes, and Shading
Introduction (Adding Lines, Boxes, Shading)
This chapter explains how to draw lines and boxes for inclusion in reports and how to add various levels of shading to report areas. This explanation is presented in the following sections:
Drawing and Manipulating Lines
Drawing and Manipulating Boxes
Adding Shading
Extending Lines and Boxes Across Bands
Special Considerations
After drawing a line or box, you use the Line Properties or Box Properties dialog to modify the object. You can display the Line or Box Properties dialog in any one of the following ways:
Right-click on the object (for a box, right-click on the box border)and select Properties;
Select the object and press F9;
Select the object and select Format ⇒ Properties.

Chapter 14: Adding Lines, Boxes and Shading
R&R ReportWorks SQL User Manual Page 504
Drawing and Manipulating Lines
Using the Insert ⇒ Line command or the Line button on the Standard Toolbar, you can draw horizontal or vertical lines. After drawing a line, you can move it, cut and paste it, or re-size it as necessary. In addition, you can select one of 5 line thicknesses, 5 different line styles, and assign one of 16 colors to the line.
The following sections explain how to draw and manipulate lines on the report layout.

Chapter 14: Adding Lines, Boxes and Shading
R&R ReportWorks SQL User Manual Page 505
Drawing and Positioning a Box
To draw a box on the report layout, do the following:
1. Select Insert ⇒ Box (or the Box button on the Standard Toolbar). The cursor becomes a combination of a crosshair (+) and the Box button.
2. Position the crosshair of the box cursor at the place where you want the top left of the box to begin. Click and drag the mouse; Report Designer draws an outline representing the size and placement of the box. If Snap-To-Grid (accessed by selecting Format ⇒ Snap-To-Grid) is on, the outline snaps to the ruler increments (or to the top or bottom of an Automatic band line) as you draw it.
3. When the box outline is the desired size (use the rulers as a guide), release the mouse. The size of the box is displayed in the Status Bar.
To move a box after inserting it on the layout, first click on one of its sides to select it; sizing handles appear at each corner and at the center of each side. To move the box with the mouse, click and hold the mouse on any part of the box except the handles; then drag the box to its new position and release the mouse. To move the box with the keyboard, press F7; then position the box using the arrow keys.

Chapter 14: Adding Lines, Boxes and Shading
R&R ReportWorks SQL User Manual Page 506
Specifying Alignment
Right-click on a drawn line and select Alignment to specify Left (the default), Center, or Right alignment. Although the default setting is usually appropriate, you can change the alignment in order to provide more precise control over placement and sizing of the line. The alignment setting also determines the direction of increase or decrease when you select a different line thickness.

Chapter 14: Adding Lines, Boxes and Shading
R&R ReportWorks SQL User Manual Page 507
Changing Line Thickness and Color
When you draw a line, it is assigned a default thickness (the thinnest of the 5 available line weights), style (solid or optional dashed) and color (black). You can change the thickness, style and and color using the Line Properties dialog (see Figure 14.1).
Figure 14.1 Line Properties Dialog Box
To select a different line thickness, style or color, do the following: 1. Open the Line Properties dialog. The current Thickness, Style and Color
settings are displayed.
2. Select the drop down item fro the property that you wish to change .
3. Select OK.

Chapter 14: Adding Lines, Boxes and Shading
R&R ReportWorks SQL User Manual Page 508
Drawing and Manipulating Boxes
Using the Insert ⇒ Box command or the Box button on the Standard Toolbar, you can draw boxes to set off portions of your report. After inserting a box, you can control the thickness and color of the box border; specify exclusion of one or more of the box sides; and add one of several shading patterns to the box background (see the Adding Shading section of this chapter for an explanation of box shading).

Chapter 14: Adding Lines, Boxes and Shading
R&R ReportWorks SQL User Manual Page 509
Drawing and Positioning a Box
To draw a box on the report layout, do the following:
4. Select Insert ⇒ Box (or the Box button on the Standard Toolbar). The cursor becomes a combination of a crosshair (+) and the Box button.
5. Position the crosshair of the box cursor at the place where you want the top left of the box to begin. Click and drag the mouse; Report Designer draws an outline representing the size and placement of the box. If Snap-To-Grid (accessed by selecting Format ⇒ Snap-To-Grid) is on, the outline snaps to the ruler increments (or to the top or bottom of an Automatic band line) as you draw it.
6. When the box outline is the desired size (use the rulers as a guide), release the mouse. The size of the box is displayed in the Status Bar.
To move a box after inserting it on the layout, first click on one of its sides to select it; sizing handles appear at each corner and at the center of each side. To move the box with the mouse, click and hold the mouse on any part of the box except the handles; then drag the box to its new position and release the mouse. To move the box with the keyboard, press F7; then position the box using the arrow keys.

Chapter 14: Adding Lines, Boxes and Shading
R&R ReportWorks SQL User Manual Page 510
Specifying Alignment
Right-click on a drawn box and select Alignment to specify Left (the default), Center, or Right alignment. Although the default setting is usually appropriate, you can change the alignment in order to provide more precise control over placement and sizing of the box. The alignment setting also determines the direction of increase or decrease when you select a different border thickness.

Chapter 14: Adding Lines, Boxes and Shading
R&R ReportWorks SQL User Manual Page 511
Sizing a Box
After you insert a box on your report layout, you can change the size of the box as necessary.
Note that if the "Snap-To-Grid" setting (accessed by selecting Format ⇒ Snap To Grid, by pressing Shift+F8, or by selecting the Snap-To-Grid button) is on, the box shape will "snap" to the horizontal and vertical ruler increments (or to the top or bottom of an Automatic band line) as you size the box.
To change only one dimension of a box (either width or height), do the following:
1. Click on the box to select it. Eight "handles" appear at the edges of the image — one at each corner and one at the center of each side.
2. Depending on which dimension you want to change, click and drag the top, bottom, or side handle as necessary. As you drag the handle, a dotted outline indicates the changing dimensions of the box.
3. When the box outline is the desired size, release the mouse.
To change both the width and the height of a box at the same time, follow these steps:
1. Click on the box to select it. Eight "handles" appear at the edges of the box — one at each corner and one at the center of each side.
2. Click and drag a corner handle. For example, if you want to increase box size while maintaining the top left position, click and drag the bottom right handle.
To maintain the box’s aspect ratio (the ratio of width to height), hold down Shift as you drag a corner handle.
3. When the outline is the desired size, release the mouse.

Chapter 14: Adding Lines, Boxes and Shading
R&R ReportWorks SQL User Manual Page 512
Changing Border Thickness, Style and Color
By default, a newly drawn box has a black border on all sides and is assigned the thinnest border weight of the five available. Using the Box Properties dialog box, you can specify a thicker border and select from one of 16 border colors.
Follow these steps to change the thickness and color of a box border:
1. Open the Box Properties dialog (see Figure 13.2). The current Thickness Style and Color settings are displayed in the Borders group box.
2. Open the Thickness menu and select the desired border weight from those displayed.
3. Open the Style menu and select the line style from those displayed.
4. Open the Color menu and select the desired color from those displayed.
5. Select OK.
Figure 13.2 Box Properties Dialog Box

Chapter 14: Adding Lines, Boxes and Shading
R&R ReportWorks SQL User Manual Page 513
Excluding One or More Box Sides
The Show group box on the Box Properties dialog controls display and printing of the top, bottom, left, and right sides of the box. By default, all four sides of a box are initially included, as indicated by the x’s in the check boxes.
You can specify that one or more of the box sides be excluded. This capability is useful, for example, if you want to print a border above and below a field or group of fields. By turning off all four sides of a box and applying a shading pattern, you can insert borderless shading areas on your report.
To control which sides of a box will be included, do the following:
1. Open the Box Properties dialog. The x’s next to the Left, Right, Top, and Bottom settings in the Show box indicate that all four box sides will print.
2. Click the check box for the side or sides that you want to exclude from the box; the x is cleared from that setting. For example, if you want to print only the Top and Bottom of the box, turn off the Left and Right check boxes.
3. If necessary, change the Pattern, Foreground, and Background settings in the Shading box (see the Adding Shading section).
4. Select OK.
In Figure 13.4, a box has been drawn around the report title in the Page Header band and the left and right sides of the box have been excluded. A gray shading background has been applied to the box around the column titles and all four sides have been excluded, resulting in a shaded, borderless box.

Chapter 14: Adding Lines, Boxes and Shading
R&R ReportWorks SQL User Manual Page 514
Adding Shading
You can also use the Box Properties dialog to add one of several shading patterns and background colors to a box. You can control any of the following characteristics of a box:
o Pattern: Select one of 13 shading patterns to assign to the box background. Figure 13.3 shows the shading options available.
o Foreground: Specify a color for the crosshatch pattern (if any).
o Background: Specify a color for the background of the box.
Figure 13.3 Pattern Selection Box
The default settings for Shading are no Background (that is, transparent), black Foreground, and solid Pattern. To change the Shading settings, open the Box Properties dialog and do the following:
1. Open the Background list box. Select a color from those displayed.
2. Open the Pattern list box (see Figure 13.3). Select a pattern from those displayed.
3. If you selected a crosshatch pattern (any pattern except the first selection), open the Foreground list box and select a color to assign to the crosshatch lines. Select OK.
In Figure 13.4, the borderless box around the column headings in the Page Header band has been assigned a solid Pattern and a gray Background.
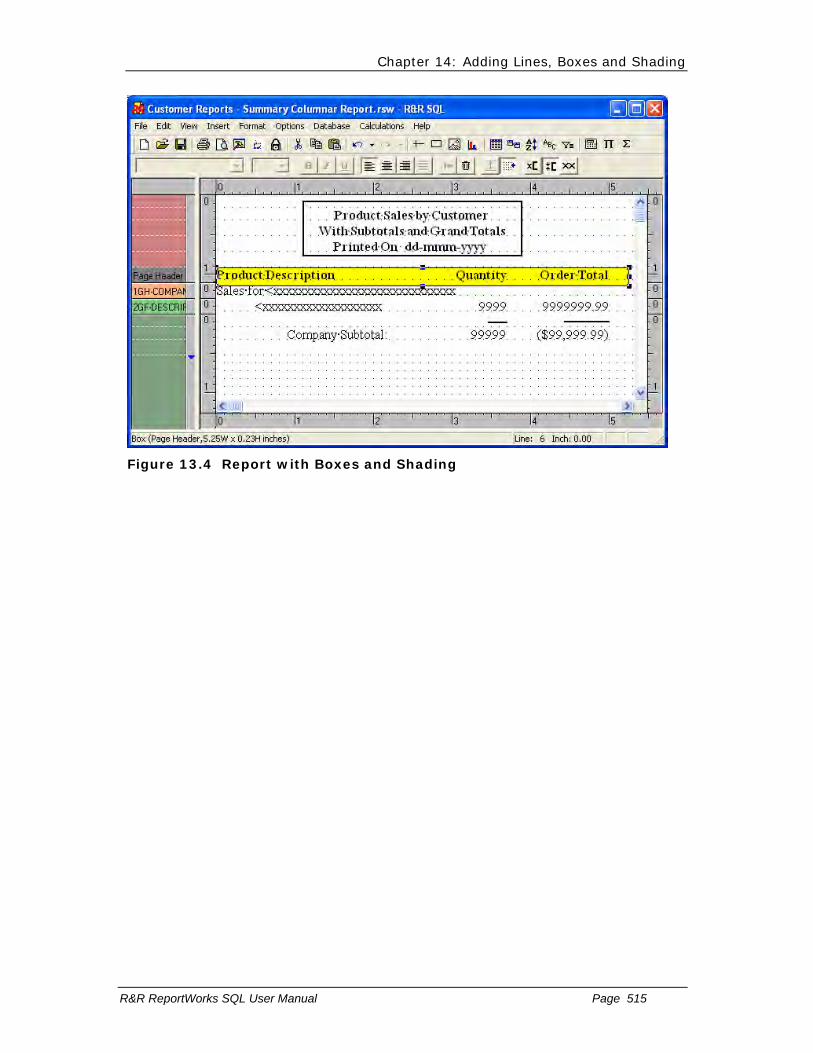
Chapter 14: Adding Lines, Boxes and Shading
R&R ReportWorks SQL User Manual Page 515
Figure 13.4 Report with Boxes and Shading

Chapter 14: Adding Lines, Boxes and Shading
R&R ReportWorks SQL User Manual Page 516
Extending Lines and Boxes Across Bands
Boxes and vertical lines can extend across multiple band areas. The box or line will begin printing when the band line containing the top of the box or line prints. The box or line will end when the band line containing the bottom of the box or line prints.
For example, a box that starts in the Header band and ends in the Record band will end on the first Record line. If you have multiple Record lines and you want the box to span all of those lines, size the box so it ends in the Footer or Summary band instead.

Chapter 14: Adding Lines, Boxes and Shading
R&R ReportWorks SQL User Manual Page 517
Reports with New-Page Lines
You cannot place the top or bottom of a box or vertical line on a New-Page line. However, if the box or line extends across a New-Page line, the object will be carried across pages.
Reports with Multiple Records Across
For reports with multiple records across, boxes will print for each record in the Record band as long as the box begins and ends in that Record band. If the box begins or ends in another band, it will print for the first record only.
Boxes and Lines that Extend Across Pages
When a box or vertical line extends across pages, it will print down the page until the Page Footer (if any) or bottom margin is reached. When the box or line resumes on the next page, the top margin and Page Header (if any) are skipped; then the box or line resumes printing.

Chapter 14: Adding Lines, Boxes and Shading
R&R ReportWorks SQL User Manual Page 518
Special Considerations
The following sections explain several special characteristics of lines and boxes that you may need to take into consideration to ensure proper placement and alignment.
Chapter 14: Adding Lines, Boxes and Shading
R&R ReportWorks SQL User Manual Page 519
Increasing Line or Box Thickness
When you increase the thickness of a horizontal line, the bottom of the line remains anchored and the thickness increases upward.
When you increase the thickness of a vertical line, the direction of increase depends on whether the line is left-, center-, or right-aligned:
A left-aligned vertical line (the default) increases in thickness to the right.
A center-aligned vertical line increases equally in both directions.
A right-aligned vertical line increases to the left.
When you increase the thickness of a box, the outer edge of the box remains fixed and the thickness increases inward.
Lines and Boxes on Automatic Band Lines
When Snap-To-Grid is on, any vertical line or box drawn on an Automatic band line will snap to the top and bottom of the band line; a horizontal line will snap to the bottom of the band line.
If you increase the font size of any field or text on a band line, you will have to adjust the height of any boxes or vertical lines on that band line accordingly.
Band Lines with Logical Conditions
If the band line on which a box or vertical line begins is suppressed as the result of a logical condition, the vertical line or box will not print.
If the band line on which a box or vertical line ends is suppressed as the result of a logical condition but the band line on which it begins is not, the vertical line or box will begin printing in the appropriate place. However, the vertical line or the box sides will print continuously to the end of report.

Chapter 15 Inserting Bitmapped Images
Introduction (Inserting Bitmapped Images)
This chapter explains how to insert and size images in reports. This information is presented in the following sections:
Inserting a Picture from File
Inserting a Picture from Field
Pasting an Image from the Clipboard
Sizing an Image on the Layout
Using the Picture Properties Dialog
R&R provides two basic methods for adding bitmapped images to your report. The first method allows you to place a single specific image at a location in your report. For example, you might want to place your company logo on each page of your report. For this, you would select either Insert->Picture from File or you could paste an image that has been placed on the windows clipboard.
The second method allows you to have a image file that changes as the report is processed. For example you may have a customer database and want to print a report with each company’s logo next to their name. For this, you select Insert->Picture from Field and then select a character database or calculated field whose are the path and filename of an image file. When the report is executed, the contents of the picture field is evaluated and the associated image is printed.

Chapter 15: Inserting Bitmapped Images
R&R ReportWorks SQL User Manual Page 521
Report Designer supports the image file formats listed in Figure 15.1.
File Extension Image File Type
BMP Windows Bitmap
TIF Tagged Image File format
PCX PC Paintbrush format
EPS Encapsulated PostScript
JPG JPEG
GIF CompuServe Graphics Interchange Format
TGA TARGA
WMF Windows Metafile
DIB Windows Device-Independent Bitmap
PCT Macintosh PICT
WPG WordPerfect Graphic
DCX Intel FAX format
Figure 15.1 Supported Image File Types
Note that EPS, WMF, PCT, and WPG file formats can include both bitmapped and vector components. For these file formats, Report Designer will use only the bitmapped graphic information.

Chapter 15: Inserting Bitmapped Images
R&R ReportWorks SQL User Manual Page 522
Inserting a picture from file
To import a static graphic image into a report, do the following: 1. Select Insert ⇒ Picture from File (or the Insert Image button on the Standard
Toolbar). The cursor changes to a combination of a crosshair and an outline of the Image button.
2. Position the crosshair of the Image cursor at the place where you want the top left of the image to begin. Click and drag the mouse down and to the right; Report Designer draws an outline representing the size and placement of the image.
3. When the outline is the desired size, release the mouse. The Picture File selection dialog displays (see Figure 15.2). The File Name box lists files in the default picture directory that have the default picture file extension (if no picture directory or file extension defaults have been specified, Windows BMP files in the current directory are listed). Select a file from those listed.
Figure 15.2 Picture File Selection Dialog
4. Select Open. Report Designer inserts the image at the specified location, maintaining the aspect ratio (the ratio of width to height) of the original image file.
You can move, cut, copy, paste, or delete the inserted image just as you do any field on the layout (note that cutting, copying, and pasting are performed internally; the image is not placed in the Windows Clipboard). If you move the image to another band of the report (or if you Paste it in another band), you may have to adjust the band line height to accommodate the size of the image.
To move an image, first select it. Then click and hold the mouse anywhere on the image except at one of the "handles" around the edge. Drag the image to the new location and release the mouse.
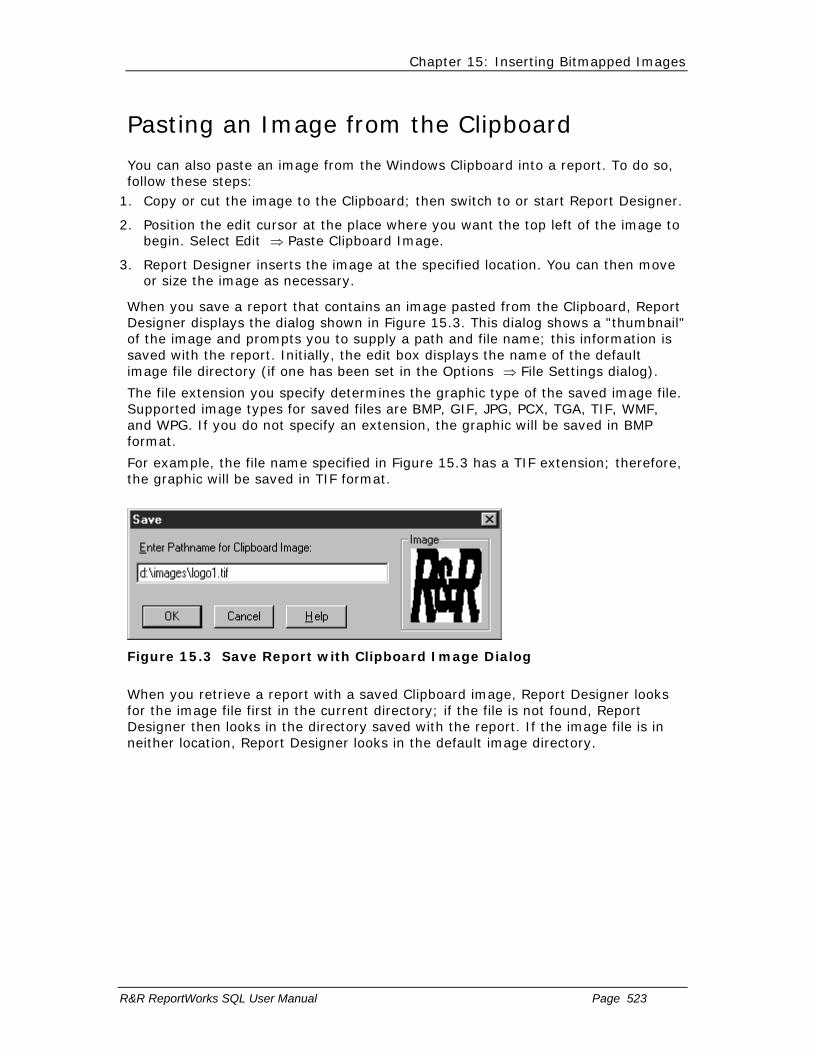
Chapter 15: Inserting Bitmapped Images
R&R ReportWorks SQL User Manual Page 523
Pasting an Image from the Clipboard
You can also paste an image from the Windows Clipboard into a report. To do so, follow these steps:
1. Copy or cut the image to the Clipboard; then switch to or start Report Designer.
2. Position the edit cursor at the place where you want the top left of the image to begin. Select Edit ⇒ Paste Clipboard Image.
3. Report Designer inserts the image at the specified location. You can then move or size the image as necessary.
When you save a report that contains an image pasted from the Clipboard, Report Designer displays the dialog shown in Figure 15.3. This dialog shows a "thumbnail" of the image and prompts you to supply a path and file name; this information is saved with the report. Initially, the edit box displays the name of the default image file directory (if one has been set in the Options ⇒ File Settings dialog).
The file extension you specify determines the graphic type of the saved image file. Supported image types for saved files are BMP, GIF, JPG, PCX, TGA, TIF, WMF, and WPG. If you do not specify an extension, the graphic will be saved in BMP format.
For example, the file name specified in Figure 15.3 has a TIF extension; therefore, the graphic will be saved in TIF format.
Figure 15.3 Save Report with Clipboard Image Dialog
When you retrieve a report with a saved Clipboard image, Report Designer looks for the image file first in the current directory; if the file is not found, Report Designer then looks in the directory saved with the report. If the image file is in neither location, Report Designer looks in the default image directory.

Chapter 15: Inserting Bitmapped Images
R&R ReportWorks SQL User Manual Page 524
Inserting a Picture from Field
Selecting Insert Picture from Field displays the Insert Field dialog which allows you to select a database or calculated character field whose contents represent the path/filename of the picture to insert. To create a placeholder for the actual image file, a file called BLANK.BMP is installed in the R&R program directory. When the report is run, the contents of file referenced in the table will be used in the report. So if you have a parts database, you could place a partID field on the layout and then print an image of each part on a record band in the report.
To insert a variable graphic image into a report, do the following: 1. Select Insert ⇒ Picture From Field.The cursor changes to a combination of a
crosshair and an outline of the Image button.
2. Position the crosshair of the Image cursor at the place where you want the top left of the image to begin. Click and drag the mouse down and to the right; Report Designer draws an outline representing the size and placement of the image.
3. When the outline is the desired size, release the mouse. The Insert Field dialog displays. Select a field from those listed.
1. Select Open. Report Designer inserts BLANK.BMP at the specified location as a placeholder for the actual image whose value will be determined at runtime.
Here is an example of report layout that produces output with names and a picture from file.

Chapter 15: Inserting Bitmapped Images
R&R ReportWorks SQL User Manual Page 525
You can move, cut, copy, paste, or delete the inserted image just as you do any field on the layout (note that cutting, copying, and pasting are performed internally; the image is not placed in the Windows Clipboard). If you move the image to another band of the report (or if you Paste it in another band), you may have to adjust the band line height to accommodate the size of the image.
To move an image, first select it. Then click and hold the mouse anywhere on the image except at one of the "handles" around the edge. Drag the image to the new location and release the mouse.

Chapter 15: Inserting Bitmapped Images
R&R ReportWorks SQL User Manual Page 526
Sizing an Image on the Layout
After you have inserted an image on your report layout, you can change the size of the image as necessary.
Note that if the "Snap-To-Grid" setting (accessed by selecting Format ⇒ Snap To Grid or by pressing Shift+F8) is on, the image shape will "snap" to the horizontal and vertical ruler increments as you size the image.
For images with a Scaling setting of "Stretch" or "Crop," you can change one dimension without changing the other. However, you cannot change just one dimension of an image with a Scaling setting of "Zoom," since width-to-height ratio of such an image must be maintained. (See the Selecting a Scaling Setting section in this chapter for a full explanation of the Scaling settings).
To change both the width and the height of an image at the same time, follow these steps:
1. Click on the image to select it. "Handles" appear at the corners of the image (see Figure 15.4).
Figure 15.4 Selected Image with Sizing Handles
2. Click and drag a corner handle. For example, if you want to increase image size while maintaining the top left position, click and drag the bottom right handle.
3. When the outline is the desired size, release the mouse.
To change only one dimension of an image (either width or height), do the following:
1. Select the image and press F9. On the Picture Properties dialog, select "Stretch (size to fit)" as the Scaling setting. Select OK.
2. The image now has four additional "handles" — one at the center of each side. Depending on which dimension you want to change, click and drag the top, bottom or side handle as necessary. As you drag the handle, a dotted outline indicates the changing dimensions of the image.
3. When the image outline is the desired size, release the mouse.

Chapter 15: Inserting Bitmapped Images
R&R ReportWorks SQL User Manual Page 527
Using the Picture Properties Dialog
Instead of sizing an image on the layout, you can use the Picture Properties dialog to specify image width and height. To display the Picture Properties dialog (see Figure 15.5), right-click on the image on the layout and select "Properties."
You can also use the Picture Properties dialog to do the following:
� Select a different image file or field to replace the current image;
� Select a Scaling option to control the image’s aspect ratio.
The following sections explain how to manage inserted images using the Picture Properties dialog.

Chapter 15: Inserting Bitmapped Images
R&R ReportWorks SQL User Manual Page 528
Sizing an Image Using Picture Properties
To size an image using the Picture Properties dialog, do the following: 1. Select the image and press F9 to display the Picture Properties dialog. In the
Picture Size box, the current dimensions of the image are displayed.
2. Enter or select the appropriate Width and Height settings. If you use the up and down arrows to select a size, the setting value increases or decreases in increments of one-tenth of an inch.
3. Select OK. Report Designer re-sizes the image based on the specified Width and Height settings. Note that if the Scaling setting is "Zoom" (the default), the image’s original aspect ratio will be maintained even if you specified Width and Height settings with a different ratio.
Figure 15.5 Picture Properties Dialog Box
To reset the image to its original dimensions, select "Original Size" on the Picture Properties dialog. The original dimensions of the file are displayed in the Width and Height boxes. When you select OK, Report Designer increases or decreases the image size on the layout to match the original dimensions.

Chapter 15: Inserting Bitmapped Images
R&R ReportWorks SQL User Manual Page 529
Selecting a Scaling Setting
Three Scaling settings are available on the Picture Properties dialog: "Zoom (retain shape)," "Crop (no scaling)," and "Stretch (size to fit)." The default setting of "Zoom" is appropriate in most instances. In those instances when you want to display or print only a portion of the image, change the setting to "Crop." In those instances when you want the image to fit within the dimensions you specify, regardless of the original aspect ratio, change the setting to "Stretch." The following sections explain each setting in more detail.

Chapter 15: Inserting Bitmapped Images
R&R ReportWorks SQL User Manual Page 530
Selecting the Zoom Scaling Option
The default Scaling setting is "Zoom (retain shape)"; the image retains its original aspect ratio (ratio of width to height), regardless of the dimensions of the insertion rectangle drawn or of the width-to-height ratio as specified in the Picture Size box. With this scaling setting, the aspect ratio is maintained when you increase or decrease the image size.

Chapter 15: Inserting Bitmapped Images
R&R ReportWorks SQL User Manual Page 531
Selecting the Crop Scaling Option
When Scaling is set to "Crop (no scaling)," the image is inserted at its original size, and no scaling is performed. If the image is larger than the insertion rectangle drawn or if you enter Width and Height settings smaller than those of the original image, the image is cropped — that is, only the top left portion of the image that fits within the rectangle or specified dimensions is inserted.

Chapter 15: Inserting Bitmapped Images
R&R ReportWorks SQL User Manual Page 532
Selecting the Stretch Scaling Option
When Scaling is set to "Stretch (size to fit)," the image is scaled to fit the insertion rectangle drawn or to fit the dimensions specified on the Image Properties dialog. If the aspect ratio (the ratio of width to height) of the rectangle or of the specified Width and Height dimensions differs from the aspect ratio of the original, the shape of the image in the report will be distorted (either stretched or shrunk).

Chapter 15: Inserting Bitmapped Images
R&R ReportWorks SQL User Manual Page 533
Specifying Alignment
Right-click on an image and select Alignment to specify Left (the default), Center, or Right alignment. Although the default setting is usually appropriate, you can change the alignment in order to provide more precise control over placement and sizing of the image.
Chapter 15: Inserting Bitmapped Images
R&R ReportWorks SQL User Manual Page 534
Selecting a Different Image File
To select a different image to replace the current one, select File or Field on the Picture Properties dialog. The Picture File selection dialog displays.
For pictures from file, it listing files in the default image directory that have the default image file extension (if no image directory or file extension defaults have been specified, Windows BMP files in the current directory are listed). To display image files of a different format, open the "List Files of Type" box and select a format. Then select a file from those listed.
For pictures from field, click the Field button and then select a field from those listed.

Chapter 16 Printing Reports
Introduction (Printing Reports)
This chapter explains how to preview and print Report Designer reports. This information is presented in the following sections:
Overview of Print-Related Commands
Defining Page Setup and Record Layout
Previewing and Printing a Report
Controlling Pagination
Report Designer provides the capability of selecting from a wide variety of Avery labels for printing. When you select an Avery label (using the "Label Type" setting on the Record Layout dialog), Report Designer automatically defines the appropriate page and record layout. See the Multiple Columns section of this chapter for details.
Also, Report Designer provides for the printing of "snaked-column" reports in which the report data flows from the bottom of one column to the top of the next (similar to the format of a telephone book). See the Snaked-Column Reports section of this chapter for information about this type of report.

Chapter 16: Printing Reports
R&R ReportWorks SQL User Manual Page 536
Overview of Print-Related Commands
The following commands display dialog boxes whose settings affect Report Designer’s printed output:
� File ⇒ Print
� File ⇒ Page Setup
� Format ⇒ Record Layout
� Options ⇒ Default Settings
Figure 16.1 briefly explains the Print settings in each dialog box.
Dialog Print Settings
Print Printer, item to print (Report, Test Pattern, or Specification) number of copies, page range, paper source, Print to file
Printers Lists available printers
Page Setup Paper size, margins, and orientation
Record Layout
Record layout; record width, height, copies, number of records across; settings for snaked column and Avery label reports
Preferences Display of colored left/right band line indicators in Print Preview
Default Settings
Global settings for Paper Size, Margins, Font, and Ruler Spacing
Figure 16.1 Print, Page Setup, and Record Layout Settings
The Print, Page Setup, and Record Layout settings you specify apply only to the current report and will be saved with that report. Each time you create a new report, Report Designer will use the default Windows printer and the global layout settings specified in the Options ⇒ Default Settings dialog box. See Chapter 5, "Setting Defaults," for information about the Default Settings dialog box.
Chapter 16: Printing Reports
R&R ReportWorks SQL User Manual Page 537
Defining Page Setup and Record Layout
After you have selected a printer, you can specify Report Designer settings to control paper size, margins, and orientation (portrait or landscape) and to define how records will be laid out. The following sections explain how to specify settings that control page and record layout.

Chapter 16: Printing Reports
R&R ReportWorks SQL User Manual Page 538
Page Setup Settings
When Report Designer prints your report, it uses the current Paper Size, Margins (Top and Bottom), and Orientation settings in the File ⇒ Page Setup dialog box to determine how much remaining space is available on the page.
Changing Paper Size
Use this setting to specify paper size for printed output. The default is Letter. To change the Paper Size used for your report:
1. Select File ⇒ Page Setup to display the Page Setup Dialog.
2. In the Paper group box, open the Size list and select a predefined paper size (the default is Letter).
3. Select OK.
The new paper size is applied to the report.
Some printers allow you to specify a custom paper size (instead of a predefined size). For those printers, you specify the dimensions for the custom size on the Paper tab of the Properties tabbed dialog for the printer (select File ⇒ Print ; then select the Properties button). Note that many Windows printer drivers do not support custom paper sizes.
The predefined paper size settings enable Report Designer to compute page length automatically based on the paper size and the Orientation setting. Selecting a predefined size also automatically determines the size of the page that displays when you preview reports.
Changing Paper Source
Many printers provide more than one paper source — some have upper and lower trays and envelope feeders, for example, and most provide the capability of manually inserting pages. To print using a paper source other than the default, use this setting to specify the source.
To change the paper source for printing a report: 1. Select File ⇒ Page Setup to display the Page Setup dialog box.
2. In the Paper group box, open the Source list (the items on this list depend on the currently selected printer). Select the appropriate paper source.
3. Select OK; the report will now be printed using the paper source you selected.

Chapter 16: Printing Reports
R&R ReportWorks SQL User Manual Page 539
Changing Page Orientation
A report’s orientation determines whether the report prints vertically (Portrait) or horizontally (Landscape). Portrait is the default.
To change a report’s page orientation: 1. Select File ⇒ Page Setup to display the Page Setup dialog.
2. In the Orientation group box, select "Portrait" or "Landscape".
3. Select OK; the new orientation is applied to the report.
Note that some printers do not support landscape printing.
Setting Margins
Enter values to specify the amount of white space at the top, bottom, left, and right of the report page. To set the margins for your report:
1. Select File ⇒ Page Setup to display the Page Setup dialog.
2. In the "Margins" group box, type the measurements you want to use in the "Top," "Bottom," "Left," and "Right" edit boxes.
3. Select OK.
The new margins are applied to the report.
On the layout, the right margin is indicated on the ruler by the letter R. The right margin setting controls where Report Designer places fields on left-, right-, and center-justified band lines. (Note that Report Designer does not prevent you from inserting a field so that it extends beyond the right margin, nor does it prevent such a field from printing beyond the right margin.)

Chapter 16: Printing Reports
R&R ReportWorks SQL User Manual Page 540
Defining Record Layout
Select Format ⇒ Record Layout to control how records are laid out on the page (see Figure 16.3).
Figure 16.3 Record Layout Dialog Box
The following sections explain each of the settings in the Record Layout dialog box.
Chapter 16: Printing Reports
R&R ReportWorks SQL User Manual Page 541
Multiple Columns Settings
Use the settings in this box to define layouts for reports requiring multiple columns, "snaked columns," or specific horizontal or vertical spacing of data on Record lines.
Columns
Use this setting to specify how many records you want to print across the page. Enter a value in this field for reports in which you want to save space by printing records in two or more columns.
Note that when you print multiple records across, Report Designer does not insert additional lines for word-wrapped fields. A word-wrapped field will wrap to fill as many lines as are available, pushing fields below it down if necessary. Therefore, you should not use word-wrapped fields when printing more than one record across unless your Record band contains enough lines to accommodate the maximum length of any word-wrapped field(s) and any fields in the Record band beneath the word-wrapped field(s).
Snaked-Column Reports
Use the "Columns" and "Order" settings on the Record Layout dialog to design multi-column reports in which the records "snake" from the bottom of one column to the top of the next. All data on Record, Group Header, and Group Footer lines will flow from one column to the next when this setting is greater than 1.
To set up a "snaked" columnar report, do the following: 1. Set "Columns" to the number of columns you want horizontally across the page.
2. Enter a "Width" setting appropriate for the maximum width of the data in your records and the number of columns across.
3. Select Down in the "Order" box.
Figure 16.4 shows the top portion of a snaked-column report. The "Columns" setting for this report is 3, and the "Width" setting is 2.5 inches. As a result of these settings, the report data prints in three columns, flowing from the bottom of one column to the top of the next.

Chapter 16: Printing Reports
R&R ReportWorks SQL User Manual Page 542
Figure 16.4 Top Portion of Snaked Column Report
Label Type
Report Designer provides over 150 choices for printing a variety of labels (for example, mailing labels) on commercially available Avery label stock. These settings are contained in a file named RRLABELS.INI that is installed in the Report Designer program directory.
Select "Label Type" on the Record Layout dialog to display a menu of label choices. When you select a label type, Report Designer automatically sets page size, margins, record width, and record height to the values appropriate for that label type.
Dimensions
Use these settings to specify the dimensions (width and height) of the Record area when printing multiple records across. Enter values in these fields for reports in which the Record area must fit within a predefined horizontal area. If you are printing mailing labels, the value in this field should be the distance from the left edge of one label to the left edge of the adjacent label.
Copies
Use this setting to specify how many copies of each Record area you want to print.
You can specify the number of Record areas to print for each composite record in either of two ways:
Enter a number in the Number edit box.
Open the Field list box and select a numeric field whose value will control the number of Record areas printed. You can use any field except a total field or a calculated field that uses a total field or the PAGENO( ) function. If the value of the field is one, zero, or negative, Report Designer prints one copy of each Record area. If the setting is positive, Report Designer uses the
Chapter 16: Printing Reports
R&R ReportWorks SQL User Manual Page 543
integer part of the setting to determine the number of record copies to print.

Chapter 16: Printing Reports
R&R ReportWorks SQL User Manual Page 544
Record Formatting Settings
The Formatting box contains check boxes for these settings: Compress Record/Group Lines, Suppress Record Lines, Headers/Footers in Summary, and Break Record Area Across Pages.
Compress Record/Group Lines
Use this setting to suppress printing of empty lines in the Record, Group Header, and Group Footer areas of a report. If you want empty lines in these areas to print, turn this setting Off.
When this setting is On, lines are suppressed if they consist entirely of empty fields of any sort, of database fields containing spaces or the NULL value, or of non-underscored text fields consisting entirely of spaces. Spaces in calculated fields are treated as "hard" spaces, so lines with calculated fields will be suppressed only if those fields are empty.
NOTE Report Designer always prints empty Record and Group lines — that is, lines that have no fields on them (for example, lines placed in a report layout for white space).
Suppress Record Lines
Use this setting to print a report without Record lines. For example, you can use this option to print a report that contains only totals (on lines other than Record lines). When this option is On, Report Designer ignores any Record lines. When this option is Off, Report Designer prints Record lines as usual.
Headers/Footers in Summary
Use this setting to specify whether Page Headers and Footers will print or display on a page containing only Summary lines. When this setting is On, any Page Header and Footer lines you defined will print on a page containing only Summary lines. When this setting is Off, Page Header and Footer lines will not print on a Summary-only page.
Break Record Area Across Pages
If a record area takes up more than one line and cannot fit on the current page, you can use this option to tell Report Designer where you want the page break (this option also affects Report Designer’s widow/orphan control). You can split the record area between two pages, or you can keep the record area together by printing the entire record on the next page.
To specify page break behavior for multiple-line record areas: 1. Select Format ⇒ Record Layout to display the Record Layout dialog.
2. In the Formatting group box, check or uncheck the "Break Record Area Across Pages" box.
When this option is On (checked), a page break can occur within a multiple-line record area. Report Designer prints as many lines of the current composite record as will fit on the current page; the rest of the record will be continued on the next page.
Chapter 16: Printing Reports
R&R ReportWorks SQL User Manual Page 545
When this option is Off (unchecked), multiple-line records are kept together on the same page. If all the Record lines won’t fit on the current page, the entire record will print on the next page.

Chapter 16: Printing Reports
R&R ReportWorks SQL User Manual Page 546
Previewing and Printing a Report
To print a report, you access the print dialog by selecting File ⇒ Print. (You can also select the Print Report button on the Standard Toolbar to bypass the print dialog and print the report directly.)

Chapter 16: Printing Reports
R&R ReportWorks SQL User Manual Page 547
Report Designer Print Dialog Settings
When you select File ⇒ Print, the Report Designer print dialog displays (see Figure 16.9). Use this dialog to specify report, test pattern, or report specification printing; to set the range of pages and number of report copies to print; and to specify printing to a file.
These settings are saved with the report and override any corresponding settings in the Windows Properties tabbed dialog for the currently selected printer.
By default, if you print multiple copies of a report, the pages will not be collated. To print collated multiple copies, turn on the "Collate Copies" setting on the Report Designer Print dialog. Printing multiple copies will take longer when this setting is on, since Report Designer must process the entire report for each copy that is printed.
Figure 16.5 briefly explains each of the items in the Print dialog box.
Item Purpose
Printer Displays name and status of currently selected printer and enables selection of a different printer
Print to file Specifies that the report be printed to a file (with printer codes included); enter file path/name in "Print file" box below
Print range Selects a range of pages to print by setting beginning (From) and ending (To) numbers
Copies Specifies how many report copies to print (default is 1)
Collate Specifies collating for multiple report copies
Print what Specifies printing of Report (the default), Test Pattern, or Report Specification
Print file Specifies output path and file name for printing to a file (when "Print to file" is On)
Preview button
Displays Preview of current report
Figure 16.5 Explanation of Print Dialog Box

Chapter 16: Printing Reports
R&R ReportWorks SQL User Manual Page 548
Windows Printer Properties Dialog Settings
You can access the Windows Printer Properties tabbed dialog by selecting Printers on the Windows Control Panel and then selecting File ⇒ Properties for a specific printer. This dialog controls nearly all printer properties, including paper size, source, and orientation; graphics resolution; and font downloading options. Changes made using these dialogs will apply to any Windows application (including Report Designer) that uses this printer driver.
Remember, though, that the Paper Source, Paper Size, and Orientation settings you select in Report Designer for a particular report (using the Print and Page Setup dialogs) override the Windows Paper Source, Paper Size, and Orientation settings specified on the Paper tab of the Printer Properties tabbed dialog.

Chapter 16: Printing Reports
R&R ReportWorks SQL User Manual Page 549
Previewing a Report
Before sending a report to the printer, you can preview it on screen to check fonts, field placement, page breaks, and other elements of the page layout. The Preview screen (see Figure 16.6) consists of a facsimile of the first page of the report, with VCR-like buttons at the top that allow you to page forward and backward through a multi-page report, magnify portions of the page, print the current page or the entire report, and pause or cancel the Preview (you can also perform these operations from the keyboard using the function keys, as shown in Figure 16.7).
To preview a report, use any of these methods:
Select File ⇒ Print Preview;
Select the Print Preview button on the Standard Toolbar;
Select File ⇒ Print; then select the Preview button on the Print dialog.
When you select any of these options, Report Designer displays the Print Preview window (see Figure 16.6).
Figure 16.6 Print Preview Display

Chapter 16: Printing Reports
R&R ReportWorks SQL User Manual Page 550
Note that if you have enabled Colored Bands/Preview on the Preferences dialog, the Preview window will include color-coding just outside the left and right Page Margins so that you can easily identify the band type of the line being displayed.
You can "zoom" the display simply by clicking at the desired location on the preview page. Note that the zoom level is maintained as you page through a report and will be retained if you exit and restart Preview.
You use the Preview buttons to move around in multiple-page reports and to close the Preview screen and return to the report layout. Figure 16.7 shows the Preview control buttons and lists the Shift + function key that corresponds to each. Figure 16.8 explains the purpose of each button.
Figure 16.7 Preview Buttons (and Corresponding Function Keys)
Button
Key: Shift +
Purpose
F1 Prints report with current settings
F2 Prints currently displayed page
Restarts the report
F3 Displays magnified page preview
F4 Returns to previous magnification level
F5 Displays first page of multi-page
report
F6 Displays previous report page
F7 Displays next page
F8 Displays final report page
F9 Pauses preview when positioning to
last page
F10 Closes Preview window
Figure 16.8 Explanation of Preview Buttons
Chapter 16: Printing Reports
R&R ReportWorks SQL User Manual Page 551
Dealing with Low Memory During Preview
When you page forward through a report in Preview, Report Designer keeps the previously viewed report pages in memory. If you have several other Windows applications running, you might reach a point when previewing a large report where there is not enough memory to store additional preview pages. If this occurs, Report Designer will display a Low Memory Condition dialog containing the message "Insufficient Memory to Continue Print Preview."
You can select one of three actions for Report Designer to take:
Pause Print Process
Free Earlier Pages
Terminate Preview Process
Pause Print Process
Selecting this option is equivalent to selecting the Pause button on the Preview screen. After pausing the preview, you can switch out of Report Designer and free up memory by terminating other Windows applications. You can then continue with the report preview.
Free Earlier Pages
You can select this option to have Report Designer begin removing earlier report pages (beginning with the first page) from memory until enough memory has been freed up to continue the preview. After you select this option, Report Designer will continue to free earlier pages as necessary as you page forward through the report.
Once these earlier pages have been freed from memory, of course, you must cancel and then restart Preview in order to view them. In some cases, restarting Preview will cause Report Designer to re-execute the report’s SELECT statement.
Terminate Preview Process
Selecting this option is equivalent to selecting the Close button on the Preview screen. Report Designer returns to the layout window; if you select Print Preview again, the preview will begin at the first report page.
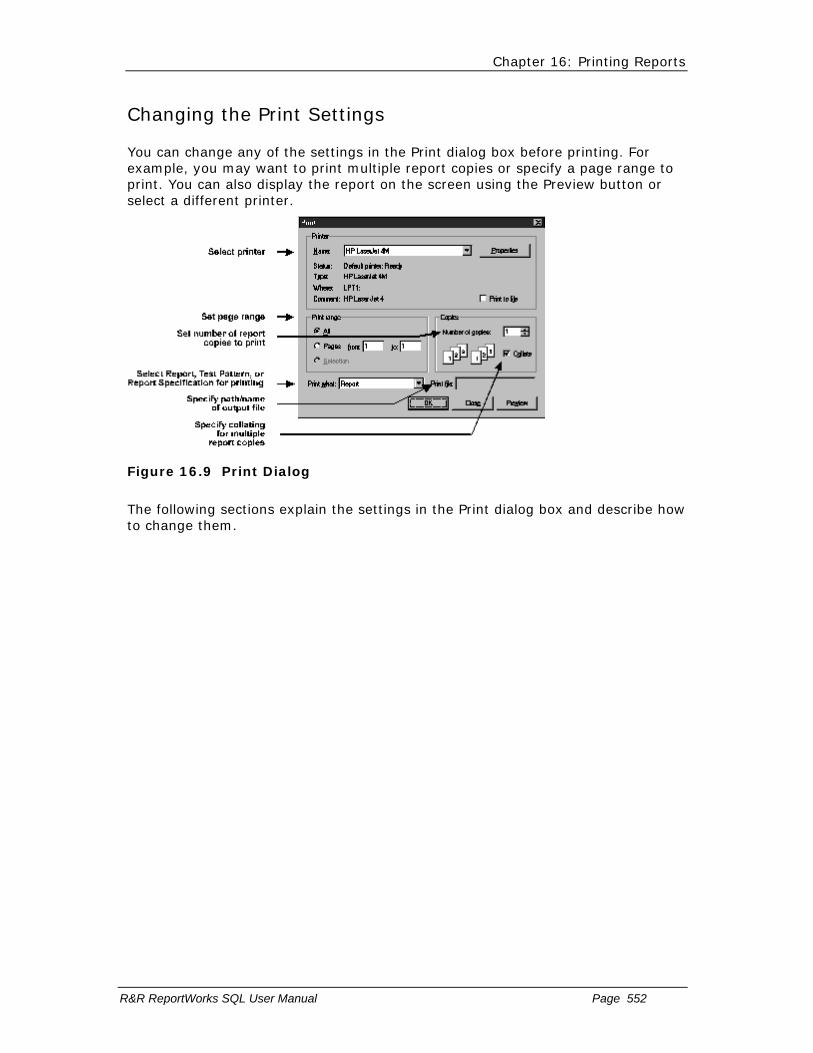
Chapter 16: Printing Reports
R&R ReportWorks SQL User Manual Page 552
Changing the Print Settings
You can change any of the settings in the Print dialog box before printing. For example, you may want to print multiple report copies or specify a page range to print. You can also display the report on the screen using the Preview button or select a different printer.
Figure 16.9 Print Dialog
The following sections explain the settings in the Print dialog box and describe how to change them.
Chapter 16: Printing Reports
R&R ReportWorks SQL User Manual Page 553
"Print What" List Box
The Print What list box has three choices: Report (the default), Test Pattern, and Report Specification.
Select Report to print or preview the current report.
Select Test Pattern to print only Page Header, Page Footer, and Record areas of a report in the form of text fields and field symbols (for example, AAAA) that represent data fields. Printing a test pattern is useful for aligning forms or mailing labels before printing the actual report data.
Select Report Specification to print or preview a complete description of the content and layout of the current report. (For an explanation of the Report Specification option, see Chapter 2, "Managing Reports.")
Chapter 16: Printing Reports
R&R ReportWorks SQL User Manual Page 554
Printing Multiple Report Copies
By default, Report Designer prints one copy of all report pages. To print multiple report copies, enter or select the number of copies to be printed in the Copies edit box.
Note that in order to avoid having to process a report multiple times when the "Collate" setting is off, Report Designer takes advantage of the ability of some printer drivers to print multiple uncollated copies. Printing multiple copies will take longer when the "Collate" setting is on, since Report Designer must process the entire report for each copy that is printed.

Chapter 16: Printing Reports
R&R ReportWorks SQL User Manual Page 555
Changing the Print Range Setting
To specify a range of report pages to print, select Pages in the Print Range box; then enter or select the beginning page number in the "From" box and the ending page number in the "To" box. In each case, "page number" is the number of a physical page rather than a printed page number; that is, you must take into account all report pages, even if page numbering does not begin on the first page.

Chapter 16: Printing Reports
R&R ReportWorks SQL User Manual Page 556
Printing to a File
To print a report to a file rather than to the printer, do the following: 1. Select File ⇒ Print to display the Print dialog.
2. Check the "Print to file" check box.
3. Enter the name of the output file (optionally including a path) in the "Print file" edit box. If you do not include a path, the file will be output to the current directory.
4. Select Print to send the output to the specified disk file. To return to the report layout without outputting the report, select Close; the print-to-file setting will be retained.
NOTES The output file will include printer codes for the currently selected Windows printer. To output to a plain text file with no printer codes, use the File ⇒ Export command.
The print-to-file setting is saved with the report. To remove this setting so that print jobs will be sent to a printer rather than a file, select File ⇒ Print and turn off "Print to file." Then select Close.
Chapter 16: Printing Reports
R&R ReportWorks SQL User Manual Page 557
Printing to a PDF file
To send the fully formatted output of your report to a PDF file that can be viewed with the Adobe Acrobat reader, use the following steps.
1. Select File ⇒ Print.
2. In the Printer Name box choose R&R PDF Export.
3. Check the Print to File Box.
4. In the Print File box, enter the path/name of the file you wish to create including the .PDF extension.
5. Select OK.
R&R will then output your report including all formatting to the named PDF file.
Chapter 16: Printing Reports
R&R ReportWorks SQL User Manual Page 558
Printing a Report Specification
To print a detailed specification of your report: 1. Select File ⇒ Print to display the Print dialog.
2. In the "Print What" list, select the "Report Specification" option.
3. Select OK.
Printing a Test Pattern
To print a test pattern showing the placement of fields in your report: 1. Select File ⇒ Print to display the Print dialog.
2. In the "Print What" list, select the "Test Pattern" option.
3. Select OK.

Chapter 16: Printing Reports
R&R ReportWorks SQL User Manual Page 559
Controlling Pagination
The following features affect how Report Designer determines where to place automatic page breaks in your report:
Page Setup settings (Paper size, margins, and orientation);
Record Layout settings;
New-page lines inserted on the report layout;
Fields with word-wrap format;
Line heights calculated automatically by Report Designer or manually specified with the Format ⇒ Band Line Properties "Freeform" setting;
Report Designer’s automatic widow/orphan control.

Chapter 16: Printing Reports
R&R ReportWorks SQL User Manual Page 560
Page Setup Settings
When Report Designer prints your report, it uses the current Paper Size, Margins (Top and Bottom), and Orientation settings in the File ⇒ Page Setup dialog box to determine how much remaining space is available on the page.

Chapter 16: Printing Reports
R&R ReportWorks SQL User Manual Page 561
Record Layout Settings
The Format ⇒ Record Layout settings determine record layout and control which records and lines Report Designer will print. All of these settings affect where Report Designer will place page breaks, especially "Compress Record/Group Lines," "Suppress Record Lines," and "Break Record Area."
When calculating the number of lines that can fit on the page, Report Designer ignores blank Record, Group Header, and Group Footer lines compressed by the "Compress Record/Group Lines" setting. In addition, it ignores Record lines suppressed by the "Suppress Record Lines" setting and any lines whose printing is suppressed with the Band Line Properties "Logical Field" setting.
Report Designer uses the "Break Record Area" setting to determine whether to allow page breaks to occur within Record areas that occupy more than one line.
Note that when printing more than one record across the page, Report Designer controls pagination by using the actual number of Record lines, not taking into account blank line compression or line logical conditions.

Chapter 16: Printing Reports
R&R ReportWorks SQL User Manual Page 562
Inserting a Page Break
You can specify where page breaks should occur on your report by inserting a new-page line anywhere on the layout except in a Page Header or Page Footer band.
To insert a page break in your report: 1. Select Insert ⇒ Create Band Line (or press Ctrl+F11) to display the Create
Band Line dialog.
2. In the "Line Placement" group box, specify where you want the new-page line to be inserted (Above Current Line, Below Current Line, or in any band except a Page Header/Footer or a swapped Group Header/Footer).
3. Turn on the "New Page Line" setting at the bottom of the dialog; an X appears indicating that the line you are inserting is a new-page line.
4. Select OK.
Report Designer inserts a dashed line in the specified area of the layout, indicating a page break.
When you output your report, Report Designer starts a new page at that line. All lines following the page break line are printed starting on the next page.
You can move, copy, or delete a new-page line just like any other line on the report layout.
Figure 16.10 explains several areas where new-page lines can be inserted to produce page breaks in different places in your report.
Position of New-Page Line on Report Layout
Resulting Page Break in Report
Last line in Title band After title
Last line in Group Footer band After group
Last line in Record band After each record
First line in Summary band Before summary
Figure 16.10 Location of New-Page Lines

Chapter 16: Printing Reports
R&R ReportWorks SQL User Manual Page 563
Word-Wrapped Fields
If your report includes word-wrapped fields in the Title, Record, Group Header, Group Footer, or Summary band, the pagination of the report may be affected by the number of lines the data in these fields occupies. You can control the length of a word-wrapped field by using the Width tab on the Properties tabbed dialog to change the width within which the data wraps. See Chapter 4, "Working with Fields," for more information about word-wrapped field format.

Chapter 16: Printing Reports
R&R ReportWorks SQL User Manual Page 564
Line Heights
Report Designer determines how many lines it can fit on a page by taking into account the height of each band line in the report. For band lines that have been assigned an Automatic height, Report Designer calculates line heights automatically based on the largest font on each line. To set a specific height, select Freeform on the Band Line Properties dialog and specify a height in inches or points.

Chapter 16: Printing Reports
R&R ReportWorks SQL User Manual Page 565
Widow/Orphan Control
In all reports, Report Designer has automatic widow/orphan control that prevents a Group Header from appearing at the bottom of a page when there is not enough room for the Record area of at least one record.
In addition, for reports that have the following features, Report Designer prevents a Group Footer from appearing at the top of a page unless it is preceded by the Record area of at least one record:
A Record band that does not contain any new-page lines.
A Group Footer band containing at least one field.
The following Format ⇒ Record Layout settings:
Break Record Area = Off Suppress Record Lines = Off Records Across = 1
"Reset Page," "Swap Header," and "Swap Footer" Group Order settings turned Off for all group fields.

Chapter 17 Exporting Data
Introduction (Exporting Data)
This chapter explains how to export report data to a variety of export file formats.
There are two separate menu choices for exporting data.
File->Export allows you to create the following formats:
Multiple Band Export Formats
Multiple band export formats include information from all band lines in the report.
The available multiple band export formats are:
� Text File
� Rich Text Format (RTF) File
� HTML
� ActiveX Viewer Control File
Single Band Export Formats
Single band export formats are columnar style formats where each export line conforms to specific defined format.
The available single band export formats are:
� Xbase (DBF) file
� Result Set (DBF)
� Worksheet (XLS)
� Text Data (Comma Delimited, Tab Delimited, Character Delimited, SDF Fixed Width)
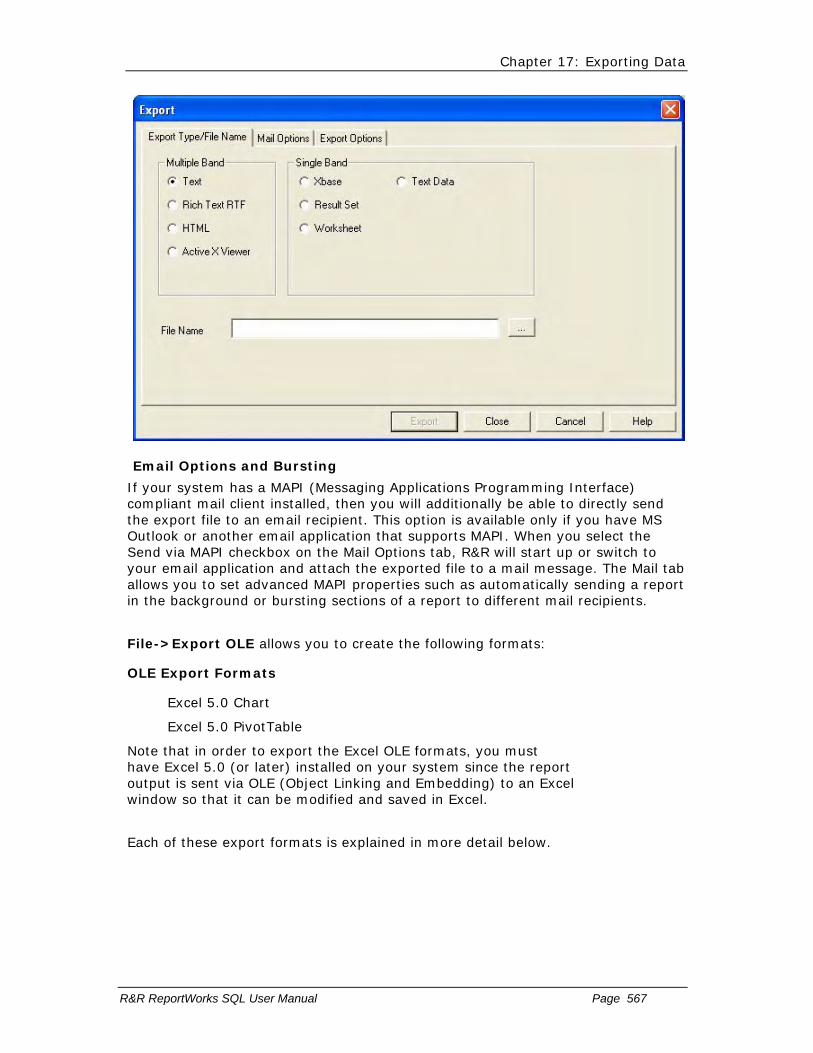
Chapter 17: Exporting Data
R&R ReportWorks SQL User Manual Page 567
Email Options and Bursting
If your system has a MAPI (Messaging Applications Programming Interface) compliant mail client installed, then you will additionally be able to directly send the export file to an email recipient. This option is available only if you have MS Outlook or another email application that supports MAPI. When you select the Send via MAPI checkbox on the Mail Options tab, R&R will start up or switch to your email application and attach the exported file to a mail message. The Mail tab allows you to set advanced MAPI properties such as automatically sending a report in the background or bursting sections of a report to different mail recipients.
File->Export OLE allows you to create the following formats:
OLE Export Formats
� Excel 5.0 Chart
� Excel 5.0 PivotTable
Note that in order to export the Excel OLE formats, you must have Excel 5.0 (or later) installed on your system since the report output is sent via OLE (Object Linking and Embedding) to an Excel window so that it can be modified and saved in Excel.
Each of these export formats is explained in more detail below.

Chapter 17: Exporting Data
R&R ReportWorks SQL User Manual Page 568
Multiple Band Export Formats
Exporting to a Text File
Use this option to export report data to an unformatted text file. Exporting to a text file is useful if you plan to include report data in a word processing document or import it into a desktop publishing program. When you export to a text file, Report Designer exports all the data on every line of the report, including text fields. . It does not include any lines/boxes/images/OLE objects.
To create an Text file:
On the File>-Export dialog box, select the Text radio button.
In the File Name box of the Input tab, enter a name for the output text file. You can alternatively use the button to the right of the text box to select a directory or filename.
The Export Options tab to allows you to select additional Text Options.
Check the Carriage Returns Once per Band box to insert a hard return after each band area in the report output. If this box is not checked, R&R will to insert a hard return after every line in the report output.
Check the No margins/page breaks box if you want to create a text file with no top or left margin and no blank lines between pages.
Check the Use DOS (PC) Character Set box to enable the DOS (PC) character set in place of the Windows (ANSI) character set.
Click the Export button to create the text file.

Chapter 17: Exporting Data
R&R ReportWorks SQL User Manual Page 569
Exporting to a Rich Text Format (RTF) File
Use this export option to export report data to a Rich Text Format file. Most popular word processing programs can import Rich Text Format files.
To create an RTF file:
On the File>-Export dialog box, select the ActiveX Viewer radio button.
In the File Name box of the Input tab, enter a name for the output file (default extension is PDI). This file will serve as the input for the Viewer control. You can also use the […] button to bring up an Export To: file dialog box so that you can select the name and location of the Export file.
Note the following restrictions and behaviors of RTF:
• RTF export conforms to the RTF 1.0 standard.
• Lines, boxes, and images are not included in an RTF export.
• Text/data within Freeform lines will be positioned at the bottom of that line.
• For snaked-column reports, data will be exported in a single column; you can then edit the RTF file using a word processor to restore the desired format.
• Swapping of headers and footers is ignored; page and group headers/footers will be output without regard to swapping.
• Page setup settings such as margins and page size are included in an RTF export; therefore, select an appropriate printer before exporting.
• Reports without page footer band lines sometimes do not paginate correctly.
There are no available settings on the Options tab when RTF is selected as the export file type.

Chapter 17: Exporting Data
R&R ReportWorks SQL User Manual Page 570
Exporting to HTML
Use this export option to export report data to an HTML. HTML (Hypertext Markup Language) is the format used for presenting information on the World Wide Web. You can generate files suitable for inclusion on a web page directly from Report Designer.
Note that lines and boxes on the report layout are not included in the HTML output, and that in certain cases there may be some loss of text formattting. R&R uses tables as the primary structure within the output HTML file.
HTML File Definition
You can export report data to an HTML file by selecting the HTML radio button on the Export Type/File Name tab and then entering the HTML file name in the File Name box. You can also use the […] button to bring up an Export To: file dialog box so that you can select the name and location of the Export file.
You can then click Export to create the file.

Chapter 17: Exporting Data
R&R ReportWorks SQL User Manual Page 571
HTML Export Options
You also can select the Export Options tab to optionally specify a background color or image and inclusion of a border grid to enclose field values.
Image
Any OLE objects or charts in the original report are converted to image files and saved to the same directory as any images in the report. By default, the image directory is a subdirectory of the HTML file location, and the directory name is the root of the HTML file name. For example, if the report is exported to c:\work\exportfile.html, the image directory will be c:\work\exportfile. The directory path will appear in the Image Directory box on the Location tab, and the sample below will show what the HTML tag will look like. In this example, an image named picture.gif would be referenced as exportfile\picture.gif in the HTML.
The Convert all images to this format drop down list allows you to select the format (BMP, GIF, or JPG) to which all images (including charts and OLE objects, which are saved as images) contained in the report will be converted upon export.
Background
To specify a solid color background for the HTML page, click the Color radio button and select a color from the drop-down list at the right.
To specify an image to serve as the page background, click the Image button and enter the name and directory location of the image file. As an alternative, you can click the ellipsis button at the right to select an image file from a specific folder.
Table Border
Click the Border tab. To specify that the exported data be enclosed in a border grid on the HTML page, click the Width button and enter or select a border thickness.
View

Chapter 17: Exporting Data
R&R ReportWorks SQL User Manual Page 572
Check this box to open the report in your system’s default web browser immediately after the file has been exported.

Chapter 17: Exporting Data
R&R ReportWorks SQL User Manual Page 573
Exporting to an ActiveX Viewer Control File
When you select this export option, you can create a report file that is readable by the ActiveX Viewer control. This control can be placed in an HTML file to display a report in an Internet/Intranet environment.
Unlike some reports exported to HTML, a report exported using this option will look the same when accessed through the Viewer control as it does when previewed or printed, including lines, boxes, images, and formatting. Note that the Viewer control can be used only with browsers that support ActiveX controls.
The example below shows a PDI file displayed in an HTML container. The report appears in a viewer window that allows you to scroll through the report and send it to the local printer.
And here is the HTML source code for the above page.
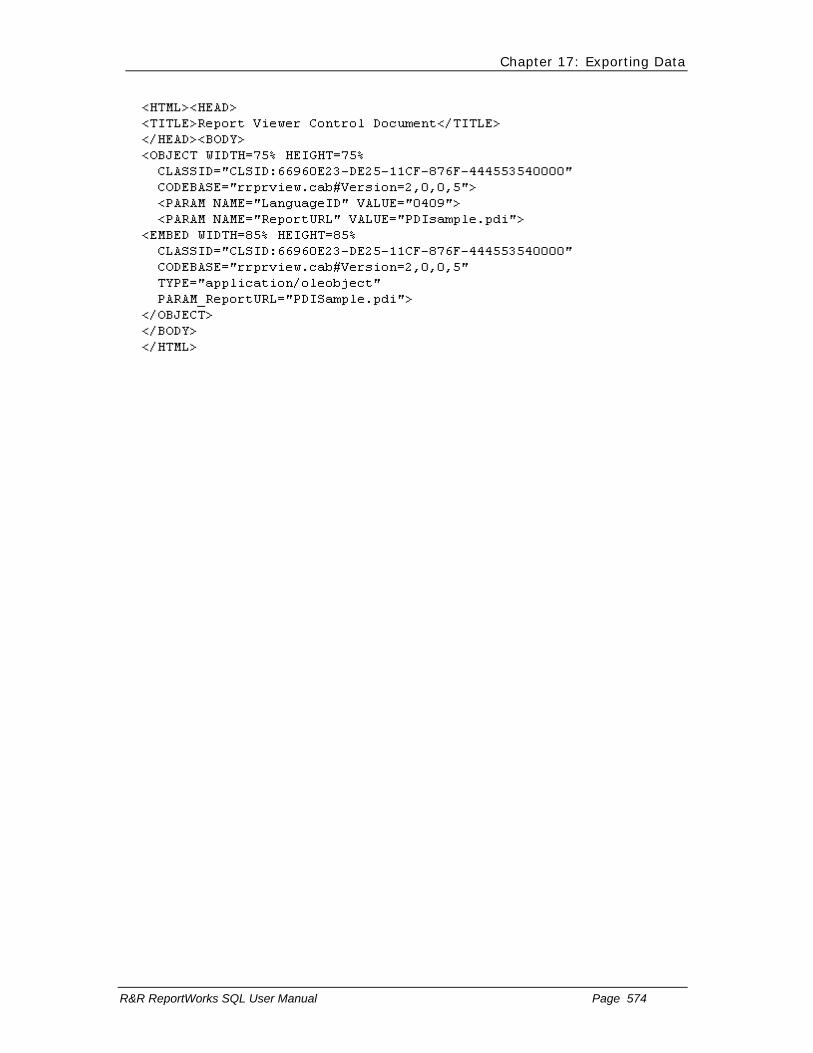
Chapter 17: Exporting Data
R&R ReportWorks SQL User Manual Page 574

Chapter 17: Exporting Data
R&R ReportWorks SQL User Manual Page 575
Embedding the Viewer Control in an HTML File
In order to make the PDI output file accessible to a browser, you must embed the Viewer control in an HTML file. You can use either of the following methods to create this container HTML file and embed the Viewer control in it:
• Select the Export Options tab to create a basic HTML container file and then edit that file as necessary.
• Create an HTML file from scratch using the syntax explained in this section.
This section provides instructions for using the Export Options to create a basic container file, explains the various elements of the dialog, and illustrates the syntax for embedding the control.
Figure 17.8 Active X Options Tab

Chapter 17: Exporting Data
R&R ReportWorks SQL User Manual Page 576
Syntax for the HTML Container File
A file created using the Object Tag dialog contains the necessary HTML tags to embed the Viewer control and to specify the exported report file as input to the control. Here is a sample of the HTML created for such a file:
<HTML><HEAD> <TITLE>Report Viewer Control Document</TITLE> </HEAD><BODY> <OBJECT WIDTH=75% HEIGHT=75% CLASSID="CLSID:66960E23-DE25-11CF-876F-444553540000" CODEBASE="rrprview.cab#Version=2,0,0,5"> <PARAM NAME="LanguageID" VALUE="0409"> <PARAM NAME="ReportURL" VALUE="PDISample.pdi"> <EMBED WIDTH=85% HEIGHT=85% CLASSID="CLSID:66960E23-DE25-11CF-876F-444553540000" CODEBASE="rrprview.cab#Version=2,0,0,5" TYPE="application/oleobject" PARAM_ReportURL="PDISample.pdi"> </OBJECT> </BODY> </HTML>
The Viewer control is embedded in the file using the <OBJECT> tag. These are the attributes and parameters that are defined in the <OBJECT> section of the file:
• The WIDTH and HEIGHT attributes set the size of the control window on the HTML page. In the example, the unit of measure is pixels. To set width and height as a percentage of the HTML page instead, enter a value followed by a percent sign (%) in each.
• The CODEBASE attribute identifies the location of the Viewer control. This file is packaged in a "cabinet" file named RRPRVIEW.CAB that is installed in the ActiveX subfolder of your program installation folder. Copy the cabinet file to your Web server and reference that location using the CODEBASE attribute. You can use either a full URL path or one that is relative to the location of the HTML container document. If the cabinet file and the HTML container file are in the same folder, you can reference just the file name (for example, CODEBASE=RRPRVIEW.CAB).
• The Version attribute indicates the software version of the Viewer control. Do not change this attribute; use the version as it was exported or as it appears in the Preview HTML Document window
• The ReportURL parameter specifies the exported report file that will serve as input for the Viewer control (the file created using the Input File tab). You can use either a full URL or one that is relative to the HTML container file.
Chapter 17: Exporting Data
R&R ReportWorks SQL User Manual Page 577
Single Band Export Formats
Exporting to an Xbase File
Export to DBF enables you to export a single band line type to an Xbase (*.DBF) table. Xbase export allows you to create a DBF file that can then used as the basis of a new report.
To create an Xbase file:
On the File>-Export dialog box, select the Xbase radio button.
In the File Name box of the Input tab, enter a name for the output file.
You can also use the […] button to bring up an Export To: file dialog box so that you can select the name and location of the Export file.
Xbase Options
Export Band
Choose the radio button that corresponds to the export band line. For headers and footers you will also select a Group field.
Notes:
Xbase export only includes the computed and data fields that are on the selected band line. It does not include any memo fields. Since a standard Xbase table only supports 10 character field names, R&R may need to truncate the field names. If there are fields on the selected export band line where the first 10 characters of the field name are duplicated, before the Export is performed, R&R will issue a warning dialog that will list the duplicates that will not be exported. You can then alternatively cancel the export, create calculated fields to replace the duplicate fields and then perform the export again.
Xbase export is limited to 255 fields, maximum field name length of 10 characters, and a maximum field size of 254 characters.
Click the Export button to create the Xbase file.

Chapter 17: Exporting Data
R&R ReportWorks SQL User Manual Page 578
Exporting to Result Set (.dbf)
A result set consists of all of the active report fields from composite records that are built internally by Report Designer. The result set export proceeds like the existing Xbase export function, except that all of the fields in use within the report are generated, not just those placed within the layout on a designated band.
To export report data to a Result Set database, do the following:
On the File>-Export dialog box, select the Result Set radio button.
In the File Name box of the Input tab, enter a name for the output file.
You can also use the […] button to bring up an Export To: file dialog box so that you can select the name and location of the Export file.
Result Set Options
Export Band
Choose the radio button that corresponds to the export band line. For headers and footers you will also select a Group field. For a result set, the values of the exported fields will be derived as if they were actually placed on the export band line even though their actual usage may be in another part of the report.
Note:
Result set export only includes the computed and data fields that are used in the report. It does not include any memo fields. Since a standard Xbase table only supports 10 character field names, R&R may need to truncate the field names. If there are fields on the selected export band line where the first 10 characters of the field name are duplicated, before the Export is performed, R&R will issue a warning dialog that will list the duplicates that will not be exported. You can then alternatively cancel the export, create calculated fields to replace the duplicate fields and then perform the export again.
Click the Export button to create the Result Set file.
Additional information about exporting to result set is provided in the following sections:
• Using the Result Set Viewer
• The Result Set Database

Chapter 17: Exporting Data
R&R ReportWorks SQL User Manual Page 579
Using the Result Set Viewer
When you are working in Report Designer, the layout screen allows you to place and format fields and Print Preview allows you to preview the resulting field output.
But sometimes it is useful in the design process to be able to view the all the data elements that contribute to the report in a tabular format. The result set viewer can assist both novice and experienced users to understand how various reporting functions (sorting, linking, grouping, calculations, etc.) impact the finished report. For example you may be developing a report that contains summary information by department any may want to verify the detail records that are contributing to the totals. Since group totals are shown, as well as all the detailed data on which the report is based, you can observe how each final piece of information within the report is derived. Since you can easily add fields to the result set (by simply placing the desired field on the report layout) this feature provides added flexibility. By providing a viewing utility for all fields in use, consultants, developers and technical support personnel can better troubleshoot reports.

Chapter 17: Exporting Data
R&R ReportWorks SQL User Manual Page 580
The Result Set Database
The Result Set Browser will only allow you to read records. No changes to the result set data records can be made. The column names for the result set do not include the file alias qualifiers that Report Designer assigns to field names that appear in more than one table used in the report. If there is more than one instance of a field name, the Result Set Browser will only contain the first occurrence of that field name. For example, if the same field name exists in two related tables within a report, and both are used, only the first occurrence based on the Result Set Browser engine will be placed in the result set. This is the same behavior that is found in all band based export formats in Report Designer. Also, if the same field is presented in the report more than once, but with different properties (such as different field widths), the first occurrence in band order will take precedence.
Fields appear in the result set in the order they appear on the report, from top-left to bottom-right. The Result Set will also include any fields that are used within the report but not on the layout such as within Sort, Group or Query.
The result set field sizes correspond to the R&R presentation widths, and values in undersized numeric fields will present as "***", as will invalid data. Dates are presented as MM/DD/YYYY (or alternate DD/MM/YYYY based on your regional setting). Memo fields are not included. The Result Set Browser is limited to 255 fields, maximum field name length of 10 characters, and a maximum field size of 254 characters.
Since the Result Set Browser is an extension of the DBF export function, the default band line that is presented in the Result Set Browser is a record band. If your report does not contain a record band line, the result set browser will display only field names with empty detail lines. To avoid this problem you can add a record band line to the report and then use either the menu choice Format Record
Layout to Suppress Record Band Lines or Click the button on the Formatting Toolbar so that this band is not actually printed.

Chapter 17: Exporting Data
R&R ReportWorks SQL User Manual Page 581
Exporting to a Worksheet File
Export to DBF enables you to export a single band line type to a Worksheet (*.XLS) table. You can then use this worksheet in spreadsheet program such as Microsoft Excel.
To create an Worksheet file:
On the File>-Export dialog box, select the Worksheet radio button.
In the File Name box of the Input tab, enter a name for the output file.
You can also use the […] button to bring up an Export To: file dialog box so that you can select the name and location of the Export file.
Worksheet Options
Export Band
Choose the radio button that corresponds to the export band line. For headers and footers you will also select a Group field.
Note:
Worksheet export only includes the computed and data fields that are on the selected band line. It does not include any memo fields. The exported worksheet is done as data only and will not include any font/format information from the report.
Click the Export button to create the worksheet file.

Chapter 17: Exporting Data
R&R ReportWorks SQL User Manual Page 582
Exporting to a Text Data File
Export to Text Data File enables you to export report data to a text file using one of several separators or delimiters.
To create a Text Data file:
On the File>-Export dialog box, select the Text Data radio button.
This will enable an additional set of radio buttons where you can select a text data file type.
Comma Delimited Each field on the line is separated by a single comma
Tab Delimited Each field on the line is separated by a single tab
Character Delimited
Each field on the line is separated by the character specified in the Options tab
SDF Fixed Width Data will be exported using the field widths defined in the report
In the File Name box of the Input tab, enter a name for the output file.
You can also use the […] button to bring up an Export To: file dialog box so that you can select the name and location of the Export file.
Text Data Export Options
Export Band
Choose the radio button that corresponds to the export band line. For headers and footers you will also select a Group field.
Text Options Check the Add Quote Delimiter box to surround each exported field value in quotes.
Check the Use Field Names on First Line box to include field names as column headings on the first line of the export file.
Check the Use DOS (PC) Character Set" box to use the DOS character set instead of the Windows (ANSI) character set.
If Character Delimited was selected as the export type, enter the character separator that will be placed between each field.
Note that all numeric data is exported in Fixed numeric format and all date/datetime data is exported in Windows International format. To retain either numeric or date/datetime field formats as they are specified in the report, you can include one or both of the following entries in the [Export] section of RRW.INI:
CSVKeepNumFormats=1
CSVKeepDateFormats=1
Click the Export button to create the text data file.

Chapter 17: Exporting Data
R&R ReportWorks SQL User Manual Page 583
Setting Mail Options
The Send via MAPI checkbox on the Export Mail Options tab enables you to export HTML, Result set, Text, RTF, Word Merge, Xbase, or worksheet files as mail attachments.
This option is available only if you have MS Mail or another email application that supports MAPI (Messaging Applications Programming Interface). This box will be dimmed if you do not have MAPI available on your machine.
By checking this box the Mail Options dialog expands to provide a number of options that will cause Report Writer to invoke your mail application and attach the exported file to a mail message. Using the choices on this tab you can enable advanced MAPI properties such as automatically sending a report in background or bursting sections of a report to different mail recipients.

Chapter 17: Exporting Data
R&R ReportWorks SQL User Manual Page 584
When you then select the Export file button, the file is created just as it would be if MAPI were not enabled. But once the file is complete, it is then send to the MAPI package where an email message is created with the export file as an attachment.
Email Address/Send Options
There are 3 available addressing radio buttons.
Send Single File to New Email Message
Select this option send the entire report to a single email message. When the file export is complete mail message is created automatically and is sent to your default MAPI client application as a new but un-sent message that includes the exported file.
Address and Auto-Send Single File
When this option is selected, the entire report is sent to a single email message that is immediately sent to the Outbox of the default MAPI client. The Send To recipient is specified in the Send To: box that is immediately below the Address and Auto Send radio button.
In the Send To: box you can enter a single recipient or can enter a list of email recipients separating each one with a semicolon.
Examples:

Chapter 17: Exporting Data
R&R ReportWorks SQL User Manual Page 585
When the Export button is selected from the export dialog, the export file will be created and when complete will be attached to the mail message using the Send to recipient and will immediately sent for delivery without first presenting the mail message to the display.
Address and Auto-Send Burst Files
The Address and Auto-Send Burst Files radio button will only be available if the report has at least one Group level set with the Reset Page Option checked. (This requirement allows Report Designer to determine the break point for each mail attachment.) Note that these buttons will only appear for if the current selected export format is HTML, RTF and Text.
The Burst Level drop down boxes allows you to select the break point for reports that will be sent as multiple mail messages.
The criterion Report Designer uses to determine how to divide a report into sections is to evaluate the Group field option of Reset Page as a bursting flag. The Send Burst Report radio button will only be available if the report has at least one Group level set with the Reset Page Option checked. In the example below there are 3 group fields; however, only two of these fields have Reset Page enabled.
Figure 17.19 Group Order with Reset Page Enabled

Chapter 17: Exporting Data
R&R ReportWorks SQL User Manual Page 586
The Mail Options Burst Level choices then become the two Reset Page Group levels.
Figure 17.20 Send Burst Report Enabled
The Send To text box below the burst level allows you select a field that contains a valid email address. The Send To field works in conjunction with the group Burst level. The Burst level determines the break point for creating a new report attachment and email message. The value of the Send To field at that break point will determine the Send to address for that portion of the report. The value of the Send To field will be the value of the field as it would appear in the Group footer for that Group level. The contents of the field selected as the Send To field should be a valid email address or list of email addresses separated by a comma. If an empty field is encountered during export execution, an error message will appear.
In a burst report, each section of the report is automatically sent to a specific email recipient. For example, you might run a weekly sales by division report and want to email the figures for each division to the sales manager for that region. Burst reports require two basic elements. The first is to determine how to section the report into separate mail messages. The second is to determine the mail recipient for each of those sections.
When sending a burst report, there are several report elements that will behave differently than if each group report were created separately.
These differences are:
• Any title band will be included only with the first burst file.
• Any summary band information will not be included in a burst report.
• Any group footers at a higher level than the burst level will be ignored.
• Page headers/footers will be included.
When the Export button is selected from the export dialog, the export file will be created for the first burst level and when complete will be attached to the mail message using the Send to recipient and will immediately sent for delivery. This process will then be repeated for each burst field value with the same export file name being re-used but with its contents updated for each burst field value.
When the Export completes, the contents of the export file will be that of the last burst field grouping.
If you are bursting a lengthy report and want to verify the contents of the file attachments, you may want to configure your MAPI software so that contents are held for delivery in the Outbox. This will allow you to view the contents/addresses of the Report Designer mail messages prior to sending them.

Chapter 17: Exporting Data
R&R ReportWorks SQL User Manual Page 587
NOTE: If you make MAPI selections and then close and re-open the Export dialog, the Send via MAPI box will return to the default value of unchecked. However any Mail Options are retained. If you again check the Send via MAPI box and return to the Mail Options screen, your last selections will still be present. These settings will also be retained when you save and re-open the report.
Optional Subject and Message Settings
The optional subject and message settings can be used with any of the available Send/Address options.
You can use the […] field selection buttons to select a character field whose value will be used for the subject and message in the generated email or you can manually enter a subject and message into the available text boxes.
The field selection feature is particularly useful in burst reports since it allows you to create a custom subject and message for each email recipient.
Chapter 17: Exporting Data
R&R ReportWorks SQL User Manual Page 588
Exporting to OLE
Exporting to an Excel 5.0 Chart
Report Designer also employs Object Linking and Embedding (OLE) automation to coordinate with Excel 5.0 in the creation of charts. When you select Excel Chart as the export type and specify the data elements of the chart, Report Designer generates the data and causes a chart to be created in Excel.
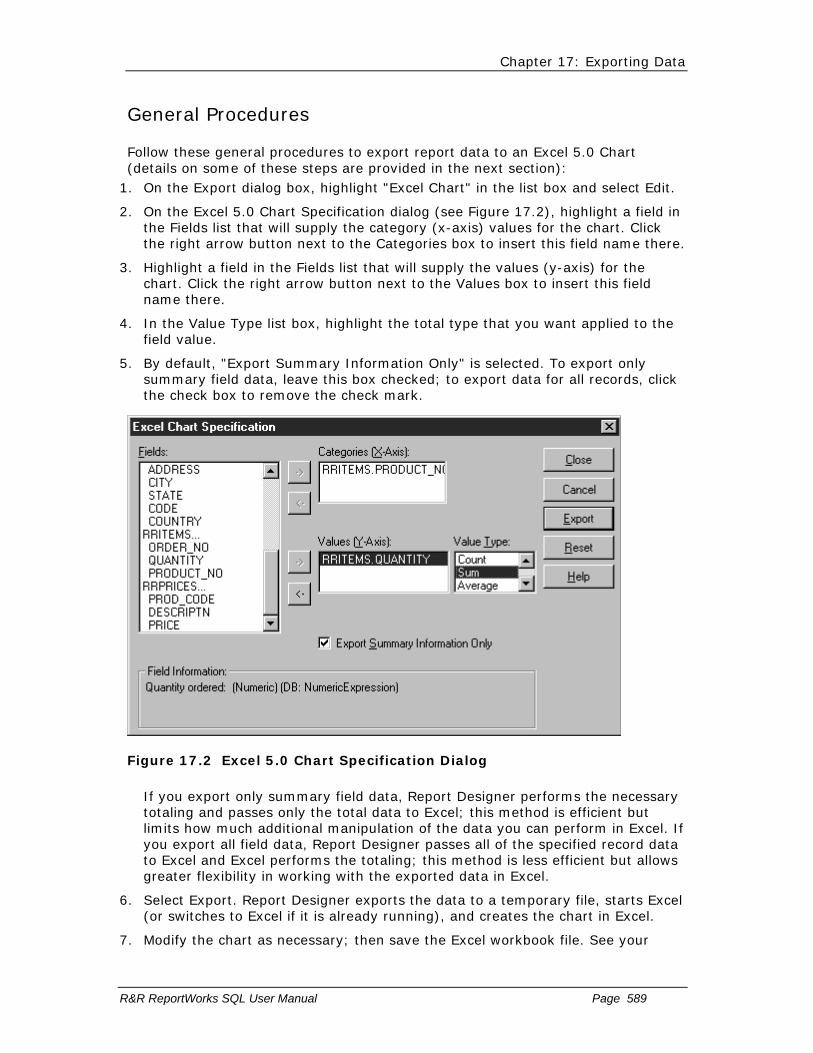
Chapter 17: Exporting Data
R&R ReportWorks SQL User Manual Page 589
General Procedures
Follow these general procedures to export report data to an Excel 5.0 Chart (details on some of these steps are provided in the next section):
1. On the Export dialog box, highlight "Excel Chart" in the list box and select Edit.
2. On the Excel 5.0 Chart Specification dialog (see Figure 17.2), highlight a field in the Fields list that will supply the category (x-axis) values for the chart. Click the right arrow button next to the Categories box to insert this field name there.
3. Highlight a field in the Fields list that will supply the values (y-axis) for the chart. Click the right arrow button next to the Values box to insert this field name there.
4. In the Value Type list box, highlight the total type that you want applied to the field value.
5. By default, "Export Summary Information Only" is selected. To export only summary field data, leave this box checked; to export data for all records, click the check box to remove the check mark.
Figure 17.2 Excel 5.0 Chart Specification Dialog
If you export only summary field data, Report Designer performs the necessary totaling and passes only the total data to Excel; this method is efficient but limits how much additional manipulation of the data you can perform in Excel. If you export all field data, Report Designer passes all of the specified record data to Excel and Excel performs the totaling; this method is less efficient but allows greater flexibility in working with the exported data in Excel.
6. Select Export. Report Designer exports the data to a temporary file, starts Excel (or switches to Excel if it is already running), and creates the chart in Excel.
7. Modify the chart as necessary; then save the Excel workbook file. See your
Chapter 17: Exporting Data
R&R ReportWorks SQL User Manual Page 590
Excel documentation for detailed information about using Excel.
Note that the Excel 5.0 Chart settings are saved with the report, but that any changes you make to the chart in Excel will not be reflected in the report.
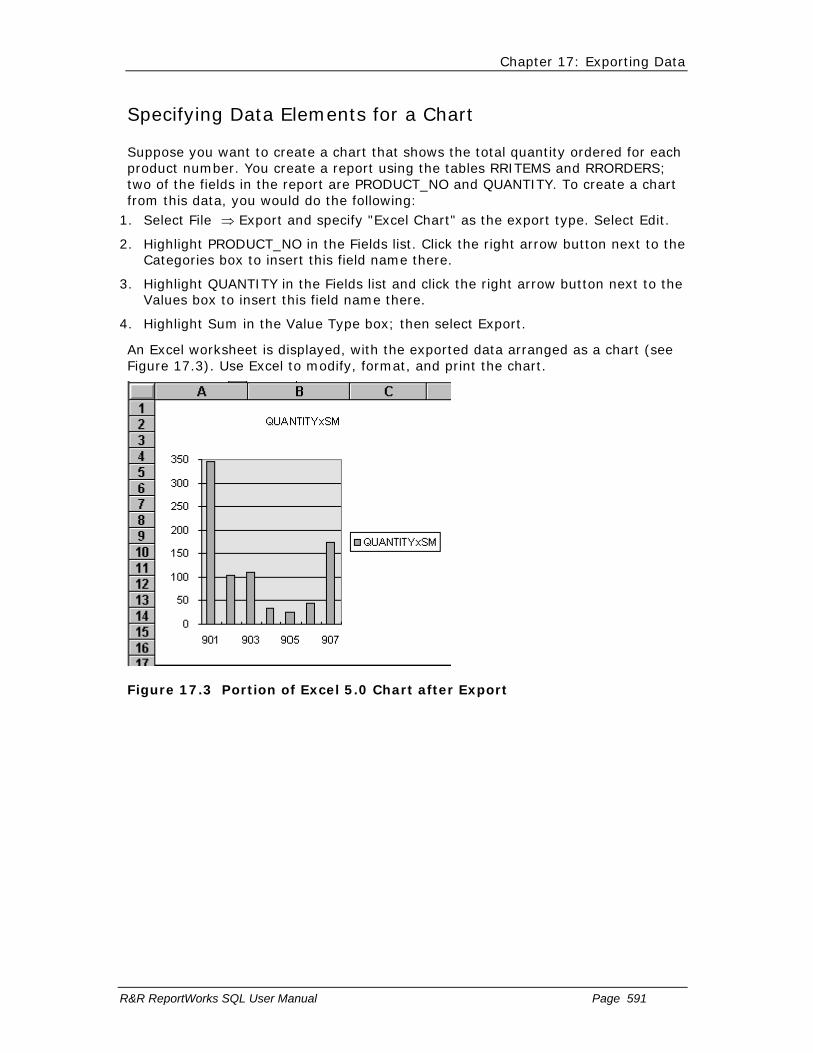
Chapter 17: Exporting Data
R&R ReportWorks SQL User Manual Page 591
Specifying Data Elements for a Chart
Suppose you want to create a chart that shows the total quantity ordered for each product number. You create a report using the tables RRITEMS and RRORDERS; two of the fields in the report are PRODUCT_NO and QUANTITY. To create a chart from this data, you would do the following:
1. Select File ⇒ Export and specify "Excel Chart" as the export type. Select Edit.
2. Highlight PRODUCT_NO in the Fields list. Click the right arrow button next to the Categories box to insert this field name there.
3. Highlight QUANTITY in the Fields list and click the right arrow button next to the Values box to insert this field name there.
4. Highlight Sum in the Value Type box; then select Export.
An Excel worksheet is displayed, with the exported data arranged as a chart (see Figure 17.3). Use Excel to modify, format, and print the chart.
Figure 17.3 Portion of Excel 5.0 Chart after Export

Chapter 17: Exporting Data
R&R ReportWorks SQL User Manual Page 592
Exporting to an Excel 5.0 PivotTable
Report Designer employs Object Linking and Embedding (OLE) automation to coordinate with Excel 5.0 in the creation of crosstab reports. When you select Excel PivotTable as the export type and specify the data elements of the crosstab, Report Designer generates the data and causes a PivotTable to be created in Excel.

Chapter 17: Exporting Data
R&R ReportWorks SQL User Manual Page 593
General Procedures
Follow these general procedures to export report data to an Excel 5.0 PivotTable (details on some steps are provided in the next section):
1. On the Export dialog box, highlight "Excel PivotTable" in the list box and select Edit.
The Excel PivotTable Specification dialog shown in Figure 17.4 displays.
2. Select one or more fields in the Fields list box to be inserted as a Row label, Column label, or table cell value in the crosstab (see the next section of this chapter for information on each of these steps).
Figure 17.4 Excel PivotTable Specification Dialog
3. By default, "Export Summary Information Only" is selected. To export only summary field data, leave this box checked; to export all field data, click the check box to remove the check mark.
If you export only summary field data, Report Designer performs the necessary totaling and passes only the total data to Excel; this method is efficient but limits how much additional manipulation of the data you can perform in Excel. If you export all field data, Report Designer passes all of the specified record data to Excel and Excel performs the totaling; this method is less efficient but allows greater flexibility in working with the exported data in Excel.
4. Select Export. Report Designer exports the data to a temporary file, starts Excel (or switches to Excel if it is already running), and creates the PivotTable in

Chapter 17: Exporting Data
R&R ReportWorks SQL User Manual Page 594
Excel.
5. Modify the PivotTable as necessary; then save the Excel workbook file. See your Excel documentation for detailed information about using Excel.
Note that the Excel 5.0 PivotTable settings are saved with the report, but that any changes you make to the PivotTable in Excel will not be reflected in the report.

Chapter 17: Exporting Data
R&R ReportWorks SQL User Manual Page 595
Specifying Labels and Cell Data for the Crosstab
The fields that you select using the buttons next to the Columns and Rows boxes on the PivotTable dialog become the labels for the x- axis (Columns) and y- axis (Rows) of the resulting crosstab. The combination of the field that you insert in the Values box and the Value Type you specify for that field supplies the values for the crosstab cells.
Take the simple example of a report that draws data from three tables, RRORDERS, RRPRICES, and RRITEMS. Suppose you want to create a crosstab that uses product descriptions as the row labels and order dates as the column labels. Suppose also that you have defined a calculated field call ORDER_TOT that multiplies quantity times unit price.
Your goal is to create a crosstab that uses product descriptions as the row labels and order dates as the column labels and that inserts the total order amount for each date in the crosstab cells.
After creating a report that provides the necessary field values, you would do the following to create such a crosstab:
1. Select File ⇒ Export and specify "Excel PivotTable" as the export type. Select Edit.
2. On the Excel PivotTable Specification dialog (see Figure 17.4), all fields from the report’s composite record structure are shown in the Fields list box. In the Fields list box, highlight the field that you want to supply values for the Column labels (in this case, the DATE field) and click the right arrow button next to the Columns box.
3. In the Fields list box, highlight the field that you want to supply values for the Row labels (in this case, the DESCRPTN field, which contains the product names) and click the right arrow button next to the Rows box.
4. In the Fields list box, highlight the field that you want to serve as the basis for the crosstab cell data (in this case, the ORDER_TOT field) and click the right arrow button next to the Values box. Then in the Value Type box select the total type that you want applied to the field value (in this case, Sum).
5. Select Export. Report Designer exports the data to a temporary file and launches Excel (or switches to it if it is already running). The OLE Driver dialog displays a series of informational prompts ("Starting PivotTable Module," "Reading in Exported Data," and "Creating PivotTable") as the crosstab is set up in Excel.
6. An Excel worksheet is displayed, with the exported data arranged as a PivotTable (see Figure 17.5). Use Excel to modify, format, and print the crosstab.
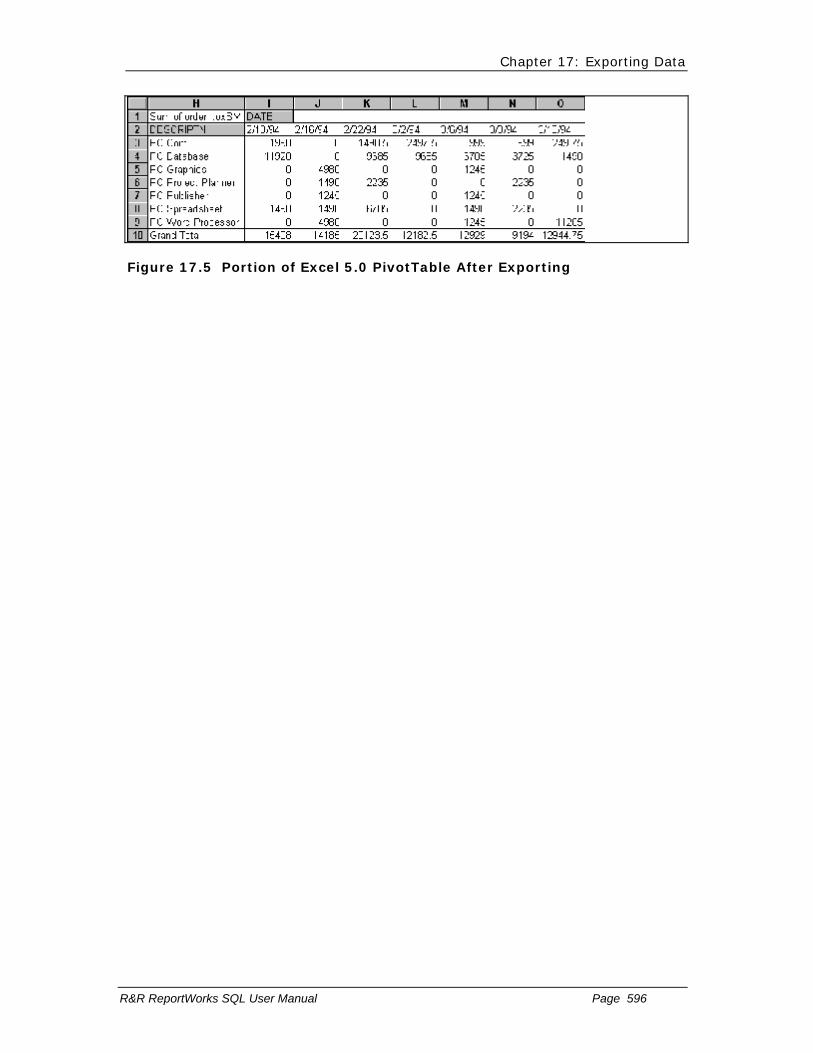
Chapter 17: Exporting Data
R&R ReportWorks SQL User Manual Page 596
Figure 17.5 Portion of Excel 5.0 PivotTable After Exporting

Chapter 18 Creating User-SQL Reports
Introduction (Creating User-SQL Reports)
This chapter explains how to create a User-SQL report by selecting File ⇒ New User SQL and then entering and modifying a SELECT statement. This information is presented in the following sections:
Entering the SELECT Statement
Executing a Stored Procedure
Modifying the SELECT Statement
Special Features of User-SQL Reports
A User-SQL report is one that you create by entering the appropriate SQL SELECT
statement (or a string to execute a stored procedure) instead of by selecting master and related tables from Report Designer menus. If you are an experienced SQL user, this method of creating reports provides some advantages over Auto-SQL reports:
Since almost all processing of data is done on the network server, User-SQL reports can be faster and more efficient.
You can perform certain operations (such as creating a report based on a union) through the SELECT statement that you do not have access to in an Auto-SQL report.
You can use the SELECT statement that Report Designer builds for an Auto-SQL report as the starting point for developing a User-SQL report (see the Copying an Auto-SQL SELECT Statement section). After you create a User-SQL report, you can edit the SELECT statement, which is saved with the report. Note that you cannot convert an Auto-SQL report (one created by selecting master and related tables) into a User-SQL report.
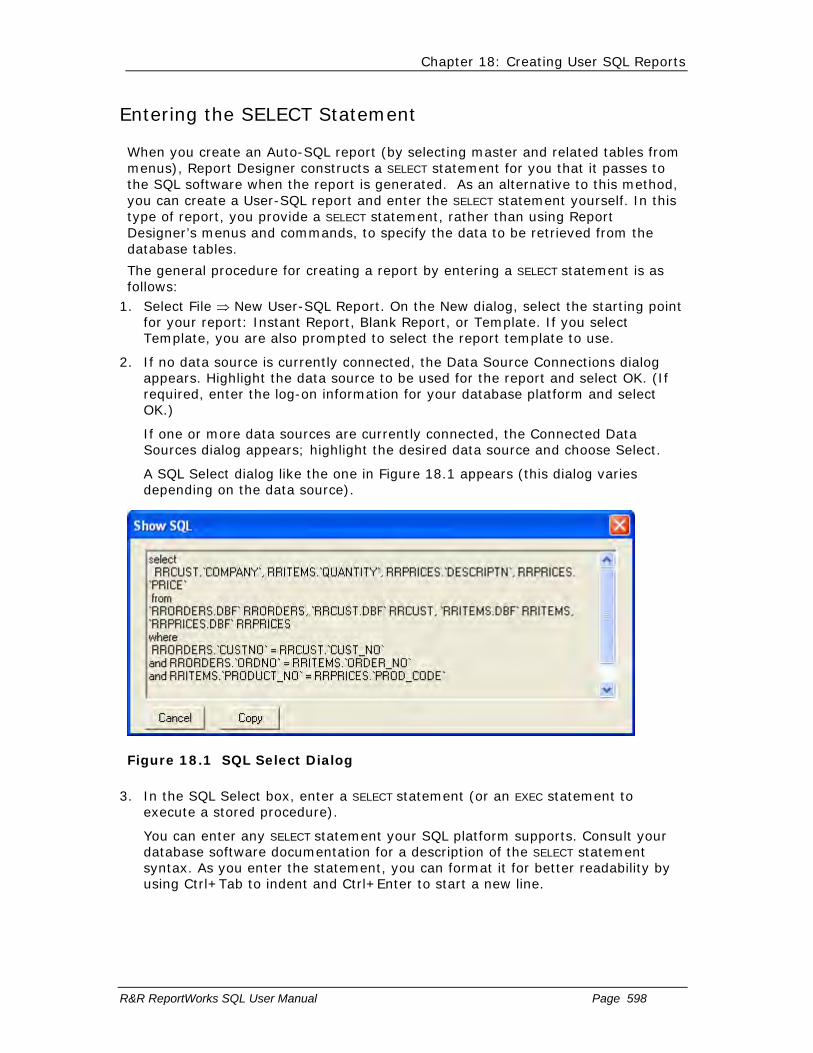
Chapter 18: Creating User SQL Reports
R&R ReportWorks SQL User Manual Page 598
Entering the SELECT Statement
When you create an Auto-SQL report (by selecting master and related tables from menus), Report Designer constructs a SELECT statement for you that it passes to the SQL software when the report is generated. As an alternative to this method, you can create a User-SQL report and enter the SELECT statement yourself. In this type of report, you provide a SELECT statement, rather than using Report Designer’s menus and commands, to specify the data to be retrieved from the database tables.
The general procedure for creating a report by entering a SELECT statement is as follows:
1. Select File ⇒ New User-SQL Report. On the New dialog, select the starting point for your report: Instant Report, Blank Report, or Template. If you select Template, you are also prompted to select the report template to use.
2. If no data source is currently connected, the Data Source Connections dialog appears. Highlight the data source to be used for the report and select OK. (If required, enter the log-on information for your database platform and select OK.)
If one or more data sources are currently connected, the Connected Data Sources dialog appears; highlight the desired data source and choose Select.
A SQL Select dialog like the one in Figure 18.1 appears (this dialog varies depending on the data source).
Figure 18.1 SQL Select Dialog
3. In the SQL Select box, enter a SELECT statement (or an EXEC statement to execute a stored procedure).
You can enter any SELECT statement your SQL platform supports. Consult your database software documentation for a description of the SELECT statement syntax. As you enter the statement, you can format it for better readability by using Ctrl+Tab to indent and Ctrl+Enter to start a new line.
Chapter 18: Creating User SQL Reports
R&R ReportWorks SQL User Manual Page 599
4. When you finish entering the SELECT statement, select OK. If the SELECT statement contains an error, Report Designer or your SQL software will return an error message identifying the problem. In most cases, error messages returned by the SQL software include a code and short description of the error. For a more detailed explanation, see your database software documentation. After acknowledging the error, you will return to the SQL Select dialog, where you can make corrections.
5. Develop the report by defining the layout and formatting as necessary. When you finish, select File ⇒ Save to save the report.
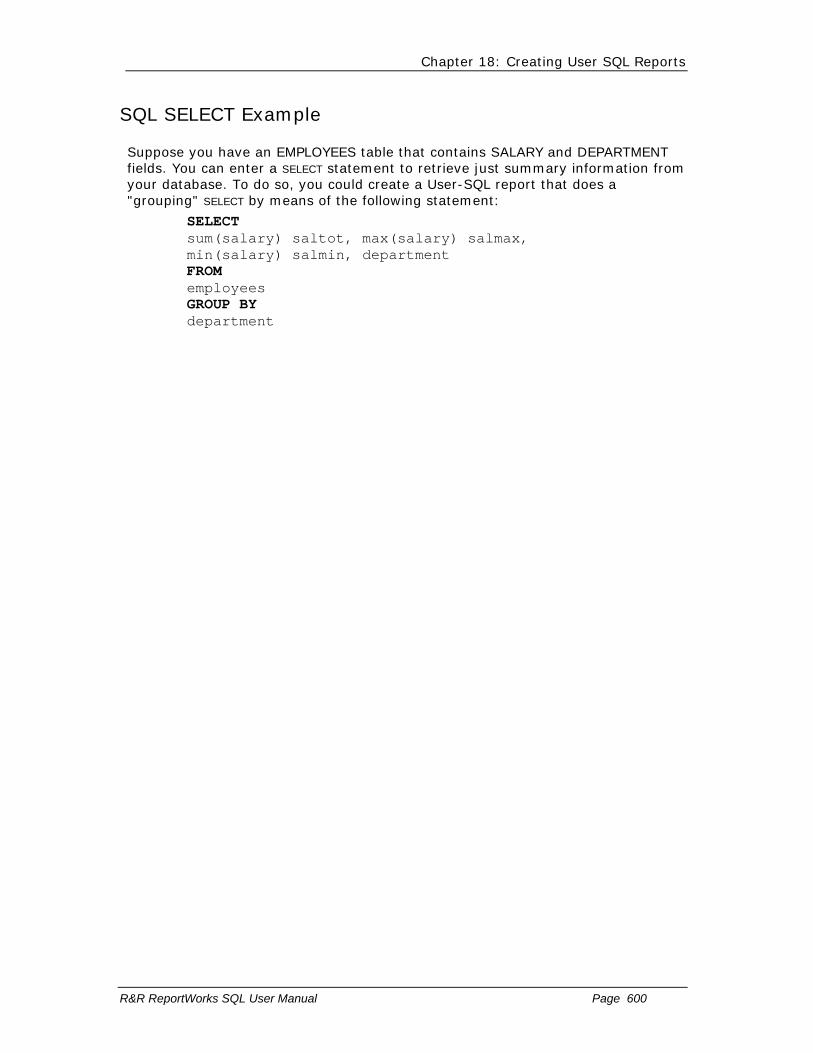
Chapter 18: Creating User SQL Reports
R&R ReportWorks SQL User Manual Page 600
SQL SELECT Example
Suppose you have an EMPLOYEES table that contains SALARY and DEPARTMENT fields. You can enter a SELECT statement to retrieve just summary information from your database. To do so, you could create a User-SQL report that does a "grouping" SELECT by means of the following statement:
SELECT sum(salary) saltot, max(salary) salmax, min(salary) salmin, department FROM employees GROUP BY department

Chapter 18: Creating User SQL Reports
R&R ReportWorks SQL User Manual Page 601
Copying an Auto-SQL SELECT Statement
Instead of entering a SELECT statement "from scratch," you can copy the SELECT statement from a previously developed Auto-SQL report and modify it as necessary.
To copy a SELECT from an Auto-SQL report and use it as the starting point of a User-SQL report, follow these steps:
1. Open the Auto-SQL report (select File ⇒ Open or press Ctrl+O) and select Database ⇒ Show SQL.
2. In the Show SQL dialog, select Copy (or press Ctrl+C). The entire statement is copied to the Windows Clipboard. Select OK.
3. Select File ⇒ New User-SQL and select the starting point for your report: Instant Report, Blank Report, or Template. Select the data source to be used for the report.
4. The SQL Select dialog appears. Select Paste (or press Ctrl+V) to paste the statement from the Clipboard to the SQL Select dialog.
5. Modify the statement as necessary; then select OK.

Chapter 18: Creating User SQL Reports
R&R ReportWorks SQL User Manual Page 602
Assigning Field Aliases
When you run a User-SQL report, Report Designer sends the SELECT statement you constructed to your database software, which executes the SELECT and returns the results to Report Designer. Report Designer requires that each field resulting from the SELECT have a valid, unique name. Therefore, field aliases are automatically assigned to any derived or aggregate fields returned by the statement.
The automatically generated fields aliases are in the form Col<number>, where <number> is the column position of the relevant column in the result set, starting with the number 1.
You can assign your own aliases for such fields by specifying the aliases in the SELECT statement. For those databases that do not directly support assigning of field aliases in a SELECT statement, Report Designer provides an alternate syntax for entering the statement. The following sections explain how to assign field aliases both in databases that support aliases and in those that do not (consult your database documentation to determine whether your database software supports assigning of field aliases).
Note that if any duplicate field aliases are returned by the statement, you must assign aliases for those fields to ensure that each field has a unique name. Report Designer will not automatically assign aliases for such fields.

Chapter 18: Creating User SQL Reports
R&R ReportWorks SQL User Manual Page 603
SQL Platforms that Support Field Aliases
You can ensure that fields returned by the SELECT statement have valid, unique names by assigning an alias to each table field, derived field, or aggregate field.
For example, the following statement retrieves the "fname" and "lname" fields from the "instrctr" table and assigns them the aliases "first" and "last" respectively:
SELECT fname first, lname last FROM instrctr
You can accomplish the same thing for a derived field. The following statement retrieves from the "instrctr" table a single derived field with the alias "both":
SELECT fname+lname both FROM instrctr
If you do not explicitly assign field aliases, Report Designer automatically assigns them if necessary. The automatically generated fields aliases are in the form Col<number>, where <number> is the column position of the relevant column in the result set.
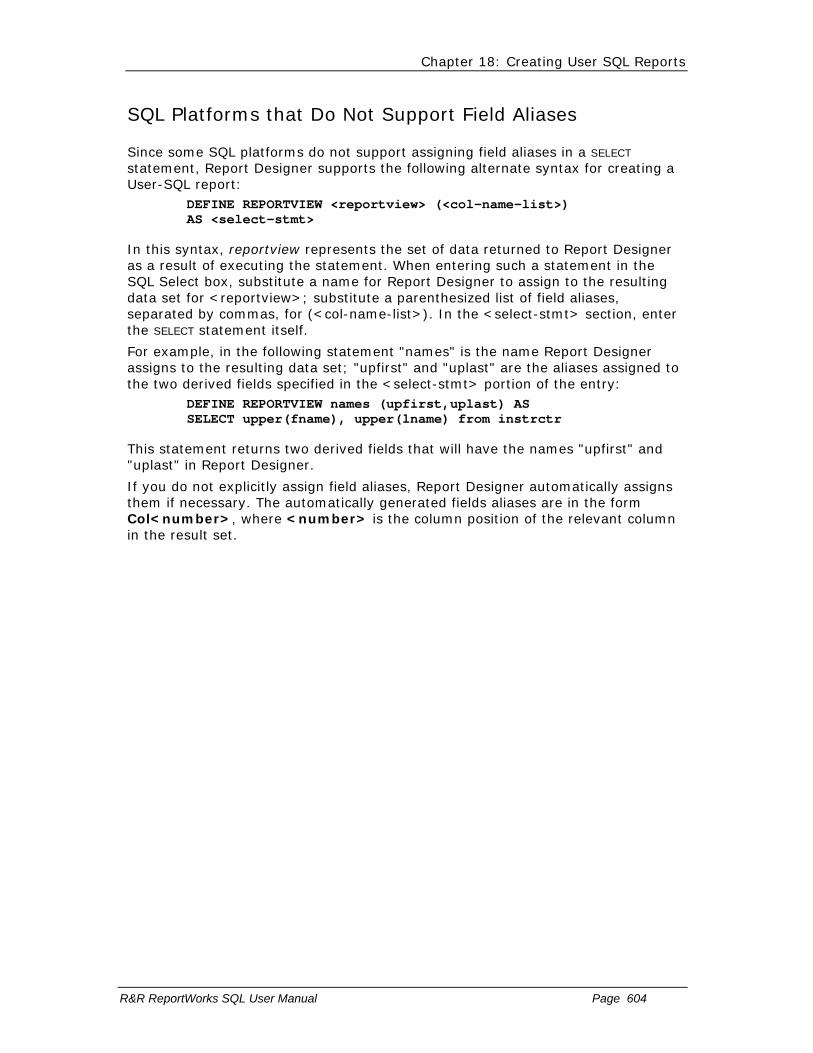
Chapter 18: Creating User SQL Reports
R&R ReportWorks SQL User Manual Page 604
SQL Platforms that Do Not Support Field Aliases
Since some SQL platforms do not support assigning field aliases in a SELECT statement, Report Designer supports the following alternate syntax for creating a User-SQL report:
DEFINE REPORTVIEW <reportview> (<col-name-list>) AS <select-stmt>
In this syntax, reportview represents the set of data returned to Report Designer as a result of executing the statement. When entering such a statement in the SQL Select box, substitute a name for Report Designer to assign to the resulting data set for <reportview>; substitute a parenthesized list of field aliases, separated by commas, for (<col-name-list>). In the <select-stmt> section, enter the SELECT statement itself.
For example, in the following statement "names" is the name Report Designer assigns to the resulting data set; "upfirst" and "uplast" are the aliases assigned to the two derived fields specified in the <select-stmt> portion of the entry:
DEFINE REPORTVIEW names (upfirst,uplast) AS SELECT upper(fname), upper(lname) from instrctr
This statement returns two derived fields that will have the names "upfirst" and "uplast" in Report Designer.
If you do not explicitly assign field aliases, Report Designer automatically assigns them if necessary. The automatically generated fields aliases are in the form Col<number>, where <number> is the column position of the relevant column in the result set.
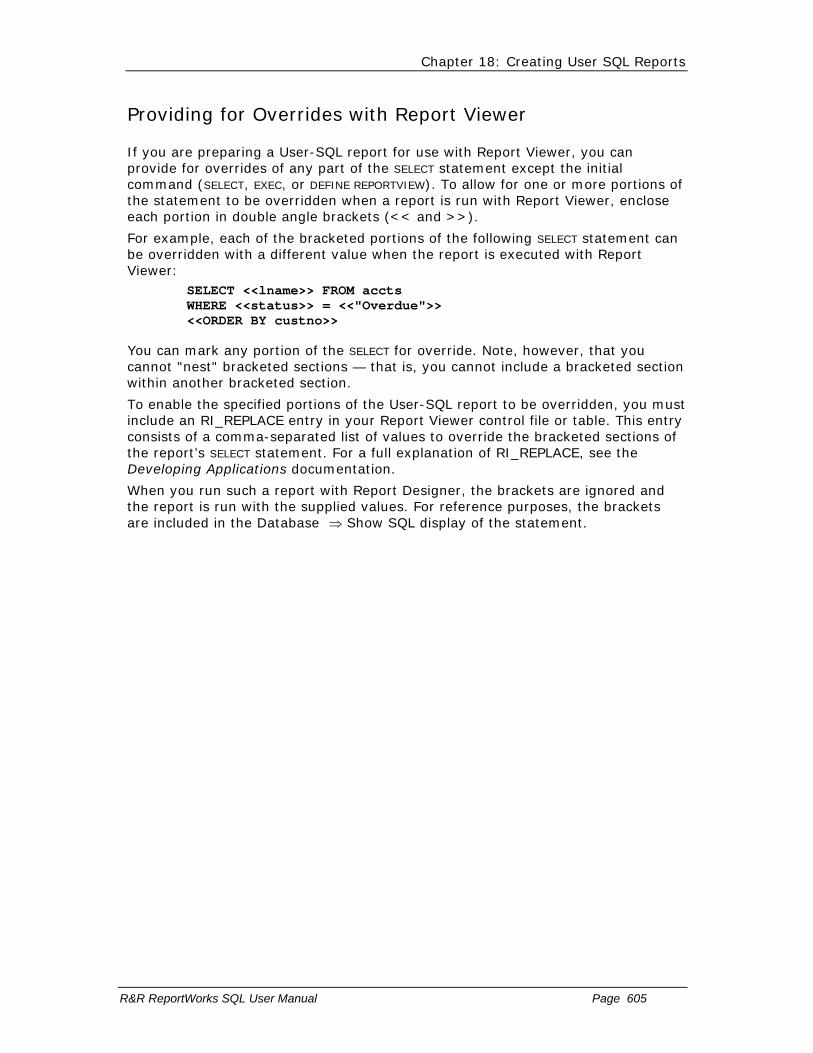
Chapter 18: Creating User SQL Reports
R&R ReportWorks SQL User Manual Page 605
Providing for Overrides with Report Viewer
If you are preparing a User-SQL report for use with Report Viewer, you can provide for overrides of any part of the SELECT statement except the initial command (SELECT, EXEC, or DEFINE REPORTVIEW). To allow for one or more portions of the statement to be overridden when a report is run with Report Viewer, enclose each portion in double angle brackets (<< and >>).
For example, each of the bracketed portions of the following SELECT statement can be overridden with a different value when the report is executed with Report Viewer:
SELECT <<lname>> FROM accts WHERE <<status>> = <<"Overdue">> <<ORDER BY custno>>
You can mark any portion of the SELECT for override. Note, however, that you cannot "nest" bracketed sections — that is, you cannot include a bracketed section within another bracketed section.
To enable the specified portions of the User-SQL report to be overridden, you must include an RI_REPLACE entry in your Report Viewer control file or table. This entry consists of a comma-separated list of values to override the bracketed sections of the report’s SELECT statement. For a full explanation of RI_REPLACE, see the Developing Applications documentation.
When you run such a report with Report Designer, the brackets are ignored and the report is run with the supplied values. For reference purposes, the brackets are included in the Database ⇒ Show SQL display of the statement.

Chapter 18: Creating User SQL Reports
R&R ReportWorks SQL User Manual Page 606
Executing a Stored Procedure
If the SQL platform you are using supports the use of stored procedures, you can enter a statement to execute a stored procedure to retrieve data for a report. Report Designer will use only the results returned by the first SELECT in the stored procedure and will ignore any subsequent return values from the stored procedure.
Improving Performance with Stored Procedures
If you have a User-SQL report that calls a SQL Server stored procedure, you may notice a delay when reading the report, especially if the stored procedure is complex. This delay occurs because Report Designer must execute the stored procedure to extract the resulting column definitions.
You can avoid this overhead and reduce report-reading time by providing Report Designer with field definitions. For each stored procedure you use with Report Designer, create a table in the same database with a name that consists of your stored procedure name preceded by the characters RSW_. For example, if your stored procedure is named myproc, create a table named RSW_myproc. This table’s column definitions must match exactly in name, number, and data type the columns that will be returned by the stored procedure.
When Report Designer reads a report that uses a stored procedure, it will first look for a table with that name in the database. If the table exists, Report Designer will use it for column definitions. Otherwise, it will execute the stored procedure to get the resulting column definitions.

Chapter 18: Creating User SQL Reports
R&R ReportWorks SQL User Manual Page 607
Modifying the SELECT Statement
After you enter a SELECT statement, you can use Database ⇒ SQL Select to edit it as necessary. If you are creating many similar reports, you can create and save a "template" report containing the basic SELECT statement, edit the SELECT statement, and then save the report with a different name.
To modify a previously entered SELECT statement: 1. Select Database ⇒ SQL Select (or the SQL button on the Standard Toolbar).
2. In the SQL Select box, edit the SELECT statement as necessary. You make changes here as you do in any edit box — to insert text, place the edit cursor where you want the text to start and begin typing; to delete text, press Backspace or Delete.
3. When you finish making changes, select OK. If the changes you made result in any fields being eliminated from the report, Report Designer will delete those fields and prompt for confirmation.

Chapter 18: Creating User SQL Reports
R&R ReportWorks SQL User Manual Page 608
Special Features of User-SQL Reports
In a User-SQL report, the following menu items (and their associated buttons) are disabled:
� Database ⇒ Sort (sorting is controlled by any ORDER BY clause in the SELECT statement itself).
� Database ⇒ Joins (table joins are specified in the SELECT statement).
Also, the Database ⇒ Master menu choice is replaced by Database ⇒ SQL Select. You can use this command (or the SQL button on the Standard Toolbar) to edit the SELECT statement.
Note that you can define a filter in a User-SQL report, but it will not be passed to the SQL software. Instead, Report Designer will apply the filter to the result of the user-specified SELECT.
Chapter 19 Creating Form Letters
Introduction (Creating Form Letter Reports)
This chapter explains how to create reports that merge data from your tables into memos stored in text files. Report Designer’s merge feature is useful for applications such as "mail merge" form letters. This explanation is presented in the following sections:
Introduction to Merging
Preparing Text for Merging
Attaching Files for Merging
Creating Merge Report Layouts
Features Affecting Merge Reports

Chapter 19: Creating Form Letters
R&R ReportWorks SQL User Manual Page 610
Introduction to Merging
A merge report is like any other report: you create it by selecting a master table that provides data such as names and addresses, by defining database joins as necessary to make information from other tables available, and by creating a layout.
The unique feature of these reports is that in addition to having database fields, they also include memo fields drawn from text files. These memo fields can be straight text or, more commonly, they can be text combined with data drawn from your tables.
The text used in a merge report comes from one or more memos stored in an unformatted text file (most word processing programs provide a "Text" or "Text Only" option for saving files). In order to provide text for a report, the memos stored in the text file must follow the conventions explained in this chapter. The file must also be associated with the report by using Insert ⇒ Text File.
After a text file has been associated with a report, the text it contains becomes one or more memo fields available for use in the report.
The following sections explain how to prepare text for merging, associate text files with your report, and insert the resulting memo fields on your report layout.

Chapter 19: Creating Form Letters
R&R ReportWorks SQL User Manual Page 611
Preparing Text for Merging
Text included in a report, for example the text that provides the body of a form letter, is provided by a single, unformatted text file that can contain one or more sections of related text, each of which is referred to as a memo. If your file contains only a single memo to be included in your report, you need not observe any special conventions in entering it. If your file contains more than one memo, you must follow these conventions in order for Report Designer to identify each memo:
� Identify each separate memo in the file by a name up to ten characters long. Precede the name with a period and enter it on a separate line before the text.
� Use the left brace, {, to mark the beginning of each memo and a right brace, }, to mark the end. The left brace must be the first character on the line that follows the memo field name.
For example, the first few lines of the FIRST memo might look like this: .first {This is the text that will be used as the first memo of a form letter. The text can be as long as you like.}
You can have any number of separate memos of any length in a text file. Be sure to give each memo a unique name.

Chapter 19: Creating Form Letters
R&R ReportWorks SQL User Manual Page 612
Including Field Data in Text
You can merge data from your tables into your memo text by including field names. You can also include the names of most calculated or total fields created in the report to which you will be attaching the memo file.
For example, the text for a form letter based on a customer table can include a reference to each customer’s state of residence in the body of the letter, as long as the composite record contains a state field. A form letter based on orders, items, and prices tables can include a reference to the total amount of each customer’s orders, as long as the amount is a field in one of the report tables or a calculated or total field.
To include a field name in a text file, type the field name where you want the data to appear. Enclose the field name within backslashes (e.g. \STATE\) to distinguish field names from the text. If you have more than one field with the same name, precede the name of each field with the table alias (for example,
\CUSTOMER·STATE\).
For example, to include the city and state name from a customer table in text that will be used in a form letter report, you might create a memo like the one illustrated in Figure 19.1 (the embedded field references are shown in bold for clarity).
In July, Eastern Computer Supply is offering a series of training seminars for all corporate customers in the \CITY\, \STATE\ area. The seminars will be held at the Hynes Convention Center in Boston on July 1-5. Each session will provide an introduction to one of our PC software products. For more information about the seminars, please fill out and return the enclosed information request form. Figure 19.1 Sample Text with Field Names
When you include this text in your report, the name of each customer’s city will replace \CITY\ and the state name will replace \STATE\. By creating a filter that selects only those customers who live in or near Boston (STATE in the list ("MA", "CT", "RI", "VT", "NH", "ME")), you can send personalized form letters to those customers. Figure 19.2 shows the type of form letter that will result.
Eastern Computer Supply, Inc. 04/29/2004 William Hickock 18 Cambridge Avenue Waltham, MA 01254 Dear William, In July, Eastern Computer Supply is offering a series of training seminars for all corporate customers in the Waltham, MA area. The seminars will be held at the Hynes Convention Center in Boston on July 1-5. Each session will provide an introduction to one of our PC software products. For more information about the seminars, please fill out and return the enclosed information request form. Sincerely, Joseph Wilson Training Coordinator

Chapter 19: Creating Form Letters
R&R ReportWorks SQL User Manual Page 613
421 Park Avenue Worcester, MA 01615 508-345-6686 Figure 19.2 Sample Merge Report
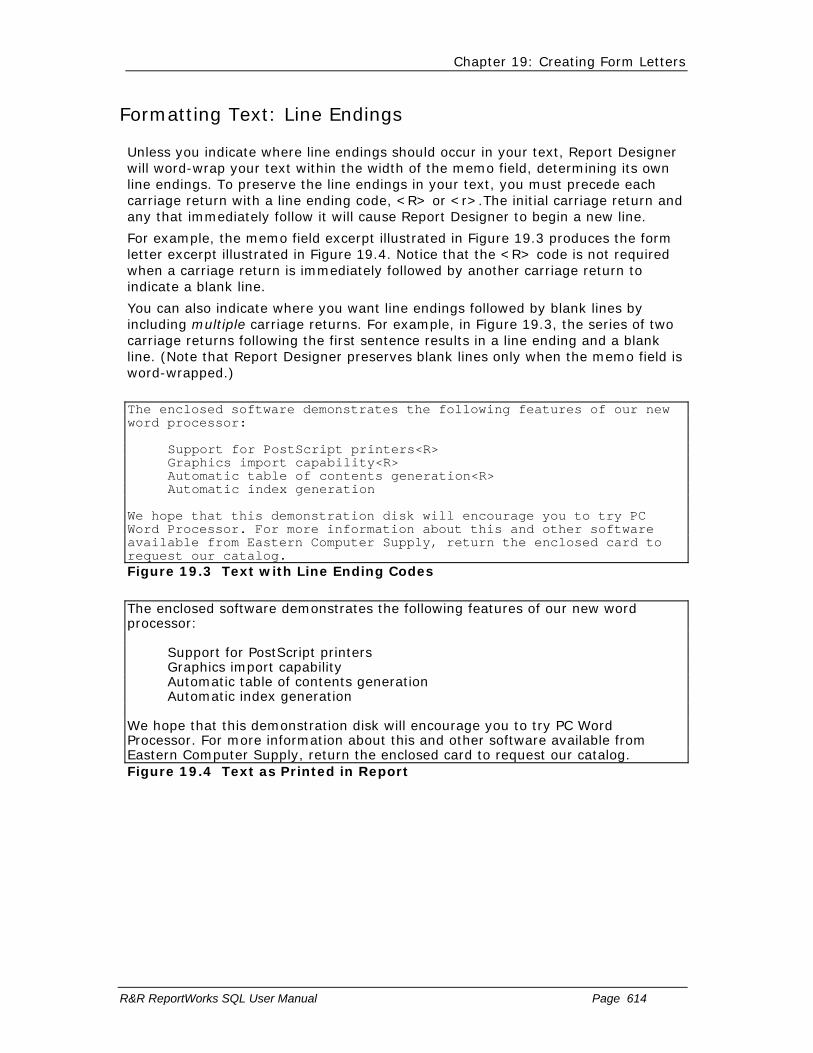
Chapter 19: Creating Form Letters
R&R ReportWorks SQL User Manual Page 614
Formatting Text: Line Endings
Unless you indicate where line endings should occur in your text, Report Designer will word-wrap your text within the width of the memo field, determining its own line endings. To preserve the line endings in your text, you must precede each carriage return with a line ending code, <R> or <r>.The initial carriage return and any that immediately follow it will cause Report Designer to begin a new line.
For example, the memo field excerpt illustrated in Figure 19.3 produces the form letter excerpt illustrated in Figure 19.4. Notice that the <R> code is not required when a carriage return is immediately followed by another carriage return to indicate a blank line.
You can also indicate where you want line endings followed by blank lines by including multiple carriage returns. For example, in Figure 19.3, the series of two carriage returns following the first sentence results in a line ending and a blank line. (Note that Report Designer preserves blank lines only when the memo field is word-wrapped.)
The enclosed software demonstrates the following features of our new word processor: Support for PostScript printers<R> Graphics import capability<R> Automatic table of contents generation<R> Automatic index generation We hope that this demonstration disk will encourage you to try PC Word Processor. For more information about this and other software available from Eastern Computer Supply, return the enclosed card to request our catalog. Figure 19.3 Text with Line Ending Codes
The enclosed software demonstrates the following features of our new word processor: Support for PostScript printers Graphics import capability Automatic table of contents generation Automatic index generation We hope that this demonstration disk will encourage you to try PC Word Processor. For more information about this and other software available from Eastern Computer Supply, return the enclosed card to request our catalog. Figure 19.4 Text as Printed in Report

Chapter 19: Creating Form Letters
R&R ReportWorks SQL User Manual Page 615
Formatting Text: Horizontal Spacing
If you want Report Designer to preserve horizontal spacing such as paragraph indentations in your text, use the spacebar or the tab key depending on what kind of word processor or editor you use:
� Use the spacebar if your word processor or editor represents a tab as the tab character. Report Designer treats a tab character as a single space, so that space represented in your memo text as one or more tab characters will not be preserved in your report.
� Use the tab key if your word processor or text editor represents a tab as a number of spaces. Report Designer preserves spaces inserted in your memo text when these spaces are at the beginning of a paragraph (as in a paragraph indentation). Spaces that are inserted elsewhere in your text are preserved, unless Report Designer’s word-wrap places them against the left margin of your report. In this case, the spaces are eliminated.
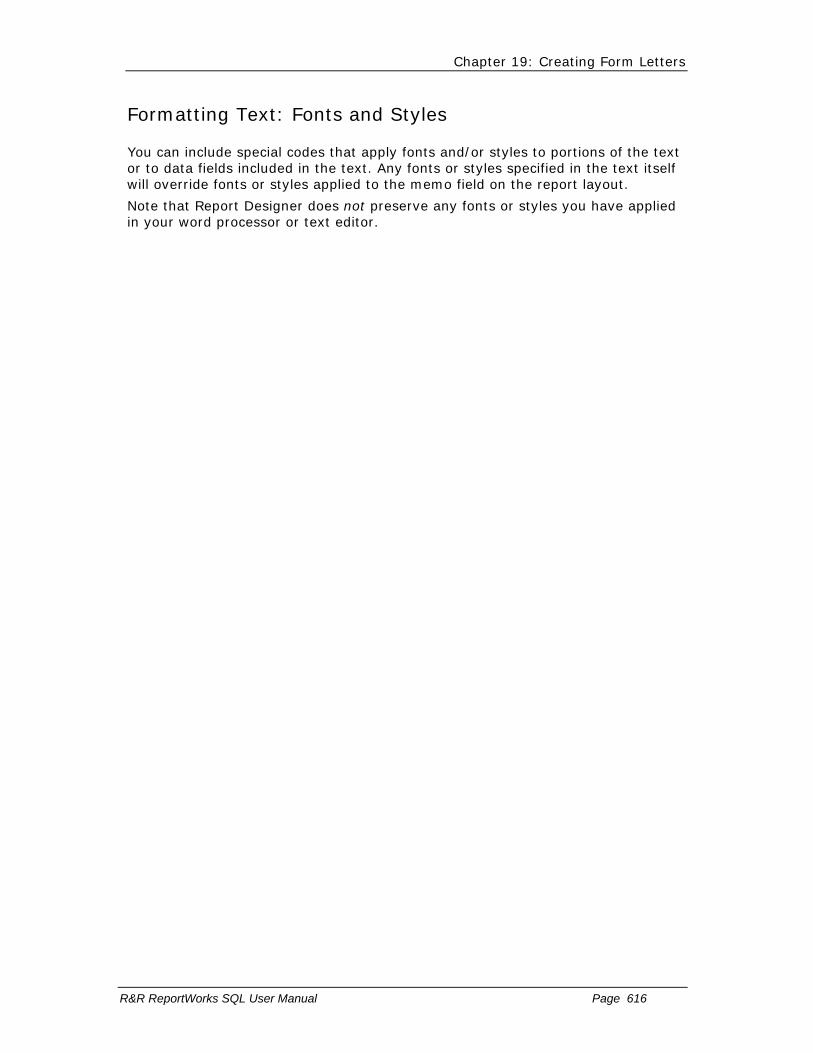
Chapter 19: Creating Form Letters
R&R ReportWorks SQL User Manual Page 616
Formatting Text: Fonts and Styles
You can include special codes that apply fonts and/or styles to portions of the text or to data fields included in the text. Any fonts or styles specified in the text itself will override fonts or styles applied to the memo field on the report layout.
Note that Report Designer does not preserve any fonts or styles you have applied in your word processor or text editor.

Chapter 19: Creating Form Letters
R&R ReportWorks SQL User Manual Page 617
Fonts Codes in Text
You can apply any font available on the currently selected Windows printer. Applying a font will not affect the style currently in effect. To apply fonts to text and/or data fields, follow these guidelines:
� To turn on a selected font, include the font code <Ftypeface> or <ftypeface> in your text, where typeface is the typeface name (for example, Times) of the font you want applied. You can enter the typeface name in upper, lower, or mixed case.
� To turn off a selected font, specify another font with another font code or use <D> or <d> to return to the font and attribute applied to the memo field on the report layout.
For example, in the text illustrated in Figure 19.5, the <FTimes> code applies the Times font to the entire text.
<FTimes>In July, Eastern Computer Supply is offering a series of training seminars for all corporate customers in the \CITY\, \STATE\ area. The seminars will be held at the Hynes Convention Center in Boston on July 1-5. Each session will provide an introduction to one of our PC software products. For more information about the seminars, please fill out and return the enclosed information request form. Figure 19.5 Embedded Font Codes (1)
When this memo field is inserted in a report, the text will print in the normal attribute of the Times font (if this font is available on the current printer). This font will override any font applied to the memo field on the layout. However, if a style is applied to the memo field on the layout, Report Designer will try to combine that style with the specified font.
In the text illustrated in Figure 19.6, Times has been applied to the entire text, but Helvetica has been applied to the embedded data fields. Note that font codes supersede each other, and that Times must be respecified for the text that follows the embedded data fields. A font remains in effect until Report Designer encounters a font off code (<D> or <d>), a code for another font, or the end of the memo.
<FTimes>In July, Eastern Computer Supply is offering a series of training seminars for all corporate customers in the <FHelvetica>\CITY\, \STATE\ <FTimes>area. The seminars will be held at the Hynes Convention Center in Boston on July 1-5. Each session will provide an introduction to one of our PC software products. For more information about the seminars, please fill out and return the enclosed information request form. Figure 19.6 Embedded Font Codes (2)
To specify point size, insert a second entry consisting of the letter "p" or "P" followed by a number indicating the point size. For example, to apply the Times font in a 10-point size, include the following codes in your text: <FTimes> <P10>.
The point size code can also be used by itself to change the point size of a previously specified font. For example, including <P14> in your text would change

Chapter 19: Creating Form Letters
R&R ReportWorks SQL User Manual Page 618
the size of the font currently in effect to 14 point. Point sizes can have up to three integer places and one decimal place.

Chapter 19: Creating Form Letters
R&R ReportWorks SQL User Manual Page 619
Style Codes in Text
To apply styles to words and/or fields in your text, follow these rules:
To turn on a selected style, include one of the following style codes in your text:
<B> or <b> for bold <I> or <i> for italic <U> or <u> for underscored <N> or <n> for normal
You can also combine codes other than N within angle brackets, for example <BI> for bold and italic.
To turn off a selected style, specify another style with another style code or use <D> to return to the font and style applied to the memo field on the report layout.
You can apply the underscore style to words and/or fields that print in any font. You should apply the normal, bold, italic, and bold/italic styles only to text and/or fields that print in fonts for which these styles are available.
In the text illustrated in Figure 19.7, Times has been applied to the entire text and the bold style has been applied to the embedded data fields. Note that style codes supersede each other, and that the Normal style must be specified for the text that follows the embedded data fields.
Applying a style will not change the font currently in effect.
<FTimes>In July, Eastern Computer Supply is offering a series of training seminars for all corporate customers in the <B>\CITY\, \STATE\ <N> area. The seminars will be held at the Hynes Convention Center in Boston on July 1–5. Each session will provide an introduction to one of our PC software products. For more information about the seminars, please fill out and return the enclosed information request form.
Figure 19.7 Embedded Font and Style Codes
As long as no other style is applied to the memo field on the report layout, this memo field will print in the normal style of the Times font. However, the embedded data fields will print bold style, assuming this style is available for Times.
Note that you can include style codes without using font codes. In this case, Report Designer will combine the specified style with the font that is applied to the field on the report layout.

Chapter 19: Creating Form Letters
R&R ReportWorks SQL User Manual Page 620
Formatting Text: Control Characters
Note that Report Designer ignores control characters (such as form feeds) included in your text. As previously explained, Report Designer converts both the tab character (character code 9) and a single carriage return into a space.

Chapter 19: Creating Form Letters
R&R ReportWorks SQL User Manual Page 621
Attaching Files for Merging
After you prepare a text file, you are ready to create your form letter report. As with any report, you must first select a master table (often the one that will provide names and addresses for the form letters) and then optionally set database joins to any other tables that will provide information for the report. As an additional step, you must then attach the text file containing the memo(s) that will provide the text of the letter.

Chapter 19: Creating Form Letters
R&R ReportWorks SQL User Manual Page 622
Attaching a Text File
To attach a text memo file to provide memo fields for your report: 1. Select Insert ⇒ Text File to display the Text File dialog.
Figure 19.8 Text File Dialog
2. Choose Select File to display the Text File selection dialog.
3. Enter or select the name of a text file that contains one or more memos. Report Designer assigns a default alias to the file; you can retain the default as long as no table used by the current report has the same alias. If the alias conflicts with a table alias, type a different alias in the Alias edit box.
4. Select OK. The path, name, and alias of the text memo file are displayed.
5. If the text file uses extended characters (such as currency symbols or foreign characters), select either Windows (ANSI) or DOS (PC) from the Character Set group box. In general, you should select Windows (ANSI) for text files created with a Windows word processor and select DOS (PC) for text files created with a DOS-based word processor or text editor.
6. Select OK to return to the report layout. The name of each memo in the text file will now appear in the field list (under the name of the master table) when you select Insert ⇒ Field or press Ins.
You can select only one text memo file at a time, so all the memos you want to include in a report must be in the same file. Within this file, you may have many named memos, one or more of which can be included in your report. See the section in this chapter on preparing memo files for information about including more than one memo in a memo file.
When you save your report, your memo file selection will be saved just like your database joins.

Chapter 19: Creating Form Letters
R&R ReportWorks SQL User Manual Page 623
Detaching a Text File
To detach a text memo file from a report: 1. Select Insert ⇒ Text File to display the Text File dialog. The currently attached
text memo file and its alias are displayed.
2. Select Detach. Report Designer displays the names of all fields that will be removed from the report when you detach the memo file.
3. Select OK to detach the file and remove the listed fields or select Cancel to leave the memo file attached and retain the fields.

Chapter 19: Creating Form Letters
R&R ReportWorks SQL User Manual Page 624
Creating Merge Report Layouts
You create the layout for a merge report just like you create the layout for any other report. You insert blank lines of the appropriate types on the report layout; then you fill in the lines with text and fields. For example, the report layout that produced the letter in Figure 19.2 is illustrated in Figure 19.9.
Figure 19.9 Sample Form Letter Layout

Chapter 19: Creating Form Letters
R&R ReportWorks SQL User Manual Page 625
Memo Field Symbol
Note the line of m’s marking the memo field location. These m’s represent a memo field that will appear as a paragraph of text.
Each memo field appears on your screen as a single line of m’s. The default format of the memo field (indicated by the « that precedes the m’s) is left-justified word-wrap. This format causes all the text in the memo field to word-wrap within the maximum report width, 254 columns (when Ruler Spacing is set to 10). After you insert a memo field, use Format ⇒ Properties to set an appropriate width.
Chapter 19: Creating Form Letters
R&R ReportWorks SQL User Manual Page 626
Generating Merge Reports
To generate a merge report such as a series of form letters, simply click on the Print button on the Standard Toolbar or use the Print dialog. Before you print, you can use the Database ⇒ Sort Order and Filter dialogs to sort the report and print only selected records, if necessary.

Chapter 19: Creating Form Letters
R&R ReportWorks SQL User Manual Page 627
Features Affecting Merge Reports
A number of Report Designer features have special relevance to merge reports. Although each of these features is discussed at length elsewhere in the manual, this section briefly explains five important features:
� Word-wrap format and width of memo fields;
� Field width and format of embedded data fields;
� Functions that conditionally include memo fields;
� Options that control printing of blank lines;
� Page breaks.
Chapter 19: Creating Form Letters
R&R ReportWorks SQL User Manual Page 628
Word-Wrap Format of Memo Fields
When you first insert a memo field in a report, it defaults to left-justified, word-wrap format. While you can change the justification of the field to right or full, you will probably not want to change the word-wrap format. (Only if the field is word-wrapped can you be sure to print all the text from the memo field.) As you insert the memo field on your report layout, you should be aware of the characteristics of this format, which are summarized in the following paragraphs.
� If you place a word-wrapped memo field in a Page Header/Footer or swap Header/Footer band, Report Designer wraps the text only until it encounters the end of the area, as these areas are fixed in length. Any data that does not fit in the area will not print.
� If you place a word-wrapped memo field in any band other than a Page Header/Footer or swap Header/Footer, Report Designer wraps the text until the entire contents of the memo field have been printed, causing these areas to vary in length.
For more information on word-wrapping and justification, see Chapter 4, "Working with Fields." For a definition of swap Headers/Footers, see Chapter 10, "Sorting and Grouping Data."

Chapter 19: Creating Form Letters
R&R ReportWorks SQL User Manual Page 629
Field Width of Memo Fields
The width of the memo field determines the horizontal area within which Report Designer wraps the text. The maximum width of a memo field is 254 characters. If you want to indent the memo text on the report, you can use the Format ⇒ Field dialog to specify memo field width in characters or inches; then move the field into position on the layout. For more information on controlling field width, see Chapter 4, "Working with Fields."
For example, the layout shown in Figure 19.10 produces the report shown in Figure 19.11.
Figure 19.10 Report Layout with Two Memo Fields
This memo is the introductory paragraph and prints across the page from the left margin to a width of 45 characters. This memo field is shorter and only prints within a field width of 35 characters.
Figure 19.11 Report Output with Two Memo Fields

Chapter 19: Creating Form Letters
R&R ReportWorks SQL User Manual Page 630
Field Width and Format of Embedded Fields
Numeric, date, datetime and logical fields embedded in a memo field appear with the same width and format that has been assigned to the fields in the report. To change the field width or format of a numeric, date, or logical field that has been embedded within a memo field but not inserted on the report layout, insert the field anywhere on the report. Use the Width/Format tab on the Properties tabbed dialog (select the field and press F9) to change the field width or format. Then erase the field from the report layout. When the field is merged with the memo field in your report, it will have the width and format you assigned it.
For any embedded character field, leading and trailing spaces are removed when the field value is printed with the memo text.

Chapter 19: Creating Form Letters
R&R ReportWorks SQL User Manual Page 631
Including Memo Fields Conditionally
If your merge report is composed of several memo fields, you can use the IIF or CASE function to include memo field text conditionally. For example, if you want to print the PAYUP memo field only if the addressee balance is past due, you can create a calculated field with the following expression:
IIF(PASTDUE,PAYUP,"")
This expression means that if the value in the PASTDUE field is true, the PAYUP memo field will be printed. Otherwise, nothing will be printed. The empty quotation marks return an empty memo field without the need for you to have such a field in your memo file.
Note that the quotation marks indicating the empty memo field must be the second return value in the expression.
Once you create this field, you can insert it in your form letter where you want the memo text to appear. Customers with a past due balance will receive letters including the text of PAYUP; paid up customers will receive letters without this text.
You can use the CASE function in a similar way to select from a series of memo fields. For example, to print different memo fields depending on the length of time customers’ bills are overdue, you might proceed as follows. First, create an OVERDUE field that contains a 0 if the bill is not overdue, 1 if it is between 30 and 60 days overdue, and a 2 if it is more than 60 days overdue. Next, create corresponding memos named THIRTY and SIXTY in a text file.
Finally, create a calculated field with the following expression:
CASE(OVERDUE,2,SIXTY,1,THIRTY,"")
This expression means that if the value in the OVERDUE field is 2, print the SIXTY memo field; if the value in the OVERDUE field is 1, print the THIRTY memo field; if the value is 0 or any other value, print no memo field. Note that the quotation marks indicating the empty memo field must not be the first result in the expression.
Note also that you can use the Format ⇒ Band Line Properties dialog to assign a logical condition that will conditionally print lines in any report. See Chapter 3, "Working with Bands," for more information.

Chapter 19: Creating Form Letters
R&R ReportWorks SQL User Manual Page 632
Blank Lines
You can include blank lines in any report simply by inserting them on the layout. In the Title, Record, Group Header/Footer, or Summary bands, Report Designer always places blank lines where you have inserted them relative to word-wrapped fields. For example, if a layout contains two memo fields separated by a blank line, as shown in Figure 19.10, Report Designer prints all the text in the first field, leaves a blank line, and then prints the second memo field, as shown in Figure 19.11.
You can control the printing of lines in which all fields are empty by using the Compress Record/Group Lines setting in the Format ⇒ Record Layout dialog. Turning this setting Off forces the printing of a Record, Group Header, or Group Footer line in which all fields are empty. Report Designer initially sets this option to On, which suppresses printing of lines in which all fields are empty. If you have used an IIF or CASE expression as explained above to conditionally exclude memo fields, you should retain the default of On.

Chapter 19: Creating Form Letters
R&R ReportWorks SQL User Manual Page 633
Page Breaks
When you are printing a merge report such as a series of form letters in which you want to start a new page for each record or group, insert a new-page line as the last line on the report layout before the Page Footer (if any). For more information on inserting new-page lines, see Chapter 3, "Working with Bands."

Chapter 20 Embedding or Linking Objects
Introduction (Embedding or Linking Objects)
This chapter explains how to embed or link information, or objects, from other applications in reports.
You can embed or link objects from any OLE server-enabled application. When you embed an object, the object becomes a part of the report and is not affected by changes to the source data. When you link an object, the report contains a link to the source; if the source changes, those changes are reflected in the report.
Explanations of object linking and embedding in Report Designer are presented in the following sections:
� Embedding Objects
� Linking Objects

Chapter 20: Embedding or Linking Objects
R&R ReportWorks SQL User Manual Page 635
Embedding Objects
When you embed an object created in another application (such as a graphic, a chart, or a text selection), the object becomes part of the report. You can edit the object "in place" in the report; when you double-click on the object, Windows launches the source application. When you finish editing and return to Report Designer, the changes are reflected in the embedded object. (Note that embedding increases the size of a report, since the object is saved with the report.)
You can embed an object using any of the following methods:
• Select Insert ⇒ Object and either create or select an object;
• In the source application, highlight the information you want to embed and select either Cut or Copy; in Report Designer, select Edit ⇒ Paste Special;
• Drag an object from another application or from the Windows Explorer.
The following sections explain these procedures in detail.

Chapter 20: Embedding or Linking Objects
R&R ReportWorks SQL User Manual Page 636
Embedding an Object Using Insert Object
Follow these steps to embed an object in a report using the Insert Object dialog (see Figure 20.1):
1. Place the edit cursor at the place on the layout where you want the top left corner of the embedded object to be positioned. Select Insert ⇒ Object.
Figure 20.1 Insert Object Dialog
2. By default, the Create New option button is selected, and the OLE-enabled applications available on your system are shown in the Object Type box.
You can either create a new object to be embedded or turn on the Create from File option button to embed an existing object.
To create a new object to embed in the report, leave the Create New button selected. In the Object Type box, highlight the source application for the object to be created and select OK to launch that application.
To embed an existing object, select the Create from File button. Enter the name (and path, if necessary) of the object to be embedded and select OK. You can use the Browse button to search for the file to be embedded.
3. If you created a new object and the source application was launched in a separate window, select File ⇒ Exit in that application to return to Report Designer. If prompted to update the object, select Yes.
If you created a new object and the source application simply replaced some of Report Designer’s menus and toolbars, click anywhere outside the object (or press Esc) to return to Report Designer.
As noted previously, an embedded object does not reflect any changes made in the source application to the file or object; however, you can directly edit the object from within Report Designer (as explained in the Modifying an Embedded Object section of this chapter).

Chapter 20: Embedding or Linking Objects
R&R ReportWorks SQL User Manual Page 637
Embedding an Object Using Paste Special
Follow these steps to embed an object in a report using the Paste Special dialog (see Figure 20.2 for an example; actual contents of the dialog will depend on the type of information on the clipboard):
1. In the source application, open the file that contains the information to be embedded. Highlight the portion that you want to embed and select Edit ⇒ Copy.
2. In Report Designer, place the edit cursor where you want to place the embedded object and select Edit ⇒ Paste Special.
Figure 20.2 Paste Special Dialog
3. On the Paste Special dialog, make sure the Paste option button is on (the Paste Link option is used to link objects and is available only for applications that are OLE linking servers, such as Microsoft Excel). To embed the object, select OK.

Chapter 20: Embedding or Linking Objects
R&R ReportWorks SQL User Manual Page 638
Modifying an Embedded Object
After you have embedded an object in a report, you can modify the object in place using the source application. You can also re-size the object using the Object Properties dialog.

Chapter 20: Embedding or Linking Objects
R&R ReportWorks SQL User Manual Page 639
Modifying the Content of an Embedded Object
To modify the content of an embedded object, do the following: 1. Double-click the object. Depending on the source application used to create the
object, either the application is launched in a separate window or some of the menu and toolbar items in Report Designer are temporarily replaced by those from the source application.
2. Modify the object as necessary.
3. If you are editing the object in a separate window, exit the source application and return to Report Designer; if prompted to update the object, select Yes.
If you are editing the object "in place" on the layout, click on the layout anywhere outside the embedded object (or press Esc) to return to Report Designer and restore its menus and toolbar items.
Note that you can also edit an object by right-clicking and selecting the object name (for example, "Bitmap Image Object") at the bottom of the menu. If both an Edit and an Open command appear, select Edit to edit the object directly on the layout; select Open to edit the object in the source application window.

Chapter 20: Embedding or Linking Objects
R&R ReportWorks SQL User Manual Page 640
Changing the Size of an Embedded Object
You can change the size of an embedded object either directly on the layout or with the Object Properties dialog (see Figure 20.3) Note that with the exception of the static text in the Object Information box identifying object type and source application, the Object Properties dialog is the same as the Picture Properties dialog explained in Chapter 13, "Inserting Bitmapped Images."
To change the size of an embedded object directly on the layout, first select it. Then click and drag one of the "handles" at the corners of the object to increase or decrease the object dimensions as necessary.
To change the size of an embedded object using the Object Properties dialog, do the following:
1. Use any of the following methods to open the Object Properties dialog:
Select the object and choose Format ⇒ Properties;
Select the object and press F9;
Right-click the object and select Properties
Figure 20.3 Object Properties Dialog
2. Enter or select settings for Width and Height as necessary.
3. Optionally change the scaling setting as explained in the Selecting a Scaling Setting section of Chapter 13, "Inserting Bitmapped Images."
4. When you are finished making changes, select OK.

Chapter 20: Embedding or Linking Objects
R&R ReportWorks SQL User Manual Page 641
Linking Objects
As noted previously, when you link an object, the report contains a link to the source that is updated when the source changes. You can create a link between Report Designer and any OLE server-enabled application.
The procedures for editing or re-sizing a linked are the same as those for editing or re-sizing an embedded object.
You can use either of the following methods to create a link to an object:
• Select Insert ⇒ Object and select an object;
• In the source application, highlight the information you want to embed and select either Cut or Copy; in Report Designer, select Edit ⇒ Paste Special.
Note that when you use the first method (selecting Insert ⇒ Object), you can create a link only to an entire file; with the second method, you can create links to a selected portion of the source file.
The following sections explain these procedures in detail.

Chapter 20: Embedding or Linking Objects
R&R ReportWorks SQL User Manual Page 642
Creating a Link Using Insert Object
Follow these steps to create a link using the Insert Object dialog (see Figure 20.1):
1. Place the edit cursor at the place on the layout where you want the top left corner of the linked object to be positioned. Select Insert ⇒ Object.
2. Turn on the Create from File option button. In the File Name box, enter or select the name of the object to be linked.
3. Click the Link to File check box; then select OK.
By default, the link is created as an Automatic one — that is, the object will automatically updated if the source changes. You can also choose to update links manually; see the Updating Links section of this chapter for information.

Chapter 20: Embedding or Linking Objects
R&R ReportWorks SQL User Manual Page 643
Creating a Link Using Paste Special
Follow these steps to create a link using the Paste Special dialog (see Figure 20.4 for an example; actual contents of the dialog depend on the type of information on the clipboard):
1. In the source application, open the file that contains the information to be linked. Highlight the portion to be linked and select Edit ⇒ Copy.
2. In Report Designer, place the edit cursor where you want to place the linked object and select Edit ⇒ Paste Special.
Figure 20.4 Paste Special Dialog (Linking)
3. On the Paste Special dialog, click the Paste Link button. To create the link, select OK.

Chapter 20: Embedding or Linking Objects
R&R ReportWorks SQL User Manual Page 644
Updating Links
Initially a link is created as Automatic — if a source changes, those changes are automatically reflected when you open a report that contains a link to that source.
Follow these steps to change the update setting to Manual so that the link will be updated only when you specify:
1. Select Edit ⇒ Links. The Links dialog (see Figure 20.5) lists all links to the current report and identifies the object type and update setting for each.
Figure 20.5 Links Dialog
2. To change the Update status, highlight one or more links (to highlight multiple links, either click and drag or Ctrl-click on each link). To change an Automatic link to Manual, click the Manual option button.
If Update is set to Automatic, changes to the source will be reflected when you open the report;
If Update is set to Manual, changes to the source will not be reflected in the report unless you select Update Now on the Links Dialog.
3. Select OK.

Error Messages
/S is invalid, use /CS to specify the control table data source
/S is an unsupported switch. You can use /CS to specify the data source for the control table, or RI_DSOURCE in the control table to specify the data source for the report.
"Abnormal Viewer termination"
A Report Viewer DLL error. The Report Viewer EXE (rsw.exe) terminated and returned an unknown error code to the Report Viewer DLL. If the problem persists, look for clues by turning on error message and status reporting with the setDisplayStatus() and setDisplayErrors() calls. Or, run Viewer EXE directly with a control file setting the same parameters as you are in the DLL calls.
Absolute or relative URL address required
The Input Control File is empty. Export to ActiveX Viewer requires that you provide the absolute or relative URL address.
Absolute or relative URL address must contain RRPREVIEW.CAB.
The control URL input does not contain the tile name RRPREVIEW.CAB.
Access denied to file: (file name)
Report Designer cannot access the specified file because of any of the following:
It is a read-only file.
It is open for exclusive use by another user on the network.
It is a directory.
Make sure you have specified a valid file name and verify that the file is not read-only.
An unexpected error occurred while reading (filename) An unexpected error occurred while writing (filename)
See Cannot create/find/open/read/write.
Argument name in use

Appendix A: Error Messages
R&R ReportWorks SQL User Manual Page 646
In entering a UDF declaration, you repeated an argument name. For example, the arguments 0_DATA and N_DATA have the same name, DATA. Enter a unique argument name.
Bad input line, or invalid text control file: filename
Make sure the Report Viewer command line uses supported switches formatted correctly, and that the specified text file is a valid control file.
Band lines containing images cannot be set to Automatic
You cannot change the Line Height setting of a band line containing one or more images to Automatic. A band line containing an image must be a Freeform line.
Appendix A: Error Messages
R&R ReportWorks SQL User Manual Page 647
Calculated field (field name) must be edited
You retrieved or tried to print a report that contains a calculated field that Report Designer can no longer evaluate (for example, a calculated field that requires a data field you deleted from your database) or that requires UDFs that have been deleted or modified. You can:
1) Edit the calculated field so that it can be evaluated.
2) Delete the field from the report.
3) Modify the file structure to replace the deleted field.
4) Modify the UDF.
Calculated join field (field name) is no longer translatable
A calculated field used as a join field in your report can no longer be evaluated by your DBMS. Edit the specified calculated field.
Calculation buffer overflow Calculation code overflow
You tried to enter an expression that is too complex to fit in the storage space allotted for it. Break the expression into subexpressions and then combine the subexpressions. For example, if you want to define field X as (A+B) * (C+D) but this causes an overflow, create two calculated fields Y and Z. Define Y as A+B. Define Z as C+D. Then define X as the expression Y*Z.
Calculation code overflow at offset (n) of RI_FILTER
The expression in the RI_FILTER field in the Viewer control table cannot be compiled because it contains an invalid character or argument. The offset number indicates the position of the character that is causing the problem. For example, "offset 10" indicates that the 10th character in the filter expression is invalid. Then edit the expression. (Refer to the explanation of the "Calculation code overflow" message.)
Can filter only on highest level preprocessed totals
You can filter on a preprocessed total only if no other preprocessed total is defined at a higher (more inclusive) reset level. For example, you cannot filter on a preprocessed group total if the report also contains preprocessed grand totals. To run your report, you must either edit your filter to remove the preprocessed total or make the higher level totals running rather than preprocessed.

Appendix A: Error Messages
R&R ReportWorks SQL User Manual Page 648
Cannot access master table 'table'. Try another Data Source?
The master table for the report could not be found. Either choose another Data Source which contains the master table or reconfigure your Data Source so that it does contain the master file from this report.
Cannot access user function library
Another user is currently making changes to RSW.UDF, the file containing user-defined functions. You must wait until the other user is finished modifying RSW.UDF before you can create or retrieve a report or modify RSW.UDF yourself.
Cannot activate a static OLE object
A static OLE object can only be inserted into Report Designer; it cannot be edited.
Cannot compare a memo field to another field
The comparison value for a memo field cannot be another field.
Cannot create band line
The band line specified in the ReportScript script file could not be created. Check to make sure that band lines have been properly specified within the script file.

Appendix A: Error Messages
R&R ReportWorks SQL User Manual Page 649
Cannot create components file Cannot create record cache Cannot create sort temporary file Cannot create image file Cannot create totals file Cannot create totals index Cannot find file (name.tmp) Cannot open image file (file name) Cannot open totals file Cannot read components file Cannot read database Cannot read record cache Cannot read totals file Cannot read totals index Cannot read user file (filename) Cannot write components file Cannot write record cache Cannot write to temporary input file Cannot write totals file Cannot write totals index
All the "Cannot create/find/open/read/write error messages indicate that Report Designer cannot create or access a program-generated or user-requested file. Any of the following conditions can cause these messages. For user-requested files, you may have entered an invalid tile name.
Check that you used valid file name characters. For any file, your disk may be full or damaged. The FILES parameter in your CONFlG.SYS may not be set high enough (see entry on "Insufficient file handles"), or you may not have enough available memory.
On a network, you may not have write access to the specified directory or the directory in which Report Designer creates temporary files. If the disk is almost full, move or delete some files to make space available. If the disk is not almost full, you may have a disk error. See your network administrator to gain access to the necessary directory.

Appendix A: Error Messages
R&R ReportWorks SQL User Manual Page 650
Cannot delete join field (field name)
This error occurs in three cases:
1) Editing a join, you tried to change the related table to a table that doesn't contain the join field.
2) Using Database ⇒ Master, you tried to replace the original master table with one that does not contain a join field of the same name and data type as the original join field.
3) Using Database ⇒ Joins, you tried to remove a join in which a related table contains a join field used in another table join.
To delete this field and all fields in the related table, first use Database ⇒ Joins to delete the join to that table. Then you can delete the join field. Note that if fields in the related table are used as join fields in other joins, you must remove all of those other joins starting at the last one in the chain. To use a different join field, first use Database ⇒ Joins Edit to select a new join field. Then you can delete the old join field.
"Cannot execute Viewer EXE: error code <code>"
The Viewer DLL was unable to load Viewer EXE. The error code is returned by CreateFileMapping(). Check ProgDir32 in Defaults section of RSW.INI to confirm it points to the location where RSWRUN.EXE is installed. If problem persists, look for clues by turning on error message and status reporting with the setDisplayStatus() and setDisplayErrors() calls. You can also run Report Viewer EXE directly with a control file setting the same parameters as you are in the DLL calls.
Cannot execute Report Wizards. Error code: (n)
The Report Wizard executable file could not be loaded. Verify that the program file RRWIZ.EXE is in you program directory or that the pathname specified by the WizardEXE keyword in the [Special] section of RSW.INI is set to the Wizard program file.
Cannot export to master or related file
Report Designer will not export a report to one of the tables used in the report.
Cannot filter on composite record number field Cannot filter on page number field
You cannot edit a calculated field currently used in a filter so that its expression includes the RECNO( ) or PAGENO( ) function. Edit your calculation or change your filter.
Cannot filter on running total if any totals are preprocessed
Appendix A: Error Messages
R&R ReportWorks SQL User Manual Page 651
You cannot filter on a running total if your report contains any preprocessed totals. You will not be able to run your report until you 1) change or eliminate your filter or 2) change all preprocessed totals to running totals.
Cannot find related table 'table'. Re-select table?
Report Designer cannot locate the related table. Either reselect the table or reconfigure the report's Data Source so that the related table exists in the Data Source.
Cannot find serial number in user file
The serial number on the diskette you inserted does not exist in the RSWUSERS.DAT file. Find and insert the diskette marked with the serial number you want to delete.
Cannot link with composite record number field Cannot link with memo field Cannot link with page number field
You cannot edit a calculated field currently used as a join field so that it results in a memo field or so that its expression uses the RECNO( ) or PAGENO( ) functions. Check your calculation. Either select a different field as the join field or edit the calculated field to eliminate the reference.
Cannot load printer library file (filename)
Report Designer could not load the printer driver, dynamic-link library file RRPD.DLL. Check to make sure that this file is located in your program directory.
Cannot match printer or port in control file
The Viewer control file contains a value in RI_WPTR or RI_WPORT, or a combination of the two, that cannot be matched to any Windows printer or port on the system.
Cannot open control file: (file name) Cannot open database table (file may be in use) Cannot open library file (file name) Cannot open memo file (file may be in use) Cannot open text file (file may be in use)
The file may not exist (enter a valid file name with a complete path).
The file may be damaged (restore it from your backup and try again).
On a network, the file may be locked by another user. Try running the report later.
Report Designer may already have the maximum number of files open (see
Appendix A: Error Messages
R&R ReportWorks SQL User Manual Page 652
"Insufficient file handles").
Cannot open file: filename
Report Designer could not open the file specified. Verify that the pathname is correct and that there is sufficient disk space on the drive.
Appendix A: Error Messages
R&R ReportWorks SQL User Manual Page 653
Cannot open script file (filename)
Report Designer could not open the script file passed on the command line. Verify that the file exists; provide a full pathname if required.
Cannot read database
See "Cannot read..."
Cannot read memo file
The text memo file attached to your report is not in the required format. If the file contains more than one memo, each memo must be identified following the conventions explained in Creating Form Letter Reports. See also "Cannot read..."
Cannot read user file (file name)
The user management program, RSWUSERS.EXE, cannot read the specified user management file. See "Cannot read..."
Cannot save clipboard image
Report Designer is unable to save the clipboard image that you pasted into the report.
Cannot sort on composite record number field Cannot sort on self-referencing field Cannot sort or group on memo field Cannot sort or group on page number field Cannot sort or group on PREVIOUS( )-related field Cannot sort or group on running-total-related field
Calculated fields:
You cannot edit a calculated field currently used as a sort or group field so that its expression includes a self-referencing calculated field, total field, or running total-related field or so that its expression results in a memo field. In addition, you cannot use the RECNO( ), PAGENO( ) or PREVlOUS( ) function in a calculated field used to sort or group a report. Check your calculation. Total fields:
You cannot change the processing mode of a preprocessed total that is currently used as a sort or group field, or that is used by a calculated sort or group field.

Appendix A: Error Messages
R&R ReportWorks SQL User Manual Page 654
Cannot use a field in a list
You cannot use a field in a comparison list.
Cannot use a field in a range
You cannot use a field in a comparison range.
Cannot use an empty value in a range
A range comparison must consist of two nonempty values.
Cannot use page total field to control line printing
In the Logical Field box of the Band Line Properties dialog box, you specified a calculated field derived from a page total to control line printing. Report Designer does not allow you to use a page total as a line logical field, since the total is likely to change if the line does not print. Use a different field.
Cannot use QUERY( ) in a user-defined function
You cannot use the QUERY( ) function in a user-defined function.
Cannot write user file
The user management program, RSWUSERS.EXE, cannot add, delete, or unlock a serial number because it cannot write to the user management file, RSWUSERS.DAT. See "Cannot create..."
Change would cause invalid running total filter
You created a filter that includes a running total field or running-total-related calculated field and then edited the field in a way that makes it unusable in a filter. Only grand counts, grand sums, and calculations derived from such running totals can be included in a filter. Either edit the total or calculated field or change the filter.

Appendix A: Error Messages
R&R ReportWorks SQL User Manual Page 655
Character field (field name) is no longer in table (table name)
This warning message provides information about a change made to the database file structure since the report was last saved. The field may have been deleted from the file. If you are using Report Viewer, you may have used the Viewer control table to change one or more of the tables used in the report.
If the tables selected at report execution do not have the same fields as the original tables, you will get this message. Report Viewer erases deleted fields, as well as fields that total them, from the report layout. Calculated fields that use deleted fields must be edited before you can run the report.
Change would make calculated join field untranslatable
The change you are making would affect a calculated join field. You can join on a calculated field only if that calculation can be evaluated by your DBMS. You have joined on such a calculated field, but the change you are making would cause it to be no longer evaluatable by your DBMS. Such a change is not allowed.
Character string required
The Compared To value in the filter condition you are creating or editing must be a character string.
Circular calculations. Cannot evaluate (field name)
You tried to define two calculated fields that refer to each other, the field you are editing and the field named in the error message. In simple terms, you said "A=B" and "B=A". Thus, these two fields can never be calculated. This message will also appear if you try to edit the formula for a calculated join field so that it uses fields from the related table. Remove the circular reference to the calculated field in the message. If the field is used as a join field in a join, remove references to fields from the related table.
Command failed
See Fatal error: save your report and exit the program.
Condition cannot be memo field
A conditional total may not have a memo field as its condition expression.
Condition cannot depend on a total
A conditional total may not have a condition that depends on a total field.
Appendix A: Error Messages
R&R ReportWorks SQL User Manual Page 656
Could not start print job
See Printer initialization error (check available memory).
Data directory does not exist
On the Default Directories dialog box, you entered an invalid Data directory. You must enter the name of an existing directory.
Database encrypted
Report Designer has tried to open a database that has been encrypted. If you are creating or editing a report, select another database or exit Report Designer and decrypt the database. If you are trying to retrieve a report, you will not be able to do so until you decrypt the database.
Database error (no message from database)
Report Designer was notified of an error by the ODBC driver in use, but no error message text was given.
Date field (field name) is no longer in file (file name)
This warning message provides information about a change made to the database file structure since the report was last saved. The field may have been deleted from the table. If you are using Report Viewer, you may have used the control table to change one or more of the tables used in the report. If the tables selected at report execution do not have the same fields as the original tables, you will get this message. Viewer erases deleted fields, as well as fields that total them, from the report layout. Calculated fields that use deleted fields must be edited before you can run the report.
Date required
The Compared To value in the filter condition you are creating or editing must be a date.
DB access...
Error messages preceded by "DB access" are messages returned by the database software. For an explanation of such messages, see your database software documentation.
Destination disk drive is full
See File error.

Appendix A: Error Messages
R&R ReportWorks SQL User Manual Page 657
Dictionary index does not exist
Report Designer could not find the report dictionary index specified in the File Settings options dialog box.
Duplicate alias
The alias you entered is already assigned to one of the report tables or to a text memo file attached to the report. Enter a unique alias.
Duplicate field name must have table alias qualifier
You tried to include a field name that exists in more than one table in a calculated field expression. If you are using the same field name in more than one table, expressions that refer to one of these fields must have a file name qualifier, for example, CUSTOMER.NAME.
Edit the expression to include the field name's table alias; for example, STATES.NAME instead of NAME. Certain calculated fields ⎯ those that depend on constants, PAGENO( ), or RECNO( ) ⎯ are not associated with a file and therefore cannot be qualified. If you need to reference such a calculated field, rename that field to give it a unique name.
Duplicate name must be qualified at offset (n) of Rl_FlLTER
The expression in the RI_FILTER field in the Viewer control table cannot be compiled because it contains a duplicate field name. The offset number indicates the beginning character position of the duplicate name. For example, "offset 10" indicates that the duplicate name begins at the 10th character in the filter expression. Edit the expression and add the appropriate table alias to the field name.
Duplicate result table column name
You must use either field aliases or the REPORTVlEW syntax to ensure that all field names are unique.
Duplicate sort fields
You have specified the same field at different sort levels.
Duplicate switch
There is a switch specified more than once in the Report Viewer command line.
Empty control file
In the Report Viewer command you specified a control table containing no records. Correct the control table or specify a valid control table.

Appendix A: Error Messages
R&R ReportWorks SQL User Manual Page 658
Empty statement
You must enter a SELECT statement.
Error creating or writing to filename
There was an error creating or writing the export or print file name.
Error creating Print Preview window
The windows used to display a report preview cannot be created. Your system may not have enough memory available. If possible, close other applications and try again.
Error executing SELECT statement for report.
With the Report Viewer, an error occurred when the user-SQL SELECT statement was issued, perhaps because the data source of the report is no longer appropriate.
Error executing SELECT statement for report. Try another Data Source?
An error occurred when the user-SQL SELECT statement was issued, perhaps because the data source of the report is no longer appropriate. You can try a different data source, if that is appropriate.
Error loading driver library
Report Designer could not find the printer driver library for the current printer. Make sure that the driver still exists and is available to Windows applications.
Error opening report dictionary file
Report Designer received an error when attempting to open the report dictionary file specified in the File Settings options dialog box.
Error reading report
The saved report specification is damaged. Restore the report library file from your backup copy.
Error opening report:\015\012%s
See "File error"

Appendix A: Error Messages
R&R ReportWorks SQL User Manual Page 659
Error reading report dictionary file
Report Designer received an error when attempting to open the report dictionary file specified in the File Settings options dialog box.
Error writing to program initialization file
Report Designer could not write to the private initialization file RSW.lNl. Make sure that RSW.lNl is in your Windows directory and that it is not write-protected or damaged.
Evaluate stack overflow on field (field name)
Report Designer could not compute the value for the calculated field specified. The expression may be too complex, contain too many levels of parentheses, or contain too many long character strings. Break the expression into subexpressions and then combine the subexpressions. For example, if you want to define field X as (A+B) (C+D) but this causes an overflow, create two calculated fields Y and Z. Define Y as A+B. Define Z as C+D. Then define X as Y*Z.
Expression required
You must enter an expression for the calculated field or UDF you are creating.
Failed to connect. Link may be broken
The connection between an OLE object inserted into a report and the OLE server which maintains the object has failed. Close the report and restart Report Designer.
Failed to convert OLE object
Report Designer was not able to perform the conversion specified. Select the OLE object and try again.
Failed to create empty document
Report Designer could not create a new report file. Terminate and restart Report Designer and try again.
Failed to launch help
A help file cannot be found or opened. Check to see that the file exists on your disk. If it does not, you need to reinstall help files.
Failed to launch server application

Appendix A: Error Messages
R&R ReportWorks SQL User Manual Page 660
The OLE Server application that supports the object in the report cannot be activated. Be sure that the application has been properly installed and registered.
Failed to open document
See Cannot open control file: (filename).
Failed to save document
An error occurred when writing to a report file. The file may be damaged. Restore it from your backup and try again.
Fatal error. Save your report; and exit the program
Report Designer has detected a fatal program error. Save the current report; then exit and restart Report Designer.
Field is missing
You must select a field in the Field edit box as the left element of the filter condition.
Field name already used
In creating a calculated or total field, you tried to use the name of a field that already exists in the report. Enter a unique field name.
Field name is not allowed in a range or list.
A range or list comparison value cannot contain a field name.
Field name must be qualified
The field name in the Compared To box must include a table qualifier.
Field name required
A valid field name is required for this command. Make sure that the name you selected or entered is actually a field name and not an alias.
Field types do not match
The items being compared in the filter condition (the Field and Compared To selections) must be of the same data type.
Fields won't fit within current margin setting

Appendix A: Error Messages
R&R ReportWorks SQL User Manual Page 661
Report Designer cannot justify the selected line(s) because the distance between the leftmost and rightmost fields is larger than the right margin. Increase the right margin, move the fields closer together, or do not justify the fields.
File already exists (file name)
In naming a new report library, you tried to use a file name that already exists. Use a unique name.
File error (description) (file activity)
Report Designer reports file errors for problems affecting report libraries or user-defined function (UDF) libraries. The description part of the message explains the specific problem (see list below). The last part of the message explains what file is affected and may provide other information about the problem. A typical message of this sort might read “File error (disk full) creating report library."
The specific problems covered by this error message are as follows:
Cannot open file ⎯ Report Designer cannot open the specified file for any of the following reasons:
− The file may not exist. For report libraries and font information files, enter a valid file name with a complete path.
− The file may be damaged. Restore it from your backup and try again.
− On a network, the file may be locked by another user. Try running the report later. Report Designer may already have the maximum number of files open. See "Insufficient file handles."
Disk error ⎯ The specified file is damaged. Exit Windows and run CHKDSK or SCANDISK to diagnose the disk problem. Then restore the file from your backup and try again.
Disk full ⎯ Report Designer cannot create or write to the specified file because you do not have enough space on your disk. You must move or delete files to free up more disk space.
Insufficient memory ⎯ Your system does not have enough available memory to continue retrieving, editing, or generating the report. Report Designer can retrieve and run most reports in 384 KB of memory.
However, reports with large numbers of calculated or total fields may require more memory. If you are running Report Designer, you can maximize the amount of available memory by saving the report (if it has not already been saved), exiting Report Designer, terminating other Windows applications, and starting Report Designer again. You may also want to use Calculations ⇒ Purge Calculations to remove unused calculated and total fields (do not use this command if you included calculated or total fields in memo fields).
Invalid file revision ⎯ You are trying to use a file created by a later version of Report Designer. Select a file created with the version you are using or with an earlier version.
Name in use ⎯ You are trying to use the name of an existing user-defined function. Use a unique name.
No such name ⎯ The report library file is damaged. Report Designer cannot access the selected report. Restore your report library from a backup copy. If you still get the error,

Appendix A: Error Messages
R&R ReportWorks SQL User Manual Page 662
contact Liveware Technical Support. If you get this message with Viewer, you may have specified a nonexistent report name in RI_REPORT. Verify the report name and, if necessary, correct the RI_REPORT entry.
File error (number)
Report Designer has encountered an unanticipated error condition. Contact Liveware Technical Support.
Filter is too complex. Simplify and try again.
The current filter is too complex for proper evaluation. Simplify the filter and try again.
Filter must be edited: field(s) deleted
You tried to output a report when the filter contains references either to fields that were deleted from the database or to calculated or total fields that were deleted from the report. Use Database ⇒ Filter to edit the filter. Note that Report Designer has inserted question marks in the filter where deleted fields were referenced.
First four characters of name not unique
The first four characters of the UDF name you entered duplicate those of another UDF name or of a predefined function name. Use another UDF name that begins with four unique characters.
FROM-field is no longer in table
In opening a report, Report Designer needed to create a "dummy" join field. You need to replace the dummy join field with an actual field.
Function (function) requires field name argument
You entered a formula including a UDF that applies the PREVIOUS( ) function to one of its arguments. Since the PREVIOUS( ) function requires a field name argument, the argument supplied to the UDF must also be a field name. Edit your formula.
Function requires field name argument at offset (n) of RI_FILTER
The expression in the RI_FILTER field in the Viewer control table cannot be compiled because it contains an invalid argument. The offset number indicates the beginning character position of the invalid argument. For example, "offset 10" indicates that the invalid argument begins at the 10th character in the filter
Appendix A: Error Messages
R&R ReportWorks SQL User Manual Page 663
expression. Edit the expression.
Function used in another function cannot contain QUERY( ) Function used in the filter cannot contain QUERY( )
You cannot use the QUERY( ) function within other functions. QUERY( ) must be the entire expression.
Functions are not current
RSW.UDF, the file containing user-defined functions, has changed since you last selected File ⇒ New, File ⇒ Open Report, or one of the Calculations ⇒ User Functions options. Save your report and open it again so that you will be working with current UDFs.
General print spooler error
Report Designer detected a failure in the Windows™ print spooler. Make sure that the Print Manager is working properly and try again.
Illegal use of QUERY( )
The QUERY( ) function must be a calculated field’s entire expression. You cannot use QUERY( ) within another function, with operators, or in the filter expression.
Image directory does not exist
On the Default File Settings dialog box, you entered an invalid Image directory. You must enter the name of an existing directory.
Insufficient file handles
DOS does not have enough available file handles for Report Designer to run. Modify your CONFIG.SYS file to include a FILES= setting of at least 55. If you are running Report Designer from within a database program, exit Report Designer and close any open files. If you are running other memory resident programs that use one or more of the available DOS file handles, exit to DOS and reboot your system without loading these programs.
Insufficient memory...
Your system does not have enough available memory to continue retrieving, editing, or generating the report. Reports with large numbers of calculated or total fields may require more memory. You can maximize the amount of available memory by terminating any other Windows™ applications. You may also want to
Appendix A: Error Messages
R&R ReportWorks SQL User Manual Page 664
use Calculations Purge Calculations to remove unused calculated and total fields (do not use this command if you included calculated or total fields in memo fields).
Insufficient memory to copy or paste additional objects
You copied or pasted a large bitmap. The bitmap was copied or pasted successfully, but there is not enough memory for Report Designer to store an additional copy of the bitmap in memory. Therefore, the Edit ⇒ Paste Objects menu choice will be disabled until you replace the item in memory by cutting, deleting, or copying something else.
Insufficient memory to create screen font
A required screen font cannot be created because of insufficient memory. Close other Windows applications and try again.
Insufficient memory to process RSW.SRT
Report Designer ran out of memory while processing RSW.SRT. The settings and collation rules specified in RSW.SRT may not take effect.
Internal application error
See Fatal error: Save your report and exit the program.
Internal file setup error
There is a serious error in the current report. Contact Liveware Technical Support.
Invalid alias
The table or text memo file alias you entered is not valid.
Appendix A: Error Messages
R&R ReportWorks SQL User Manual Page 665
Invalid argument
You tried to enter an expression where the specified function contains an argument of the wrong data type. An argument can be a constant, a variable, or an expression. The proper syntax for using the specified function displays in the Control Panel for reference.
Replace the argument with an argument of the proper data type, (numeric, date, character, memo, or logical). For predefined functions, check either the help screen or the entry for the function in the Using Functions.
A common error is to try to use a date or numeric argument where a character string is required. If this is the case, use either the DTOC( ) or STR( ) function to first convert the date or number to a character string.
Invalid argument at offset (n) of RI_FILTER
The expression in the RI_FILTER field in the Viewer control table cannot be compiled because it contains an invalid argument. The offset number indicates the beginning character position of the invalid argument. For example, "offset 10" indicates that the invalid argument begins at the 10th character in the filter expression.
Edit the expression (refer to the explanation of the “Invalid argument to function" error message).
Invalid argument name
You specified an invalid argument name while creating a UDF. Enter a new argument name. Argument names must begin with one of the following valid data type prefixes: C_, D_, L_, M_, N_. The name following the prefix can include only letters, numbers, and the underscore character. For more information, see Using Functions.
Invalid checkpoint value: (value)
The field RI_CHKTIME in the Viewer control table does not contain the letter R or P. Check your control table.
Invalid command line argument
You used any of the following:
An invalid argument in your command to start Report Viewer.
The 1 without a letter to designate an argument.
Two arguments of the same type.
An invalid letter after I to designate an argument.

Appendix A: Error Messages
R&R ReportWorks SQL User Manual Page 666
Invalid control file structure
The control table does not have the proper structure. If you install the Report Viewer files during installation, it will place an empty control table named RRUNIN.DBF in your program directory. You can then edit this table to run your report(s).
Invalid date
The month number is not between 1 and 12, the day number is not correct for the month entered, or the date is out of range (date range is 03/01/1600 through 12/31/2400). Enter a correct date value.
Invalid date value
You entered a date constant incorrectly. The date must be enclosed in curly braces (1 and must be in the form defined by the Windows International date setting, using spaces, hyphens(-), slashes(/), or periods (.) as separator characters. Example: DATE=(08/27/94).
Invalid Default Data Directory
The Data Directory specified in the File Settings options dialog box does not exist.
Invalid Default Image Directory
The Image Directory specified in the File Settings options dialog box does not exist.
Invalid Default Library Directory
The Library Directory specified in the File Settings options dialog box does not exist.
Invalid 'equivalence' on line (number) of RSW.SRT
One of the character collation equivalences on the line of RSW.SRT specified in the error message is invalid. See the RSW.SRT for rules that must be observed in specifying collation rules, as well as a definition of the term 'equivalence'. You cannot, for example, mix uppercase and lowercase characters in a single collation rule.
Invalid 'expansion' on line (number) of RSW.SRT
One of the character collation expansions on the line of RSW.SRT specified in the error message is invalid. See RSW.SRT for rules that must be observed in specifying collation rules, as well as a definition of the term 'expansion'. You may not, for example, mix uppercase and lowercase characters in a single collation rule.
Appendix A: Error Messages
R&R ReportWorks SQL User Manual Page 667
Invalid field width value
The value you entered for field width contains invalid characters or exceeds the maximum value allowed. The maximum character field width is 254 characters.
Invalid filename
See File error.
Invalid filename in RI_OUTFILE
In the Viewer control table field RI_OUTFILE you entered a file name that ends with a slash or that contains spaces. Enter a valid file name.
Invalid filter in control file
The RI_FILTER field in the Viewer control table contains an expression that does not return a logical true or false value. This message may also indicate that the RI_FILTER expression in the control table makes invalid use of totals by referencing a running total or preprocessed total that resets at a level other than the highest level at which a preprocessed total is defined. Then change the value in the field.
Invalid frequency for this total
You have selected “Once per page” as the accumulation frequency for the total field you are creating/editing. This accumulation frequency is valid only for totals of page totals.
$ Invalid function name
The function name specified in a UDF declaration contains embedded spaces. Edit the declaration to remove the spaces.
Invalid image file format
The format of the image file you are trying to insert is not valid. Check to make sure that the file is a valid graphics file and that it has the appropriate file extension.
Invalid 'inequality' on line (number) of RSW.SRT
One of the character collation inequalities on the line of RSW.SRT specified in the error message is invalid. See RSW.SRT for rules that must be observed in specifying collation rules, as well as a definition of the term “inequality.” You may not, for example, mix uppercase and lowercase characters in a single collation rule.
$ Invalid function name

Appendix A: Error Messages
R&R ReportWorks SQL User Manual Page 668
Invalid integer/decimal value
You entered a value that contains nonnumeric characters, has too many decimal places, or is outside the valid numeric range. Re-enter a valid numeric/decimal value.
Invalid line height
The line height value you entered either contains nonnumeric characters or has too many decimal places. Re-enter a valid height value.
Invalid master table pathname
Report Designer cannot open the specified master table. Make sure that the path name you entered is correct and try again.
Invalid number of arguments
You entered too few or too many arguments to a function. Review the expression and eliminate or add arguments as necessary.
Invalid number of arguments at offset (n) of RI_FILTER
The expression in the RI_FILTER field in the Viewer control table cannot be compiled because it contains an invalid argument. The offset number indicates the beginning character position of the invalid argument. For example, "offset 10" indicates that the invalid argument begins at the 10th character in the filter expression. Edit the expression (refer to the explanation of the "Invalid number of arguments to function CASE" error message).
Invalid number of copies: xxxx
The RI_COPIES field in the Viewer control table contains a number outside the range 0 to 999. Change the value in the field.
Invalid number of lines
The number you specified either is too large to fit within the maximum number of lines allowed (256) or contains invalid numeric characters. Re-enter a valid number of lines.
Invalid numeric value or value out of range
You entered a value that contains non-numeric characters, has too many decimal places, or is outside the valid numeric range.

Appendix A: Error Messages
R&R ReportWorks SQL User Manual Page 669
Invalid operation
You tried to apply an operator to an argument of the wrong data type. Some operators do not apply to all data types. For example, you cannot multiply a date. Correct the formula or expression.
Invalid operation at offset (n) of RI_FILTER
The expression in the RI_FILTER field in the Viewer control table cannot be compiled because it contains an invalid argument. The offset number indicates the beginning character position of the invalid argument. For example, "offset 10" indicates that the invalid argument begins at the 10th character in the filter expression. Edit the expression (refer to the explanation of the "Invalid operation" error message).
Invalid or duplicate command line argument
Make sure the Report Viewer command line uses supported switches formatted correctly, and that there are no duplicate switches.
Invalid page range: xxxxxxxxx to xxxxxxxxx
The field RI_BEGPAGE in the Viewer control table contains a higher number than RI_ENDPAGE. The beginning page number must be less than or equal to the ending page number.
Invalid parameter: (parameter) Script line: (n)
Report Designer has detected an invalid section or keyword name (parameter) in the script file at line n. Verify that the line in the script file has the proper format.
Invalid pathname: (pathname)
You entered an invalid pathname. Verify the file name and directory path and re-enter.
Invalid point size: Range is 4.0 to 500.0 points
You entered an invalid point size. Enter a point size within the indicated range.
Invalid printer indicator: (indicator)
The RI_PRINTER field in the Viewer control table contains a character other than A, D, P, or ?.
Invalid filter type: (character)

Appendix A: Error Messages
R&R ReportWorks SQL User Manual Page 670
You tried to start Report Viewer using a control table that contains an invalid character in the RI_INCLUDE field. Valid characters are 5 (use saved filter), E (use entire file), 0 (override saved filter with expression in RI_FILTER field), and ? (prompt for user input). Edit the control table and place a valid character in RI_INCLUDE.
Invalid related table pathname
You entered an invalid pathname for a related table.
Invalid report dictionary index file (name)
Report Designer received an error when attempting to open the report dictionary index file specified in the File Settings options dialog box.
Invalid report library
You tried to select a file that is not a report library or a report library that was created with a later version of Report Designer. Check to see that you selected or entered the correct library name.
Invalid report name
When saving a report, you either omitted the report name or entered a name consisting only of spaces.
Invalid report revision
The saved report specification is damaged or you were trying to use a report created with a later version of Report Designer. If your problem is compatibility, use a version of Report Designer that is the same as or later than the version used to create the report. Try restoring your report from its backup copy.
Invalid report type
You attempted to open a report saved with a special version of Report Designer.
Invalid REPORTVIEW name list
There is an error in the parenthesized list of field names in the REPORTVIEW statement.
Invalid RI_WCONTROL value
The RI_WCONTROL value may range from zero to three. .
Invalid RI_WHEIGHT value

Appendix A: Error Messages
R&R ReportWorks SQL User Manual Page 671
The value specified is below the minimum height allowed by Report Designer or is too large for the current display device.
Invalid RI_WPARENT window handle
The value passed is not a valid Windows window handle.
Invalid RI_WTOP/RI_WLEFT value
The value specified is not within the proper range for the current display device.
Invalid RI_WWIDTH value
The value specified is not within the proper range for the current display device.
Invalid running total filter
You are trying to filter on a running total that is not a Grand Count or Sum.
Invalid runtime output file argument
The path and/or file name you specified with the /0 switch is not valid. If you specified a path, the directory may not exist. You may also have used an invalid DOS file name.
Invalid setting for (name) ((value)) in RSW.SRT
The combination of name and value specified in the error message is not a valid combination. See RSW.SRT for information about the valid setting names and values.
Invalid setting (name) on line (number) of RSW.SRT
On the specified line number of RSW.SRT, you attempted to specify a “setting” with the specified name. Report Designer does not recognize a setting with this name. See the RSW.SRT for information about the valid setting names.
Invalid Starting/Ending page value(s)
You either entered a starting page value that is larger than the ending page value or the values you entered contain non-numeric characters.
Invalid use of QUERY function
You tried to use a calculated field that contains the QUERY( ) function in a UDF definition or a filter expression, or you tried to use the QUERY( ) function within another function. QUERY( ) must be the entire expression. Edit the expression.
Invalid user function library

Appendix A: Error Messages
R&R ReportWorks SQL User Manual Page 672
RSW.UDF, the file containing user-defined functions, is damaged. Restore the file from backup and try again.
Invalid user management file
The RSWUSERS.DAT file in the program or link directory is damaged or does not match the Report Designer version you are using. You may need to re-install to provide a valid RSWUSERS.DAT.
Invalid value
The comparison value you entered in the Compared To box is not valid.
Invalid value in (Runtime input field)
This message indicates that the value in the specified field in the Viewer control table is too long.
Invalid value in Copies field
You entered a zero or an invalid value in the Copies field. Enter a numeric value.
Invalid wildcard for memo field filter
The filter condition entered contained an asterisk (*) as other than the first or last character. The * wildcard character is valid only as the first or last character of the filter (e.g., *stuff, stuff*, or *stuff*).
Join field 'name' is no longer in file 'name'
You attempted to print or preview a report for which Report Designer needed to create a “dummy” join field when it opened the report. You must replace the dummy join field with an actual field before you can print or preview the report.
Join must be edited
The report you have retrieved relies on a join field that is no longer in the database. On the Joins dialog box, each incomplete join is preceded by a question mark. You must edit and correct all incomplete joins before you can preview or print the report.
Joining Character field (field name) is no longer in table (table name) Joining Date field (field name) is no longer in table (table name) Joining Numeric field (field name) is no longer in table (table name)
Appendix A: Error Messages
R&R ReportWorks SQL User Manual Page 673
These warning messages provide information about changes to the database file structure since the report was last saved. You tried to retrieve a report with a database join based on a field that no longer exists in the database structure. The report will not be retrieved.
If you are using Report Viewer, you may have used the Viewer control table to change one or more of the tables used in the report. If the tables selected at report execution do not contain the join fields used in the original report, you will get this message.
To change the join field and preserve the report in its entirety, exit Report Designer and use your database software to modify the database structure. Insert the missing field temporarily. Then use Report Designer to retrieve the report and change the join field. To do so, retrieve the report and then use Database Joins to change the join field. Finally, save the report. After you have modified the report, you can use your database software to delete the temporary field.
Library directory does not exist
You entered an invalid Library directory on the Default Directories dialog box. You must enter the name of an existing directory.
List must contain at least two items
You tried to end a comparison list that contains only one value. If you want to compare with only one value, use either the "equal to" or "not equal to" comparison operator. If you want to compare with more than one value, highlight the blank data-entry choice and enter another value.
Logical field (field name) is no longer in file (file name)
This warning message provides information about a change made to the database file structure since the report was last saved. The field may have been deleted from the table. If you are using Report Viewer, you may have used the control table to change one or more of the tables used in the report. If the tables selected at report execution do not have the same fields as the original tables, you will get this message. Report Designer erases deleted fields, as well as fields that total them, from the report layout. Calculated fields that use deleted fields must be edited before you can run the report.
Logical value required
This operation requires you to supply a logical value.
Mail system DLL is invalid Unable to load mail system support
The Windows mail system dynamic link library file (MAPI32.DLL) is missing, invalid or damaged. You may need to run Windows ScanDisk system tool or other disk

Appendix A: Error Messages
R&R ReportWorks SQL User Manual Page 674
diagnostic utility to diagnose the problem.
Master table (table name) not found
RSWRUN cannot find the master table named in RI_MASTER. Enter the correct table name in the Viewer control file field.
Maximum decimal places is 15
The maximum number of decimal places allowed for a numeric field is 15.
Maximum image width and height is 14 inches Maximum image width and height is 30.8 centimeters
The width and height dimensions of an image file must be 14 inches (30.8 centimeters) or less.
Maximum record height is 99.99 inches Maximum record height is 99.99 centimeters
The record height you entered exceeds the 99.99 inches (or 99.99 centimeters) maximum. Enter a valid record height value.
Maximum record width is 99.99 inches Maximum record width is 99.99 centimeters
The record width you entered exceeds the 99.99 inches (or 99.99 centimeters) maximum. Enter a valid record width value.
Memo field (field name) is no longer in file (file name)
This warning message provides information about a change made to the table or text-memo file structure since the report was last saved. The field may have been deleted from the file.
If you are using Report Viewer, you may have used the control table to change a table or memo file used in the report. If the files selected report execution do not have the same fields as the original files, you will get this message. Report Designer erases deleted fields from the report layout, and you may have to edit calculated fields.
Missing AS Missing SELECT
The statement used as the basis of a user-SQL report must begin with DEFINE REPORTVIEW, EXEC, or SELECT.
Missing argument

Appendix A: Error Messages
R&R ReportWorks SQL User Manual Page 675
Your UDF declaration contains a comma as an argument separator, but no argument follows the comma. Delete the comma from the declaration or follow it with an argument.
Missing REPORTVIEW name
You did not provide a result table name in the REPORTVlEW statement.
Missing result table column name
A derived or aggregate field in your SELECT statement has not been assigned a field alias.
Missing RSWSQL.INI. Report Designer will use generic ODBC . . .
While it is possible to run Report Designer without having RSWSQL.INI in the program directory, it is not recommended. RSWSQL.INI contains important information about DBMS platforms and enables Report Designer to take better advantage of the underlying DBMS.
Missing stored procedure name
A user-SQL report can be based on a user-SQL statement of the form "EXEC <stored procedure name>". This error indicates that your user-SQL statement started with EXEC, but included no stored procedure name.
Missing user management file
The user management file, RSWUSERS.DAT, is not in the program directory or link directory. If the file has been moved, copy it to the Report Designer program directory or link directory. If the file has been deleted, restore it from your backup.
Multiple (name) settings in RSW.SRT
RSW.SRT contains more than one value for the setting with the name specified in the error message. Remove all but one of the lines specifying a value for that setting.
Must start with SELECT or DEFINE REPORTVlEW
You entered a statement starting with something other than SELECT, DEFINE REPORTVIEW, or EXEC.
Name in use
A user defined function's name is already in use. Use a different name for this user function.

Appendix A: Error Messages
R&R ReportWorks SQL User Manual Page 676
No default Data Source specified
Reports do not have a Data Source associated with them. You will see this error when trying to open a report without specifying a Data Source.
No available network user ID
All serial numbers in RSWUSERS.DAT are in use. To check the status of serial numbers, run the User Management program (RSWUSERS.EXE). Wait until a user exits the program and try again.
No closing parenthesis
Your UDF declaration has no closing parenthesis. Add the closing parenthesis.
No fields to export on selected line
There are no exportable fields in the selected band area.
No library specified
In running Report Viewer, you specified a control table that contains no data in the RI_LIBRARY field. Edit the control table so that it specifies a report library file.
No master table specified
No master table was specified for the MasterTable keyword in the Report section of the script file. A master table must be specified in this section.
No opening parenthesis
Your UDF declaration has no opening parenthesis. Add the opening parenthesis.
No printer fonts available
No printer fonts are currently available. Make sure that at least one Windows printer is installed and that it is active (see your Windows documentation).
No printers installed
No printers are installed or active in Windows; see your Windows documentation for information about installing printers.
No records found
The report definition resulted in no records selected. Check any filter the report

Appendix A: Error Messages
R&R ReportWorks SQL User Manual Page 677
contains. For a detailed list of report characteristics, print a report specification.
No reports defined
You tried to retrieve a report from an empty report library. It you want to use a different library, use Open Library on the Open Report dialog box to select a library.
No table names found in the specified directory, (directory)
When selecting tables through the Directory button, you have specified a directory in which there are no tables for the current Data Source. Re-select a directory that has tables.
Not a database table
The file selected is not a database table or else it is damaged. Either select a database table or restore the damaged table from a backup copy.
Not a valid dBase III index file: (file name)
In a User-SQL report based on dBase tables, you specified one of the following index types in the SELECT statement: FoxBase+ IDX; FoxPro IDX, CDX. Report Designer cannot use these indexes. You must edit the SELECT and specify a supported index type.
Not a valid report field name
The name you have chosen for a calculated or total field contains characters that are not valid in a field name. Use only valid field name characters. See Working with Fields.
Numeric field (field name) is no longer in table (table name)
This warning message provides information about a change made to the database table structure since the report was last saved. The field may have been deleted from the table.
If you are using Report Viewer, you may have used the Viewer control file to

Appendix A: Error Messages
R&R ReportWorks SQL User Manual Page 678
change one or more of the tables used in the report. If the tables selected at report execution do not have the same fields as the original tables, you will get this message. Report Designer erases deleted fields, as well as fields that total them, from the report layout. Calculated fields that use deleted fields must be edited before you can run the report.
Numeric value required
This operation requires that you supply a numeric value.
Object is positioned on new page line
You tried to move one or more objects to a line designated as a new-page line. Move the object off the line.
Only left parentheses may be entered
You can enter only left parentheses (one or more) in this field.
Only right parentheses may be entered
You can enter only right parentheses (one or more) in this field.
Output file append is not supported in this version
The Report Viewer does not allow you to append to an existing file when printing to file.
Page header/footer may not contain new-page lines
You cannot create a new-page line in a Page Footer or Page Header band. See Working with Bands.
Point size not supported in current printer
You entered a point size that is not supported by the current Windows printer. Select a point size from the list box.
Preprocessed total at total-related group level
Totals that reset or accumulate on group fields that are themselves preprocessed totals (or calculated fields whose expressions include preprocessed totals) cannot be designated as preprocessed. You will not be able to run your report until you change either of the offending totals to a running total.

Appendix A: Error Messages
R&R ReportWorks SQL User Manual Page 679
Preprocessed total at unassigned group level
You have a preprocessed total field that resets at group level n, but no field has been assigned to this group level. Assign a field to that group level.
Print spooler out of disk space
The Windows print spooler has run out of disk space. You must move or delete files to free up additional disk space.
Print spooler out of memory
The Windows print spooler has run out of memory. Terminate other Windows applications to free up memory and try again.
Printer does not support landscape orientation
The current printer does not support this orientation. Either select another printer or change to Portrait orientation.
Printer does not support page length and/or orientation specified. Select a fixed size.
The current printer does not support the current page size or orientation. Either select another printer or change the page size or orientation.
Printer initialization error (check available memory)
Report Designer was unable to call the specified printer driver. Make sure that the printer driver associated with the current Windows printer is available. Therefore, your system may not have enough memory available. If possible, close other applications and try again.
QUERY( ) used indirectly
You cannot use the QUERY( ) function within other functions. QUERY( ) must be the entire expression.
Range must contain two items
You tried to end a range list that contains only one value. Enter two values, the first for the lower limit of the range and the second for the upper limit.
Range or list value is too long
The range or list value is too long to evaluate. Shorten the value if possible, or specify the query using additional selection rules.
Range out of order
Appendix A: Error Messages
R&R ReportWorks SQL User Manual Page 680
You must list range values in the Compared To box in ascending order.
Record caching error
Report Designer has encountered a problem in generating the temporary file it uses to prevent widows or orphans in your report. Contact Liveware Technical Support.
Record copies: Invalid field name or numeric value
In the Copies group box, you either entered an invalid numeric value or selected an invalid field.
Report dictionary does not exist
Report Designer could not find the report dictionary specified in the File Settings options dialog box.
Report Dictionary error ⎯ incorrect file format
One or more of the required report dictionary fields ⎯ TABLE_NAME, FIELD_NAME, or COMMENT ⎯ is missing. If you have created a dictionary with nonstandard field names, be sure to specify your dictionary's field names in the Data Dictionary section of RSW.INI.
Report dictionary requires a table and an index file
You must specify both a report dictionary filename and the name of its index file if you specify either.
Required argument
The specified function is missing an argument. You may have omitted a comma between arguments. For predefined functions, check either the help screen or the entry for this function in Using Functions. Then change the expression to include the correct number of arguments.
Required argument at offset (n) of RI_FILTER
The expression in the RI_FILTER field in the Viewer control table cannot be compiled because it is missing a required argument. The offset number indicates the character position where the argument was expected to begin. For example, "offset 10" indicates that the argument was expected to begin at the 10th character in the filter expression. Edit the expression (refer to the explanation of

Appendix A: Error Messages
R&R ReportWorks SQL User Manual Page 681
the "Required argument" error message).
Reset level inconsistent with (field name)
When you are selecting the reset level of a total field that totals another total field (or a calculated field derived from another total field), this message indicates that you are trying to reset the current total at a less inclusive level than the reset level of the existing total.
Select a reset level that is more inclusive than the reset level of the field being totaled. From least inclusive to most inclusive, the reset levels are Level 8, Level 7, Level 6, Level 5, Level 4, Level 3, Level 2, Level 1, Page, Grand.
Ruler spacing may be 4 to 30 characters per inch
You may not have a ruler spacing of fewer than 4 or more than 30 columns per inch.
SELECT statement would return unsupported data type
The SELECT statement serving as the basis of a user-SQL report is requesting data from a field not supported by Report Designer. Remove the offending field from the SELECT statement.
Send Mail failed to send message
Report Designer encountered an internal error when attempting to mail a report file. Save your work and exit Report Designer. Restart Windows and try again.
Single value required
You can enter multiple values in the Compared To box only for range or list comparisons. All other comparisons require a single value in the Compared To box.
Sort and group fields are out of synch
In a report that sorts on a preprocessed total (or a calculated field whose expression includes such a total), your sort and group fields must be in the same order. See Sorting and Grouping Data for information about how preprocessed totals affect sort fields.
Starting page too large
You tried to print the report starting at a page number higher than the total number of pages in the report. On the Print dialog box, enter a lower starting page number.
Syntax error

Appendix A: Error Messages
R&R ReportWorks SQL User Manual Page 682
You tried to enter a meaningless expression. This is often caused by an incomplete expression such as Amount +. Refer to the Using Calculated Fields.
Syntax error at offset (n) of RI_FILTER
The expression in the RI_FILTER field in the Viewer control table cannot be compiled because it contains a syntax error. The offset number indicates the beginning character position of the incorrect syntax. For example, "offset 10" indicates that the incorrect syntax begins at the 10th character in the filter expression. Edit the expression (refer to the explanation of the "Syntax error" message).
Syntax stack overflow
You tried to enter an expression that is too complex. First try to eliminate any unnecessary parentheses. Also try to simplify the expression. For example, if you want to define field X as (A+B) * (C+D) but this causes an overflow, create two calculated fields Y and Z. Define Y as A+B. Define Z as C+D. Then define X as the expression Y*Z.
Syntax stack overflow at offset (n) of RI_FILTER
The expression in the RI_FILTER field in the Viewer control table cannot be compiled because it is too complex. The offset number indicates the position of the character that is causing the problem. For example, "offset 10" indicates that the 10th character in the filter expression is invalid. Edit the expression (refer to the explanation of the "Syntax stack overflow" error message).
Table contains no supported fields
The indicate contains only fields that are not supported by Report Designer.
Template library does not exist
Report Designer could not find the default template library specified in the File Settings options dialog box.
The /G switch requires a valid Library file and Report name
You have used the /G switch without providing a valid library and report to run.
The page number is too large. Please enter a value less than or equal to...
You have entered a page number value that exceeds the maximum of 65,534.
Appendix A: Error Messages
R&R ReportWorks SQL User Manual Page 683
Correct the page number entry.
The SQLEXP( ) function is not supported in User Defined Functions
You cannot create User-Defined Functions that contain the SQLEXP( ) function or that use calculated fields that are derived from the SQLEXP( ) function.
The SQLEXP( ) function is not supported in User-SQL reports
You cannot create a User-SQL report that uses the SQLEXP( ) function.
There is no bitmap in file (file name)
The image file you are trying to insert contains no bitmap information. EPS, PCT, WMF, and WPG file formats can contain both bitmap and vector components. Report Designer can use a file in one of these formats only if the file contains bitmap information. You will be able to insert this image into a report only if you first use a graphic conversion program to convert the file to a bitmap format such as TIFF, PCX, or BMP.
Note that many commonly available EPS, PCT, WMF, and WPG clipart files are vector-format files that contain no bitmap information. You will have to convert such files to bitmap format for use in Report Designer reports.
There is no master table, so no data to export
The current report has no master table attached, so there are no composite records to export.
This data source's section of the Windows Registry should include a string value named QEDATADICTEXTENSIONS with data '1'.
Your data source is using the Microsoft Text driver; you must add the specified line to the relevant section for that data source in ODBC.INI.
TO-field is no longer in table

Appendix A: Error Messages
R&R ReportWorks SQL User Manual Page 684
In opening a report, Report Designer needed to create a "dummy" join field. You need to replace the dummy join field with an actual field.
Too many arguments
The specified function includes too many arguments. You may have entered an extra comma after the last argument. For predefined functions, check either the help screen or the entry for the function in Using Functions. Then edit the expression to include the correct number of arguments.
Too many arguments at offset (n) of RI_FILTER
The expression in the RI_FILTER field in the Viewer control table cannot be compiled because it contains too many arguments. The offset number indicates the beginning character position of the excess argument. For example, "offset 10" indicates that the 10th character in the filter expression is invalid. Edit the expression (refer to the explanation of "Too many arguments").
Too many connections!
Report Designer supports a maximum of 100 connections.
Too many 'equivalences' in RSW.SRT
You have attempted to specify more than 128 'equivalences' in RSW.SRT. See RSW.SRT for a definition of 'equivalence'.
Too many 'expansions' in RSW.SRT
You have attempted to specify more than 128 'expansions' in RSW.SRT.
Too many 'inequalities' in RSW.SRT
You have attempted to specify more than 128 'inequalities' in RSW.SRT.
Too many join pairs
Currently, at most 10 join pairs can be used in a multi-column join.
Too many lines. Maximum is 256
The number of lines you are trying to insert or create will make the report exceed the maximum of 256 band lines. Enter a number that will not force the report to exceed this limit.
Too many nested IIFs

Appendix A: Error Messages
R&R ReportWorks SQL User Manual Page 685
You tried to enter an expression that is too complicated to fit in the storage space allotted for it by Report Designer. Break the expression into sub-expressions and then combine the sub-expressions.
Too many nested lIFs at offset (n) of RI_FILTER
The expression in the RI_FILTER field in the Viewer control table cannot be compiled because it is too complicated to fit in the allotted storage space. The offset number indicates the position of the character that is causing the problem. For example, "offset 10" indicates that the 10th character in the filter expression is invalid. Edit the expression (refer to the explanation of the "Too many nested IIFs" error message).
Top plus bottom margin exceeds page length
The sum of the values entered for the "Top margin" and "Bottom margin" print options is greater than or equal to the value entered for "Page length". Check your values for these print options.
Total condition for (total field name) must be edited
Because of calculated field or database changes, Report Designer can no longer evaluate a total condition. You must edit the indicated total’s condition.
Total (field name) cannot be evaluated
This warning message provides information about changes that have been made to the database file structure since the report was last saved. When you retrieve a saved report, Report Designer checks to make sure that total fields don't refer to fields that have been renamed or deleted from the database. No action is needed. A total field referring to a field that no longer exists in the database is automatically deleted.
Type cannot be changed. Field is linking field Type cannot be changed. Field is totaled Type cannot be changed. Field used in filter
You tried to change the data type of a calculated field used in another part of the report. This is not possible since it would invalidate the other reference to this field. First delete the reference to the field in the part of the report that is specified in the message. Then try again.
Unable to load or find the setup DLL for (data source

Appendix A: Error Messages
R&R ReportWorks SQL User Manual Page 686
name)
You selected “Configure Data Source” button on the No Tables Found dialog box, but Report Designer cannot find or load the setup DLL for the specified data source. In the section for the data source in ODBCINST.INI, make sure there is an entry for the named data source and that the pathname to the setup DLL exists.
Unable to read RRLABELS.INI
Report Designer could not initialize the list of label types because it could not find or read the RRLABELS.INI file in the program directory.
Unable to read write-only property Unable to read from (filename), it is opened by someone else Unable to write read-only property Unable to write to (filename), it is read-only or opened by someone else
See Access denied to file: (file name).
(filename) Unable to register document. The document may already be open.
Report Designer was not able to register the report file with the Windows OLE system. Report Designer cannot open a report file that is open by another application.
Unable to start print job
Report Designer cannot communicate with the printer driver for the current printer. Verify that the current printer is correctly installed and that the driver file is available; then try again.
Unbalanced parentheses
You tried to save a filter or calculated field expression that contains an unequal number of left and right parentheses. Either delete the extra parenthesis or insert the missing one.
Unbalanced parentheses at offset (n) of RI_FILTER
The expression in the RI_FILTER field in the Viewer control table cannot be compiled because it contains an unequal number of left and right parentheses. The offset number indicates the position of the character that is causing the problem.

Appendix A: Error Messages
R&R ReportWorks SQL User Manual Page 687
For example, "offset 10" indicates that the 10th character in the filter expression is invalid. Edit the expression (refer to the explanation of the "Unbalanced parentheses" error message).
Unexpected file format
The file specified is not a valid report file.
Unknown or ambiguous group field (field) Unknown or ambiguous sort field (field)
The group or sort field passed in the Viewer control file either does not exist in the database or is ambiguous. Verify that the field name exists in the database and that there is no other field with the same name in other related tables.
Unrecognized name or operator
You tried to enter an expression that contains an invalid operator or the name of a non-existent field or function. This is often the result of a spelling error or a character constant without delimiters. Delete the unrecognized item and then, to avoid spelling errors, select the item from the appropriate list box.
Unrecognized name or operator at offset (n) of RI_FILTER
The expression in the RI_FILTER field in the Viewer control table cannot be compiled because it contains an invalid field, function, or operator. The offset number indicates the position of the character that is causing the problem. For example, "offset 10" indicates that the 10th character in the filter expression is invalid. Edit the expression (refer to the explanation of the "Unrecognized name or operator" error message).
Unsupported combination of preprocessed totals
Fields that total other total fields cannot be preprocessed when the total-of-total accumulates more frequently than the field being totaled resets. You will not be able to run your report until you 1) change the total-of-total field to a running total or 2) change the reset level of the field being totaled.
Unsupported totals sort
You cannot sort on a calculated field whose expression includes both a preprocessed total and a database field. Edit the calculated field you are sorting on or select another sort field.
Unterminated string
You tried to enter an expression that contains a character string that is not terminated with a delimiter. Character strings must be enclosed within single quotes, double quotes, or square brackets. Enter the second delimiter and try again.
Appendix A: Error Messages
R&R ReportWorks SQL User Manual Page 688
Unterminated string at offset (n) of RI_FILTER
The expression in the RI_FILTER field in the Viewer control table cannot be compiled because it is missing a character string delimiter. The offset number indicates the position where the delimiter was expected to be found. For example, "offset 10" indicates that a delimiter was expected at the 10th character in the filter expression. Edit the expression (refer to the explanation of the "Unterminated string" error message).
Use of invalid user function
A calculated field or UDF formula in your report contains a reference to an invalid UDF name, perhaps because the name conflicts with the name of an internal Report Designer function. You must change the invalid UDF name and then edit the calculated field or UDF formula.
User file does not exist (file name)
The user management file, RSWUSERS.DAT, does not exist in the program or link directory. Move the file to the appropriate directory. If the file has been deleted, restore it from your backup.
User function access error
See the explanation of the "Cannot create ..." error messages.
User function used in linking field '<field name>'
The user function cannot be deleted, as it is required by its use in the named linking field.
User function (user-function) must be edited
Report Designer can no longer evaluate the user-function, perhaps because it references other user-functions that have been deleted. Edit the user function declaration and/or formula.
User function declaration required
You omitted the declaration for the UDF you are creating or editing. You must supply a UDF declaration.
Value(s) not in range
You tried to enter a value outside the acceptable range of values. Enter a value within the acceptable range.
Viewer control table column RI_ID not found
Appendix A: Error Messages
R&R ReportWorks SQL User Manual Page 689
You have specified a Row ID on the Report Viewer command line, but the control table does not contain the necessary RI_ID column. Either correct the Row ID on the command line or edit the control table.
You cannot copy to the current library
You selected the current report library as the destination for "Copy Report To." You cannot copy a report to the source library file.
You must first select a field
You tried to use a command that applies to a field when a field is not selected. Point to the appropriate field and try the command again.
You must select a related table
You must select a related table in order to define a database join.
$ This report cannot be saved in a library without information loss. It must be saved as a report file (.RSW) instead.
You must name the report file using .RSW as its extension.
You must select a table from the DBC
When working with a report based on a Visual FoxPro DBC file, the master file and all related files must be selected from the same DBC file. The change you are making, selecting a related file or changing the master file, would violate this restriction, so is not allowed.
"Could not locate Designer entry point in export DLL"
There is a mismatch between Excel export.exe and .dll. An invalid installation or a product version conflict could have caused the error.
"Could not locate Viewer entry point in DLL: <dll name>"
There is a mismatch between Excel export.exe and export.dll. This is possibly caused by likely an invalid installation or a product version conflict.
Chart must be edited: "Cannot specify a sub-category for a chart in the record band"
$ This report cannot be saved in a library without information loss. It must be saved as a report file (.RSW) instead.

Appendix A: Error Messages
R&R ReportWorks SQL User Manual Page 690
The Sub-category field is used to define a different way of obtaining data for the chart and cannot be specified in the record band. When you specify a Sub-category, you are essentially informing the charting software that the single Selected Field can be thought of as being composed of a series of values of the Sub-category Value Field.
In this case, the Selected Field’s values are not actually used at all in preparing the chart, though the Sort and Label Field values associated with the Selected Field are used. A given chart can contain more than one Selected Field or a Sub-category but not both, since the Sub-category Value Field replaces the Selected Field as the source of data.
Chart must be edited: "Missing "Selected Fields' or 'Label" or 'Sort field"
One of the following values expected on the Data page to be charted is missing. You need to provide:
• One or more Selected Fields whose values provide the data to chart.
• A Label Field whose values provide labels for the data points.
• A Sort Field whose values are used to order the data points. By default this will be the same as the Label Field. When specifying the Sort Field, you can also specify whether the sorting is to be ascending or descending and whether to combine duplicate sort field values.
Error reading file <filename>
This error can result from several circumstances. For example:
(1) When Report Designer is trying to read from a file that is locked by another user. In this case, you are given the option of aborting or retrying the read. Retrying often solves the problem, if done after the other user has unlocked the file.
(2) When Report Designer is trying to access either a Visual FoxPro DBC file or another file from the database of such a DBC file that is locked by another user. No retry option is given in this case.
Fax/modem device not detected on machine
Try to right click to send to FAX.
No Printer Specified
You must specify the printer that you want the report sent to. The system does not send the report to the default printer.
No Registry entry exists for the provider type specified by dwProvType.
The provider DLL file could not be loaded, and may not exist. If it exists, then the
Appendix A: Error Messages
R&R ReportWorks SQL User Manual Page 691
file is not a valid DLL.
The error occurred while loading the DLL file image, before verifying its signature.
One of the parameters contains an invalid value. This is most often an illegal pointer.
The value is either invalid or out of range.
<report name> is being used. Do you want to make a copy?
The report you want to access is currently open by another process. You can either make a copy or wait until the file is closed.
'Selected Fields' must not be from shallower level than header band containing chart
You cannot make a chart of totals from shallower group levels than the band the chart is in if the chart is in a header band. It is OK in use totals from shallower group levels in charts in footers.
For example, suppose you have a report with group levels of order-id within customer-id and totals for both group levels. Order-id is the deeper group level, customer-id the shallower level. It is OK to have charts of order totals in customer headers and footers, and it's OK (though, perhaps strange) to have charts of customer totals in order footers, but it's forbidden to have charts of customer totals in order headers.
The absolute or relative URL address must contain RRPRVIEW.CAB
The control URL input does not contain the filename RRPRVIEW.CAB. You must supply RRPRVIEW.CAB.
The operating system ran out of memory during the operation.
The operation could not proceed when the operating system ran out of memory. Please shut down other applications or reboot the system.

Appendix A: Error Messages
R&R ReportWorks SQL User Manual Page 692
The dwFlags parameter is CRYPT_NEWKEYSET, but the key container already exists.
The Registry entry for the pszContainer key container was found (in the HKEY_CURRENT_USER window), but is corrupt.
To override the printer selection, you must specify a printer name.
To properly use the "Printer" or "Port" properties, you must supply a valid printer name. This is a Viewer OCX error.
The Registry entry for the key container could not be opened and may not exist.
No Registry entry exists in the HKEY_CURRENT_USER window for the key container specified by pszContainer. "The CSP ran out of memory during the operation."
Unknown error: %ld.
An unknown error occurred. Possible causes could be bad data, such as a wrong password, or one of the parameters contains an invalid value, or the operating system ran out of memory during the operation.
You must specify either .HTM or .HTML extension
When exporting to an ActiveX file, you must provide the .HTM or .HTML extension. The system does not automatically
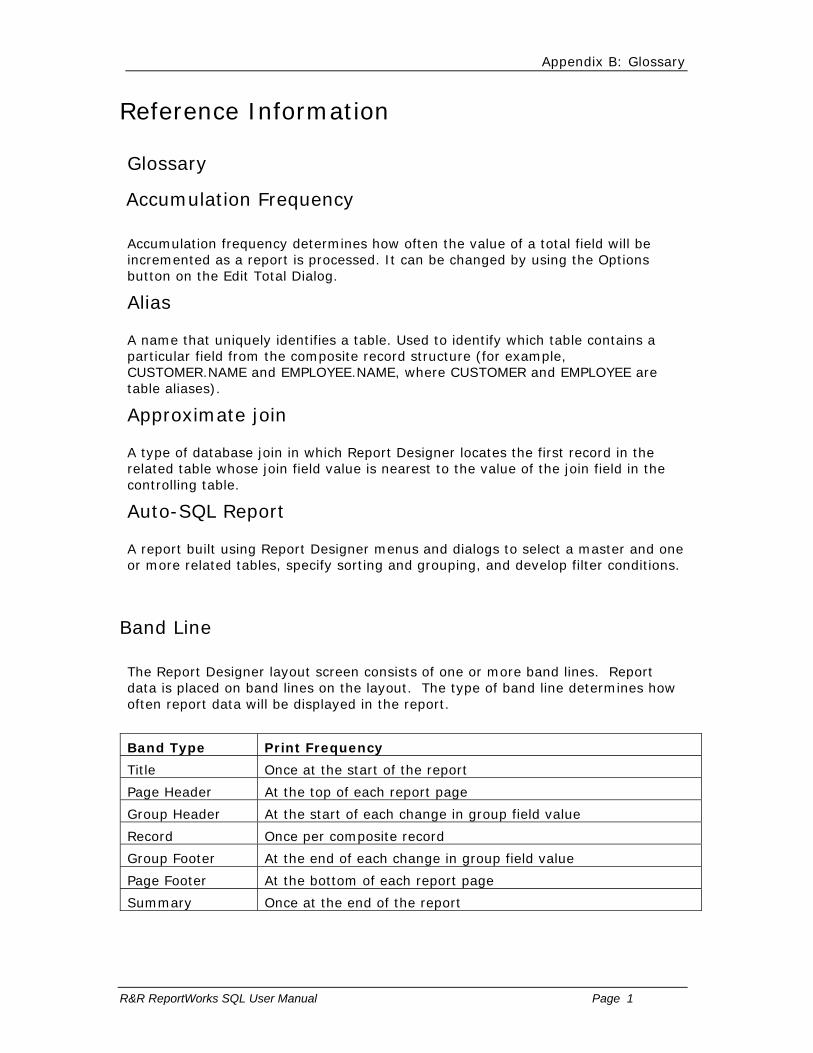
Appendix B: Glossary
R&R ReportWorks SQL User Manual Page 1
Reference Information
Glossary
Accumulation Frequency
Accumulation frequency determines how often the value of a total field will be incremented as a report is processed. It can be changed by using the Options button on the Edit Total Dialog.
Alias
A name that uniquely identifies a table. Used to identify which table contains a particular field from the composite record structure (for example, CUSTOMER.NAME and EMPLOYEE.NAME, where CUSTOMER and EMPLOYEE are table aliases).
Approximate join
A type of database join in which Report Designer locates the first record in the related table whose join field value is nearest to the value of the join field in the controlling table.
Auto-SQL Report
A report built using Report Designer menus and dialogs to select a master and one or more related tables, specify sorting and grouping, and develop filter conditions.
Band Line
The Report Designer layout screen consists of one or more band lines. Report data is placed on band lines on the layout. The type of band line determines how often report data will be displayed in the report.
Band Type Print Frequency
Title Once at the start of the report
Page Header At the top of each report page
Group Header At the start of each change in group field value
Record Once per composite record
Group Footer At the end of each change in group field value
Page Footer At the bottom of each report page
Summary Once at the end of the report

Appendix B: Glossary
R&R ReportWorks SQL User Manual Page 694
Calculated field
A field created in Report Designer whose value is calculated as a report is generated. You specify a formula that is used to calculate the field's value; for example, PRICE*QUANTITY multiplies the value of the PRICE field by the value of the QUANTITY field to produce a calculated field value.
Composite record
A single record (row) from the composite record structure.
Composite record structure
The combination of all fields from all tables (master and related) used by a report, as well as all calculated and total fields created in that report.
Controlling table
The table used to initiate a database relation (that is, the table that contains the join field for a relation).
Data files
Files that contain specific data that is used to generate a report. Data files include database or table files and memo files.
Data type
The type of data a field contains. Fields can have one of five data types: character, numeric, date, logical, or memo.
Database
A collection of logically related data files (tables, views, data dictionary files); depending on your SQL platform, these database elements might be contained in a single database file or in separate files and/or directories.
For example, an Employees database might include the tables EMPLOYEE, for employee names and addresses; BENEFITS, for benefits information; and SALARIES, for salary information.
Database field
A field (column) from a database table.
Database join
A join defined in Report Designer between two tables so that data from both tables is available for a report.

Appendix B: Glossary
R&R ReportWorks SQL User Manual Page 695
Exact join
In an Exact join, Report Designer searches for all the records in the related table that match the join field value in the controlling table. In some cases, this search results in a one-to-one match between records in the two tables. In other cases, Report Designer may find many records in the related table that match the controlling join field value.
Exact joins can be based on any type of field except a logical or memo field.
Expression
A formula used to compute the value of a calculated field using fields, constants, operators, and functions.
Field
The basic unit of information in a table or in the composite record structure.
Filter
A set of user-defined selection conditions to include or exclude records.
Footer
A report band type. A report can have Page Footers that print once at the bottom of every page, or Group Footers and that print once at the end of each group. Page Footers often contain information such as page numbers and dates. Group Footers often contain summary information for each group, such as a group total.
Freeform Bandline
A freeform band line is a line whose height has been adjusted. Free form band lines will contain blue sizing arrows in the Line status area on the left of the report designer layout screen.
Function
A set of instructions that performs a special operation, such as converting lowercase letters to uppercase or calculating the number of days between two dates. Report Designer includes over 100 pre-defined functions and allows you to create your own functions, called User-Defined Functions (UDFs)
Group field
A field used to group report data into categories. For example, in a customer report you can use a COUNTRY field to group customers by country. Report Designer allows up to eight group levels in a report.

Appendix B: Glossary
R&R ReportWorks SQL User Manual Page 696
Group Footer
A footer that prints once for each group. Group Footers often contain summary information for the group. For example, in a customer report grouped by country, a Group Footer might include a total field that counts the number of customers in each country.
Group Header
A header that prints once for each group. For example, in a customer report grouped by country, a Group Header might include the country name.
Header
A report band type. Reports can have Page Headers that print once at the top of every page, or Group Headers and that print once at the beginning of each group. Page Headers often contain information such as page numbers and dates. Group Headers often contain the name of the group field or column headings.
Join field
In a database join, the field in the controlling table that is used to search for matching records in the related table. The join field in the related table must contain the same data as the join field in the controlling table.
Library files
DOS files that act as "file folders" to contain report definitions. Report libraries are a convenient way of organizing related reports.
Master table
The table that serves as the initial source of data for a report.
Memo file
A text file that contains one or more memos and, optionally, field references that Report Designer uses to generate merge documents such as form letters.
New Page Line
A New Page line is a band line option that tells R&R to start a new page. A New Page line appears on the report layout as a dashed line.
Operator

Appendix B: Glossary
R&R ReportWorks SQL User Manual Page 697
A symbol (such as a plus sign) that performs an operation within an expression. Report Designer provides five types of operators: arithmetic, date, character, relational, and logical.
Page Footer
An area of a report containing data that will print or display at the bottom of each report page.
Page Header
An area of a report containing data that will print or display at the top of each report page.
Record
A row of information in a database table or in a composite record structure.
Related table
In a database join, the table that is joined to the controlling table. To generate a report that draws information from more than one table, you first define database joins among the related tables you want to use.
Report Specification
A Report Specification is a document that lists the complete contents of a report. To create a report specification, you use the command File Print to display the print dialog. In the Print What list at the bottom left, click the right area and select the third choice Report Specification
Sort field
A field that you select in Report Designer which controls the order in which data is read from the composite record structure.
Summary
An area of a report containing data that will print or display at the end of the report or, optionally, on a separate page.
Table
A database file containing fields (columns) and records (rows).
Text memo file

Appendix B: Glossary
R&R ReportWorks SQL User Manual Page 698
A specially designed text file used to supply memo fields to a report.
Title
An area of a report containing data that will print or display at the beginning of the report or, optionally, on a separate page.
Total field
A field that contains summary information such as subtotal and total figures. The value of a total field is calculated according to the total options you select.
Trim
A field setting that controls whether Report Designer removes or retains blank space between fields on the same line in your report.
User-defined function (UDF)
A function that processes field values according to an expression or formula that you define. You can create UDFs to perform complex operations beyond those available through predefined functions.
User-SQL Report
A report built by entering the appropriate SQL SELECT statement (or a string to execute a stored procedure) instead of selecting master and related tables from Report Designer menus.
Open Scripting
Open Scripting allows you to use a specially formatted text file to create a single file report that can be used by either the Report Designer or runtime.
Pre-processed total
A Pre-processed total is a total whose Options processing has been changed from the default value of running. A pre-processed total is computed by a preliminary pass through the database to derive a group or grand total. This allow you to use this total in a header or to create percent of total calculation.
Data Dictionary
Data Dictionary is an R&R utility program that allows you to provide meaningful

Appendix B: Glossary
R&R ReportWorks SQL User Manual Page 699
descriptions for field names, set default alias names for tables, set default display formats for fields and define calculations that will be available across reports
Export
Export allows you to send the output of a report to an external file such as a text file, a spreadsheet or a database file.
ParameteRR field
A parameteRR field is a calculated constant whose value can be determined when a report is executed through user input to a ParameteRR value entry screen. ParameteRRs are often used to supply information for report filters.
Rapid Runner
Rapid Runner is a menu driven utility program that can be used automate and batch the execution of reports.
Result Set
A result set consists of all of the active report fields from composite records that are built by Report Designer. You can both view and export result sets during report design.
Report Librarian
Report Librarian is a utility program that allow you to track the location and contents of report files.
Report Wizard
You can select Report Wizard to create a new report. This wizard allows you to create either a label, basic columnar or grouped columnar report layout using a set of simple selection screens. This report can then be edited within the Report Designer just as if it had been created manually.
Ruler Spacing
R&R allows you to control the horizontal and vertical ruler spacing for the report designer layout screen. This spacing control the number of increments per inch on

Appendix B: Glossary
R&R ReportWorks SQL User Manual Page 700
each ruler and also controls the grid of dots that can optionally be displayed. Changes in ruler will impact the spacing between fields on the layout.
Runtime
Runtime allows you to execute reports created by the Report Designer without needed to use a Report Designer license. Runtime consists of set of freely re-distributable files.
Runtime Shortcuts
Runtime Shortcuts can be created using the Quick Runtime Shortcuts utilty program. This program is menu driven utilty that allows you to create Windows shortcuts to run R&R reports using R&R runtime.
Snap to Grid
Enabling Format Snap to Grid causes fields placed on the report layout to be aligned/snapped to the nearest grid dot. It also controls the available free form line height size in Band Line Properties.
Swap Header/Footer
Swap header/footer is an available option within Database Group Order. When swap header or footer is enabled, a new page is started for each group change. Any swap header is printed in place of the page header for the first page of the group and any swap footer is printed in place of the page footer for the last page of the group. To work appropriately, the report layout needs to have an equal area of group and page lines.
Template file
A template is a report definition with a specialized purpose. It uses a different file extension and is designed to serve as a starting point for a series of reports. You can create and modify templates in the same way as you do for reports.
Appendix B: License Agreement
R&R ReportWorks SQL User Manual Page 701
ReportWorks License Agreement
PLEASE READ THIS LICENSE CAREFULLY BEFORE COMPLETING THE INSTALLATION AND SETUP OF THE SOFTWARE, OR USING OR REPRODUCING THE SOFTWARE. BY CONTINUING WITH INSTALLATION AND SETUP BEYOND THIS POINT, USING OR REPRODUCING THIS SOFTWARE, YOU ARE AGREEING TO BE BOUND BY THE TERMS OF THIS LICENSE. IF YOU DO NOT AGREE TO THE TERMS OF THIS LICENSE, PROMPTLY RETURN THE UNUSED SOFTWARE PACKAGE(S) TO THE PLACE WHERE YOU OBTAINED IT AND YOUR MONEY WILL BE REFUNDED.
1. DEFINITIONS. As used in this Agreement: The term “Product” refers collectively to the compact disks or diskettes and the software programs recorded on them provided by Liveware Publishing Inc. (“LP”) under the name R&R Report Works, and all updates subsequently provided by LP, if any; the term “Recorded Programs” refers to the software programs recorded on the compact disks, DVD’s or diskettes; the term “Runtime” refers to the Recorded Programs listed in the Product’s online “Help” as runtime files; and the term “Designated Computer” refers to either (i) a stand-alone workstation, or (ii) a networked workstation which does not permit the Recorded Programs to be shared with other networked workstations, unless a separate licensed serial number has been obtained from LP for each simultaneous, non-Runtime user.
2. LICENSE. LP grants you (“You”), the end user, a nonexclusive license: (a) to use the Recorded Programs on a single Designated Computer, and (b) for you to use, and to permit others to use, copies of the Runtime for the purpose of printing reports from report format files created by the Product or to define printer configurations or font information files for the printing of such reports. You agree that you will not use or permit the use of the Recorded Programs, other than the Runtime, in any manner that enables more than one person to use them at the same time. You may, however, use the Recorded Programs on a network, provided that you ensure that a separate licensed serial number has been obtained from LP for each simultaneous, non-Runtime user. You may transfer the Recorded Programs to another Designated Computer not more than once every thirty days, provided that the Recorded Programs are removed from the Designated Computer from which it is transferred. LP may terminate this license if You fail to comply with all the terms of this License. Upon such termination, You must destroy all originals and copies of the Product in Your possession.
3. OTHER RESTRICTIONS. You may not sell, rent, license, lend or otherwise transfer the Product to any other person or entity, except that You may transfer on a permanent basis all of Your license rights to the Product if You do not keep any copies of the Product or accompanying materials and the recipient agrees to the terms of this license. You must comply with the then-applicable United States export control laws in your use or transfer of the Product and accompanying materials. You may not modify, translate, reverse engineer, decompile or disassemble the Product. The Runtime may be copied for the purpose described in the license grant above, and, except for this specific use of the Runtime, you agree to copy the Recorded Programs only for backup purposes and for absolutely no other purpose. You also agree not to make copies of any other components of the Product.
4. PROPRIETARY RIGHTS. LP or its suppliers own the Product and all associated patent, copyright, trade secrets and other proprietary rights in the

Appendix B: License Agreement
R&R ReportWorks SQL User Manual Page 702
Product. No title to or ownership of the Product or any associated proprietary rights are transferred to You by this license.
5. LIMITED WARRANTY. LP warrants that, for ninety (90) days from the date of initial receipt, the Product will perform substantially as provided in the accompanying end user documentation. LP’s and its suppliers’ entire liability and Your exclusive remedy for failure of the Product to comply with this Limited Warranty shall be, at LP’s option: (a) repair or replacement of the Product; or (b) return of the price You paid for the Product. To receive this remedy, you must return the Product to LP with a copy of Your receipt within ninety (90) days of the date You initially received the enclosed Product. Any replacement Product will be warranted for the remainder of the original ninety-day warranty period or thirty (30) days from the date You received the replacement, whichever is longer. This Limited Warranty applies only to the original recipient of the Product and is void if the failure of the Product has resulted from accident, abuse, or misuse.
LP does not warrant that the Product is free from all errors and omissions or is suitable for your intended use. LP AND ITS SUPPLIERS DISCLAIM ALL OTHER WARRANTIES, EXPRESSED OR IMPLIED, INCLUDING, BUT NOT LIMITED TO, ANY IMPLIED WARRANTY OF MERCHANTABILITY OR FITNESS FOR A PARTICULAR PURPOSE WITH REGARD TO THE PRODUCT OR ACCOMPANYING MATERIALS, OR ANY RELATED SERVICES.
6. LIMITATION OF LIABILITY. IN NO EVENT SHALL LP OR ITS SUPPLIERS HAVE ANY LIABILITY FOR COVER OR FOR ANY INDIRECT, INCIDENTAL, SPECIAL OR CONSEQUENTIAL DAMAGES (INCLUDING WITHOUT LIMITATION ANY LOSS OF PROFITS OR DATA, BUSINESS INTERRUPTION OR OTHER PECUNIARY LOSS) ARISING OUT OF THE USE OR INABILITY TO USE THE PRODUCT OR THE ACCOMPANYING MATERIALS, OR PERFORMANCE OF OR FAILURE TO PERFORM ANY RELATED SERVICES, EVEN IF LP OR ITS SUPPLIERS HAVE BEEN ADVISED OF THE POSSIBILITY OF SUCH DAMAGES. IN NO EVENT SHALL THE AGGREGATE LIABILITY OF LP AND ITS SUPPLIERS (WHETHER IN CONTRACT, WARRANTY, TORT (INCLUDING NEGLIGENCE), PRODUCT LIABILITY OR OTHER THEORY) (i) ARISING OUT OF THE USE OR INABILITY TO USE THE PRODUCT EXCEED YOUR PURCHASE PRICE FOR THE PRODUCT; OR (ii) ARISING OUT OF THE PERFORMANCE OF OR FAILURE TO PERFORM ANY RELATED SERVICES EXCEED THE PRICE YOU PAID FOR SUCH SERVICES DURING THE YEAR IN WHICH THE CLAIM AROSE. Further, LP will not be liable for any delay or failure to perform any related services or any of its obligations under this license as a result of any causes or conditions beyond LP’s reasonable control.
7. U.S. GOVERNMENT RESTRICTED RIGHTS. If the Product is acquired by an agency or other part of the U.S. Government, the Product and accompanying written materials are provided with Restricted Rights and use, duplication or disclosure is subject to restrictions as set forth in subparagraph (c)(1)(ii) of the Rights in Technical Data and Computer Software clause at 48 C.F.R. § 252.227-7013 or in subparagraphs (c)(1) and (2) of the Commercial Computer Software-Restricted Rights clause at 48 C.F.R. § 52.227-19, as applicable. The contractor/manufacturer is Liveware Publishing Inc., at the address described below.
8. MISCELLANEOUS. This license constitutes the entire agreement between You and LP regarding the Product and all accompanying materials. LP will not be bound by, and specifically objects to, any provision that is different from or in

Appendix B: License Agreement
R&R ReportWorks SQL User Manual Page 703
addition to the provisions of this license (whether or not it would materially alter this license) which is proffered by You in any purchase order, receipt, acceptance, confirmation, correspondence or otherwise (other than terms contained therein identifying the Products and quantities ordered), unless LP specifically agrees in writing to such provision. LP’s acceptance of any order by You is expressly conditioned on Your assent to the terms and conditions of this license. Statements or representations made by employees, distributors, resellers or any other third party do not constitute warranties by LP, do not bind LP and should not be relied on by You. This Agreement is governed by the laws of the State of Delaware without reference to its choice of law principles. The provisions of the 1980 U.N. Convention on Contracts for the International Sale of Goods shall not apply. If you have any questions concerning this license, please write to: Liveware Publishing Inc. 1406 Society Drive Claymont, DE 19703
Appendix B: INI File Settings
R&R ReportWorks SQL User Manual Page 704
INI File Settings
Introduction
R&R has several available initialization files that can be used to tailor your working environment. This section describes the following files. Each one is a plain text file that can be viewed and modified in any text-editing program such as Notepad or Wordpad.
• RSW.INI
• RSW.SRT
• RSWFIF.INI
• RSWSQL.INI

Appendix B: INI File Settings
R&R ReportWorks SQL User Manual Page 705
RSW.INI
RSW.INI is the primary R&R intialization file. When you install R&R, RSW.INI is created in your Windows directory. If you are upgrading a machine that already has an installed INI file, the installer will change the PROGDIR32 setting to point to updated installation directory.
Each time you open the Report Designer, default settings are read from the RSW.INI that impact its behavior. A number of settings can be directly modified by making menu selections in the Report Designer. Other settings (such as the size of the Designer window) are written to the INI based on indirect actions. There are also some settings that can only be made by directly editing RSW.INI with a text editing program. Many settings also have a default value that will be used when a value is not explicitly set.
The structure of RSW.INI is a standard windows initialization with bracket named sections followed by one or more lines of settings.
The following describes the available RSW.INI settings, their default values and the method used to edit them.
Section/Setting Purpose
Default Value Available Values Source
[Defaults]
ProgDir32 Location of designer and runtime executable files
Created by setup
AllowW Allow other users to update tables
1 1=Yes
0=No
Options->Default Settings
BotM Default Bottom Margin 50 Options->Default Settings
Color Default Font Color 0 0=Black Options->Default Settings
DefaultDataSource Default data source used for new reports
Options->Preferences
Data Source
NewReportAlwaysUseSameDS Report Datasource 0=Allow selection of data source for new report
1=Always use default datasource
Options->Preferences
Data Source
ReadReportAlwaysUseSameDS Report Datasource 0=Allow selection of data source when opening report
1=Always saved datasource
Options->Preferences
Data Source
LibDir Default report directory Options->File Settings

Appendix B: INI File Settings
R&R ReportWorks SQL User Manual Page 706
Section/Setting Purpose
Default Value Available Values Source
DefMeas Default measurement system
1 1=inches
0=metric
Windows control panel
FaceName Default font for inserted fields
Arial Options->Default Settings
ImgDir Default image directory Options->File Settings
LeftM Default Left Margin 50 Options->Default Settings
LogF Logical False string F Options->Default Settings
LogT Logical False string T Options->Default Settings
MemExt Default text file extension Options->File Settings
PgLM Default Paper Size 1 1=Letter
5=Legal
7=Executive
9=A4
256=Custom
Options->Default Settings
Pts Default font size 120 Options->Default Settings
RightM Right Margin 50 Options->Default Settings
RulPit Horizontal Ruler Pitch 10 Options->Default Settings
SnapTo Snap to Grid 1 1=Yes
0=No
Options->Default Settings
TemplateLib Default Template Directory
Options->File Settings
TopM Top Margin 50 Options->Default Settings
VRulPit Vertical Ruler Pitch 10 Options->Default Settings
Librarian Report Librarian ON ON=Use
OFF=Disable
Manual edit to change default
PDFDriver PDF Printer Driver ON ON=Use
OFF=Disable
Manual edit to change default

Appendix B: INI File Settings
R&R ReportWorks SQL User Manual Page 707
Section/Setting Purpose
Default Value Available Values Source
Printer Use named printer instead of reading saved printer when opening a report
Can be set to DEFAULT or an available printer name
Manual edit to change default
FloatCompTolerance Used to specify method for comparing floating-point values.
3 Acceptable values are in range -10 to -30 and greater than 1. Values more negative than about -16 are equivalent.
Manual edit to change default
NoRecHDR Controls no records found behavior
1 1 or absent= Runtime honors no records found band line
0=Runtime prints all title/Summary bands when no records are found
(Pre-V11 behavior)
Manual edit to change default
[Export]
Export1 Add Excel PivotTable as Export choice
Excel PivotTable,
RRXTAB.DLL
Set by SETUP when Excel is present on machine
Export2 Add Excel Chart as Export choice
Excel Chart, RRXCHART.D
LL
Set by SETUP when Excel is present on machine
[Frame]
Left Left edge of window
Size and placement of Report Designer is saved in INI and re-used when report is re-opened
Top Top edge of window
Right Right edge of window
Bottom Bottom edge of window
Show Show state of the window
[MRU_Files]

Appendix B: INI File Settings
R&R ReportWorks SQL User Manual Page 708
Section/Setting Purpose
Default Value Available Values Source
MaxMRUFiles Max number of recently used files in File menu
4 Value between 4 and 9
Manual edit to change default
MRU_File1
MRU_File2
MRU_File3
MRU_File4
Most recently used filename
List internally updated as reports are opened
[Preferences]
FieldLists Display format for field names
0 0=Field Names
1=Dictionary
Options->Preferences
FileNew Format for new reports
0 0=Display Dialog
1=Wizard
2=Instant Report
3=Blank Report
4=Template
Options->Preferences
BandClr Display Colored Bands in Preview
1 1=Yes
0=No
Options->Preferences
BandClr1 Display Colored Totals/Groups
1 1=Yes
0=No
Options->Preferences
MemoEd Default Memo Editor
1 1=Xbase
0=Other
Options->Preferences
ScrBarHz Display Horizontal Scroll Bar
1 1=Yes
0=No
Options->Preferences
ScrBarVt Display Vertical Bar
1 1=Yes
0=No
Options->Preferences
SortFieldNames Sort Field Names
0 1=Yes
0=No
Options->Preferences

Appendix B: INI File Settings
R&R ReportWorks SQL User Manual Page 709
Section/Setting Purpose
Default Value Available Values Source
PrevWinClr Use Windows window color for preview page
1 1=Yes
0=No
Manual edit to change default
ShowSplash Show splash screen in runtime
1 1=Yes
0=No
Manual edit to change default
[Save List]
ActionBar View Standard toolbar
1 1=Yes
0=No
View->Toolbar
Band Width Width of Band type column
80 Any re-size is saved and read when designer is re-opend
CloseInsDlg Close dialog after inserting field
0 1=Yes
0=No
Insert->Field
FormatBar Display formatting toolbar
1 1=Yes
0=No
View->Toolbar
FieldNames Display field names or XXX/999 format templates
0 1=Field names
0=format template
View->Field Names
IVER Internal version
Do not change
PasteArgs Paste function arguments for calculations
1 1=Yes
0=No
Calculations->Calculated field
ShGrd Display Grid 1 1=Yes
0=No
View->Grid
ShHzRul Display Horizontal Ruler
1 1=Yes
0=No
View->Horizontal Ruler
ShVtRul Display Vertical Ruler
1 View->Vertical Ruler
ToolHelp Show tool tips
1 1=Yes
0=No
View->Toolbar
Library32 Default filename for
File->Open
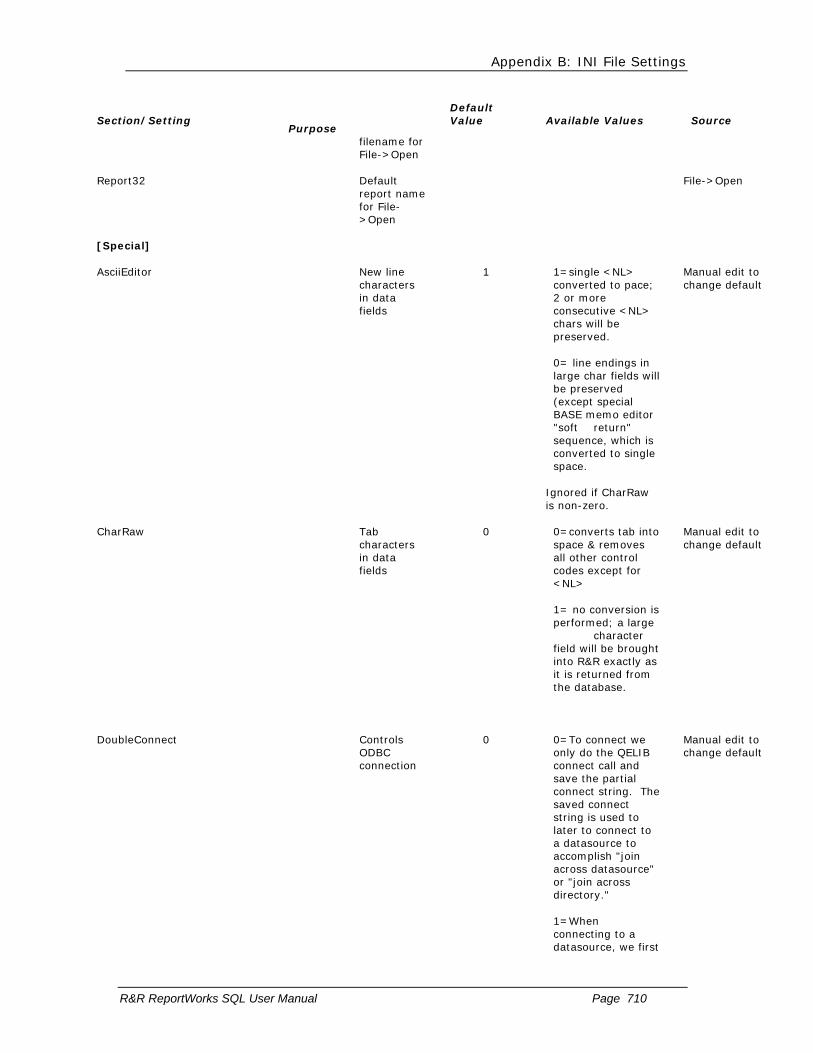
Appendix B: INI File Settings
R&R ReportWorks SQL User Manual Page 710
Section/Setting Purpose
Default Value Available Values Source
filename for File->Open
Report32 Default report name for File->Open
File->Open
[Special]
AsciiEditor New line characters in data fields
1 1=single <NL> converted to pace; 2 or more consecutive <NL> chars will be preserved.
0= line endings in large char fields will be preserved (except special BASE memo editor "soft return" sequence, which is converted to single space.
Ignored if CharRaw is non-zero.
Manual edit to change default
CharRaw Tab characters in data fields
0 0=converts tab into space & removes all other control codes except for <NL>
1= no conversion is performed; a large character field will be brought into R&R exactly as it is returned from the database.
Manual edit to change default
DoubleConnect Controls ODBC connection
0 0=To connect we only do the QELIB connect call and save the partial connect string. The saved connect string is used to later to connect to a datasource to accomplish "join across datasource" or "join across directory."
1=When connecting to a datasource, we first
Manual edit to change default

Appendix B: INI File Settings
R&R ReportWorks SQL User Manual Page 711
Section/Setting Purpose
Default Value Available Values Source
do a SQLDriverConnect
so that we can retrieve the full connect string. Then we then disconnect and use the retrieved connect string for the QELIB connect call.
DbfXGray Allow DBF export
1=remove Xbase from list of export types
Manual edit to change default
TxtXGray Allow TXT export
1=remove Text from list of export types
Manual edit to change default
WksXGray Allow XLS export
1=remove Worksheet from list of export types
Manual edit to change default
SaveWizScript Save wizard script files
1= do NOT delete Wizard temporary input/output files
Manual edit to change default
WizardEXE Name of wizard executable
RRWIZ.EXE Pathname to Wizard program file
Manual edit to change default
WizardRecordLimit Number of records for wizard preview
20 Override row limit in Wizard preview
Manual edit to change default
SortPoolSize Sort buffer size
600000 Size in bytes of a buffer used in sort code
Manual edit to change default
CommentsOnlyAtStartofLine Control use of ; character within the INI
1 1 = ";" preceded by non-whitespace not considered comment delimiter
Manual edit to change default
[User Info]
Company Company name (set by SETUP)
UserName User name (set by SETUP)
[Database]
LongCharLimit Layout width max for char fields
80 Limit fixed length character fields to this width
Manual edit to change default

Appendix B: INI File Settings
R&R ReportWorks SQL User Manual Page 712
Section/Setting Purpose
Default Value Available Values Source
LongCharWrap Wrap any truncated char fields
0 1= use wordwrap format for fixed length fields so truncated
Manual edit to change default
MemoLimit Layout width for memo fields
30 Set memo fields to this width.
Manual edit to change default
MemoWrap Wrap memo fields
1 1= use wordwrap format for variable length long character fields.
0=do not
Manual edit to change default
AlwaysLocalLog Determines when to re-read a result set
1 1= When a second pass over the result set is needed (e.g. for preprocessed totals), this causes the result to be locally cached, even if the DBMS itself supports random access to result set rows.
0 = Cache results locally when needed only if DBMS does not support rereading of result set.
Manual edit to change default
AlwaysSelect Determines when to re-read a result set
0 0 = Causes result set to be reread on a second print or preview, rather that having the select re-issued.
1 = always issues select on a subsequent print or preview.
Manual edit to change default
DatetimeCompatibility Determines how database datetime fields will be treated when a older saved report is being opened.
1 1= Prompt user if such field should be treated as date or datetime fields.
2= Always ask user how to treat database datetime fields.
3 = Never convert database datetime to date, and
Manual edit to change default
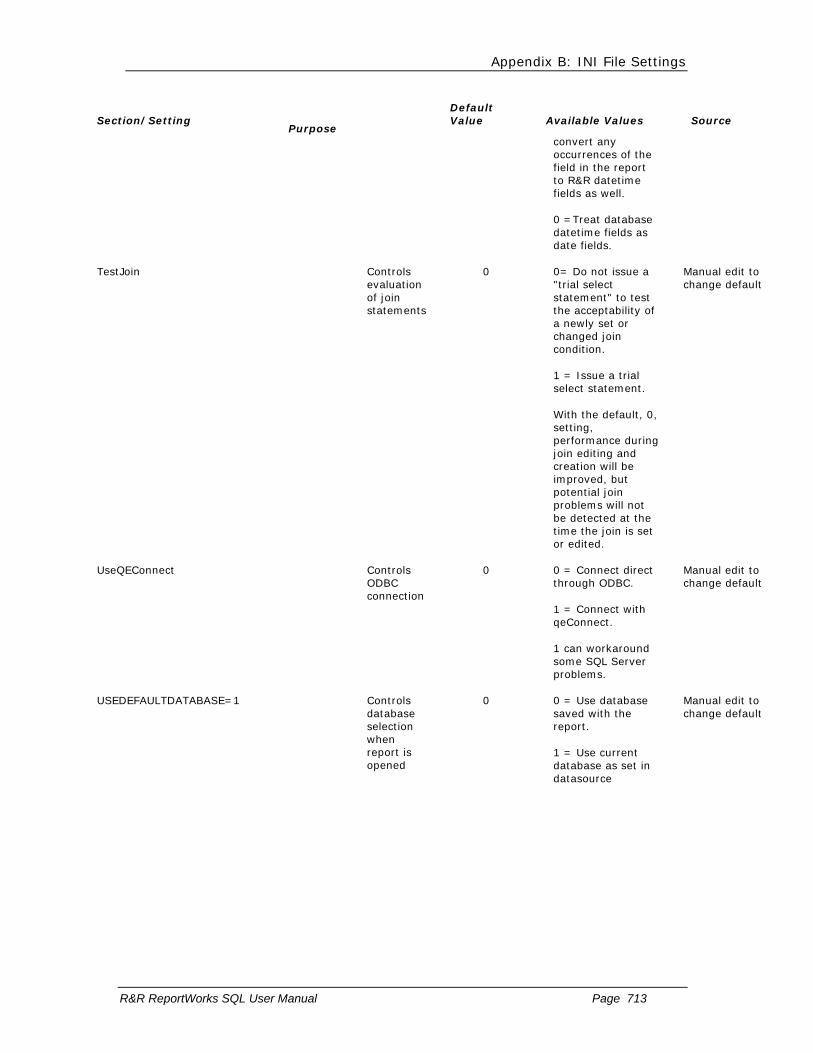
Appendix B: INI File Settings
R&R ReportWorks SQL User Manual Page 713
Section/Setting Purpose
Default Value Available Values Source
convert any occurrences of the field in the report to R&R datetime fields as well.
0 =Treat database datetime fields as date fields.
TestJoin Controls evaluation of join statements
0 0= Do not issue a "trial select statement" to test the acceptability of a newly set or changed join condition.
1 = Issue a trial select statement.
With the default, 0, setting, performance during join editing and creation will be improved, but potential join problems will not be detected at the time the join is set or edited.
Manual edit to change default
UseQEConnect Controls ODBC connection
0 0 = Connect direct through ODBC.
1 = Connect with qeConnect.
1 can workaround some SQL Server problems.
Manual edit to change default
USEDEFAULTDATABASE=1 Controls database selection when report is opened
0 0 = Use database saved with the report.
1 = Use current database as set in datasource
Manual edit to change default

Appendix B: INI File Settings
R&R ReportWorks SQL User Manual Page 714
RSW.SRT
By default, Report Designer does not distinguish between upper- and lower-case letters when sorting or comparing character data in Database ⇒ Sort Order and Group Order operations, queries, and calculations (that is, these operations are case insensitive).
To change this default behavior for sorting and comparing character data, use any text editor to edit RSW.SRT, the file that controls Report Designer’s case sensitivity. This file resides in the Report Designer program directory. Directions for editing the file are contained within the file itself.
Note that database relations are not affected by the case sensitivity setting in RSW.SRT. Database relations that use character linking fields are always case sensitive.
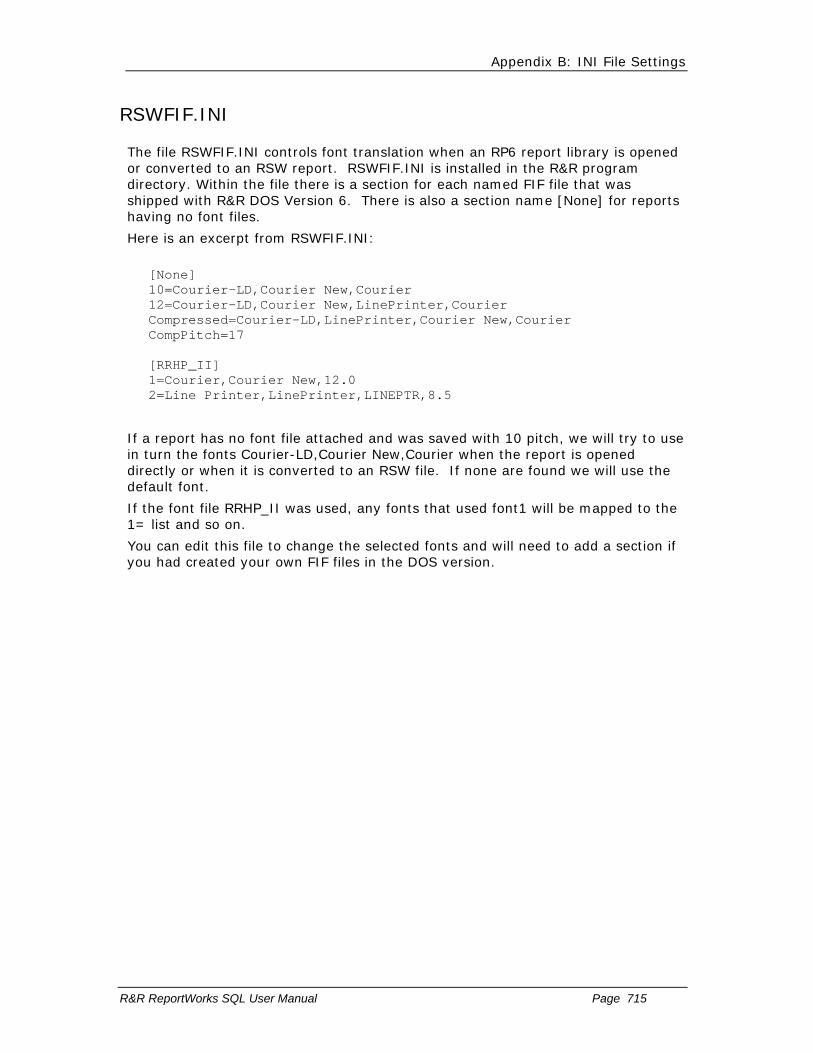
Appendix B: INI File Settings
R&R ReportWorks SQL User Manual Page 715
RSWFIF.INI
The file RSWFIF.INI controls font translation when an RP6 report library is opened or converted to an RSW report. RSWFIF.INI is installed in the R&R program directory. Within the file there is a section for each named FIF file that was shipped with R&R DOS Version 6. There is also a section name [None] for reports having no font files.
Here is an excerpt from RSWFIF.INI:
[None] 10=Courier-LD,Courier New,Courier 12=Courier-LD,Courier New,LinePrinter,Courier Compressed=Courier-LD,LinePrinter,Courier New,Courier CompPitch=17 [RRHP_II] 1=Courier,Courier New,12.0 2=Line Printer,LinePrinter,LINEPTR,8.5
If a report has no font file attached and was saved with 10 pitch, we will try to use in turn the fonts Courier-LD,Courier New,Courier when the report is opened directly or when it is converted to an RSW file. If none are found we will use the default font.
If the font file RRHP_II was used, any fonts that used font1 will be mapped to the 1= list and so on.
You can edit this file to change the selected fonts and will need to add a section if you had created your own FIF files in the DOS version.

Appendix B: INI File Settings
R&R ReportWorks SQL User Manual Page 716
RSWSQL.INI
RSWSQL.INI is a text initialization file that is installed in the R&R program directory. It contains general and DBMS platform/driver-specific information used by R&R to:
1) generate SQL SELECT statements
2) translate R&R calculated field formulas into DBMS-engine-evaluatable expressions
3) control R&R's desktop platform cross-directory join support
In the absence of this file, R&R will revert to "generic" ODBC mode and will not take advantage of any native platform features not available through ODBC. It will also not support capabilities it offers for specific platforms, e.g. it will not support changing databases for SQL Server.
Within the file are a number of named sections that control how R&R interfaces with specific ODBC drivers.
You can edit this file in any text editing program such as Notepad. Explanation of the contents of this file and documentation of each available setting can be found within the file itself.
You may need to edit this file for the following reasons:
• You are experiencing slow performance against your database
• You want to change the SQL that is being generated by R&R

Technical Support
Summary Technical Support service gives you access to product experts who can help solve problems you encounter using R&R Report Writer.
Several options provide you with the level of service you need to get answers in the most timely and cost-effective manner.
Key Benefits Help available when you need it — online, email or 800# Dedicated, knowledgeable staff — over 50+ years R&R experience Cost-effective — pay only for what you use, never expires
Capabilities Liveware Publishing offers varying levels of service to meet your technical, administrative, and budgetary requirements. From comprehensive support plans to self-service online resources, we've got the right program to fit your needs.
Option 1 — Pay-per-Call At any time between the hours of 8:30 AM and 5:30 PM Eastern
Time, you may call 302-791-9446 to speak with a technical support representative. The fee for support is $100 per hour, with a minimum charge of $10 per call. Payment can be made by credit card (VISA/MC/AMEX). You will not be charged for problems arising from R&R Report Writer software. (Time is calculated to the closest five dollar time unit, only for time actually spent by a Liveware Publishing support representative resolving the issue. Any time spent is subject to Liveware Publishing management review for effectiveness of the support provided.)
(A "call" is defined as phone conversations, e-mail, and voice-mail messages related to resolution (or attempted resolution) of a particular issue. Issues may be grouped in a particular "call" to reach the minimum.)
Option 2 — Support/Upgrade Account
You can establish a pre-paid support/upgrade account (SUA) with Liveware Publishing to receive a faster response and at a discounted rate. The cost for opening an SUA account for a single user is $500, and special pricing is available for multiple user accounts. Once you have opened an SUA account, at any time between the hours of 8:30 AM and 5:30 PM Eastern Time, you may call the special 800 number to speak with a technical support representative. You may also send an email if you are working outside our normal business hours. The fee for support is discounted to $80 per hour, with a minimum charge of $10 per call.
In addition, with the purchase of an SUA account you receive the following benefits:
Installation support during the first 60 days is not chargeable. One FREE tech support call. One FREE copy of Relate and Report: Your Guide to Reporting with R&R. (350 pages, a $59 value.) FREE maintenance releases Reduced pricing on printed copies of the product documentation - pay just $25 (a $10 savings.)
Reduced pricing on product upgrades. You may apply any unused portion of your SUA account balance to the purchase of upgrades.

Appendix C: Technical Support
R&R ReportWorks Xbase User Manual Page 718
The balance in your account never expires.
Customers with SUA accounts will be supplied a statement of account usage, upon request, itemizing time spent on each call. Per-call customers will be informed of the time and cost of the call at its conclusion. Requests for review of charges may be sent via e-mail at our web site. Customers with SUAs should deposit sufficient funds to cover reasonable support needs for your organization for at least three months. Automatic re-billing to replenish accounts is available, or you may use a credit card or purchase order.
Option 3 — Self Service Resources
At any time, you may refer to the Resources page on our web site for Documentation, Frequently Asked Questions, Technical Bulletins, Service Packs, and other information about R&R Report Writer.
We also offer a User Discussion forum http://207.5.19.19/cgi-bin/dcforum/dcboard.pl where you can view and post R&R questions. This forum is monitored by our support staff.
Subscribe Now! Complete the form on our web site to open your Support/Upgrade
Account today, or call 800-936-6202 or 302-791-9446. Before You
Call Please be prepared to provide the following information with each call or email:
User name, company, email and phone/fax numbers
Product serial number
SUA account number (if applicable)
Type, vendor and version of operating system and database in use
Product and version in use
Underlying application name and vendor
To contact Liveware Publishing Technical Support for Pay-per-Call
or Support/Upgrade Account service, call the special 800 number any time between the hours of 8:30 AM and 5:30 PM Eastern Time. Alternatively, you may send an email at any time using the online Technical Support Help Request form or by sending an email to [email protected].