SPU#196 JW Trends in Pesticide Use in New Zealand MFE...
78
Trends in Pesticide Use in New Zealand: 2004 Manktelow D, Stevens P, Walker J, Gurnsey S, Park N, Zabkiewicz J, Teulon D and Rahman A. November 2005 Report to the Ministry for the Environment, Project SMF4193 HortResearch Client Report No. 17962 HortResearch Contract No. 18620 Manktelow D, Walker J, Gurnsey S, Park N HortResearch Hawke’s Bay Cnr Crosses and St Georges Roads Private Bag 1401, HAVELOCK NORTH, NZ Tel: +64-6-877 8196 Fax: +64-6-877 4761 Stevens P HortResearch Mt Albert 120 Mt Albert Road, Private Bag 92169 Mt Albert, AUCKLAND, NZ Tel: +64-9-815 4200 Fax: +64-9-815 4201 Zabkiewicz J Plant Protection Chemistry PO Box 6282, Rotorua, NZ Tel: +64-7-3435899 Fax: +64-7-3480952 Teulon D Crop and Food Research Private Bag 4704 CHRISTCHURCH, NZ Tel: +64-4-3256400 Fax: +64-3-3252074 Rahman A. AgResearch Corporate Office Private Bag 3115 HAMILTON, NZ Tel: +64-7-834 6600 Fax: +64-7-8346640
Transcript of SPU#196 JW Trends in Pesticide Use in New Zealand MFE...

Trends in Pesticide Use in New Zealand: 2004 Manktelow D, Stevens P, Walker J, Gurnsey S, Park N, Zabkiewicz J, Teulon D and Rahman A. November 2005 Report to the Ministry for the Environment, Project SMF4193 HortResearch Client Report No. 17962 HortResearch Contract No. 18620
Manktelow D, Walker J, Gurnsey S, Park N HortResearch Hawke’s Bay Cnr Crosses and St Georges Roads Private Bag 1401, HAVELOCK NORTH, NZ Tel: +64-6-877 8196 Fax: +64-6-877 4761
Stevens P HortResearch Mt Albert 120 Mt Albert Road, Private Bag 92169 Mt Albert, AUCKLAND, NZ Tel: +64-9-815 4200 Fax: +64-9-815 4201
Zabkiewicz J Plant Protection Chemistry PO Box 6282, Rotorua, NZ Tel: +64-7-3435899 Fax: +64-7-3480952
Teulon D Crop and Food Research Private Bag 4704 CHRISTCHURCH, NZ Tel: +64-4-3256400 Fax: +64-3-3252074
Rahman A. AgResearch Corporate Office Private Bag 3115 HAMILTON, NZ Tel: +64-7-834 6600 Fax: +64-7-8346640

DISCLAIMER
Unless agreed otherwise, HortResearch does not give any prediction, warranty or assurance in relation to the accuracy of or fitness for any particular use or application of, any information or scientific or other result contained in this report. Neither HortResearch nor any of its employees shall be liable for any cost (including legal costs), claim, liability, loss, damage, injury or the like, which may be suffered or incurred as a direct or indirect result of the reliance by any person on any information contained in this report.
The Ministry for the Environment does not endorse or support the content of the publication in any way.
This work is copyright. The copying, adaptation, or issuing of this work to the public on a non-profit basis is welcomed. No other use of this work is permitted without the prior consent of the copyright holder.
This report has been prepared by The Horticulture and Food Research Institute of New Zealand Ltd (HortResearch), which has its Head Office at 120 Mt Albert Rd, Mt Albert, AUCKLAND. This report has been approved by:
_____________________________ _____________________________ Research Scientist Group Leader, Bioprotection Date: 30 November 2005 Date: 30 November 2005

CONTENTS Page EXECUTIVE SUMMARY........................................................................................................ 1 1. INTRODUCTION............................................................................................................. 5 2. SCOPE AND METHODOLOGY..................................................................................... 7 2.1 Identification of pesticide groups...................................................................................... 7 2.2 Collection of national sales data ....................................................................................... 7 2.3 Collection of sector specific pesticide use data ................................................................ 8
3. RESULTS AND DISCUSSION ..................................................................................... 11 3.1 National trends in pesticide sales 1994-2003.................................................................. 11
3.1.1 Trends in insecticide use ........................................................................................ 14 3.1.2 Trends in fungicide use .......................................................................................... 16 3.1.3 Trends in herbicide use .......................................................................................... 17 3.1.4 Summary of trends in the national sales data......................................................... 19
3.2 Sector specific pesticide use patterns and trends ............................................................ 20 3.2.1 Pesticide use in the arable sector............................................................................ 21 3.2.2 Pesticide use in the pastoral farming sector ........................................................... 21 3.2.3 Pesticide use in plantation forestry ........................................................................ 22 3.2.4 Pesticide use in vegetable production .................................................................... 24 3.2.5 Pesticide use in fruit production............................................................................. 26
3.3 Comparison of sector-specific use estimates against national sales data ....................... 32 4. CONCLUSIONS............................................................................................................. 34 5. RECOMMENDATIONS ................................................................................................ 36 6. REFERENCES................................................................................................................ 37 7. ACKNOWLEDGEMENTS ............................................................................................ 38 8. APPENDICES................................................................................................................. 39


1
EXECUTIVE SUMMARY
Trends in Pesticide Use in New Zealand: 2004
Report to the Ministry for the Environment, Project SMF4193
Manktelow D, Stevens P, Walker J, Gurnsey S, Park N, Zabkiewicz J, Teulon D and Rahman A.
November 2005
Background
This project was undertaken in 2004 to provide up-to-date data on pesticide use in New Zealand and related land use trends over time. Such data are needed to help identify pesticide use issues, to determine appropriate research and management policies, and to help maintain consumer and market confidence. Use of incorrect or outdated pesticide use data may lead to incorrect identification of risks associated with pesticide use by different users and contribute to inappropriate policies on pesticide risk reduction. Pesticide risk assessment on the basis of quantity of active ingredient used is not a particularly sensitive measurement, as it does not reflect the assessment of potential risks to the environment and people i.e. “real” impacts. However, this remains the most widely reported pesticide use statistic.
Methods
The New Zealand Association for Animal Health and Crop Protection (Agcarm) was the principal source of information for the national sales data in this report. Participants in the Agcarm survey provide voluntary annual data on sales of pesticides by kilograms of active ingredient (a.i.), with data grouped into various categories. Information was also gathered on the quantities of pesticides (insecticides, fungicides, herbicides and plant growth regulators) used in 69 sectors, comprising data from the horticultural, arable, forestry and pastoral industries. Pesticide use in the different sectors was then estimated relative to the known land areas of each sector. The national sales and estimated use data were compared and the resulting pesticide use patterns are discussed.
Key findings
• International data (FAOSTAT) on New Zealand’s pesticide imports suggested that since 1999, these increased by 12% and were valued at US$72m in 2003. Over this period they constituted about 1% of the annual value of New Zealand’s agricultural exports (US$8b).
• Over the last five years (1999-2003) the estimated volume of pesticides (tonnes of product), as reported by Statistics New Zealand from Customs documentation, suggests that total pesticide imports increased by 17%. Herbicides increased by 42%, fungicides by 10% and insecticides decreased by 41%.
• Comprehensive and reliable data on pesticide use in New Zealand were difficult to obtain; Customs importation records appeared to be unreliable because of their broad classifications (e.g. timber treatments included as pesticides) while Agcarm (the pesticide sector’s agency) reports data from members only, estimated to cover approximately 80% pesticide sales.

2
• The authors therefore used Agcarm data (active ingredient sales) as the basis of this report that suggested total pesticide use increased by 27% between 1999 and 2003. Herbicide, insecticide and fungicide sales increased by 25, 28 and 29% respectively.
• This recent increase in pesticide sales followed a period of declining sales in the mid and late 1990s that was probably due to various sustainability initiatives within fruit sector (e.g. KiwiGreen, Integrated Fruit Production) as total pesticide sales increased by just 15% for the 10 years period between 1994 and 2003.
• The 27% increase in pesticide sales between 1999 and 2003 could only be accounted for in small part by expansion of the horticultural sector; the most significant increase being a 76% increase in winegrape plantings.
• The trend towards sustainable production within horticulture has continued as most of the sectors we surveyed were actively involved in developing and promoting sustainable production programmes that usually featured pesticide risk reduction strategies e.g. residue management, resistance management, use of selective products and phasing out of disruptive chemistries.
• The fruit industries lead the shift towards the use of selective products and the phasing out of broad-spectrum pesticides. Similar trends are apparent in other industries, for example, the trend to replace granular organophosphate (OP) insecticides that are drilled in with some arable and agricultural crops with more selective insect growth regulator insecticides.
• Measured in terms of total active ingredient use, the pastoral and forestry sectors account for the largest volume of herbicide used, while fungicides and insecticides are mainly used in the horticultural sectors. Despite many sustainability initiatives, the horticultural sectors is still the most intensive users of pesticides on an land area basis (13.2kg a.i./ha), followed by the arable (2.4kg a.i./ha), forestry (0.3kg a.i./ha), and pastoral sectors (0.2kg a.i./ha).
• Increasing sales of certain classes of pesticides (e.g. 19% increase in organophosphate insecticides and 35% increase in glyphosate herbicide) between 1999 and 2003 may be linked to small use changes within the expansive agricultural sector. Industry sources state that recent increases in insecticide use in agriculture were due to unseasonal outbreaks of diamond back moth in forage brassica crops. Similarly, there has been increasing use of glyphosate herbicide for pasture renewal.
• Increasing sales of biological insecticides (e.g. Bacillus thuringiensis) since 1999 may be due in large part to Integrated Pest Management (IPM) initiatives within the kiwifruit sector (e.g. KiwiGreen) and the expansion of organic apple production. Peak sales in 1999 and 2003 could in part be due to management of biosecurity pest incursions.
• There remains a real lack of data on domestic and urban pesticide uses and their implications.

3
Recommendations
• New Zealand needs to implement a better system for recording pesticide sales and use data. This has been a recommendation from previous reports (MacIntyre et al., 1989; Holland and Rahman, 1999), but has not been progressed in any substantive way. A lack of consistent pesticide use data limits our ability to make a meaningful assessment of pesticide risks and issues in individual sectors.
• Standardisation of pesticide categories within the Customs importation records could provide the basis for meaningful analysis and tracking of pesticide use in New Zealand. This would allow tracking of generic pesticide active ingredients imported into New Zealand that are not fully represented in Agcarm’s current recording system.
• Spray diary records from individual pesticide users are the key building blocks to any pesticide use recording system and the need for these should be driven by industry sectors for industry good.
• We recommend that a working group be formed with representation from all pesticide use sectors and stakeholders with the aim of developing an improved system for collecting pesticide use data.
For further information please contact: Jim Walker HortResearch Hawke’s Bay Cnr Crosses and St Georges Roads Private Bag 1401, HAVELOCK NORTH, NZ Tel: +64-6-877 8196 Fax: +64-6-877 4761
Email [email protected]

4

5
1. INTRODUCTION
Pesticides have been and continue to be an important component of primary production in New Zealand and overseas. Pesticides (collectively insecticides, fungicides, herbicides and plant growth regulators) are used to control insects, diseases and weeds in many areas of primary production, including agricultural farming, forestry and horticultural production. These industries are important to New Zealand’s economy, together accounting for NZ$18 billion in export earnings for New Zealand for the year ended March 2003 (MAF, 2003). The use of pesticides in these industries is often necessary to ensure high quality production with minimal loss to pests and diseases. Pests and diseases constitute one of the most significant risks to primary industries, especially in horticultural production where high value crops are being produced. Without the use of pesticides, growers and farmers face the risk of losing significant proportions of their production and subsequently export earnings. Loss of production may also have an effect in subsequent years with the loss of export market shares where customer demands cannot be met. While there are clearly benefits in the use of pesticides, it is important to manage any associated risks. There is specific legislation in place to ensure that environmental risks associated with pesticide use are managed (e.g. the Hazardous Substances and New Organisms Act 1996 and subsequent ERMA controls). This report does not specifically address issues of pesticide safety, human health or food safety. This project was undertaken in 2004 to provide up-to-date data on pesticide use in New Zealand and related land use trends over time. Such data are needed to help identify pesticide use issues, to determine appropriate research and management policies, and to help maintain consumer and market confidence. Use of incorrect or outdated pesticide use data may lead to incorrect identification of risks associated with pesticide use by different users and contribute to inappropriate policies on pesticide risk reduction. According to Food and Agricultural Organisation (FAO) data, the value of pesticide imports in New Zealand is significant in relation to agricultural exports. From the mid 1960s until the mid 1990s, the value (in US$) of annual imports of pesticides was relatively stable at about 0.4% of the value of New Zealand’s agricultural exports. In 1996 our annual imports of pesticides increased to approximately 1% of export earnings and since then have been relatively stable at this level. In 2003, New Zealand imported pesticides valued at US$72 million and had agricultural export earning of approximately US$8b (Figure 1).

6
0
1,000
2,000
3,000
4,000
5,000
6,000
7,000
8,000
9,000
1961196319651967196919711973197519771979198119831985198719891991199319951997199920012003
Agri
cultura
l export
s (U
S$M
)
0
10
20
30
40
50
60
70
80
90
Pesticid
e im
port
s (U
S$M
)
Agricultural exports
Pesticide imports
Figure 1. The estimated value (US$) of New Zealand agricultural exports in relation to pesticide imports between 1961 and 2003 (FAOSTAT data).
Estimates of import values are a useful indicator of pesticide use and the increase since the mid 1970s can be related in part to the expansion and diversification of horticultural production in New Zealand. Dairy farming intensification and continued increases in horticultural production since 1997 are not reflected in continued increases in total pesticide import values. The apparent levelling off in import values since 1997 may well reflect efforts by many primary industries to reduce pesticide inputs and minimise potential risks associated with pesticide use, largely through use reduction programmes and the substitution of broad-spectrum pesticides (often generic products) with newer, more selective products (often patent protected). Specific case studies of industry initiatives to reduce pesticide use are described more fully in Section 3 of this report. However, import values do not provide any hard data on pesticide risks and this report seeks to review actual and specific trends in pesticide use in New Zealand. The last review of trends in pesticide use was made on data that included the 1997-98 season (Holland and Rahman, 1999). This survey found that total pesticide use (excluding mineral oil) grew between 1984 and 1994, reaching a peak of about 3,700 tonnes of active ingredient per annum and had declined to a 1998 total of 3,300 tonnes. Herbicides dominated pesticide use (68%) followed by fungicides (24%) and insecticides (8%). The authors also stated that “the Kiwigreen (IFP) and organic production systems used by all of the kiwifruit industry are notable successes for more biologically oriented insect and disease control.” Given the significant uptake of pesticide reduction programmes (see section 3.2) and pesticide substitution programmes in a number of industries (whereby broad-spectrum pesticides are replaced by more targeted approaches) along with changing land use patterns, it was timely to complete a follow-up review of pesticide use in New Zealand.

7
2. SCOPE AND METHODOLOGY
2.1 IDENTIFICATION OF PESTICIDE GROUPS
To maintain consistency with the Holland and Rahman (1999) report, the same FAO classes of pesticides were used as a basis for reporting (FAO, 1996), with the additional subgroups created by Holland and Rahman (1999) used where the FAO classes were too broad to explore key New Zealand trends. For example, Holland and Rahman (1999) separated phosphonyls (glyphosate, glufosinate-ammonium) from the FAO ‘Other herbicides’ class. Active ingredients were assigned to the FAO groups, with a full list of active ingredients and their groupings shown in Appendix 1. In this Appendix, and in the rest of this report, individual pesticide active ingredients are described and discussed in terms of their International Standards Organisation (ISO) (ISO, no date) common names. Pesticides as formulated and packaged for sale in New Zealand are described by their product names registered under the Agricultural Compounds and Veterinary Medicines Act 1997 (New Zealand Food Safety Authority, no date).
2.2 COLLECTION OF NATIONAL SALES DATA
The New Zealand Association for Animal Health and Crop Protection (Agcarm) was the principal source of information for the national sales data in this report. Participants in the Agcarm survey provide voluntary annual data on sales of pesticides by kilograms of active ingredient (a.i.), with data grouped into various categories (Appendix 2). Agcarm estimate their data represent over 80% of annual national sales, with the major omissions being herbicides supplied into the forestry sector. The Agcarm annual sales data of pesticides summarised by kilograms of active ingredient (a.i.) in various categories were supplied for the years between 1994-2003. Unfortunately the pesticide classification system used by Agcarm differs from the FAO groupings as Agcarm have chosen to group pesticides more by market segment than by mode of action. Examination of the Agcarm versus FAO groupings in Appendix 2 shows that some of the active ingredients in the Agcarm groupings could occur in more than one of the FAO groups. It proved impossible to reliably align the years of Agcarm data with the FAO groups, so all national sales data have been presented in their Agcarm groups. The disadvantage of this reporting approach is that the data are not consistent with a system generally used to summarise pesticide use in other countries. Agcarm data are used by the New Zealand Food Safety Authority (NZFSA) to report New Zealand pesticide use to the World Trade Organisation (Dave Lunn, NZFSA, pers. comm., 2004), with some assumptions required that could lead to under or over reporting in some groups. To overcome this problem, other sources of national pesticide use were sought as a way of increasing the integrity of our data. These sources included a summary of retail sales values for approximately 900 pesticide products by a professional market analysis company, AC Nielsen Ltd. This survey has been discontinued and data were made available for 2001-02, which was the last time this type of survey was conducted. The sales value by product data
8
provided a useful cross reference to the sector-based use estimates and provided a reliable indication of the relative quantities of specific active ingredients used. Another source of data was Statistics New Zealand. Statistics New Zealand collects data on quantities of pesticide product imported for New Zealand Customs Service records. These data should capture all imported pesticide products but in the context of national use must be treated with caution as they do not include pesticides that were manufactured in New Zealand. These data may also differ from Agcarm because of differences in product categorisation and product groupings between these two information sources.
2.3 COLLECTION OF SECTOR SPECIFIC PESTICIDE USE DATA
One of the factors affecting overall pesticide inputs is land use patterns. Land area data were collected for the sectors included in this report, with area information compiled from Statistics New Zealand web-based survey reports (Statistics New Zealand, no date) and related websites (Ministry of Agriculture and Forestry, no date) and publications (Kerr et al., 2003). Understanding the contribution of pesticide use per hectare and total number of hectares under any particular land use are critical components for understanding trends in pesticide use over time. The average use for a pesticide category across all land in a crop (kg a.i./ha) can be used as a basis for comparisons of overall intensity of pesticide use between sectors.
Gathering of sector specific data
Information was gathered on the quantities of pesticides (insecticides, fungicides, herbicides and plant growth regulators) used in 69 sectors, comprising data from the horticultural, arable, forestry and pastoral industries. Where similar use patterns in pesticide use occurred in different crops (e.g. nectarines and peaches), these were aggregated to give a total of 48 different sectors (Appendix 3). The initial sector-level data were collected through a variety of means, including industry databases, published information, and personal communications from either scientists/consultants closely involved with a sector, or sector contacts. Cooperating sectors with comprehensive spray diary databases (e.g. the pipfruit industry) allowed the data collection template to be filled with actual recorded use data. However, for a majority of sectors use patterns were estimated by consultation with other researchers, consultants, growers and/or pesticide sales staff. Wherever practical, a sample of grower spray diaries was collected and examined. For the forestry sector, major companies were contacted directly to provide typical patterns of pesticide use. The task of identifying pesticide use in specific sectors was divided between researchers from HortResearch, Plant Protection Chemistry (formally a part of ForestResearch), Crop and Food Research and AgResearch. Each research collaborator was provided with a data collection template that listed pesticide products with label claims for each sector and the expected application rate for each product. The researchers were asked to identify a single representative product for each pesticide active ingredient used in each sector, to confirm a typical application rate and to provide an estimate of the proportion of land area treated each season. The researchers were also tasked with identifying the typical range in the numbers of applications of each active ingredient made to different sectors by identifying representative minimum and maximum numbers of applications used each season (or year).

9
In most cases the researchers were able to fill the data collection template for a sector with nationally representative use patterns with explanatory comments (e.g. “the high number of applications estimated would be applied in wet North Island production areas”). The initial data were supplied back to organisations that represented each sector (usually at federation or grower association level) to seek feedback and comments as to whether the data were considered representative of current industry practices. The data were modified as required based on this feedback.
Sector data analysis
Once the data collection template had been filled for each sector, data were amalgamated into a single spreadsheet table and this was linked by active ingredient to the FAO and Agcarm pesticide groups. The table was also linked by sector to a table of national area data. The application rate units for each product example in the table was converted to an area basis. In other words, for products applied as a rate per 100 litres of water, a typical application volume assumption was required. Where products were applied as a seed dressing, an application rate per area was estimated from typical seed sowing rates. The final amalgamated spreadsheet was used to tabulate pesticide usage for each sector as application rate (kg a.i./ha), % use (mean proportion of total land area treated) and use frequency (number of applications per year for low and high use situations). The links to different grouping variables meant that data could be presented in terms of use of individual active ingredient or by Agcarm or FAO groups. Likewise, the data could be presented at an individual sector level or at any desired sector grouping. Holland and Rahman (1999) reported pesticide use in a sector/region using three use statistics:
Quantity – the total quantity of pesticide active ingredient in a class applied to land in
that sector/region in the year.
Quantity (tonnes a.i.) = Area x Sum (% Use x Number applications x Rate)/100,000
The sum is made over all pesticides in the class and Area is the total area of land for
the sector and region in ha (conventionally the cropped or canopy hectarage, or 80%
of farm area for pastoral land).
Use (%) = the percent of land area that received at least one application of a pesticide
in the class in the year. Where more than one individual pesticide was used within a
class, decisions were required as to whether this represented either different growers
making alternative choices (Use for class = Sum of % uses for individual pesticides)
or all were applied by each grower (Use for class = Mean of individual % uses).
The delineation was often not clear cut e.g. three insect growth regulators (IGRs)
were commonly used on apples with several applications. Some growers used only one
IGR throughout the season and others alternated products. Therefore the Average
Use for the IGR class in apples lies somewhere between the sum and the mean of the
individual % uses. For crops where this was a common situation, a separate analysis
of the spray diary information grouped by pesticide class was undertaken to establish
more accurate Average Use values.
Loading = the average amount of pesticide active ingredient in each class applied per
unit area of treated land in the year.
Loading (kg a.i./ha) = Sum (% Use x Number applications x Rate)/ Use)

10
The average is over land that received at least one application of a pesticide in the
class and only where the Average Use reaches 100% does it equate to the loading
over all the land in a sector.
It was found that the Use and Loading statistics calculated by Holland and Rahman (1999) rapidly became meaningless when active ingredients were amalgamated into FAO or Agcarm groupings, as the potential different use patterns within sectors (outlined above) could completely distort the amalgamated data. For this reason a sector-based loading statistic was used to facilitate comparisons of pesticide use intensity between sectors. This was calculated as total active ingredient (for each pesticide grouping) used in a sector divided by the sector area. Mean loading across a sector will usually be an underestimate of potential loadings on treated land areas, but does provide a basis for comparison between sectors. True potential loading estimates are only practical when individual user practices can be examined at individual active ingredient or product level.
Data assumptions and issues
Collection of consistent pesticide use data from across a wide range of sectors required some compromises as to the level of variability in use patterns that could be captured. Where several products represented a particular active ingredient used in a sector, we attempted to select the most used product. It was assumed that good agricultural practice would result in average application rates matching those specified on the product label. Where there was a range of possible application rates for a product, the highest specified rate was selected. The assumed numbers of applications per year for each product had a large effect on the final use estimates in situations where more than one application of a particular active ingredient was expected. The high use estimate was included to try and capture something of the potential variability in pesticide use between growers and/or in high pest or disease pressure situations. A total of 70% of the active ingredient use patterns identified used a maximum of no more than two applications per year (i.e. high use estimate = 1 or 2). Where multiple active ingredient applications were identified, only 8% had a low versus high use estimate that differed by more than four applications. It was originally intended that the pesticide use estimates in this report would be expressed using means derived from the low and high use figures. Unfortunately, the large potential variation in application numbers between individual users suggested that derived means were not representative of actual use patterns. The true average number of applications of particular active ingredients from 14 fruit sector spray diary databases was compared with their derived averages (i.e. with the mean of the minimum and maximum numbers of applications). The true average number of applications was consistently lower than the derived averages, by 20 to 45%. After much debate, it was decided that use of either of the mean estimates potentially distorted the data and the estimated low number of applications was used throughout this report. The implication of this is that active ingredient use is likely to have been underestimated in situations where the low and high use application numbers differed greatly (i.e. in approximately 8% of cases where they differed by more than four applications). Analysis of the data indicated that these underestimates occurred mainly (6% of total) with fungicides used in the pipfruit, winegrape and summerfruit industries.

11
3. RESULTS AND DISCUSSION
3.1 NATIONAL TRENDS IN PESTICIDE SALES 1994-2003
National statistics on pesticide sales were collected from three different sources as discussed in section 2.2. The majority of the following analysis is based on data obtained from Agcarm. While these data are likely to be fairly representative of the general trends in pesticide use, as indicated by sales figures, there are some specific exceptions where products are sold by non-Agcarm companies. These exceptions apply mainly to mineral oils, some plant growth regulators1 and to copper compounds and some herbicides supplied to the forestry sector, including generic glyphosate and triazine formulations. Therefore, analysis of AC Neilsen and Statistics New Zealand data was undertaken to help identify gaps in the Agcarm data set. AC Neilsen sales surveys, which report on pesticide sales by $ value, have not been collected since 2002. However, analysis of sales data from 2002 gave a total pesticide sales value of $209.7 million (Appendix 4), of which over 80% was identified as sales associated with companies that report product sales volumes to Agcarm. The relative value of sales reported in the AC Nielsen data, among herbicides, fungicides and insecticides approximated the Agcarm data volumes in each of these pesticide groups (Table 1).
Table 1. Comparison of AC Nielsen and Agcarm proportion of sales by pesticide group.
Pesticide group
Mean % of sales 1994 to 2003
– by volume
(Agcarm, 2004)
% of sales for 2002
– by $ value
(AC Nielsen, 2002)
Fungicides 23.5% 26.9% Insecticides1 10.9% 14.3% Herbicides 62.2% 58.7% Plant growth regulators (PGRs) 3.4% n.a.
1 Excluding mineral oils
It should be noted that Holland and Rahman (1999) reported total pesticide use data that included an estimate of forestry products that were not included in the Agcarm dataset. Holland and Rahman (1999) estimated that the 1998 Agcarm data under-estimated national pesticide use by 296,200 kg of triazine herbicides (approximately 16% of total herbicides) and 82,000 kg of inorganic (copper) fungicides (12% of total fungicides). A similar level of additional pesticide use is believed to have occurred in subsequent years, with the Agcarm data again missing many forestry herbicides plus mineral oils and some plant growth regulators used in forestry and other sectors. The survey collection period (2002) and relatively large proportion of inadequately identified products in the AC Neilsen data (Appendix 4) made it impossible to fill the gaps in the Agcarm data reliably. Therefore only the Agcarm data have been included in the following discussion. The reconciliation of Agcarm data against sector use estimates is discussed later in this report (Section 3.3). The Agcarm data show the percentage of total quantity of pesticide in each pesticide group (insecticides, fungicides, herbicides, and plant growth regulators) is remarkably consistent over time (Figure 2). Herbicides dominate the active ingredients used, making up over 60% of the total quantity of active ingredient sold in New Zealand each year.
1 e.g. ammonium thiosulphate which is used as blossom desiccant for crop load management

12
0%
10%
20%
30%
40%
50%
60%
70%
80%
1994 1995 1996 1997 1998 1999 2000 2001 2002 2003
year ending June
Sale
s b
y p
esticid
es g
roup
Herbicides Fungicides
Insecticides (exc. oil) Plant growth regulators
Figure 2. Pesticide sales by volume in New Zealand 1994-2003 (% sales by pesticide group – Agcarm data).
The Agcarm sales data show significant year-to-year variation (Figure 3). For example, sales showed a downward trend from 1995 to 1999, followed by an increase to a high in 2002. However, analysing the data at such a high level has the effect of masking more subtle patterns in pesticide use that are of greater interest e.g. substitution of new, more selective products for the older broad-spectrum pesticides. In addition, it would be inappropriate to draw any conclusions about the intensity of pesticide usage per hectare from this data, as it does not take into account changing land use patterns over time. For example, the volume of active ingredient applied per hectare may have significantly decreased for a particular pesticide group over time, but this will not result in a decrease in gross volumes sold if the area in that land use had significantly increased over the same time period. Interpretation of the intensity of pesticide use for any particular land use needs to be evaluated in the context of sector specific data (see section 3.2). Other factors which may affect trends include overall economic growth patterns and climatic factors (e.g. the drought between 1998-1999 and the subsequent reduction in stock numbers).

13
0
500
1,000
1,500
2,000
2,500
3,000
3,500
4,000
4,500
1994 1995 1996 1997 1998 1999 2000 2001 2002 2003
year ending June
tonne a
.i. per
annum
Fungicides Insecticides (exc. oil)Herbicides Plant growth regulatorsGRAND TOTAL
Figure 3. Pesticide sales in New Zealand 1994-2003 (tonnes of active ingredient sold during June to June – Agcarm data).
The broad trends in terms of pesticide sales shown in the Agcarm data show some consistency with an independently derived data set obtained via Statistics New Zealand. These data cannot be directly compared as Agcarm data are based on amounts of active ingredient sold while Statistics New Zealand data are based on amounts of product imported. The information should exclude any products destined for domestic use but may include products used in industrial processes (e.g. wood product treatment). It should show similar trends given that the active ingredient content of formulated products would not be expected to change rapidly over the broad base of pesticide products imported into New Zealand annually. Overall, the Statistics New Zealand data, which are based on New Zealand Customs service records of amounts of pesticides imported, indicates a relatively small increase in gross quantities of pesticides imported into New Zealand since 1999 (Table 2). The apparent decrease in gross weight of pesticides in 2003 may be a consequence of stock carried over from 2002 when the quantity of pesticide imported was significantly higher than previous years. If the data are averaged for 2002 and 2003 then the amount of pesticides imported into New Zealand could be estimated at 8,283,946 kg of gross product weight for 2003, representing an increase of 17% over the period 1999-2003. This is somewhat lower than data supplied from Agcarm (active ingredient sales) that shows a 28% increase for the same period. Both data sources are consistent, reporting an increase in pesticide importation and sales into New Zealand in the five-year period from 1999 to 2002-2003 (average).

14
Table 2: Estimated amounts of pesticides imported into New Zealand between 1999 and 2003 (kg of product (gross weight) – Year ending June). (Statistics New Zealand, no date)
1999 2000 2001 2002 2003
Insecticides 1,427,768 932,841 905,735 980,102 708,923
Fungicides 2,104,248 2,087,350 1,988,722 2,372,091 2,258,688
Herbicides 3,247,771 4,131,998 4,339,644 5,470,229 3,725,366
PGRs 293,451 336,895 345,571 416,456 636,036
Total 7,073,238 7,489,084 7,579,672 9,238,878 7,329,013
Information on active ingredient sales or product imports for Agcarm and Statistics New Zealand is even more inconsistent within pesticide categories. The Agcarm data suggest that herbicide, fungicide and insecticide use increased by 25, 29 and 30% respectively. In contrast, Statistics New Zealand 2002-2003 average data suggest that since 1999 herbicide and fungicide imports increased by 42 and 10% respectively while insecticide imports declined by 41%. These major discrepancies suggest that there is a problem with the way that total pesticide importation and use information is recorded in New Zealand e.g. wood product treatment used in industrial processes. Sources within the pesticide sector suggest that there are significant issues with the broad categorisation of pesticides in the customs importation records as reported by Statistics New Zealand raising doubts about their consistency for the purpose of this analysis. For these reasons we have focussed our analysis and discussion on the Agcarm data believing these to be the most consistent and reliable source of pesticide sales information in New Zealand.
3.1.1 Trends in insecticide use
Analysis of Agcarm sales data indicates a reduction in insecticide sales by volume between 1995-1998, followed by an increase in 1999. After 1999, the total quantity of insecticide active ingredient sales appears to have slowing increased over time (Figure 4). Graphs showing insecticide sales by Agcarm category are provided in Appendix 5.

15
0
50
100
150
200
250
300
350
400
1994 1995 1996 1997 1998 1999 2000 2001 2002 2003
year ending June
kg a
.i. per
annum
(000's
)
Organophosphates Carbamates Synthethic Pyrethroids
All others Biologicals Miticides
Oils TOTAL (exc. oils)
Figure 4. Insecticide sales in New Zealand 1994-2003 (Kilograms of active ingredient sold during June to June – Agcarm data).
The decrease in quantity sold between 1995-99 appears to have been driven mainly by reduced sales of oils and organophosphates. Although Agcarm data show a reduction in oil sales over time, it is not considered an accurate estimate. For example, the level of oil sales reported by Agcarm for 1998 (29,572 kg) is significantly lower than that indicated in the Holland and Rahman (1999) report for the same year (617,000 kg). The reason for this discrepancy is that oils are largely sold by non-Agcarm companies, so are consequently under-represented in the Agcarm survey data (Holland and Rahman, 1999). Therefore oils have been excluded from subsequent analysis of the Agcarm data. When oils are excluded, organophosphates are the dominant category influencing insecticide use patterns over time (Figure 4). Between 1995-99 there was a decrease in the amount of organophosphate sold, followed by an increase after this time. Industry sources state that recent increases in insecticide use in agriculture were due to unseasonal outbreaks of diamond back moth in forage brassica crops. As previously mentioned, this pattern should not be interpreted as an indication of an intensification of organophosphate use without considering changing land use patterns, and other factors affecting individual sectors use of these chemicals. Many horticultural sectors are now using substantially fewer organophosphates on a per hectare basis (see section 3.2). There have been some major changes in the types of insecticide products being used over the 1994-2003 period. For example, there has been an increasing quantity of biological materials sold, particularly Bacillus thuringiensis, as organic fruit production has expanded in both the kiwifruit and apple sectors since 1999. There has also been a decrease in the quantities of

16
miticides sold since 1999 (Appendix 5). These trends are likely to have developed as a result of more sectors introducing sustainable production programmes and moving towards the use of selective products for insect control rather than broad-spectrum pesticides. For example, pest mites can be adequately controlled by predatory mites as long as predatory populations remain at high enough levels. The use of broad-spectrum pesticides disrupts these predatory mite populations to levels where they cannot adequately control pest mite populations. As a result, miticide products are often required to control the pest mite populations. With the use of more selective products, which do not affect predatory mites, pest mite populations have decreased to levels where miticide applications are seldom required.
3.1.2 Trends in fungicide use
Annual volumes of fungicides sold followed similar patterns as insecticides, with a decrease in total sales volume between 1996-1999 (Figure 5). Although there has been year-to-year variation, quantities of sales have been trending upwards since that time. However, there have been some shifts in use of the different categories. For example, since 1998 there appears to have been an increase in sales of inorganic chemicals and a decrease in the sales of dithiocarbamates (Appendix 6).
0
200
400
600
800
1,000
1,200
1994 1995 1996 1997 1998 1999 2000 2001 2002 2003
year ending June
kg a
.i. per
annum
(000's
)
Seed treatments Dithiocarbamates EBI'sBenzimidazole Dicarboximides Other SystemicsInorganics Other TOTAL
Figure 5. Fungicide sales in New Zealand 1994-2003 (Kilograms of active ingredient sold during June to June – Agcarm data).
Dithiocarbamates remain the largest category of fungicides in terms of quantity sold. They are one of the older groups of fungicides with protective activity and their continued use is a reflection of their effectiveness, relatively low cost and low risk of pathogen resistance problems. Some of the other categories of fungicides (e.g. dicarboximides, benzimidazoles,

17
and strobilurin fungicides) have a risk of resistance developing and so need to be used in a resistance management strategy. This often includes limiting the number of applications and may also require mixing of ‘at risk’ and ‘low risk’ chemical groups. Such strategies will limit the relative use of some groups of fungicides. The increase in total volume of inorganic chemicals is a good example of the influence of changing land use patterns. Sulphur forms the basis of disease control for powdery mildew (Uncinula necator) in wine grapes and this industry has significantly grown over the past 10 years (from approximately 6,000 ha in 1995 to 18,000 ha in 2004). As a result, sales of inorganic pesticides have more than doubled since 1994. In addition, the increase in area under organic production since 1998 would have also had an influence on the increasing amount of inorganic chemicals used. Products in this chemical group form the basis of a disease control programme in many organic crops (Beresford et al., 1991). One of the key factors affecting fungicide use in New Zealand is the wet maritime climate, which creates conditions favourable for disease development. To combat this some sectors are using disease forecast models to predict disease risk. The use of these models has allowed fungicide applications to be better targeted at high-risk periods, which can result in a reduced number of applications being made. For example, 10 years ago many Marlborough vineyards based their disease control programmes on regular fungicide applications. Field monitoring for diseases and the use of disease forecast models resulted in a reduction in fungicide use of up to 50% (Agnew et al., 2004).
3.1.3 Trends in herbicide use
Over the last 10 years, there has been a trend for increased sales of herbicides, although annual amounts have fluctuated (Figure 6). Phenoxy hormone and non-selective - non-residual herbicides (mainly glyphosate) remain the largest component of total herbicide sales each year, which is consistent with the pattern reported in Holland and Rahman (1999). The dramatic increase in the use of glyphosate observed in the 1999 survey was noted again in 2000 and sales have stayed at similar or slightly higher levels in subsequent years. This reflects the wide range of uses and the high cost effectiveness of this broad-spectrum herbicide. Because of its high efficacy on many perennial weeds and its non-residual nature, it has found a niche in many cropping, horticultural and pasture use situations. Glyphosate has also been more extensively in agriculture, for weed management in forage brassica crops and pasture renewal programmes.

18
0
500
1,000
1,500
2,000
2,500
3,000
1994 1995 1996 1997 1998 1999 2000 2001 2002 2003
year ending June
kg a
.i. per annum
(000's
)
Brushweed herbicides Phenoxy hormoneTriazines UreasNon-selective (non residual) Non-selective (residual)Graminocides Selective - mainly grass weedsSelective - mainly broadleaves Cereal BroadleavesTOTAL
Figure 6. Herbicide sales in New Zealand 1994-2003 (Kilograms of active ingredient sold during June to June – Agcarm data).
Figures of quantities of herbicides sold by Agcarm category are provided in Appendix 7. These show an upward trend in the sales of phenoxy hormone herbicides between 1999 and 2003, mainly because of the improved financial position of the pastoral sector. Total quantities of brushweed herbicides sold have not changed much since the 1999 survey, probably because no new products have been introduced and herbicides like glyphosate and metsulfuron have further encroached into this market. According to the Agcarm data, use of triazine herbicides has increased considerably in the past couple of years2. This could be because of increased use in cropping and forestry and their high cost-effectiveness. The substantial increase in the use of urea herbicides noted in the 1999 survey has levelled off now, probably because the older urea herbicides (with use rates in kg a.i./ha) are being replaced by sulfonylurea herbicides (with use rates in g a.i./ha). There have also been some changes over time amongst the smaller herbicide categories. For example, there has been a trend for a reduction in the sales of non-selective residual herbicides in the last five years compared with the quantities sold in mid-1990s. Conversely, there has been an increase in the use of selective herbicide in all categories. The comparable increase in the case of selective broad leaf herbicides has been more than that for the selective grass weed herbicides. This could be because many broadleaf herbicides also provide some level of grass weed control and also because broadleaf weeds are more of a problem than
2 total triazine use is still under-estimated in the Agcarm data

19
grass weeds in many crops. Recent introduction of several selective post-emergence herbicides in crops like maize and vegetables has also boosted the sales of products in this category. Herbicide resistance has already appeared in some weeds in New Zealand. The world-wide problem of triazine herbicide resistance by weeds like fathen (Chenopodium album) and willow weed (Polygonum persicaria) has been here for the last two decades, although growers have been able to control them with other products. Biotypes of chickweed (Stellaria media) resistant to chlorsulfuron have been found in Southland cereal crops, but the problem is on a very limited scale. The more serious problem for New Zealand is the development of resistance to phenoxy hormone herbicides in some pasture weeds (Rahman et al., 2001). These resistances have developed because of selection pressure exerted by phenoxy hormone herbicides and the problem is unique to New Zealand.
3.1.4 Summary of trends in the national sales data
The key points of the above analysis of trends in pesticide sales in New Zealand are:
• International data (FAOSTAT) on New Zealand’s pesticide imports suggested that since 1999, these increased by 12% and were valued at US$72m in 2003. Over this period they constituted about 1% of the annual value of New Zealand’s agricultural exports (US$8b).
• Total pesticide sales (Agcarm data) increased by 15% in the 10 year period 1994-2003. The greatest change was a 25% increase in herbicide sales, followed by a 5% increase in insecticide sales (excluding oils) and a 9% decrease in fungicide sales.
• There has been a recent increase in pesticide sales during the last 5 years after a period of declining sales in the mid and late 1990s. Total pesticide use increased by 27% between 1999 and 2003. Herbicide, fungicide and insecticide sales increased by 25, 29 and 30% respectively during this period.
• Changes in insecticide use during the last ten years have been largely driven by variation in organophosphate sales. The initial decrease in sales of this pesticide group in the late 1990s, primarily due to the phasing out of these chemicals in many horticultural industries, has been followed by an increase since 1999.
• The total quantity of fungicide sales has varied over the last 10 years but remains at similar levels to 1994. However, there have been some shifts in use of the different categories. For example, there appears to have been an increase in use of inorganic chemicals, and a decrease in the use of dithiocarbamates. Dithiocarbamates remain the largest category of fungicides in terms of quantity sold.
• Over the last 10 years, there has been a trend for slightly increased sales of herbicides, although annual amounts have fluctuated. Phenoxy hormone and non-selective (non-residual) herbicides remain the largest component of total herbicide sales each year. Amongst the other herbicide categories there have been some changes. For example, there has been a trend for a reduction in the use of non-selective residual herbicides and conversely, a trend for an increase in the use of selective products used mainly against broadleaf weeds.

20
3.2 SECTOR SPECIFIC PESTICIDE USE PATTERNS AND TRENDS
Although this survey represents the most comprehensive survey of pesticide use in New Zealand, there are some significant uses that are not covered because of inability to collect data. Key omissions relate to pesticide use in urban and recreational areas and for minor crops, where few, if any pesticides have label claims, and data are not generally available. For reasons relating to consistency of data collection, this survey does not cover use of rodenticides, biocides, or surfactants/other penetrants. This survey also excludes data on use of pesticides for timber treatments, antifoulings, fly-sprays and related domestic products, or animal remedies. Summed sector-based pesticide use estimates are shown by FAO category in Appendix 8 and the breakdown among the four major sectors for the main pesticide groups is shown in Table 3. A full breakdown of pesticide use by FAO category in each of the sector groups is given in Appendix 9. It can be seen from these tables that the pastoral farming sector dominates herbicide use estimates, while horticulture dominates use of fungicides and insecticides. Collectively these two sectors accounted for approximately 77% of the total active ingredient use identified. Table 3. Sector group areas and quantities of pesticide used
Sector Group Total New
Zealand Area
(ha)
Area as a %
of Total
Total tonnes
(a.i./yr)
Mean pesticide
loading
(kg a.i./ha/yr)
Percentage
of Total
Use
Pastoral farming 7,654,734 79.34% 1,278.42 0.17 35.91%
Arable 141,803 1.47% 343.98 2.43 9.66%
Forestry 1,739,500 18.03% 462.48 0.27 12.99%
Horticulture 111,848 1.16% 1,475.50 13.19 41.44%
The most intensive pesticide use in New Zealand continues to occur in the horticultural sectors, where approximately 41% of total national active ingredient use is made to approximately 112,000 hectares, or slightly over 1% of the land area identified as potentially receiving pesticides. This equates to a mean pesticide loading of 13.19kg a.i./ha/yr, compared with less intensive use in the arable, forestry and pastoral farming sectors (2.43, 0.27 and 0.17kg a.i./ha/yr respectively) (Table 3). Despite the relatively high pesticide use intensity in horticultural crops, a recent study to predict leaching and soil accumulation risks in horticultural crops across a wide range of soil types indicated that current pesticide use patterns in the horticultural industry is unlikely to lead to unacceptable pesticide leaching (Snow et al., 2004). A total of 185 active ingredients were recorded as being used across the sector-based estimates, with 44 of these (24%) identified as contributing to nearly 80% of total active ingredient use. These 44 active ingredients represented 13 of the FAO pesticide categories. These sector data were calculated from estimates of the low number of applications applied for each active ingredient then collated into FAO pesticide groupings and expressed in terms of:
• Total active ingredient inputs (tonnes a.i./sector)
• Proportion of a.i. in each of the FAO groups
• Mean loading across the sector (tonnes a.i. for each sector divided by the total area represented by the sector).

21
Pesticide use estimates by sector are given in Appendices 11-16. The data collected on pesticide use in urban, transport, and parks and reserves were considered incomplete and these have not been presented.
3.2.1 Pesticide use in the arable sector
Data were collected on wheat, barley, oats and maize for grain. We attempted to collect data on linseed, rape and sunflowers, but as both area and pesticide data were incomplete, these have been excluded from the analysis.
Wheat, oats and barley
For small grain arable crops, pesticide usage for weed control remains based on multiple mixtures for broad-spectrum control. Product selection is more likely to be influenced by product pricing rather than biological spectrum of activity. Diflufenican/isoproturon mixture is widely used as well as chlorsulfuron in tank mixtures with other herbicides, especially on autumn-sown wheat and barley.
The use of insecticide seed treatments on wheat and barley, such as imidacloprid, is increasing, with a consequent lower requirement for granular applications or foliar sprays, apart from lambda-cyhalothrin for aphid control.
There has been little change in fungicide seed treatment use on wheat and barley, with most seed treated with tebuconazole. Triazoles (e.g. epoxiconazole) still form the basis of fungicide applications for the control of diseases such as rusts and leaf blotches. Products based on new chemistry such as strobilurins (e.g. azoxystrobin or trifloxystrobin) are increasingly being used for specific diseases and as part of a resistance management strategy. The newer cultivars grown still require plant growth regulator use, especially milling and irrigated wheat and oats in Southland.
Maize for grain
The standard fungicide seed treatment for maize is a mixture of carboxin and thiram. Most maize seed is now treated with an insecticide (imidacloprid replacing furathiocarb). This has replaced the need for granular organophosphate insecticides at planting.
Weed control in maize is still dependent on annual grass and broadleaf control. Acetanilides form the major pre-emergent grass herbicide group with alachlor largely being replaced by acetochlor. Mixtures with atrazine are still common. The wider use of acetochlor and its efficacy on triazine resistant fathen (Chenopodium album) has reduced the need for post-emergent use of dicamba. Concerns of environmental contamination with acetanilide and triazine herbicides have resulted in the recent release of additional selective post-emergence herbicides, although their use is minimal because of their high costs. There is little need for foliar fungicide sprays on current commercial maize cultivars apart from special hybrids for seed production.
3.2.2 Pesticide use in the pastoral farming sector
The area of pastoral land remains fairly constant at 13 million hectares, although some traditional pastoral land near urban areas is being used for industry, housing or cropping (e.g. market gardening).
The estimates of area treated and pesticides used were largely based on the general industry information given in the sector survey for each of the pesticide groups.
Pasture

22
Pesticide use in pastoral agriculture is still dominated by the use of phenoxy hormone herbicides for the control of a few specific problem weeds in established pasture (e.g. ragwort and thistles). This is dominated by 2,4-D (largely the ethylhexyl ester). To minimise the damage to clovers in dairy pasture, applications are made by spot spraying and not broadcast to control the major weed problem, ragwort.
The increase in broadleaf weed resistance to phenoxy hormone herbicides, especially in nodding thistle (Carduus nutans) and giant buttercup (Ranunclulus acris), has increased the use of mixtures with alternative chemistry such as clopyralid, picloram and flumetsulam.
Expenditure on brushweed control is probably slightly less than that for pasture broadleaf weeds. Brushweed control is still based on metsulfuron, picloram/triclopyr mixture and, to a lesser extent, glyphosate.
An increase in pasture renewal and no-till cultivation has elevated the use of seed treatment (e.g. imidacloprid) to control insect pests (e.g. stem weevil) as well as the use of baits to control slugs and snails. The broadcast use of insecticides that were originally used (e.g. organophosphates) for grass grub control has decreased appreciably. The significant ($0.5 million) but localised use of diflubenzuron for porina (Wiseana spp.) control has remained the same.
The use of fungicides on pasture to control facial eczema outbreaks in grazing stock remains very limited. Facial eczema needs specific weather conditions for the pathogen to develop and become a risk to stock.
Fodder brassicas
The fodder brassicas include information from choumoellier and rapeseed crops. Virtually the sole herbicide used is trifluralin, which is incorporated into the soil pre-sowing. Lambda cyhalothrin is the primary insecticide and is used for aphid control in rapeseed. Organophosphate use has increased since 2001 in response to outbreaks of diamond back moth (Plutella xylostella) in forage brassica crops but the amount and likely continuity of this use could not be determined. Seed crops of brassicas are likely to be sprayed with a metalaxyl/mancozeb mixture for specific disease control.
3.2.3 Pesticide use in plantation forestry
During the last five years the forestry sector has undergone some significant shifts in land management. Although the overall forest estate continued to increase by about 150,000 ha during this period, (to 1,700,000 ha in 2003), this is a much slower rate than in the previous five years, when new plantings were more than double that area. Although restocking of existing forest areas increased in the preceding five years (from ~30,000 ha p.a. in 1998 to 40,000 ha p.a. in 2003), this activity did not compensate for the decrease in new plantings. Hence, between new plantings and restocking, forest establishment activity fell from a total of 81,000 ha in 1998 to 62,000 ha in 2003. The other consideration is that there are 84 forest owners with estates larger than 1,000 ha and 14,230 owners with estates ranging from less than 40 ha up to 1,000 ha. These “small owners” accounted for 30% (600,000 ha approximately) of the total forest estate in April 2003. Pinus radiata continued to dominate the industry, with 54,000 ha established or re-established in 2003 compared with 6,000 ha Douglas-fir, and 1,000 ha respectively of other softwoods and hardwoods. Overall, P. radiata still accounts for 89% of the total forest estate. A similar proportion (80% by one estimate (P. Milne, pers. comm.)) exists across the “small owner” category, reflecting the fact that the major forest companies do not plant alternative species to

23
any extent. Pesticide use in forest nurseries is not included in this review, as it represents a very small and seasonally variable proportion of pesticide use. As always, the predominant pesticides used in forestry are herbicides. Although the herbicide prescriptions for P. radiata and Douglas fir establishment are well known, those that may be used for softwoods (albeit mainly other pines) and eucalyptus species are more variable and depend on the species. The methods and prescriptions used to control weeds in forestry have not changed significantly in the last five years, and as before involve both pre-plant and post-plant control. New plantings, which dominated the sector in the previous five years, were typically on uneconomic hill country pasture sites, but this activity has decreased substantially in the immediate past five years. Such new plantings involved spot-spraying herbicide only around the tree seedling and were responsible for a huge reduction in overall herbicide use, compared with broadcast sprays in earlier decades. In addition, the sector is characterised by its extensive use of adjuvants (surfactants, oils) to enhance herbicide and fungicide efficacy, and thereby reducing the amount of active ingredient required. The sector has also come under pressure to reduce pesticide inputs overall, through compliance with national legislation and international market requirements (i.e. forest certification schemes (New Zealand Forest Industries Council et al., 2003)) and has attempted to do so. However, the huge reduction and improved use of pesticides that occurred in the 1980s, with new products, improved formulation and spot application, make further significant reductions very difficult. It is improbable that in New Zealand plantation forestry there will ever be the potential to eliminate the use of herbicides or some fungicide or insecticide products. The information presented in this survey is based on operations during the 2002-03 year (to March or June). This captures a full annual operational cycle. Twenty-four forest companies responded, representing ~60% of national forest ownership. These were predominantly for P. radiata and Douglas fir plantations. The small forest owners with ~30% national forest estate ownership were not surveyed. Instead the mean per ha use rates, obtained from the major company survey, were applied to 80% of their holdings, which were considered to have a similar species mix. The remainder, of about 120,000 ha, represents approximately 6% of the total forest holding and is a mixture of many minor species, for which different herbicide regimes would have been used. Direct interrogation of other forest owners provided some further guidelines for this part of the national estate, mainly for eucalypt plantations. Hence, information has been consolidated for a total of over 90% of the forest estate, either by direct survey or by extrapolation of known use rates. The predominant herbicide active ingredients used are: terbuthylazine (53%), glyphosate (35%) and hexazinone (10%), which collectively account for over 95% of total herbicides used. Appendix 13 shows the pesticide groups used in forestry in the 2002-03 year. It should be emphasised that these quantities are related to the amount of forest area being prepared for planting, or immediately within one to two years after planting. Thereafter, there is no further application of pesticide until the next rotation in 25 to 30 years’ time. The only other products likely to be applied are inorganic copper fungicides for the control of Dothistroma needle blight. These amounts vary according to the level of infestation each year. The total amount of herbicides used on forestlands in 2002-03 is calculated to be in the region of 400 tonnes a.i. per annum. Overall the average amount of herbicide applied is 0.23 kg a.i. per treated ha. This figure is calculated across all forestry land area, although less than 5% of the total area may be treated (i.e. new plantings and re-established forest). Therefore, use on treated land areas may vary from around 1 kg a.i. for spot control in ex-pasture sites, through typical use rate of 3-5 kg a.i. per ha, up to nearly 6 kg a.i. in heavily infested areas. These

24
quantities also include all roadside weed control operations, for which individual areas cannot be identified. The main driver for the higher use rates appears to be the use of terbuthylazine containing products for post-plant weed control at rates up to 10 kg a.i. per ha. The quantity of copper used in 2002-03 was estimated to be 177 tonnes, applied over P. radiata forests, predominantly in the Central and Northern North Island, Nelson and West Coast regions. Typical application rates are 0.85 kg copper equivalent per hectare, but the area treated each year can vary greatly, with 2002-03 representing an unusually high copper usage. Average copper inputs to the forestry industry over the last five years have been closer to 60 tonnes per annum and this is the estimate included in the national use estimates. The quantity of other fungicides used was miniscule. No insecticide use was recorded on P. radiata or Douglas fir. Some insecticide use is known to occur on eucalyptus plantings affected by relatively new pest incursions. The quantities and patterns of insecticide use on eucalyptus plantings are dependent on insect infestation and were not established in this survey. However, given the relatively small areas planted in eucalyptus, this represents a very small proportion of total forestry pesticide use.
3.2.4 Pesticide use in vegetable production
The vegetable crops for which pesticide use estimates have been obtained represent the majority of the total area planted in vegetables in New Zealand. The top five vegetable crops by area (2003) include potatoes (fresh/process/seed) (10,931 ha), peas and beans (fresh/process) (8,445 ha), squash (6,804 ha), sweet corn (5,790 ha) and onions/garlic (5,948 ha). Annual value (2002 domestic data and 2003 export data; values quoted are $NZ million (Kerr et al., 2003)) for all vegetables was $965.9 for domestic consumption and $498.5 for export products. The value of the main domestic crops was: potatoes ($303), tomatoes (mostly greenhouse) ($110), broccoli/cabbage/cauliflower ($80.3), and peas ($45). The main exports include: fresh onions ($100.5), fresh and processed potatoes ($67.4), fresh squash ($53), processed sweet corn ($53.5) and processed mixed vegetables ($59.4). Vegetable growers belonging to the Approved Supplier Programme3, a EUREPGAP4
(European Good Agricultural Practice) equivalent programme, are required to maintain a pesticide spray diary. However, collection of vegetable spray diary information beyond the farm gate is largely restricted to growers supplying processors and supermarket chains. For this report, pesticide use estimates within the vegetable industry were developed from a combination of grower and company spray diaries, consultants, growers and specialist knowledge. They represent generalised use patterns of the conventional growers (including those using Integrated Pest Management (IPM) programmes). Pesticide use in organic crops was not determined. The total use of pesticides on vegetable crops reflects the total land area cropped and the sum of pests, diseases and weeds for a particular crop. Onions and potatoes remain major users of pesticides because they are large industries and they have particularly problematic pests. Insecticide use is also relatively high with vegetable brassicas for the same reasons. A number of vegetable crops (e.g. asparagus, squash, and sweet corn) are also sensitive to weed competition, so herbicide use on these crops is relatively high compared with other vegetable crops.
3 www.approvedsupplier.co.nz 4 www.eurep.org
25
A strategic focus of the vegetable industry is the development of sustainable cropping systems including Integrated Pest Management (IPM). Recent industry-initiated programmes include those for greenhouse tomatoes, greenhouse capsicums, process tomatoes, vegetable brassicas, potatoes, lettuce and onions. The MAF Sustainable Farming Fund has provided an important catalyst for these programmes in recent years. Significant reductions in pesticide (mostly insecticide) use as a result of IPM have been documented for process tomatoes (90%) and vegetable brassicas (50%). Significant challenges to sustainable vegetable crop protection remain. These include:
� Pesticide resistance (e.g. Western flower thrips, onion thrips) restricts the pesticide options for growers
� Pests new to New Zealand (e.g. lettuce aphid, white blister) require additional management practices and it may be some time before sustainable solutions are found that can be integrated into IPM programmes
� The (perceived) difficulty of introducing and registering selective pesticides for small crops may mean a continued reliance on older, broad-spectrum chemistry for pest management
� For various reasons, including cost and regulations, fewer biological control agents are being introduced into New Zealand than in previous years, resulting in continued reliance on pesticides for pest, disease and weed control.
Case Study: Pesticide use in onions
The New Zealand onion industry is a major exporter. In 2003, 184,000 tonnes valued at over $NZ100M was shipped overseas. Europe was the destination for nearly 60% of exports (MAF, 2004). In their 1999 report Holland and Rahman stated:
Onions received the most intensive spray programmes of all the crops studied. The
spray practices vary widely between growers…The crop is very sensitive to weed
competition and provides little shading or ground cover to suppress weeds. Therefore
there is an emphasis on total weed control over the growing season using selective
herbicides applied frequently, often at lower than label rates. The average use of
herbicides in onions exceeds 6 kg/ha. Insecticide use is also relatively intense for a
field crop. Thrips are a pest and export phytosanitary risk which has proved difficult
to control. Fungicide use was even more intense. Concentrated seed treatments are
followed by 8-10 applications of mancozeb and 4-6 applications of MBC products
(benzimadazole) and several applications of fungicides from other classes. The
average use of fungicides in onions exceeds 25 kg/ha… The production system for
onions in this district (Pukekohe) is now widely regarded as unsustainable because of the disease and insect problems combined with degradation of the soil resource,
runoff and leaching…
This fairly damming review of the onion industry generated significant media attention when it was released. The onion industry continues to grapple with problems associated with white rot disease and thrips, and it continues to require high inputs of fungicides and herbicides. However, pest and disease control in the onion industry has benefited from the introduction of improved spray application technology, featuring low volume applications with improved surfactants, in combination with forward and backward angled fan nozzles. MBC fungicide use has been reduced, but the industry is still strongly reliant on dithiocarbamate fungicide inputs.

26
The Sustainable Farming Fund is funding a significant research programme to develop an Integrated Pest and Disease Production System for Onions and other Allium crops. The overall aim of the project is to produce, and implement with training, a comprehensive best-practice IPM Manual for pest and disease control (MAF, 2004).
Case Study: Changing insecticide use in vegetable brassicas
Diamondback moth is a major pest of vegetable brassicas and has traditionally been controlled with multiple sprays of synthetic pyrethroid and organophosphate insecticides. However, development of resistance to these products in some regions in the late 1990s meant that a different approach to control was needed. An IPM (Integrated Pest Management) programme was initiated by Crop and Food Research in 1997 with the support of the government, industry and pesticide companies. The programme emphasized the use of a reduced spray programme supported by crop monitoring. During the programme development, action thresholds were identified for the different crops through various research projects. The programme also included an implementation phase where crop managers were trained in insect identification and crop monitoring techniques. An accreditation system for trainees and a crop management recording system to document insecticide use in the IPM crops were also developed. Demonstration sites in three of the main brassica growing regions were used for grower field days and to compare IPM practices with conventional pest management. Levels of resistance in diamondback moth to the commonly used groups of insecticides were monitored, and resistance levels were compared within regions as well as between regions. As a result of the programme, an insecticide resistance management rotation strategy was developed. This strategy has different chemical groups assigned to two different seasonal windows and recommends rotation of different insecticides within these windows. It also recommends preferential use of selective insecticides to preserve natural enemies. An independent survey in November 2001 reported that 80% of growers in the main brassica-growing region were using IPM and 96% were using crop monitoring. Crop management records from IPM crops showed an average reduction of at least 50% in insecticide use compared with conventional crops, with potential savings of 75%.
3.2.5 Pesticide use in fruit production
Herbicide use in fruit crop production has been greatly reduced for reasons documented in the pipfruit industry case study detailed below. However, both conventionally and organically grown orchard crops continue to rely on fungicide and insecticide inputs to maintain economically viable production under New Zealand’s growing conditions. In their 1999 report Holland and Rahman stated:
“Orchard crops overall still have relatively high uses of pesticides despite increased
adoption of IFP strategies. However the Kiwigreen (IFP) and organic production
systems used by all the kiwifruit industry are notable successes for more biologically
oriented insect and disease control.”
All of the major fruit industries (kiwifruit, pipfruit, winegrapes, avocados, summerfruit and citrus) have implemented sustainable production and/or IPM programmes that focus on justified pesticide inputs, with emphasis placed on selective control options. The various fruit industry sustainable production programmes have to address industry-specific issues as they arise, and each is at a different stage of development. The kiwifruit KiwiGreen, pipfruit

27
Integrated Fruit Production and winegrape Sustainable Winegrowing New Zealand® programmes are arguably the most sophisticated and advanced of New Zealand’s sustainable production programmes. The notable successes of pipfruit Integrated Fruit Production have been detailed in a case study in this report. Similar changes in pesticide use patterns have been, or are being, achieved in other industries, with examples of issues and progress in specific fruit industries given below. A key part of rationalising and changing grower pesticide use patterns has been the establishment of effective benchmarking and communication lines to the individual users. Most growers work in a knowledge vacuum and tend to follow pesticide use practices that they know have worked successfully for them in the past, with very little idea whether such practices are optimised or sustainable. Providing data by which individuals can benchmark their inputs and performance against others and the industry target has been an important and powerful tool in the implementation and adoption of the various sustainable production programmes.
Winegrapes
The winegrape industry has shifted from an average national input of over one organophosphate insecticide application each season in 1997, to an average of approximately 0.4 organophosphate applications per season in 2003 (Manktelow et al., 2004). Regional analysis of this data indicated that organophosphate insecticides were being replaced with new selective insecticides (mainly insect growth regulators such as tebufenozide for leafroller control and buprofezin for mealybug control). Mealybug remains a significant pest problem to the wine industry because of their role in vectoring the debilitating leaf roll virus disease. This problem occurs especially in the warmer North Island production regions and is the main driver for continued use of some organophosphate insecticides in affected areas. The wine industry is actively seeking improved leaf roll virus and mealybug control options. Some major wine companies have shifted to using recycling sprayers for early spring mealybug control sprays, in an effort to minimise environmental loading with organophosphate insecticides. While these are specialist sprayers suitable for only some specific applications, in this situation they have been able to achieve two-to-five fold per hectare insecticide use reductions. Elemental sulphur remains the single largest pesticide input to New Zealand winegrapes. The apparent increase in inorganic chemical sales seen in the Agcarm data (Appendix 6) can largely be attributed to the dramatic increase in winegrape plantings (see earlier discussion). The Sustainable Winegrowing New Zealand® programme sets target sustainable input levels for various pesticides and has recommended that growers should ideally aim to use no more than 18 kg of elemental sulphur per hectare per season. Analysis of industry use data (Manktelow et al., 2004) found that over 80% of growers managed to meet this target. Other work (Gurnsey et al., 2004) has shown that sulphur inputs at the levels seen within the New Zealand wine industry are not expected to lead to any significant environmental or human health problems.
Avocados
The avocado industry is another that has expanded greatly in the time since the Holland and Rahman (1999) report. Avocados continue to face production problems associated with leafroller caterpillars, an increasing problem with six-spotted mites (Tetranychus sexmaculatus) and a complex of storage rots that arise from field infections of immature fruit. The disease control programme in avocados has been heavily reliant on inputs of copper compounds with avocado (and some stonefruit) estimates appearing to be the highest per hectare sector users of copper fungicides. The sustainability or otherwise of copper inputs

28
remains an issue of some debate (Gurnsey et al., 2004). However, the avocado industry is actively seeking sustainable solutions to these problems, with significant ongoing commitments made to research on disease epidemiology and spray application technology.
Kiwifruit
Just over 12,000 ha are currently planted in kiwifruit. Approximately 85% of the plantings are in the Bay of Plenty, with the remainder in the Northland, Auckland, Gisborne and Nelson regions. Over the last two decades, pesticide use in kiwifruit has changed markedly. In the 1980s growers followed a calendar spray programme that included 8-9 broad-spectrum insecticide sprays per annum. Most of these insecticides belonged to the organophosphate group and included azinphos-methyl, phosmet, diazinon and chlorpyrifos. Dicarboximide and/or benzimidazole fungicides were also routinely applied, often up to 3 per annum. In response to market signals an Integrated Pest Management programme, KiwiGreen, was introduced to the industry in the early 1990s. KiwiGreen was first trialled in 1991-92 on just 50 ha, but within 6 years the programme had become the industry standard for all export crops (excluding organic crops). The industry-wide adoption of KiwiGreen resulted in a dramatic decrease in pesticide use in kiwifruit. KiwiGreen pest monitoring systems meant sprays could be applied according to need as opposed to on a calendar basis, and the identification of effective, more selective insecticides (e.g. Bacillus thuringiensis and mineral oil products) gave growers alternatives to organophosphates. The number of broad-spectrum insecticide sprays being applied fell from an average of 8-9 per annum in 1980 to just 3 per annum in 1998, equating to a saving of 100 tonnes a year. Similarly, with the introduction of monitoring systems and new cultural control tools for diseases, fungicide use dropped from an average of 3 to <1 spray per annum over the same period. Similar reductions in pesticide use have been recorded for herbicides. In the 1980s, herbicides were used on an estimated 80% of kiwifruit orchards to maintain a weed-free area beneath the vine canopy. This practice is now used on approximately 35% of kiwifruit orchards only, with the remainder using mowers for weed control. Going against the trend for reduced pesticide use, the growth regulator hydrogen cyanamide is now used on approximately 90% of orchards as a dormant season spray to improve bud-burst, up from 50% of orchards in 1998 (Holland and Rahman, 1999). Since the industry-wide adoption of KiwiGreen in the late 1990s, pesticide use in kiwifruit has not changed dramatically. The average number of organophosphate and fungicide sprays applied per annum remains at 3 and <1 respectively. The industry aims to make further reductions, but this will depend on the development of effective alternative control technologies, particularly for armoured scale insects and Sclerotinia disease.
Case Study: Pesticide use in pipfruit and summerfruit orchards
Pipfruit production land area has declined by 20% in the last 5 years to about 12,000 ha while summerfruit production areas have remained relatively static at about 3,000 ha. The pipfruit sector has undergone considerable structural change since the late 1990s that culminated in deregulation and loss of ENZA’s export monopoly in 2001. Crop protection practices have changed markedly in the pipfruit sector. Also, by 2003 organic apple production accounted for about 5% of the national export crop.

29
Although the IFP programmes described below developed from a market-led initiative, the benefits of reduced pesticide toxicity and use with IFP management has created a strong advocacy for this approach amongst growers in both the pipfruit and summerfruit sectors. The benefits of these programmes are not just to growers but also their workers, rural communities and rural environments.
Pipfruit
In the mid 1990s, organophosphate (OP) insecticides formed the basis of insect control in apple production. Changing market requirements and pest resistance to this class of pesticides lead the sector towards the implementation of an Integrated Fruit Production (IFP) programme in the late 1990s. This programme, initiated by ENZA New Zealand International in 1996, was progressively adopted by growers and became the minimum export standard before the sector was deregulated. It introduced major changes to pest management including the replacement of broad-spectrum organophosphate insecticides with selective products that were compatible with biological control. Calendar-based spraying was replaced by monitoring systems and pest thresholds that eliminated unnecessary insecticide use. An analysis of all pesticide use on the major cultivar ‘Braeburn’ (~35% of plantings) shows that total active ingredient use decreased by over 40% between 1996 and 2003. Insecticide use in the sector was reported separately by Holland and Rahman (1999) for four programmes as the sector transitioned towards full implementation of IFP pest management in 2001. It is therefore more appropriate to report here on change in insecticide use that occurred between 1996 and 2003 with a focus on the major cultivar, ‘Braeburn’. Implementation of IFP reduced the number of insecticide sprays by 40-50% to 4-6 per season, depending on variety and region. Total insecticide active ingredient use on ‘Braeburn’ decreased by approximately 80% nationally between 1996 and 2003. While half of this decrease can be attributed to a reduction in the frequency of use, the remainder is due to a reduction in the application rate per hectare of the new selective pest management products used in the IFP programme. Organophosphate insecticides accounted for the largest part of this decrease; their frequency of use has declined by approximately 95% (Figure 7). Use of carbaryl (a broad-spectrum carbamate insecticide) has also declined to an average of approximately 0.6 applications nationally. Although classified as an insecticide, this pesticide is used to thin apple crops rather than for any role in pest management. It is, however, also toxic to many natural enemies and the sector is currently implementing IFP-compatible thinning strategies to further reduce carbaryl use. Pest management in apples is now based on new, selective products, including Insect Growth Regulator (IGR) insecticides, that are highly specific to the target pests and have very low application rates per hectare. Other new classes of insecticides are also used and all these products are now screened for safety to the important beneficial species. Miticide (acaricide) use is now negligible and the 95% decrease since 1996 is a consequence of new IFP pest and disease management programmes that are compatible with the predator mite, Typhlodromus pyri. Greater use of biological insecticides e.g. Bacillus thuringiensis (Bt) and spinosad, is attributable, in part, to the expansion of organic apple production. Mineral oils, by virtue of their application rate (~20 L per hectare), accounted for approximately 50% of all pesticide active ingredient use on ‘Braeburn’ apples in 200. This was a decrease of approximately 60% since 1996.

30
Organophosphate insecticide use on Braeburn apples
0
1
2
3
4
5
6
1996 1997 1998 1999 2000 2001 2002 2003
Avera
ge n
um
ber
of applications
azinphos-methyl
chlorpyrifos
diazinon
Figure 7: The decline in the average number of organophosphate insecticide sprays applied annually to ‘Braeburn’ apples nationally between 1996 and 2003 (average number of applications per block per season).
IFP also introduced significant changes to disease management, which is challenging in New Zealand’s maritime climate because of the high number of infection periods for major diseases like apple black spot. IFP growers access disease risk prediction services that use disease models and weather data from regional networks of weather stations to optimise their disease management programmes. A small increase in total pipfruit industry fungicide use is a consequence of 8-fold increase in use of inorganic fungicides. Lime sulphur is a mildly effective fungicide that is used in organic production at relatively high application rates of 10-20 L per hectare so consequently accounts for 80% of inorganic fungicide use. It therefore also accounts for about 30% of all fungicide active ingredients used on ‘Braeburn’ apple crops nationally. If this use is eliminated from the analysis, then use of all other classes of fungicides has decreased by approximately 35% between 1996 and 2003. Use of dithiocarbamate fungicides has decreased by over 60% while use of other fungicides, including captan and dodine that underpin preventative disease management programmes on apple, have decreased by approximately 17%. IFP has not only reduced the use of fungicides in the apple sector, it has also helped to increase growers’ compliance with fungicide resistance management guidelines for ‘at risk’ fungicides (e.g. ergosterol biosynthesis inhibitors) and decrease their use of the mite disruptive, dithiocarbamate fungicide group. Occasional use of the antibiotic streptomycin is required to manage bacterial infection by fire blight (Erwinia amylovora) in some seasons. Just 6% of orchards used streptomycin on ‘Braeburn’ crops in 2003 (less than 1% of these orchards had more than one application) compared with ~20% of orchards in 1999 and 2000 seasons. This antibiotic use reduction reflects a combination of the introduction of an alternative biological control agent for fire blight control and better grower understanding of

31
factors leading to fire blight disease outbreaks, and when and if preventative sprays are required. The pipfruit industry runs a national weather-based fire blight disease warning service that alerts growers to seasonal disease risks and the potential need for spray applications. Use of plant growth regulators on ‘Braeburn’ apples increased significantly between 1996 and 2003. This increase is associated mainly with the use of ammonium thiosulphate as a desiccant bloom thinner to manage crop load and is a consequence of the move away from use of the insecticide carbaryl as the primary fruit thinning treatment. Hydrogen cyanimide, to promote flowering on early varieties e.g. ‘Gala’, and was applied to just 5% of that variety in 2003. Total herbicide use associated with the national ‘Braeburn’ crop has also declined between 1996 and 2003. In 1996, pre-emergence residual triazine herbicides (e.g. simazine) were an integral part of orchard weed management programmes but, following IFP weed management initiatives, are not used. Weed management is now largely based on use of knockdown phosphonyl herbicides (e.g. glyphosate) with problem broadleaf weeds targeted with spot treatments of other selective herbicides (e.g. fluroxypyr). Despite this philosophical change to weed management, use of phosphonyl herbicides on ‘Braeburn’ has decreased by over 60% between 1996 and 2003. Other IFP practices, including a reduction in the width of the ‘herbicide strip’ beneath trees (now typically 30% of the orchard area compared with 50-60% previously), have contributed to this reduction in herbicide use. Grazing sheep in winter and greater grower acceptance of some vegetation beneath trees have also contributed to lower herbicide use in apple production.
Summerfruit
Insecticide use in summerfruit has declined since the late 1990s with the introduction of the SummerGreen programme that was based on IFP philosophies. The level of insecticide used by the sector is strongly influenced by the markets for the crop with 6 – 8 sprays applied on export peach and nectarine crops respectively compared with 2 – 3 sprays per season on local market crops in 2003. Nationally, organophosphate insecticide use on summerfruit crops has declined significantly and is continuing to do so. The use of carbamate and pyrethroid insecticides (for thrips control), aphicides and miticides remains largely unchanged on peaches and nectarines; together these account for about 50% of insecticide use on export crops in 2003. Fungicide use on summerfruit is strongly determined by New Zealand’s spring/summer rainfall and this can result in significant seasonal and regional variations in fungicide use. Eight to eleven fungicides are applied to nectarine crops with most use targeted at control of brown rot. There was a very low level of antibiotic use in 2003 for control of blast and other bacterial diseases, but use has declined by at least 70% since 2001. There has been a corresponding increase in copper use. Four to five copper sprays are typically applied for the suppression of both bacterial and fungal diseases, compared with 2 - 3 in 2001.

32
3.3 COMPARISON OF SECTOR-SPECIFIC USE ESTIMATES AGAINST
NATIONAL SALES DATA
A gross comparison of total active ingredient use estimated across all sectors surveyed versus total Agcarm sales data are shown in Table 4. Given the assumptions in the sector use estimates, agreement of the data to within 20% was considered an acceptable target for reconciliation of the two use estimates. The Agcarm data are known to under-represent some herbicide use, so the 19% greater herbicide use estimated from the Agcarm data suggest that the sector-based herbicide use estimates failed to account for at least 300,000 kg of herbicide active ingredient used in New Zealand each year. Possible use situations that would account for this quantity of herbicide include use on roadsides, industrial, recreational and domestic areas, which were not reliably assessed in this report. Likewise, a sensitivity analysis of the sector-based use estimates for herbicides indicates that the treated area assumptions in the pastoral farming sectors could easily introduce a range in use estimates on a scale of that observed. The potentially treated pastoral farming area made up nearly 80% of the total sector areas (Appendix 3); a typical herbicide use assumption across these sectors saw phenoxy hormones and phosphonyls applied across 1 to 5% of this land area each year. Applied at rates in excess of 1 kg a.i. per ha, a small change in the actual treated area could easily account for large annual differences in total herbicide use.
Table 4. Comparison of sector-based pesticide use estimates against Agcarm sales data for 2003.
Pesticide group
Estimated typical national use
(000 kg a.i.)
Agcarm sales reported
(000 kg a.i.)
Agcarm data as a %
of sector use estimates
Fungicides 894 827 93%
Herbicides 2,131 2,541 119%
Insecticides1 230 332 144%
PGRs 305 166 54%
Total 3,560 3,911 110% 1Excludes mineral oils
The Agcarm groupings used for reporting different product uses made it difficult to undertake a reliable analysis of differences between sales-based and sector-based estimates of pesticide use within specific pesticide groups. However, there was evidence to suggest that mineral oil, triazine herbicide and some plant growth regulator use are not fully reported to Agcarm, but were identified in the sector-based use estimates. The Agcarm data also indicated that organophosphate insecticide use was under-estimated by 20% in the sector-based use figures, which represents approximately 40 tonnes of active ingredient. There was a strong downwards trend in organophosphate use apparent in the Agcarm data in the years 1995-1999 (Appendix 5) and this was, correctly, attributed to the phasing out of these insecticides by the major fruit industries (section 3.2). The return to organophosphate use at levels around 200 tonnes from a low of approximately 150 tonnes in 1998 was not predicted from the sector-based use estimates. Following consultation with the chemical suppliers and various sectors believed to use these insecticides, it was established that the apparent increase in organophosphate use since 1998 reflects a combination of:
1) Increase in use of minimum tillage direct drilling technology

33
2) Possible increase in use of forage crops (especially brassicas) 3) The need to control specific insect pest problems associated with these changes in farming practices.
Holland and Rahman (1999) identified phosphonyl herbicides (principally glyphosate) as the largest class of pesticides used in 1998 (831 tonnes), with similar levels of phenoxy hormone herbicides use (743 tonnes) and triazine use at about a third of these (245 tonnes). The relative rankings of these herbicides shown in Appendix 10 would suggest that the sector-based use estimates have failed to account for something in the order of 500-700 tonnes of phosphonyl herbicides. Two possible contributing factors to this omission are; 1) the large number of generic glyphosate compounds on the New Zealand market, with probable under-reporting of glyphosate use in the Agcarm statistics and 2) widespread use of glyphosate compounds in sectors that were not adequately covered in this survey (roadside, urban etc.).
Ideally, the sector use estimates would have been adjusted to reflect these changes. However, spray diary and land use area data associated with these practices were not readily available within the timeframe required for this report, and so will need to be quantified in subsequent work.
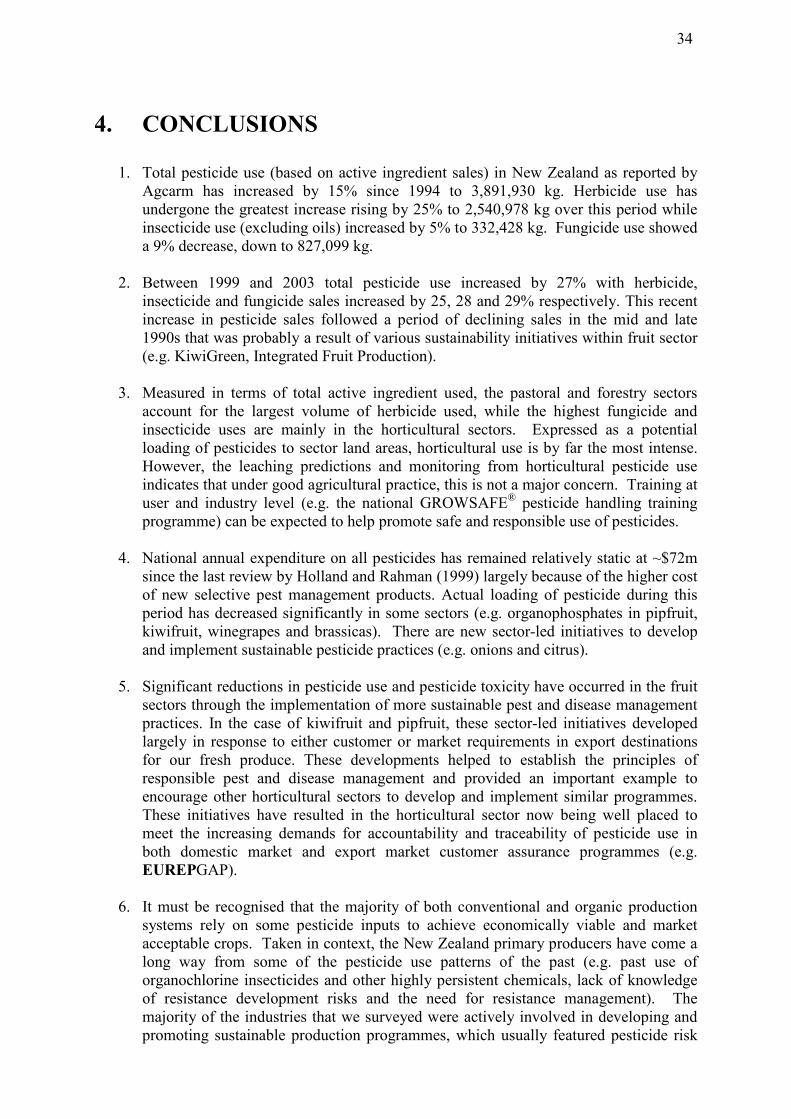
34
4. CONCLUSIONS
1. Total pesticide use (based on active ingredient sales) in New Zealand as reported by
Agcarm has increased by 15% since 1994 to 3,891,930 kg. Herbicide use has undergone the greatest increase rising by 25% to 2,540,978 kg over this period while insecticide use (excluding oils) increased by 5% to 332,428 kg. Fungicide use showed a 9% decrease, down to 827,099 kg.
2. Between 1999 and 2003 total pesticide use increased by 27% with herbicide,
insecticide and fungicide sales increased by 25, 28 and 29% respectively. This recent increase in pesticide sales followed a period of declining sales in the mid and late 1990s that was probably a result of various sustainability initiatives within fruit sector (e.g. KiwiGreen, Integrated Fruit Production).
3. Measured in terms of total active ingredient used, the pastoral and forestry sectors
account for the largest volume of herbicide used, while the highest fungicide and insecticide uses are mainly in the horticultural sectors. Expressed as a potential loading of pesticides to sector land areas, horticultural use is by far the most intense. However, the leaching predictions and monitoring from horticultural pesticide use indicates that under good agricultural practice, this is not a major concern. Training at user and industry level (e.g. the national GROWSAFE® pesticide handling training programme) can be expected to help promote safe and responsible use of pesticides.
4. National annual expenditure on all pesticides has remained relatively static at ~$72m
since the last review by Holland and Rahman (1999) largely because of the higher cost of new selective pest management products. Actual loading of pesticide during this period has decreased significantly in some sectors (e.g. organophosphates in pipfruit, kiwifruit, winegrapes and brassicas). There are new sector-led initiatives to develop and implement sustainable pesticide practices (e.g. onions and citrus).
5. Significant reductions in pesticide use and pesticide toxicity have occurred in the fruit
sectors through the implementation of more sustainable pest and disease management practices. In the case of kiwifruit and pipfruit, these sector-led initiatives developed largely in response to either customer or market requirements in export destinations for our fresh produce. These developments helped to establish the principles of responsible pest and disease management and provided an important example to encourage other horticultural sectors to develop and implement similar programmes. These initiatives have resulted in the horticultural sector now being well placed to meet the increasing demands for accountability and traceability of pesticide use in both domestic market and export market customer assurance programmes (e.g. EUREPGAP).
6. It must be recognised that the majority of both conventional and organic production
systems rely on some pesticide inputs to achieve economically viable and market acceptable crops. Taken in context, the New Zealand primary producers have come a long way from some of the pesticide use patterns of the past (e.g. past use of organochlorine insecticides and other highly persistent chemicals, lack of knowledge of resistance development risks and the need for resistance management). The majority of the industries that we surveyed were actively involved in developing and promoting sustainable production programmes, which usually featured pesticide risk

35
reduction strategies (e.g. residue management, resistance management, use of selective products and phasing out of disruptive pesticides).
7. The fruit industries lead the shift towards the use of selective pest management
products and the phasing out of broad-spectrum pesticides. Similar trends are apparent in other industries, e.g. the trend in some arable and agricultural crops to replace granular organophosphate insecticides with more selective insect growth regulator insecticides.
8. A key part of any pesticide risk reduction programme is communication of issues and
management options to individual pesticide users. Experience in the fruit industries has demonstrated high between-grower variability in use patterns and decisions on pesticide use. Growers cannot be expected to take risks in production until they are educated about viable alternative management options. This requires that they can relate their own practices to those that are proven successful with other growers.
9. During the data collection phase of this project it was found that the best pesticide use
data were consistently linked to sectors with fresh produce exports. Systems appeared to be in place for recording animal remedy inputs on farms (not part of this report), but industry knowledge of other pesticide inputs on farms was limited mainly to the types and generally expected use patterns. Specific data on areas treated and individual use decisions are an essential part of any programme to identify risks and then mitigate them. The most incomplete pesticide use records tended to be in the least regulated sectors that were not directly related to primary production. There remains a real lack of data on domestic and urban pesticide uses and their implications.
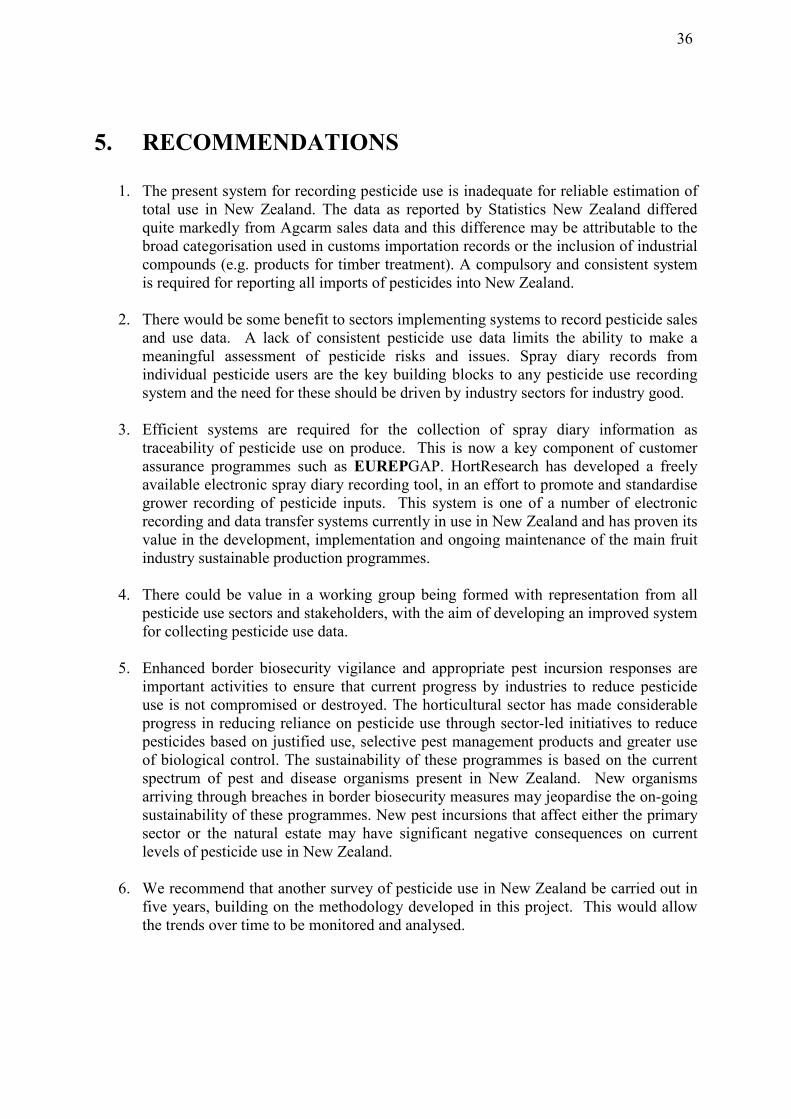
36
5. RECOMMENDATIONS
1. The present system for recording pesticide use is inadequate for reliable estimation of
total use in New Zealand. The data as reported by Statistics New Zealand differed quite markedly from Agcarm sales data and this difference may be attributable to the broad categorisation used in customs importation records or the inclusion of industrial compounds (e.g. products for timber treatment). A compulsory and consistent system is required for reporting all imports of pesticides into New Zealand.
2. There would be some benefit to sectors implementing systems to record pesticide sales
and use data. A lack of consistent pesticide use data limits the ability to make a meaningful assessment of pesticide risks and issues. Spray diary records from individual pesticide users are the key building blocks to any pesticide use recording system and the need for these should be driven by industry sectors for industry good.
3. Efficient systems are required for the collection of spray diary information as
traceability of pesticide use on produce. This is now a key component of customer assurance programmes such as EUREPGAP. HortResearch has developed a freely available electronic spray diary recording tool, in an effort to promote and standardise grower recording of pesticide inputs. This system is one of a number of electronic recording and data transfer systems currently in use in New Zealand and has proven its value in the development, implementation and ongoing maintenance of the main fruit industry sustainable production programmes.
4. There could be value in a working group being formed with representation from all pesticide use sectors and stakeholders, with the aim of developing an improved system for collecting pesticide use data.
5. Enhanced border biosecurity vigilance and appropriate pest incursion responses are
important activities to ensure that current progress by industries to reduce pesticide use is not compromised or destroyed. The horticultural sector has made considerable progress in reducing reliance on pesticide use through sector-led initiatives to reduce pesticides based on justified use, selective pest management products and greater use of biological control. The sustainability of these programmes is based on the current spectrum of pest and disease organisms present in New Zealand. New organisms arriving through breaches in border biosecurity measures may jeopardise the on-going sustainability of these programmes. New pest incursions that affect either the primary sector or the natural estate may have significant negative consequences on current levels of pesticide use in New Zealand.
6. We recommend that another survey of pesticide use in New Zealand be carried out in
five years, building on the methodology developed in this project. This would allow the trends over time to be monitored and analysed.

37
6. REFERENCES
Agnew, R.H.; Mundy D.C.; Balalasubramaniam, R. 2004: Effects of spraying strategies based
on monitored disease risk on grape disease control and fungicide usage in Marlborough. New Zealand Plant Protection Society 57:30-36.
Beresford, R.M., Elmer, P.A.G.; Spink, M.; Alexander, R.T.; Daly, M.J. 1991. Fungicides for control of black spot and powdery mildew in organic apple systems. Proceedings of the 44
th New Zealand Weed and Pest Control Conference 44: 86-90.
FAO, 1996: Disaggregated data sets for pesticides. FAO Pesticides Database. UN Food &
Agricultural Organisation, Rome. FAOSTAT data. (no date): FAO Statistical Databases. Food and Agriculture Organisation of
the United Nations. Retrieved from http://faostat.fao.org/faostat/collections?subset=agriculture
Gurnsey, S.; Pearson, A. and Manktelow, D. 2004: Inorganic pesticides: Sustainable use in
New Zealand horticultural industries. HortResearch Client Report No. 13290. 131pp. Holland, P.T. and Rahman, A. 1999: Review of trends in agricultural pesticide use in New
Zealand. MAF Policy Technical Paper 99/11. International Standards Organisation (ISO) (no date): ISO/TC 81 common names for
pesticides and other agrochemicals. ISOTC Portal. Retrieved from http://isotc.iso.org/isotcportal/index.html
Kerr, J.P.; Hewett, E.W.; Aitken, A.G. 2003: New Zealand horticulture facts and figures.
HortResearch. www.hortresearch.co.nz MacIntyre, A.; Allison, N. ; Penman, D. 1989: Pesticides : Issues and options for New
Zealand. Ministry for the Environment. Manktelow, D.; Gurnsey, S.; van der Zijpp, S. and Manson, P. 2004: Report on 2002-03
season scorecard and spray diary data. Report to Sustainable Winegrowing New Zealand members. 27pp.
Ministry of Agriculture and Forestry (MAF). 2003: Situation and Outlook for New Zealand
Agriculture and Forestry: Update May 2003. Retrieved from http://www.maf.govt.nz/mafnet/rural-nz/statistics-and-forecasts/sonzaf/may-03-update/may-03-update.pdf
Ministry of Agriculture and Forestry (MAF). 2004: Sustainable Farming Fund Project
Summary. Development of an integrated pest and disease production system for onions and other allium crops. Grantee: NZ Onion Exporters Association. Grantee Number: 04/110. Retrieved from http://www.maf.govt.nz/sff/about-projects/horticulture/04110onions.htm

38
Ministry of Agriculture and Forestry. No date: Primary industries- statistics index. Retrieved from http://www.maf.govt.nz/statistics/primary-industries/index.htm
New Zealand Food Safety Authority. No date: ACVM database of currently registered
Veterinary Medicines, Plant Compounds and Vertebrate Toxic Agents. Retrieved from http://www.nzfsa.govt.nz/acvm/registers-lists/acvm-register/index.htm
New Zealand Forest Industries Council; New Zealand Forest Dunes Association. 2003: From
Principles to Practice. The New Zealand Sustainable Forest Management Story. Wellington. 13pp.
Rahman, A.; James, T.K.; Seefeldt, S. 2001: The current situation with herbicide resistant
weeds in New Zealand. Proceedings of the 18th Asian-Pacific Weed Science Society
Conference: 500 - 508.
Snow, V.; Green, S.; Veale, C.; Clothier, B.; Ironside, N.; Ensor, P. 2004: Growsafe calculator. Version 1.0.6.14. HortResearch.
Statistics New Zealand. No date: Primary production datasets. Retrieved from
http://www.stats.govt.nz/datasets/primary-production/default.htm
7. ACKNOWLEDGEMENTS
Financial support has been received from the Minister for the Environment’s Sustainable Management Fund, which is administered by the Ministry for the Environment. Our sincere thanks to the many researchers, growers, sector representatives, chemical company staff and other people who have helped us in the compilation of the data for this report.

39
APPENDIX 1. Pesticide active ingredients grouped into FAO categories
Group FAO group Active ingredientHERBICIDES Amides acetochlor
HERBICIDES Amides alachlor
HERBICIDES Amides metolachlor
HERBICIDES Amides propachlor
HERBICIDES Amides propyzamide
HERBICIDES Bipyridyls diquat
HERBICIDES Bipyridyls paraquat
HERBICIDES Bipyridyls paraquat dichloride
HERBICIDES Carbamate herbicides asulam
HERBICIDES Carbamate herbicides chlorprophamHERBICIDES Carbamate herbicides phenmedipham
HERBICIDES Dinitroanilines pendimethalin
HERBICIDES Dinitroanilines trifluralin
HERBICIDES FOPs and DIMs (H3) clethodim
HERBICIDES FOPs and DIMs (H3) clodinafop-propargyl
HERBICIDES FOPs and DIMs (H3) fenoxaprop-p-ethyl
HERBICIDES FOPs and DIMs (H3) flamprop isopropyl
HERBICIDES FOPs and DIMs (H3) fluazifop-p-butyl
HERBICIDES FOPs and DIMs (H3) haloxyfop
HERBICIDES FOPs and DIMs (H3) haloxyfop [(r)-isomer]
HERBICIDES FOPs and DIMs (H3) sethoxydim
HERBICIDES FOPs and DIMs (H3) tralkoxydim
HERBICIDES Other herbicides (H4) amitrole
HERBICIDES Other herbicides (H4) bentazone
HERBICIDES Other herbicides (H4) bromoxynilHERBICIDES Other herbicides (H4) chloridazon
HERBICIDES Other herbicides (H4) clomazone
HERBICIDES Other herbicides (H4) dichlobenil
HERBICIDES Other herbicides (H4) diflufenican
HERBICIDES Other herbicides (H4) dimethenamid
HERBICIDES Other herbicides (H4) ethofumesate
HERBICIDES Other herbicides (H4) fluroxypyr
HERBICIDES Other herbicides (H4) ioxynil
HERBICIDES Other herbicides (H4) ioxynil
HERBICIDES Other herbicides (H4) norfluazon
HERBICIDES Other herbicides (H4) oxyfluorfen
HERBICIDES Other hormone types (H1) clopyralid
HERBICIDES Other hormone types (H1) dicamba
HERBICIDES Other hormone types (H1) picloramHERBICIDES Other hormone types (H1) triclopyr
HERBICIDES Other hormone types (H1) triclopyr butoxyethyl ester: triclopyr bee
HERBICIDES Phenoxy hormones 2,4-D
HERBICIDES Phenoxy hormones 2,4-D amine
HERBICIDES Phenoxy hormones 2,4-D ester
HERBICIDES Phenoxy hormones 2,4-DB
HERBICIDES Phenoxy hormones MCPA
HERBICIDES Phenoxy hormones MCPB
HERBICIDES Phenoxy hormones mecoprop
HERBICIDES Phenoxy hormones dichlorprop
HERBICIDES Phenoxy hormones dichlorprop-p
HERBICIDES Phenoxy hormones mecoprop-p
HERBICIDES Phosphonyls (H2) glufosinate-ammonium
HERBICIDES Phosphonyls (H2) glyphosate
HERBICIDES Phosphonyls (H2) glyphosate-trimesiumHERBICIDES Sulfonylureas chlorsulfuron
HERBICIDES Sulfonylureas iodosulfuron-methyl-sodium
HERBICIDES Sulfonylureas metsulfuron-methyl
HERBICIDES Sulfonylureas tribenuron-methyl
HERBICIDES Sulfonylureas primisulfuron-methyl
HERBICIDES Sulfonylureas thifensulfuron-methyl
HERBICIDES Sulfonylureas halosulfuron-methyl
HERBICIDES Sulfonylureas chlorimuron-ethyl
HERBICIDES Triazines atrazine
HERBICIDES Triazines hexazinone
HERBICIDES Triazines metribuzin
HERBICIDES Triazines prometryn
HERBICIDES Triazines simazine
HERBICIDES Triazines terbuthylazineHERBICIDES Uracils terbacil
HERBICIDES Urea Derivatives diuron
HERBICIDES Urea Derivatives isoproturon
HERBICIDES Urea Derivatives linuron
HERBICIDES Urea Derivatives methabenzthiazuron
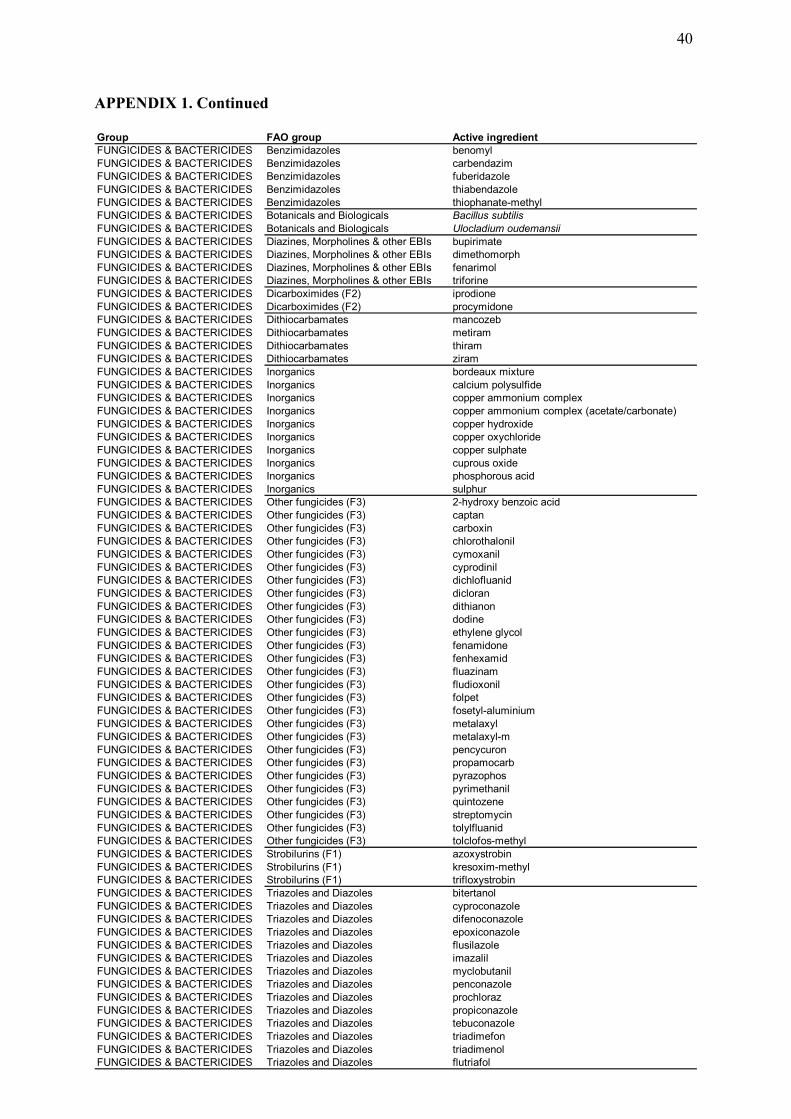
40
Group FAO group Active ingredientFUNGICIDES & BACTERICIDES Benzimidazoles benomyl
FUNGICIDES & BACTERICIDES Benzimidazoles carbendazimFUNGICIDES & BACTERICIDES Benzimidazoles fuberidazole
FUNGICIDES & BACTERICIDES Benzimidazoles thiabendazole
FUNGICIDES & BACTERICIDES Benzimidazoles thiophanate-methylFUNGICIDES & BACTERICIDES Botanicals and Biologicals Bacillus subtilis
FUNGICIDES & BACTERICIDES Botanicals and Biologicals Ulocladium oudemansii
FUNGICIDES & BACTERICIDES Diazines, Morpholines & other EBIs bupirimateFUNGICIDES & BACTERICIDES Diazines, Morpholines & other EBIs dimethomorph
FUNGICIDES & BACTERICIDES Diazines, Morpholines & other EBIs fenarimolFUNGICIDES & BACTERICIDES Diazines, Morpholines & other EBIs triforine
FUNGICIDES & BACTERICIDES Dicarboximides (F2) iprodione
FUNGICIDES & BACTERICIDES Dicarboximides (F2) procymidoneFUNGICIDES & BACTERICIDES Dithiocarbamates mancozeb
FUNGICIDES & BACTERICIDES Dithiocarbamates metiram
FUNGICIDES & BACTERICIDES Dithiocarbamates thiramFUNGICIDES & BACTERICIDES Dithiocarbamates ziram
FUNGICIDES & BACTERICIDES Inorganics bordeaux mixture
FUNGICIDES & BACTERICIDES Inorganics calcium polysulfideFUNGICIDES & BACTERICIDES Inorganics copper ammonium complex
FUNGICIDES & BACTERICIDES Inorganics copper ammonium complex (acetate/carbonate)
FUNGICIDES & BACTERICIDES Inorganics copper hydroxideFUNGICIDES & BACTERICIDES Inorganics copper oxychloride
FUNGICIDES & BACTERICIDES Inorganics copper sulphate
FUNGICIDES & BACTERICIDES Inorganics cuprous oxideFUNGICIDES & BACTERICIDES Inorganics phosphorous acid
FUNGICIDES & BACTERICIDES Inorganics sulphurFUNGICIDES & BACTERICIDES Other fungicides (F3) 2-hydroxy benzoic acid
FUNGICIDES & BACTERICIDES Other fungicides (F3) captan
FUNGICIDES & BACTERICIDES Other fungicides (F3) carboxinFUNGICIDES & BACTERICIDES Other fungicides (F3) chlorothalonil
FUNGICIDES & BACTERICIDES Other fungicides (F3) cymoxanil
FUNGICIDES & BACTERICIDES Other fungicides (F3) cyprodinilFUNGICIDES & BACTERICIDES Other fungicides (F3) dichlofluanid
FUNGICIDES & BACTERICIDES Other fungicides (F3) dicloran
FUNGICIDES & BACTERICIDES Other fungicides (F3) dithianonFUNGICIDES & BACTERICIDES Other fungicides (F3) dodine
FUNGICIDES & BACTERICIDES Other fungicides (F3) ethylene glycol
FUNGICIDES & BACTERICIDES Other fungicides (F3) fenamidoneFUNGICIDES & BACTERICIDES Other fungicides (F3) fenhexamid
FUNGICIDES & BACTERICIDES Other fungicides (F3) fluazinam
FUNGICIDES & BACTERICIDES Other fungicides (F3) fludioxonilFUNGICIDES & BACTERICIDES Other fungicides (F3) folpet
FUNGICIDES & BACTERICIDES Other fungicides (F3) fosetyl-aluminium
FUNGICIDES & BACTERICIDES Other fungicides (F3) metalaxylFUNGICIDES & BACTERICIDES Other fungicides (F3) metalaxyl-m
FUNGICIDES & BACTERICIDES Other fungicides (F3) pencycuronFUNGICIDES & BACTERICIDES Other fungicides (F3) propamocarb
FUNGICIDES & BACTERICIDES Other fungicides (F3) pyrazophos
FUNGICIDES & BACTERICIDES Other fungicides (F3) pyrimethanilFUNGICIDES & BACTERICIDES Other fungicides (F3) quintozene
FUNGICIDES & BACTERICIDES Other fungicides (F3) streptomycin
FUNGICIDES & BACTERICIDES Other fungicides (F3) tolylfluanidFUNGICIDES & BACTERICIDES Other fungicides (F3) tolclofos-methyl
FUNGICIDES & BACTERICIDES Strobilurins (F1) azoxystrobin
FUNGICIDES & BACTERICIDES Strobilurins (F1) kresoxim-methylFUNGICIDES & BACTERICIDES Strobilurins (F1) trifloxystrobin
FUNGICIDES & BACTERICIDES Triazoles and Diazoles bitertanol
FUNGICIDES & BACTERICIDES Triazoles and Diazoles cyproconazoleFUNGICIDES & BACTERICIDES Triazoles and Diazoles difenoconazole
FUNGICIDES & BACTERICIDES Triazoles and Diazoles epoxiconazole
FUNGICIDES & BACTERICIDES Triazoles and Diazoles flusilazoleFUNGICIDES & BACTERICIDES Triazoles and Diazoles imazalil
FUNGICIDES & BACTERICIDES Triazoles and Diazoles myclobutanilFUNGICIDES & BACTERICIDES Triazoles and Diazoles penconazole
FUNGICIDES & BACTERICIDES Triazoles and Diazoles prochloraz
FUNGICIDES & BACTERICIDES Triazoles and Diazoles propiconazoleFUNGICIDES & BACTERICIDES Triazoles and Diazoles tebuconazole
FUNGICIDES & BACTERICIDES Triazoles and Diazoles triadimefon
FUNGICIDES & BACTERICIDES Triazoles and Diazoles triadimenolFUNGICIDES & BACTERICIDES Triazoles and Diazoles flutriafol
APPENDIX 1. Continued

41
Group FAO group Active ingredient
INSECTICIDES Acaricides (I2) azocyclotinINSECTICIDES Acaricides (I2) clofentezineINSECTICIDES Acaricides (I2) dicofol
INSECTICIDES Acaricides (I2) fenbutatin oxideINSECTICIDES Acaricides (I2) fenpyroximateINSECTICIDES Acaricides (I2) milbemectinINSECTICIDES Acaricides (I2) propargiteINSECTICIDES Botanicals and Biologicals abamectin
INSECTICIDES Botanicals and Biologicals Bacillus thur/isra
INSECTICIDES Botanicals and Biologicals Bacillus thuringiensis
INSECTICIDES Botanicals and Biologicals Bacillus thuringiensis var aizawai/kurstakiINSECTICIDES Botanicals and Biologicals Bacillus thuringiensis var kurstaki (h-3a, 3b, sa-11)
INSECTICIDES Botanicals and Biologicals Bacillus thuringiensis var kurstaki (h-3a,3b hd1)INSECTICIDES Botanicals and Biologicals Cydia pomonella granulosis virus, mexican strainINSECTICIDES Botanicals and Biologicals pyrethrinsINSECTICIDES Botanicals and Biologicals Serratia entomophila
INSECTICIDES Botanicals and Biologicals spinosad
INSECTICIDES Carbamate insecticides carbarylINSECTICIDES Carbamate insecticides furathiocarbINSECTICIDES Carbamate insecticides methiocarbINSECTICIDES Carbamate insecticides methomyl
INSECTICIDES Carbamate insecticides oxamylINSECTICIDES Carbamate insecticides pirimicarbINSECTICIDES Carbamate insecticides primicarbINSECTICIDES Insect Growth Regulators (I1) buprofezin
INSECTICIDES Insect Growth Regulators (I1) diflubenzuronINSECTICIDES Insect Growth Regulators (I1) lufenuronINSECTICIDES Insect Growth Regulators (I1) s-methopreneINSECTICIDES Insect Growth Regulators (I1) tebufenozideINSECTICIDES Organophosphates acephate
INSECTICIDES Organophosphates azinphos-methylINSECTICIDES Organophosphates chlorpyrifosINSECTICIDES Organophosphates diazinonINSECTICIDES Organophosphates dichlorvos
INSECTICIDES Organophosphates dimethoateINSECTICIDES Organophosphates fenamiphosINSECTICIDES Organophosphates maldisonINSECTICIDES Organophosphates methamidophosINSECTICIDES Organophosphates parathion-methyl
INSECTICIDES Organophosphates phorateINSECTICIDES Organophosphates pirimiphos-methylINSECTICIDES Organophosphates prothiofosINSECTICIDES Organophosphates terbufos
INSECTICIDES Other insecticides (I3) clothianidinINSECTICIDES Other insecticides (I3) emamectin benzoateINSECTICIDES Other Insecticides (I3) endosulfanINSECTICIDES Other Insecticides (I3) fipronilINSECTICIDES Other Insecticides (I3) imidacloprid
INSECTICIDES Other Insecticides (I3) indoxacarbINSECTICIDES Other Insecticides (I3) indoxycarbINSECTICIDES Other Insecticides (I3) metaldehydeINSECTICIDES Other Insecticides (I3) pymetrozine
INSECTICIDES Other Insecticides (I3) thiaclopridINSECTICIDES Other Insecticides (I3) thiamethoxamINSECTICIDES Other Insecticides (I3) thioclopridINSECTICIDES Pyrethroids alpha-cypermethrinINSECTICIDES Pyrethroids bifenthrin
INSECTICIDES Pyrethroids cyfluthrinINSECTICIDES Pyrethroids cypermethrinINSECTICIDES Pyrethroids deltamethrinINSECTICIDES Pyrethroids esfenvalerate
INSECTICIDES Pyrethroids fluvalinateINSECTICIDES Pyrethroids lambda-cyhalothrinINSECTICIDES Pyrethroids permethrinINSECTICIDES Pyrethroids tau-fluvalinate
MINERAL OIL Various mineral oils mineral oilPLANT GROWTH REGULATORS Plant Growth Regulators 1-napthylacetic acidPLANT GROWTH REGULATORS Plant Growth Regulators 2-(1-napthyl)acetamidePLANT GROWTH REGULATORS Plant Growth Regulators aminoethoxyvinylglycinePLANT GROWTH REGULATORS Plant Growth Regulators ammonium thiosulphate
PLANT GROWTH REGULATORS Plant Growth Regulators benzyladeninePLANT GROWTH REGULATORS Plant Growth Regulators chlorethephonPLANT GROWTH REGULATORS Plant Growth Regulators chlormequat-chloridePLANT GROWTH REGULATORS Plant Growth Regulators ethephon
PLANT GROWTH REGULATORS Plant Growth Regulators ethoxylated propoxylated tallow alkyl aminesPLANT GROWTH REGULATORS Plant Growth Regulators gibberellic acidPLANT GROWTH REGULATORS Plant Growth Regulators gibberellin a4/a7PLANT GROWTH REGULATORS Plant Growth Regulators hydrogen cyanamidePLANT GROWTH REGULATORS Plant Growth Regulators mepiquat-chloride
PLANT GROWTH REGULATORS Plant Growth Regulators methyl canolatePLANT GROWTH REGULATORS Plant Growth Regulators trinexepac methyl
APPENDIX 1. Continued
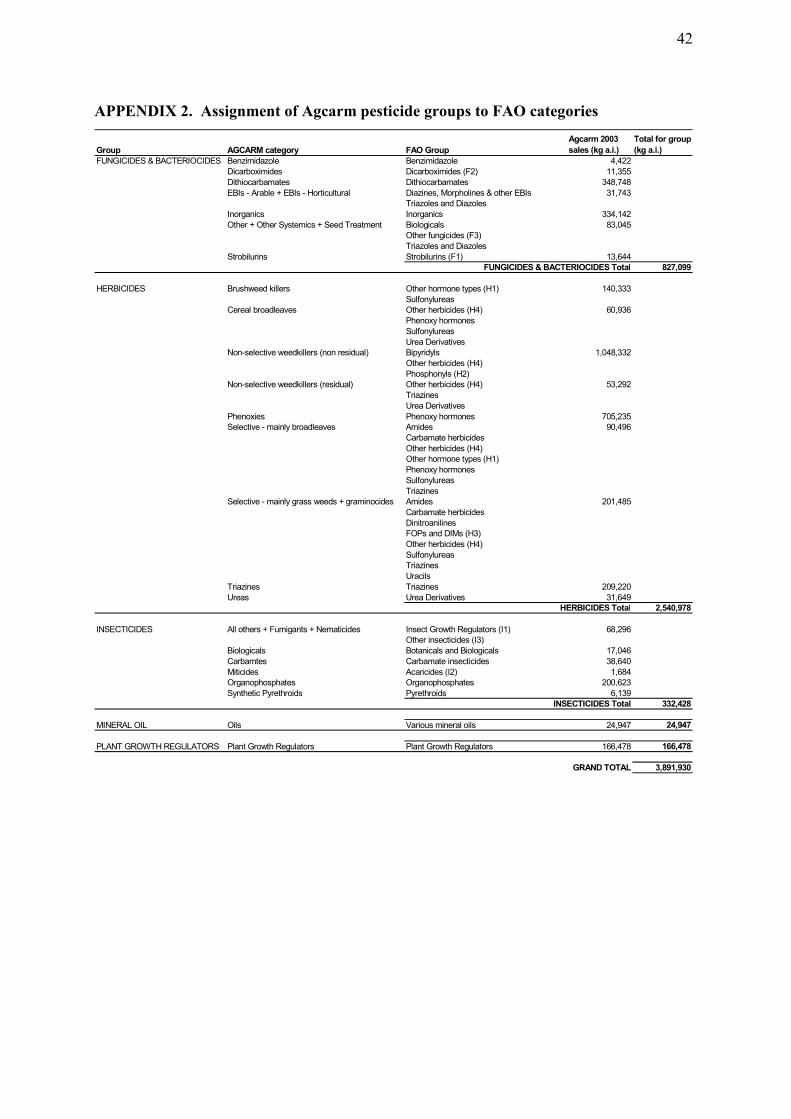
42
APPENDIX 2. Assignment of Agcarm pesticide groups to FAO categories
Group AGCARM category FAO Group
Agcarm 2003
sales (kg a.i.)
Total for group
(kg a.i.)
FUNGICIDES & BACTERIOCIDES Benzimidazole Benzimidazole 4,422
Dicarboximides Dicarboximides (F2) 11,355
Dithiocarbamates Dithiocarbamates 348,748
EBIs - Arable + EBIs - Horticultural Diazines, Morpholines & other EBIs 31,743Triazoles and Diazoles
Inorganics Inorganics 334,142
Other + Other Systemics + Seed Treatment Biologicals 83,045Other fungicides (F3)
Triazoles and Diazoles
Strobilurins Strobilurins (F1) 13,644FUNGICIDES & BACTERIOCIDES Total 827,099
HERBICIDES Brushweed killers Other hormone types (H1) 140,333
SulfonylureasCereal broadleaves Other herbicides (H4) 60,936
Phenoxy hormones
Sulfonylureas
Urea DerivativesNon-selective weedkillers (non residual) Bipyridyls 1,048,332
Other herbicides (H4)
Phosphonyls (H2)Non-selective weedkillers (residual) Other herbicides (H4) 53,292
Triazines
Urea Derivatives
Phenoxies Phenoxy hormones 705,235Selective - mainly broadleaves Amides 90,496
Carbamate herbicides
Other herbicides (H4)Other hormone types (H1)
Phenoxy hormones
Sulfonylureas
TriazinesSelective - mainly grass weeds + graminocides Amides 201,485
Carbamate herbicides
DinitroanilinesFOPs and DIMs (H3)
Other herbicides (H4)
SulfonylureasTriazines
Uracils
Triazines Triazines 209,220
Ureas Urea Derivatives 31,649HERBICIDES Total 2,540,978
INSECTICIDES All others + Fumigants + Nematicides Insect Growth Regulators (I1) 68,296Other insecticides (I3)
Biologicals Botanicals and Biologicals 17,046
Carbamtes Carbamate insecticides 38,640
Miticides Acaricides (I2) 1,684Organophosphates Organophosphates 200,623
Synthetic Pyrethroids Pyrethroids 6,139INSECTICIDES Total 332,428
MINERAL OIL Oils Various mineral oils 24,947 24,947
PLANT GROWTH REGULATORS Plant Growth Regulators Plant Growth Regulators 166,478 166,478
GRAND TOTAL 3,891,930

43
APPENDIX 3: Breakdown of specific sectors for which pesticide use was estimated
Note that areas in italics were crude estimates made in the absence of reliable area statistics
* Pesticide use estimates could not be made for this sector due to a lack of data
Sector
Groups Subgroup Sectors reported
Total New
Zealand
area (ha)
Percentage of
sector group
area
Percentage of
total land area
Arable Cereals Barley 78,097 53.9%Arable Cereals Maize - grain 14,166 9.8%Arable Cereals Oats 7,353 5.1%Arable Cereals Wheat 42,187 29.1% 1.5%Forestry Exotic forest Radiata pine and Douglas Fir 1,739,500 100% 18.0%
Horticulture Flowers Nerines/Paeonies/Sandersonia 237 0.2%Horticulture Tree fruit Apples 12,150 10.9%Horticulture Tree fruit Apricots 636 0.6%Horticulture Tree fruit Avocado 3,235 2.9%Horticulture Tree fruit Cherries 550 0.5%Horticulture Tree fruit Feijoas 198 0.2%Horticulture Tree fruit Olives 2,732 2.4%Horticulture Tree fruit Oranges/Mandarins/Tangelos/Lemons/Lime 2,031 1.8%Horticulture Tree fruit Peaches/Nectarines 1,288 1.2%Horticulture Tree fruit Pears/Nashi 1,029 0.9%Horticulture Tree fruit Persimmons 282 0.3%Horticulture Tree fruit Plums 394 0.4%Horticulture Tree fruit Tamarillos 270 0.2%Horticulture Tree fruit Walnuts/Macadamias/Chestnuts 1,334 1.2%Horticulture Vegetables Asparagus 2,015 1.8%Horticulture Vegetables Carrots 1,831 1.6%Horticulture Vegetables Cauliflower/Cabbage/B.sprouts/Broccoli 3,867 3.5%Horticulture Vegetables Cucumbers/Tomatoes/Capsicums 307 0.3%Horticulture Vegetables Kumara 985 0.9%Horticulture Vegetables Lettuce 1,287 1.2%Horticulture Vegetables Onions/Garlic 5,948 5.3%Horticulture Vegetables Peas/Beans (fresh/processed) 8,455 7.6%Horticulture Vegetables Potatoes 10,931 9.8%Horticulture Vegetables Pumpkins 1,033 0.9%Horticulture Vegetables Silverbeet/Spinach 396 0.4%Horticulture Vegetables Squash 6,804 6.1%Horticulture Vegetables Sweetcorn 5,790 5.2%Horticulture Vegetables Tomatoes - outdoor 630 0.6%Horticulture Vine and bush fruit Blackcurrants 1,308 1.2%Horticulture Vine and bush fruit Blueberries 430 0.4%Horticulture Vine and bush fruit Boysenberries/Blackberries/Raspberries 655 0.6%Horticulture Vine and bush fruit Grapes (Wine) 19,646 17.6%Horticulture Vine and bush fruit Hops 426 0.4%Horticulture Vine and bush fruit Kiwifruit 12,357 11.0%Horticulture Vine and bush fruit Passionfruit 70 0.1%Horticulture Vine and bush fruit Strawberries 311 0.3% 1.2%Pastoral farming Forage crops Cereal silage or balage 41,066 0.5%Pastoral farming Forage crops Forage brassicas 10,000 0.1%Pastoral farming Forage crops Maize - silage or balage 16,917 0.2%Pastoral farming Forage crops Other arable crops for silage or balage* 108,470 1.4%Pastoral farming Grazing land Dairy 1,463,281 19.1%Pastoral farming Grazing land Deer 215,000 2.8%Pastoral farming Grazing land Sheep and beef 5,800,000 75.8% 79.3%
TOTAL AREA 9,647,884

44
APPENDIX 4. AC Nielsen pesticide sales values for 2002
1Percentages relate only to total identified fungicide, herbicide and insecticide sales figures.
FAO Group
2002 Sales value
($ million) % of total1
FUNGICIDES & BACTERIOCIDES Benzimidazoles $1.7 1.1%Diazines, Morpholines & other EBIs $1.4 0.9%
Dicarboximides (F2) $2.2 1.4%
Dithiocarbamates $4.7 2.9%
Inorganics $2.8 1.7%Other fungicides (F3) $12.4 7.6%
Strobilurins (F1) $6.2 3.8%
Triazoles and Diazoles $12.3 7.6%
TOTAL $43.7 26.9%
HERBICIDES Amides $3.5 2.2%Bipyridyls $3.1 1.9%
Carbamate herbicides $0.3 0.2%
Dinitroanilines $1.2 0.8%
FOPs and DIMs (H3) $2.4 1.5%Other herbicides (H4) $5.3 3.3%
Other hormone types (H1) $17.6 10.9%
Phenoxy hormones $17.0 10.5%
Phosphonyls (H2) $27.6 17.0%
Sulfonylureas $13.9 8.5%Triazines $2.3 1.4%
Uracils $0.0 0.0%
Urea Derivatives $1.1 0.7%
TOTAL $95.3 58.7%
INSECTICIDES Acaricides (I2) $0.4 0.2%
Botanicals and Biologicals $1.2 0.8%
Carbamate insecticides $2.5 1.6%
Insect Growth Regulators (I1) $5.5 3.4%
Organophosphates $9.0 5.5%Other insecticides (I3) $2.2 1.4%
Pyrethroids $2.4 1.5%
TOTAL $23.3 14.3%
MINERAL OIL Various mineral oils $1.4
PLANT GROWTH REGULATORS Plant Growth Regulators $4.8
Not identified Not identified $41.1
GRAND TOTAL $209.7

45
APPENDIX 5. Quantities of insecticide sold in New Zealand between 1994 and 2003.
a.
b.
Biologicals
0
5,000
10,000
15,000
20,000
1994 1995 1996 1997 1998 1999 2000 2001 2002 2003
kg a
.i. per
annum
c.
Miticides
0
5,000
10,000
15,000
20,000
1994 1995 1996 1997 1998 1999 2000 2001 2002 2003
kg a
.i. per
annum
d.
Carbamates
0
20,000
40,000
60,000
80,000
100,000
1994 1995 1996 1997 1998 1999 2000 2001 2002 2003
kg a
.i. per annum
e.
All others
0
20,000
40,000
60,000
80,000
100,000
1994 1995 1996 1997 1998 1999 2000 2001 2002 2003
kg a
.i. per annum
f.
Organophosphates
0
50,000
100,000
150,000
200,000
250,000
300,000
1994 1995 1996 1997 1998 1999 2000 2001 2002 2003
kg a
.i. per annum
g.
Oils
0
50,000
100,000
150,000
200,000
250,000
300,000
1994 1995 1996 1997 1998 1999 2000 2001 2002 2003
kg a
.i. per annum
Synthethic Pyrethroids
0
5,000
10,000
15,000
20,000
1994 1995 1996 1997 1998 1999 2000 2001 2002 2003
kg a
.i. per
annum

46
APPENDIX 6. Quantities of fungicide sold in New Zealand between 1994 and 2003.
a.
Seed treatments
0
10,000
20,000
30,000
40,000
50,000
1994 1995 1996 1997 1998 1999 2000 2001 2002 2003
kg a
.i. per
annum
b.
Benzimidazole
0
10,000
20,000
30,000
40,000
50,000
1994 1995 1996 1997 1998 1999 2000 2001 2002 2003
kg a
.i. per annum
c.
Dicarboximides
0
10,000
20,000
30,000
40,000
50,000
1994 1995 1996 1997 1998 1999 2000 2001 2002 2003
kg a
.i. per annum
d.
Other Systemics
0
10,000
20,000
30,000
40,000
50,000
1994 1995 1996 1997 1998 1999 2000 2001 2002 2003
kg a
.i. per annum
e.
EBI's
0
50,000
100,000
150,000
200,000
1994 1995 1996 1997 1998 1999 2000 2001 2002 2003
kg a
.i. per annum
f.
Other
0
50,000
100,000
150,000
200,000
1994 1995 1996 1997 1998 1999 2000 2001 2002 2003
kg a
.i. per annum
g.
Inorganics
0
100,000
200,000
300,000
400,000
500,000
600,000
1994 1995 1996 1997 1998 1999 2000 2001 2002 2003
kg a
.i. per annum
h.
Dithiocarbamates
0
100,000
200,000
300,000
400,000
500,000
600,000
1994 1995 1996 1997 1998 1999 2000 2001 2002 2003
kg a
.i. per
annum

47
APPENDIX 7. Quantities of herbicide sold in New Zealand between 1994 and 2003.
a.
Graminocides
0
10,000
20,000
30,000
40,000
50,000
1994 1995 1996 1997 1998 1999 2000 2001 2002 2003
kg a
.i. per annum
b.
Ureas
0
10,000
20,000
30,000
40,000
50,000
1994 1995 1996 1997 1998 1999 2000 2001 2002 2003
kg a
.i. per annum
c.
Non-selective weedkillers (residual)
0
25,000
50,000
75,000
100,000
125,000
150,000
1994 1995 1996 1997 1998 1999 2000 2001 2002 2003
kg a
.i. per annum
d.
Selective - mainly broadleaves
0
25,000
50,000
75,000
100,000
125,000
150,000
1994 1995 1996 1997 1998 1999 2000 2001 2002 2003
kg a
.i. per annum
e.
Cereal Broadleaves
0
25,000
50,000
75,000
100,000
125,000
150,000
1994 1995 1996 1997 1998 1999 2000 2001 2002 2003
kg a
.i. per annum
f.
Triazines
0
50,000
100,000
150,000
200,000
250,000
300,000
1994 1995 1996 1997 1998 1999 2000 2001 2002 2003
kg a
.i. per annum
g.
Selective - mainly grass weeds
0
50,000
100,000
150,000
200,000
250,000
300,000
1994 1995 1996 1997 1998 1999 2000 2001 2002 2003
kg a
.i. per annum
h.
Brushweed Killers
0
50,000
100,000
150,000
200,000
250,000
300,000
1994 1995 1996 1997 1998 1999 2000 2001 2002 2003
kg a
.i. per annum
i.
Phenoxies
0
200,000
400,000
600,000
800,000
1,000,000
1,200,000
1994 1995 1996 1997 1998 1999 2000 2001 2002 2003
kg a
.i. per annum
j.
Non-selective weedkillers (non residual)
0
200,000
400,000
600,000
800,000
1,000,000
1,200,000
1994 1995 1996 1997 1998 1999 2000 2001 2002 2003
kg a
.i. per annum

48
APPENDIX 8. Breakdown of sector-based active ingredient use by FAO category1
1Data excludes mineral oils. See notes in text regarding the probable under estimate of phosphonyl use
Agrichemcial groups FAO Category
Total Tonnes
a.i./yr
FUNGICIDES & BACTERIOCIDES
Benzimidazoles 7.56
Botanicals and Biologicals 0.45
Diazines, Morpholines & other EBIs 1.56
Dicarboximides (F2) 9.53
Dithiocarbamates 430.37
Inorganics 264.86
Other fungicides (F3) 130.27
Strobilurins (F1) 21.46
Triazoles and Diazoles 27.86
TOTAL 893.92
HERBICIDES
Amides 131.91
Bipyridyls 8.92
Carbamate herbicides 2.11
Dinitroanilines 24.74
FOPs and DIMs (H3) 4.53
Other herbicides (H4) 45.87
Other hormone types (H1) 68.04
Phenoxy hormones 1051.38
Phosphonyls (H2) 353.29
Sulfonylureas 6.50
Triazines 336.82
Urea Derivatives 97.47
TOTAL 2131.57
INSECTICIDES
Acaricides (I2) 0.97
Botanicals and Biologicals 6.06
Carbamate insecticides 27.65
Insect Growth Regulators (I1) 15.88
Organophosphates 159.13
Other Insecticides (I3) 16.83
Pyrethroids 3.08
TOTAL 229.60
PLANT GROWTH REGULATORS
Plant Growth Regulators 305.28
TOTAL 305.28
GRAND TOTAL 3,560.38

49
APPENDIX 9. Active ingredient use by FAO category estimated across the four major
sector groups1
1Data excludes mineral oils
Continued on next page
Sector main group Agrichemcial groups FAO Category
Total tonnes
a.i./yr
Percentage of
total
ARABLE FUNGICIDES & BACTERIOCIDES
Benzimidazoles 1.47 0.04%
Dithiocarbamates 0.73 0.02%
Other fungicides (F3) 0.73 0.02%
Strobilurins (F1) 14.47 0.41%
Triazoles and Diazoles 14.08 0.40%
HERBICIDES
Amides 32.64 0.92%
Dinitroanilines 1.40 0.08%
FOPs and DIMs (H3) 1.63 0.05%
Other herbicides (H4) 10.47 0.29%
Other hormone types (H1) 4.70 0.13%
Phenoxy hormones 137.37 3.86%
Sulfonylureas 2.12 0.06%
Triazines 19.12 0.54%
Urea Derivatives 52.33 1.47%
INSECTICIDES
Carbamate insecticides 0.09 0.00%
Organophosphates 2.72 0.08%
Other Insecticides (I3) 4.70 0.13%
Pyrethroids 1.01 0.03%
PLANT GROWTH REGULATORS
Plant Growth Regulators 42.19 1.18%
ARABLE TOTAL 343.98 9.70%
FORESTRY FUNGICIDES & BACTERIOCIDES
Inorganics 56.49 1.59%
HERBICIDES
FOPs and DIMs (H3) 0.50 0.01%
Other hormone types (H1) 5.47 0.15%
Phosphonyls (H2) 144.17 4.05%
Sulfonylureas 1.36 0.04%
Triazines 254.49 7.14%
FORESTRY TOTAL 462.48 12.98%

50
APPENDIX 9. Continued
Sector main group Agrichemcial groups FAO Category
Total tonnes
a.i./yr
Percentage of
total
HORTICULTURE FUNGICIDES & BACTERIOCIDES
Benzimidazoles 5.00 0.14%
Botanicals and Biologicals 0.45 0.01%
Diazines, Morpholines & other EBIs 1.56 0.04%
Dicarboximides (F2) 9.53 0.27%
Dithiocarbamates 425.63 11.95%
Inorganics 208.37 5.85%
Other fungicides (F3) 129.14 3.63%
Strobilurins (F1) 2.79 0.08%
Triazoles and Diazoles 7.02 0.20%
HERBICIDES
Amides 60.30 1.69%
Bipyridyls 8.92 0.25%
Carbamate herbicides 2.11 0.06%
Dinitroanilines 7.26 0.20%
FOPs and DIMs (H3) 2.17 0.06%
Other herbicides (H4) 31.30 0.88%
Other hormone types (H1) 0.03 0.00%
Phenoxy hormones 0.00 0.00%
Phosphonyls (H2) 103.76 2.91%
Sulfonylureas 0.01 0.00%
Triazines 40.37 1.13%
Urea Derivatives 24.60 0.69%
INSECTICIDES
Acaricides (I2) 0.97 0.03%
Botanicals and Biologicals 6.06 0.17%
Carbamate insecticides 24.05 0.68%
Insect Growth Regulators (I1) 15.13 0.42%
Organophosphates 85.83 2.41%
Other Insecticides (I3) 8.37 0.24%
Pyrethroids 1.68 0.05%
PLANT GROWTH REGULATORS
Plant Growth Regulators 263.09 7.39%
HORTICULTURE TOTAL 1,475.50 41.42%
PASTORAL FARMING FUNGICIDES & BACTERIOCIDES
Benzimidazoles 1.09 0.03%
Dithiocarbamates 4.01 0.11%
Other fungicides (F3) 0.41 0.01%
Strobilurins (F1) 4.20 0.12%
Triazoles and Diazoles 6.76 0.19%
HERBICIDES
Amides 38.98 1.09%
Dinitroanilines 16.07 0.45%
FOPs and DIMs (H3) 0.22 0.01%
Other herbicides (H4) 4.11 0.12%
Other hormone types (H1) 57.83 1.62%
Phenoxy hormones 914.01 25.66%
Phosphonyls (H2) 105.36 2.96%
Sulfonylureas 3.02 0.08%
Triazines 22.84 0.64%
Urea Derivatives 20.53 0.58%
INSECTICIDES
Carbamate insecticides 3.51 0.10%
Insect Growth Regulators (I1) 0.75 0.02%
Organophosphates 70.58 1.98%
Other Insecticides (I3) 3.75 0.11%
Pyrethroids 0.39 0.01%
PASTORAL FARMING TOTAL 1,278.42 35.89%
GRAND TOTAL 3,560.38 100.00%

51
APPENDIX 10. Total national use estimates for the most commonly used pesticide
active ingredients (each representing approximately 1% or more of total a.i. use) plus
other high use active ingredients from the same FAO grouping1
1Data excludes mineral oils.
FAO Category
FAO Category
as a % of use Active ingredient
Total Tonnes
a.i./yr
Percentage of
total a.i.use
Phenoxy hormones 25.37% MCPA 446.7 10.48%
2,4-D 282.2 6.62%
mecoprop 178.4 4.19%
MCPB 173.7 4.08%
Dithiocarbamates 11.11% mancozeb 441.9 10.37%
metiram 15.0 0.35%
thiram 10.6 0.25%
ziram 5.7 0.13%
Phosphonyls (H2) 8.35% glyphosate 344.3 8.08%
glufosinate-ammonium 11.6 0.27%
Triazines 7.65% terbuthylazine 223.8 5.25%
hexazinone 53.4 1.25%
atrazine 48.8 1.15%
Plant Growth Regulators 6.91% hydrogen cyanamide 216.1 5.07%
ammonium thiosulphate 44.9 1.05%
chlomequat-chloride 18.5 0.43%
mepiquat-chloride 14.9 0.35%
Inorganics 6.94% copper compounds 190.0 4.46%
sulphur compounds 99.0 2.32%
phosphorous acid 6.8 0.16%
Organophosphates 3.60% diazinon 92.7 2.18%
methamidophos 18.7 0.44%
chlorpyrifos 17.4 0.41%
fenamiphos 10.8 0.25%
pirimiphos-methyl 7.5 0.18%
phorate 6.3 0.15%
Amides 3.04% acetochlor 62.9 1.48%
alachlor 39.8 0.93%
propachlor 26.7 0.63%
Other fungicides (F3) 2.38% captan 46.6 1.09%
chlorothalonil 25.2 0.59%
metalaxyl-m 15.3 0.36%
tolyfluanid 14.1 0.33%
Urea Derivatives 2.03% isoproturon 72.9 1.71%
linuron 13.7 0.32%
Other hormone types (H1) 1.29% triclopyr 44.0 1.03%
pichloram 11.1 0.26%
Dinitroanilines 0.44% trifluralin 19.0 0.44%
Carbamate insecticides 0.38% carbaryl 16.4 0.38%

52
APPENDIX 11. Arable sector-based pesticide use estimates
BARLEY Total area (ha) 78,097
Agrichemical groups FAO Category Tonnes a.i./yr
Agchem class
as % of total
Mean loading
(kg a.i./ha)
FUNGICIDES & BACTERIOCIDES 18.32 10.65% 0.23
Benzimidazoles 0.35 0.20% 0.00
Dithiocarbamates 0.59 0.34% 0.01
Other fungicides (F3) 0.59 0.34% 0.01
Strobilurins (F1) 10.25 5.96% 0.13
Triazoles and Diazoles 6.54 3.80% 0.08
HERBICIDES 124.17 72.18% 1.59
FOPs and DIMs (H3) 1.41 0.82% 0.02
Other herbicides (H4) 6.25 3.63% 0.08
Other hormone types (H1) 2.04 1.19% 0.03
Phenoxy hormones 82.00 47.67% 1.05Sulfonylureas 1.23 0.72% 0.02
Urea Derivatives 31.24 18.16% 0.40
INSECTICIDES 6.31 3.67% 0.08
Organophosphates 2.44 1.42% 0.03Other Insecticides (I3) 3.16 1.84% 0.04
Pyrethroids 0.70 0.41% 0.01
PLANT GROWTH REGULATORS 23.23 13.51% 0.30
Plant Growth Regulators 23.23 13.51% 0.30
Grand Total 172.02 100.00% 2.20
MAIZE - GRAIN Total area (ha) 14,166
Agrichemical groups FAO Category Tonnes a.i./yr
Agchem class
as % of total
Mean loading
(kg a.i./ha)
FUNGICIDES & BACTERIOCIDES 0.28 0.51% 0.02
Dithiocarbamates 0.14 0.26% 0.01
Other fungicides (F3) 0.14 0.26% 0.01
HERBICIDES 54.44 98.77% 3.84
Amides 32.64 59.22% 2.30
Dinitroanilines 1.40 2.54% 0.10
Other hormone types (H1) 1.27 2.31% 0.09
Triazines 19.12 34.70% 1.35
INSECTICIDES 0.39 0.72% 0.03
Organophosphates 0.28 0.51% 0.02
Other Insecticides (I3) 0.11 0.20% 0.01
Grand Total 55.12 100.00% 3.89

53
APPENDIX 11. Continued
WHEAT Total area (ha) 42,187
Agrichemical groups FAO Category Tonnes a.i./yr
Agchem class
as % of total
Mean loading
(kg a.i./ha)
FUNGICIDES & BACTERIOCIDES 12.19 10.82% 0.29
Benzimidazoles 1.12 0.99% 0.03
Strobilurins (F1) 4.22 3.75% 0.10
Triazoles and Diazoles 6.85 6.08% 0.16
HERBICIDES 83.18 73.85% 1.97
FOPs and DIMs (H3) 0.23 0.20% 0.01
Other herbicides (H4) 4.22 3.75% 0.10
Other hormone types (H1) 1.38 1.23% 0.03
Phenoxy hormones 55.37 49.16% 1.31
Sulfonylureas 0.89 0.79% 0.02
Urea Derivatives 21.09 18.73% 0.50
INSECTICIDES 1.66 1.48% 0.04
Other Insecticides (I3) 1.37 1.21% 0.03
Pyrethroids 0.30 0.26% 0.01
PLANT GROWTH REGULATORS 15.61 13.86% 0.37
Plant Growth Regulators 15.61 13.86% 0.37
Grand Total 112.64 100.00% 2.67
OATS Total area (ha) 7,353
Agrichemical groups FAO Category Tonnes a.i./yr
Agchem class
as % of total
Mean loading
(kg a.i./ha)
FUNGICIDES & BACTERIOCIDES 0.69 16.41% 0.09
Triazoles and Diazoles 0.69 16.41% 0.09
INSECTICIDES 0.17 3.96% 0.02
Carbamate insecticides 0.09 2.19% 0.01Other Insecticides (I3) 0.06 1.42% 0.01
Pyrethroids 0.01 0.35% 0.00
PLANT GROWTH REGULATORS 3.35 79.64% 0.46
Plant Growth Regulators 3.35 79.64% 0.46
Grand Total 4.20 100.00% 0.57

54
APPENDIX 12. Pastoral sector-based pesticide use estimates
DAIRY Total area (ha) 1,463,281
Agrichemical groups FAO Category Tonnes a.i./yr
Agchem class
as % of total
Mean loading
(kg a.i./ha)
HERBICIDES 316.27 80.62% 0.22
Other hormone types (H1) 18.88 4.81% 0.01
Phenoxy hormones 191.69 48.86% 0.13
Phosphonyls (H2) 105.36 26.86% 0.07
Sulfonylureas 0.35 0.09% 0.00
INSECTICIDES 76.04 19.38% 0.05
Carbamate insecticides 3.51 0.90% 0.00
Organophosphates 70.24 17.90% 0.05
Other Insecticides (I3) 2.29 0.58% 0.00
Grand Total 392.31 100.00% 0.27
SHEEP AND BEEF Total area (ha) 5,800,000
Agrichemical groups FAO Category Tonnes a.i./yr
Agchem class
as % of total
Mean loading
(kg a.i./ha)
HERBICIDES 681.07 99.89% 0.12
Other hormone types (H1) 34.80 5.10% 0.01Phenoxy hormones 644.53 94.53% 0.11
Sulfonylureas 1.74 0.26% 0.00
INSECTICIDES 0.73 0.11% 0.00
Insect Growth Regulators (I1) 0.73 0.11% 0.00
Grand Total 681.79 100.00% 0.12
DEER Total area (ha) 215,000
Agrichemical groups FAO Category Tonnes a.i./yr
Agchem class
as % of total
Mean loading
(kg a.i./ha)
HERBICIDES 25.25 99.89% 0.12
Other hormone types (H1) 1.29 5.10% 0.01
Phenoxy hormones 23.89 94.53% 0.11
Sulfonylureas 0.06 0.26% 0.00
INSECTICIDES 0.03 0.11% 0.00
Insect Growth Regulators (I1) 0.03 0.11% 0.00
Grand Total 25.27 100.00% 0.12

55
APPENDIX 12. Continued
CEREAL SILAGE OR
BALAGE Total area (ha) 41,066
Agrichemical groups FAO Category Tonnes a.i./yr
Agchem class
as % of total
Mean loading
(kg a.i./ha)
FUNGICIDES & BACTERIOCIDES 11.86 12.56% 0.29
Benzimidazoles 1.09 1.15% 0.03
Strobilurins (F1) 4.11 4.35% 0.10
Triazoles and Diazoles 6.67 7.06% 0.16
HERBICIDES 80.97 85.73% 1.97
FOPs and DIMs (H3) 0.22 0.24% 0.01Other herbicides (H4) 4.11 4.35% 0.10
Other hormone types (H1) 1.34 1.42% 0.03
Phenoxy hormones 53.90 57.07% 1.31
Sulfonylureas 0.86 0.91% 0.02Urea Derivatives 20.53 21.74% 0.50
INSECTICIDES 1.62 1.71% 0.04
Other Insecticides (I3) 1.33 1.41% 0.03
Pyrethroids 0.29 0.30% 0.01
Grand Total 94.45 100.00% 2.30 FORAGE BRASSICAS Total area (ha) 10,000
Agrichemical groups FAO Category Tonnes a.i./yr
Agchem class
as % of total
Mean loading
(kg a.i./ha)
FUNGICIDES & BACTERIOCIDES 4.27 22.74% 0.43
Dithiocarbamates 3.84 20.46% 0.38
Other fungicides (F3) 0.24 1.28% 0.02
Strobilurins (F1) 0.09 0.50% 0.01
Triazoles and Diazoles 0.09 0.50% 0.01
HERBICIDES 14.40 76.72% 1.44
Dinitroanilines 14.40 76.72% 1.44
INSECTICIDES 0.10 0.53% 0.01
Pyrethroids 0.10 0.53% 0.01
Grand Total 18.77 100.00% 1.88 MAIZE - SILAGE OR
BALAGE Total area (ha) 16,917
Agrichemical groups FAO Category Tonnes a.i./yr
Agchem class
as % of total
Mean loading
(kg a.i./ha)
FUNGICIDES & BACTERIOCIDES 0.34 0.51% 0.02
Dithiocarbamates 0.17 0.26% 0.01
Other fungicides (F3) 0.17 0.26% 0.01
HERBICIDES 65.01 98.77% 3.84
Amides 38.98 59.22% 2.30Dinitroanilines 1.67 2.54% 0.10
Other hormone types (H1) 1.52 2.31% 0.09
Triazines 22.84 34.70% 1.35
INSECTICIDES 0.47 0.72% 0.03
Organophosphates 0.34 0.51% 0.02
Other Insecticides (I3) 0.13 0.20% 0.01
Grand Total 65.82 100.00% 3.89
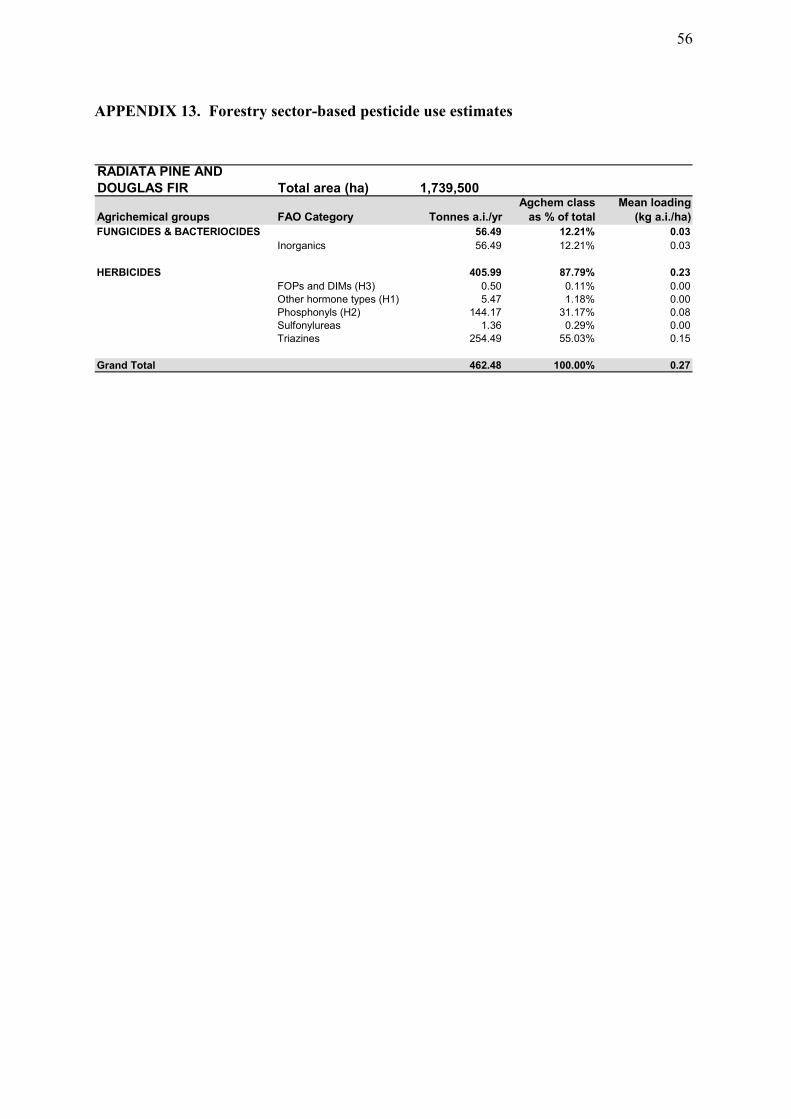
56
APPENDIX 13. Forestry sector-based pesticide use estimates
RADIATA PINE AND
DOUGLAS FIR Total area (ha) 1,739,500
Agrichemical groups FAO Category Tonnes a.i./yr
Agchem class
as % of total
Mean loading
(kg a.i./ha)
FUNGICIDES & BACTERIOCIDES 56.49 12.21% 0.03
Inorganics 56.49 12.21% 0.03
HERBICIDES 405.99 87.79% 0.23
FOPs and DIMs (H3) 0.50 0.11% 0.00
Other hormone types (H1) 5.47 1.18% 0.00
Phosphonyls (H2) 144.17 31.17% 0.08
Sulfonylureas 1.36 0.29% 0.00
Triazines 254.49 55.03% 0.15
Grand Total 462.48 100.00% 0.27

57
APPENDIX 14. Vegetable sector-based pesticide use estimates
CARROTS Total area (ha) 1,831
Agrichemical groups FAO Category Tonnes a.i./yr
Agchem class
as % of total
Mean loading
(kg a.i./ha)
FUNGICIDES & BACTERIOCIDES 11.97 43.09% 6.54
Dithiocarbamates 8.65 31.14% 4.73
Inorganics 0.07 0.26% 0.04
Other fungicides (F3) 3.20 11.53% 1.75
Triazoles and Diazoles 0.05 0.16% 0.03
HERBICIDES 5.23 18.82% 2.86
Dinitroanilines 0.60 2.17% 0.33
FOPs and DIMs (H3) 0.07 0.25% 0.04
Phosphonyls (H2) 0.53 1.90% 0.29
Triazines 1.05 3.79% 0.58
Urea Derivatives 2.98 10.71% 1.63
INSECTICIDES 10.58 38.09% 5.78
Carbamate insecticides 0.00 0.00% 0.00
Organophosphates 10.57 38.06% 5.78
Pyrethroids 0.01 0.03% 0.00
Grand Total 27.79 100.00% 15.17
ASPARAGUS Total area (ha) 2,015
Agrichemical groups FAO Category Tonnes a.i./yr
Agchem class
as % of total
Mean loading
(kg a.i./ha)
FUNGICIDES & BACTERIOCIDES 4.41 31.42% 2.19
Dithiocarbamates 3.87 27.55% 1.92
Other fungicides (F3) 0.47 3.34% 0.23
Triazoles and Diazoles 0.08 0.54% 0.04
HERBICIDES 9.61 68.47% 4.77
Other herbicides (H4) 2.62 18.65% 1.30
Other hormone types (H1) 0.03 0.22% 0.02
Phosphonyls (H2) 2.07 14.72% 1.03
Triazines 1.88 13.35% 0.93
Urea Derivatives 3.02 21.52% 1.50
INSECTICIDES 0.02 0.11% 0.01
Organophosphates 0.02 0.11% 0.01
Pyrethroids 0.00 0.00% 0.00
Grand Total 14.04 100.00% 6.97

58
APPENDIX 14. Continued
CAULIFLOWER/CABBAGE/
B.SPROUTS/BROCCOLI Total area (ha) 3,867
Agrichemical groups FAO Category Tonnes a.i./yr
Agchem class
as % of total
Mean loading
(kg a.i./ha)
FUNGICIDES & BACTERIOCIDES 26.41 56.29% 6.83
Dithiocarbamates 13.59 28.96% 3.51Inorganics 6.75 14.38% 1.74
Other fungicides (F3) 5.81 12.39% 1.50
Triazoles and Diazoles 0.27 0.57% 0.07
HERBICIDES 9.65 20.56% 2.49
Amides 6.17 13.15% 1.60
Dinitroanilines 2.17 4.63% 0.56
FOPs and DIMs (H3) 0.89 1.89% 0.23
Other herbicides (H4) 0.42 0.89% 0.11
INSECTICIDES 10.86 23.15% 2.81
Botanicals and Biologicals 0.35 0.75% 0.09
Carbamate insecticides 0.23 0.49% 0.06
Organophosphates 7.56 16.11% 1.96
Other Insecticides (I3) 2.65 5.65% 0.69
Pyrethroids 0.07 0.15% 0.02
Grand Total 46.92 100.00% 12.13
CUCUMBERS/TOMATOES/
CAPSICUMS Total area (ha) 307
Agrichemical groups FAO Category Tonnes a.i./yr
Agchem class
as % of total
Mean loading
(kg a.i./ha)
FUNGICIDES & BACTERIOCIDES 3.53 56.60% 11.51
Benzimidazoles 0.04 0.62% 0.13
Dicarboximides (F2) 0.09 1.40% 0.29
Dithiocarbamates 0.38 6.12% 1.24
Inorganics 0.66 10.66% 2.17
Other fungicides (F3) 1.55 24.92% 5.07
Strobilurins (F1) 0.01 0.10% 0.02
Triazoles and Diazoles 0.80 12.78% 2.60
INSECTICIDES 2.70 43.40% 8.82
Acaricides (I2) 0.01 0.10% 0.02
Botanicals and Biologicals 0.05 0.81% 0.16
Carbamate insecticides 2.39 38.30% 7.79
Insect Growth Regulators (I1) 0.01 0.11% 0.02
Organophosphates 0.05 0.72% 0.15
Other Insecticides (I3) 0.21 3.37% 0.69
Grand Total 6.23 100.00% 20.33

59
APPENDIX 14. Continued
KUMARA Total area (ha) 985
Agrichemical groups FAO Category Tonnes a.i./yr
Agchem class
as % of total
Mean loading
(kg a.i./ha)
FUNGICIDES & BACTERIOCIDES 1.00 14.58% 1.01
Other fungicides (F3) 1.00 14.58% 1.01
HERBICIDES 2.58 37.72% 2.62
Bipyridyls 0.66 9.72% 0.68
Phosphonyls (H2) 1.91 28.00% 1.94
INSECTICIDES 3.26 47.70% 3.31
Organophosphates 2.88 42.05% 2.92
Other Insecticides (I3) 0.39 5.65% 0.39
Grand Total 6.84 100.00% 6.94
LETTUCE Total area (ha) 1,287
Agrichemical groups FAO Category Tonnes a.i./yr
Agchem class
as % of total
Mean loading
(kg a.i./ha)
FUNGICIDES & BACTERIOCIDES 12.17 54.45% 9.46
Benzimidazoles 0.31 1.37% 0.24
Diazines, Morpholines & other EBIs 0.06 0.25% 0.04
Dicarboximides (F2) 1.08 4.83% 0.84
Dithiocarbamates 10.12 45.27% 7.86
Inorganics 0.61 2.74% 0.48
HERBICIDES 9.46 42.33% 7.35
Amides 8.09 36.18% 6.28
Dinitroanilines 1.38 6.15% 1.07
INSECTICIDES 0.72 3.22% 0.56
Carbamate insecticides 0.14 0.63% 0.11
Organophosphates 0.30 1.36% 0.24
Other Insecticides (I3) 0.27 1.21% 0.21
Pyrethroids 0.00 0.02% 0.00
Grand Total 22.35 100.00% 17.37

60
APPENDIX 14. Continued
ONIONS/GARLIC Total area (ha) 5,948
Agrichemical groups FAO Category Tonnes a.i./yr
Agchem class
as % of total
Mean loading
(kg a.i./ha)
FUNGICIDES & BACTERIOCIDES 115.61 70.20% 19.44
Benzimidazoles 1.61 0.98% 0.27
Diazines, Morpholines & other EBIs 0.92 0.56% 0.15
Dicarboximides (F2) 0.48 0.29% 0.08
Dithiocarbamates 103.29 62.71% 17.37Inorganics 5.75 3.49% 0.97
Other fungicides (F3) 0.54 0.33% 0.09
Triazoles and Diazoles 3.03 1.84% 0.51
HERBICIDES 38.08 23.12% 6.40
Amides 19.08 11.58% 3.21
Carbamate herbicides 1.99 1.21% 0.33
Dinitroanilines 1.69 1.03% 0.28
FOPs and DIMs (H3) 0.14 0.09% 0.02
Other herbicides (H4) 8.36 5.08% 1.41
Phosphonyls (H2) 3.86 2.34% 0.65
Urea Derivatives 2.96 1.80% 0.50
INSECTICIDES 11.01 6.68% 1.85
Organophosphates 9.24 5.61% 1.55
Other Insecticides (I3) 1.62 0.98% 0.27
Pyrethroids 0.15 0.09% 0.02
Grand Total 164.70 100.00% 27.69
PEAS/BEANS
(FRESH/PROCESSED) Total area (ha) 8,455
Agrichemical groups FAO Category Tonnes a.i./yr
Agchem class
as % of total
Mean loading
(kg a.i./ha)
FUNGICIDES & BACTERIOCIDES 21.79 77.80% 2.58
Benzimidazoles 0.69 2.45% 0.08
Dicarboximides (F2) 0.21 0.76% 0.03
Dithiocarbamates 0.44 1.57% 0.05
Inorganics 3.07 10.95% 0.36
Other fungicides (F3) 17.27 61.67% 2.04Triazoles and Diazoles 0.11 0.39% 0.01
HERBICIDES 6.15 21.95% 0.73
Dinitroanilines 1.21 4.34% 0.14
FOPs and DIMs (H3) 0.99 3.52% 0.12
Other herbicides (H4) 0.87 3.12% 0.10Sulfonylureas 0.00 0.01% 0.00
Triazines 3.07 10.97% 0.36
INSECTICIDES 0.07 0.25% 0.01
Organophosphates 0.07 0.25% 0.01
Grand Total 28.00 100.00% 3.31

61
APPENDIX 14. Continued
PUMPKINS Total area (ha) 1,033
Agrichemical groups FAO Category Tonnes a.i./yr
Agchem class
as % of total
Mean loading
(kg a.i./ha)
FUNGICIDES & BACTERIOCIDES 8.18 77.42% 7.92
Dithiocarbamates 5.28 50.00% 5.11
Inorganics 2.65 25.10% 2.57
Other fungicides (F3) 0.21 1.96% 0.20
Triazoles and Diazoles 0.04 0.37% 0.04
HERBICIDES 2.31 21.86% 2.24
Amides 0.99 9.39% 0.96
Other herbicides (H4) 0.95 8.95% 0.92
Phosphonyls (H2) 0.37 3.52% 0.36
INSECTICIDES 0.08 0.73% 0.07
Organophosphates 0.06 0.61% 0.06
Other Insecticides (I3) 0.01 0.05% 0.01
Pyrethroids 0.01 0.06% 0.01
Grand Total 10.56 100.00% 10.23
POTATOES Total area (ha) 10,931
Agrichemical groups FAO Category Tonnes a.i./yr
Agchem class
as % of total
Mean loading
(kg a.i./ha)FUNGICIDES & BACTERIOCIDES 170.46 78.74% 15.59
Diazines, Morpholines & other EBIs 0.46 0.21% 0.04
Dithiocarbamates 163.05 75.32% 14.92
Inorganics 0.90 0.41% 0.08
Other fungicides (F3) 4.25 1.96% 0.39Strobilurins (F1) 1.68 0.77% 0.15
Triazoles and Diazoles 0.12 0.06% 0.01
HERBICIDES 26.03 12.02% 2.38
Bipyridyls 7.52 3.47% 0.69
FOPs and DIMs (H3) 0.08 0.04% 0.01
Phosphonyls (H2) 5.43 2.51% 0.50Sulfonylureas 0.01 0.00% 0.00
Triazines 2.90 1.34% 0.27
Urea Derivatives 10.08 4.66% 0.92
INSECTICIDES 20.00 9.24% 1.83
Botanicals and Biologicals 0.04 0.02% 0.00
Carbamate insecticides 4.43 2.05% 0.41Organophosphates 14.20 6.56% 1.30
Other Insecticides (I3) 1.27 0.59% 0.12
Pyrethroids 0.07 0.03% 0.01
Grand Total 216.48 100.00% 19.80

62
APPENDIX 14. Continued
SILVERBEET/SPINACH Total area (ha) 396
Agrichemical groups FAO Category Tonnes a.i./yr
Agchem class
as % of total
Mean loading
(kg a.i./ha)
FUNGICIDES & BACTERIOCIDES 1.80 52.17% 4.55
Dicarboximides (F2) 0.15 4.30% 0.38
Dithiocarbamates 0.63 18.34% 1.60
Inorganics 0.48 13.75% 1.20
Other fungicides (F3) 0.50 14.35% 1.25
Strobilurins (F1) 0.05 1.43% 0.13
HERBICIDES 1.16 33.58% 2.93
Amides 0.19 5.50% 0.48
Carbamate herbicides 0.12 3.44% 0.30
Other herbicides (H4) 0.85 24.64% 2.15
INSECTICIDES 0.49 14.24% 1.24
Botanicals and Biologicals 0.15 4.30% 0.38
Organophosphates 0.34 9.74% 0.85
Pyrethroids 0.01 0.20% 0.02
Grand Total 3.45 100.00% 8.72
SQUASH Total area (ha) 6,804
Agrichemical groups FAO Category Tonnes a.i./yr
Agchem class
as % of total
Mean loading
(kg a.i./ha)FUNGICIDES & BACTERIOCIDES 79.38 86.29% 11.67
Dithiocarbamates 53.75 58.43% 7.90
Inorganics 22.57 24.53% 3.32
Other fungicides (F3) 2.72 2.96% 0.40
Triazoles and Diazoles 0.34 0.37% 0.05
HERBICIDES 12.57 13.67% 1.85
Amides 9.14 9.94% 1.34
Phosphonyls (H2) 3.43 3.73% 0.50
INSECTICIDES 0.04 0.05% 0.01
Pyrethroids 0.04 0.05% 0.01
Grand Total 92.00 100.00% 13.52
SWEETCORN Total area (ha) 5,790
Agrichemical groups FAO Category Tonnes a.i./yr
Agchem class
as % of total
Mean loading
(kg a.i./ha)
FUNGICIDES & BACTERIOCIDES 4.34 13.49% 0.75
Dithiocarbamates 2.17 6.74% 0.38
Other fungicides (F3) 2.17 6.74% 0.38
HERBICIDES 26.35 81.85% 4.55
Amides 14.82 46.04% 2.56
Other herbicides (H4) 2.28 7.08% 0.39
Triazines 9.25 28.73% 1.60
INSECTICIDES 1.50 4.66% 0.26
Carbamate insecticides 0.00 0.00% 0.00
Organophosphates 1.33 4.14% 0.23
Other Insecticides (I3) 0.05 0.15% 0.01
Pyrethroids 0.12 0.38% 0.02
Grand Total 32.20 100.00% 5.56

63
APPENDIX 14. Continued
TOMATOES - OUTDOOR Total area (ha) 630
Agrichemical groups FAO Category Tonnes a.i./yr
Agchem class
as % of total
Mean loading
(kg a.i./ha)
FUNGICIDES & BACTERIOCIDES 11.02 82.72% 17.49
Dithiocarbamates 7.95 59.72% 12.63
Other fungicides (F3) 3.06 23.00% 4.86
HERBICIDES 2.29 17.17% 3.63
Amides 1.81 13.62% 2.88
Triazines 0.47 3.55% 0.75
INSECTICIDES 0.02 0.11% 0.02
Botanicals and Biologicals 0.02 0.11% 0.02
Pyrethroids 0.00 0.00% 0.00
Grand Total 13.32 100.00% 21.14

64
APPENDIX 15. Fruit sector pesticide use estimates
APPLES Total area (ha) 12,150
Agrichemical groups FAO Category Tonnes a.i./yr
Agchem class
as % of total
Mean loading
(kg a.i./ha)
FUNGICIDES & BACTERIOCIDES 65.40 14.95% 5.38
Benzimidazoles 0.61 0.14% 0.05
Dithiocarbamates 18.79 4.29% 1.55
Inorganics 9.09 2.08% 0.75
Other fungicides (F3) 34.94 7.99% 2.88
Strobilurins (F1) 1.00 0.23% 0.08Triazoles and Diazoles 0.97 0.22% 0.08
HERBICIDES 12.10 2.77% 1.00
Other herbicides (H4) 2.92 0.67% 0.24
Phosphonyls (H2) 9.19 2.10% 0.76
INSECTICIDES 21.25 4.86% 1.75
Acaricides (I2) 0.17 0.04% 0.01
Botanicals and Biologicals 0.26 0.06% 0.02
Carbamate insecticides 12.15 2.78% 1.00Insect Growth Regulators (I1) 3.06 0.70% 0.25
Organophosphates 4.37 1.00% 0.36
Other Insecticides (I3) 1.23 0.28% 0.10
MINERAL OILS 286.11 65.39% 23.55
Various mineral oils 286.11 65.39% 23.55
PLANT GROWTH REGULATORS 52.70 12.04% 4.34
Plant Growth Regulators 52.70 12.04% 4.34
Grand Total 437.56 100.00% 36.01
APRICOTS Total area (ha) 636
Agrichemical groups FAO Category Tonnes a.i./yr
Agchem class
as % of total
Mean loading
(kg a.i./ha)
FUNGICIDES & BACTERIOCIDES 6.78 23.34% 10.65
Benzimidazoles 0.10 0.33% 0.15
Diazines, Morpholines & other EBIs 0.02 0.08% 0.04
Dicarboximides (F2) 0.38 1.31% 0.60
Dithiocarbamates 0.20 0.70% 0.32
Inorganics 3.82 13.17% 6.01
Other fungicides (F3) 2.13 7.33% 3.34
Triazoles and Diazoles 0.12 0.41% 0.19
HERBICIDES 0.92 3.15% 1.44
Phosphonyls (H2) 0.92 3.15% 1.44
INSECTICIDES 1.67 5.76% 2.63
Acaricides (I2) 0.14 0.48% 0.22
Botanicals and Biologicals 0.05 0.17% 0.08
Carbamate insecticides 1.23 4.23% 1.93
Insect Growth Regulators (I1) 0.00 0.01% 0.01
Organophosphates 0.25 0.87% 0.40
MINERAL OILS 19.67 67.75% 30.92
Various mineral oils 19.67 67.75% 30.92
Grand Total 29.03 100.00% 45.65

65
APPENDIX 15. Continued
AVOCADO Total area (ha) 3,235
Agrichemical groups FAO Category Tonnes a.i./yr
Agchem class
as % of total
Mean loading
(kg a.i./ha)
FUNGICIDES & BACTERIOCIDES 30.76 30.38% 9.51
Inorganics 30.76 30.38% 9.51
HERBICIDES 4.66 4.60% 1.44
Phosphonyls (H2) 4.66 4.60% 1.44
INSECTICIDES 11.28 11.14% 3.49
Botanicals and Biologicals 2.64 2.61% 0.82
Carbamate insecticides 0.65 0.64% 0.20Insect Growth Regulators (I1) 2.43 2.40% 0.75
Organophosphates 5.38 5.31% 1.66
Pyrethroids 0.18 0.18% 0.06
MINERAL OILS 54.54 53.88% 16.86
Various mineral oils 54.54 53.88% 16.86
Grand Total 101.24 100.00% 31.29
BLACKCURRANTS Total area (ha) 1,308
Agrichemical groups FAO Category Tonnes a.i./yr
Agchem class
as % of total
Mean loading
(kg a.i./ha)
FUNGICIDES & BACTERIOCIDES 2.53 21.55% 1.93
Dithiocarbamates 0.31 2.68% 0.24
Inorganics 0.96 8.16% 0.73
Other fungicides (F3) 1.26 10.72% 0.96
HERBICIDES 6.24 53.20% 4.77
Phosphonyls (H2) 1.33 11.38% 1.02
Triazines 4.91 41.82% 3.75
INSECTICIDES 0.20 1.74% 0.16
Carbamate insecticides 0.08 0.70% 0.06
Organophosphates 0.12 1.05% 0.09
MINERAL OILS 2.76 23.50% 2.11
Various mineral oils 2.76 23.50% 2.11
Grand Total 11.73 100.00% 8.97

66
APPENDIX 15. Continued
BLUEBERRIES Total area (ha) 430
Agrichemical groups FAO Category Tonnes a.i./yr
Agchem class
as % of total
Mean loading
(kg a.i./ha)
FUNGICIDES & BACTERIOCIDES 2.38 47.53% 5.54
Benzimidazoles 0.17 3.43% 0.40
Dicarboximides (F2) 0.05 1.07% 0.13
Dithiocarbamates 0.38 7.55% 0.88
Inorganics 0.70 14.03% 1.64
Other fungicides (F3) 1.06 21.19% 2.47
Triazoles and Diazoles 0.01 0.25% 0.03
HERBICIDES 0.44 8.75% 1.02
Phosphonyls (H2) 0.44 8.75% 1.02
INSECTICIDES 0.38 7.56% 0.88
Carbamate insecticides 0.05 1.03% 0.12
Insect Growth Regulators (I1) 0.01 0.28% 0.03
Organophosphates 0.31 6.24% 0.73
MINERAL OILS 1.81 36.17% 4.22
Various mineral oils 1.81 36.17% 4.22
Grand Total 5.01 100.00% 11.65
BOYSENBERRIES/
BLACKBERRIES/
RASPBERRIES Total area (ha) 655
Agrichemical groups FAO Category Tonnes a.i./yr
Agchem class
as % of total
Mean loading
(kg a.i./ha)
FUNGICIDES & BACTERIOCIDES 8.00 70.21% 12.21
Dithiocarbamates 4.61 40.47% 7.04
Inorganics 0.17 1.51% 0.26
Other fungicides (F3) 3.22 28.23% 4.91
HERBICIDES 2.68 23.54% 4.10
Bipyridyls 0.18 1.58% 0.28
Phosphonyls (H2) 0.86 7.59% 1.32
Triazines 1.64 14.37% 2.50
INSECTICIDES 0.71 6.25% 1.09
Botanicals and Biologicals 0.02 0.14% 0.02
Carbamate insecticides 0.08 0.69% 0.12
Insect Growth Regulators (I1) 0.02 0.17% 0.03
Organophosphates 0.37 3.24% 0.56
Other Insecticides (I3) 0.23 2.01% 0.35
Grand Total 11.39 100.00% 17.39

67
APPENDIX 15. Continued
CHERRIES Total area (ha) 550
Agrichemical groups FAO Category Tonnes a.i./yr
Agchem class
as % of total
Mean loading
(kg a.i./ha)
FUNGICIDES & BACTERIOCIDES 4.31 23.07% 7.84
Benzimidazoles 0.21 1.10% 0.38
Dicarboximides (F2) 0.37 1.99% 0.68
Inorganics 2.74 14.65% 4.98
Other fungicides (F3) 0.91 4.86% 1.65
Triazoles and Diazoles 0.09 0.48% 0.16
HERBICIDES 0.08 0.42% 0.14
Phosphonyls (H2) 0.08 0.42% 0.14
INSECTICIDES 0.39 2.10% 0.71
Acaricides (I2) 0.01 0.06% 0.02
Botanicals and Biologicals 0.01 0.03% 0.01
Carbamate insecticides 0.11 0.59% 0.20
Organophosphates 0.26 1.40% 0.48
Pyrethroids 0.01 0.03% 0.01
MINERAL OILS 13.91 74.40% 25.29
Various mineral oils 13.91 74.40% 25.29
PLANT GROWTH REGULATORS 0.00 0.00% 0.00
Plant Growth Regulators 0.00 0.00% 0.00
Grand Total 18.70 100.00% 33.99
FEIJOAS Total area (ha) 198
Agrichemical groups FAO Category Tonnes a.i./yr
Agchem class
as % of total
Mean loading
(kg a.i./ha)
FUNGICIDES & BACTERIOCIDES 0.20 8.57% 1.02
Inorganics 0.20 8.57% 1.02
HERBICIDES 0.30 12.94% 1.54
Bipyridyls 0.07 2.89% 0.34
Dinitroanilines 0.20 8.37% 1.00
Phosphonyls (H2) 0.04 1.68% 0.20
INSECTICIDES 0.18 7.56% 0.90
Botanicals and Biologicals 0.10 4.20% 0.50
Organophosphates 0.08 3.36% 0.40
MINERAL OILS 1.67 70.93% 8.44
Various mineral oils 1.67 70.93% 8.44
Grand Total 2.36 100.00% 11.90

68
APPENDIX 15. Continued
GRAPES (WINE) Total area (ha) 19,646
Agrichemical groups FAO Category Tonnes a.i./yr
Agchem class
as % of total
Mean loading
(kg a.i./ha)
FUNGICIDES & BACTERIOCIDES 127.36 58.65% 6.48
Dicarboximides (F2) 1.96 0.90% 0.10
Dithiocarbamates 18.23 8.40% 0.93
Inorganics 72.58 33.42% 3.69
Other fungicides (F3) 34.17 15.73% 1.74
Triazoles and Diazoles 0.42 0.19% 0.02
HERBICIDES 48.88 22.51% 2.49
Other herbicides (H4) 11.79 5.43% 0.60
Phosphonyls (H2) 27.66 12.74% 1.41
Triazines 3.93 1.81% 0.20
Urea Derivatives 5.50 2.53% 0.28
INSECTICIDES 7.78 3.58% 0.40
Botanicals and Biologicals 0.25 0.11% 0.01
Insect Growth Regulators (I1) 6.17 2.84% 0.31
Organophosphates 1.35 0.62% 0.07
Pyrethroids 0.01 0.00% 0.00
MINERAL OILS 33.12 15.25% 1.69
Various mineral oils 33.12 15.25% 1.69
Grand Total 217.14 100.00% 11.05
HOPS Total area (ha) 426
Agrichemical groups FAO Category Tonnes a.i./yr
Agchem class
as % of total
Mean loading
(kg a.i./ha)
HERBICIDES 0.82 95.87% 1.92
Bipyridyls 0.11 12.52% 0.25
Phosphonyls (H2) 0.38 45.06% 0.90
Triazines 0.33 38.30% 0.77
INSECTICIDES 0.04 4.13% 0.08
Acaricides (I2) 0.04 4.13% 0.08
Botanicals and Biologicals 0.00 0.00% 0.00
Grand Total 0.85 100.00% 2.00

69
APPENDIX 15. Continued
OLIVES Total area (ha) 2,732
Agrichemical groups FAO Category Tonnes a.i./yr
Agchem class
as % of total
Mean loading
(kg a.i./ha)
FUNGICIDES & BACTERIOCIDES 13.73 26.76% 5.03
Inorganics 13.66 26.62% 5.00
Triazoles and Diazoles 0.07 0.13% 0.03
HERBICIDES 3.93 7.67% 1.44
Phosphonyls (H2) 3.93 7.67% 1.44
INSECTICIDES 0.08 0.16% 0.03
Insect Growth Regulators (I1) 0.03 0.06% 0.01
Organophosphates 0.05 0.10% 0.02
MINERAL OILS 33.56 65.42% 12.29
Various mineral oils 33.56 65.42% 12.29
Grand Total 51.31 100.00% 18.78
KIWIFRUIT Total area (ha) 12,357
Agrichemical groups FAO Category Tonnes a.i./yr
Agchem class
as % of total
Mean loading
(kg a.i./ha)
FUNGICIDES & BACTERIOCIDES 9.48 3.18% 0.77
Benzimidazoles 0.62 0.21% 0.05
Dicarboximides (F2) 3.71 1.24% 0.30
Inorganics 5.16 1.73% 0.42
HERBICIDES 33.56 11.24% 2.72
Phosphonyls (H2) 23.33 7.81% 1.89
Triazines 10.23 3.43% 0.83
INSECTICIDES 26.52 8.88% 2.15
Botanicals and Biologicals 1.85 0.62% 0.15
Insect Growth Regulators (I1) 2.98 1.00% 0.24
Organophosphates 20.70 6.93% 1.68
Other Insecticides (I3) 0.09 0.03% 0.01
Pyrethroids 0.90 0.30% 0.07
MINERAL OILS 20.81 6.97% 1.68
Various mineral oils 20.81 6.97% 1.68
PLANT GROWTH REGULATORS 208.19 69.73% 16.85
Plant Growth Regulators 208.19 69.73% 16.85
Grand Total 298.57 100.00% 24.16

70
APPENDIX 15. Continued
ORANGES/MANDARINS/
TANGELOS/LEMONS/LIME Total area (ha) 2,031
Agrichemical groups FAO Category Tonnes a.i./yr
Agchem class
as % of total
Mean loading
(kg a.i./ha)FUNGICIDES & BACTERIOCIDES 5.12 15.16% 2.52
Benzimidazoles 0.09 0.25% 0.04Dicarboximides (F2) 0.03 0.10% 0.02Dithiocarbamates 2.64 7.81% 1.30Inorganics 2.28 6.75% 1.12Other fungicides (F3) 0.07 0.19% 0.03Strobilurins (F1) 0.01 0.03% 0.00Triazoles and Diazoles 0.01 0.02% 0.00
HERBICIDES 9.23 27.31% 4.55
Phenoxy hormones 0.00 0.01% 0.00Phosphonyls (H2) 8.90 26.32% 4.38Triazines 0.33 0.98% 0.16
INSECTICIDES 2.90 8.58% 1.43
Acaricides (I2) 0.13 0.39% 0.06Botanicals and Biologicals 0.02 0.07% 0.01Carbamate insecticides 0.00 0.00% 0.00Insect Growth Regulators (I1) 0.13 0.39% 0.07Organophosphates 2.58 7.63% 1.27Other Insecticides (I3) 0.03 0.08% 0.01Pyrethroids 0.00 0.00% 0.00
MINERAL OILS 16.55 48.95% 8.15
Various mineral oils 16.55 48.95% 8.15
PLANT GROWTH REGULATORS 0.00 0.01% 0.00
Plant Growth Regulators 0.00 0.01% 0.00
Grand Total 33.81 100.00% 16.65
PASSIONFRUIT Total area (ha) 70
Agrichemical groups FAO Category Tonnes a.i./yr
Agchem class
as % of total
Mean loading
(kg a.i./ha)
FUNGICIDES & BACTERIOCIDES 0.55 85.98% 7.89
Benzimidazoles 0.00 0.68% 0.06Dithiocarbamates 0.03 5.23% 0.48Inorganics 0.51 80.07% 7.35
INSECTICIDES 0.09 14.02% 1.29
Botanicals and Biologicals 0.02 3.00% 0.28Organophosphates 0.07 10.89% 1.00Pyrethroids 0.00 0.13% 0.01
Grand Total 0.64 100.00% 9.18

71
APPENDIX 15. Continued
PEACHES/NECTARINES Total area (ha) 1,288
Agrichemical groups FAO Category Tonnes a.i./yr
Agchem class
as % of total
Mean loading
(kg a.i./ha)FUNGICIDES & BACTERIOCIDES 19.35 32.87% 15.02
Benzimidazoles 0.22 0.37% 0.17Diazines, Morpholines & other EBIs 0.04 0.07% 0.03Dicarboximides (F2) 0.74 1.26% 0.58Dithiocarbamates 3.94 6.69% 3.06Inorganics 10.53 17.88% 8.17Other fungicides (F3) 3.66 6.21% 2.84
Triazoles and Diazoles 0.23 0.38% 0.17
HERBICIDES 0.19 0.32% 0.15
Phosphonyls (H2) 0.19 0.32% 0.15
INSECTICIDES 2.77 4.71% 2.15
Acaricides (I2) 0.25 0.43% 0.20Botanicals and Biologicals 0.06 0.10% 0.05Carbamate insecticides 1.84 3.12% 1.43Insect Growth Regulators (I1) 0.02 0.04% 0.02Organophosphates 0.54 0.92% 0.42Other Insecticides (I3) 0.02 0.03% 0.02Pyrethroids 0.03 0.05% 0.02
MINERAL OILS 36.53 62.05% 28.36
Various mineral oils 36.53 62.05% 28.36
PLANT GROWTH REGULATORS 0.03 0.05% 0.02
Plant Growth Regulators 0.03 0.05% 0.02
Grand Total 58.86 100.00% 45.70
PEARS/NASHI Total area (ha) 1,029
Agrichemical groups FAO Category Tonnes a.i./yr
Agchem class
as % of total
Mean loading
(kg a.i./ha)FUNGICIDES & BACTERIOCIDES 5.24 15.91% 5.09
Benzimidazoles 0.01 0.03% 0.01Diazines, Morpholines & other EBIs 0.01 0.02% 0.01Dithiocarbamates 1.17 3.56% 1.14Inorganics 1.99 6.04% 1.93Other fungicides (F3) 1.98 6.01% 1.92Strobilurins (F1) 0.05 0.14% 0.04Triazoles and Diazoles 0.04 0.11% 0.04
HERBICIDES 2.38 7.22% 2.31
Bipyridyls 0.14 0.43% 0.14Other herbicides (H4) 0.24 0.74% 0.24Phosphonyls (H2) 2.00 6.06% 1.94
INSECTICIDES 0.74 2.24% 0.72
Acaricides (I2) 0.02 0.07% 0.02Botanicals and Biologicals 0.03 0.09% 0.03Insect Growth Regulators (I1) 0.17 0.53% 0.17Organophosphates 0.46 1.40% 0.45Other Insecticides (I3) 0.05 0.15% 0.05
MINERAL OILS 22.42 68.05% 21.79
Various mineral oils 22.42 68.05% 21.79
PLANT GROWTH REGULATORS 2.17 6.58% 2.11
Plant Growth Regulators 2.17 6.58% 2.11
Grand Total 32.95 100.00% 32.02

72
APPENDIX 15. Continued
PERSIMMONS Total area (ha) 282
Agrichemical groups FAO Category Tonnes a.i./yr
Agchem class
as % of total
Mean loading
(kg a.i./ha)FUNGICIDES & BACTERIOCIDES 4.19 48.87% 14.86
Benzimidazoles 0.18 2.14% 0.65Botanicals and Biologicals 0.45 5.26% 1.60Dicarboximides (F2) 0.11 1.23% 0.38Dithiocarbamates 0.45 5.26% 1.60Inorganics 2.63 30.69% 9.33Other fungicides (F3) 0.37 4.28% 1.30
HERBICIDES 0.40 4.67% 1.42
Bipyridyls 0.02 0.23% 0.07Phosphonyls (H2) 0.38 4.45% 1.35
INSECTICIDES 1.60 18.72% 5.69
Botanicals and Biologicals 0.10 1.21% 0.37Carbamate insecticides 0.34 3.95% 1.20Insect Growth Regulators (I1) 0.05 0.63% 0.19Organophosphates 1.04 12.12% 3.69Other Insecticides (I3) 0.05 0.64% 0.20Pyrethroids 0.01 0.16% 0.05
MINERAL OILS 2.38 27.73% 8.43
Various mineral oils 2.38 27.73% 8.43
Grand Total 8.57 100.00% 30.40
PLUMS Total area (ha) 394
Agrichemical groups FAO Category Tonnes a.i./yr
Agchem class
as % of total
Mean loading
(kg a.i./ha)FUNGICIDES & BACTERIOCIDES 4.89 25.67% 12.41
Benzimidazoles 0.06 0.31% 0.15Dicarboximides (F2) 0.12 0.62% 0.30Dithiocarbamates 0.45 2.36% 1.14Inorganics 3.26 17.12% 8.28Other fungicides (F3) 0.95 4.97% 2.40Triazoles and Diazoles 0.06 0.29% 0.14
HERBICIDES 0.21 1.13% 0.54
Phosphonyls (H2) 0.21 1.13% 0.54
INSECTICIDES 0.66 3.46% 1.67
Acaricides (I2) 0.13 0.66% 0.32Botanicals and Biologicals 0.03 0.18% 0.09Carbamate insecticides 0.31 1.64% 0.80Insect Growth Regulators (I1) 0.01 0.04% 0.02Organophosphates 0.16 0.85% 0.41Pyrethroids 0.02 0.08% 0.04
MINERAL OILS 13.29 69.75% 33.72
Various mineral oils 13.29 69.75% 33.72
Grand Total 19.05 100.00% 48.34

73
APPENDIX 15. Continued
STRAWBERRIES Total area (ha) 311
Agrichemical groups FAO Category Tonnes a.i./yr
Agchem class
as % of total
Mean loading
(kg a.i./ha)FUNGICIDES & BACTERIOCIDES 1.17 60.21% 3.75
Benzimidazoles 0.09 4.41% 0.28Dithiocarbamates 0.30 15.40% 0.96Other fungicides (F3) 0.67 34.38% 2.14Triazoles and Diazoles 0.12 6.02% 0.38
HERBICIDES 0.61 31.60% 1.97
Phosphonyls (H2) 0.22 11.55% 0.72Triazines 0.39 20.05% 1.25
INSECTICIDES 0.16 8.19% 0.51
Acaricides (I2) 0.07 3.49% 0.22Botanicals and Biologicals 0.00 0.17% 0.01Carbamate insecticides 0.02 1.16% 0.07Other Insecticides (I3) 0.07 3.37% 0.21
Grand Total 1.94 100.00% 6.23
TAMARILLOS Total area (ha) 270
Agrichemical groups FAO Category Tonnes a.i./yr
Agchem class
as % of total
Mean loading
(kg a.i./ha)FUNGICIDES & BACTERIOCIDES 1.48 40.37% 5.50
Inorganics 1.48 40.37% 5.50
HERBICIDES 0.35 9.63% 1.31
Phosphonyls (H2) 0.35 9.63% 1.31
INSECTICIDES 0.70 19.01% 2.59
Acaricides (I2) 0.00 0.01% 0.00Botanicals and Biologicals 0.00 0.06% 0.01Insect Growth Regulators (I1) 0.01 0.39% 0.05Organophosphates 0.58 15.74% 2.14Other Insecticides (I3) 0.09 2.38% 0.32Pyrethroids 0.02 0.43% 0.06
MINERAL OILS 1.14 30.99% 4.22
Various mineral oils 1.14 30.99% 4.22
Grand Total 3.68 100.00% 13.62

74
APPENDIX 16. Flower and nut crop sector-based pesticide use estimates
NERINES/PAEONIES/
SANDERSONIA Total area (ha) 237
Agrichemical groups FAO Category Tonnes a.i./yr
Agchem class
as % of total
Mean loading
(kg a.i./ha)FUNGICIDES & BACTERIOCIDES 1.52 55.93% 6.43
Benzimidazoles 0.01 0.37% 0.04Diazines, Morpholines & other EBIs 0.05 1.96% 0.23Dicarboximides (F2) 0.04 1.61% 0.18Dithiocarbamates 0.11 4.11% 0.47Inorganics 0.21 7.73% 0.89
Other fungicides (F3) 1.02 37.59% 4.32Strobilurins (F1) 0.00 0.11% 0.01Triazoles and Diazoles 0.07 2.45% 0.28
HERBICIDES 0.57 20.76% 2.38
Bipyridyls 0.22 8.05% 0.92FOPs and DIMs (H3) 0.01 0.34% 0.04Phosphonyls (H2) 0.27 10.06% 1.16Urea Derivatives 0.06 2.30% 0.26
INSECTICIDES 0.63 23.31% 2.68
Acaricides (I2) 0.00 0.05% 0.01Carbamate insecticides 0.01 0.22% 0.03Insect Growth Regulators (I1) 0.00 0.07% 0.01Organophosphates 0.53 19.47% 2.24Other Insecticides (I3) 0.06 2.16% 0.25Pyrethroids 0.04 1.34% 0.15
Grand Total 2.72 100.00% 11.49
WALNUTS/MACADAMIAS/
CHESTNUTS Total area (ha) 1,334
Agrichemical groups FAO Category Tonnes a.i./yr
Agchem class
as % of total
Mean loading
(kg a.i./ha)FUNGICIDES & BACTERIOCIDES 2.96 78.54% 2.22
Dithiocarbamates 0.82 21.73% 0.61Inorganics 2.14 56.81% 1.61
HERBICIDES 0.80 21.36% 0.60
Phosphonyls (H2) 0.80 21.36% 0.60
INSECTICIDES 0.00 0.10% 0.00
Botanicals and Biologicals 0.00 0.08% 0.00Pyrethroids 0.00 0.02% 0.00
Grand Total 3.77 100.00% 2.83