SPSS Workbook 2 - Descriptive Statistics...2 SPSS– Workbook 2 – Descriptive Statistics Accuracy...
21
TEESSIDE UNIVERSITY SCHOOL OF HEALTH & SOCIAL CARE SPSS Workbook 2 - Descriptive Statistics Includes: Recoding variables Cronbachs Alpha Module Leader:Sylvia Storey Phone:016420384969 [email protected]
Transcript of SPSS Workbook 2 - Descriptive Statistics...2 SPSS– Workbook 2 – Descriptive Statistics Accuracy...

TEESSIDE UNIVERSITY
SCHOOL OF HEALTH & SOCIAL CARE
SPSS Workbook 2 - Descriptive Statistics
Includes:
Recoding variables Cronbachs Alpha
Module Leader:Sylvia Storey Phone:016420384969

2
SPSS– Workbook 2 – Descriptive Statistics
Accuracy of data input
Once you have entered your data into SPSS, you need to “clean-up” the data. This involves
ensuring that data has been correctly entered. A good starting point for this is to run a
frequency distribution for each of the variables eg:
If you consider the variable “Gender” (1=male, 2=female) – then any other values entered
would not fall into these categories eg 11, 12, 22. This is one of the most common mistakes
when entering data into SPSS.
To check frequencies for all the variables:
Select Analyse – Descriptive Statistics – Frequencies
Move variables from the left hand column to the right hand column by highlighting the
variable name and then clicking on the arrow to move the variable. Click on OK to finish.

3
When you have done this the frequencies will be displayed in a new output window. Look
down the frequency tables and make a note of any variables that fall outside of the
expected range:
Q1. Would this identify all mistakes? If not what other mistakes may be present?
Descriptive Statistics – Mean and Standard deviation
The following variables are interval/ratio level data
Age, Years of experience
We are now going to obtain the following descriptive statistics:
Mean (measure of central tendency) and Standard deviation (SD = measure of dispersion)
This can be done in a number of ways but we will do this by selecting :
Analyse – Descriptive Statistics – Descriptives
Move the 2 variables into the right hand column and click on Options. Ensure that the
following are selected Mean, Standard deviation, Maximum, Minimum. Now click Continue
and then OK to finish.

4
Record the descriptive statistics for each variable:
Table 1 – Descriptive Statistics
Mean SD Min Max
Age
Length of Experience
So far we have looked at variables individually. This is often referred to to univariate
analysis. We are now going to look at some bivariate analysis – ie looking at the interactions
between 2 variables (remember we are still looking at descriptive statistics so we are not yet
looking at cause and effect).
Crosstabulation – nominal data
We want to know if there is a relationship between Profession and the following statement
“PT/OT should be responsible for own literature searches”. As both variables are
categorical (what does this mean?) we will carry out a Crosstabulation by:
Selecting – Analyse – Descriptives – Crosstabs.

5
Now move the variable Profession into the Rows box, and the variable Q10 (PT/OT should
be responsible for own literature searches) into the columns box. Next click on Cells
As there are unequal number of OTs and PTs in the group we can ask SPSS to calculate
percentages of OTs/PTs that agree/disagree etc. We do this by ticking the Row in the
Percentages box. Click Continue then OK.

6
Now complete the table below:
Table 2 : Crosstabulation Profession: “EBP does not take into account patient preferences”
EBP does not take into account patient preferences
Strongly disagree
Disagree Neutral Agree Strongly Agree
Profession OT
PT
Q2. What do the results suggest?
....................................................................................................................................................
....................................................................................................................................................
The Crosstabulation we have just carried out looked at the relationship between 2
categorical variables (one nominal and one ordinal).
Summarising the results of multiple Dependent Variables.
On the questionnaire variables Q1 – Q9 looked at the attitudes towards EBP whilst Q10-Q12
asked participants about whether they thought certain activities were their own
responsibility.
We will now summarise the results of Q1-Q9 within a table (we are not separating this by
profession we are simply summarising the responses of the participants). We could provide
a table that summarises the category responses of all these variables (and I have included
an example in the answers section) however, as these variables are ORDINAL level data
then the appropriate summary statistic is the MEDIAN. You should additionally include
information about the range of the responses.
Select Analyse, Descriptive Statistics, Frequencies

7
Highlight the variables relating to question Q1-Q9 and move then to the variables box by
clicking on the arrow. Click on Statistics
Change the choice of statistic from Mean to Median by selecting the relevant boxes. Click
on Continue and OK.

8
Now complete the following table:
Table 3 – Summary of Q1-Q9
Question Median Min Max
Application of EBP is necessary
Literature and research findings useful in daily practice
Need to increase use of evidence in daily practice
Adoption of EBP places unreasonable demand on PT/OT
Am interested in learning skills to incorporate EBP in practice
EBP improves quality of patient care
EBP helps me make decisions about patient care
EBP does not take into account patient preferences
Definite divide between research and practice
Q3. What do the data above show?
....................................................................................................................................................
....................................................................................................................................................
...................................................................................................................................................
....................................................................................................................................................
Positive and negative statements
Remember when we discussed questionnaire design we stated that questions could be
positively or negatively worded and that negative statements were often used to ensure
that participants were answering questions accurately. From the statements in the table
above (Table 3) identify the statements as follows:
+ indicates a positive attitude towards EBP
-indicates a negative attitude towards EBP
Was it easy to do this? Which statement /statements (if any) were difficult for you to
determine?
....................................................................................................................................................
....................................................................................................................................................
...................................................................................................................................................
....................................................................................................................................................

9
We need to “Re-code” negative statements ie if a HIGH SCORE represents a POSITIVE
ATTITUDE towards EBP then we need to change the coding for these variable ie Q4, Q8 and
Q9. (Participants who had a positive attitude towards EBP would have ticked 1 or 2 for these
items. If we want to total all of these scores together (eg 9 questions maximum score 45)
then we need to change these scores.
Before we go ahead with this next stage save your file and then Save Data as “Recoded
data” as any actions you carry out at this stage cannot be undone – by saving your file you
keep the original data intact.
To re-code the variables select , Transform then Recode into Same Variable.

10
Move questions 4, 8 and 9 the Numeric Variables box by highlighting them in the left and
clicking on the arrow. You will need to move each variable separately.
Then click on Old and New Values. We are going to reverse the scores for each category so
type in 5 in the Old Value and 1 in the New Value box. Then click on Add then Continue

11
Repeat this process until you have entered the following:
Old value 4 = New value 2
Old value 3= New value 3 (you can leave this out as it stays the same)
Old value 2 = New value 4
Old value 1 – New value 5
Don’t forget to click on Add after each one. These will now show in the box below. Check
that all your values are correct before proceeding. If they are correct click on Continue.
Now that we have reverse code these items we are going to run a reliability
check for these 9 questions of the questionnaire.

12
Cronbachs alpha
To see if the questions are being answered correctly we can carry out a test that will identy
any problematic questions.
Click on Analyse, Scale, Reliability Analysis
Highlight variable Q1 – Q9 and move these to the Items box by clicking on the arrow, then
select Statistics.

13
Now select the following, Item, Scale, Scale if item deleted as shown below. Click Continue
and then OK
The data from the Cronbachs alpha is quite detailed but this is what you need to know:
Cronbachs alpha is 0.569 which represents 9 questions.
Reliability Statistics
Cronbach's
Alpha N of Items
.569 9
Now we know from class that the alpha co-efficient (which ranges from 0-1) should be more
than 0.7 for the internal consistency to be good (Remember this?)
So at 0.569 – do you think this is good?

14
The table below shows each statement (ie Q1 to Q9) and in the right hand
column shows what the new Cronbachs alpha will be if the item is removed.
In other words it identified statements that are not being answered in line
with the other questions.
We can see that 2 statements if removed individually would increase the
alpha coefficient to 0.655
tem-Total Statistics
Scale Mean if
Item Deleted
Scale Variance
if Item Deleted
Corrected Item-
Total
Correlation
Cronbach's
Alpha if Item
Deleted
Application of EBP is
necessary
30.7895 8.287 .502 .452
Literature and research
findings useful in daily
practice
31.1053 10.988 .148 .567
Need to increase use of
evidence in daily practice
31.1053 9.322 .429 .491
Adoption of EBP places
unreasonable demand on
PT/OT
32.3684 11.690 -.094 .655
Am interested in learning
skills to incorporate EBP in
practice
30.7895 9.731 .629 .477
EBP improves quality of
patient care
30.7368 10.982 .228 .552
EBP helps me make
decisions about patient care
30.9474 9.719 .426 .500
EBP does not take into
account patient preferences
31.7368 7.760 .566 .421
Definite divide between
research and practice
32.9474 11.497 -.075 .655
If both of these items are removed we would expect the alpha coefficient to increase to
more than 0.655 – possible even to more than 0.7.
Can you think of an explanation for why these questions/statements are different to the
remainder of the statements?
....................................................................................................................................................
....................................................................................................................................................
..................................................................................................................................................

15
To remove these items select Transform, Scale, Reliability Analysis as before.
Highlight question 4 and click on the arrow in the centre to move it back to the left hand
box.
Repeat the same for question 9 and then re-do the Cronbachs alpha test.
The new alpha coefficient should now be 0.788 from 7 questions
Reliability Statistics
Cronbach's
Alpha N of Items
.788 7
(The table on the following page shows that there are now no further questions causing a
“problem” with the data.)

16
Item-Total Statistics
Scale Mean if
Item Deleted
Scale Variance
if Item Deleted
Corrected Item-
Total
Correlation
Cronbach's
Alpha if Item
Deleted
Application of EBP is
necessary
25.4737 8.596 .477 .776
Literature and research
findings useful in daily
practice
25.7895 10.175 .410 .779
Need to increase use of
evidence in daily practice
25.7895 9.175 .509 .762
Am interested in learning
skills to incorporate EBP in
practice
25.4737 9.708 .704 .742
EBP improves quality of
patient care
25.4211 10.368 .489 .770
EBP helps me make
decisions about patient care
25.6316 9.246 .603 .745
EBP does not take into
account patient preferences
26.4211 7.813 .593 .749

17
ANSWERS

18
Appendix 1 – Answers & Completed tables. Q1. No – this would only identify mistakes where the input value falls outside of the expected range. If you entered someone’s data as male instead of female (ie 1 instead of 2 in the case of our data-file) then you would not know you had done this unless you checked all data carefully. Table 1 : Descriptive Statistics This is the output from SSPSS:
Descriptive Statistics
N Minimum Maximum Mean Std. Deviation
age 19 22.00 42.00 28.8421 5.31521
YrsExperience 19 3.00 13.00 5.1579 2.87254
Valid N (listwise) 19
You should NEVER include these tables in your written work (eg your dissertation) you should extract the date you need and then include this in a table as shown below:
Mean SD Min Max
Age
28.8421 5.31521 22 42
Length of Experience
5.1579 2.87254 3 13
Table 2 – Gender vs “EBP does not take into account patient preferences” This is the output from SPSS – as you can see none of the respondents disagreed or strongly disagreed with this statement and therefore these values are not represented in the SPSS table.
Profession * PT/OTs should be responsible for own literature reviews to address their clinical questions
PT/OTs should be responsible for own literature
reviews to address their clinical questions
Total neutral agree strongly agree
Profession PT Count 4 6 4 14
% within Profession 28.6% 42.9% 28.6% 100.0%
OT Count 0 4 1 5
% within Profession .0% 80.0% 20.0% 100.0%
Total Count 4 10 5 19
% within Profession 21.1% 52.6% 26.3% 100.0%

19
Table 2 : Crosstabulation - Gender: “OT/PT should be responsible for own literature
searches”
EBP does not take into account patient preferences
Strongly disagree
Disagree Neutral Agree Strongly Agree
Prefession PT 0 0 4 (28.6) 6 (42.9) 4 (28.6%)
OT 0 0 0 4 (80%) 1(20%)
Q2. In terms of Table 2 the data suggests that with the exception of 4 participants who were unsure, all participants agreed/strongly agreed that the OT/PT should be responsible for carrying out their own literature searches. ** PLEASE TAKE CARE to note that the sample size for this study is very small and therefore any results should be treated with caution.
Summarising the results of multiple questions. The following table summarises the main findings of the result and should be used if the study you are undertaking is a descriptive study as it provides the full breakdown of responses (you could then express these as percentages)
Question Strongly disagree
Disagree Neutral Agree Strongly Agree
Application of EBP is necessary 1 0 0 5 13 Literature and research findings useful in daily practice
0 0 2 11 6
Need to increase use of evidence in daily practice
0 0 4 7 8
Adoption of EBP places unreasonable demand on PT/OT
1 3 11 2 2
Am interested in learning skills to incorporate EBP in practice
0 0 0 9 10
EBP improves quality of patient care 0 0 0 8 11 EBP helps me make decisions about patient care
0 0 2 8 9
EBP does not take into account patient preferences
3 9 3 4 0
Definite divide between research and practice 0 3 5 7 4
The table on the following page shows the median value for each question (remember a response of 1=strongly disagree whilst 5 = strongly agree):
20
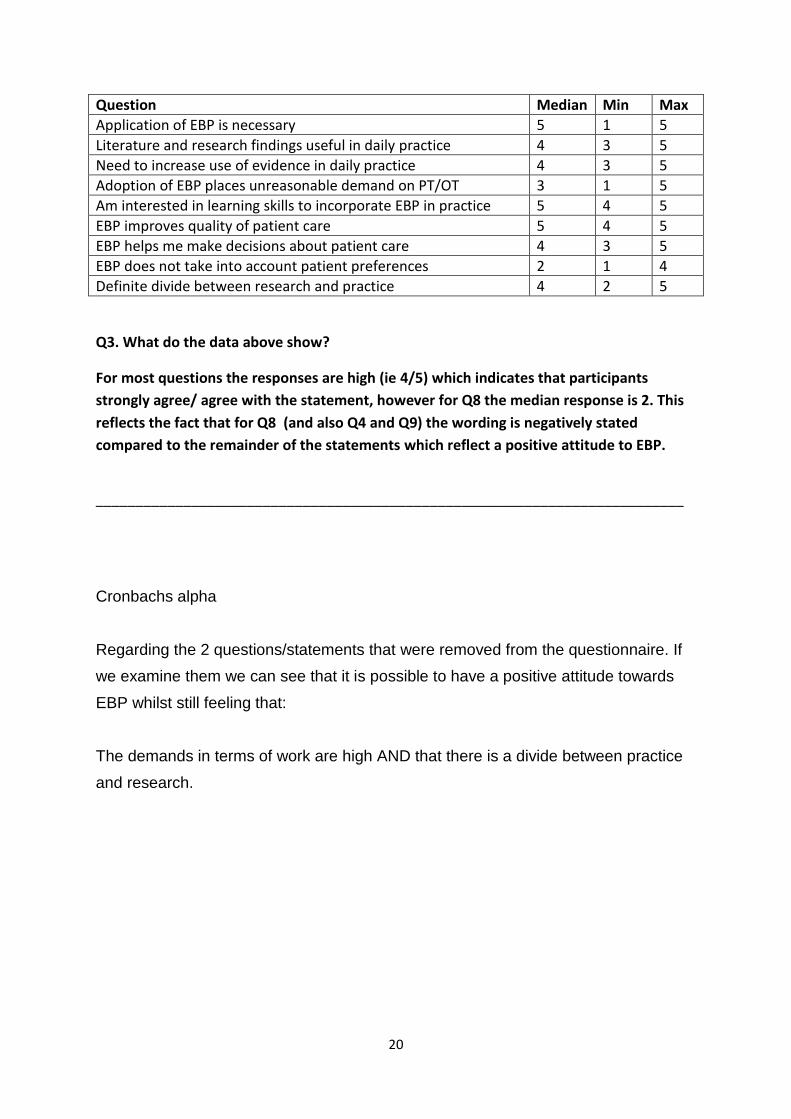
Question Median Min Max
Application of EBP is necessary 5 1 5
Literature and research findings useful in daily practice 4 3 5
Need to increase use of evidence in daily practice 4 3 5
Adoption of EBP places unreasonable demand on PT/OT 3 1 5
Am interested in learning skills to incorporate EBP in practice 5 4 5
EBP improves quality of patient care 5 4 5
EBP helps me make decisions about patient care 4 3 5
EBP does not take into account patient preferences 2 1 4
Definite divide between research and practice 4 2 5
Q3. What do the data above show?
For most questions the responses are high (ie 4/5) which indicates that participants
strongly agree/ agree with the statement, however for Q8 the median response is 2. This
reflects the fact that for Q8 (and also Q4 and Q9) the wording is negatively stated
compared to the remainder of the statements which reflect a positive attitude to EBP.
__________________________________________________________________________
Cronbachs alpha
Regarding the 2 questions/statements that were removed from the questionnaire. If
we examine them we can see that it is possible to have a positive attitude towards
EBP whilst still feeling that:
The demands in terms of work are high AND that there is a divide between practice
and research.

21