SPSS Tables 12 12.0 Tables.pdf · The new SPSS Tables interface is outstanding; creating complex...
6
® Ensure that others can use your analytical results with SPSS Tables, an SPSS add-on module that enables you to create tabular reports using an interactive interface SPSS Tables ™ 12.0
Transcript of SPSS Tables 12 12.0 Tables.pdf · The new SPSS Tables interface is outstanding; creating complex...

®
Ensure that others can
use your analytical
results with SPSS
Tables, an SPSS add-on
module that enables
you to create tabular
reports using an
interactive interface
SPSS Tables ™ 12.0

Report analytical results to thepeople who need themYou often report the results of your analyses to decision makers, colleagues, clients,
grant committees, or others. Building tabular reports, however, can be a time-consuming,
trial-and-error process. SPSS Tables 12.0 enables you to view your tables as you build
them, so you can create polished, accurate tables in less time.
SPSS Tables 12.0 is optimized for use with SPSS 12.0. It includesfrequently requested features such as:■ An interactive table preview builder that enables you to see
your tables as you create them ■ Category management capabilities that enable you to reveal
more information about your table. For example, you canexclude specific categories, display missing value cells and add subtotals to your table. And now there are more sortingoptions than in SPSS Tables 11.0 and previous versions.
■ Inferential statistics that add even more insight to your tables ■ Easy deployment to Word or Excel for use in reports
SPSS Tables 12.0, an add-on module for the SPSS product line,makes it easy for you to summarize your data in columns and rowsfor different audiences. The module’s build-as-you-go interfaceupdates in real time, so you always know what your tables looklike. You can add inferential statistics, for example, and then customize the table so your audience can easily understand theinformation. When your tables are complete, you can export themto Microsoft® Word or Excel. And depending on the size of yourdata file, SPSS Tables 12.0 can run up to 40 percent faster* thanSPSS Tables 11.0 and earlier versions.
SPSS Tables 12.0 is ideal for anyone who creates and updatesreports on a regular basis, including people who work in:■ Survey research■ Market research■ Social sciences■ Database or direct marketing■ Institutional research
– Nancy L. Leech, PhDAssistant ProfessorSchool of EducationUniversity of Colorado at Denver
ÊI really like the new version of SPSS Tables. The new interface is clear and easy
to use; it makes setting up reports very easy. Also, SPSS’ ability to export data
into other software formats will increase my productivity.**Â
* For performance test results, visit www.spss.com/spssbi/tables/benchmark.htm** Quote refers to SPSS Tables 11.5

Customize your table structureDisplay information the way you want to when you use the categorymanagement features in SPSS Tables 12.0. Create totals and subtotalswithout changing your data file. You can combine several categoriesinto a single category, for example, for frequent top- and bottom-box analyses.
Make your tables more precise, as you create them, by changingvariable types or excluding categories. You can display or excludecategories with no counts for clearer and more concise output. Or sort and rank categories based on cell values for a neater, moreinformative table.
Preview tables as you build themSPSS Tables 12.0’s intuitive graphical user interface takes theguesswork out of building tables. The drag-and-drop capabilitiesand preview pane enable you to see what your tables look like,before you click “OK.”
It’s easy to create a table with the interactive interface. First, youcan interact with the variables onscreen. Then, you can identifyvariables as categorical or scale and know immediately how yourdata are structured. You can even change the variable type with a single mouseclick.
To create a table, just drag and drop your desired variables into thetable preview builder. You don’t have to write complicated syntaxor struggle with unwieldy dialog boxes. And you can move variableseasily from row to column for precise positioning. The table structureupdates after every change you make, so you can see the formattingeffect immediately. You can also add, swap, and nest variables, orhide statistic labels, directly from within the table preview builder.And you can collapse large, complex tables for a more concise view,and still see your variables.
Use your SPSS data to build the right report the first time
The drag-and-droptable preview builderin SPSS Tables 11.5replaces the dialog-box interface used inprevious versions ofSPSS Tables. Comparethe previous interface,shown to the left, withthe new interface inthe screenshot below.
Know more about your tables with the new, drag-and-drop table preview builder. Your variablesand categories are always displayed at the left. Drag and drop variables onscreen to positionthem where you want them. In this example, the user adds the “Age of Respondent” variableto the table using the stacking feature, and places the “Gender” variables within the tableusing the nesting feature. These features enable you to see what your table looks like beforeyou click “OK.”
This is the resulting table from the table preview builder. Beforeclicking the “OK” button, apply the optional TableLooks™ for amore polished appearance.
Insert subtotals into your tables to make it easier for report readers to understandresults. In this example, the user places the subtotal for the two most negativesurvey response options in a table showing survey respondents’ feelings aboutjazz music.
Table preview builder
Result
Previous interface
New interface

Share results more easily with othersOnce you have results, you need to put them in the hands of thosewho need them. SPSS Tables 12.0 creates results as interactivepivot tables, which enable you to export results to Word or Excel.This not only improves your workflow, it saves time because youdon’t have to reconfigure your tables in Word or Excel. No editing is required after you export them. You can, however, insert anyadditional descriptive content that you want to use.
Save time and effort by automating frequent reportsDo you regularly create reports that have the same structure? Beforeyou run new data, do you spend a lot of time recreating reportsthat you had built in the past? Use syntax and automation in SPSSTables to run frequently needed reports, such as the compliancereports required for grant funding, in a production mode.
When you create a table, SPSS Tables records every click you makeand saves your actions as syntax. To run an automated report, yousimply paste the relevant syntax into a syntax window, then justclick and go. With syntax and automation, your report is readywithout tedious and time-consuming production.
Syntax in SPSS 12.0 uses a more natural language than in SPSSTables 11.0 and earlier versions, so it’s easier to understand. Thisimproved command syntax also saves time when you make minorchanges during production, and gives you more flexibility to runmany tables simultaneously. Syntax created in SPSS Tables 11.0and earlier versions is still usable, however. To take advantage offeatures such as inferential statistics in SPSS Tables 12.0, simplyuse the included syntax converter to translate the original syntaxto new command syntax.
Get in-depth analysesGive your readers reports that enable them to dig into the information and make more informed decisions. Highlight opportunities or problem areas in your results when you includeone of three inferential statistics. Using inferential statistics withSPSS Tables 12.0 enables you to compare means or proportions fordemographic groups, customer segments, time periods, or othercategorical variables. You can also identify trends, changes ormajor differences in your data.
A market researcher at a major publishing company, for example,studies student ratings of college textbooks. He notices a potentialrelationship between students at private universities and low ratings for math textbooks. The researcher runs a column proportions test with SPSS Tables. The test shows, at a 95 percentconfidence level, that there is a difference in math textbook ratingsbetween students at private and public universities. Knowing thatthe confidence level for this difference is high, and that it’s unlikelythat the relationship is due to chance, the researcher recommendsthat the publishing company explore the reasons for the differencein ratings.
You can also select from a variety of summary statistics for cell calculations, including maximum, minimum, mean, median andmode, for other types of analysis.
Control your table outputMany features in SPSS Tables 12.0 help you create tables with the look you want and the time-saving capabilities you need:■ Add titles and captions■ Use table expressions in titles■ Use SPSS Base features such as TableLooks™ and scripts
to automate formatting and redundant tasks■ Specify minimum and maximum column widths for individual
tables during table creation
Use inferential statistics with SPSS Tables to give your report readers in-depth information.
A: Easily create titles with convenientdate, time and table expression stamps.
B: Customize maximum and minimum column widths for a better appearance.
A
B

Create presentation-quality tables fromSPSS data — in a snapWith SPSS Tables 12.0’s intuitive interface, creating professional-looking tables is as easy as 1-2-3.The diagram below shows you just how easy it is.
2
Start
1
Start with yourSPSS data.
Drag and dropyour variablesonto the tablepreview builderand see whatyour table looks like asyou create it.
Easily add to your table to show the informationyou need, such assummary stats (shownto the left), inferentialstats and subtotals,and preview as you go.
Once your table is complete, click the “OK” button.
– Bob MuenchenManager Statistical Consulting CenterUniversity of Tennessee Office of Information Technology
The new SPSS Tables interface
is outstanding; creating
complex tables is quick
and very easy.
ÂÊ
When your tables look the way youwant them to, you can export themto Word or Excel. Your formattingremains intact and you can insertany additional descriptive content.This example shows a final reportin Word.
End
3
SPSS Inc. +1.312.651.3000Toll-free +1.800.543.2185
SPSS Andino +57.1.6358585SPSS Argentina +54.11.4371.5031SPSS Asia Pacific +65.6245.9110SPSS Australasia +61.2.9954.5660
Toll-free +1.800.024.836SPSS Belgium +32.2.474.03.60SPSS Benelux +31.183.651.777SPSS Brasil +55.11.5505.3644SPSS Chile +56.2.233.7499SPSS Colombia toll-free +01800.0914636SPSS Czech Republic +420.222.212.005
SPSS Denmark +45.45.46.02.00SPSS East Africa +254.2.577.262SPSS Federal Systems +1.703.740.2400
Toll-free +1.800.860.5762SPSS Finland +358.9.4355.920SPSS France +01.56.69.18.18SPSS GmbH Software +49.89.4890740SPSS BI Greece +30.10.6971950SPSS Hong Kong +852.28119662SPSS Iberica +34.902.123.606SPSS India +91.80.2088069SPSS Ireland +353.1.415.0234SPSS BI Israel +972.3.6166616
SPSS Italia +800.437300SPSS Japan +81.3.5466.5511SPSS Korea +82.2.563.0014SPSS Latin America +1.312.651.3539SPSS Malaysia +603.6203.2300SPSS Malta +356.21.322314SPSS Mexico +52.55.5682.8768SPSS Morocco +212.37.670866SPSS New Zealand +0800.943.276SPSS Norway +47.22.99.25.50SPSS Polska +48.12.6369680SPSS Russia +7.095.125.0069SPSS San Bruno +1.650.794.2692
SPSS Schweiz +41.1.266.90.30SPSS Singapore +65.6346.2061SPSS South Africa +27.21.7024666SPSS South Asia +91.80.2088069SPSS Sweden +46.8.506.105.50SPSS Taiwan +886.2.25771100SPSS Thailand +66.2.260.7070SPSS Turkiye +90.216.4644806SPSS UK +44.1483.719200
In addition to these offices, SPSS has aworldwide network of distributors. Contactthe SPSS office nearest you for assistance.
Learn more about SPSSContact your nearest SPSS office or visit us at www.spss.com.
®About SPSS Inc.SPSS Inc. (Nasdaq: SPSS) headquartered in Chicago, IL, USA, is a multinational computer software company providing technology that transforms data into insight through the use of predictive analytics and other data mining techniques. The company’s solutions and products enable organizations to manage the future by learning from the past, understanding the present, as well as predictingpotential problems and opportunities. For more information, visit www.spss.com.
SPSS is a registered trademark and the other SPSS products named are trademarks of SPSS Inc. All other names are trademarks of their respective owners. Printed in the U.S.A. © Copyright 2003 SPSS Inc. STB12BRO-0703
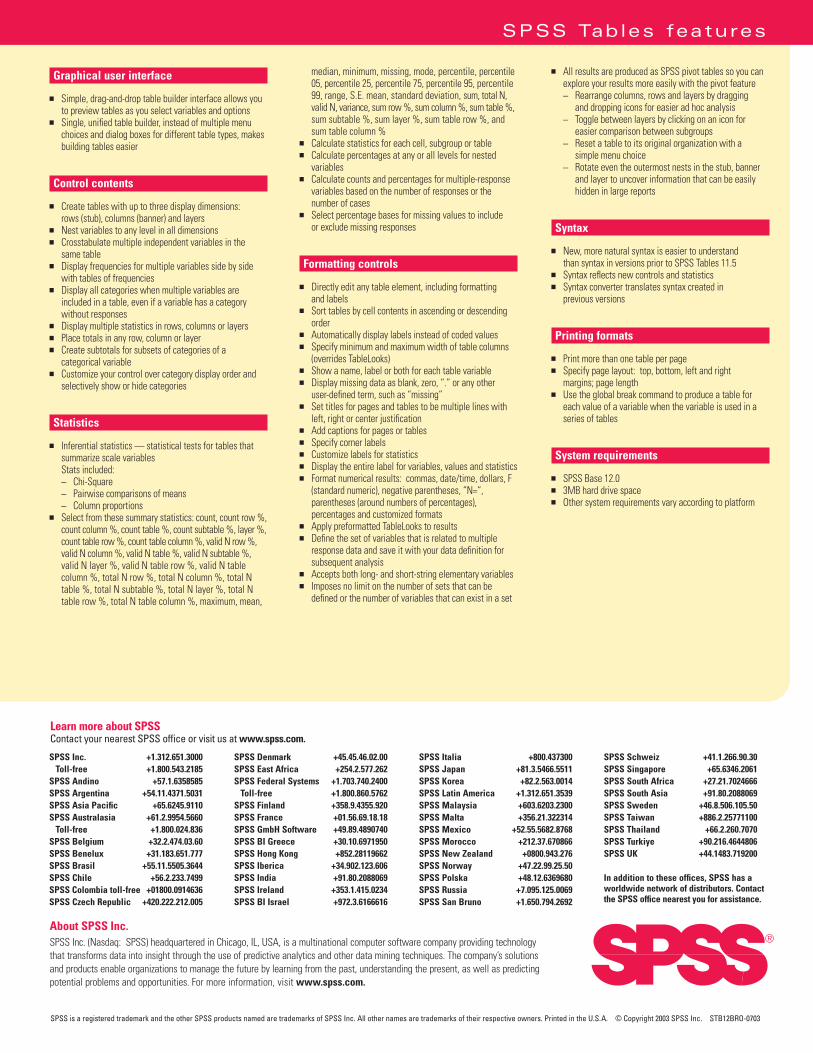
Graphical user interface
■ Simple, drag-and-drop table builder interface allows youto preview tables as you select variables and options
■ Single, unified table builder, instead of multiple menuchoices and dialog boxes for different table types, makesbuilding tables easier
Control contents
■ Create tables with up to three display dimensions: rows (stub), columns (banner) and layers
■ Nest variables to any level in all dimensions■ Crosstabulate multiple independent variables in the
same table■ Display frequencies for multiple variables side by side
with tables of frequencies■ Display all categories when multiple variables are
included in a table, even if a variable has a category without responses
■ Display multiple statistics in rows, columns or layers■ Place totals in any row, column or layer■ Create subtotals for subsets of categories of a
categorical variable ■ Customize your control over category display order and
selectively show or hide categories
Statistics
■ Inferential statistics — statistical tests for tables thatsummarize scale variablesStats included:_ Chi-Square _ Pairwise comparisons of means _ Column proportions
■ Select from these summary statistics: count, count row %,count column %, count table %, count subtable %, layer %,count table row %, count table column %, valid N row %,valid N column %, valid N table %, valid N subtable %,valid N layer %, valid N table row %, valid N table column %, total N row %, total N column %, total Ntable %, total N subtable %, total N layer %, total Ntable row %, total N table column %, maximum, mean,
median, minimum, missing, mode, percentile, percentile05, percentile 25, percentile 75, percentile 95, percentile99, range, S.E. mean, standard deviation, sum, total N,valid N, variance, sum row %, sum column %, sum table %,sum subtable %, sum layer %, sum table row %, andsum table column %
■ Calculate statistics for each cell, subgroup or table■ Calculate percentages at any or all levels for nested
variables■ Calculate counts and percentages for multiple-response
variables based on the number of responses or the number of cases
■ Select percentage bases for missing values to include or exclude missing responses
Formatting controls
■ Directly edit any table element, including formatting and labels
■ Sort tables by cell contents in ascending or descendingorder
■ Automatically display labels instead of coded values■ Specify minimum and maximum width of table columns
(overrides TableLooks)■ Show a name, label or both for each table variable■ Display missing data as blank, zero, “.” or any other
user-defined term, such as “missing”■ Set titles for pages and tables to be multiple lines with
left, right or center justification■ Add captions for pages or tables■ Specify corner labels■ Customize labels for statistics■ Display the entire label for variables, values and statistics■ Format numerical results: commas, date/time, dollars, F
(standard numeric), negative parentheses, “N=“, parentheses (around numbers of percentages), percentages and customized formats
■ Apply preformatted TableLooks to results■ Define the set of variables that is related to multiple
response data and save it with your data definition forsubsequent analysis
■ Accepts both long- and short-string elementary variables■ Imposes no limit on the number of sets that can be
defined or the number of variables that can exist in a set
■ All results are produced as SPSS pivot tables so you canexplore your results more easily with the pivot feature_ Rearrange columns, rows and layers by dragging
and dropping icons for easier ad hoc analysis_ Toggle between layers by clicking on an icon for
easier comparison between subgroups_ Reset a table to its original organization with a
simple menu choice_ Rotate even the outermost nests in the stub, banner
and layer to uncover information that can be easily hidden in large reports
Syntax
■ New, more natural syntax is easier to understand than syntax in versions prior to SPSS Tables 11.5
■ Syntax reflects new controls and statistics■ Syntax converter translates syntax created in
previous versions
Printing formats
■ Print more than one table per page■ Specify page layout: top, bottom, left and right
margins; page length■ Use the global break command to produce a table for
each value of a variable when the variable is used in aseries of tables
System requirements
■ SPSS Base 12.0■ 3MB hard drive space■ Other system requirements vary according to platform
SPSS Tables features