SPREADSHEET ANALYSIS AND DESIGN - FDA: Homearchive.nyu.edu/bitstream/2451/14493/1/IS-87-52.pdf ·...
32
SPREADSHEET ANALYSIS AND DESIGN Boaz Ronen Department of Information Systems Leonard N. Stem School of Business New York University 44 West 4th Street, Suite 9-170 New York, NY 10012-1126 Michael A. Palley Baruch College, CUNY School of Business and Public Administration 17 Lexington Avenue, Box 5 13 New York, NY 10010 Henry C. Lucas, Jr. Department of Information Systems Leonard N. Stem School of Business New York University 44 West 4th Street, Suite 9-67 New York, NY 10012-1126 June 1987 Working Paper Series STERN IS-87-52 Center for Digital Economy Research Stem School of Business IVorking Paper IS-87-52
Transcript of SPREADSHEET ANALYSIS AND DESIGN - FDA: Homearchive.nyu.edu/bitstream/2451/14493/1/IS-87-52.pdf ·...
SPREADSHEET ANALYSIS AND DESIGN
Boaz Ronen Department of Information Systems Leonard N. Stem School of Business
New York University 44 West 4th Street, Suite 9-1 70 New York, NY 100 12- 1 126
Michael A. Palley Baruch College, CUNY
School of Business and Public Administration 17 Lexington Avenue, Box 5 13
New York, NY 100 10
Henry C. Lucas, Jr. Department of Information Systems Leonard N. Stem School of Business
New York University 44 West 4th Street, Suite 9-67 New York, NY 100 12- 1 126
June 1987
Working Paper Series STERN IS-87-52
Center for Digital Economy Research Stem School of Business IVorking Paper IS-87-52

SPREADSHEET ANALYSIS AND DESIGN
Boaz Ronen* Michael A. Palley** Henry C. Lucas, Jr.*
ABSTRACT
Spreadsheet programs and microcomputers have revolutionized information processing in organizations. Users have adopted spreadsheets to solve problems and circumvent the long delays encountered in dealing with the traditional information services department. A significant number of serious errors have been reported through the misuse of spreadsheet technology. This paper discusses several different contexts for the development of spreadsheet models and presents structured design techniques for these models. The recommended approach to spreadsheet analysis and design encourages the use of a block structure format for the worksheet and introduces Spreadsheet Flow Diagrams as a systems design tool. The objective of this design approach is to reduce the probability and severity of spreadsheet errors, improve auditability and promote greater longevity for spreadsheet models.
* Graduate School of Business Administration, 100 Trinity Place, New York, N.Y. 10006
** Baruch College, CUNY, School of Business and Public Administration, 17 Lexington Avenue, Box 513, New York, N.Y. 10010
Center for Digital Economy Research Stem School of Business IVorking Paper IS-87-52

INTRODUCTION
Spreadsheet programs have become extremely popular with
microcomputer users. Spreadsheets are utilized heavily by
end users and systems professionals alike. In fact
spreadsheet software has contributed a great deal to the
popularity of personal computers. These packages present
the user with a general purpose problem solving tool.
A spreadsheet can be viewed as a large matrix in which
columns are typically designated by letters and rows by
numbers. The intersection of a row and column defines a
cell; a cell can contain a number, label or formula which
relates it to other cells in the spreadsheet. The ability
to relate cells with formulae is what provides spreadsheets
with their tremendous power. If the spreadsheet model is
constructed with formulae, a change in one or two numbers is
immediately reflected throughout the spreadsheet.
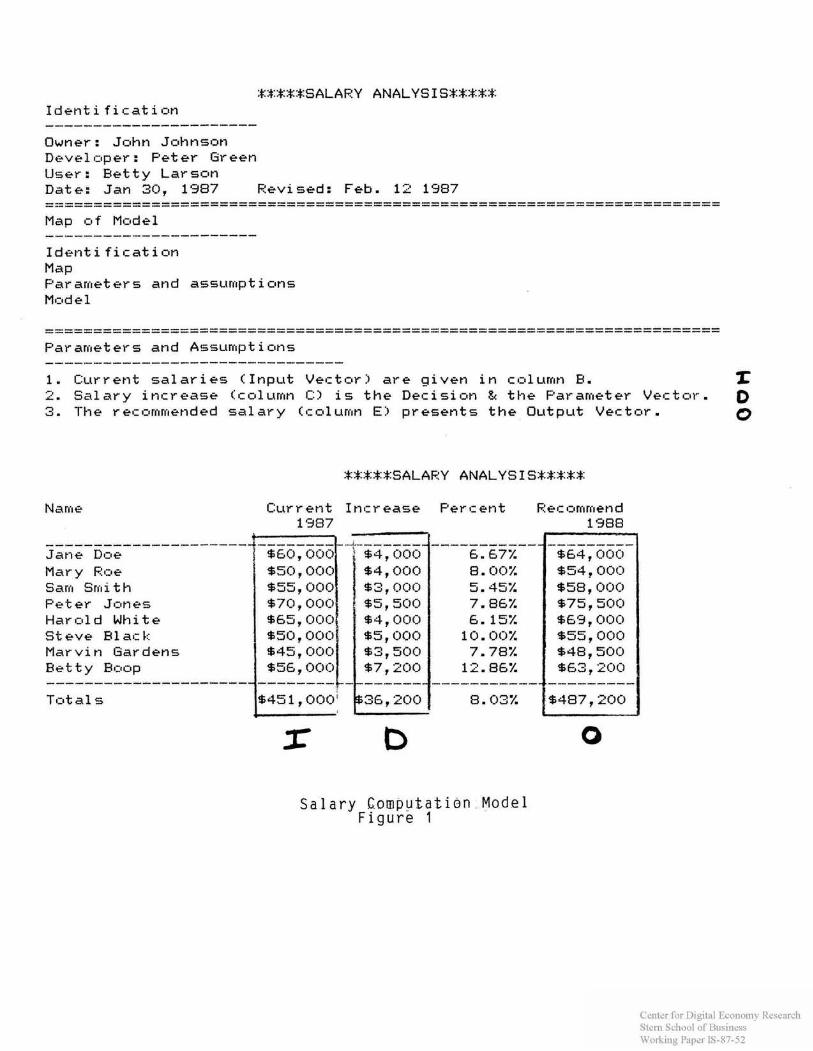
As an example, consider Figure 1 which is the printout
of a simple spreadsheet model. Figure 1 is a salary
calculation model; the decisionmaker enters an increase
amount, and the percentage of the 1987 wage the increase
represents is calculated in the third column. Total
increases and the percentage of total 1987 compensation they
represent are computed in the Totals row.
Suppose that the decisionmaker is told that wage
increases in his department can average 8% for 1987. This
model allows him to enter different increases for
individuals, observe the individual's percentage increase
Center for Digital Economy Research Stem School of Business IVorking Paper IS-87-52
and at the same time view the impact of all increases on the
"bottom linen represented by the totals. In this instance,
the decisionmaker has stopped having reached a departmental
aggregate wage increase of 8.03%
Once this model has been constructed, the only input
needed by the decision maker is to enter dollar amounts in
the column labeled @lIn~rease.~ The alternative to a
spreadsheet model is pencil, paper and calculator; each time
a new salary increase is entered, the totals must be
manually recomputed. One of the authors used to use a
calculator for this process and developed the model in
Figure 1 as his first spreadsheet application. He reports
that the time to figure raises fell by a factor of at least
five using the model.
Spreadsheets offer a tremendous amount of analytical
power. Most users of spreadsheets develop the models
themselves. Another attraction of both microcomputers as
well as this type of software is that the user is no longer
dependent on the information services staff. Especially for
quick, infrequently used applications such as the one in
Figure 1, it would take far too long to create an
application on a mainframe or mini through the information
services department.
Overview
This paper recommends a structured approach to the
design of spreadsheet models. Topics covered include the
differences between spreadsheets and traditional information
Center for Digital Economy Research Stem School of Business IVorking Paper IS-87-52
processing applications. The paper then suggests that
different types of design contexts influence the degree of
structure appropriate in spreadsheet design. The life cycle
of a spreadsheet is presented along with a block structure
format for these models. The paper introduces spreadsheet
flow diagrams (SFDs) as one approach to designing these
models. The paper concludes with suggestions for menu
designs for spreadsheets.
DESIGN METHODOLOGY
The Problem
Spreadsheet packages and micros have extended computing
to vast numbers of individuals. For many users, the
spreadsheet program represents the first "hands onv
experience with a computing device, programming and
documentation. In general, these users have not been trained
to undertake systems analysis and tend to overlook the
concerns of the professional systems analyst in designing a
system, such as reliability, auditability and control. In
fact, the spreadsheet user is often happy to avoid systems
professionals.
Unfortunately, user independence comes at a potentially
high cost. The practitioner literature has discussed a
number of problems with spreadsheet construction (Bryan,
1986 and Grushcow, 1985). Examples of frequently cited
errors are mistakes in logic, incorrect ranges in formulae,
incorrect cell references, confused range names, incorrectly
Center for Digital Economy Research Stem School of Business IVorking Paper IS-87-52
copied formulae, incorrect use of formats and column widths,
accidentally overwritten formulae and misuse of built-in
functions. Table 1 describes some of the problems found
with spreadsheets.
Desisn Obi ectives
To minimize the probability and severity of the
problems in Table 1, the designer of a spreadsheet should be
concerned with the following issues: 1) A spreadsheet
should produce reliable results; the output it generates
should be correct and consistent. 2) A spreadsheet should
be capable of being audited; the user should be able to
retrace the steps followed to generate different outputs
from the model to understand the model and to verify
findings. 3) A spreadsheet should be capable of being
modified easily without introducing errors.
A final issue impacts the three listed above:
comprehensibility. The designer and user should be able to
easily understand the model and its assumptions as
represented in the spreadsheet.
Spreadsheets and Traditional IS
Spreadsheets are a type of information system, though
they are most often not developed by information systems
professionals. The IS professional is (or should be)
concerned with the issues described above in designing any
information system. One reason for lengthy development
times for multiuser systems designed by professionals is
Center for Digital Economy Research Stem School of Business IVorking Paper IS-87-52
concerns about data integrity, input editing and error
checking.
Since the spreadsheet developer is often a user who is
basically unfamiliar with the design principles above, ad
hoc design is common. There tends to be little concern with
formal analysis or documentation, Often the spreadsheet
model is a one-time exercise or an infrequently used
decision support system (DSS). Formal design methods slow
progress on ttquicktt systems.
A structured approach to spreadsheet design can help
reduce the probability and severity of problems with
spreadsheets. To be useful, a spreadsheet design approach
must help achieve the objectives for these models described
above, must achieve results quickly, and must be suited to
the style of the end user. Table 2 describes the
characteristics of spreadsheet applications and the
implications of these characteristics for design.
Because of the wide variety of use for spreadsheet
models, it is very difficult to construct a design
methodology that will be generally applicable. This paper
proposes a structured approach to design the use of which is
contingent on the type of model being developed.
SPREADSHEET ANALYSIS AND DESIGN
Types of Applications
Spreadsheets are distinguished by the variety of
applications for which they have been used. The most
Center for Digital Economy Research Stem School of Business IVorking Paper IS-87-52
frequent use of spreadsheets is for decision support and
personal productivity, but there have also been many
spreadsheet applications which could be considered
mainstream information systems applications. For example, a
firm might do all of its financial statement consolidation
for its subsidiaries using a spreadsheet package. Before
this software was available, the firm might have written
COBOL programs or purchased a dedicated package to produce
financial statements.
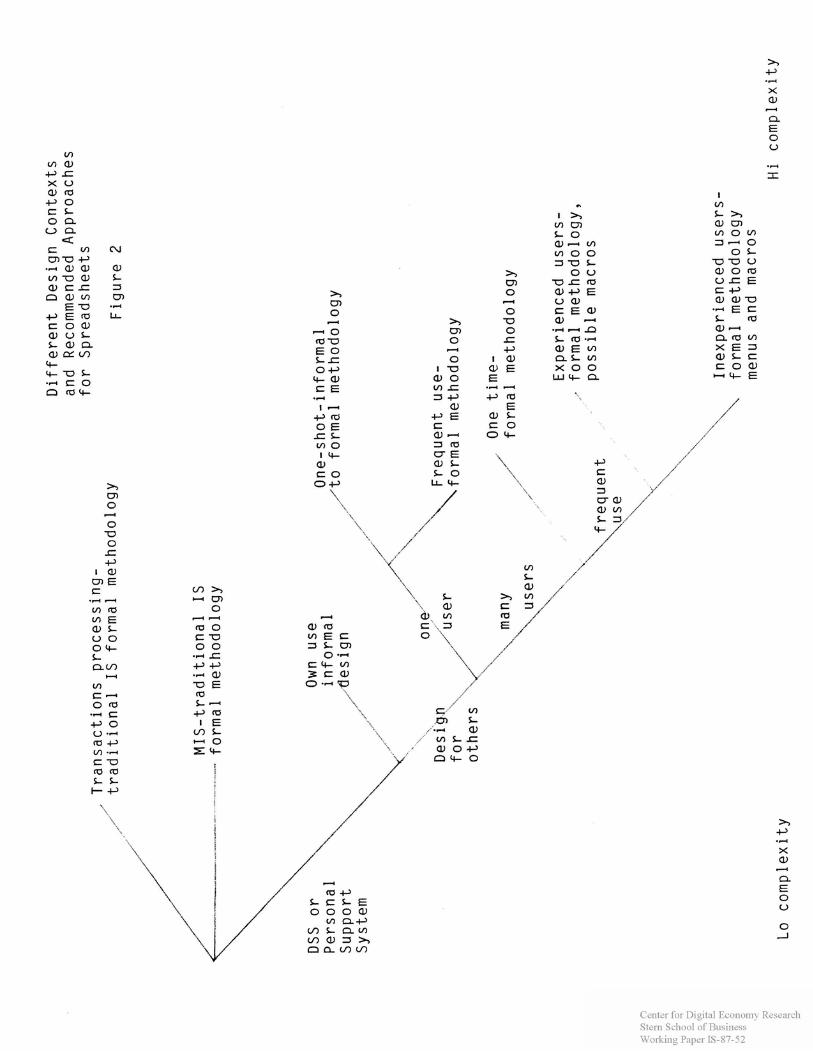
Figure 2 depicts the design context for spreadsheets.
If the spreadsheet is to be used for a traditional
transactions processing or information processing task, then
one could argue that it should be designed using normal
information services methodologies like structured design,
data flow diagrams, etc. ; (see Lucas, 1985) . However, it is
unlikely that such formal design will be used. The
techniques presented below are an alternative to completely
informal, ad hoc design for systems professionals as well as
end users.
In the DSS environment, it is important to consider
whether or not the developer is also the user. If the user
develops his or her own model for a one shot decision, then
informal design procedures are probably satisfactory. It is
also unlikely that anyone can convince the user in these
circumstances to adopt any other approach! If the one-shot
decision is crucial to the organization, it might be useful
Center for Digital Economy Research Stem School of Business IVorking Paper IS-87-52
to at least have someone other than the designer audit the
model.
If a user is developing his or her own application and
plans to use it frequently, then the analysis approach
suggested later in this paper should be considered.
When the developer is not the primary user, then it is
recommended that a formal design methodology be employed.
Even if the system is to be used for a one-shot decision,
the fact that the spreadsheet is being designed for someone
else suggests that the decision is either very important or
the model is complex; either condition warrants the use of a
formal approach to design.
Appplications that will be used frequently by many
users are candidates for formal design, macros and menus.
If users are experienced and understand the package, macros
and menus may be an extra option. However, if users are
inexperienced, menus and macros are needed to help the user
execute the model and to protect the spreadsheet.
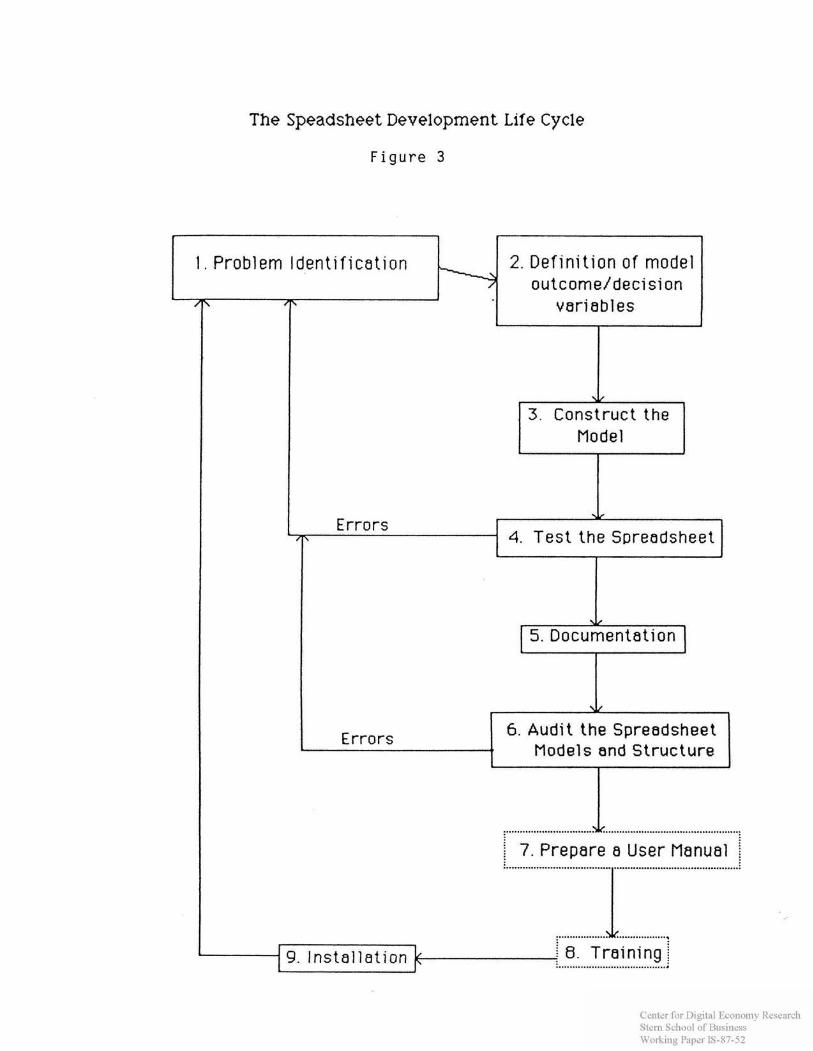
The Spreadsheet Development Life Cvcle
Texts on systems analysis and design usually include a
systems development life cycle. (See Lucas,1985.) It is
possible to develop a similar life cycle for spreadsheet
applications, though the life cycle must be flexible to
reflect the different contexts for spreadsheet design
described above. (See Figure 3.)
Center for Digital Economy Research Stem School of Business IVorking Paper IS-87-52
1. Problem Identification
The designer defines the nature of the problem to be
solved. How is the problem currently solved if at all?
What are the performance bottlenecks? This stage is similar
to the "existing systems studyfg of the systems development
life cycle. How will a spreadsheet model help solve the
problem? What are the sources of information?
a. Cost benefit analysis.
What is a reasonable time frame for model development?
What kind of application is this, e.g. is it a one-shot
decision model or a model that will be used many times?
What resources should be put into development?
b. "Make or buytt analysis.
The designer should conduct research to determine if an
existing template can be purchased for this
application. There are a number of such templates for
income tax calculations, rental analysis, real estate
investments, etc.
2. Definition of model outcome/decision variables.
The spreadsheet is usually developed to produce some
type of results like a net present value for an investment,
a yearly estimate of profits, the deviation of actual from
budgeted expenses, or a set of financial statements. The
outcome variable needs to be defined. The designer may have
variable which represents a decision such as the dollar
raises granted to each employee in Figure 1.
Center for Digital Economy Research Stem School of Business IVorking Paper IS-87-52

a. Define how the outcome is generated.
This part of the model represents the calculations
which are undertaken in the model.
b. Define the block structure of the model.
A recommended model structure is presented later in
this paper.
c. Define menus/macros (optional)
If the model will have menus and macros, the designer
should describe their function at this point.
3. Construct the model
This stage corresponds to the traditional notion of
programming. Using the various commands of the spreadsheet
language, build the model. When the model is large, use a
top down approach in which building blocks are constructed
and then filled in with details.
a. Build macros and menus (optional)
Depending on the type of applications, the developer
may want to include menus and macros.
4. Test
Carefully test the results of the model. Print a hard
copy of the model and the cell formulae. Check all
calculations independently from the spreradsheet. Test both
historical and extreme input data. Examine the spreadsheet
to see if there is an audit trail; can someone follow
through the assumptions to determine how a cell's value was
determined, or is too much hidden in formulae? Look for
Center for Digital Economy Research Stem School of Business IVorking Paper IS-87-52
formatting errors which might result in the unintentional
rounding of percentages or multipliers.
5. Documentation
Document the spreadsheet on the spreadsheet, itself,
That is, include text on the spreadsheet that explains the
model as shown later in the paper.
6. Audit
Review the model and its structure. Consider the use
of audit packages to trace through formulae.
7 . Prepare a user manual (optional)
For systems designed for others to use, a manual is a
necessity. For applications created by the user, a manual
is valuable if the application is to be used more than once.
8. Training (optional)
If the model is to be used by others, they need to be
trained prior to installation.
9. Installation.
Prepare the spreadsheet for use, for example, by
installing it on a users computer so that the model loads
whenever the spreadsheet program is started.
The next section of this paper suggests a block
structured format for a spreadsheet model. Then the paper
introduces the concept of Spreadsheet Flow Diagrams as a
structured design aid. Finally, the paper concludes with a
discussion of how to design menus for spreadsheets.
Center for Digital Economy Research Stem School of Business IVorking Paper IS-87-52

Model Format
Figure 4 presents a recommended structure for a
spreadsheet. similar designs have been proposed in Grupe
(1985) and Berry (1985). The purpose of the structure is to
separate parts of a spreadsheet into blocks to reduce the
potential for errors. A well structured spreadsheet also
clarifies the assumptions of the model to users.
Figure 4 contains a number of blocks which taken
together comprise the spreadsheet model. The identification
block presents the name of the developer, user and the name
of the model. It also contains a list of revision dates.
To the right of the identification block one finds the
macros/menus block. Macros and menus must be isolated from
parameters and formulae because the insertion or deletion of
a row in a model could delete a line or insert a blank line
in a macro causing quite anomalous behavior when the macro
is executed.
Immediately below the identification block is a map or
index to the spreadsheet. It contains a description of
where the various blocks may be found and acts like a table
of contents for the model.
The large documentation block allows the spreadsheet
developer to describe in general terms how the model works
and to annotate various rows in the model, itself.
The parameter block contains variables which are used
in the formulae. For example, one would place interest
rates, assumptions about sales growth rates, and so on in
Center for Digital Economy Research Stem School of Business IVorking Paper IS-87-52

the parameter block. A good rule to follow is that no
formula should contain a number; there should only be
references to parameters or cells in the worksheet. If this
rule is followed, there is little danger of
misinterpretation because a crucial parameter is hidden in a
formula. Looking over multiple runs of the model, the user
will be able to see what assumptions pertain to each run,
for example, it will be clear what interest rate was used on
each model run by examining the parameter block for the
interest rate parameter.
The final block in the spreadsheet is the model,
itself. The spreadsheet packages with their row and column
references suggest a view of the model as a matrix. Certain
columns or rows of the matrix (possibly a single cell) might
be interpreted as input or output vectors.
Spreadsheet Flow Diaqrams
The notion of Data Flow Diagrams (DFD) has proven
popular in traditional systems analysis and design as a way
to encourage structured, top down design and to reduce
complexity (Gane and Sarson, 1979, DeMarco, 1979). This
paper proposes the use of Spreadsheet Flow Diagrams (SFD)
for the analogous purpose with spreadsheets. For many
spreadsheets there will be no need to follow a top down
approach because the model will be simple. However, for
large spreadsheets, the notation allows and encourages the
use of top down design approaches.
Center for Digital Economy Research Stem School of Business IVorking Paper IS-87-52
Why not just use existing DFD notation? DFDs were
designed for transactions processing systems; they are
excellent for showing sources, flows and processing of data.
The spreadsheet is less concerned with the flow of data than
it is with modeling relationships. Even a low level DFD
might only indicate lfPost Receivablesw to denote a process
that most designers and users would understand. Spreadsheet
analysis and design needs a notation that shows the
"alg~rithrn*~ or the underlying formulae of the model.
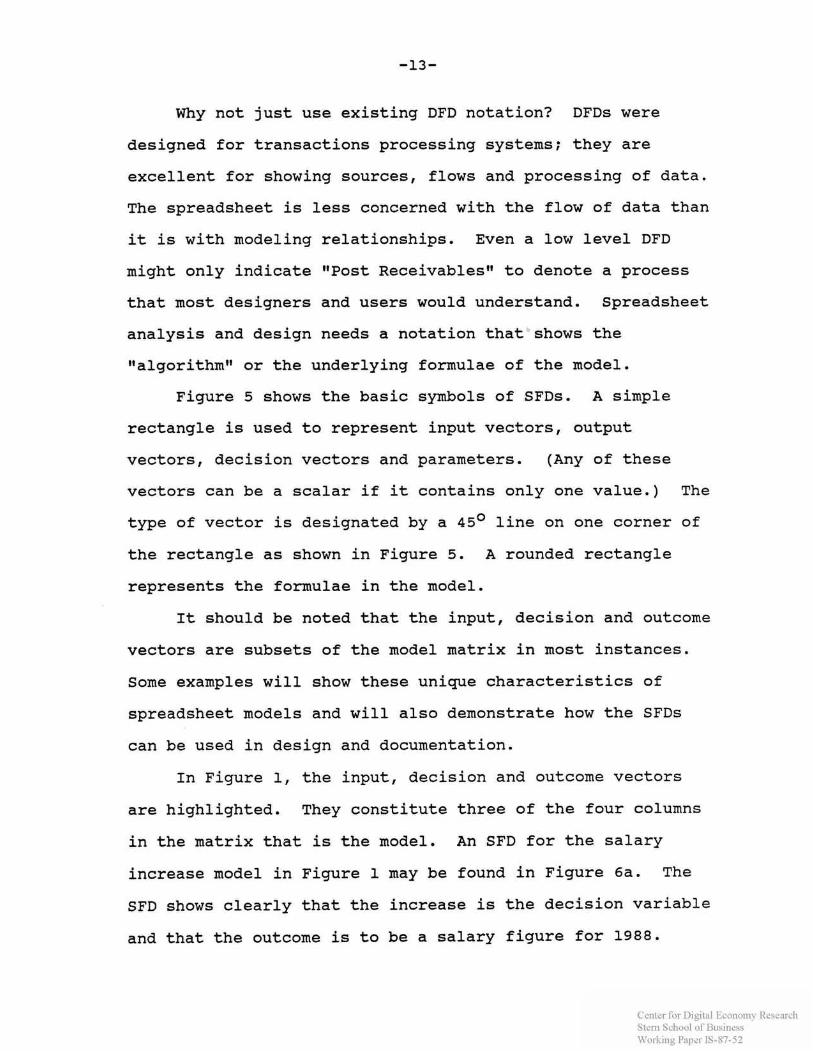
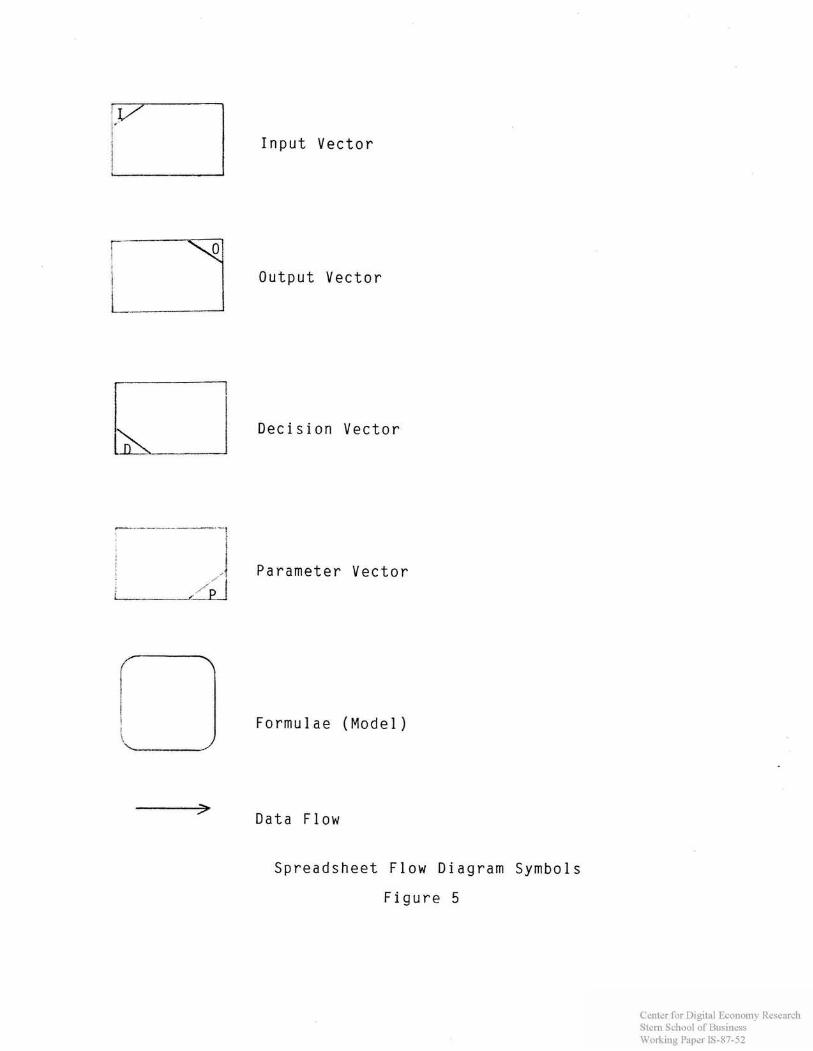
Figure 5 shows the basic symbols of SFDs. A simple
rectangle is used to represent input vectors, output
vectors, decision vectors and parameters. (Any of these
vectors can be a scalar if it contains only one value.) The
type of vector is designated by a 45O line on one corner of
the rectangle as shown in Figure 5. A rounded rectangle
represents the formulae in the model.
It should be noted that the input, decision and outcome
vectors are subsets of the model matrix in most instances.
Some examples will show these unique characteristics of
spreadsheet models and will also demonstrate how the SFDs
can be used in design and documentation.
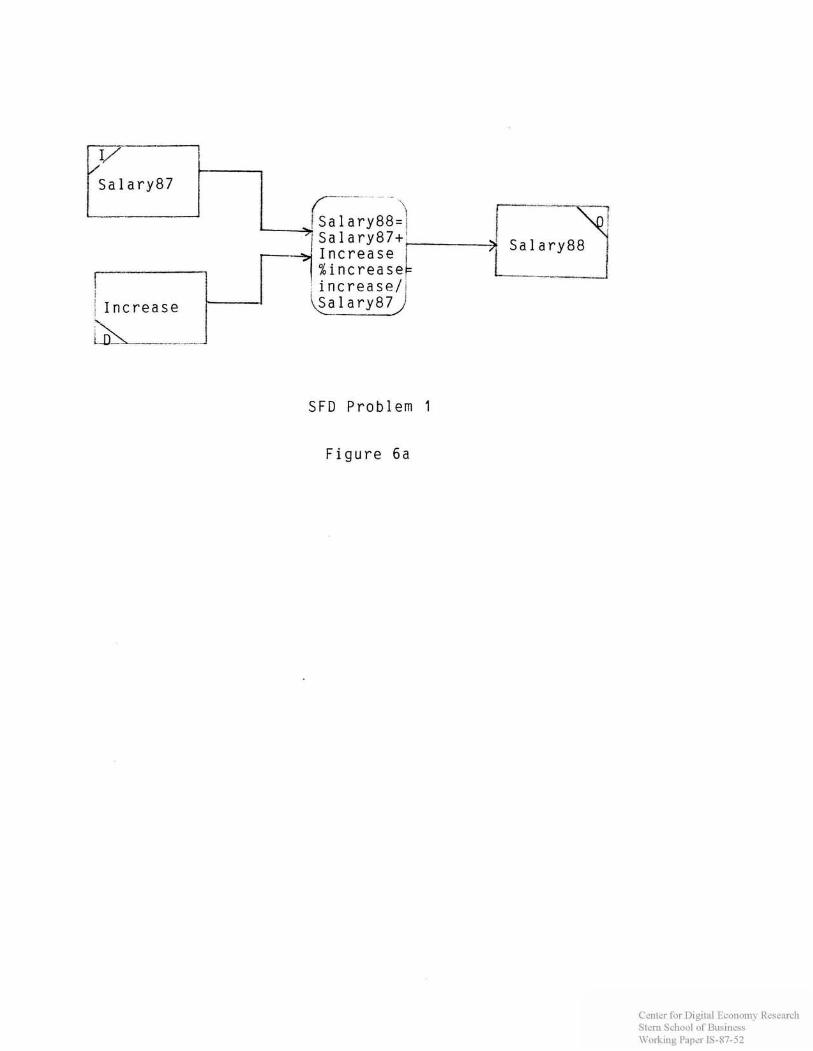
In Figure 1, the input, decision and outcome vectors
are highlighted. They constitute three of the four columns
in the matrix that is the model. An SFD for the salary
increase model in Figure 1 may be found in Figure 6a. The
SFD shows clearly that the increase is the decision variable
and that the outcome is to be a salary figure for 1988.
Center for Digital Economy Research Stem School of Business IVorking Paper IS-87-52

While this decision vector may seems obvious, approximately
50% of students assigned this problem end up using the
percentages as the decision vector and awarding raises like
$2432!
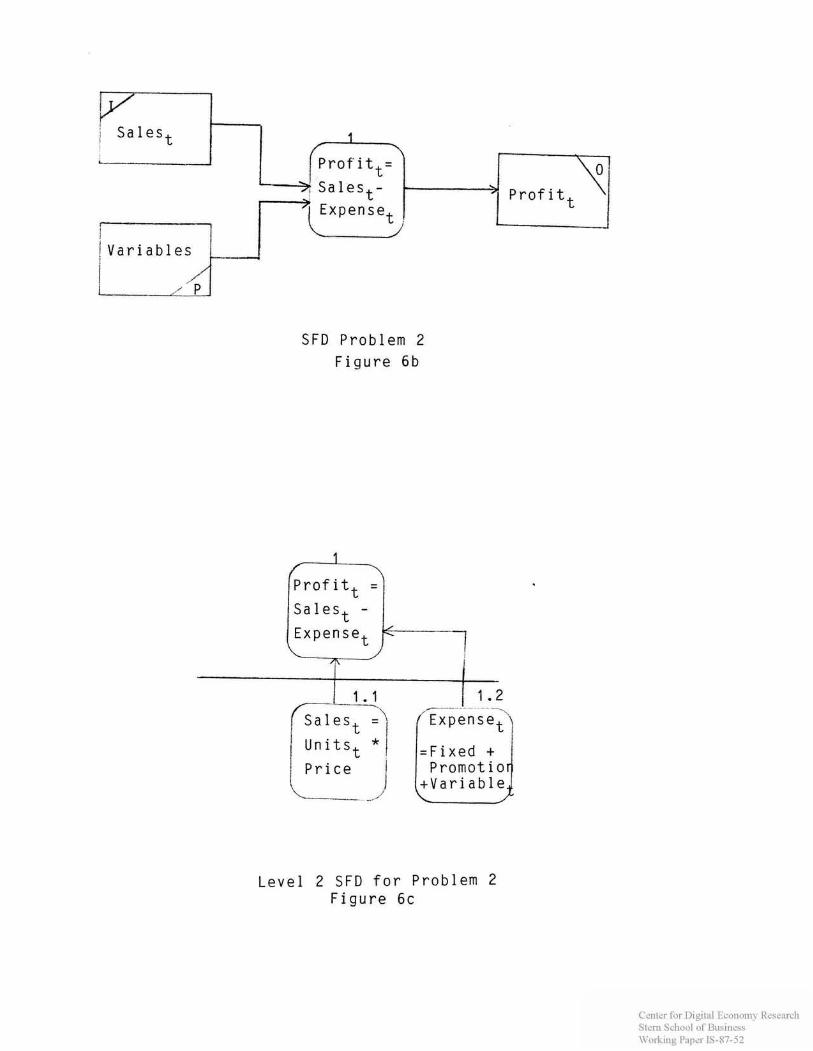
Figure 7 presents a typical spreadsheet application for
predicting sales of a new product and Figure 6b is a high
level SFD for the model. The input vector has a subscript
*Itw to show that the model is predicting values over a time
period. Because it is easier to understand, the model
diagram shows profits as being sales less expenses. The
model box (labeled 1) in Figure 6b is exploded into a lower
level of detail in Figure 6c.
Figure 8 contains the final example, a grading program;
the corresponding SFD may be found in Figure 6d. Here there
are m students with n grades. The model weights the grades
to provide a final average and grade for each student. The
instructor also is interested in the mean, variance and
standard deviation of the scores on each assignment. The
subscripts m and n used in the SFD clarify the requirements
of the model.
The advantage of using a structured notation for
spreadsheets is the same as the advantage of using a
notation like Data Flow Diagrams for traditional systems
analysis and design. SFDs help the designer structure the
design of the problem. They assist in communicating the
structure of a model to others and they serve as
Center for Digital Economy Research Stem School of Business IVorking Paper IS-87-52
documentation when it is necessary to audit or modify the
spreadsheet.
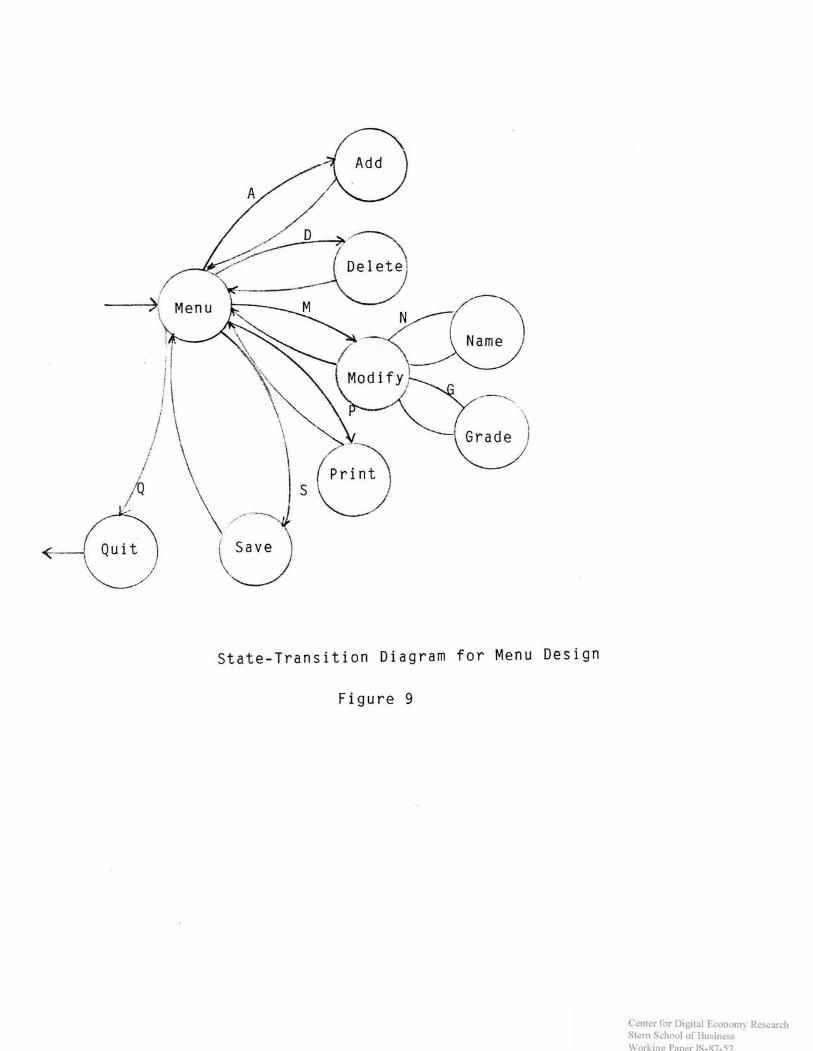
Menu Desisn
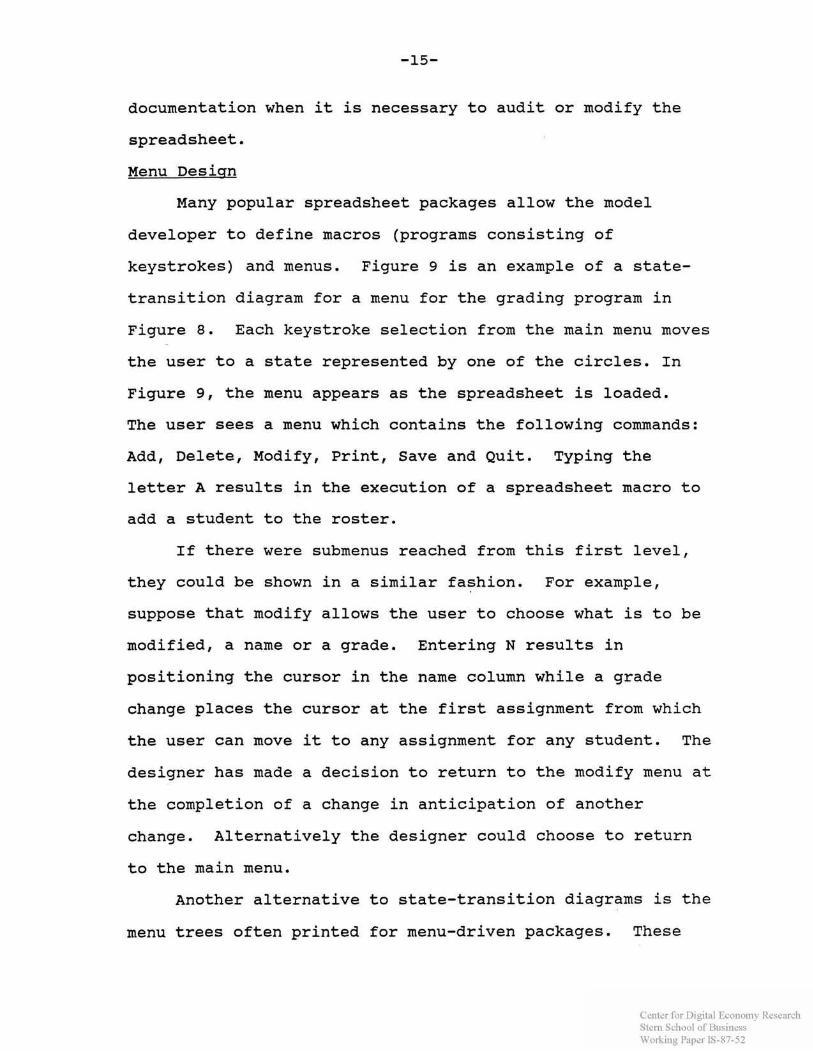
Many popular spreadsheet packages allow the model
developer to define macros (programs consisting of
keystrokes) and menus. Figure 9 is an example of a state-
transition diagram for a menu for the grading program in
Figure 8. Each keystroke selection from the main menu moves
the user to a state represented by one of the circles. In
Figure 9, the menu appears as the spreadsheet is loaded.
The user sees a menu which contains the following commands:
Add, Delete, Modify, Print, Save and Quit. Typing the
letter A results in the execution of a spreadsheet macro to
add a student to the roster.
If there were submenus reached from this first level,
they could be shown in a similar fashion. For example,
suppose that modify allows the user to choose what is to be
modified, a name or a grade. Entering N results in
positioning the cursor in the name column while a grade
change places the cursor at the first assignment from which
the user can move it to any assignment for any student. The
designer has made a decision to return to the modify menu at
the completion of a change in anticipation of another
change. Alternatively the designer could choose to return
to the main menu.
Another alternative to state-transition diagrams is the
menu trees often printed for menu-driven packages. These
Center for Digital Economy Research Stem School of Business IVorking Paper IS-87-52
menu trees look like organization charts and communicate the
same information as found in Figure 9. However, they are
less clear about the return point from each command issued
than the state-transition diagram.
SUMMARY
This article has argued for greater structure and care
in the design of spreadsheet information systems. The paper
first explored some of the problems with spreadsheet design
and the differences between the design of traditional
information processing applications and spreadsheet models.
The major contribution of this research are the
following:
1. Guidelines for differing levels of formal design and
the appropriate use of menus and macros in spreadsheet
design.
2. A suggested systems development life cycle for
spreadsheets.
3. A block-structured format for spreadsheet models.
4. Spreadsheet Flow Diagrams.
5 . Menu and macro design aids.
Spreadsheet packages have made a major contribution to
analysis and problem solving. The importance of the
decisions entrusted to spreadsheet modeling and the
pervasive use of these packages suggests that end users and
developers of these models need to be concerned with good
practice in spreadsheet analysis and design.
Center for Digital Economy Research Stem School of Business IVorking Paper IS-87-52
REFERENCES
Ahituv, N. and Neumann, S. (1985). Information Systems for Manasement, Dubuque, Iowa: Wm. C. Browne, Second Edition.
Ariav, G. and Ginsberg, M. (1985). "DSS design, a systematic view of decision support88, Communications of the ACM, 28, 10, pp. 1045-1052.
(1986). "Methodology for DSS analysis and design: a contingency approach to their appli~ation~~, Proceedinss of the International Conference on Information Systems.
Berry, T. (1986). "How to structure spreadsheet^^^, Business Software, October, 1986, pp. 56-58.
Bryan, M. (1986). "Are your spreadsheets lying to you?88, Business Software, October, 1986, pp. 59-64.
Demarco, T. (1979). Structured Analvsis and System S~ecification. Englewood Cliffs, Prentice Hall.
Gane, C, and T. Sarson. (1979). Structured Systems Analysis. Englewood Cliffs, Prentice Hall.
Grupe, F. (1985). "Tips for better worksheet documentation^, Lotus, August, 1985, pp. 68-70.
Grushcow, J. (1985). "Avoid these common spreadsheet errors88, Lotus, July, 1985, pp. 59-62.
LeBlond, G. and D.Cobb (1986). Using 1-2-3. Indianapolis, IN: Que Corporation, Second Edition.
Lucas, H.C., Jr. (1985). The Analysis, Desisn, and Imwlementation of Information Systems, 3rd. ed., New York: McGraw -Hill.
McGrath, 3. (1986). I8PC8s can't add - but you can teach them tovt, Business Software, September, 1986, pp. 58-59.
Center for Digital Economy Research Stem School of Business IVorking Paper IS-87-52
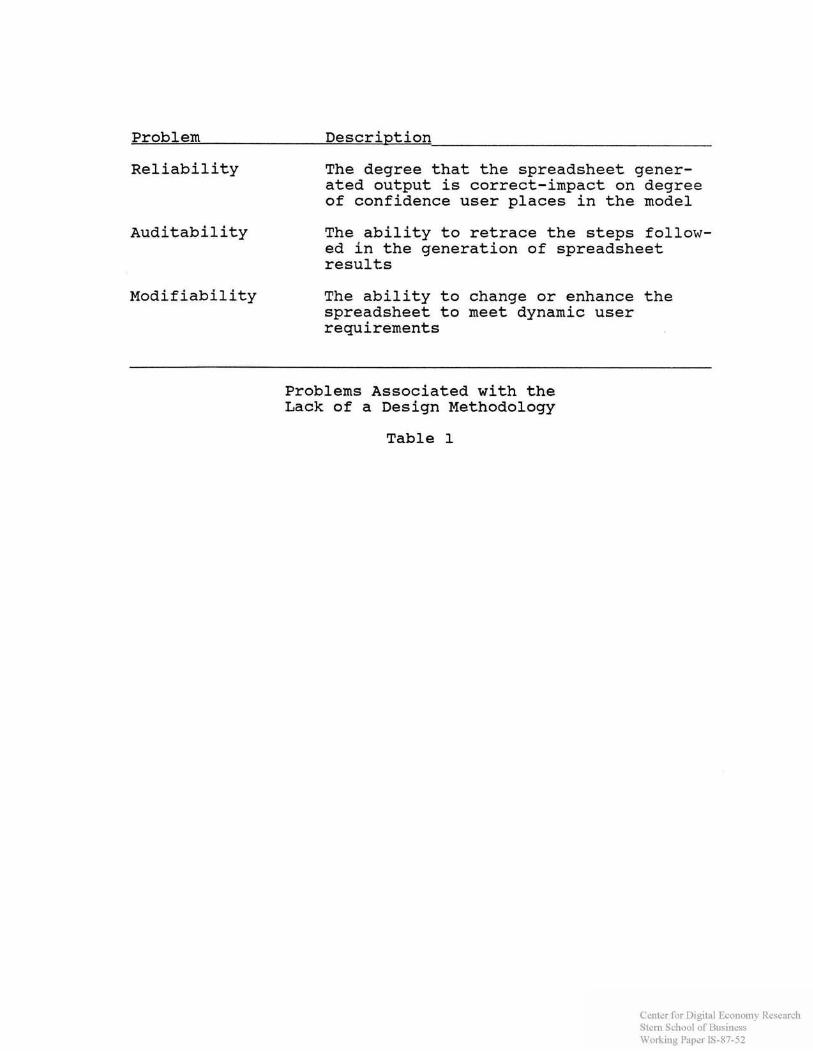
Problem Description
Reliability The degree that the spreadsheet gener- ated output is correct-impact on degree of confidence user places in the model
Auditability The ability to retrace the steps follow- ed in the generation of spreadsheet results
Modifiability The ability to change or enhance the spreadsheet to meet dynamic user requirements
Problems Associated with the Lack of a Design Methodology
Table 1
Center for Digital Economy Research Stem School of Business IVorking Paper IS-87-52

Attribute Spreadsheets Implications
Users Non professional users often are designers of spreadsheets
Development Relatively Short
Modifiability Easy
Life cycle Short
Context Variety of situations
User does not realize problems with ad hoc approaches Assumes no need for a methodology
Attitude of no need or no time for a formal approach
May convince user to disregard formal analysis
Formal techniques seen as useless
Difficult to build a methodology suitable to all contexts
Characteristics of Spreadsheet Analysis and Design
Table 2
Center for Digital Economy Research Stem School of Business IVorking Paper IS-87-52
$::$::$:g:t:SALARY ANALYS 1 S:t:$::$:%:$ I d e t i t i f ica t i l s l t i ...................... Owner : J~=thti J o h t i s ~ ~ t i Devel s p e r : P e t e r Gr eeti U s e r : B e t t y La r scgti D a t e : J a n 30, 1 9 8 7 R e v i s e d : Feb. 1 2 1987 ...................................................................... ....................................................................... Map I=I f Mudel --.----- --.-- ---- ------- I d e t i t i f i c a t i o n Map P a r arfiet er 5 and a s sumpt i c~ t i s M~z~del
...................................................................... ...................................................................... P a r ariiet er si and Assumpt i ut is
1. C u r r e n t sa la r ies ( I n p u t V e c t c ~ r l are g i v e n i n column B. I: 2. S a l a r y i t i c r e a s e Ccc~lurnti 1::) is t h e D e c i s i ~ ~ t i & t h e F'ararlseter V e c t o r . 0 3. The rec~s~mmetided s a l a r y (cml urnti ES p r e s e n t s t h e O u t p u t V e c t o r . 0
N a m e C u r r e n t I n c r e a s e P e r c etit Recomrftetid 1987 1988
--.---- ------.--------- ----------- Jar te Dcte 6. G 7 % Mary Rc~e 8. 00% Sartt Srs~i t h 5.45% F'et er Jcsties 7.86% H a r o l d Whi t e 6 .15% S t e v e B lack 10. 0(2% Marvin G a r d e n s 7.78% B e t t y E~tclp 12.86% ---.------------------ ----------- Tota l s 8.03%
S a l a r y C o m p u t a t i o n Model Figure 1
Center for Digital Economy Research Stem School of Business IVorking Paper IS-87-52
The Speadsheet Development Life Cycle
Figure 3
Center for Digital Economy Research Stem School of Business IVorking Paper IS-87-52
I . Prob lem I d e n t i f i c a t i o n 2. D e f i n i t i o n o f model outcorne/decis ion
A A I
var iab les
V
3. Const ruc t the Model
J
Er ro rs v
A 4. T e s t t h e Spreadsheet &
W
5. Documenta t ion
v
Er ro rs 6. Aud i t t he Spreadsheet Models and S t r u c t u r e
................................................................................... 1' j 7. Prepare a User Manual i
................................................................................... *:
; 1 : ...................................... ; 8. T ra i n i ng i .........................................

Identification Owner Developer
Macros
Menus User I Date Rev i sed
Map of model
Parameters (Assumptions)
Model Formulae/Matrix Input Vector(s) Decision Vector s) c. Parameter Vecto (s) Output Vector(s)
Recommended Spreadsheet Structure
Figure 4
Center for Digital Economy Research Stem School of Business IVorking Paper IS-87-52
- 1 Input Vector
1 I output Vector
Decision Vector
i i
Parameter Vector
i Formulae (Model)
Data Flow
Spreadsheet Flow Diagram Symbols
Figure 5
Center for Digital Economy Research Stem School of Business IVorking Paper IS-87-52
Increase
SFD Problem 1
Figure 6 a
Center for Digital Economy Research Stem School of Business IVorking Paper IS-87-52
SFD Problem 2 Figure 6b
/ Price 1 Promot io \
Level 2 SFD for Problem 2 Figure 6 c
Center for Digital Economy Research Stem School of Business IVorking Paper IS-87-52

-. -I___ _-- _-_-
Final, h, ? I
S F D P r o b l e m 3
F i g u r e 6d
Center for Digital Economy Research Stem School of Business IVorking Paper IS-87-52
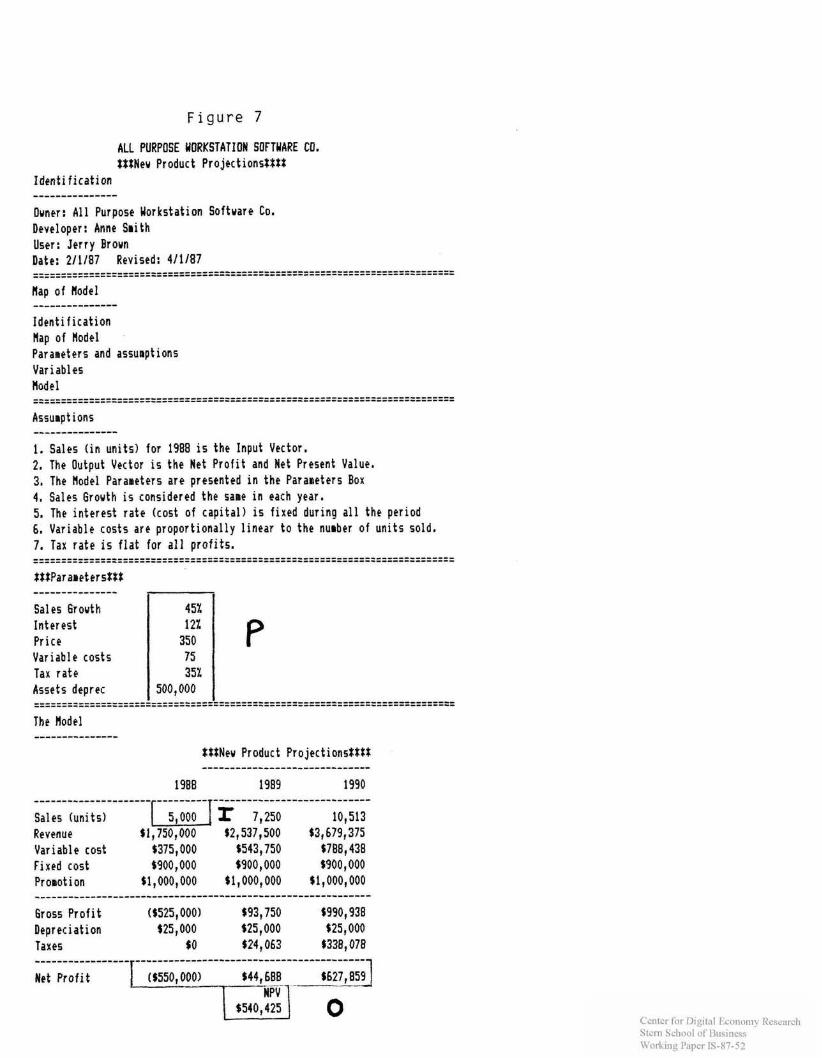
Figure 7
ALL PURPOSE WORKSTATION SOFTWARE CO. $$$New Product Project ionstStS
Identification --------------- Owner: All Purpose Workstation Software Co. Developer: Anne Smith User: Jerry Brown Date: 211187 Revised: 411187 ........................................................................... ........................................................................... Hap of Hodel --------------- Identification Hap of Hodel Paraaeters and assuapt ions Variables Hodel ........................................................................... ........................................................................... Assumpt ions --------------- 1. Sales ( in uni ts) for 1988 is the Input Vector. 2. The Output Vector is the Net Profit and Net Present Value, 3, The Hodel Parameters a re presented in the Paralseters Box 4, Sales Growth i s considered the same in each year. 5. The interest ra te (cost of capi tal) is fixed during a l l the period 6. Variable costs are proportionally linear t o the nurber of uni ts sold, 7. Tax r a t e is f l a t for a l l profi ts . ........................................................................... ........................................................................... SS?PararetersSSf --------------- Sales Growth Interest Price Variable costs Tax r a t e Assets deprec ------------------. ------------------- The Hodel -------..-------
---------------- Sales (uni ts) Revenue Variable cost Fixed cost Prolsot ion
$$$New Product Project ions%%?$ ..............................
1988 1989 1990 ----- ............................ 1 5,000 ir 7,250 10,513 $1,750,000 $2,537,500 $3,679,375 $375,000 $543,750 $798,438 $900,000 $900,000 $900,000
$1,000,000 $1,000,000 ~1,000,000
6105s Profi t ($525,000) $93,750 $990,938 Depreciation $25,000 $25,000 $25,000 Taxes $0 $24,063 $338,078
Het Profi t 8 $627,84 v1---
Center for Digital Economy Research Stem School of Business IVorking Paper IS-87-52
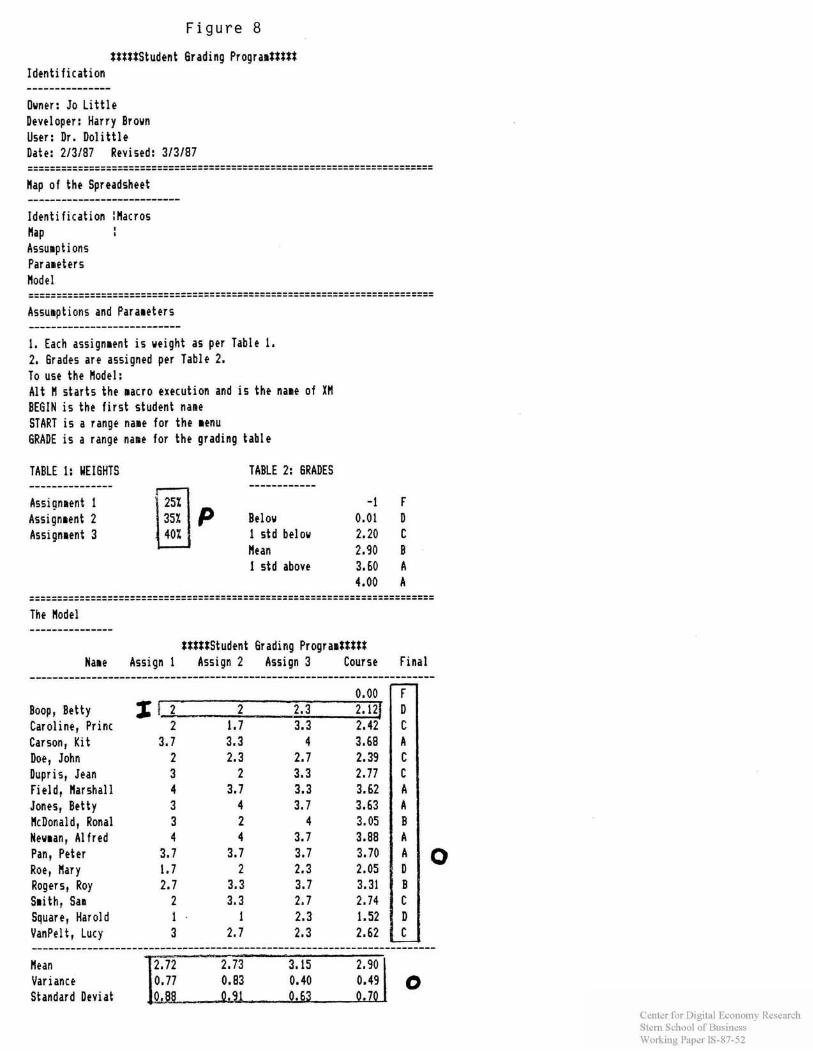
Figure 8
SSttSStudent Grading ProgramSSSSS Identification --------------- Owner: Jo L i t t l e Developer: Harry Brown User: Dr. Doli t t le Date: 213187 Revised: 3/3/87 ........................................................................ ........................................................................ Hap of the Spreadsheet ........................... Identification :Hacros Hap I I
Assump t i ons Par ameter s Hodel ........................................................................ ........................................................................ Assumpt ians and Parameters
1. Each assignment is weight a s per Table 1. 2. 6rades are assigned per Table 2. To use the Hodel: Alt H s t a r t s the macro execution and is the nare of XH BEGIN is the f i r s t student nare START is a range name for the menu GRADE i s a range name for the grading table
TABLE 1: HEIGHTS TABLE 2: GRADES --------------- ------------ Assiqnrent 1 -1 F Assignment 2 p elo ow 0.01 D Assignment 3 1 s td below 2.20 C
Hean 2.90 B 1 s td above 3.60 A
4.00 A ........................................................................ ........................................................................ The Hodel *--------------
SSSStStudent Grading ProgramtSStS Name Assign 1 Assign 2 Assign 3 Course Final
........................................................................
Boop, Betty Caroline, Princ
x Carson, Kit Doe, John Dupris, Jean Field, Harshall Jones, Betty HcDonald, Ronal Neuman, A1 fred Pan, Peter Roe, Hary
0 Rogers, Roy S ~ i t h , Sam Square, Harold VanPel t , Lucy ........................................................................ Hean Variance Standard Deviat
Center for Digital Economy Research Stem School of Business IVorking Paper IS-87-52
4 q u i t ) f- s a v e ) i i
State-Transition Diagram f o r M e n u D e s i g n
F i g u r e 9
Center for Digital Economy Research Stem School of Business IVorking Paper IS-87-52