Spray Away Allergies Modeling Intranasal Drug Delivery · Particle Tracing module to describe the...
28
1 Spray Away Allergies – Modeling Intranasal Drug Delivery BEE 4530 Computer Aided Engineering By: Michelle Chau Pimkhuan Hannanta-Anan Oleh Krupa Jack Yi May 3 rd , 2012
Transcript of Spray Away Allergies Modeling Intranasal Drug Delivery · Particle Tracing module to describe the...

1
Spray Away Allergies – Modeling Intranasal Drug Delivery
BEE 4530
Computer Aided Engineering
By:
Michelle Chau
Pimkhuan Hannanta-Anan
Oleh Krupa
Jack Yi
May 3rd
, 2012

2
Table of Contents
1. EXECUTIVE SUMMARY .......................................................................................... 3
2. INTRODUCTION ...................................................................................................... 4-5
2.1 DESIGN OBJECTIVES .............................................................................................................. 5
3. PROBLEM FORMULATION
3.1 TERMS DEFINED ............................................................................................................................. 5
3.2 SCHEMATIC ................................................................................................................................. 5-6
3.3 MESH .................................................................................................................................................. 7
3.4 GOVERNING EQUATIONS ........................................................................................................... 7-8
3.5 BOUNDARY CONDITIONS ............................................................................................................... 8
3.6 ASSUMPTIONS .................................................................................................................................. 8
3.7 INPUT PARAMETERS ................................................................................................................ 9-10
3.8 MASS TRANSPORT FORMULATION ..................................................................................... 10-11
4. RESULTS AND DISCUSSION
4.1 RESULTS .................................................................................................................................. 11-13
4.2 LIMITATIONS TO RESULTS ................................................................................................... 13-14
4.3 ACCURACY TEST ................................................................................................................... 14-15
4.4 SENSITIVITY ANALYSIS........................................................................................................ 15-17
5. CONCLUSIONS AND DESIGN RECOMMENDATIONS
5.1 CONCLUSION ................................................................................................................................. 18
5.2 IMPLICATIONS AND RELEVANCE ....................................................................................... 18-19
5.3 DESIGN RECOMMENDATIONS .................................................................................................... 19
5.4 DESIGN CONSTRAINTS ......................................................................................................... 19-20
6. APPENDIX A: MATEHMATICAL STATEMENT OF THE PROBLEM
6.1 FORCE EXERTED ON PARTICLES FOR EVALUATION OF PARTICLE TRAJECTORIES ......... 21
6.2 DERIVATION OF BOUNDARY CONDITION IN A NOSTRIL................................................ 21-22
7. APPENDIX B: SOLUTION STRATEGY
7.1 MESH CONVERGENCE ........................................................................................................... 23-24
8. APPENDIX C: SOFTWARE IMPLEMENTATION
8.1 PARTICLE TRACING FUNCTION ................................................................................................. 25
8.2 PARTICLE COORDINATES ........................................................................................................... 26
9. APPENDIX D: REFERENCES ............................................................................ 27-28

3
1. Executive Summary Nasal drug delivery has served as an alternative to oral and injection treatments for
respiratory ailments, such as allergies, congestion, and infection (Berger, 2004). Recent
studies have examined the role various parameters – spray particle size, flow rate in the
nasal cavity, spray injection angle, injection velocity, material properties of the particle,
and deposition mechanisms – play in alleviating nasal symptoms. It has been noted that
certain specifications lead to wasteful drug deposition and ineffective delivery to targeted
areas (Quraishi et al., 1997). Computational models are vital in optimizing these
parameters to maximize the drug’s effectiveness in the targeted sinus areas. This study
focuses on developing a computational model to describe the optimal flow rate, insertion
angle, spray cone angle, and particle size of Azelastine hydrochloride (Astelin), a
common anti-histamine drug, required to suppress an immune response while avoiding
excessive drug application.
Assuming laminar airflow, the nasal cavity was modeled in 2D and divided into four
regions: the anterior, the middle, the posterior, and escape. Using COMSOL Multiphysics
3.5a, the model implemented 2D Navier Stokes fluid flow equations and the Lagrangian
Particle Tracing module to describe the distribution of drug in the nasal cavity. The
particle deposition in the 4 regions depended on the characteristics of the particles and its
flow. To validate the model output, the average drug concentration in each nasal cavity
region was determined and compared with published numerical data analysis by
Inthavong et al. (2008). We also run a mass transport simulation to observe the change in
drug concentration in the mucosal layer over time.
Sensitivity analysis focused on average drug concentration to examine the effect of
insertion angle, flow rate, cone spray angle, and particle diameter on drug deposition in
the middle and posterior regions. Most drug particles are 50μm in size and it was
determined that for this size, the combination of a 40 L/min flow rate of a high insertion
angle of 45° and a large spray cone angle of 90° exhibited 100% optimal deposition in
the posterior and middle regions. When particle size was decreased at higher flow rates,
the majority of particles exited the outlet without depositing. For smaller sized particles, a
lower flow rate of 20 L/min combined with a lower insertion angle of 20° and same spray
cone angle of 90°, resulted in an optimal particle deposition of 64%.
These findings will allow future designs of nasal sprays to focus on the optimal
parameters – drug size, flow rate, insertion angle, and spray cone angle. This model can
pave a way for nasal sprays to be used in medical treatments outside of chronic rhinitis
and respiratory ailments, such as diabetes and other pain treatments.
Keywords: nasal spray, spray cone angle, drug deposition, Astelin, optimization

4
2. Introduction Nasal drug delivery provides an alternative non-invasive method to administer a variety
of systemic drugs. The intranasal administration of drugs is not a novel concept, but has
been practiced for centuries. Ancient Tibetans used inhalers containing sandalwood and
aloewood extracts as antiemetic while Ancient Egyptians resorted to intranasal medicine
to treat epistaxis and rhinitis (Quraishi et al., 1997). This method of administration
provides not only convenience to the patients, but also superior rates of drug absorption
and metabolism in the mucosal lining of the nose.
The rich vasculature and high permeability of the nasal mucosa favor efficient
pharmacokinetics, thus making it an ideal tissue to target for drug delivery. Factors that
facilitate transnasal absorption of drugs include the stratified squamous epithelium of the
nasal vestibule, the mucosa between nasal septum and lateral wall of the nose, and the
vast absorption surface area provided by the pseudostratified columnar epithelium in the
main vault of the nasal cavity (Quraishi et al., 1997). In comparison to traditional
intravenous or gastrointestinal administrations, pharmacologically active drug
components are more stable in the nasal cavity environment, exhibit superior absorption
in nasal mucosa, avoid hepatic elimination, circumvent the blood-brain barrier, and elude
gastrointestinal and hepatic metabolism (Pires et al., 2009). These advantages enhance
drug bioavailability after absorption and allow sufficient medication to reach targeted
regions.
Allergic rhinitis is a medical condition characterized by irritation and inflammation of the
mucosal membrane in the nasal cavity. It’s estimated that rhinitis affects 10%-30% of
adults (Schoenwetter et al. 2004). Airborne allergens diffuse into the mucosal membrane
where immune cells begin secreting antibodies as an allergenic response. These
antibodies bind to mast cells in the mucosal membrane, causing them to secrete
histamine, which leads to itching, swelling, and mucus secretion in the nasal cavity. The
most common treatment for rhinitis is by anti-histamines, which block histamine
receptors on basophils and mucus-secreting mast cells to prevent inflammation. Nasal
injection is the most effective method for drug delivery, as anti-histamines come into
direct contact with the mucosal layer, without needing to diffuse through vasculature.
To maximize the advantages provided by nasal therapy, nasal drug delivery requires
careful design of a nasal sprayer device. The ability of the sprayer device to deposit drug
particles rely on fluid flow velocity, flow turbulence, deposition mechanisms between
particles and environment, and particle properties stemming from particle density, size,
and spray cone angle. The nasal sprayer must deliver administered drug to the posterior
cavity for maximal absorption and avoid depositing in anterior regions where little drug
diffuses through the mucosa. Recently, Inthavong et al. (2008) showed the major factors

5
influencing deposition – nasal cavity geometry, spray particle sizes, spray cone angles,
insertion angle, and injected particle velocities – using a particle tracking method. The
findings suggested that spray particle size, spray cone diameter, and insertion angle had
significant effects on position of drug deposition.
Expanding on established studies, this report focuses on the optimal injection
velocity/flow rate, injection angle, spray cone angle, and particle diameter. This model
incorporates the Navier-Stokes and Continuity equations for fluid flow with Lagrangian
Particle Tracking equations for particle velocity and location to observe concentration of
drug deposited in the anterior, middle, and posterior cavity regions.
2.1 Design Objectives
We will model drug particle deposition in a simplified nasal geometry using
mathematical modeling. We will determine the optimal injection flow rate, injection
angle, spray cone angle, and particle mass and size for effective deposition of Azelastine
hydrochloride in the posterior nasal cavity. The parameters are defined below in Problem
Formulation. We will also observe how Azelastine is cleared from the mucosal layer.
These findings will inform future nasal spray designs. Our goal is to identify what
combination of parameters defined will lead to optimal drug deposition in the targeted
nasal mucosa.
3. Problem Formulation
3.1 Terms Defined
Flow Rate – flow velocity of the particles as they enter the nasal cavity.
Particle Mass – the mass of the liquid particles injected by the nasal spray. Particle mass
will depend only on particle diameter as the density is assumed to remain constant at
1000 kg/m3. Particle diameters range from 10μm to 50μm.
Injection Angle – the angle at which the particles leave the spray nozzle and enter the
nasal cavity
Cone Angle (Cone Diameter) – the angle from the nozzle at which particle spreading
occur. In other words, it is the spray angle at which the liquid stream is dispersed into
distinct particles. The cone diameter at which particle dispersion occurs is a function of
cone angle.
3.2 Schematic
The anatomical image and geometry of the nasal passageway, shown in Figure 1, is
simplified to a two dimensional geometry to reduce complexity in calculation. The
simplified geometry consists of four distinct regions – the anterior, the middle, the
posterior, and the escape. This model incorporates the appropriate parameters that
determine whether spray particles will avoid being trapped in the anterior cavity and

6
reach the posterior areas instead. To account for computational discrepancies caused by
sharper edges in a previous simplification, the design was adjusted accordingly using
smooth boundary curves in Figure 2. This provided a more accurate representation of the
true geometry and offered enhanced computational results.
Anterior (20mm)
Middle (30mm)
Posterior (35mm)
Escape (15mm)
Figure 2. Simplified geometry of the nasal cavity and the flow boundary conditions. The cavity was
divided into four regions based on distance along the x axis. The inlet velocity shown is one of the
boundary conditions used in our model. The complete list of the nostril velocity can be found in table 3.
𝒖𝒙 = 𝟑.𝟏𝟎 ∗ 𝐬𝐢𝐧 𝝅𝒕 𝟐
𝒖𝒚 = 𝟏.𝟏𝟑 ∗ 𝐬𝐢𝐧(𝝅𝒕 𝟐 )
𝑷 = 𝟎 𝒑𝒂
No slip wall
Figure 1. Anatomical image of a healthy human’s nasal cavity. The figure on the left shows current
drug delivery in the nasal cavity in yellow. The figure on the right displays more efficient and improved
drug deposition as seen by the nasal cavity being completely full.
[http://www.optinose.no/nasal-delivery/nasal-delivery-challenges]
7
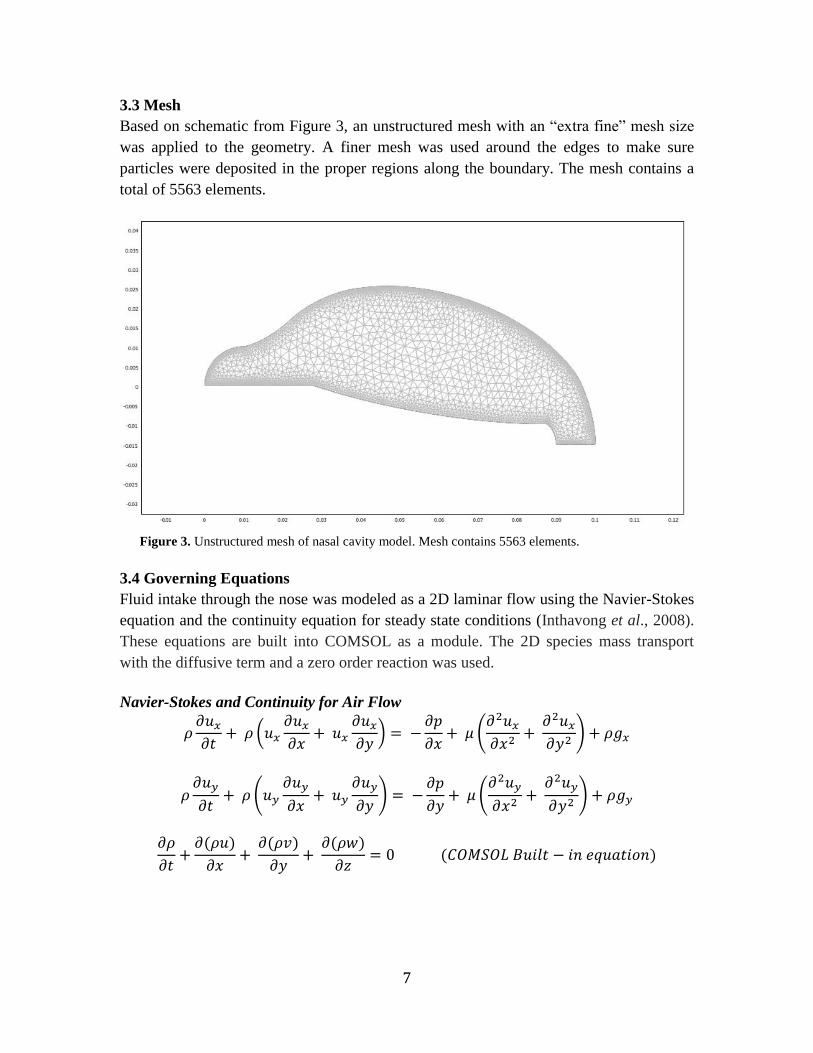
3.3 Mesh
Based on schematic from Figure 3, an unstructured mesh with an “extra fine” mesh size
was applied to the geometry. A finer mesh was used around the edges to make sure
particles were deposited in the proper regions along the boundary. The mesh contains a
total of 5563 elements.
3.4 Governing Equations
Fluid intake through the nose was modeled as a 2D laminar flow using the Navier-Stokes
equation and the continuity equation for steady state conditions (Inthavong et al., 2008).
These equations are built into COMSOL as a module. The 2D species mass transport
with the diffusive term and a zero order reaction was used.
Navier-Stokes and Continuity for Air Flow
(
) =
(
)
(
) =
(
)
( )
( )
( )
= ( )
Figure 3. Unstructured mesh of nasal cavity model. Mesh contains 5563 elements.
8
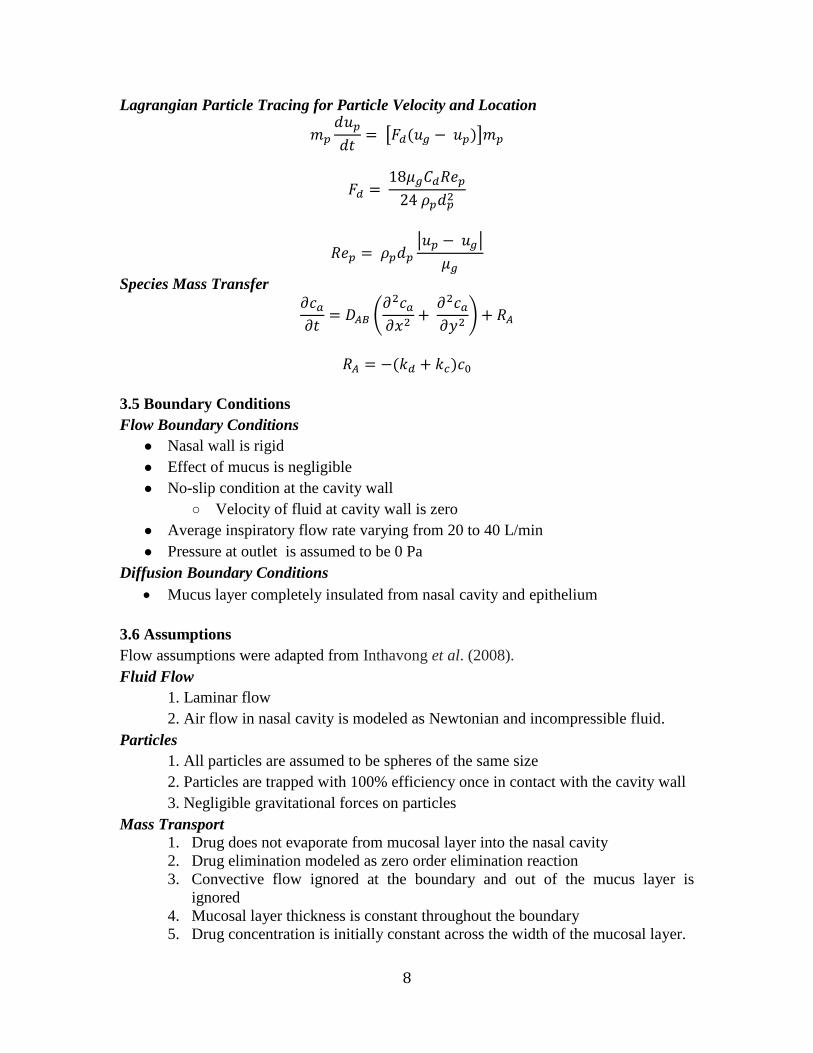
Lagrangian Particle Tracing for Particle Velocity and Location
= [ ( )]
=
=
| |
Species Mass Transfer
= (
)
= ( )
3.5 Boundary Conditions
Flow Boundary Conditions
● Nasal wall is rigid
● Effect of mucus is negligible
● No-slip condition at the cavity wall
○ Velocity of fluid at cavity wall is zero
● Average inspiratory flow rate varying from 20 to 40 L/min
● Pressure at outlet is assumed to be 0 Pa
Diffusion Boundary Conditions
Mucus layer completely insulated from nasal cavity and epithelium
3.6 Assumptions
Flow assumptions were adapted from Inthavong et al. (2008).
Fluid Flow
1. Laminar flow
2. Air flow in nasal cavity is modeled as Newtonian and incompressible fluid.
Particles
1. All particles are assumed to be spheres of the same size
2. Particles are trapped with 100% efficiency once in contact with the cavity wall
3. Negligible gravitational forces on particles
Mass Transport
1. Drug does not evaporate from mucosal layer into the nasal cavity
2. Drug elimination modeled as zero order elimination reaction
3. Convective flow ignored at the boundary and out of the mucus layer is
ignored
4. Mucosal layer thickness is constant throughout the boundary
5. Drug concentration is initially constant across the width of the mucosal layer.
9
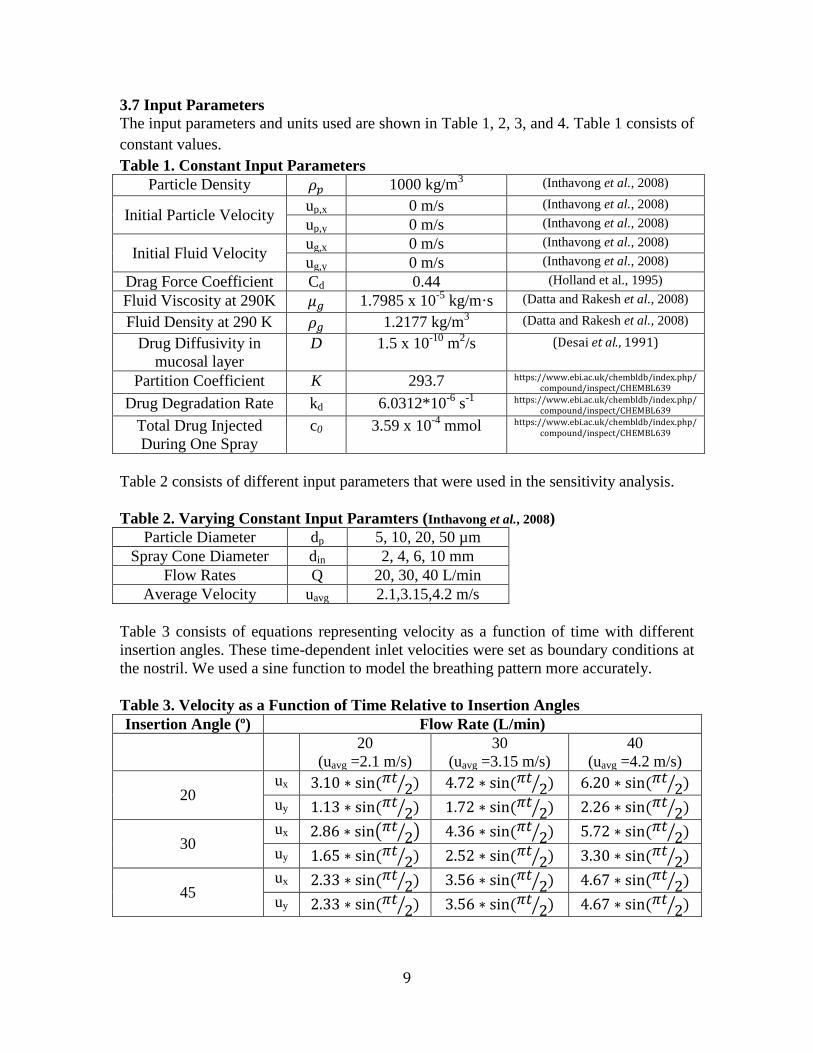
3.7 Input Parameters
The input parameters and units used are shown in Table 1, 2, 3, and 4. Table 1 consists of
constant values.
Table 1. Constant Input Parameters
Particle Density 1000 kg/m3 (Inthavong et al., 2008)
Initial Particle Velocity up,x 0 m/s (Inthavong et al., 2008)
up,y 0 m/s (Inthavong et al., 2008)
Initial Fluid Velocity ug,x 0 m/s (Inthavong et al., 2008)
ug,y 0 m/s (Inthavong et al., 2008)
Drag Force Coefficient Cd 0.44 (Holland et al., 1995)
Fluid Viscosity at 290K 1.7985 x 10⁻⁵
kg/m·s (Datta and Rakesh et al., 2008)
Fluid Density at 290 K 1.2177 kg/m3 (Datta and Rakesh et al., 2008)
Drug Diffusivity in
mucosal layer
D 1.5 x 10⁻¹⁰
m2/s (Desai et al., 1991)
Partition Coefficient K 293.7 https://www.ebi.ac.uk/chembldb/index.php/ compound/inspect/CHEMBL639
Drug Degradation Rate kd 6.0312*10-6
s-1
https://www.ebi.ac.uk/chembldb/index.php/ compound/inspect/CHEMBL639
Total Drug Injected
During One Spray
c0 3.59 x 10⁻⁴
mmol https://www.ebi.ac.uk/chembldb/index.php/ compound/inspect/CHEMBL639
Table 2 consists of different input parameters that were used in the sensitivity analysis.
Table 2. Varying Constant Input Paramters (Inthavong et al., 2008)
Particle Diameter dp 5, 10, 20, 50 µm
Spray Cone Diameter din 2, 4, 6, 10 mm
Flow Rates Q 20, 30, 40 L/min
Average Velocity uavg 2.1,3.15,4.2 m/s
Table 3 consists of equations representing velocity as a function of time with different
insertion angles. These time-dependent inlet velocities were set as boundary conditions at
the nostril. We used a sine function to model the breathing pattern more accurately.
Table 3. Velocity as a Function of Time Relative to Insertion Angles
Insertion Angle (º) Flow Rate (L/min)
20
(uavg =2.1 m/s)
30
(uavg =3.15 m/s)
40
(uavg =4.2 m/s)
20 ux . ∗ ( ) . ∗ ( ) . ∗ ( )
uy . ∗ ( ) . ∗ ( ) . ∗ ( )
30 ux . ∗ . ∗ ( ) . ∗ ( )
uy . ∗ ( ) . ∗ ( ) . ∗ ( )
45 ux . ∗ ( ) . ∗ ( ) . ∗ ( )
uy . ∗ ( ) . ∗ ( ) . ∗ ( )

10
Table 4 consists of mucosal clearance rates that were used to model drug elimination
from the mucus layer. Rates were considered constant based on in vivo experimental data
from Hua (2010). Note that these rates are based from a mouse model with elimination of
nanoparticles in isotonic saline.
Table 4. Mucosal Clearance Properties
Time Mucosal Clearance Rate (kc)
0 to 10 min 1.7% min-1 (Hua et al., 2010)
10 to 60 min 0.3% min-1 (Hua et al., 2010)
3.8 Mass Transport Formulation
After performing the flow simulation, species mass transport calculations were done in
the mucosal layer. The mucosal layer was estimated to be 0.5mm in thickness (Marttin et
al.1998). The particle distribution along boundary was calculated by interpolating particle
deposition along the boundary. Particle coordinates were determined (see Appendix 8.2)
and were the basis for the areas of 25 subdomains in mucosal layer where particles had
deposited (Figure 4, Table 5). Each particle coordinate was positioned at the midpoint of
the width of each subdomain. By dividing the total drug injected by the mucus area, the
total drug concentration was determined to be 4.03 mmol/m2. Each subdomain contained
a fraction of the initial concentration, based on the area of the subdomain.
Drug removal was assumed to occur by two modes: elimination from mucus turnover and
drug degradation. Hua et al. observed that mucosal clearance occurs at 2 relatively
constant rates within the first hour. Therefore, we used a zero order reaction to model
drug elimination from the mucosal layer. This reaction incorporated the elimination rate
and the initial concentration in each subdomain.
Table 5 consists of mucosal subdomain areas and initial concentration determined by
particle distribution along the boundary. Note that the particle distribution in this model
was based on the flow model with optimal deposition parameters (40L/min, 45o insertion,
6 mm cone, 50 µm particle diameter), where all particles had deposited in the cavity.
Table 5. Mucosal Subdomain Initial Concentrations Along The Upper Boundary
1 2 3 4 5 6 7 8 9 10 11 12 13
Area
(106 m
2)
5.06 2.1 1.58 1.33 1.26 0.921 0.834 0.736 0.622 0.618 0.573 0.537 0.535
Concentration
(10 mmol/m2)
0.028 0.068 0.090 1.08 1.13 1.56 1.71 1.94 2.29 2.31 2.49 2.66 2.66
14 15 16 17 18 19 20 21 22 23 24 25 Total
Area
(106 m
2)
0.505 0.536 0.533 0.530 0.537 0.556 0.553 0.556 0.572 0.618 0.610 4.02 26.8
Concentration
(10 mmol/m2)
2.82 2.66 2.66 2.73 2.65 2.56 2.57 2.56 2.48 2.29 2.32 0.354 50.4

11
4. Results and Discussion
4.1 Results
We ran our model for a range of flow rates from 20 L/min to 40 L/min, insertion angles
from 20° to 45°, spray cone diameters from 2mm to 8mm, and varying particle diameters
from 10μm to 50μm. Comparing combinations of these parameters, an optimal
combination for maximum drug deposition was achieved at 40 L/min flow rate with a 45°
insertion angle and a 90° (6mm) cone angle. Figure 5 shows the contour plot for fluid
flow through nasal cavity based on said parameters.
Figure 5. Contour map of nasal cavity with fluid flow, drug deposition, and particle tracking. The
optimal parameters of 40 L/min flow rate, with a 45° insertion angle and a 90° cone angle (6mm) were
used.
Figure 4. Schematic of mucosal layer divided into multiple subdomains. Note that only the top
boundary was considered as no particles deposited along the bottom boundary.

12
Furthermore, the model was expanded to test diffusion and elimination of the drug after
deposition into the surrounding mucosal layer. Figure 6 shows the concentration profile
after 1 hour based on the particle distribution profile from the flow simulation with
optimal parameters. The average drug concentration distribution in each subdomain is
given in Figure 7.
0
0.005
0.01
0.015
0.02
0.025
0.03
0.035
0 0.01 0.02 0.03 0.04 0.05 0.06 0.07 0.08
Co
nce
ntr
ati
on
(m
ol/
m3)
Arc-Length (m)
Concentration Deposited Along Upper Mucosal Boundary
t = 0
t = 1 hr.
Figure 6. Contour map of drug concentration after 1 hour. This simulation was based on the drug
deposition from the optimal case shown in Figure 4.
Figure 7. Plot of average drug concentration in each subdomain at t=0 and t=1hr. Note that
subdomains were only evaluated where drug was deposited at the upper boundary, not the entire
mucosal layer. Over time, drug is eliminated and diffuses out resulting in a flatter profile.

13
The contour map and concentration profile suggest that diffusion will have a role in
spreading drug throughout mucosal layer. However, the rate of elimination is much too
fast for the drug concentration to have a completely even spread throughout the layer.
From the total average concentration plot (Figure 8), one can see that the drug is
eliminated quickly in the first 10 minutes and more slowly after 10 minutes. Our model
predicts that 32.3% of the drug is eliminated after 1 hour.
4.2 Limitation of Results
There were several limitations to our results. The model was limited to one cycle of
breathing because COMSOL would have had difficulty converging and solving the
problem. The initial fluid velocity was assumed to be 0 m/s because if the initial velocity
was significantly higher it would be more likely for the drug particles to deposit in the
anterior region instead of the middle and posterior region. This initial fluid velocity value
was also not realistic. We are constantly breathing in and out so it would be impossible
for the velocity at the inlet of the nasal cavity to ever be 0 m/s.
Another limitation was in our diffusion analysis. The drug concentration profile was
determined by interpolating particle deposition, instead of using a more accurate,
continuous distribution. Increasing the number of particles would provide more accurate
results, but becomes more time intensive. Also, flow effects were not considered and
elimination was considered as a zero order reaction, while in reality elimination also must
0
0.0005
0.001
0.0015
0.002
0.0025
0.003
0.0035
0.004
0.0045
0 600 1200 1800 2400 3000 3600
Co
nce
ntr
ati
on
(m
ol/
m3)
Time (sec.)
Average Drug Concentration In Mucosal Layer
Figure 8. Plot of average drug concentration in the entire mucosal layer over time (including the areas
for the top and bottom layers of nasal cavity). The fastest rate of elimination occurs in the first 10
minutes.

14
depend on drug concentration. Yet another limitation was assuming drug concentration
was homogeneous in each subdomain.
4.3 Accuracy Check
To confirm the accuracy of our flow results, we compared with a similar computational
model (Inthavong et al., 2008) and an experimental model (Cheng et al., 2001).
Specifically, we looked at particle deposition along different sections of the nasal
boundary. Using the postprocessing particle tracing module, 50 particles at 10μm
diameter were released for 2 seconds. The nasal cavity, depicted in Figure 9, was divided
into 4 sections: anterior, middle, posterior, and escape. Our model assumed perfect
particle entrapment along the boundary.
Table 6. Percentage of Drug Particles Captured in Each Nasal Region
Anterior Middle Posterior Escape
Number of
Particles
30 2 4 14
Fractional
Deposition
0.6 0.04 0.08 0.28
Ithavong,
2008
0.538 0.036 0.038 0.388
Error +11.5% +11.1% +111% -27.8%
Chen, 2003 0.375 0.625 0 0
Escape
Anterior
Middle
Posterior
Figure 9. Accuracy check of nasal cavity model. The number of drug particles stuck to the wall of the
nasal cavity in each of the four regions – anterior, middle, posterior, and escape – are shown.
Parameters used were equivalent to those used by Inthavong.

15
Our results shown in Table 6 have a similar trend as seen by Ithavong et al., (2008). Most
of the particles either deposited in the anterior region or escaped through the outlet. The
relatively high error values can be accounted for by the small differences in geometry.
Better accuracy can be achieved with more particles, but visualization and particle
tracking would be significantly more difficult.
On the contrary, our results were significantly different from to Cheng et al., (2003). The
middle portion, in Cheng’s findings, had absorbed more particles. A number of factors
that could have contributed to variation from experimental data include particle
diameters, a 3D geometry, a lower inlet flow rate, and turbulence. Our particle deposition
was very sensitive to particle diameter as seen in our sensitivity analysis. The 3D
geometry would increase the surface area and consequently cause most of the particles to
become entrapped before leaving the nasal cavity.
Unfortunately, we could not find any other studies that analyzed elimination of anti-
histamines in the mucosal layer. Measuring total drug concentration in the nasal cavity
over time is still very difficult to achieve in vivo. However, our cumulative drug
clearance (32.3%) did compare favorably with those observed by Hua et al. 2010
(33.2%), who performed mucosal clearance tests of isofluorane at an equal concentration
in the mouse model.
4.4 Sensitivity Analysis
Our sensitivity analysis analyzed the effects of four parameters on drug deposition: flow
rate, insertion angle, cone diameter, and particle diameter. Our analysis determined the
optimal parameters for deposition in the middle and posterior regions of the nose.
Parameter values were adapted from Inthavong et al., (2008). The model implemented at
three inlet flow rates (20, 30, 40 L/min), which were converted to flow velocity as shown
in Appendix A. Insertion angle was varied by changing the x and y components of the
flow velocity at the inlet. Parameters in the particle-tracing module were varied to
account for different cone and particle diameter. Combinations of four different insertion
angles and cone diameters were tested (Figure 10).

16
Our results showed the most deposition occurring at 20L/min with a 20° insertion angle.
Deposition also seemed to occur more frequently at higher cone diameters. Particle
diameter directly increased the particle mass when the density remained constant. Next,
the optimal combination for each flow rate was tested with varying particle diameter
sizes. Our results are shown in Figure 11.
Figure 10. Sensitivity analysis of injection angle and
cone diameter on particle deposition in the middle and
posterior of the nasal cavity at various flow rates.
Maximum particle deposition occurred at 20L/min flow
rates at a 20° insertion angle. Larger cone angles of
6mm and 8mm were most optimal. Insertion angles
were applied by varying the x and y components of
inlet flow. Angles are degrees from the axis normal to
the inlet boundary. Cone diameters were applied by
varying the particle release boundary in the particle
tracing module. All values were calculated using 10um
particle diameter. The model with 40L/min flow and
20° insertion angle did not converge.

17
At lower flow rates, increased diameter increases particle deposition in the nasal cavity
only by a little. This occurred because the high particle mass caused particle to move less
directly along the flow and prevent escape through the outlet, but the particle was too
heavy for the low flow rate to bring the drug to the target location. At lower masses, there
was more circulation as particles escaped along Eddy currents occurring along the sides
of the main flow path. At high flow rates, deposition increased with particle diameter as
increased velocity allowed particles to have more momentum to escape the flow path and
deposit along the top boundary. By varying the angle, one can “aim” the particle
deposition path. Our model shows that maximum particle deposition at the middle and
posterior regions occur when “aiming” the flow at a 45° insertion angle.
Figure 11. Sensitivity analysis of particle
diameter on particle deposition in the four nasal
cavity regions. Increased diameter resulted in
higher particle mass. At lower flow rates,
increased particle diameter resulted in less
particle escape. As the flow rate, injection angle,
and particle diameter increased, more particles
deposited inside the nasal cavity. All values were
calculated using a 6mm cone angle.

18
5. Conclusion and Design Recommendations
5.1 Conclusion
This study demonstrated the significance of insertion angle in determining deposition of
spray particles in the middle and posterior regions of the nasal cavity. For a flow rate of
20 L/min, maximal deposition occurred with an insertion angle of 20°. However, when
we varied flow rate from 20 L/min to 30 L/min to 40 L/min, maximum particle
deposition occurred at insertion angle of 45°. As the particle diameter increased, the mass
of the drug increased as well. This change required a higher flow rate and larger insertion
angle for the drug to be deposited effectively in the middle and posterior regions. Also,
our mass transport simulation showed that drug elimination occurs much too rapidly
before the drug concentration can evenly spread by diffusion.
5.2 Implications and Relevance
Our model demonstrated the importance of the size of drug particles, which ultimately
decides the flow rate and insertion angle most suitable for administration. While the
typical drug particle diameter should never be as large as 50μm but not too small, a size
of 10 or 20μm is also reasonable. This consequently dictates a lower flow rate and a
smaller insertion angle to prevent too many particles from escaping through the outlet.
This finding helps considerations for drug dosages when evaluating the reproducibility
and precision of the delivery of the spray. In the case of Azelastine hydrochloride, the
recommended dosage for adults and children 12 years of age and older is one or two
sprays per nostril twice daily (Berger, 2009). Each spray, delivering 137 μg of drug,
significantly reduces histamine release and biochemical regulators of inflammatory
response. Thus, our parameters can dictate an effective combination that will deliver the
prescribed amount to targeted areas.
In addition, the cone angle and insertion angle parameters are useful in developing head
positioning techniques for administering Azelastine hydrochloride. The current positions
are: 1) head neutral (0-10° to the vertical plane), spray at 30° to the plane of face and 2)
head forward (60-90° to the vertical plane), spray at 90° to the plane of face (Batemen et
al. 2002). Bateman pointed out that neither technique is superior to the other and both fail
to deliver optimal distribution of drug to posterior nasal cavity. Our findings can improve
clinical studies and provide proper insertion and cone angles for maximal delivery of
drug to the posterior regions.
Most importantly, this study paves a way for nasal sprays to be used in medical
treatments outside of chronic rhinitis and respiratory ailments. In past and recent
scientific news nasal sprays have been involved in a range of treatments. They have been

19
used to incorporate the use of vasopressin to treat diabetes insipidus. Results have shown
that the method of treatment allows the drug to stay in blood plasma longer and its
absorption is effective, non-sensitive, and non-irritating. It could be used as an in between
treatment for patients with severe diabetes (Dashe, 1964). Also nasal decongestants can
be used to significantly reduce the frequency of snoring (Braver et al., 1995). Most
recently, research has begun for the use of intranasal fentanyl for treating acute pain. The
benefit of this administration is an immediate effect on the central nervous system and it
can be administered to children as well. However, the onset time so far is longer than the
basic IV treatment. More studies have to be done to incorporate pharmacokinetics to
allow faster and more efficient absorption. Some other hypotheses being worked on now
involve a nicotine replacement treatment by nasal spray instead of a patch or pill, and a
nose to brain drug delivery pathway to avoid the blood brain barrier. Our results on
optimal parameters for maximum absorption will help with the amount of research going
into nasal sprays utilizing different drugs to treat various types of illnesses and the
pharmacokinetics that come along with the types of drugs used, which need to be studied
and taken into account.
5.3 Design Recommendations
Based on our study we determined that effective drug deposition for a moderately sized
around 10 to 20 µm drug particle requires a flow rate of approximately 20 L/min and an
insertion angle of 20°. For most drug particles sized at 50 µm, a flow rate of 40 L/min
and insertion angle of 45º showed higher effectiveness. The spray cone diameter should
always be at least 6 mm, which is a 90° spray angle. We would recommend designers of
nasal sprays to make the nozzle longer and possibly narrower. The longer length would
help achieve the small insertion angle. On the other hand, the outlet of the nozzle for the
drug particles should be designed for the particles to produce the optimal spray cone
diameter. Also, nasal spray development should not put too much focus on improving
diffusion because this rate is several orders of magnitude slower than the mucosal
clearance rate.
5.4 Design Constraints
Although our model found the optimal spray and drug parameters of Azelastine, the
values used may not apply to other drugs. Different drug applications have different
particle densities, drug diffusion coefficients, and particle sizes. The variability in particle
densities would affect the modeling of drug deposition. If the drug is lighter, a lower inlet
velocity is required with a lower insertion angle. But if the drug is heavier, a higher flow
rate along with a higher insertion angle can be used to achieve the same percentage of
drug deposition in the middle and posterior regions. Also the difference in diffusion
coefficients may be representative of the mechanisms of different drugs. However, it is
difficult to obtain the values of these diffusion coefficients from experimentation.
Another factor to consider is the mucosal layer. This layer constantly changes its

20
chemical composition and thickness, affecting viscosity, drug distribution, and therefore
diffusion rates. Some current intranasal applications do not deposit particles at a fairly
constant particle size. This high degree of variability brings up questions on how accurate
any computational model can be in determining a definite set of optimal parameters.
Another constraint to our model was using 2D geometry instead 3D. With modern day
technology, it is easier to scan a patient’s nasal cavity to serve as a 3D model. However,
the governing equations and input parameters used for flow velocity would be more
complex. This would change the equations in our model and the solution time would be
much longer. On the other hand, a 3D model would provide observations and results that
would be much more accurate than our 2D geometry. Significant effort should be put into
developing a 3D model as it’s clear from anatomical imaging that the 3D model would
have a much greater surface than a 2D model projected as a slab. Surface area is arguably
the most important difference will significantly affect where particles get deposited.
While it may be challenging to develop a functional 3D model, this is the clear next step
in modeling intranasal delivery

21
6. Appendix A: Mathematical Statement of Problem
6.1 Force exerted on particles for evaluation of particle trajectories
=
= [ ( )]
=
=
(
| |
)
= | |
Plug in th Fd equation into the force equation, we get
= [( | |
) ∗ ( )]
This derived force equation was inputted into the equation of motion of the particle
tracing function in COMSOL to obtain the pattern of drug deposition (see figure 9.)
6.2 Derivation of boundary condition at a nostril
Flow rate in human nasal passageway ranges between 20 and 40 L/min which correspond
to average inlet velocity of 2.1 m/s and 4.2 m/s (Inthavong et al., 2006). Because the
physiological flow velocity is not constant over a breathing cycle, we sought to apply a
time-dependent velocity to the boundary condition at the inlet, while keeping the average
velocity at the physiological rates.
To derive the inlet velocity equation, we first looked at the general form of sine equation.
= ∗ ( )
where u is velocity
t is time
T is a period of one breathing cycle (which is 4 seconds for human)
We next calculated the function of average velocity
Uavg = ∫
=
∫ ∗ ( )
=
(
)
| 0 to tf= 2 s

22
Note that we modeled only half of the breathing cycle. Our final time is therefore equal to
2 seconds
=
We knew the value of average velocity and we wanted to find amplitude value.
Rearranging the equation, we got:
= ∗
Plugging the equation of amplitude back into the original speed equation, we got:
u =
( )

23
7. Appendix B: Solution Strategy
7.1 Mesh Convergence
Figure 12. Schematic of a nasal cavity. The red line located in the middle of the cavity is where the
average velocity is taken for the mesh convergence analysis
The mesh convergence analysis was performed based on the average value of the velocity
along the red line shown in Figure 12 because the velocity field varies the most in this
region. The average velocity was evaluated at eight different mesh sizes, and the solution
began to converge when number of elements reached 5563 (Figure 13). This mesh was
used as our model to evaluate the drug deposition for our final solution.
Figure 13. Mesh convergence analysis of nasal cavity.
0.84
0.86
0.88
0.9
0.92
0.94
0.96
0.98
0 5000 10000 15000 20000
Av
era
ge
Ve
loci
ty (
m/
s)
Number of Elements
Cavity Mesh Convergence Plot

24
Mesh convergence was also performed on the mucosal layer subdomain (Figure
14). Analysis was performed at 5 different mesh sizes by integrating drug concentration
across the mucosal domain after 1 hour. The solution converges at about 5000 elements
and our mesh contained 5678 elements. This mesh was used in our mass transport model.
Figure 14. Mesh convergence analysis of mucosal layer.
1.98E-07
0.0000002
2.02E-07
2.04E-07
2.06E-07
2.08E-07
2.1E-07
2.12E-07
0 2000 4000 6000 8000 10000
Co
nce
ntr
ati
on
(m
ol/
m)
Number of Elements
Mucosal Layer Mesh Convergence

25
8. Appendix C: Software Implementation
8.1 Particle Tracing
To obtain particle trajectory plot, we used a COMSOL particle tracing feature
under post-processing. This function requires five major input parameters including force
equation derived in section 6.1, particle mass, particle initial positions, and initial velocity
of the particles. These respective parameters indicated by number 1-5 were input into the
particle tracing window shown in Figure 15.
Figure 15. COMSOL particle tracing window. Number 1-5 indicate the five required input parameters:
force, particle mass, particle radius, particle release positions, and initial velocity, respectively
1
2
3
4 5

26
8.2 Particle Coordinates
To determine particle position along the boundary, we exported our model in
FEM format into MATLAB. The following code was used to run the particle simulation
in MATLAB for 25 particles and extract particle position (Figure 16).
Figure 16. MATLAB code for FEM simulation of particle module
27
9. Appendix D: References
Bateman, N.D, A.D Whymark, N.J Clifton, and T.J Woolford. "A Study of Intranasal
Distribution of Azelastine Hydrochloride Aqueous Nasal Spray with Different Spray
Techniques." Clinical Otolaryngology. 27.5 (2002): 327-330. Print.
Berger, W.E. "Pharmacokinetic Characteristics and Safety and Tolerability of a
Reformulated Azelastine Hydrochloride Nasal Spray in Patients with Chronic
Rhinitis." Expert Opinion on Drug Metabolism and Toxicology. 5.1 (2009): 91-102.
Print.
Braver, H. M., A. J. Block, and M. G. Perri. "Treatment for Snoring: Combined Weight
Loss, Sleeping on Side, and Nasal Spray." Chest 107.5 (1995): 1283-288. Print.
Cheng, YS, TD Holmes, J Gao, RA Guilmette, S Li, Y Surakitbanharn, and C Rowlings.
"Characterization of Nasal Spray Pumps and Deposition Pattern in a Replica of the
Human Nasal Airway." Journal of Aerosol Medicine : the Official Journal of the
International Society for Aerosols in Medicine. 14.2 (2001): 267-80. Print.
"Compound Report Card." ChEMBL. EMBL-EBI. Web. 30 Apr. 2012.
<https://www.ebi.ac.uk/chembldb/index.php/compound/inspect/CHEMBL639>.
Dashe, Alfred M., Charles B. Kleeman, J. Walter Czaczkes, Howard Rubinoff, and Irene
Spears. "Synthetic Vasopressin Nasal Spray in the Treatment of Diabetes Insipidus."
Synthetic Vasopressin Nasal Spray in the Treatment of Diabetes Insipidus. Web. 27 Apr.
2012. <http://jama.ama-assn.org/content/190/12/1069.short>. Datta, Ashim K., and Vineet Rakesh. An Introduction to Modeling of Transpor
Processes: Applications to Biomedical Systems. Cambridge, UK: Cambridge UP, 2010.
Print. Desai, M. A., & Vadgama, P. (January 01, 1991). Estimation of effective diffusion
coefficients of model solutes through gastric mucus: assessment of a diffusion chamber
technique based on spectrophotometric analysis. The Analyst, 116, 11, 1113-6. Efficient Drug Delivery Using Computational Fluid Dynamics." Computers in Biology
and Medicine 38.6 (2008): 713-26. Print.
Hansen, M. S., O. Mathiesen, S. Trautner, and J. B. Dahl. "Intranasal Fentanyl in the
Treatment of Acute Pain - a Systematic Review." Acta Anaesthesial Scand 56 (2012):
407-19. Print. Holland FA and R Bragg, 1995. Fluid Flow for Chemical Engineers (2
nd
Edition). Elsevier. Online version available at:
http://knovel.com/web/portal/browse/display?_EXT_KNOVEL_DISPLAY_b

28
okid=412&VerticalID=0
Hua, X., Zeman, K. L., Zhou, B., Hua, Q., Senior, B. A., Tilley, S. L., & Bennett, W. D.
(January 01, 2010). Noninvasive real-time measurement of nasal mucociliary clearance in
mice by pinhole gamma scintigraphy. Journal of Applied Physiology, 17, 1, 189.
Inthavong, K, Z F. Tian, H F. Li, J Y. Tu, W Yang, C L. Xue, and C G. Li. "A Numerical
Study of Spray Particle Deposition in a Human Nasal Cavity." Aerosol Science &
Technology. 40.11 (2006): 1034-1045. Print.
Inthavong, K., Z. Tian, J. Tu, W. Yang, and C. Xue. "Optimising Nasal Spray Parameters for Efficient Drug Delivery Using Computational Fluid Dynamics." Computers in Biology and Medicine 38.6 (2008): 713-26. Print.
Marttin, E., Schipper, N. G., Verhoef, J. C., & Merkus, F. W. (January 01, 1998). Nasal
mucociliary clearance as a factor in nasal drug delivery. Advanced Drug Delivery
Reviews, 29, 13-38.
Quraishi, MS, NS Jones, and JD Mason. "The Nasal Delivery of Drugs." Clinical
Otolaryngology and Allied Sciences. 22.4 (1997): 289-301. Print.
Schoenwetter, W. F., Dupclay, L., Appajosyula, S., Botteman, M. F., & Pashos, C. L.
(January 01, 2004). Economic impact and quality-of-life burden of allergic
rhinitis. Current Medical Research & Opinion, 20, 3, 305-317.
Zia, H, P Dondeti, and T E. Needham. "Intranasal Drug Delivery." Clinical Research and
Regulatory Affairs. 10.2 (1993): 99-135. Print.