SPR-720: Addressing Work Zone Traffic Safety Issues in … · Addressing Work Zone Traffic Safety...
50
Addressing Work Zone Trafϐic Safety Issues in Arizona MARCH 2017 Arizona Department of Transportation Research Center SPR-720
Transcript of SPR-720: Addressing Work Zone Traffic Safety Issues in … · Addressing Work Zone Traffic Safety...

Addressing Work Zone Traf ic Safety Issues in Arizona
MARCH 2017
Arizona Department of Transportation Research Center
SPR-720


Addressing Work Zone Traffic Safety
Issues in Arizona
SPR-720
March 2017
Prepared by:
Michael Blankenship, PE
Amec Foster Wheeler, Environment and Infrastructure
4600 E. Washington Street, Suite 600
Phoenix, AZ 85034
Eric Rensel, PE
Gannett Fleming, Inc.
P.O. Box 67100
Harrisburg, PA 17106
Published by:
Arizona Department of Transportation
206 South 17th Avenue
Phoenix, Arizona 85007
In cooperation with
U.S. Department of Transportation
Federal Highway Administration
This report was funded in part through grants from the Federal Highway Administration, U.S.
Department of Transportation. The contents of this report reflect the views of the authors, who are
responsible for the facts and the accuracy of the data, and for the use or adaptation of previously
published material, presented herein. The contents do not necessarily reflect the official views or
policies of the Arizona Department of Transportation or the Federal Highway Administration, U.S.
Department of Transportation. This report does not constitute a standard, specification, or regulation.
Trade or manufacturers’ names that may appear herein are cited only because they are considered
essential to the objectives of the report. The U.S. government and the State of Arizona do not endorse
products or manufacturers.

Technical Report Documentation Page
1. Report No.
FHWA-AZ-17-720
2. Government Accession No.
3. Recipient's Catalog No.
4. Title and Subtitle 5. Report Date
March 2017
Addressing Work Zone Traffic Safety Issues in Arizona 6. Performing Organization Code
7. Author Michael R. Blankenship, Eric Rensel
8. Performing Organization Report No.
9. Performing Organization Name and Address
Amec Foster Wheeler, Environment and Infrastructure
4600 E Washington St., Suite 600
Phoenix, AZ 85034
10. Work Unit No.
11. Contract or Grant No.
SPR‐000-1 (183) 720
12. Sponsoring Agency Name and Address
Arizona Department Of Transportation
206 S. 17th Avenue
Phoenix, AZ 85007
13.Type of Report & Period Covered
Final
14. Sponsoring Agency Code
15. Supplementary Notes
Prepared in cooperation with the U.S. Department of Transportation, Federal Highway Administration
16. Abstract
The occurrence of work zone crashes is expected to increase in Arizona with the Arizona Department of Transportation’s (ADOT’s) shifted emphasis from constructing new roadways to preserving existing facilities. Identifying factors that contribute to work zone crashes will lead to development of appropriate strategies to improve work zone traffic control design and management. This research effort included analysis of work zone crashes identified in the ADOT Accident Location Identification Surveillance System (ALISS) database to determine accuracy of data and to identify factors associated with work zone crashes. The research also compared information from work zone crash reports to the data in the ALISS database to identify inconsistencies. Recommendations were developed for improving the accuracy of crash investigation reporting and transcribing, and for improving work zone policies and procedures.
17. Key Words
Work zone, work zone traffic control, work zone
safety, crash report, traffic incident management
18. Distribution Statement
Document is available to the U.S. public through theNational Technical Information Service, Springfield, Virginia 22161
23. Registrant's Seal
19. Security Classification
Unclassified
20. Security Classification
Unclassified
21. No. of Pages
42
22. Price

SI* (MODERN METRIC) CONVERSION FACTORS APPROXIMATE CONVERSIONS TO SI UNITS
Symbol When You Know Multiply By To Find Symbol
LENGTH in inches 25.4 millimeters mm ft feet 0.305 meters m yd yards 0.914 meters m mi miles 1.61 kilometers km
AREA in
2square inches 645.2 square millimeters mm
2
ft2
square feet 0.093 square meters m2
yd2
square yard 0.836 square meters m2
ac acres 0.405 hectares ha mi
2square miles 2.59 square kilometers km
2
VOLUME fl oz fluid ounces 29.57 milliliters mL
gal gallons 3.785 liters L ft
3 cubic feet 0.028 cubic meters m
3
yd3
cubic yards 0.765 cubic meters m3
NOTE: volumes greater than 1000 L shall be shown in m3
MASS oz ounces 28.35 grams g
lb pounds 0.454 kilograms kgT short tons (2000 lb) 0.907 megagrams (or "metric ton") Mg (or "t")
TEMPERATURE (exact degrees) oF Fahrenheit 5 (F-32)/9 Celsius
oC
or (F-32)/1.8
ILLUMINATION fc foot-candles 10.76 lux lx fl foot-Lamberts 3.426 candela/m
2 cd/m
2
FORCE and PRESSURE or STRESS lbf poundforce 4.45 newtons N lbf/in
2poundforce per square inch 6.89 kilopascals kPa
APPROXIMATE CONVERSIONS FROM SI UNITS
Symbol When You Know Multiply By To Find Symbol
LENGTHmm millimeters 0.039 inches in m meters 3.28 feet ft m meters 1.09 yards yd
km kilometers 0.621 miles mi
AREA mm
2 square millimeters 0.0016 square inches in
2
m2 square meters 10.764 square feet ft
2
m2 square meters 1.195 square yards yd
2
ha hectares 2.47 acres ac km
2 square kilometers 0.386 square miles mi
2
VOLUME mL milliliters 0.034 fluid ounces fl oz
L liters 0.264 gallons gal
m3
cubic meters 35.314 cubic feet ft3
m3
cubic meters 1.307 cubic yards yd3
MASS g grams 0.035 ounces ozkg kilograms 2.202 pounds lbMg (or "t") megagrams (or "metric ton") 1.103 short tons (2000 lb) T
TEMPERATURE (exact degrees) oC Celsius 1.8C+32 Fahrenheit
oF
ILLUMINATION lx lux 0.0929 foot-candles fc cd/m
2candela/m
20.2919 foot-Lamberts fl
FORCE and PRESSURE or STRESS N newtons 0.225 poundforce lbf
kPa kilopascals 0.145 poundforce per square inch lbf/in2
*SI is the symbol for th International System of Units. Appropriate rounding should be made to comply with Section 4 of ASTM E380. e
(Revised March 2003)

Contents
EXECUTIVE SUMMARY .................................................................................................................................. 1
INTRODUCTION ......................................................................................................................... 3 CHAPTER 1.
RESEARCH METHODOLOGY ....................................................................................................... 7 CHAPTER 2.
ANALYSIS FINDINGS ................................................................................................................... 9 CHAPTER 3.
PRELIMINARY ANALYSIS OF FLAWED DATA ........................................................................................... 9
FURTHER ERRORS IN DATA ..................................................................................................................... 9
DATA FROM REFINED ALISS QUERIES ................................................................................................... 11
ANALYSIS OF CRASH REPORTS .............................................................................................................. 17
LOCATION-SPECIFIC CRASH PATTERNS ................................................................................................ 24
REVIEW OF ARIZONA POLICE CRASH REPORT FORM ........................................................................... 25
PRACTICES IN OTHER STATES .................................................................................................. 27 CHAPTER 4.
IOWA’S INTEGRATED TEMPORARY INTELLIGENT TRANSPORTATION SYSTEMS .................................. 27
TENNESSEE’S QUEUE MANAGEMENT AND SECONDARY CRASHES ..................................................... 29
FLORIDA’S TRANSPORTATION SYSTEMS MANAGEMENT AND OPERATIONS ...................................... 29
CONCLUSIONS AND RECOMMENDATIONS ............................................................................. 31 CHAPTER 5.
CONCLUSIONS ...................................................................................................................................... 31
RECOMMENDATIONS ........................................................................................................................... 32
OPPORTUNITIES DEVELOPED FROM OTHER STATES’ PRACTICES ........................................................ 34
REFERENCES ................................................................................................................................................ 37

List of Figures
FIGURE 1. FLOW OF DATA FROM CRASH OCCURRENCE TO ADOT’S CRASH DATABASE ........................... 5
FIGURE 2. ARIZONA POLICE CRASH REPORT FORM - CONTRIBUTING CIRCUMSTANCES ........................ 10
FIGURE 3. ARIZONA POLICE CRASH REPORT FORM (PRE-2009) - CONTRIBUTING CIRCUMSTANCES ..... 11
FIGURE 4. ARIZONA WORK ZONE CRASHES INVOLVING DRIVER IMPAIRMENT (2004-2013) ................. 14
FIGURE 5. ARIZONA WORK ZONE CRASHES BY AGE GROUP AND SEVERITY (2004-2013) ....................... 14
FIGURE 6. ARIZONA WORK ZONE CRASHES INVOLVING LACK OF RESTRAINT (2004-2013) .................... 15
FIGURE 7. ARIZONA WORK ZONE CRASHES BY POSTED SPEED AND SEVERITY (2004-2013) ................. 15
FIGURE 8. ARIZONA WORK ZONE CRASHES BY HOUR AND SEVERITY (2004-2013) ................................. 16
FIGURE 9. ARIZONA WORK ZONE CRASHES BY ROAD CONDITION AND SEVERITY (2004-2013) ............ 16
FIGURE 10. SAMPLE ARIZONA WORK ZONE CRASHES INVOLVING SPEEDING OR
DISTRACTION (2011-2013)........................................................................................................... 20
FIGURE 11. SAMPLE ARIZONA WORK ZONE CRASHES INVOLVING DRIVER
IMPAIRMENT (2011-2013) ............................................................................................................ 20
FIGURE 12. SAMPLE ARIZONA WORK ZONE CRASHES BY AGE GROUP (2011-2013) ................................. 21
FIGURE 13. SAMPLE ARIZONA WORK ZONE CRASHES INVOLVING LACK OF SAFETY
RESTRAINT (2011-2013)................................................................................................................ 21
FIGURE 14. SAMPLE ARIZONA WORK ZONE CRASHES BY POSTED SPEED AND SEVERITY (2011-2013) .... 22
FIGURE 15. SAMPLE ARIZONA WORK ZONE CRASHES BY ROAD CONDITION AND
SEVERITY (2011-2013) .................................................................................................................. 23
FIGURE 16. SAMPLE ARIZONA WORK ZONE CRASHES BY HOUR AND SEVERITY (2011-2013) .................. 23
FIGURE 17. WORK ZONE INSTRUCTIONS FOR ARIZONA CRASH REPORT FORM ........................................ 25
FIGURE 18. ARIZONA CRASH REPORT FORM WITH LANE SHIFT/CLOSURE ERRONEOUS LISTING ............. 25
FIGURE 19. IOWA DOT QUEUE DETECTION SYSTEMS ................................................................................ 27
FIGURE 20. IOWA TRAFFIC CRITICAL PROJECT PLAN OVERLAY .................................................................. 28
FIGURE 21. FLORIDA DOT TSMO OUTREACH GRAPHIC.............................................................................. 30
FIGURE 22. PROCESS FOR TIM AS PART OF WORK ZONE MANAGEMENT ................................................. 34
FIGURE 23. CHECKLIST FOR DESIGN PHASE WORK ZONE MANAGEMENT USING TIM CONCEPTS............ 35

List of Tables
TABLE 1. ARIZONA WORK ZONE CRASHES BY INJURY SEVERITY ................................................................... 4
TABLE 2. ARIZONA WORK ZONE CRASHES BY YEAR AND INJURY SEVERITY................................................ 12
TABLE 3. ARIZONA WORK ZONE CRASHES BY AMBIENT LIGHT CONDITION AND INJURY
SEVERITY (2004-2013) ................................................................................................................. 12
TABLE 4. ARIZONA WORK ZONE CRASHES BY ROUTE TYPE AND INJURY SEVERITY (2004-2013) ............... 13
TABLE 5. ARIZONA WORK ZONE CRASHES BY CRASH TYPE AND INJURY SEVERITY (2004-2013)................ 13
TABLE 6. SAMPLE ARIZONA WORK ZONE CRASHES BY ROUTE AND SEVERITY (2011-2013) ...................... 18
TABLE 7. SAMPLE ARIZONA WORK ZONE CRASHES BY COLLISION MANNER AND
SEVERITY (2011-2013) .................................................................................................................. 19
TABLE 8. SAMPLE ARIZONA WORK ZONE CRASHES BY LIGHT CONDITION AND
SEVERITY (2011-2013) .................................................................................................................. 19

List of Acronymns
ADOT Arizona Department of Transportation
ALERT Arizona Local Emergency Response Team
ALISS Accident Location Identification Surveillance System
CCTV closed circuit television
DMS dynamic message sign
DOT department of transportation
FHWA Federal Highway Administration
HCRS Highway Condition Reporting System
ITS intelligent traffic systems
MSLT Maintenance Servant Leadership Team
PVMS portable variable message sign
SR state route
TIM traffic incident management
TMC traffic management center
TMS traffic management system
TDOT Tennessee Department of Transportation
TSMO transportations systems management and operation
TRACS Transportation Accounting System
TTC temporary traffic control
1
EXECUTIVE SUMMARY
A work zone is the area of a trafficway subject to construction, maintenance, or utility work. It extends
from the first warning sign indicating a work area to the END ROAD WORK sign. The “Arizona Crash
Report Forms Instruction Manual” defines a work zone crash as a traffic crash in which the first event
occurs within the boundaries of a work zone or on an approach to or exit from a work zone, resulting
from an activity, behavior or control related to the movement of the traffic units through the work zone.
This would include crashes related to queues created by the work zone activities, even if the queue
extended beyond the END ROAD WORK sign.
While work zone fatal crashes had decreased in recent years, they trended upward both nationally and
in Arizona in 2014 and 2015. The Arizona Department of Transportation (ADOT) 5-year Construction
Program has shifted emphasis from constructing new roadways to preserving existing facilities, which
will mean more active work zones that must accommodate live traffic. The more live traffic going
through work zones may result in an increase in work zone related crashes.
This research effort included analysis of work zone crashes identified in the ADOT Accident Location
Identification Surveillance System (ALISS) database to determine accuracy of data. Research was also
intended to include analysis of work zone traffic control plans to identify contributing factors associated
with crashes. Having the consistent and complete documentation for the work zone traffic control plan
would assist engineers in identifying field conditions that may contribute to the crash causation. During
the course of this study, it was difficult to retroactively identify the work zone traffic control plan that
was in place at the time a work zone crash occurred. Instead, the research focus changed to identifying
contributing factors from police crash reports, as well as making recommendations for improving
accuracy of crash data.
The research team initially queried 29,877 crashes that the ALISS database identified as occurring in
work zones for the 10 years from 2004 through 2013. Approximately 11 percent of these crashes were
misidentified as work zone crashes. Analysis indicated that certain errors were associated with changes
in the Arizona police crash report form in 2009. Further database queries were refined to produce actual
work zone crash data, which was analyzed in Chapter 3 of this report.
The research team also analyzed a three-year sample of 300 work zone crash reports to obtain certain
details, including field conditions noted by investigating police officers. Review of the sample revealed
that only 191 of the 300 crashes occurred in actual work zones, an error rate of 36 percent. Examining
the 191 remaining reports identified crash patterns on two interstate locations:
Nighttime road departure crashes associated with the use of temporary yellow reflective tabs
(rather than permanent markings) for the left edge line (Interstate 10)
Daytime rear-end crashes due to limited view of the work zone related to queues caused by
horizontal and vertical curves (Interstate 15)

2
Some or all of the data inaccuracies observed can lead to misidentifying both high-crash locations and
the type of work zone where the crashes occurred, making it difficult for engineers to develop
appropriate countermeasures to reduce the crash potential of a work zone.
Changes made in 2009 to the Arizona police crash report form led to a significant decrease of 74 percent
in the number of crashes flagged as work zone crashes in the ADOT ALISS database. This can create
issues in conducting before and after safety evaluations that incorporate work zone crash data before
and after 2009, which can lead to erroneous conclusions on the effectiveness of safety countermeasures
in work zones.
It is currently difficult to identify the work zone set-up that was in place at the time a crash occurred
within a work zone. Having the data for the work zone set-up would assist engineers in identifying field
conditions that may contribute to the crash causation.
ADOT requires that a work zone review be performed when a work zone experiences a significant crash
or a re-occurrence of vehicular crashes. However, discussions with ADOT personnel indicated that these
reviews are not conducted on a regular basis, removing the opportunity to identify timely changes in the
work zone traffic control to decrease the potential for additional crashes.
Of multiple recommendations offered in Chapter 5 for ADOT’s consideration, the following key ones are
generalized here:
Improve the accuracy of crash reporting by revising the police crash report form.
Standardize documentation of work zone traffic control information so as to verify field
conditions at the time of a crash.
Conduct work zone crash reviews and work zone safety reviews on construction projects.
During temporary traffic control (TTC) training, stress adherence to ADOT’s policy of installing
permanent edge line markings before opening the far left lane on divided highways.
In training, stress using various types of queue management to prevent daytime rear-end
crashes.
Expand the use of temporary intelligent transportation systems in work zones.
Enhance traffic incident management planning for work zones.

3
INTRODUCTION CHAPTER 1.
The Arizona Department of Transportation (ADOT) defines a work zone in its “Arizona Crash Report
Forms Instruction Manual” as an area of a trafficway with highway construction, maintenance, or utility
work activities. A work zone is typically marked by signs, channelizing devices, barriers, pavement
markings, and/or work vehicles. It extends from the first warning sign or flashing lights on a vehicle to
the “End of Work” sign or the last traffic control device. A work zone may be for short or long durations
and may include stationary or moving activities.
The “Arizona Crash Report Forms Instruction Manual” defines a work zone crash as a traffic crash in
which the first event occurs within the boundaries of a work zone or on an approach to or exit from a
work zone, resulting from an activity, behavior,r or control related to the movement of the traffic units
through the work zone. This definition includes collision and non-collision crashes occurring within the
signs or markings indicating a work zone or occurring on approach to, exiting from, or adjacent to work
zones that are related to the work zone.
Work zones present conditions that can violate driver expectancy that can increase the risk of a traffic
crash. NCHRP Report 500, Volume 17, A Guide for Reducing Work Zone Collisions (Antonucci et al 2005),
provides the following work zone crash statistics from a national perspective:
More than half of all fatal work zone crashes occurred during the day.
Fatal work zone crashes occurred most often during the summer months.
Almost 30 percent of fatal work zone crashes occurred on Interstate roadways.
Almost 60 percent of fatal work zone crashes occurred on roads with a posted speed limit of 55
mph or greater.
Single vehicle crashes accounted for over half of all fatal work zone crashes.
Ten percent of all work zone fatalities were pedestrians and bicyclists.
Heavy trucks were involved in more than 20 percent of fatal work zone crashes.
Alcohol was involved in almost 40 percent of fatal work zone crashes.
Rear-end fatal crashes were 2.7 times as common in work zones as in all fatal crashes.
Work zone crashes are typically associated with traffic queues caused by the work zone condition; for
example, approximately 50 percent of total work zone crashes in Michigan are due to stopped or
slowing traffic (Roelofs and Brookes 2014).
From the ADOT Accident Location Identification Surveillance System (ALISS) database, the most
commonly quoted statistics for Arizona work zone crashes were that almost 30,000 crashes occurred in
the 10 years ending in 2013. However, as discussed in Chapter 2, this study found an 11 percent error
rate in those figures. Refined ALISS queries showed that work zone crashes in that 10-year period, 2004
through 2013, numbered closer to 27,000 crashes in Arizona work zones, as summarized in Table 1.

4
Table 1. Summary of Arizona Work Zone Crashes (2004-2013)
Year Fatal
Crashes
Incapacitating Injury Crashes
Total Crashes
2004 9 97 3513 2005 15 81 3527 2006 23 103 4307 2007 19 114 4820 2008 13 109 4934 2009 1 25 1460 2010 5 19 1220 2011 5 19 1089 2012 4 24 795 2013 8 21 1006
Total 102 612 26671
While work zone fatal crashes had decreased in recent years, they trended upward both nationally and
in Arizona in 2014 and 2015. ADOT’s 5-year Construction Program has shifted emphasis from
constructing new roadways to preserving existing facilities, which will lead to more active work zones
that must accommodate live traffic. This will lead to more road user exposure in work zones, which may
lead to an increase in work zone related crashes. It is imperative to understand the contributing causes
of work zone crashes to then be able to implement improvements to work zone traffic control design
and management.
Recommendations for traffic safety improvements are frequently based on causes identified in police
crash reports; therefore, it is important that crash reports reflect the actual contributing factors to the
crash. However, current methods of reporting and recording crash data may fall short of this due to:
Inaccurate or incomplete representation on the crash report of the crash characteristics due to:
o Limited law enforcement expertise in accurate identification of contributing factors
o Inconsistencies in crash reporting
o Uncertainty about whether the crash occurred in a work zone
o Lack of information about the work zone, including work zone limits
Inaccurate or incomplete input of data from the crash report form into ADOT’s ALISS crash
database
Figure 1 illustrates the process of crash data from crash to input into the ALISS database.

5
Figure 1. Flow of Data from Crash Occurrence to ADOT’s Crash Database
This research effort included analysis of crashes coded in the ALISS database as work zone crashes to determine accuracy of data and to identify contributing factors associated with work zone crashes. The research also compared information from work zone crash reports to the data in the ALISS database so as to identify inconsistencies.

6

7
RESEARCH METHODOLOGY CHAPTER 2.
The ADOT approach to work zone safety is defined in these core agency documents:
Implementation Guidelines for Work Zone Safety & Mobility, Revised May 2009
ENG 07-3, ADOT Work Zone Safety & Mobility Policy
Arizona Supplement to the Manual on Uniform Control Devices, Revised January 2012
Traffic Control Guidelines, Revised October 2011
Construction Manual, January 2005
Crash data for the 10-year period from 2004 through 2013 were obtained from ADOT in Incident, Unit,
and Person worksheets. The Incident worksheet was queried on the “WorkZoneRelatedFlag” field to
identify crashes occurring in work zones. The Unit worksheet was queried on the “Road Condition” field
to identify additional characteristics of the work zone, including:
Lane closure
Lane shift/closure
Work on shoulder or median
Intermittent or moving work
Work zone other
Workers present
The initial research plan included analyzing 100 work zone crash reports and comparing the crash data
with the actual setup of the work zone at the time of each crash. It was anticipated that the Temporary
Traffic Control (TTC) plans for the 100 crash locations would be readily available to identify contributing
factors in work zone crashes. Other documentation might also be examined to determine the actual
work zone layout at the time of the crashes:
Work Zone Crash Reviews: When a work zone is the scene of a significant crash or repeated
crashes, a work zone review is supposed to be performed by the resident engineer and/or the
regional traffic engineer.
Photographs: Pictures taken during the crash investigation, documenting the crash scene and of
the work zone setup
Videotapes: Videotapes of active work zones taken when inspected by construction operations
traffic control coordinators
Inspector Daily Diaries: Inspectors responsible for traffic control setup and monitoring make
daily entries related to work zone setup, including notes regarding any crashes that occurred.

8
At the start of the data collection process, ADOT personnel indicated that district offices institutional
knowledge would be required to identify roadwork projects and their Transportation Accounting System
(TRACS) numbers to assist in locating TTC plans. Typically, these TTC plans are designed and
implemented prior to road construction and maintenance activities and, due to field revisions, may not
accurately reflect the traffic control in the field at the time of a crash.
Attempts were made to obtain work zone traffic control information (TTC plans, photos, reports from
inspectors) for the locations of the crashes for which crash reports were obtained. ADOT Construction
Operations personnel conducted electronic searches and met with ADOT Tucson District staff to obtain
additional information on the work zones. Challenges in finding this information included:
Many TTC plans examined didn’t have ADOT TRACS numbers, making it difficult to match the
plans to the project location.
Only 5 out of 10 TTC plans reviewed had associated inspector diaries.
Inspector diaries did not provide information on the crashes.
Some TTC plans didn’t reference the specific traffic control setup that was in place at the time of
the crash.
TTC plans change in the field on a frequent basis, making it difficult to accurately identify the
conditions at the time of the crash.
Work zone crash reviews are not conducted on a regular basis.
Inconsistency exists among ADOT districts in documenting the field conditions in a work zone
after a crash occurs.
Dealing with the difficulties in obtaining accurate traffic control plans moved the study in a different
direction. It was determined that even if specific traffic control information could be obtained after
much effort, the information would probably not accurately show field conditions at the time of each
crash. The original research methodology — comparing 100 work zone crashes to the traffic control
plans — was changed. The revised methodology would analyze 300 work zone police crash reports by
relying more heavily on the reporting officer’s narrative for information on the work zone setup. The
research focus changed to:
Improving accuracy of identifying crash locations and characteristics by analyzing crash reports
and the ALISS database
Identifying contributing factors from police crash reports
Crash reports were obtained from ADOT’s Traffic Records Section for the following types of crashes
flagged as occurring in work zones on ADOT facilities from 2011 through 2013:
All fatal crashes (18 crashes)
All incapacitating injury crashes (33 crashes)
A mix of non-incapacitating injury and possible injury crashes, with an emphasis on selecting crash cluster locations (249 crashes)

9
ANALYSIS FINDINGS CHAPTER 3.
Preliminary Analysis of Flawed Data
ADOT ALISS crash data for 2004 through 2013 were queried for work zone-related crashes and analyzed.
It was learned that approximately 11 percent of these 29,877 crashes were not work zone related, so
the database queries were refined and re-analyzed.
Note that the initial queries that yielded the inaccurate data are the queries currently used for the ALISS
database. Highlights of the initial crash data included:
29,877 work zone crashes (2.5 percent of all crashes in Arizona)
32 percent of work zone crashes occur on ADOT roads
131 fatal work zone crashes (1.5 percent of all fatal crashes)
49 percent of fatal work zone crashes occur on ADOT roads
Young drivers over-represented – 26 percent of crashes (11 percent of licensed drivers)
58 percent decrease in work zone crashes after 2008
o Average of 4,220 crashes/yr for 2004-2008
o Average of 1,755 crashes/yr for 2009-2013
Reasons for this decrease in work zone crashes after 2008 may include:
Change in Crash Report Form on January 1, 2009 (old form listed “under construction” and
“under repair” within the “Unusual Road Condition” section; new form lists “work zone” check
boxes within the “Contributing Circumstances – Road” section
Overall crash decrease due to impacts of recession on vehicle miles traveled
Possible decrease in number of active work zones
Further Errors in Data
Review of the data from fatal and incapacitating injury work zone crash reports provided by ADOT
showed that the majority of these crashes did not occur in work zones. The crashes were coded as
“work zone related” in the ALISS database, but review of the original police crash reports indicated that:
12 of 18 fatal crashes were incorrectly flagged as work zone crashes
19 of 33 incapacitating injury crashes were incorrectly flagged as work zone crashes
This is an error rate of 61 percent. Review of the 31 crashes inaccurately coded as work zone crashes
revealed that the errors occurred in the “Road Condition” field, which uses information from the
“Contributing Circumstances – Road” section of the police crash report form shown in Figure 2.

10
Figure 2. Arizona Police Crash Report Form - Contributing Circumstances
These errors included:
26 crashes coded as “obstruction in roadway” which included animal, downed motorcycle,
pedestrian, abandoned vehicle, vehicle from prior crash, rock, and bicyclist
4 crashes coded as “other” under “work zone” which included 3 with water on the road and 1
weather-related
1 crash coded as “intermittent or moving work” which was actually a dust storm
This preliminary analysis of crash reports indicated that 84 percent of the coding error was due to the
contributing circumstance of “obstruction in roadway” being flagged as work zone related. ADOT Traffic
Records Section staff indicated that this specific error could be readily addressed within the ALISS crash
database. Other errors may need to be addressed with a future revision to the crash report form.
After discovering these errors, a more detailed review of the ALISS database was conducted for the
29,877 crashes that were flagged as work zone crashes. Up to 14 percent of the 29,877 crashes may be
incorrectly flagged as work zone crashes based on the following entries in the “Road Condition” field:
1,965 “obstruction in roadway”
1,436 “work zone other”
127 “road surface condition”
185 “debris”
72 “changing road width”
308 “no contributing circumstance”
222 “no data”
These entries do not appear in the database for crashes occurring prior to 2009, which is when the
Arizona police crash report form was revised. Figure 3 shows the “Unusual Road Condition” section of
the pre-2009 Arizona police crash report form.

11
Figure 3. Arizona Police Crash Report Form (Pre-2009) - Contributing Circumstances
Data from Refined ALISS Queries
To address the inaccurately flagged work zone crashes, the crash data in the ALISS database were
filtered on the following “Road Condition1” and “Road Condition2” entries:
Lane closure
Lane shift/closure
Work on shoulder or median
Intermittent or moving work
Workers present
Work zone other
Since the “Work Zone Other” road condition was also shown to be in error, crashes with this code were
further filtered on “Road Condition 2” equal to one of the first 5 bulleted items above or “Traffic Control
Device” equal to “Warning Sign” or “Person.” This filtering produced 26,671 work zone crashes, a
decrease of 11 percent from the 29,877 crashes currently flagged in the “Work Zone Related” field.
This data shows that during the 10 years from 2004 through 2013 in Arizona, there were 26,671 work
zone crashes (2.2 percent of all Arizona crashes) and 102 fatal work zone crashes (1.2 percent of all fatal

12
Arizona crashes). The frequency of crashes flagged as work zone crashes dropped beginning in 2009,
after the Arizona police crash report form was revised. The annual work zone crash average dropped 74
percent after 2008: from an average of 4,220 crashes per year (2004-2008) to an average of 1,114
crashes per year (2009-2013).
The change in work zone crash frequency occurred over the 5-year period from 2009 through 2013; the
filtered, or scrubbed, data did not impact the crash frequencies for 2004 through 2008. The overall
decrease in work zone crash frequency for 2009 through 2013 (pre-scrubbed to post-scrubbed) is
approximately 37 percent. This 5-year period is considered more accurate due to the additional
scrubbing of data; the date shows that there were 5,570 work zone crashes (1.1 percent of all crashes)
and 23 fatal crashes (0.6 percent of all fatal crashes) in work zones in Arizona. Crash analysis findings for
the scrubbed data are shown in Tables 2 through 5 and Figures 4 through 9.
Table 2. Arizona Work Zone Crashes by Year and Injury Severity
Year Fatal Crash
Incapacitating Injury Crash
Non- Incapacitating Injury Crash
Possible Injury Crash
No Injury Crash
Total Crashes
2004 9 97 384 592 2431 3513
2005 15 81 344 522 2565 3527
2006 23 103 420 716 3045 4307
2007 19 114 436 746 3505 4820
2008 13 109 478 737 3597 4934
2009 1 25 139 203 1092 1460
2010 5 19 104 163 929 1220
2011 5 19 133 173 759 1089
2012 4 24 79 104 584 795
2013 8 21 98 131 748 1006
Total 102 612 2615 4087 19255 26671
Table 3. Arizona Work Zone Crashes by Light Condition and Injury Severity (2004-2013)
Light Condition Fatal Crash
Incapacitating Injury Crash
Non-Incapacitating Injury Crash
Possible Injury Crash
No Injury Crash
Total Crashes
Daylight 55 389 1714 3108 14455 19721
Dark 43 190 768 813 3934 5748
Dawn 4 32 117 152 773 1078
Dusk 0 1 12 12 69 94
Unknown 0 0 4 2 24 30
Total 102 612 2615 4087 19255 26671

13
Table 4. Arizona Work Zone Crashes by Route Type and Injury Severity (2004-2013)
Route Type Fatal Crash Serious Injury Crash Minor/No Injury
Crash Total
Crashes
US/State Route 24 121 4075 4220
Interstate 16 77 3667 3760
Non-ADOT 62 414 18215 18691
Total 102 612 25957 26671
Table 5. Arizona Work Zone Crashes by Crash Type and Injury Severity (2004-2013)
Crash Type Fatal Crash
Incapacitating Injury Crash
Non- Incapacitating Injury Crash
Possible Injury Crash
No Injury Crash
Total Crashes
Rear End 17 178 982 2229 7649 11055
Sideswipe Same Direction 1 29 166 384 4313 4893
Single Vehicle 29 139 495 316 2652 3631
Angle 13 79 386 553 2449 3480
Left Turn 9 68 324 364 1076 1841
Other 9 18 60 50 427 564
Rear To Side 0 0 4 11 360 375
Head On 16 26 39 42 83 206 Sideswipe Opposite Direction 1 9 13 23 158 204
Pedestrian 6 43 78 50 18 195
Bicyclist 1 23 64 59 31 178
Unknown 0 0 3 2 24 29
Rear To Rear 0 0 1 4 15 20
Total 102 612 2615 4087 19255 26671

14
Figure 4. Arizona Work Zone Crashes Involving Driver Impairment (2004-2013)
Figure 5. Arizona Work Zone Crashes by Age Group and Severity (2004-2013)

15
Figure 6. Arizona Work Zone Crashes Involving Lack of Restraint (2004-2013)
Figure 7. Arizona Work Zone Crashes by Posted Speed and
Severity (2004-2013)
0
1000
2000
3000
4000
5000
6000
7000
8000
9000
0
50
100
150
200
250
300
25 -Under
30 - 35 40 - 45 50 - 55 60 - 65 70 - 75
Min
or/
No
Inju
ry C
rash
es
Fata
l an
d S
erio
us
Inju
ry C
rash
es
Speed (mph)
Crash Count by Posted Speed and Severity
Fatal Serious Injury Minor/No Injury

16
Figure 8. Arizona Work Zone Crashes by Hour and Severity (2004-2013)
Figure 9. Arizona Work Zone Crashes by Road Condition and Severity (2004-2013)

17
Analysis of Crash Reports
To discover field condition details at the time of work zone-related crashes, the researchers wanted to
examine the police reports filed for specific work zone crashes. This involved examining 300 crash
reports obtained from ADOT’s Traffic Records Section for the following work zone crashes occurring on
ADOT facilities from 2011 through 2013:
All fatal crashes (18 crashes)
All incapacitating injury crashes (33 crashes)
A mix of non-incapacitating injury and possible injury crashes, with an emphasis on selecting
crash cluster locations (249 crashes)
Review of the 300 crash reports revealed that only 191 of the crashes occurred in actual work zones, an
error rate of 36 percent that included these errors:
Crashes coded as “obstruction in roadway” were not in work zones (64 crashes).
Crashes coded as “work zone other” were not in work zones, including 7 secondary crashes due
to queues from previous crashes (27 crashes).
The corrected sample of 191 crash reports for work zone crashes occurring on ADOT facilities from 2011
through 2013 showed that:
The fatal work zone crashes numbered 6, not 18.
The serious injury crashes in work zones numbered 14, not 33.
The minor injury crashes in work zones numbered 171, not 249.
For those work zone crashes where an officer had listed the estimated driving speed for the at-fault
vehicle, it was found that:
24 percent of the vehicles were estimated to be driving at the posted speed limit.
52 percent were estimated at under the posted speed limit (average 22 mph under).
24 percent were estimated at over the posted speed limit (average of 14 mph over).
Tables 6 through 8 and Figures 10 through 16 highlight the findings from the review of the three-year
crash report sample.

18
Table 6. Sample Arizona Work Zone Crashes by Route and Severity (2011-2013)
Road Name Fatal Crash
Serious Injury Crash
Minor Injury Crash
Total Crashes
Interstate 10 3 5 44 52
State Route 101 1 2 48 51
Interstate 17
1 10 11
State Route 202
10 10
US Highway 60
9 9
State Route 303
7 7
Interstate 8 1
5 6
State Route 95
5 5
Interstate 40
4 4
Interstate 15
3 3
State Route 260
2 2
State Route 389
2 2
State Route 51
2 2
State Route 69
2 2
State Route 86
2 2
State Route 92
2 2
US Highway 95
2 2
State Route 85
1 1 2
US Highway 160
1 1 2
US Highway 93
1 1 2
Interstate 19
1 1
State Alternate 89
1 1
State Route 177
1 1
State Route 64
1 1
State Route 77
1 1
State Route 80
1 1
State Route 87
1 1
State Route 90
1 1
US Highway 191
1 1
State Business 40
1
1
State Route 264 1
1
State Route 347
1
1
State Route 72
1
1
Total 6 14 171 191

19
Table 7. Sample Arizona Work Zone Crashes by Collision Manner and Severity (2011-2013)
Table 8. Sample Arizona Work Zone Crashes by Light Condition and Severity (2011-2013)
Collision Manner Fata
l
Inca
pac
itat
ing
Inju
ry
No
n In
cap
acit
atin
g In
jury
Po
ssib
le In
jury
Tota
l
Rear End 3 11 60 58 132
Single Vehicle 3 2 19 5 29
Sideswipe Same Direction 1 7 5 13
Angle 4 4 8
Other 2 1 3
Left Turn 1 1 2
Sideswipe Opposite Direction 2 2
Head On 1 1
Pedestrian 1 1
Total 6 14 95 76 191
Light Condition Fata
l
Inca
pac
itat
ing
Inju
ry
No
n In
cap
acit
atin
g In
jury
Po
ssib
le In
jury
Tota
l
Daylight 4 9 58 54 125
Dark 2 4 34 20 60
Dusk 1 2 3
Dawn 3 3
Total 6 14 95 76 191

20
Figure 10. Sample Arizona Work Zone Crashes Involving Speeding or Distraction (2011-2013)
Figure 11. Sample Arizona Work Zone Crashes Involving Driver Impairment (2011-2013)

21
Figure 12. Sample Arizona Work Zone Crashes by Age Group (2011-2013)
Figure 13. Sample Arizona Work Zone Crashes Involving Lack of Safety Restraint (2011-2013)

22
Figure 14. Sample Arizona Work Zone Crashes by Posted Speed and Severity (2011-2013)
0
10
20
30
40
50
60
0
2
4
6
8
10
12
25 - Under 30 - 35 40 - 45 50 - 55 60 - 65 70 - 75
Min
or/
No
Inju
ry C
rash
es
Fata
l an
d S
erio
us
Inju
ry C
rash
es
Speed (mph)
Crashes by Posted Speed and Severity
Fatal Serious Injury Minor/No Injury

23
Figure 15. Sample Arizona Work Zone Crashes by Road Condition and Severity (2011-2013)
Figure 16. Sample Arizona Work Zone Crashes by Hour and Severity (2011-2013)

24
Location-Specific Crash Patterns
Further analysis of details in the sample police crash reports identified two work zone locations with a
pattern of crashes. On Interstate 10 (I-10) between mileposts 199.7 and 203.9, from September 22 to
October 22, 2011, there were three nighttime run-off-road left, rollover crashes with the following
conditions and characteristics:
Two lanes existed each direction, with an active construction project to widen to three lanes in
each direction.
Drivers indicated they were confused by the yellow reflective tabs along the left shoulder (there
were no yellow edgeline markings) and directed their vehicles to the left thinking it was a lane.
The posted speed limit was 65 mph, and the estimated vehicle speeds were 65 mph, 62 mph,
and unknown.
One vehicle vaulted the concrete barrier, landing in the opposite-direction lane.
One driver was cited for speed too fast for conditions; the other two drivers were not cited.
The crashes occurred in the same work zone, but each report noted a different road condition:
o Intermittent or moving work
o Work on shoulder or median
o Other
The second location with a crash pattern was on Interstate 15 (I-15) between mileposts 21.1 and 25.5.
There, between July 16 and September 30, 2012, three daytime rear-end crashes occurred with the
following conditions and characteristics:
One of the two travel lanes was closed.
The drivers claimed they did not see the stopped traffic due to horizontal and vertical curves;
the lane closure was on the far side of the curves.
The posted speed limit was 45 mph, and estimated vehicle speeds were 60 mph, 45 mph, and
unknown.
One driver was cited for inattention.
Two drivers were cited for inattention and speed too fast for conditions.
Two crash reports listed road conditions as lane closure and workers present.
One crash report noted lane closure and lane shift/closure.
A fourth similar daytime crash on I-15 occurred on July 28, 2013, at milepost 12.7. The crash had the
following conditions and characteristics:
A lane closure created 3-mile-long vehicle queues.
The posted speed limit was 55 mph, and the estimated vehicle speed was 35 mph.
The road condition was listed as “other.”

25
Review of Arizona Police Crash Report Form
Some of the errors in identifying work zone crashes may be related to the format of the Arizona police
crash report form. The Arizona Crash Report Forms Instruction Manual defines a work zone crash as “A
traffic crash in which the first event occurs within the boundaries of a work zone or on an approach to or
exit from a work zone, resulting from an activity, behavior or control related to the movement of the
traffic units through the work zone. Includes collision and non-collision crashes occurring within the
signs or markings indicating a work zone or occurring on approach to, exiting from or adjacent to work
zones that are related to the work zone.” Figure 17 shows an excerpt from the manual defining the
Work Zone options to be listed on the crash report form.
Figure 17. Work Zone Instructions for Arizona Crash Report Form
Item B, Lane Shift/Crossover, is erroneously listed as Lane Shift/Closure on the actual crash report form
(Figure 18). Lane Shift/Closure is the most frequently cited work zone condition in the ALISS database;
approximately 85 percent of the crashes flagged as work zone crashes showed this entry.
Figure 18. Arizona Crash Report Form with Lane Shift/Closure Erroneous Listing

26

27
PRACTICES IN OTHER STATES CHAPTER 4.
Practices in other states demonstrate that opportunities exist to further enhance work zone safety.
Iowa’s Integrated Temporary Intelligent Transportation Systems
The Iowa Department of Transportation (DOT) is a best practice state for work zone safety, especially as
it pertains to monitoring traffic and responding to work zone crashes. Iowa has a standard construction
specification that requires contractors to provide temporary intelligent transportation systems (ITS)
capable of integration into the central operations software at the traffic management centers (TMCs).
This allows the TMC to monitor traffic conditions in and around work zones. The use of temporary ITS
monitoring of work zones can decrease the length of time to detect and verify incidents, thus
contributing to quickly clearing crashes (Simodynes 2014).
Iowa DOT uses wireless connectivity and construction special specifications to help alert drivers to
queues and to alert TMCs to emerging safety concerns. The figure below shows how the use of portable
variable message signs (PVMS), portable detectors, and portable CCTV cameras proactively monitor
traffic approaching a work zone.
Figure 19. Iowa DOT Queue Detection Systems

28
This temporary ITS is not only important for real-time information gathering, but also gathers data that
enables predictive operations in the future. Collecting queue information near work zones can lead to
better predictions in the future.
Temporary ITS needs, such as queue detection, are captured as part of a stand-alone traffic incident
management (TIM) report. The figure below shows how each plan sheet from the construction drawing
set is overlaid with TIM and ITS information. The links at the bottom of each sheet provide links to:
An overall map of the project
Critical areas to monitor for diversion decision making
Incident response options under moderate and low volume conditions
Agency contacts
DMS messages to be posted
Traffic control options at adjacent intersections
Figure 20. Iowa Traffic Critical Project Plan Overlay

29
Tennessee’s Queue Management and Secondary Crashes
The Tennessee Department of Transportation (TDOT) uses a strategy called “Protect the Queue” to
guard against secondary crashes. Secondary crashes are typically more lethal than initial crashes. TDOT
regularly emphasizes to its employees and emergency partners the importance of protecting drivers in
the queue through awareness/outreach and by providing training on effective queue management
techniques. In addition, each of TDOT’s 12 districts dispatch specially equipped “Protect the Queue”
trucks when advised of non-recurring traffic queues caused by construction, maintenance, special
events, or roadway incidents (FHWA 2015).
Florida’s Transportation Systems Management and Operations
Transportation systems management and operations (TSMO) is a set of strategies to anticipate and
manage traffic congestion, and minimize unpredictable causes of service disruption and delay, thus
maintaining roadway capacity while improving reliability and safety. The Florida Department of
Transportation (DOT) has developed a TSMO program over the years. The Florida DOT TSMO program
focuses on work zone management, including:
Automated speed enforcement
Coordination with traffic management centers
Focused training
Peer exchanges
Florida uses the following diagram to present the concept during outreach efforts.

30
Figure 21. Florida DOT TSMO Outreach Graphic

31
CONCLUSIONS AND RECOMMENDATIONS CHAPTER 5.
Work zone crashes in Arizona make up approximately 2 percent of all crashes and 1 percent of all fatal
crashes in the state. Work zone crashes were identified as an Emphasis Area in the 2014 Arizona
Strategic Highway Safety Plan. Accurate identification of work zone crashes, their locations, traffic
control setup, and crash contributing factors are key to addressing work zone crash issues. The following
conclusions and recommendations are based on analysis of ADOT’s ALISS database, police crash reports,
and available documentation of work zone traffic control plans.
Conclusions
It is currently difficult to identify the work zone set-up that was in place at the time a crash occurred
within a work zone. This can create issues in identifying any field conditions that may contribute to the
crash causation.
Current coding of work zone crashes in the ADOT ALISS database led to some inaccuracies in crashes
being flagged as work zone crashes. There are also inaccuracies in the identification of the type of work
zone that the crash occurred in. Some of these errors occur on the police crash report form, while other
errors occur in the database management of the crash data. These inaccuracies can lead to
misidentifying high crash locations and the type of work zone the crashes occurred in, making it difficult
for engineers to develop appropriate countermeasures to decrease the crash potential of the work zone.
Changes made in 2009 to the Arizona police crash report form led to a decrease, after 2008, of 74
percent in the number of crashes flagged as work zone crashes in the ADOT ALISS database. This
reporting variance can create issues in conducting before and after safety evaluations that incorporate
work zone crash data before and after 2009, which can lead to erroneous conclusions on the
effectiveness of safety countermeasures in work zones.
ADOT requires that a work zone review be performed when a work zone experiences a significant crash
or a re-occurrence of vehicular crashes. However, discussions with ADOT personnel indicate that these
reviews are not conducted on a regular basis, removing the opportunity to identify timely changes in the
work zone traffic control to decrease the potential for additional crashes.
Review of crash reports identified two location-specific crash patterns on interstate facilities — one on
Interstate 10 and one on Interstate 15:
Nighttime road-departure crashes associated with the use of temporary yellow reflective tabs
for the left edgeline (I-10)
Daytime rear-end crashes due to limited visibility of the work zone related to queues caused by
horizontal and vertical curves (I-15)

32
Recommendations
The following recommendations are offered for ADOT’s consideration.
Revise the queries used for identifying work zone crashes in the ALISS database. When using the “Road
Condition” field:
Don’t include “Obstruction in Roadway” as a work zone crash.
Use “Other” in combination with “Road Condition” equal “Lane Closure” or “Lane
Shift/Crossover” or “Work on Shoulder or Median” or “Intermittent or Moving Work” or
“Workers Present.”
Use “Traffic Control Device” equal “Warning Sign” or “Person.”
Improve the accuracy of crash reporting:
Simplify the existing work zone section on the police crash report form to make it less
susceptible to inaccurate reporting.
Correct the “Lane Shift/Closure” check box on the police crash report form to read
“Lane Shift/Crossover.”
Provide a “Queue” check box in the Work Zone Road Condition section of the crash report form.
Provide cross-training to reporting officers and to ADOT Traffic Records staff on work zone crash
reporting.
Evaluate using ADOT’s Highway Condition Reporting System (HCRS), which provides statewide
highway closure and restriction information, for obtaining additional information on work zone
locations to improve accuracy of locating crashes occurring within work zones.
Improve documentation of work zone traffic control information in ADOT Construction diaries,
Construction Inspection Quantlists, Temporary Traffic Control (TTC) plans, and police crash reports, so
that they include documentation of field conditions at the time of a crash. This will also help in defense
of claims against ADOT. ADOT is moving toward making electronic copies of all TTC plans, which should
make it easier to locate the plans. Improved documentation will provide a more accurate depiction of
the traffic control setup at the time of a work zone crash. Use TTC training to emphasize the importance
of the following items:
Include TRACs numbers on the TTC plans
Include date and time of initial set up and removal of TTC in Quantlists
Include TTC changes made in the field in Quantlists
Include TTC plan page numbers in the Quantlists
Conduct work zone crash reviews as required by ADOT Guidelines for Work Zone Safety & Mobility. This
crash review includes a site visit, review of police crash reports, interviews with construction staff and
contractor, and collaboration with the design engineer of record, district staff, and/or the regional traffic

33
engineer. When the review is complete, a report containing any recommended changes is sent to the
district engineer for a review to implement changes as necessary. As part of these reviews:
Establish the protocol for law enforcement to contact ADOT District personnel when a crash
occurs in a work zone.
Develop criteria for conducting these crash reviews.
Update standard specifications to require contractors to report crashes in work zones.
In addition to conducting work zone crash reviews, which are triggered by crashes, a more proactive
approach to identifying potential safety issues in work zones before crashes occur is to conduct Work
Zone Safety Reviews. ADOT should consider initiating a Work Zone Safety Review process, to include
developing criteria for conducting Work Zone Safety Reviews on construction projects such as:
Size of project
Stage(s) to conduct (e.g. during design of traffic control plans, after setup of traffic control
devices)
Who performs the review (consider including human factors, law enforcement, and risk
management perspectives)
The benefits of Safety Reviews for work zones include:
Identification of work zone traffic safety issues, most of which aren’t identified until a crash
occurs
Proactive nature anticipates driver errors
Focus on safety of all road users, including pedestrians and bicyclists, which oftentimes get
overlooked in work zone traffic control
Considers the 4 E’s of traffic safety (engineering, education, enforcement, emergency
services)
Recommendations can be incorporated into planning and design
Recommendations can be implemented immediately
Develop safety strategies for specific work zone crash types
To address nighttime road departure crashes associated with the use of temporary yellow reflective tabs
for the left edgeline on interstates, during TTC training stress the importance of adherence to ADOT’s
policy to install permanent edgeline markings before opening the far left lane on divided highways to
help address driver confusion associated with the use of temporary yellow reflective tabs.
To address daytime rear-end crashes due to limited visibility of the work zone related to queues caused
by horizontal and vertical curves, during TTC training stress the importance of the use of on-site law
enforcement, variable speed limit systems, and queue detection with Portable Changeable Message
Signs to address queue-related crashes.

34
Opportunities Developed from Other States’ Practices
Evaluation of work zone management practices in other states identified the following opportunities for
ADOT to consider.
Expand the Use of Temporary ITS
One of the critical parts of work zone management is queue monitoring. It is important for drivers and
TMC operators to know where the back of the queue is for quick mitigation of emerging safety concerns.
Portable changeable message signs (PCMS) are devices closest to the work zone that could provide real
time benefits with the ability to update the message as conditions change, especially with queue length
detection. An issue that may need to be addressed is the potential for hacking into the PCMS.
Enhance Traffic Incident Management Planning for Work Zones
Expanding the ADOT Guidelines for Work Zone Safety and Mobility to provide specific objectives
associated with stakeholder outreach to emergency responders will help increase readiness to respond
to crashes. For example, every significant project and certain non-significant projects should include
delivery of the National Traffic Incident Management Responder training. Delivering the training creates
a dynamic dialog based on real-world conditions while also helping to achieve the national goal of traffic
incident management training. ADOT’s Maintenance Servant Leadership Team (MSLT) and Arizona Local
Emergency Response Team (ALERT) should be included in this TIM training.
A mixture of training and “game planning” for possible response scenarios in work zones will help
improve incident clearance. The core concept of successful development of local TIM activities is a
three-tier process:
Figure 22. Process for TIM as Part of Work Zone Management
Talk about how well the plan worked
after the incident
Execute the plan during the incident
Plan for the incident before it happens
35
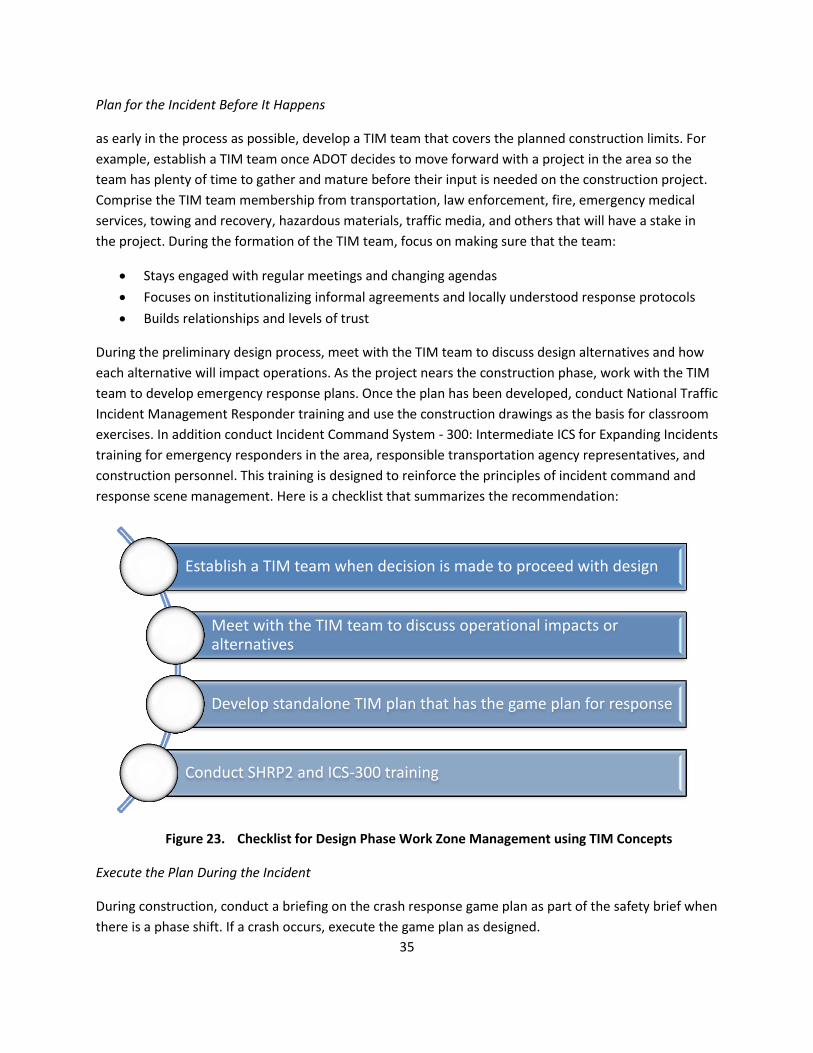
Plan for the Incident Before It Happens
as early in the process as possible, develop a TIM team that covers the planned construction limits. For
example, establish a TIM team once ADOT decides to move forward with a project in the area so the
team has plenty of time to gather and mature before their input is needed on the construction project.
Comprise the TIM team membership from transportation, law enforcement, fire, emergency medical
services, towing and recovery, hazardous materials, traffic media, and others that will have a stake in
the project. During the formation of the TIM team, focus on making sure that the team:
Stays engaged with regular meetings and changing agendas
Focuses on institutionalizing informal agreements and locally understood response protocols
Builds relationships and levels of trust
During the preliminary design process, meet with the TIM team to discuss design alternatives and how
each alternative will impact operations. As the project nears the construction phase, work with the TIM
team to develop emergency response plans. Once the plan has been developed, conduct National Traffic
Incident Management Responder training and use the construction drawings as the basis for classroom
exercises. In addition conduct Incident Command System - 300: Intermediate ICS for Expanding Incidents
training for emergency responders in the area, responsible transportation agency representatives, and
construction personnel. This training is designed to reinforce the principles of incident command and
response scene management. Here is a checklist that summarizes the recommendation:
Figure 23. Checklist for Design Phase Work Zone Management using TIM Concepts
Execute the Plan During the Incident
During construction, conduct a briefing on the crash response game plan as part of the safety brief when
there is a phase shift. If a crash occurs, execute the game plan as designed.
Establish a TIM team when decision is made to proceed with design
Meet with the TIM team to discuss operational impacts or alternatives
Develop standalone TIM plan that has the game plan for response
Conduct SHRP2 and ICS-300 training

36
Discuss the Plan After the Incident
An important part of improvement is reviewing what was done to identify strengths and weaknesses.
Conduct an after-action review within 48 hours after the incident. From a transportation agency
standpoint, it will be important to gather data to support a positive and progressive conversation. Some
examples of data will be screen shots from Google traffic taken during the incident by the TMC. Other
information should be recordings from traffic cameras (where available), communication logs from each
agency, and an initial assessment on how things went.

37
REFERENCES
Antonucci, Nicholas D., Kelly K. Hardy, James E. Bryden, Timothy R. Neuman, Ronald Pfefer, Kevin Slack,
NCHRP Report 500, Volume 17: A Guide for Reducing Work Zone Collisions, Transportation Research
Board, 2005.
Arizona 2014 Strategic Highway Safety Plan.
Federal Highway Administration, “Traffic Incident and Events Management Webpage,” accessed
September 15, 2015.
Roelofs, Tina, Chris Brookes, Synthesis of Intelligent Work Zone Practices, ENTERPRISE Pooled Fund
Study TPF-5(231), 2014.
Simodynes, Tim, “Intelligent Work Zones on Traffic Critical Projects,” presentation at National Rural ITS
Conference, Branson, Missouri, August 26, 2014.