
Addressing the Disproportionate Representation of Racially and Ethnically Diverse Students in...
45
Addressing the Disproportionate Representation of Racially and Ethnically Diverse Students in Special Education 2008-2009 SPR&I Regional Training
-
Upload
alexander-smithwick -
Category
Documents
-
view
217 -
download
1
Transcript of Addressing the Disproportionate Representation of Racially and Ethnically Diverse Students in...

Addressing the Disproportionate Representation of Racially and Ethnically
Diverse Students in Special Education
2008-2009 SPR&I Regional Training

2
Goals for today: Review indicators B4, 9 & 10 and the process used to
determine Significant Discrepancy and Disproportionate Representation due to Inappropriate Identification Significant discrepancy versus disproportionate
representation Required response if flagged for B4, 9, 10
Review worksheet content (9 & 10 only) Focus on data analysis Removing ambiguity in the referral – eligibility process
Review P to P content Focus on file review – compliance Articulating practice Team exercise/discussion
Corrective Action Planning (CAP) Elements of an effective plan

3
Indicator B4: Discipline Percent of districts identified by the State as
having a significant discrepancy in the rates of suspensions and expulsions of children with disabilities for greater than 10 days in a school year.
Significant discrepancy is defined as: a rate of suspension/expulsion of greater than 10
days based on chi-square analysis and/or a ≥1% suspension/expulsion rate of special education students within a district and
District must have at least 10 students in their SECC and not justified by unique district characteristics

4
Purpose of B4 Ensure FAPE for all students with
disabilities by: Reducing ambiguity of discipline procedures
across the district Address academic and behavior support
needs to assist a student in the LRE
5
IEP Team & IEP Team Considerations and Special Factors
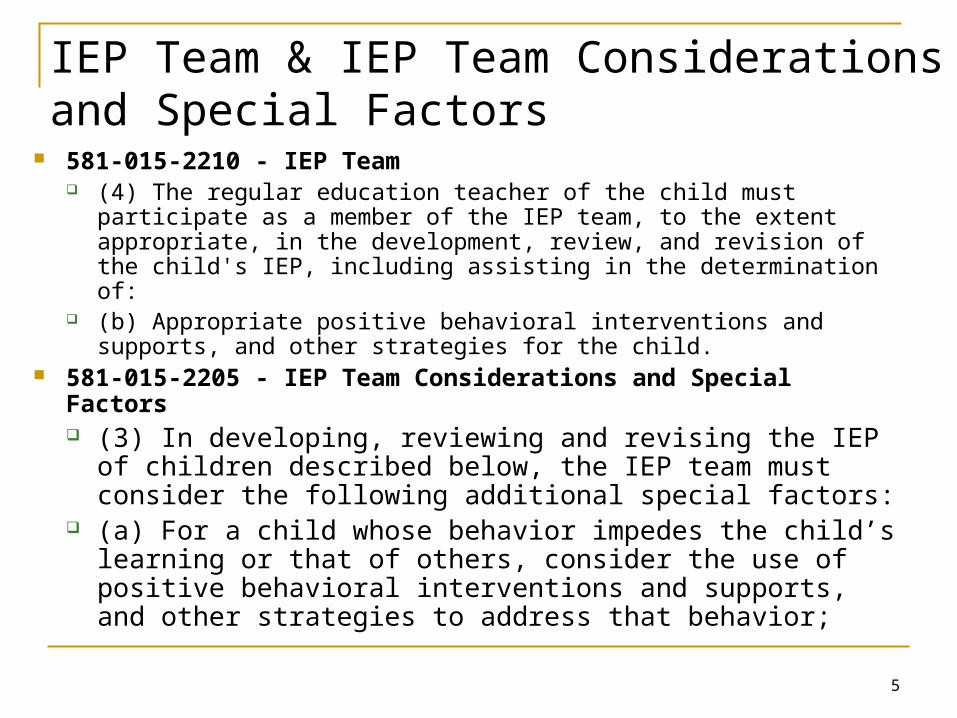
581-015-2210 - IEP Team (4) The regular education teacher of the child must participate
as a member of the IEP team, to the extent appropriate, in the development, review, and revision of the child's IEP, including assisting in the determination of:
(b) Appropriate positive behavioral interventions and supports, and other strategies for the child.
581-015-2205 - IEP Team Considerations and Special Factors (3) In developing, reviewing and revising the IEP of
children described below, the IEP team must consider the following additional special factors:
(a) For a child whose behavior impedes the child’s learning or that of others, consider the use of positive behavioral interventions and supports, and other strategies to address that behavior;

6
Disciplinary Removals of More than 10 School Days (Pattern or Consecutive) 581-015-2415
(3) Manifestation determination. Within 10 school days of any decision to change the placement of a child with a disability because of a violation of a code of student conduct, the school district must determine whether the child's behavior is a manifestation of the student's disability in accordance with OAR 581-015-2420.
(4) Manifestation. If the determination under subsection (3) is that the child's behavior is a manifestation of the child's disability, the school district must: (a) Return the child to the placement from which the child
was removed, unless…
AND

7
Disciplinary Removals of More than 10 School Days (Pattern or Consecutive) 581-015-2415 (cont)
(b) Either: (A) Conduct a functional behavioral assessment, unless
the school district conducted a functional behavioral assessment before the behavior occurred that prompted the disciplinary action, and implement a behavior intervention plan; or
(B) If the student already has a behavior plan, review the behavioral intervention plan and modify it, as necessary, to address the behavior.

8
2006-2007 B4: Activities
38 Districts were flagged in 2006-2007 OSEP required revision to ODE’s process
for determining “Significant Discrepancy” As a consequence of that finding, ODE
held a Policy to Practice (P to P) review with all 38 districts
Following the P to P, ODE mailed a letter to each district with required actions to be addressed in a corrective action plan (CAP)

9
What Was Learned? District special education personnel
need to verify discipline data submitted to ODE
Districts need discipline data collection system that captures low and high level discipline data
It is important to review and disseminate district policies on discipline for children with disabilities to all staff at least annually
Ensure appropriate implementation of discipline policies and procedures

10
B4:Next Steps
07-08 Flagged districts will need to verify data accuracy
including access to services for students suspended/expelled beyond 10 days
Flagged districts will need to complete policy to practice review
After policy to practice review districts will need to complete CAP based on ODE’s feedback
Process:
District submits Discipline Data
ODE applies threshold
Districts not meeting threshold are identified with Significant Discrepancy
ODE conducts policy to practice review with districts identified with Significant Discrepancy
After policy to practice review, District completes Corrective Action Plan (CAP)
ODE approves or rejects CAP
Rejected CAPs are revised by district until approved by ODE
11
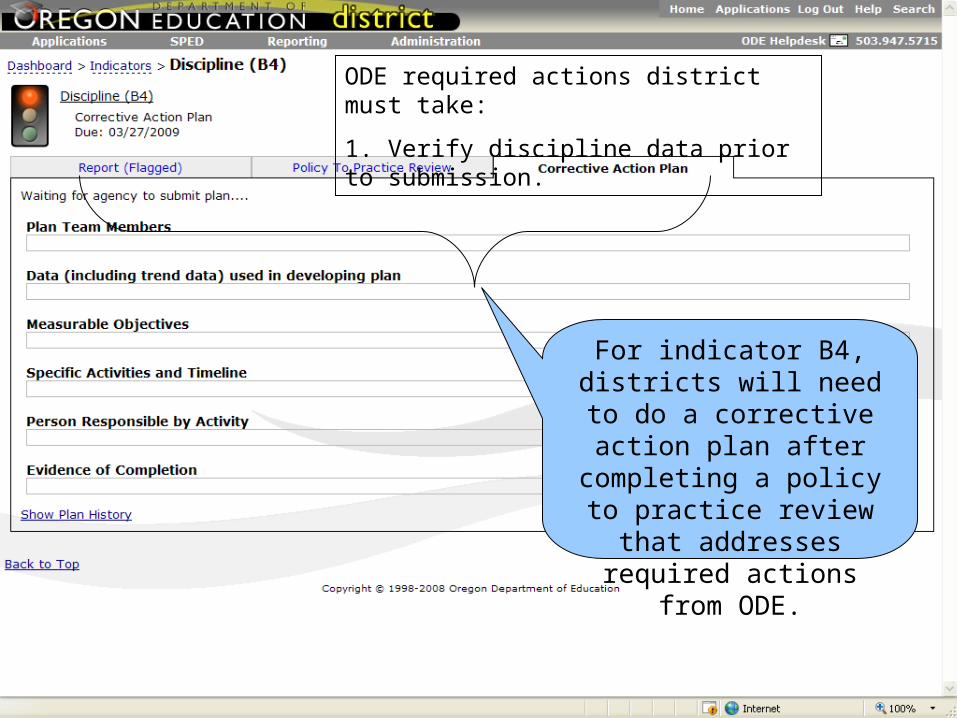
For indicator B4, districts will need to do a corrective action plan after completing a policy to practice review that addresses required
actions from ODE.
ODE required actions district must take:
1. Verify discipline data prior to submission.

12
General Guidelines for Corrective Action Plans
Activities should be: Observable Measurable Actionable Realistic
Activities should include: Timelines Responsibility assignment Technical assistance needs
Activities should align with larger district-wide improvement plan

13
Example ODE Recommendation:
Ensure the accurate and timely collection, analysis, review by district special education director, and reporting of suspension/expulsion data for students with disabilities.
District CAP District describes a clear process for review and
approval by the special education director prior to data submission in June.
Process includes: dates and names of individuals involved in the process
District provides a statement assuring that special education director reviewed and approved the data prior to submission
Assures the same process is being used this year

14
Example ODE Recommendation: Ensure IEPs are developed and implemented to
support the academic and behavioral needs of students eligible under IDEA.
District CAP District describes process in which they use an
appropriate data (that tracks and summarizes low and high level behaviors) to identify if students on IEPs demonstrate a “pattern” of behavioral difficulties.
AND For those students, with both low and high level
“patterns” of behavioral difficulty, district states that a Functional Behavioral Assessment (FBA) was conducted
AND A Positive Behavioral Intervention Plan exists

15
B4:Next Steps Continued FFY 2007 APR and 08-09 data
Revise measure for indicator for next APR submission due to inability to use worksheet content
Striving for balance in accountability and not being overly burdensome
One approach is to use a risk ratio similar to how indicators B9 and B10 are examined

16
IDEA: Regulations Require policies and procedures.
The State must have in effect, consistent with the purposes of 34 CFR Part 300 and with section 618(d) of the Act, policies and procedures designed to prevent the inappropriate overidentification or disproportionate representation by race and ethnicity of children as children with disabilities, including children with disabilities with a particular impairment described in 34 CFR 300.8 of the IDEA regulations. [34 CFR 300.173] [20 U.S.C. 1412(a)(24)]
Require collection and examination of data regarding disproportionality. Special education Special education by disability type Suspension and Expulsion (Discipline) LRE
Establish requirements for review and revision of policies, practices and procedures.
Require States to disaggregate data on suspension and expulsion rates by race and ethnicity.
Require States to monitor their LEA's to examine disproportionality.

17
IDEA: State Performance Plan and Annual Performance Report
Indicator 9: Percent of districts with disproportionate representation of racial and ethnic groups in special education and related services that is the result of inappropriate identification.
Indicator 10: Percent of districts with disproportionate representation of racial and ethnic groups in specific disability categories that is the result of inappropriate identification.

18
Purpose of B9 & B10
Reduce inappropriate referrals to special education by: Addressing general education instruction
and intervention polices and practices Addressing variability in referral rates by
race/ethnicity Addressing variability in evaluation process

19
Quality Instruction in General Education
Eligibility
Evaluation
Child Find, Referral
Gen Ed Behavioral Interventions:
SWPBS
Gen Ed Academic Interventions: SWRTI
Disproportionality

20
Annual APR
Indicator and PCR
Cycle
July
April
January
October
August
May
March
February December
November
June
May 09Districts continue to submit evidence of correction for 07-08 and 08-09 noncomplianceDistricts revise rejected improvement plans and CAPs
08-09 data populated for B5, 9 & 10 reports
Jan. 09Districts continue submitting 08-09 PCR data
Districts begin Improvement Plan for B1-2, 3, 5 & 11 based on 2007-2008 data (if required)
Districts begin Corrective Action Plans for B4, 9 & 10 based on 2007-2008 (if required)
April 09Districts submit evidence of correction for 07-08 and 08-09 noncompliance
ODE approves/rejects district improvement plans and CAPs
2008-2009
Aug. 08ODE disseminates Final Determinations
Nov. 08Districts submit evidence of correction for 06-07 noncompliance until 100% compliantWorksheets due for B5, 9 & 10 based on 07-08 data Policy to practice reviews for B4 (if required)Districts continue submitting 08- 09 PCR data
Dec. 08Policy to practice reviews for B9 & 10 (if required)Districts continue submitting 08-09 PCR data
Feb. 09APR due to OSEPDistrict 08-09 PCR data due end of month
March 09CC verify 08-09 PCR submission
Improvement Plan due end of month for B1-2, 3, 5, & 11 based on 07-08 dataCAPs due for B4, 9 & 10 (if required) Districts to verify public report card data
Oct. 08Districts submit evidence of correction for 06-07 noncompliance until 100% compliantSPR&I Annual Trainings ODE populates reports for B1-2, 3, 4, 5, 9, 10 & 11 with 07-08 data08-09 PCR report opens for submissionODE populates B1-2 report with 07-08 data
June 09Districts continue to submit evidence of correction for 07-08 and 08-09 noncompliance
July 08 Districts continue to submit evidence of correction for 07-08 and 08-09 noncompliance
ODE working on final determinations including correction of 07-08 noncompliance
September
Sept. 08Districts submit evidence of correction for 06-07 noncompliance until 100% compliant

21
Indicator B9: Disproportionate representation in special education
Measure: The percentage of IDEA eligible students disaggregated by
race/ethnicity differs by +/- 20% from the percentage of all students within the district disaggregated by race/ethnicity in at least one race/ethnic category
Weighted Risk Ratio analysis shows a value >2.0 or < 0.25 in the same race/ethnic category; and, There are at least 10 IDEA eligible students in the same
race/ethnic category in special education.
Process: District submits SECC Data
ODE conducts policy to practice review for unjustified districts
Based on policy to practice review, ODE determines if Disproportionate Representation due to inappropriate identification exists
Districts with Disproportionate Representation complete Corrective Action Plan
ODE applies threshold
Flagged districts complete worksheet by due date
ODE justifies district based on worksheet
Districts not meeting thresholds are Flagged in SPR&I
ODE approves or rejects CAP
Rejected CAPs are revised by district until approved by ODE

22
5.83 > 20% diff (2.60*1.20 = 3.12) = Over-representation &5.83 < -20% diff (2.60*.8 = 2.08) ≠ Under-representation
23
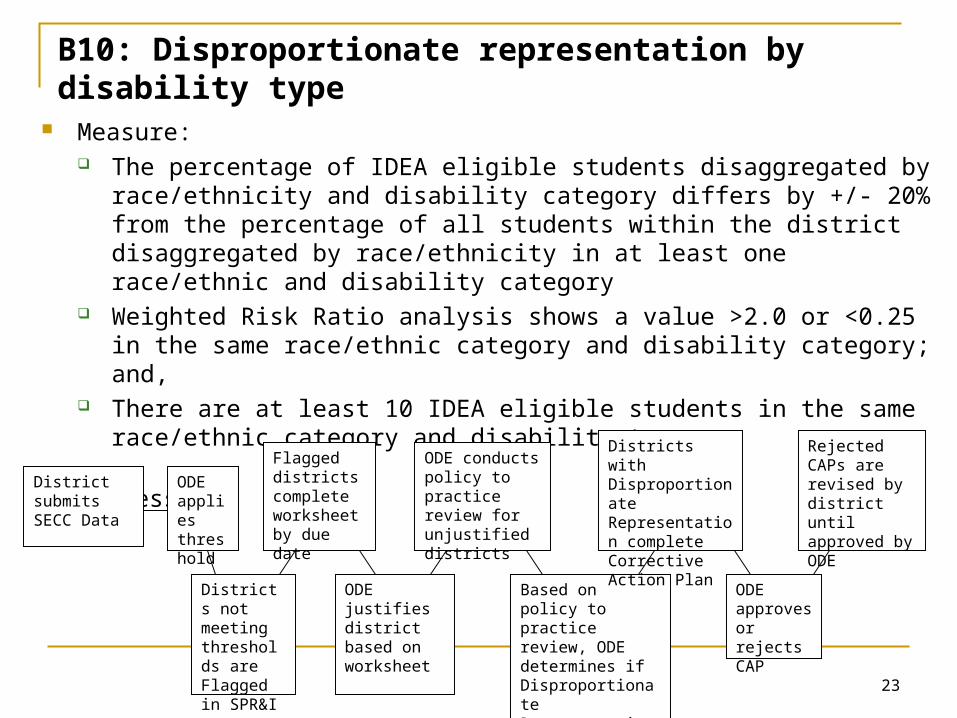
B10: Disproportionate representation by disability type
Measure: The percentage of IDEA eligible students disaggregated by
race/ethnicity and disability category differs by +/- 20% from the percentage of all students within the district disaggregated by race/ethnicity in at least one race/ethnic and disability category
Weighted Risk Ratio analysis shows a value >2.0 or <0.25 in the same race/ethnic category and disability category; and,
There are at least 10 IDEA eligible students in the same race/ethnic category and disability type.
Process:
District submits SECC Data
ODE conducts policy to practice review for unjustified districts
Based on policy to practice review, ODE determines if Disproportionate Representation due to inappropriate identification exists
Districts with Disproportionate Representation complete Corrective Action Plan
ODE applies threshold
Flagged districts complete worksheet by due date
ODE justifies district based on worksheet
Districts not meeting thresholds are Flagged in SPR&I
ODE approves or rejects CAP
Rejected CAPs are revised by district until approved by ODE

24

25

26
1.21 > 20% diff (.56*1.20 = .67)= Over-representation &1.21 < -20% diff (.56*.8 = .45) ≠ Under-representation
27
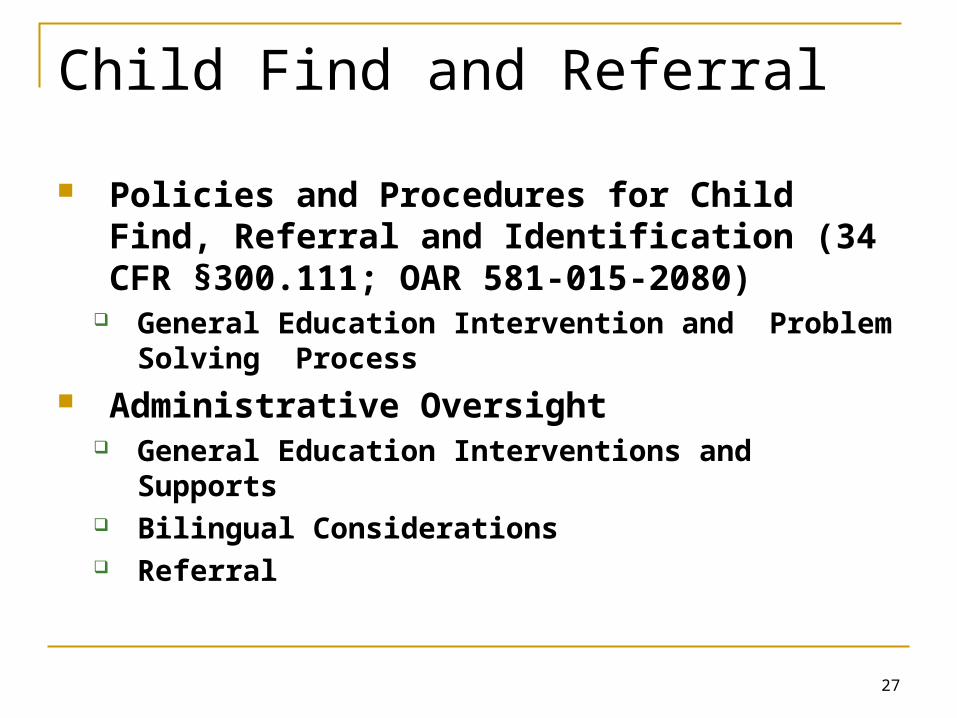
Child Find and Referral
Policies and Procedures for Child Find, Referral and Identification (34 CFR §300.111; OAR 581-015-2080)
General Education Intervention and Problem Solving Process
Administrative Oversight General Education Interventions and
Supports Bilingual Considerations Referral

28
Evaluation & Eligibility
Evaluation (34 CFR §300.201; OAR 581-015-2105) Assessment Tools and Strategies
Eligibility (34 CFR §§ 300.301 through 300.311; OAR 581-015-2120) Eligibility Decision Making Process

29
B9 & 10 Worksheet: Purpose and Expectations
Focus on Data Analysis: Pre-referral, Referral, Evaluation/Eligibility Referral and placement data disaggregated by
ethnicity, primary disability, socio-economic status
New students to special education – where were they coming from?
Least Restrictive Environment Suspension, expulsion, attendance and high
school completion Transfer students

30
B9 & 10 Policy to Practice: Purpose and Expectations Focus on Compliance: Pre-referral, Referral,
Evaluation/Eligibility Review Indicator reports in SPR&I. Review the worksheet submitted for Indicator. Review original files (initial referral, most recent
evaluation, and IEP) for 10% of the students in special education who are included in the potentially disproportionate representation group(s).
Complete step one based on district policies and procedures.
Complete step two based on the sample of files reviewed.
Submit these completed document(s) to the ODE using the SPR&I upload process.

31
Districts will need to do a corrective action plan after completing a policy to practice review that addresses required actions from ODE.
Revised CAP now contains separate text boxes for each content area.
ODE required actions district must take:
1. Collect and analyze pre-referral data by race/ethnicity.
ODE is able to provide feedback and will reject or approve CAP once it is submitted.Rejected CAPs will need to be resubmitted until approved.

32
General Guidelines for Corrective Action Plans
Activities should be: Observable Measurable Actionable Realistic
Activities should include: Timelines Responsibility assignment Technical assistance needs
33
Where you begin to address disproportionality...

34
SYST
EMS
PRACTICES
DATASupportingStaff Behavior
SupportingDecisionMaking
SupportingStudent Academic Achievement and Behavior
OUTCOMES
Equitable use of general education prevention/intervention efforts and accurate referral and proper identification

35
Data Critically examine your district data and provide
your schools with their own data to discuss Overall S.E. prevalence rate Percentage of students in S.E. by ethnic group Risk Ratios S.E. referral and placement rates
Referral and placement (LRE) data disaggregated by ethnicity, primary disability, socio-economic status
Discipline Graduation/Drop-Out Transfer students New students to special education – where are they
coming from?

36
Special Education Students and Fall Membership by Ethnicity , 2007-08
2.20%4.84%
3.03%
17.13%
72.80%
3.05% 2.63%4.42%
15.92%
73.97%
0.00%
10.00%
20.00%
30.00%
40.00%
50.00%
60.00%
70.00%
80.00%
Native American Asian Black Hispanic White
2007-08 FM
2007-08 SECC
37
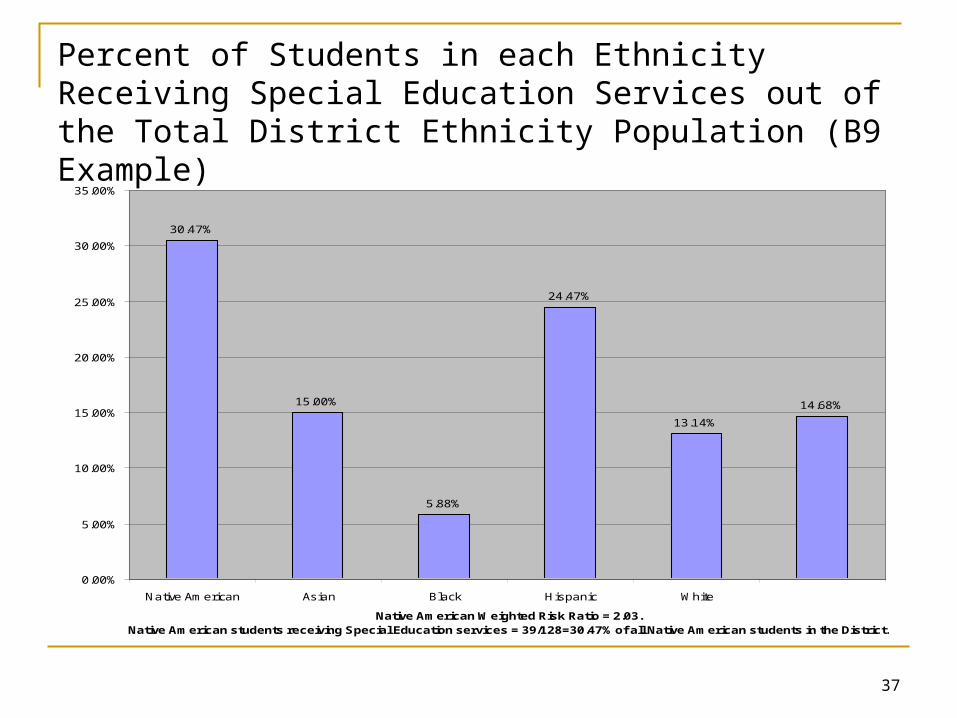
Percent of Students in each Ethnicity Receiving Special Education Services out of the Total District Ethnicity Population (B9 Example)
30.47%
15.00%
5.88%
24.47%
13.14%
14.68%
0.00%
5.00%
10.00%
15.00%
20.00%
25.00%
30.00%
35.00%
Native American Asian Black Hispanic White
Native American Weighted Risk Ratio = 2.03.Native American students receiving Special Education services = 39/128=30.47% of all Native American students in the District.

38
Percent of Students Receiving Special Education Services Compared to Percent of Students in District by Ethnicity for Mental Retardation (B10 Example)
4.863.34 3.65
27.05
61.09
1.79
4.38
1.20
31.55
61.09
.00
10.00
20.00
30.00
40.00
50.00
60.00
70.00
Native American Asian Black Hispanic White
Native American Weighted Risk Ratio = 2.65, Black: Weighted Risk Ratio = 3.05.
MR
FM

39
Percent of Special Education Students Suspended/Expelled for more than 10 Days Compared to Percent of Students in District by Ethnicity (B4 Example)
2.13 2.13
42.55
19.15
34.04
2.00
10.61
16.30
14.09
56.99
.00
10.00
20.00
30.00
40.00
50.00
60.00
Native American Asian Black Hispanic White
Black Weighted Risk Ratio = 3.63.
SpEd Discipline
FM

40
INSTRUCTION: Oregon Statewide Assessment, Reading, 2006-07
0%
20%
40%
60%
80%
100%
3rd 5th 8th 10th
Amer Indian
Asian
Black
Hispanic
White

41
INSTRUCTION: Oregon Statewide Assessment, Math, 2006-07
0%
20%
40%
60%
80%
100%
3rd 5th 8th 10th
Amer Indian
Asian
Black
Hispanic
White

42
Systems
Admin Leadership Team-based implementation Defined commitment Allocation of FTE Budgeted support Development of decision-driven
information system

43
Planning and Practices Develop a multi-year, comprehensive
improvement plan that addresses all facets of disproportionality
Professional development Define expectations Teach expectations Monitor Use information for decision-making

44
Problem ?
Systems ?
Local/Individual ?
Use Questions and Data to Target Issues and Use Resources Most Efficiently

45
Suggested Resources IDEA: Building the Legacy of IDEA 2004: http://idea.ed.gov/
Disproportionality Module
National Center for Culturally Responsive Educational Systems (NCCRESt): http://www.nccrest.org/
National Center on Response to Intervention: http://www.rti4success.org/
National Technical Assistance Center on Positive Behavioral Interventions and Supports (PBIS): http://www.pbis.org/main.htm
State Implementation of Scaling-up Evidence-based Practices (SISEP) Center: http://sisep.fmhi.usf.edu/
Oregon RtI: http://www.ode.state.or.us/search/page/?id=315
Oregon PBS: http://www.ode.state.or.us/search/page/?=553