Spend Less, Deliver More - SNIA · 1 100TB—Single Tier—600G—15K—RAID-6 2 Usable Cap (TB)...
26
Data Center Storage ... Spend Less, Deliver More Hubbert Smith, LSI
Transcript of Spend Less, Deliver More - SNIA · 1 100TB—Single Tier—600G—15K—RAID-6 2 Usable Cap (TB)...
Data Center Storage ... Spend Less, Deliver More
Hubbert Smith, LSI

Data Center Storage …Spend Less, Deliver More © 2011 Storage Networking Industry Association. All Rights Reserved.
SNIA Legal Notice
The material contained in this tutorial is copyrighted by the SNIA unless otherwise noted. Member companies and individual members may use this material in presentations and literature under the following conditions:
Any slide or slides used must be reproduced in their entirety without modificationThe SNIA must be acknowledged as the source of any material used in the body of any document containing material from these presentations.
This presentation is a project of the SNIA Education Committee.Neither the author nor the presenter is an attorney and nothing in this presentation is intended to be, or should be construed as legal advice or an opinion of counsel. If you need legal advice or a legal opinion please contact your attorney.The information presented herein represents the author's personal opinion and current understanding of the relevant issues involved. The author, the presenter, and the SNIA do not assume any responsibility or liability for damages arising out of any reliance on or use of this information.
NO WARRANTIES, EXPRESS OR IMPLIED. USE AT YOUR OWN RISK.
22

Data Center Storage …Spend Less, Deliver More © 2011 Storage Networking Industry Association. All Rights Reserved. 33
Abstract
Data Center Storage ... Spend Less, Deliver More
Will be of value to Data Center Managers, CIOs.
Bridges the Business side of Data Center Storage with the Technology side of Data Center Storage.
Not a technology deep dive. Not a promo for specific products or technologies.
Spend less. Deliver more.

Data Center Storage …Spend Less, Deliver More © 2011 Storage Networking Industry Association. All Rights Reserved.
Framing the problem
4
Intel’s storage requirements grow 35% per year, driven in part by the need to retain data for compliance reasons and to fulfill e-discovery requests. – Diane Bryant, Intel CIO, Computerworld, Aug 2009
IDC reports that, with compound annual growth rate of ~60%, the digital universe is projected to hit 1,800 exabytes in 2011, that’s ten-fold increase in 5-years– Michael Freidberg, Pres and CEO CIO Magazine, CIO magazine Sept 2009
Most IT departments spend at least 50% of the budget on salaries, and up to 70% of IT staff time is spent on maintenance.– www.cloudemail101.org/should-igo-to-the-cloud
A UK construction company switched 1,800 employees email from Outlook to Gmail. The company’s IT director reports cost savings of $2M.– CIO.com, Savings_Found_When_Microsoft_Outlook_Ousted_for_Gmail_at_British_Construction_Firm_
The urge to collect is primal.– Hubbert Smith
All data is not hot data.– Hubbert Smith

Data Center Storage …Spend Less, Deliver More © 2011 Storage Networking Industry Association. All Rights Reserved.
We overspend on Storage
Common ills, we all know, but still tolerateLots of unconsolidated storage silos. Direct attached storage still lurking in the dark corners.Too much stale data on Tier-1, too much growth of Tier-1 data. High cost of tape-backup, yet poor RTO/RPO and poor quality of service.Business units with unrealistic expectations, bringing unrealistic requests.No clear path to take advantage of Managed HostingData Center storage is expanding fast.And so, our storage-related overspending is accelerating.
5
Bridge the business-to-technology storage gapTechnical folks use effective (affordable) business approaches
Business folks use effective (manageable risk) technical approachesSpend less, Deliver more

Data Center Storage …Spend Less, Deliver More © 2011 Storage Networking Industry Association. All Rights Reserved.
ConsolidateRetire Old HardwareTieringSLAsManaged Hosting
6
Bridge the business-to-technology storage gapTechnical folks use effective (affordable) business approaches
Business folks use effective (manageable risk) technical approachesSpend less, Deliver more

Data Center Storage …Spend Less, Deliver More © 2011 Storage Networking Industry Association. All Rights Reserved.
ConsolidateExample Scenario-A vs Scenario-B
7
the tape backup treadmill
Before - unconsolidated
After - consolidated
Data Center Storage …Spend Less, Deliver More © 2011 Storage Networking Industry Association. All Rights Reserved.
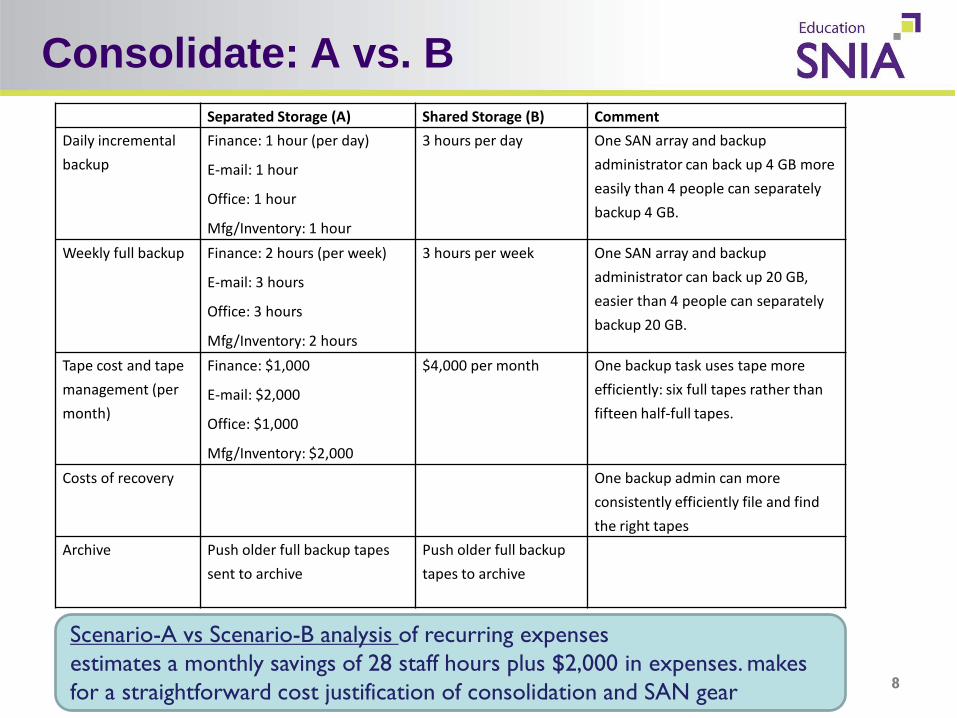
Consolidate: A vs. B
8
Separated Storage (A) Shared Storage (B) CommentDaily incremental backup
Finance: 1 hour (per day)
E-mail: 1 hour
Office: 1 hour
Mfg/Inventory: 1 hour
3 hours per day One SAN array and backup administrator can back up 4 GB more easily than 4 people can separately backup 4 GB.
Weekly full backup Finance: 2 hours (per week)
E-mail: 3 hours
Office: 3 hours
Mfg/Inventory: 2 hours
3 hours per week One SAN array and backup administrator can back up 20 GB, easier than 4 people can separately backup 20 GB.
Tape cost and tape management (per month)
Finance: $1,000
E-mail: $2,000
Office: $1,000
Mfg/Inventory: $2,000
$4,000 per month One backup task uses tape more efficiently: six full tapes rather than fifteen half-full tapes.
Costs of recovery One backup admin can more consistently efficiently file and find the right tapes
Archive Push older full backup tapes sent to archive
Push older full backup tapes to archive
Scenario-A vs Scenario-B analysis of recurring expenses estimates a monthly savings of 28 staff hours plus $2,000 in expenses. makes for a straightforward cost justification of consolidation and SAN gear

Data Center Storage …Spend Less, Deliver More © 2011 Storage Networking Industry Association. All Rights Reserved.
Retire - Backup improvements
9
Basic Server BackupServerApp-1App-2
1
Server AApp-1App-2
Server BApp-1App-2
13
network2
Basic Server Network Backup
Time
Load
, Cap
acity
100% capacity
Normal I/O Load
Time
Load
, Cap
acity
100% capacity
Backup load
Normal I/O Load
Performance and Backup – Right-provisioned Server

Data Center Storage …Spend Less, Deliver More © 2011 Storage Networking Industry Association. All Rights Reserved.
Backup improvements
10
Server
I/O Controller(South Bridge)
PCI Bus
Memory Controller(North Bridge)
CPU
Disk Drive (s)
Memory(aka. RAM, DIMM)
Start
Finish
1
2 Server AApp-1App-2
Server BApp-1App-2
SAN Switch
Consolidated Storage and Backup
RAID ControllerSANStorageArray
1 2
4
5
Server BApp-1App-2
3
6
snap Tape forarchive
Daily incremental to array snapshots, substantially reduce cost(compare Scenario-A to Scenario-B)Storage array based snapshots, offload application serversRPO/RTO, big improvementsTape for archival only, Snapshot (not Tape) for incremental backup

Data Center Storage …Spend Less, Deliver More © 2011 Storage Networking Industry Association. All Rights Reserved.
Retire - Demystifying Disk Drives
Use RatiosIOP/$IOP/wattGB/$GB/watt
Not all data ishot dataUse Tiering
11
IOP/$, GB/$, IOP/watt, GB/wattMakes a straightforward cost justification for retiring older HDDsMakes a straightforward cost justification for Tier-1 and Tier-2 supported with SLAs
IOP/watt
GB/watt
GB/$IOP/$
15K rpm146G
IOP/watt
GB/watt
GB/$IOP/$
10K rpm300G
IOP/watt
GB/watt
GB/$IOP/$
SSD
IOP/watt
GB/watt
GB/$IOP/$
7.2K rpm2TB

Data Center Storage …Spend Less, Deliver More © 2011 Storage Networking Industry Association. All Rights Reserved.
Tiering - All data is not Hot dataconvert from Single-Tier to Two-Tier
12
Scenario 1. Baseline 100TB of Single Tier Storage, Protected by RAID-6
1 100TB—Single Tier—600G—15K—RAID-6
2 Usable Cap (TB) 100
3 RAID level RAID-6 overhead 80% 80%
4 Type HDD 600G 15K in RAID-6 600
5 #HDDs 208
6 HDD Price Each $1,500
7 HDD Total Price $312,500
8 System HW (excluding HDD) assume $10K/tray $180,000
9 HW maintenance (typically 18% per year)
18% $88,650
10 Storage SW $20,000
11 People per Year 0.5 $60,000
12 Cost of full backups per year $20,000
13 Cost of Incremental or Snaps per year $52,000
14 Communications for Replication $ -
15 Added Capacity per Year $35,000
16 Total Initial HW/SW $512,500
17 Total Yearly Expense assuming 4-year life $295,125
18 Yearly Cost per TB $2,951
19 Performance Score 600G 15K in RAID-6 4
20 Power Score 4
21 Reliability-Uptime Score big rebuild times 4

Data Center Storage …Spend Less, Deliver More © 2011 Storage Networking Industry Association. All Rights Reserved.
Tiering - All data is not Hot dataconvert from Single-Tier to Two-Tier
13
1 90TB—Tier 2—2TB 7200—RAID-6
2 Usable Cap (TB) 90
3 RAID level RAID-6 overhead 80% 80%
4 Type HDD 600G 15K in RAID-6 2000
5 #HDDs 56
6 HDD Price Each $750
7 HDD Total Price $42,188
8 System HW (excluding HDD) assume $10K/tray $50,000
9 HW Maintenance (Typically 18% per Year)
18% $16,594
10 Storage SW $10,000
11 People per Year 0.4 $48,000
12 Cost of Full Backups per Year $20,000
13 Cost of Incremental or Snaps per Year $52,000
14 Communications for Replication $ -
15 Added Capacity per Year $15,000
16 Total Initial HW/SW $102,188
17 Total Yearly Expense assuming 4 year life $160,547
18 Yearly Cost per TB $1,784
19 Performance Score 600G 15K in RAID6 4
20 Power Score TB/watt 7
21 Reliability-uptime score big rebuild times 4
Scenario 2. Same Service Levels, Use 2-Tier Approach to Save Money
1 20TB—Tier 1—600G 15K—RAID-6
2 Usable Cap (TB) 20
3 RAID level RAID-6 overhead 80% 80%
4 Type HDD 600G 15K in RAID-6 600
5 #HDDs 42
6 HDD Price Each $1,500
7 HDD Total Price $62,500
8 System HW (excluding HDD) assume $10K/tray $40,000
9 HW maintenance
(typically 18% per year)
18% $18,450
10 Storage SW $10,000
11 People per Year 0.2 $24,000
12 Cost of Full Backups per Year $2,000
13 Cost of Incremental or Snaps per Year $5,000
14 Communications for Replication $ -
15 Added Capacity per Year $5,000
16 Total Initial HW/SW $112,500
17 Total Yearly Expense assuming 4-year life $64,125
18 Yearly Cost per TB $3,206
19 Performance score 600G 15K in RAID-6 4
20 Power score 4
21 Reliability-uptime score big rebuild times 4
Scenario-1 vs Scenario-2 Single Tier (RAID-6) $295KTwo-Tier (RAID-6) $221K

Data Center Storage …Spend Less, Deliver More © 2011 Storage Networking Industry Association. All Rights Reserved.
Tiering - All data is not Hot dataconvert from Single-Tier to Two-Tier
14
Scenario-1 vs 2 vs 3 analysis Scenario 1 - Single Tier (RAID-6) $295K worst Tier1 RPO/RTO, performance, ?growth? Scenario 2 -Two-Tier (RAID-6) $221K least expensiveScenario 3 –Two tier (mirrored) $247K best Tier1 performance and uptime
Scenario 3. Better Service Levels, Still Save Some Money
1 20TB—Tier 1—600G 15K—Mirrored
2 Usable Cap (TB) 20
3 RAID Level RAID-1 overhead 50% 0.5
4 Type HDD 600G 15K in RAID-6 600
5 #HDDs 74
6 HDD Price Each $800
7 HDD Total Price $59529
8 System HW (excluding HDD) assume $10K/tray $50,000
9 HW Maintenance (Typically 18% per year)
18% $19667
10 Storage SW $10,000
11 People per Year 0.2 $24,000
12 Cost of Full Backups per Year $2,000
13 Cost of Incremental or Snaps per year $5,000
14 Communications for Replication $ -
15 Added Capacity per Year $5,000
16 Total Initial HW/SW $119,259
17 Total Yearly Expense assuming 4-year life $65,815
18 Yearly Cost per TB $3,291
19 Performance Score 600G 15K mirrored 7
20 Power score TB/watt 2
21 Reliability-uptime score good—mirroring 6
1 90TB—Tier 2—2TB 7200—Mirrored
2 Usable Cap (TB) 90
3 RAID Level RAID-1 overhead 50% 50%
4 Type HDD 600G 15K in RAID-6 2000
5 #HDDs 120
6 HDD Price Each 800
7 HDD Total Price $96,000
8 System HW (excluding HDD) assume $10K/tray $80,000
9 HW Maintenance (Typically 18% per Year) 18% $31,680
10 Storage SW $10,000
11 People per Year 0.4 $48,000
12 Cost of Full Backups per Year $20,000
13 Cost of Incremental or Snaps per Year $52,000
14 Communications for Replication $ -
15 Added Capacity per Year $15,000
16 Total Initial HW/SW 186,000
17 Total Yearly Expense assuming 4-year life $181,500
18 Yearly Cost per TB $2017
19 Performance Score cool data on 7200 5
20 Power Score TB/watt 6
21 Reliability-Uptime Score mirrored, no rebuild times
7

Data Center Storage …Spend Less, Deliver More © 2011 Storage Networking Industry Association. All Rights Reserved.
Data Center Cooling and PowerWords you do NOT want to hear … “We need a new chiller”
Every watt spent on a server or disk drives equals 2.75 watts in total energy. Every watt taxes power distrib & taxes cooling systems. Add loads with care.Deliver cooling efficiently …Office ductwork distributes air evenly throughout office space. Good for cooling office, but inefficient for cooling heat-generating equipmentData center ductwork delivers cooling directly to the heat load, monitored/controlled by local thermostats at heat load
15
100 watt delivered (Power load)
VR 20 watts
PSU 50 watts
Server fans 15 wattsUPS and PDU 20 watts
Room Cooling 70 watts
275 Wattstotal
100 WattsTo load
Source: INTEL
The power bill is expensive, but out growing the data center is REALLY expensive

Data Center Storage …Spend Less, Deliver More © 2011 Storage Networking Industry Association. All Rights Reserved.
Retire - Cooling and Power
Power Bill Rules of thumb …Power bill for HDD - $/KWh * hours/year * 2.75 * ~= $3.6 per watt per yr
MAID (aka spin down), right tool for the situationAll drives in a raid group operate together. MAID NO payoff for active and moderately active dataMAID DOES pay off for seldom-accessed data. Alternate approach D-D VTL
Taxation penalties related to power-overuseAnother reason to consider Managed Hosting
Keep your key applications in-houseOff load your data center of those tier-2 applications
16
Every watt spent on a server or disk drives equals 2.75 watts in total energy. Add loads with care.The power bill is expensive, out growing the data center is REALLY expensive
Old - 15Krpm 146G LFF ~ 12W 15Krpm 600G LFF ~ 12W 10Krpm 300G SFF ~ 8W 7.2K 2TB LFF ~ 8W
Per year - $43/HDD or $294/TB Per year - $43/HDD or $71/TB Per year - $29/HDD or $96/TB Per year - $29/HDD or $14.4/TB
Data Center Storage …Spend Less, Deliver More © 2011 Storage Networking Industry Association. All Rights Reserved.
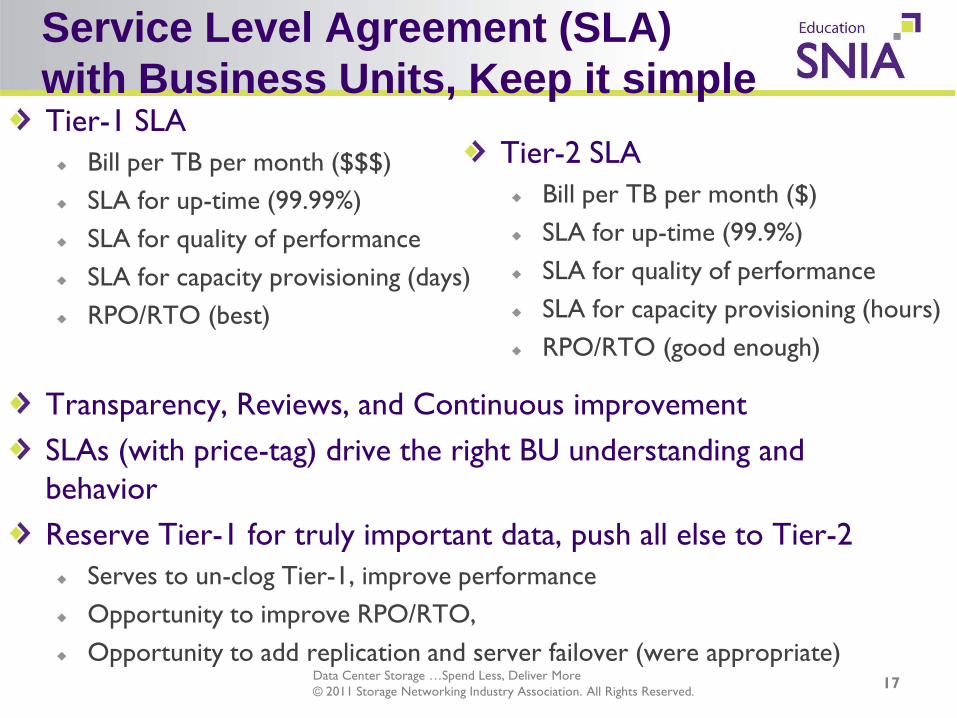
Service Level Agreement (SLA)with Business Units, Keep it simpleTier-1 SLA
Bill per TB per month ($$$)SLA for up-time (99.99%)SLA for quality of performanceSLA for capacity provisioning (days)RPO/RTO (best)
Transparency, Reviews, and Continuous improvementSLAs (with price-tag) drive the right BU understanding and behaviorReserve Tier-1 for truly important data, push all else to Tier-2
Serves to un-clog Tier-1, improve performanceOpportunity to improve RPO/RTO, Opportunity to add replication and server failover (were appropriate)
17
Tier-2 SLABill per TB per month ($)SLA for up-time (99.9%)SLA for quality of performanceSLA for capacity provisioning (hours)RPO/RTO (good enough)
Data Center Storage …Spend Less, Deliver More © 2011 Storage Networking Industry Association. All Rights Reserved.
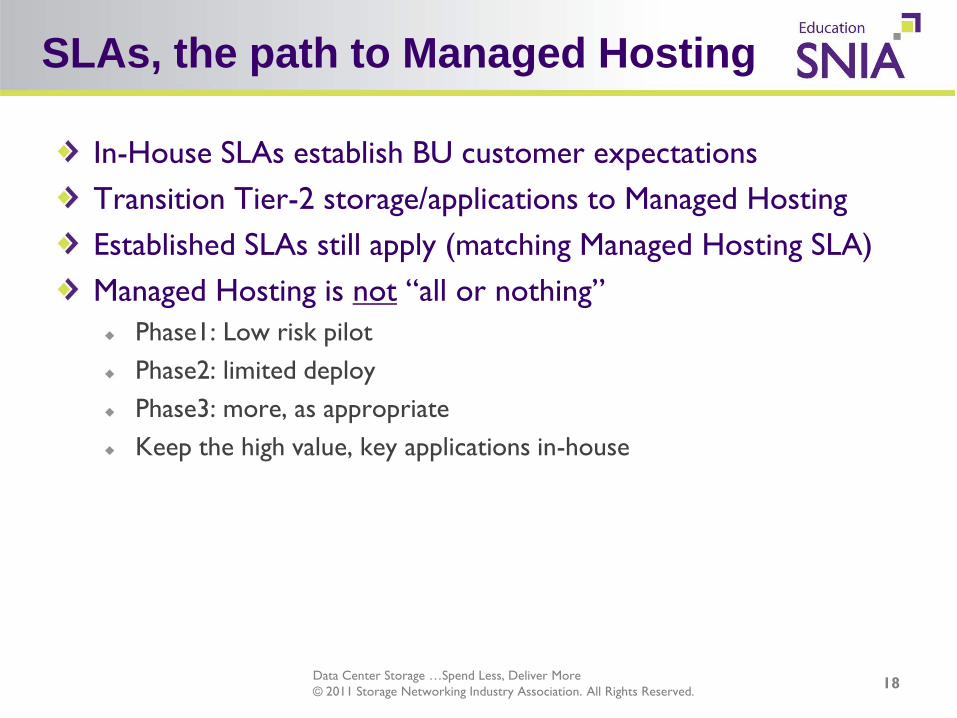
SLAs, the path to Managed Hosting
In-House SLAs establish BU customer expectationsTransition Tier-2 storage/applications to Managed HostingEstablished SLAs still apply (matching Managed Hosting SLA)Managed Hosting is not “all or nothing”
Phase1: Low risk pilotPhase2: limited deployPhase3: more, as appropriate Keep the high value, key applications in-house
18

Data Center Storage …Spend Less, Deliver More © 2011 Storage Networking Industry Association. All Rights Reserved.
Roadmap
19

Data Center Storage …Spend Less, Deliver More © 2011 Storage Networking Industry Association. All Rights Reserved.
Roadmap
20

Data Center Storage …Spend Less, Deliver More © 2011 Storage Networking Industry Association. All Rights Reserved.
Roadmap
21

Data Center Storage …Spend Less, Deliver More © 2011 Storage Networking Industry Association. All Rights Reserved.
Closing thoughts
22
Consolidate Save moneyBetter Service
Use savings to fund Tiering and HW Retirement
Retire old hardwareCreate data center headroom
Save moneyBetter Service
Lower power bill, avoid outgrowing data center.Use savings to Fund Tiering
Tiering Save moneyBetter Service
Creates opportunity for SLAs
SLAs Save moneyBetter Service
Create opportunity for Managed hosting (selectively)
Managed Hosting, based on SLA Save moneyBetter Service
Bridge the business-to-technology storage gapTechnical folks use effective (affordable) business approaches
Business folks use effective (manageable risk) technical approaches
Think like the man who lives on a sailboat … every item brought onto the boat requires an item taken off the boat
Think like a CIO. Scenario A vs Scenario B - Price-tag, Business benefit and Risk.
Spend less, Deliver more
Data Center Storage …Spend Less, Deliver More © 2011 Storage Networking Industry Association. All Rights Reserved. 23
Thanks !!
Feedback encouraged and Welcome
Data Center Storage …Spend Less, Deliver More © 2011 Storage Networking Industry Association. All Rights Reserved. 2424
Refer to Other Tutorials
Please use this icon to refer to other SNIA Tutorials where appropriate.
Check out SNIA Tutorial:
Enter Tutorial Title Here

Data Center Storage …Spend Less, Deliver More © 2011 Storage Networking Industry Association. All Rights Reserved. 2525
Q&A / Feedback
Please send any questions or comments on this presentation to SNIA: [email protected]
Many thanks to the following individuals for their contributions to this tutorial.
- SNIA Education Committee
Hubbert Smith Name of contributor hereName of contributor here Name of contributor here

Data Center Storage …Spend Less, Deliver More © 2011 Storage Networking Industry Association. All Rights Reserved. 26
BACKUP