Speech BASF Analyst Conference Q2 2014
37
BASF 2 nd Quarter 2014 Analyst Conference Call July 24, 2014, 11:00 a.m. (CEST) Ludwigshafen Second Quarter 2014 Financial highlights July 24, 2014 BASF increases earnings considerably due to higher volumes Analyst Conference Call Script – long version Kurt Bock Hans-Ulrich Engel The spoken word applies.
-
Upload
basf -
Category
Investor Relations
-
view
390 -
download
0
Transcript of Speech BASF Analyst Conference Q2 2014
BASF 2nd
Quarter 2014 Analyst Conference Call
July 24, 2014, 11:00 a.m. (CEST)
Ludwigshafen
Second Quarter
2014
Financial highlights
July 24, 2014
BASF increases earnings
considerably due to higher volumes
Analyst Conference Call Script – long version
Kurt Bock
Hans-Ulrich Engel
The spoken word applies.

Page 2
BASF 2nd
Quarter 2014 Analyst Conference Call July 24, 2014
Cautionary note regarding
forward-looking statements
This presentation may contain forward-looking statements that are subject to risks and
uncertainties, including those pertaining to the anticipated benefits to be realized from the
proposals described herein. Forward-looking statements may include, in particular,
statements about future events, future financial performance, plans, strategies,
expectations, prospects, competitive environment, regulation and supply and demand.
BASF has based these forward-looking statements on its views and assumptions with
respect to future events and financial performance. Actual financial performance could differ
materially from that projected in the forward-looking statements due to the inherent
uncertainty of estimates, forecasts and projections, and financial performance may be better
or worse than anticipated. Given these uncertainties, readers should not put undue reliance
on any forward-looking statements. The information contained in this presentation is subject
to change without notice and BASF does not undertake any duty to update the forward-
looking statements, and the estimates and assumptions associated with them, except to the
extent required by applicable laws and regulations.
2BASF Q2 2014 Analyst Conference Call July 24, 2014
BASF increases earnings considerably
due to higher volumes
Business performance Q2’14 Q2’13 vs. Q2’13
Sales €18.5 billion €18.4 billion +1%
EBITDA €2.7 billion €2.5 billion +9%
EBIT before special items €2.1 billion €1.8 billion +12%
EBIT €2.0 billion €1.8 billion +14%
Net income €1.3 billion €1.2 billion +12%
Reported EPS €1.41 €1.26 +12%
Adjusted EPS €1.54 €1.40 +10%
Operating cash flow €0.9 billion €2.0 billion (53%)
Sales development
Period Volumes Prices Portfolio Currencies
Q2’14 vs. Q2’13 6% (2%) 1% (4%)
3
BASF Q2 2014 Analyst Conference Call July 24, 2014
Page 3
BASF 2nd
Quarter 2014 Analyst Conference Call July 24, 2014
Kurt Bock
Ladies and Gentlemen, good morning and thank you for joining us.
[Chart 3: BASF increases earnings considerably due to higher
volumes]
The global economic environment is developing slightly better
than last year. The economies in the Eurozone are partially
improving, however, structural risks remain. German demand was
disappointing in Q2. The economies in North America expand on
a moderate level after a very weak first quarter. In China, growth
in the second quarter has been in line with expectations, but
structural imbalances persist. The major Latin American
economies continue to face sluggish demand growth and
economic challenges, especially related to currencies and
inflation. These trends and the continued increased political risks
might result in higher economic volatility in the second half of this
year.
Despite the challenging environment the positive volume trend in
our businesses continued.
The devaluation of major currencies remained an important issue
and adversely impacted BASF’s top and bottom line.
We increased sales slightly by 1 percent to 18.5 billion euros.
Higher volumes, especially in the chemicals business and Oil &
Gas, were offset by adverse currency effects in all segments and
lower prices in some businesses. Sales of the Agricultural
Solutions segment declined slightly, as strong currency
devaluations outweighed price increases.
Page 4
BASF 2nd
Quarter 2014 Analyst Conference Call July 24, 2014
Page 5
BASF 2nd
Quarter 2014 Analyst Conference Call July 24, 2014
EBITDA went up by 9 percent to 2.7 billion euros.
EBIT before special items increased by 12 percent to almost
2.1 billion euros. All business segments except Agricultural
Solutions contributed to this profit increase.
The considerable decline of EBIT before special items in Other is
related to a negative income from foreign currency transactions
as well as an increase of provisions for our long-term incentive
program.
The devaluation of almost all major currencies against the euro
negatively impacted earnings by roughly 200 million euros
compared to prior year.
Special items amounted to minus 34 million euros, mainly in the
segments Chemicals and Performance Products.
EBIT grew by 14 percent to 2.0 billion euros.
Income taxes went up by 32 percent to 507 million euros, due to
higher pre-tax earnings as well as increased oil and gas
production in Norway, which led to a tax rate of 26.9 percent.
At 1.3 billion euros, net income came in 12 percent higher than in
the second quarter of last year.
Adjusted earnings per share increased to 1.54 euros in Q2 2014
after 1.40 euros in Q2 2013.
At 0.9 billion euros, operating cash flow in Q2 2014 was
significantly lower than last year, due to an increase in net
working capital and a swing in miscellaneous items.
Page 6
BASF 2nd
Quarter 2014 Analyst Conference Call July 24, 2014
Portfolio optimization
Strengthen competitiveness of
Performance ProductsSale of 50% share in Styrolution to Ineos
Capacity expansions in
Functional Materials and Solutions
BASF Q2 2014 Analyst Conference Call July 24, 2014
Enlarged production footprint
in Asia Pacific to support growing demand
4
Page 7
BASF 2nd
Quarter 2014 Analyst Conference Call July 24, 2014
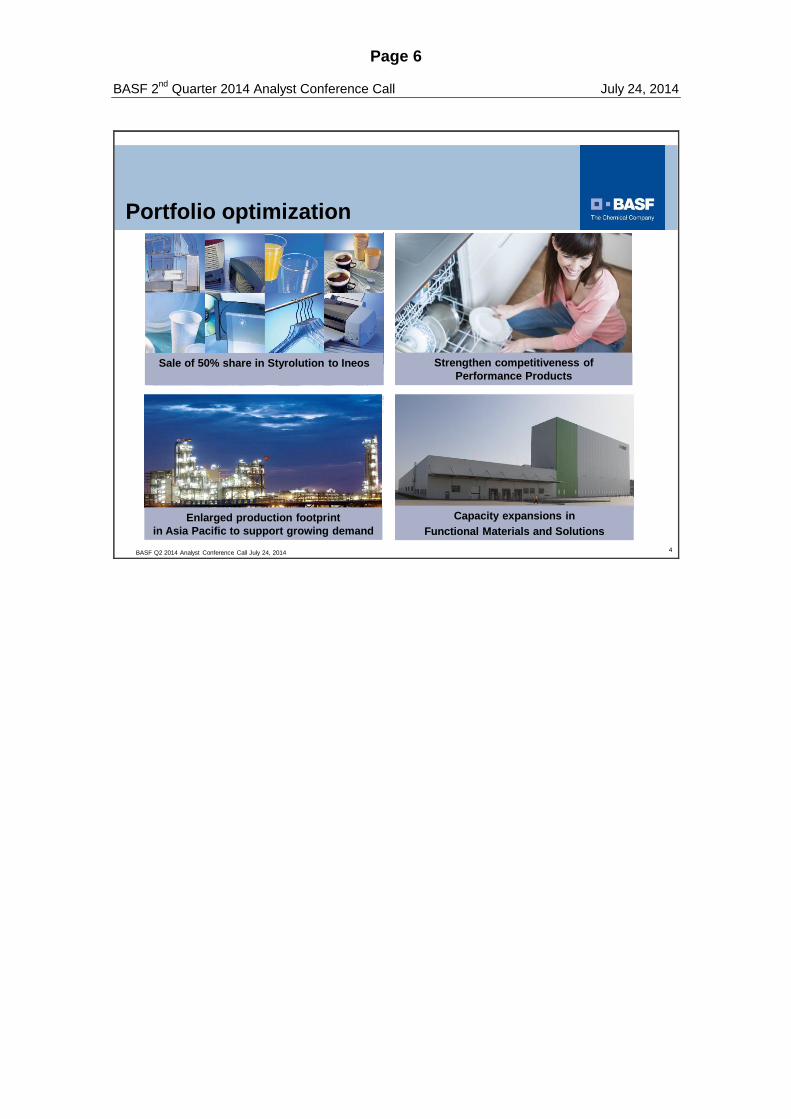
[Chart 4: Portfolio optimization]
Before we discuss our individual business segments in more detail,
please allow me to highlight a couple of milestones:
On June 30, 2014 we announced that Ineos will acquire BASF’s
50% share in Styrolution for a purchase price of 1.1 billion euros.
We expect to realize a mid three-digit-million euro disposal gain.
Closing of the transaction is planned for the end of 2014.
We progressed further with the restructuring of our Performance
Products segment, particularly with respect to our Care
Chemicals and Nutrition & Health businesses. We anticipate an
annual earnings improvement of about 500 million euros from
2017 onwards from the restructuring measures announced so far,
in combination with one-time costs of 250 to 300 million euros
and a reduction of 2,000 positions.
In the growth region Asia Pacific we strengthened our market
position through further investments. Together with our partner
Sinopec, we started the new acrylic acid and superabsorbent
polymers plants at our joint venture in Nanjing and we agreed to
add a plant for neopentylglycol. We also announced that we will
double the MDI capacity of our joint venture Shanghai Lianheng
Isocyanate Co. Ltd. in Caojing to 480kt p.a.
In the Functional Materials and Solutions segment we expanded
the Technical Center and production capacities for performance
materials at the Pudong site in China. Moreover, we inaugurated
our largest European production plant for mobile emissions
catalysts in Poland, and today we start our new coatings resins
plant in Caojing, China.
Page 8
BASF 2nd
Quarter 2014 Analyst Conference Call July 24, 2014
Page 9
BASF 2nd
Quarter 2014 Analyst Conference Call July 24, 2014
Now I would like to turn over to Hans, who will comment on the
performance of the individual business segments.
Page 10
BASF 2nd
Quarter 2014 Analyst Conference Call July 24, 2014
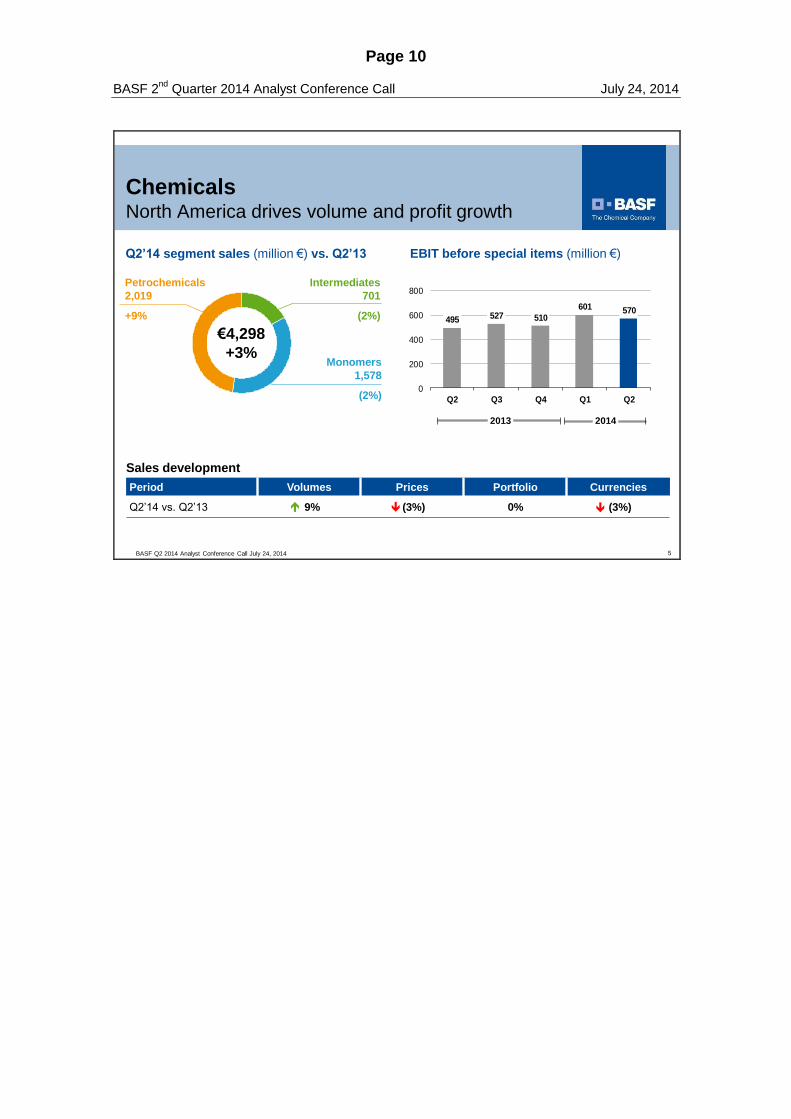
ChemicalsNorth America drives volume and profit growth
Intermediates
701
(2%)
Monomers
1,578
(2%)
Petrochemicals
2,019
+9%
€4,298
+3%
Q2’14 segment sales (million €) vs. Q2’13
Sales development
Period Volumes Prices Portfolio Currencies
Q2’14 vs. Q2’13 9% (3%) 0% (3%)
5
EBIT before special items (million €)
495 527 510
601 570
0
200
400
600
800
Q2 Q3 Q4 Q1 Q2
20142013
BASF Q2 2014 Analyst Conference Call July 24, 2014
Page 11
BASF 2nd
Quarter 2014 Analyst Conference Call July 24, 2014
Hans-Ulrich Engel
Good morning ladies and gentlemen.
Let me highlight the financial performance of each segment in
comparison to the second quarter of 2013.
[Chart 5: Chemicals – North America drives volume and profit
growth]
Sales in the Chemicals segment increased slightly, driven by
strong volume growth in all three divisions. Increased competition,
especially in Asia, resulted in lower prices. Adverse currency effects
had a negative impact on sales.
EBIT before special items was up significantly, as a result of better
earnings in Petrochemicals.
In Petrochemicals sales increased considerably. Significantly
higher volumes, especially in North America, compensated for
slightly lower prices and negative currency effects. Cracker
margins remained high in North America and were on a
satisfactory level in Europe. Global demand for acrylics was high,
but the start-up of new capacities in Asia resulted in pressure on
prices. EBIT before special items rose considerably. The prior
year quarter had been impacted by the cracker turnaround in
Antwerp.
Page 12
BASF 2nd
Quarter 2014 Analyst Conference Call July 24, 2014

Page 13
BASF 2nd
Quarter 2014 Analyst Conference Call July 24, 2014
Sales in Monomers decreased slightly. Considerably higher
volumes, especially in MDI and polyamides, were offset by
adverse currency effects and the impact of lower prices. Lower
margins, especially in the Asian business, were partially offset by
lower fixed costs. EBIT before special items declined slightly.
In Intermediates, sales were slightly lower. Volumes were up,
especially in amines, but could not fully compensate for negative
currency effects and reduced prices. Despite weaker margins,
EBIT before special items came in slightly higher, driven by lower
fixed costs.
Page 14
BASF 2nd
Quarter 2014 Analyst Conference Call July 24, 2014
Performance ProductsRestructuring measures increase earnings
Performance
Chemicals
824
(3%)
Care Chemicals
1,204
(2%)
€3,924
(3%)
Paper Chemicals
342
(8%)
Q2’14 segment sales (million €) vs. Q2’13
Nutrition
& Health
520
(4)% Dispersions
& Pigments
1,034
0%
EBIT before special items (million €)
Sales development
Period Volumes Prices Portfolio Currencies
Q2’14 vs. Q2’13 1% 0% 0% (4%)
20142013
394 376
216
427 435
0
200
400
600
Q2 Q3 Q4 Q1 Q2
6BASF Q2 2014 Analyst Conference Call July 24, 2014

Page 15
BASF 2nd
Quarter 2014 Analyst Conference Call July 24, 2014
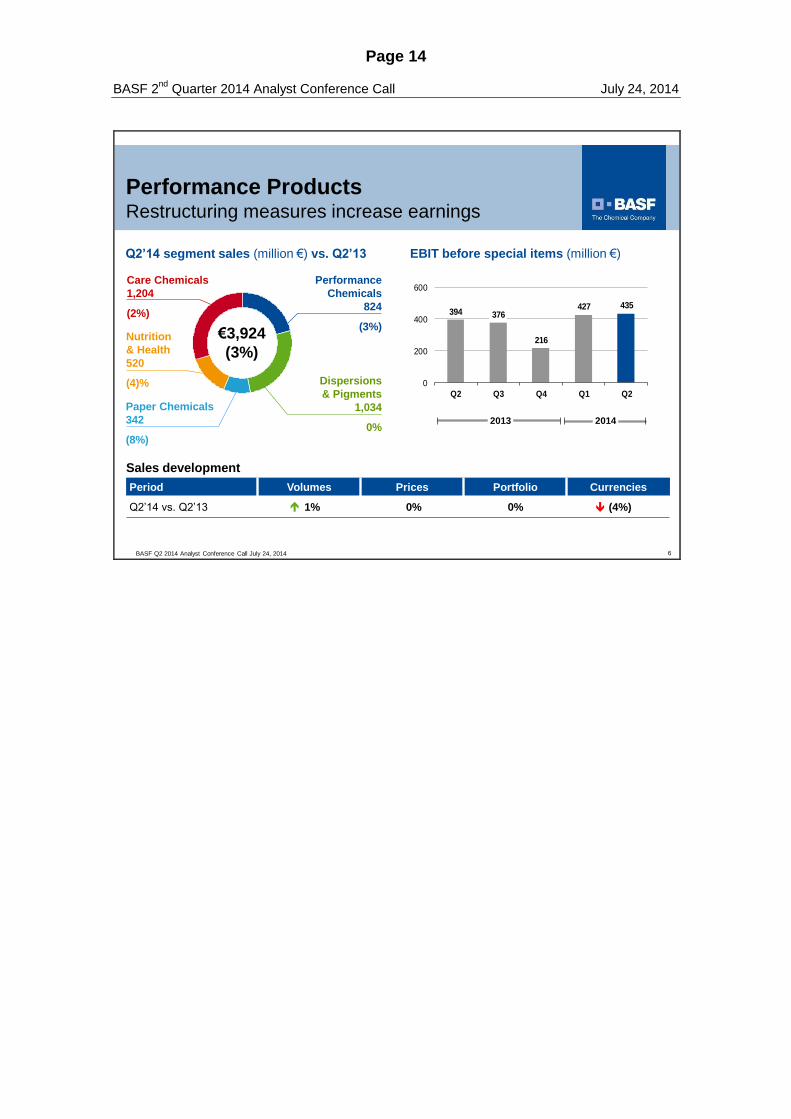
[Chart 6: Performance Products – Restructuring measures
increase earnings]
Sales in Performance Products came in slightly below prior-year
level, as higher volumes could not compensate for strong adverse
currency effects. Prices were stable. EBIT before special items
increased considerably, due to lower fixed costs supported by
ongoing restructuring measures. Positive special items from the
divestiture of the PolyAd business more than offset negative special
items related to the restructuring in the segment.
In Dispersions & Pigments, sales were stable. Volume growth
was offset by negative currency effects and slightly lower prices.
Sales of dispersions and pigments increased especially in Asia.
Resin volumes were up due to higher demand from the paints and
coatings industries in Europe. Fixed costs were reduced as a
result of restructuring measures and strict cost discipline. EBIT
before special items increased considerably.
In Care Chemicals, sales came in slightly lower. Volumes stayed
stable, while higher prices could not compensate for adverse
currency effects. We were able to increase prices and volumes in
all our businesses except hygiene. In hygiene, volumes went
down compared with the strong prior-year quarter, which had
benefitted from temporarily lower capacities in the market. EBIT
before special items slightly increased mainly as a result of lower
fixed costs.

Page 16
BASF 2nd
Quarter 2014 Analyst Conference Call July 24, 2014

Page 17
BASF 2nd
Quarter 2014 Analyst Conference Call July 24, 2014
In Nutrition & Health, sales decreased slightly. Higher prices
could not compensate for lower volumes and currency headwinds.
In aroma chemicals we faced strongly declining volumes as a
result of the force majeure affecting citral-based products. In
animal and human nutrition we experienced ongoing competitive
pressure on vitamin E prices. EBIT before special items declined
substantially.
Sales in Paper Chemicals decreased considerably, especially
due to lower demand and intense competition in Asia.
Additionally, lower raw material prices, which were passed
through, and negative currency effects adversely affected sales.
Significantly lower fixed costs resulted in a considerable increase
in EBIT before special items.
Sales in Performance Chemicals decreased slightly. Volume
growth in most businesses was more than offset by adverse
currency effects and slightly lower prices. The positive volume
trend in oilfield and mining continued. Water solutions faced
ongoing price pressure. Demand for plastic additives and fuel &
lubricant solutions was strong. Fixed cost reduction measures
contributed to a considerable increase in EBIT before special
items.
Page 18
BASF 2nd
Quarter 2014 Analyst Conference Call July 24, 2014
Functional Materials & SolutionsContinued good demand from automotive industry
Catalysts
1,528
+4%
Construction
Chemicals
541
(8%)
Coatings
756
+1%
€4,518
0%
Q2’14 segment sales (million €) vs. Q2’13
Sales development
Period Volumes Prices Portfolio Currencies
Q2’14 vs. Q2’13 6% 0% (1%) (5%)
Performance
Materials
1,693
(0%)
7
EBIT before special items (million €)
20142013
293 300238
311356
0
200
400
600
Q2 Q3 Q4 Q1 Q2
BASF Q2 2014 Analyst Conference Call July 24, 2014

Page 19
BASF 2nd
Quarter 2014 Analyst Conference Call July 24, 2014
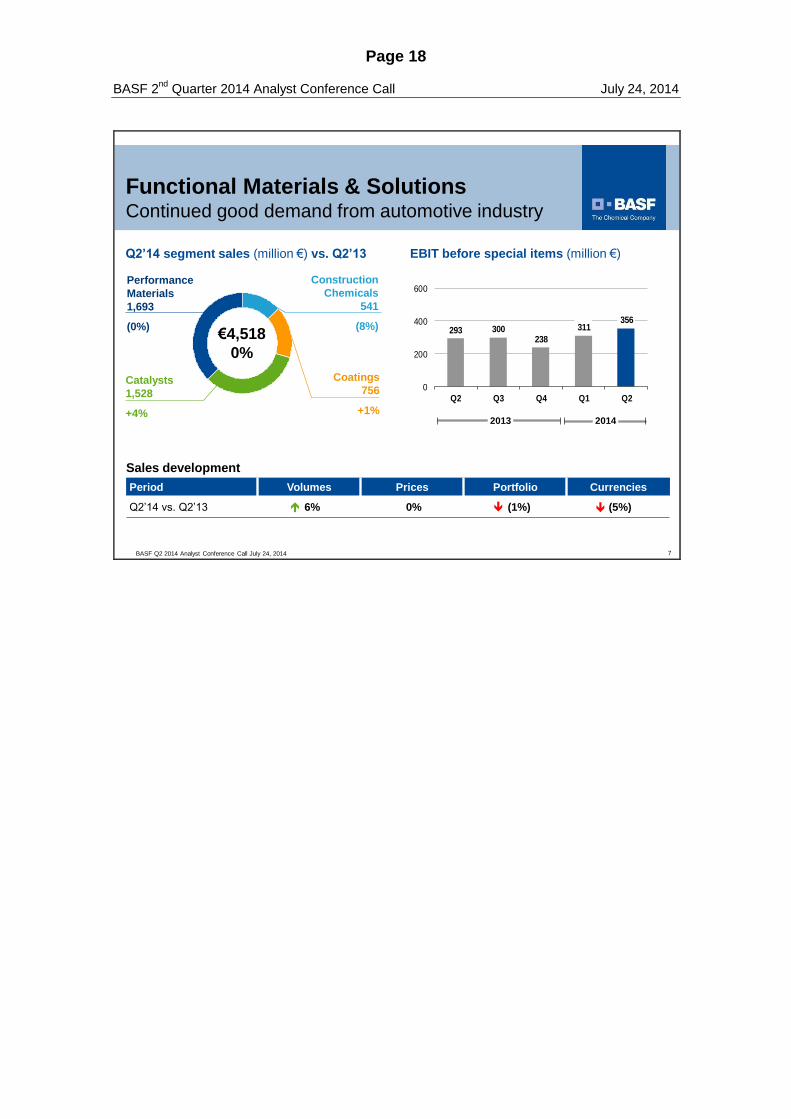
[Chart 7: Functional Materials & Solutions – Continued good
demand from automotive industry]
Sales in Functional Materials & Solutions were stable. While
prices remained flat, significantly higher volumes, especially from
the automotive industry, compensated for adverse currency effects
and the impact of divestitures. EBIT before special items increased
substantially.
Sales in Catalysts came in slightly above the prior year level.
Demand for mobile emissions catalysts grew especially in Europe
and Asia. In chemical catalysts, demand was slightly lower. We
increased our precious metal inventories to ensure sufficient
supply of precious metals due to an uncertain supply situation
from South Africa. Precious metal sales reached 659 million
euros, up by 71 million euros versus a year ago. R&D
expenditures incurred by the battery materials business reduced
earnings. EBIT before special items came in significantly higher.
Sales in Construction Chemicals decreased considerably.
Higher prices could not compensate for lower volumes, strong
currency headwinds, and the impact of divestitures. We continue
to face weak construction activities in Southern Europe. In North
America, building activities restarted after the cold weather period
in the first quarter 2014, but sales were affected by the
weakening of the US dollar. EBIT before special items came in
substantially lower.

Page 20
BASF 2nd
Quarter 2014 Analyst Conference Call July 24, 2014
Page 21
BASF 2nd
Quarter 2014 Analyst Conference Call July 24, 2014
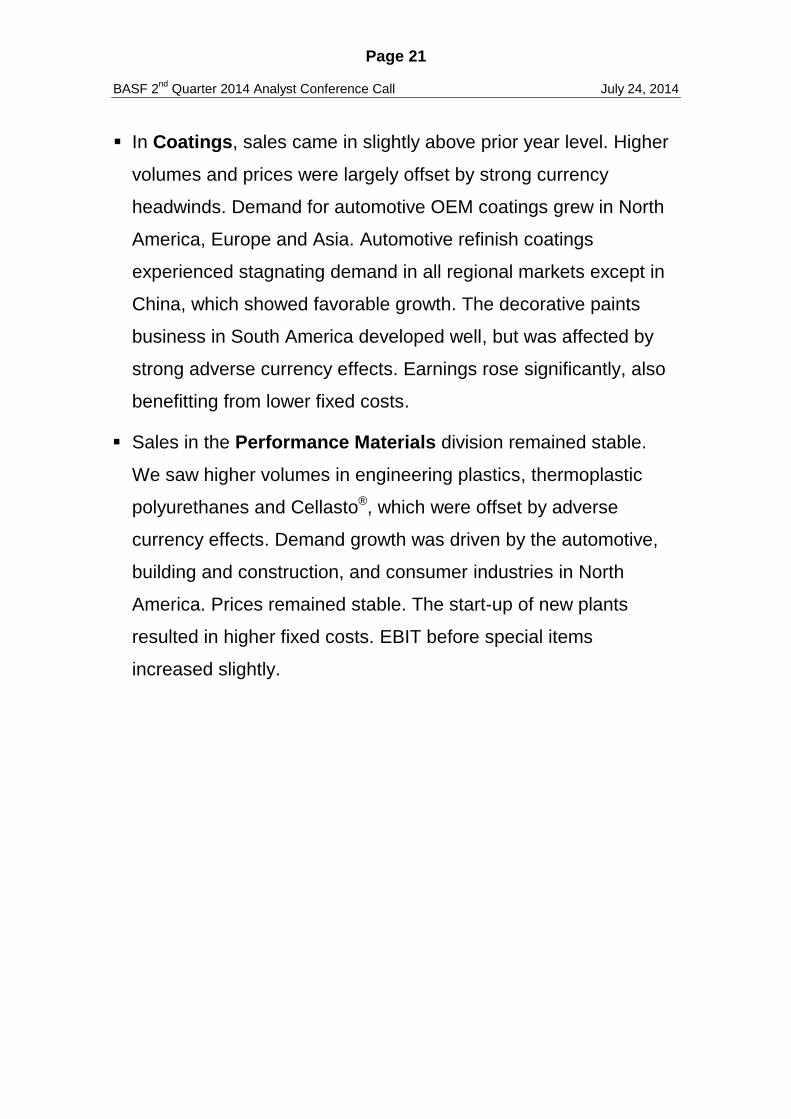
In Coatings, sales came in slightly above prior year level. Higher
volumes and prices were largely offset by strong currency
headwinds. Demand for automotive OEM coatings grew in North
America, Europe and Asia. Automotive refinish coatings
experienced stagnating demand in all regional markets except in
China, which showed favorable growth. The decorative paints
business in South America developed well, but was affected by
strong adverse currency effects. Earnings rose significantly, also
benefitting from lower fixed costs.
Sales in the Performance Materials division remained stable.
We saw higher volumes in engineering plastics, thermoplastic
polyurethanes and Cellasto®, which were offset by adverse
currency effects. Demand growth was driven by the automotive,
building and construction, and consumer industries in North
America. Prices remained stable. The start-up of new plants
resulted in higher fixed costs. EBIT before special items
increased slightly.
Page 22
BASF 2nd
Quarter 2014 Analyst Conference Call July 24, 2014
Agricultural SolutionsExchange rate driven sales and earnings decrease
Q2’14 segment sales (million €) vs. Q2’13
Sales development
Period Volumes Prices Portfolio Currencies
Q2’14 vs. Q2’13 0% 2% 0% (6%)
0
200
400
600
Q2 Q2
0
500
1.000
1.500
2.000
Q2 Q2
1,666
433485
1,727
8
EBIT before special items (million €)
2014201320142013
BASF Q2 2014 Analyst Conference Call July 24, 2014
Page 23
BASF 2nd
Quarter 2014 Analyst Conference Call July 24, 2014
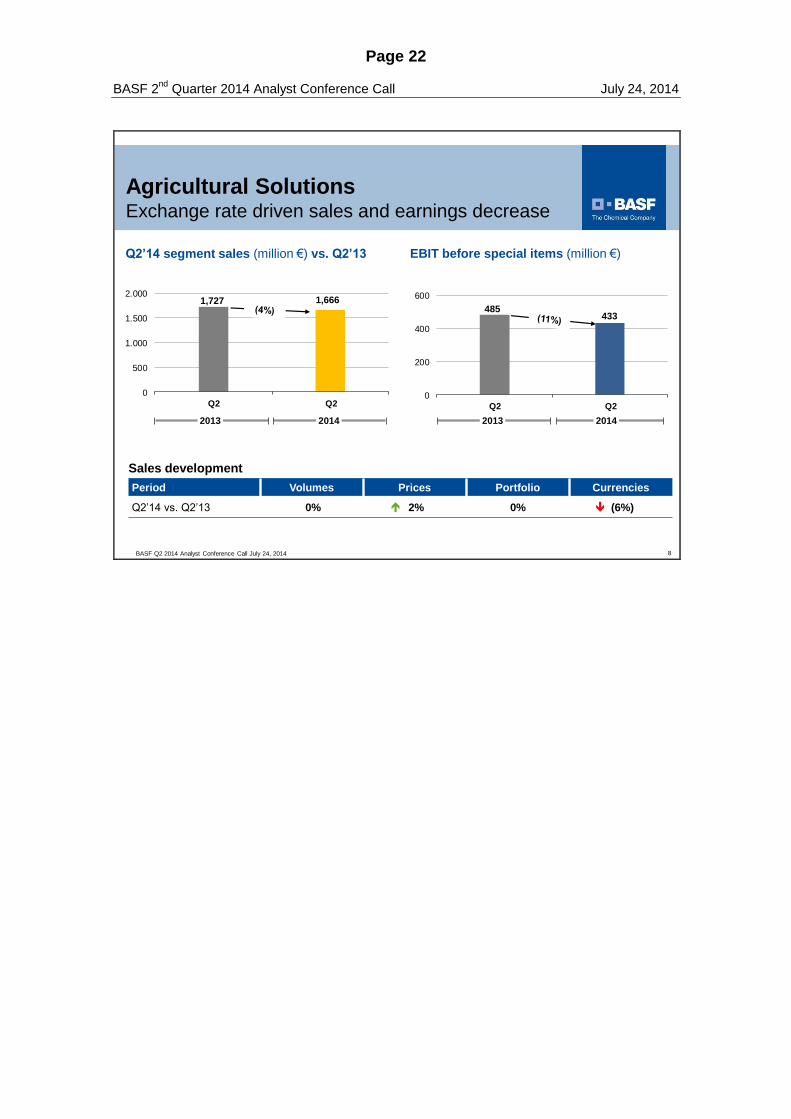
[Chart 8: Agricultural Solutions – Exchange-rate driven sales
and earnings decrease versus strong prior-year]
In Agricultural Solutions volumes were stable versus a very strong
prior year’s second quarter. We were able to increase prices in all
regions, but faced strong currency headwinds. Consequently, sales
decreased slightly.
Business in Europe remained strong, with a very good development
in Western Europe offsetting a slight decline in parts of Eastern
Europe. In North America, sales came in only slightly lower despite
the late start of the season and the weaker US dollar. South
America saw a challenging quarter especially due to the strong
devaluation of the Brazilian Real and difficult market conditions for
our sugarcane insecticides. In Asia, the underlying business
developed well, especially in fungicides and in China.
EBIT before special items came in considerably lower than in the
strong second quarter of 2013. This was mainly caused by negative
currency effects, and higher R&D expenses.
For the first half of 2014 earnings did not reach the level of last year.
However, due to our entry into new markets and the positive
momentum with respect to many of our product innovations, we
uphold our target. We strive to slightly increase EBIT before special
items in Agricultural Solutions, with an EBITDA margin of around
25%.
Page 24
BASF 2nd
Quarter 2014 Analyst Conference Call July 24, 2014
Oil & GasHigher production volumes drive earnings
Exploration &
Production
807
+54%
Natural Gas
Trading
2,387
+3% €3,194
+13%
Q2’14 segment sales (million €) vs. Q2’13 EBIT bSI/Net income (million €)
Natural Gas Trading
Exploration & Production
Net income
Sales development
Period Volumes Prices/Currencies Portfolio
Q2’14 vs. Q2’13 24% 16% 5%
382
322
477
587
9
BASF Q2 2014 Analyst Conference Call July 24, 2014
59
280
110
393
0
100
200
300
400
500
600
Q2/2013 Net Income Q2/2014 Net Income
323 477
Page 25
BASF 2nd
Quarter 2014 Analyst Conference Call July 24, 2014
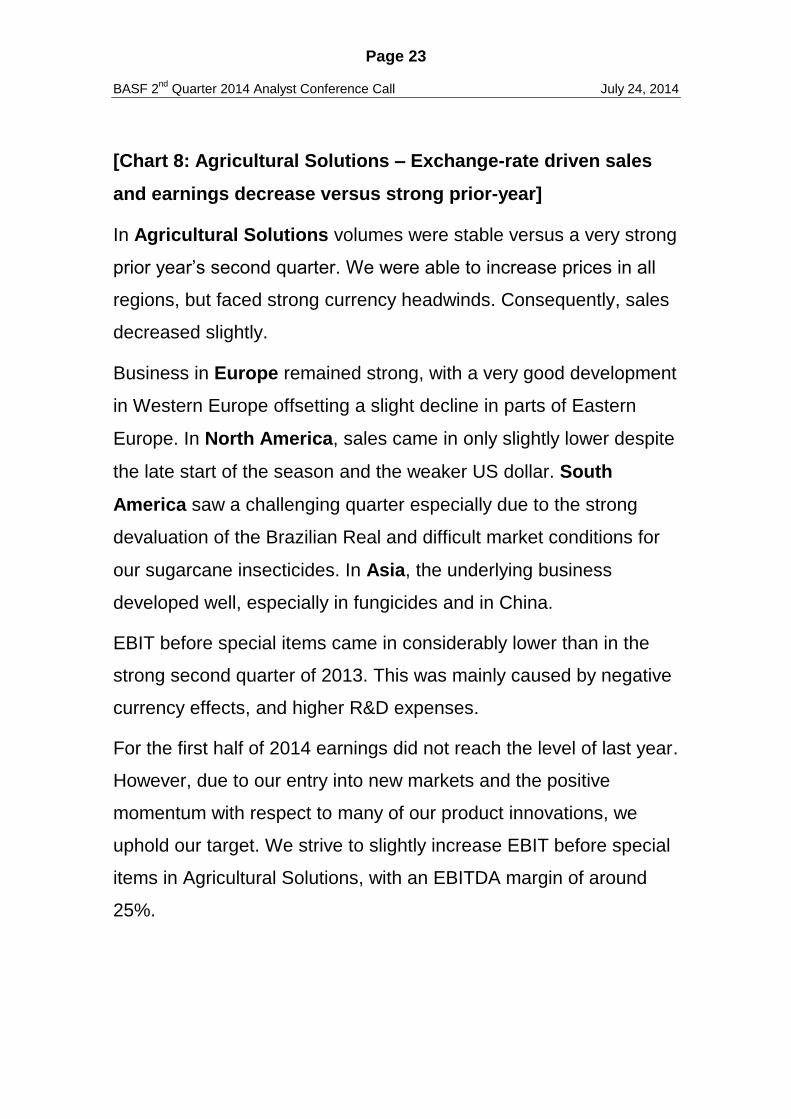
[Chart 9: Oil & Gas – Higher production volumes drive
earnings]
In the Oil & Gas segment, sales grew significantly. This was mainly
driven by higher volumes and portfolio effects in Exploration &
Production. EBIT before special items improved considerably. Net
income increased by 40 percent to 393 million euros.
Sales in Exploration & Production rose by 54 percent. We
increased production volumes in Norway. We also had one lifting
from our offshore production in Libya, while in the previous year’s
second quarter there was no lifting. The average Brent oil price
slightly increased, from 78 euros per barrel a year ago to 80 euros
per barrel, and impacted sales positively.
EBIT before special items in Exploration & Production
increased by 154 million euros to 477 million euros caused by the
higher production volumes in Norway and the lifting from our
offshore production in Libya.
Sales in the Natural Gas Trading business grew by 3 percent
due to higher trading volumes, especially on the European spot
markets. Despite continued margin pressure, EBIT before special
items came in substantially above the level of the prior year’s
second quarter due to improved sourcing opportunities at the
European spot markets.

Page 26
BASF 2nd
Quarter 2014 Analyst Conference Call July 24, 2014
Page 27
BASF 2nd
Quarter 2014 Analyst Conference Call July 24, 2014
We also would like to update you on the status of the asset swap
between Gazprom and BASF. The work on restructuring and
preparing the assets of the parties involved is proceeding according
to plan. However, the complex legal unbundling process involving
the establishment of new companies in Russia, the Netherlands and
Germany is taking longer. Therefore, we expect the closing in
autumn 2014 – still with retroactive financial effect from April 1,
2013.
Page 28
BASF 2nd
Quarter 2014 Analyst Conference Call July 24, 2014
Review of “Other”
Million € Q2’14 Q2’13
Sales 855 1,072
EBIT before special items (328) (217)
thereof Corporate research
Group corporate costs
Foreign currency results, hedges and
other measurement effects
Other businesses
(97)
(57)
(117)
37
(97)
(58)
(63)
37
Special items (12) 3
EBIT (340) (214)
10BASF Q2 2014 Analyst Conference Call July 24, 2014
Page 29
BASF 2nd
Quarter 2014 Analyst Conference Call July 24, 2014
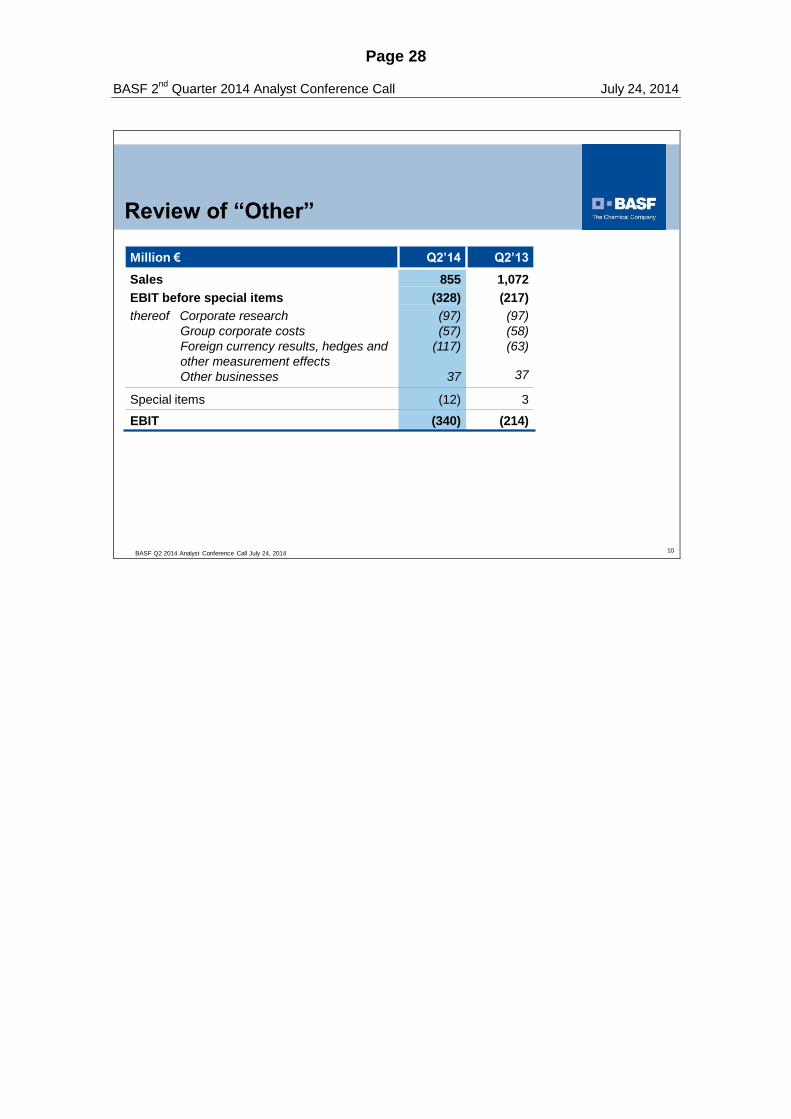
[Chart 10: Review of “Other”]
Sales in 'Other' decreased by 20 percent to 0.9 billion euros. Main
reasons were the force majeure at the ELLBA joint venture in
Moerdijk, the Netherlands, and lower raw materials trading
activities.
EBIT before special items came in at minus 328 million euros. The
decline of 111 million euros compared to the second quarter of
2013 was mainly due to negative income from foreign currency
transactions as well as provisions for the long-term incentive
program.
Page 30
BASF 2nd
Quarter 2014 Analyst Conference Call July 24, 2014
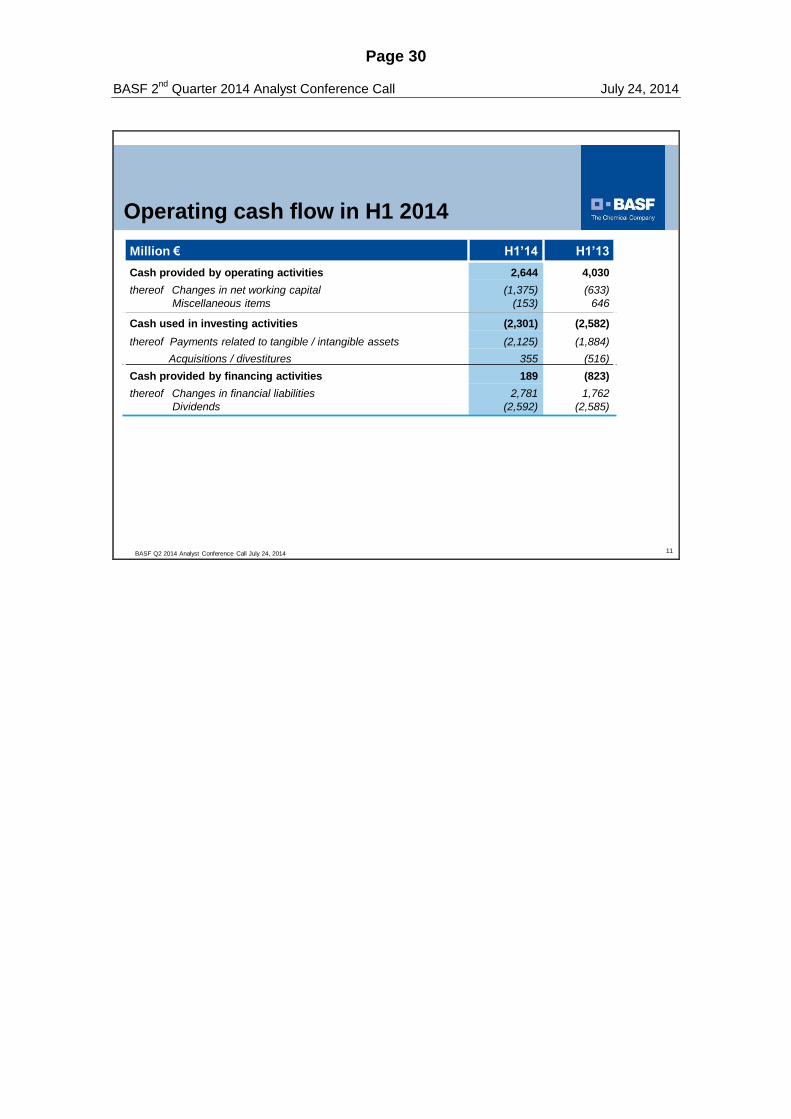
Operating cash flow in H1 2014
Million € H1’14 H1’13
Cash provided by operating activities 2,644 4,030
thereof Changes in net working capital
Miscellaneous items
(1,375)
(153)
(633)
646
Cash used in investing activities (2,301) (2,582)
thereof Payments related to tangible / intangible assets (2,125) (1,884)
Acquisitions / divestitures 355 (516)
Cash provided by financing activities 189 (823)
thereof Changes in financial liabilities
Dividends
2,781
(2,592)
1,762
(2,585)
11BASF Q2 2014 Analyst Conference Call July 24, 2014
Page 31
BASF 2nd
Quarter 2014 Analyst Conference Call July 24, 2014
[Chart 11: Operating cash flow in H1 2014 ]
Let me now turn to our cash flow. Please be reminded that we
summarize the first half of 2014.
At 2.6 billion euros, cash provided by operating activities was 34
percent lower than last year. This was mainly attributable to an
increase in net working capital and a swing in miscellaneous
items.
Net working capital went up due to a build-up in inventories and
trade accounts receivable as well as lower trade accounts
payable.
Miscellaneous items in H1 2014 amounted to minus 153 million
euros. This was mainly caused by the reclassification of the gain
on the disposal of non-operated oil and gas producing fields in
the North Sea to the Hungarian MOL Group as cash provided by
divestitures.
In the first half of 2013 miscellaneous items amounted to plus
646 million euros. This positive value was related to a decline in
net assets in the natural gas trading disposal group.
Cash used in investing activities amounted to 2.3 billion euros.
Capex increased to 2.1 billion euros compared with 1.9 billion
euros in the prior year.
Free cash flow decreased to 0.5 billion euros.
Page 32
BASF 2nd
Quarter 2014 Analyst Conference Call July 24, 2014
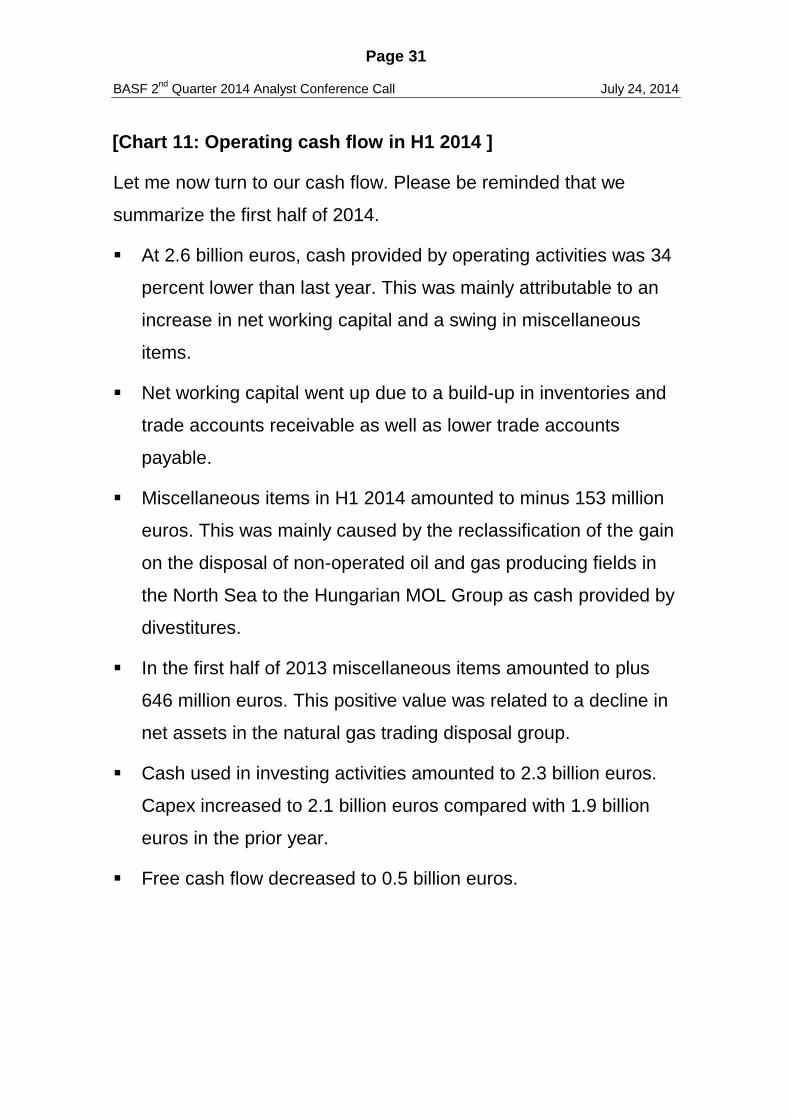
Balance sheet remains strong
Balance sheet June 30, 2014 vs. December 31, 2013
(billion €)
Liquid funds
Accountsreceivable
Long-termassets
37.1
9.4
1.8
Otherliabilities
Financialdebt
Stockholders’equity
Dec 312013
June 302014
June 302014
Dec 312013
64.4
Inventories
Other assets
9.6
3.7
Highlights June 30, 2014
Short-term assets increased by
€2.6 billion:
- Accounts receivables grew
seasonally by €1.0 billion
- Liquid funds up by €0.6 billion
Net debt increased to €14.6
billion
Equity ratio: 39%
38.5
10.4
2.4
9.8
3.7
68.4
3.6Disposal group
Disposalgroup
12
2.8
27.8
20.9
64.4
1.3
26.9
22.9
1.6
68.4
17.014.4
BASF Q2 2014 Analyst Conference Call July 24, 2014

Page 33
BASF 2nd
Quarter 2014 Analyst Conference Call July 24, 2014
[Chart 12: “Balance sheet remains strong”]
And now to the most relevant developments on the balance sheet:
Compared to the end of 2013 total assets grew by 4.0 billion
euros to 68.4 billion euros.
Accounts receivables increased by almost 1 billion euros, driven
by the seasonally strong Crop Protection business.
Following the announcement that Ineos will acquire BASF’s share
in the Styrolution joint venture, the equity book value of
Styrolution - in the amount of 776 million euros - was transferred
to the disposal group. The Styrolution call option, valued at 158
million euros, is now shown under liabilities of the disposal group.
Total liabilities increased by around 5 billion euros to 41.5 billion
euros, attributable mainly to two factors:
We increased pension provisions by almost 2.0 billion
euros due to lower assumed discount rates.
We issued several bonds resulting in a net increase of
our financial indebtedness of 2.6 billion euros. Short-
term debt increased due to the reclassification of long-
term debt into short-term debt.
Net debt increased by roughly 2.0 billion euros to 14.6 billion
euros.
At 39 percent, our equity ratio remained at a healthy level.
Page 34
BASF 2nd
Quarter 2014 Analyst Conference Call July 24, 2014
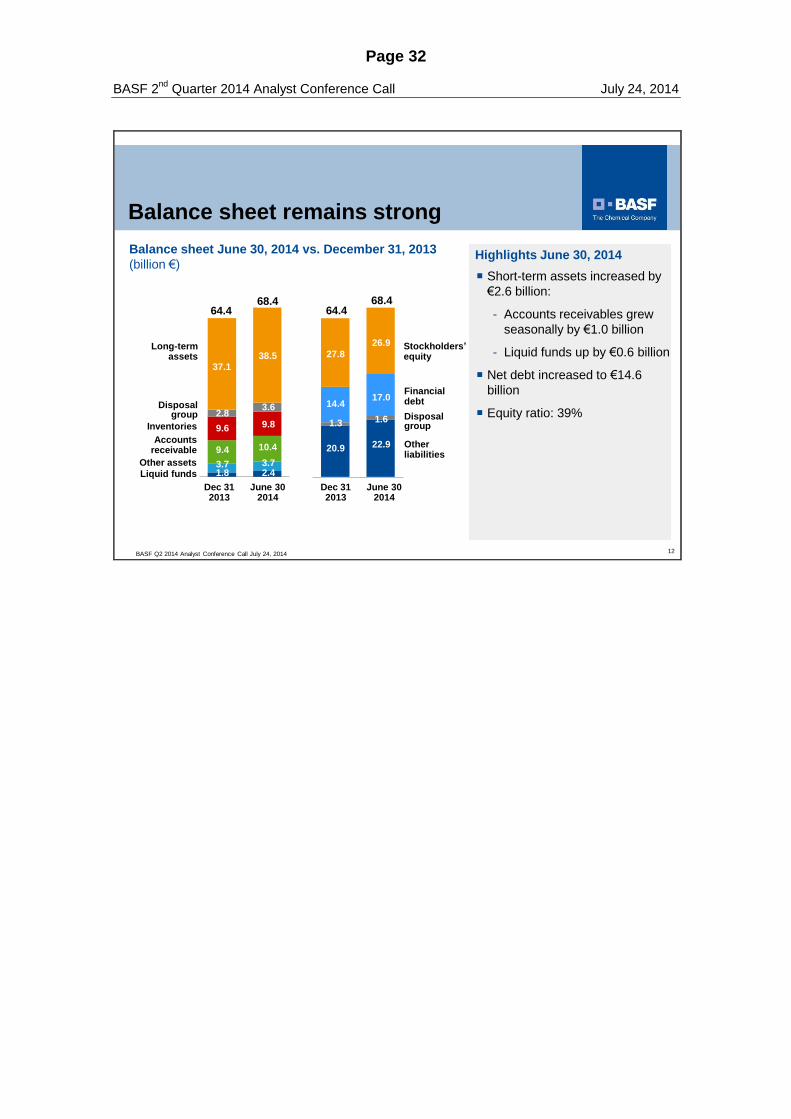
We aim to increase our sales volumes excluding the effects of acquisitions and divestitures.
Nonetheless, sales will decline slightly compared with 2013 due to the divestiture of the gas
trading and storage business planned for autumn 2014 and negative currency effects.
We expect a slight increase in EBIT before special items, especially as a result of
considerably higher contributions from the Performance Products and Functional Materials &
Solutions segments.
We aim to earn a high premium on our cost of capital once again in 2014.
Outlook 2014
GDP: +2.5% (previous: 2.8%)
Industrial production: +3.7%
Chemical production: +4.4%
US$ / Euro: 1.35 (previous: 1.30)
Oil price (US$ / bbl): 110
Assumptions 2014
Outlook 2014 confirmed
13BASF Q2 2014 Analyst Conference Call July 24, 2014
Page 35
BASF 2nd
Quarter 2014 Analyst Conference Call July 24, 2014
Kurt Bock
[Chart 13: Outlook 2014 confirmed]
Coming to the outlook:
In 2014, we expect only a slightly higher global economic growth
than in 2013 and certainly lower than anticipated just 6 months ago.
GDP growth in the United States was unusually weak in the first
quarter of 2014, mainly due to adverse weather effects. Following a
recent downward revision of the U.S. data, BASF has lowered its
global GDP forecast from 2.8 percent to 2.5 percent.
Contrary to our assumptions at the beginning of this year we no
longer expect that the euro will devalue. Therefore, we now
anticipate a dollar/euro exchange rate of 1.35 for 2014.
Despite these negative changes, the continuing unfavorable
currency effects and also increased political risks we confirm our
outlook 2014 for BASF Group:
We aim to increase our sales volumes excluding the effects of
acquisitions and divestitures.
Nonetheless, sales will decline slightly compared with 2013 due
to the divestiture of the gas trading and storage business and
negative currency effects.
We expect a slight increase in EBIT before special items,
especially as a result of considerably higher contributions from
the Performance Products and Functional Materials & Solutions
segments.
We aim to earn a high premium on our cost of capital once again
in 2014.

Page 36
BASF 2nd
Quarter 2014 Analyst Conference Call July 24, 2014
Page 37
BASF 2nd
Quarter 2014 Analyst Conference Call July 24, 2014
Thank you for your attention. We are now happy to take your
questions.
40BASF 4Q/FY’2010 Conference | February 24th, 2011