BASF charts analyst conference call Q3 2017
15
Ludwigshafen, October 24, 2017 Analyst Conference Call Q3 2017
-
Upload
basf -
Category
Investor Relations
-
view
182 -
download
0
Transcript of BASF charts analyst conference call Q3 2017

Ludwigshafen, October 24, 2017Analyst Conference Call Q3 2017
BASF Q3 2017 Analyst Conference Call, October 24, 2017 2
This presentation contains forward-looking statements. These forward-looking statements are basedon current estimates and projections of the Board of Executive Directors and on currently availableinformation. These forward-looking statements are not guarantees of the future developments andresults outlined therein. Rather, they depend on a number of factors, involve various risks anduncertainties, and are based on assumptions that may not prove to be accurate. Such risk factorsparticularly include those discussed on pages 111 to 118 of the BASF Report 2016. The BASFReport is available online at basf.com/report. BASF does not assume any obligation to update theforward-looking statements contained in this presentation.
Cautionary note regarding forward-looking statements
BASF Q3 2017 Analyst Conference Call, October 24, 2017 3
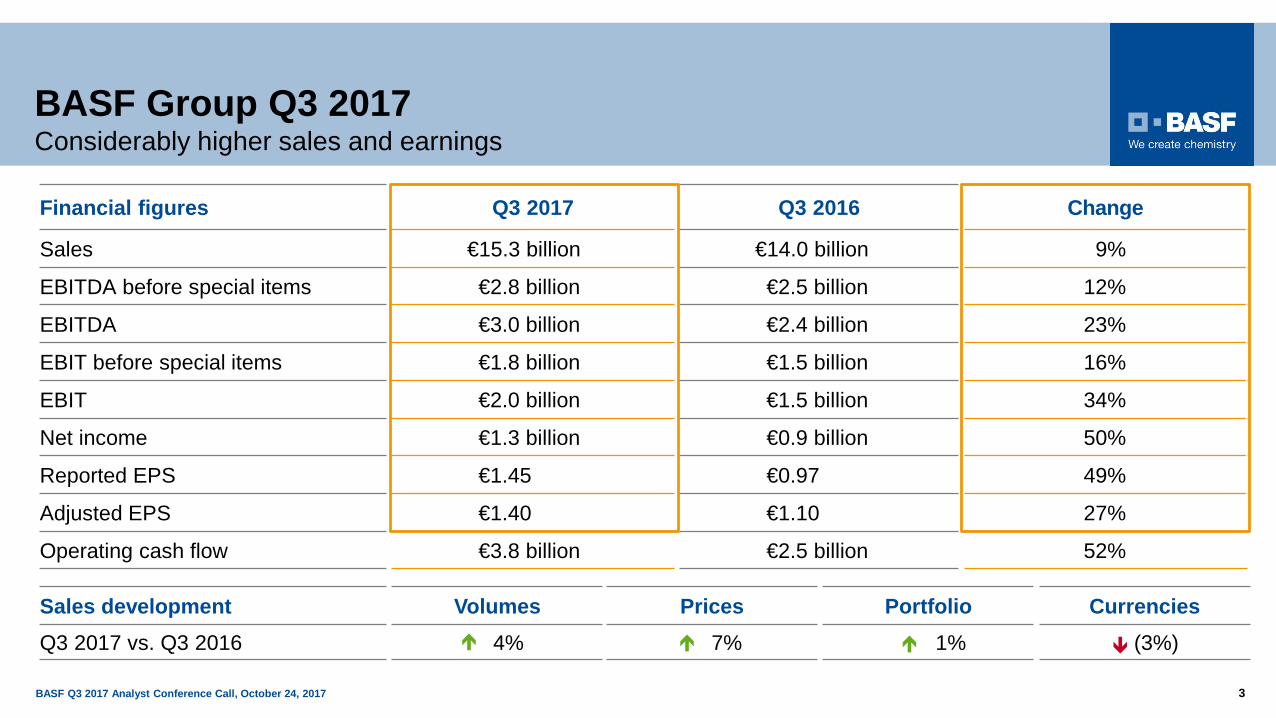
BASF Group Q3 2017Considerably higher sales and earnings
Financial figures Q3 2017 Q3 2016 Change
Sales €15.3 billion €14.0 billion 9%
EBITDA before special items €2.8 billion €2.5 billion 12%
EBITDA €3.0 billion €2.4 billion 23%
EBIT before special items €1.8 billion €1.5 billion 16%
EBIT €2.0 billion €1.5 billion 34%
Net income €1.3 billion €0.9 billion 50%
Reported EPS €1.45 €0.97 49%
Adjusted EPS €1.40 €1.10 27%
Operating cash flow €3.8 billion €2.5 billion 52%
Sales development Volumes Prices Portfolio CurrenciesQ3 2017 vs. Q3 2016 4% 7% 1% (3%)
BASF Q3 2017 Analyst Conference Call, October 24, 2017 4
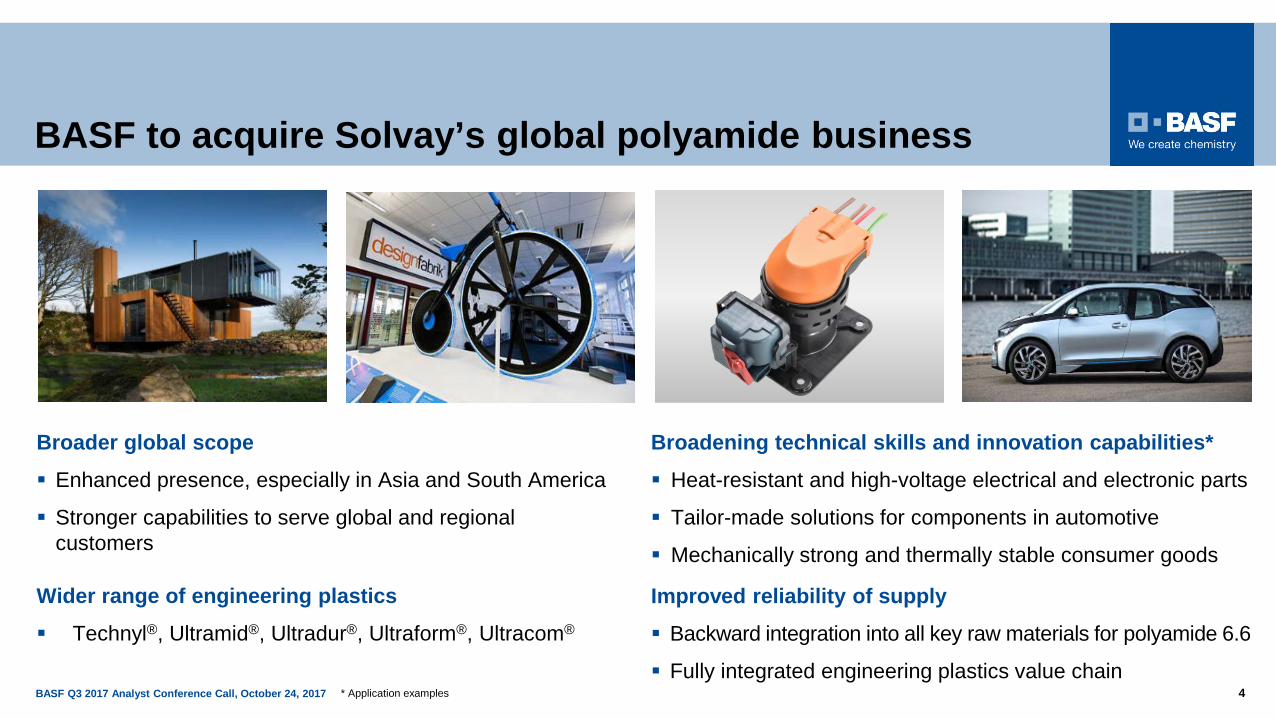
BASF to acquire Solvay’s global polyamide business
* Application examples
Broader global scope Enhanced presence, especially in Asia and South America
Stronger capabilities to serve global and regional customers
Wider range of engineering plastics Technyl®, Ultramid®, Ultradur®, Ultraform®, Ultracom®
Broadening technical skills and innovation capabilities* Heat-resistant and high-voltage electrical and electronic parts
Tailor-made solutions for components in automotive
Mechanically strong and thermally stable consumer goods
Improved reliability of supply Backward integration into all key raw materials for polyamide 6.6
Fully integrated engineering plastics value chain
BASF Q3 2017 Analyst Conference Call, October 24, 2017 5
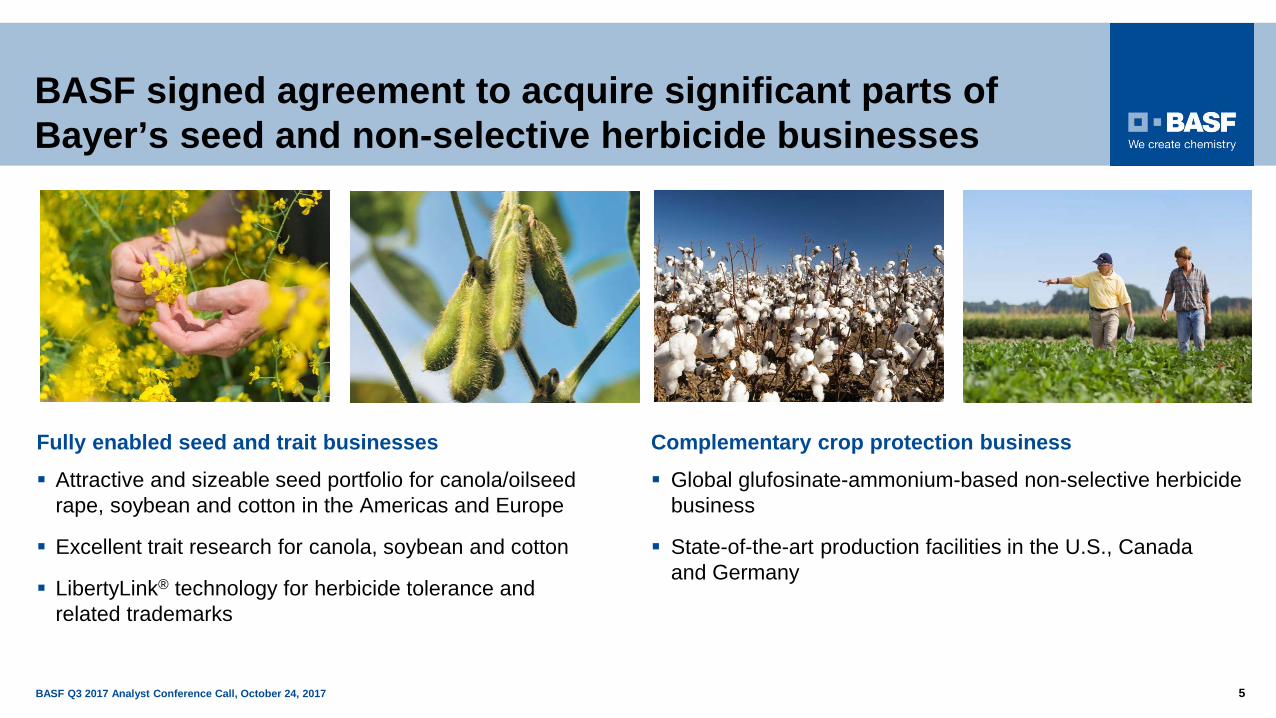
BASF signed agreement to acquire significant parts of Bayer’s seed and non-selective herbicide businesses
Fully enabled seed and trait businesses Attractive and sizeable seed portfolio for canola/oilseed
rape, soybean and cotton in the Americas and Europe
Excellent trait research for canola, soybean and cotton
LibertyLink® technology for herbicide tolerance and related trademarks
Complementary crop protection business Global glufosinate-ammonium-based non-selective herbicide
business
State-of-the-art production facilities in the U.S., Canada and Germany
BASF Q3 2017 Analyst Conference Call, October 24, 2017 6
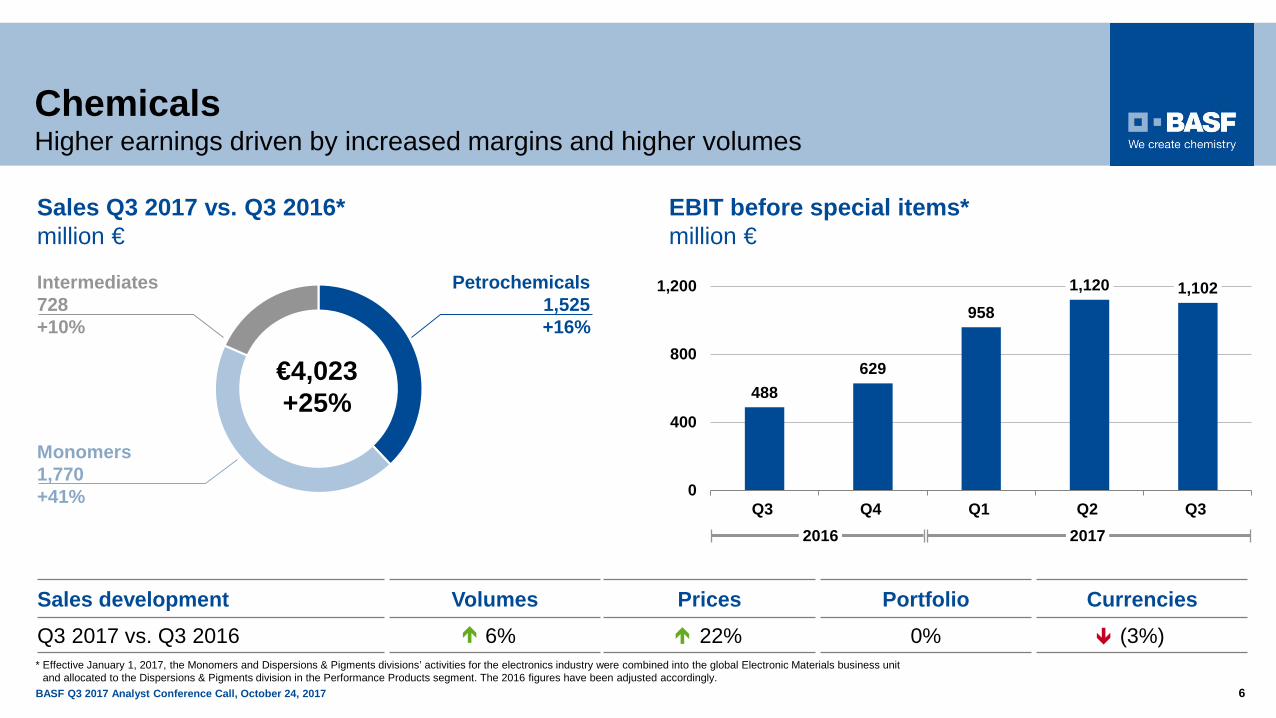
Intermediates728+10%
Monomers1,770+41%
Petrochemicals1,525+16%
€4,023+25%
Sales Q3 2017 vs. Q3 2016*million €
EBIT before special items* million €
488629
9581,120 1,102
0
400
800
1,200
Q3 Q4 Q1 Q2 Q3
Sales development Volumes Prices Portfolio CurrenciesQ3 2017 vs. Q3 2016 6% 22% 0% (3%)
2017
* Effective January 1, 2017, the Monomers and Dispersions & Pigments divisions’ activities for the electronics industry were combined into the global Electronic Materials business unit and allocated to the Dispersions & Pigments division in the Performance Products segment. The 2016 figures have been adjusted accordingly.
2016
ChemicalsHigher earnings driven by increased margins and higher volumes
BASF Q3 2017 Analyst Conference Call, October 24, 2017 7
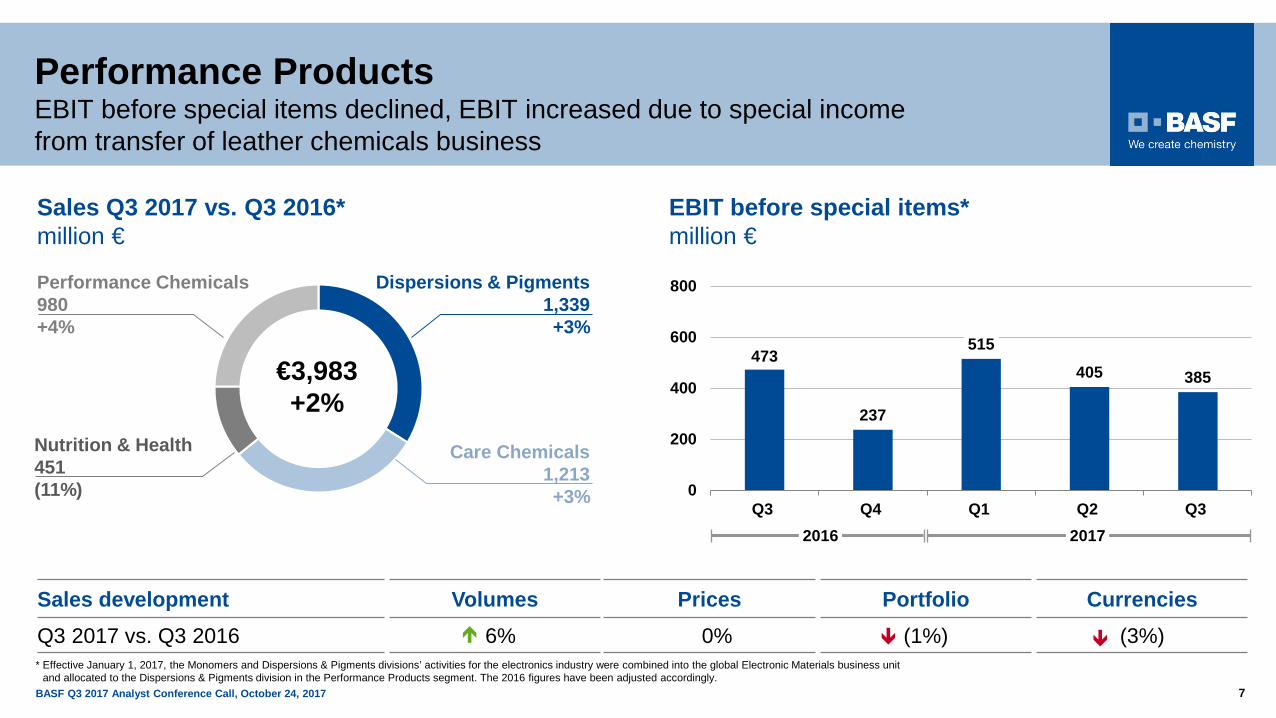
Performance ProductsEBIT before special items declined, EBIT increased due to special incomefrom transfer of leather chemicals business
Performance Chemicals980+4%
Nutrition & Health451(11%)
Care Chemicals1,213+3%
€3,983+2%
EBIT before special items* million €
Sales Q3 2017 vs. Q3 2016*million €
Dispersions & Pigments1,339+3%
Sales development Volumes Prices Portfolio CurrenciesQ3 2017 vs. Q3 2016 6% 0% (1%) (3%)
473
237
515405 385
0
200
400
600
800
Q3 Q4 Q1 Q2 Q320172016
* Effective January 1, 2017, the Monomers and Dispersions & Pigments divisions’ activities for the electronics industry were combined into the global Electronic Materials business unit and allocated to the Dispersions & Pigments division in the Performance Products segment. The 2016 figures have been adjusted accordingly.
BASF Q3 2017 Analyst Conference Call, October 24, 2017 8
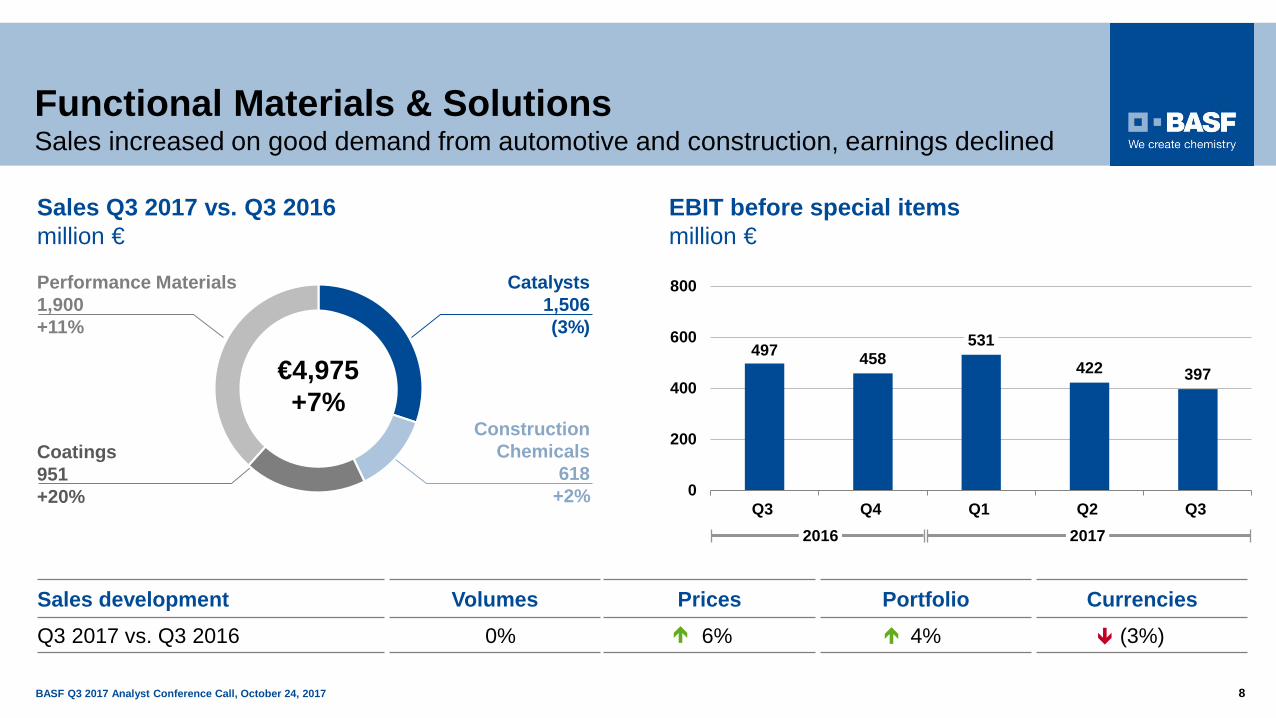
Functional Materials & Solutions Sales increased on good demand from automotive and construction, earnings declined
Coatings951+20%
Catalysts1,506 (3%)
ConstructionChemicals
618+2%
Performance Materials1,900+11%
€4,975+7%
497 458531
422 397
0
200
400
600
800
Q3 Q4 Q1 Q2 Q3
EBIT before special items million €
Sales Q3 2017 vs. Q3 2016million €
Sales development Volumes Prices Portfolio CurrenciesQ3 2017 vs. Q3 2016 0% 6% 4% (3%)
20172016
BASF Q3 2017 Analyst Conference Call, October 24, 2017 9
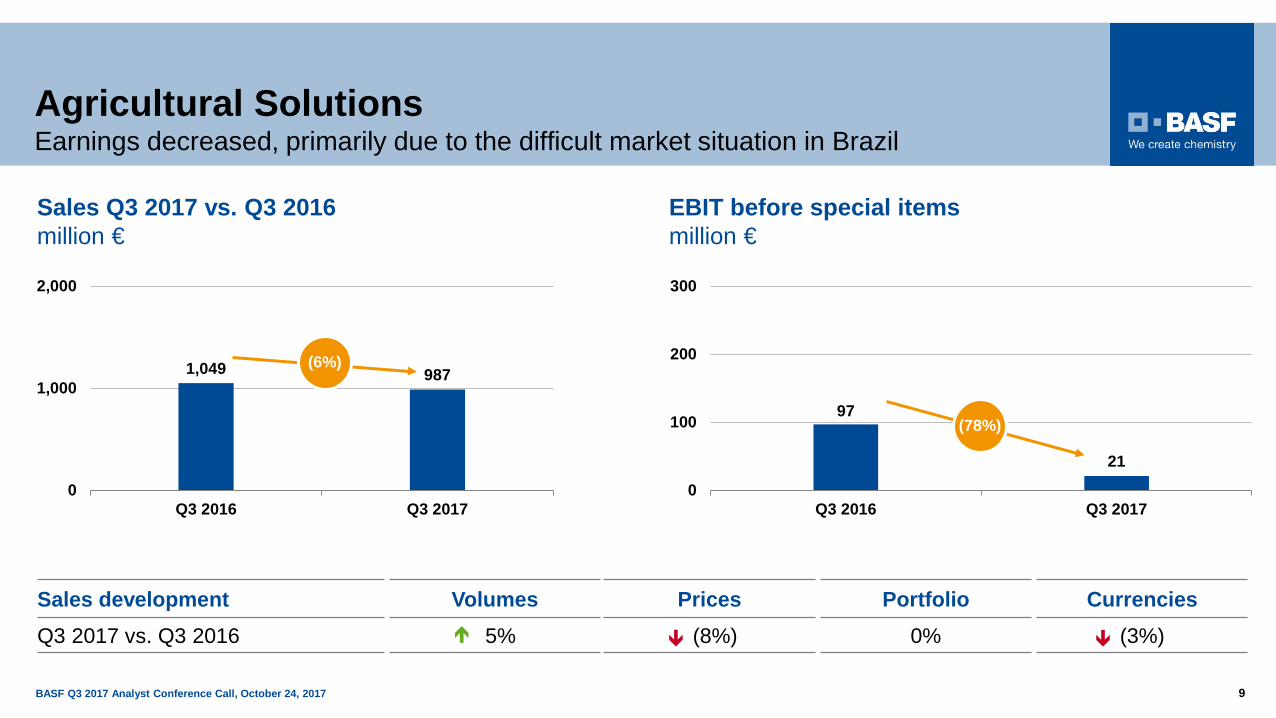
Agricultural SolutionsEarnings decreased, primarily due to the difficult market situation in Brazil
1,049 987
0
1,000
2,000
Q3 2016 Q3 2017
Sales Q3 2017 vs. Q3 2016million €
Sales development Volumes Prices Portfolio CurrenciesQ3 2017 vs. Q3 2016 5% (8%) 0% (3%)
EBIT before special items million €
97
21
0
100
200
300
Q3 2016 Q3 2017
(6%)
(78%)
BASF Q3 2017 Analyst Conference Call, October 24, 2017 10
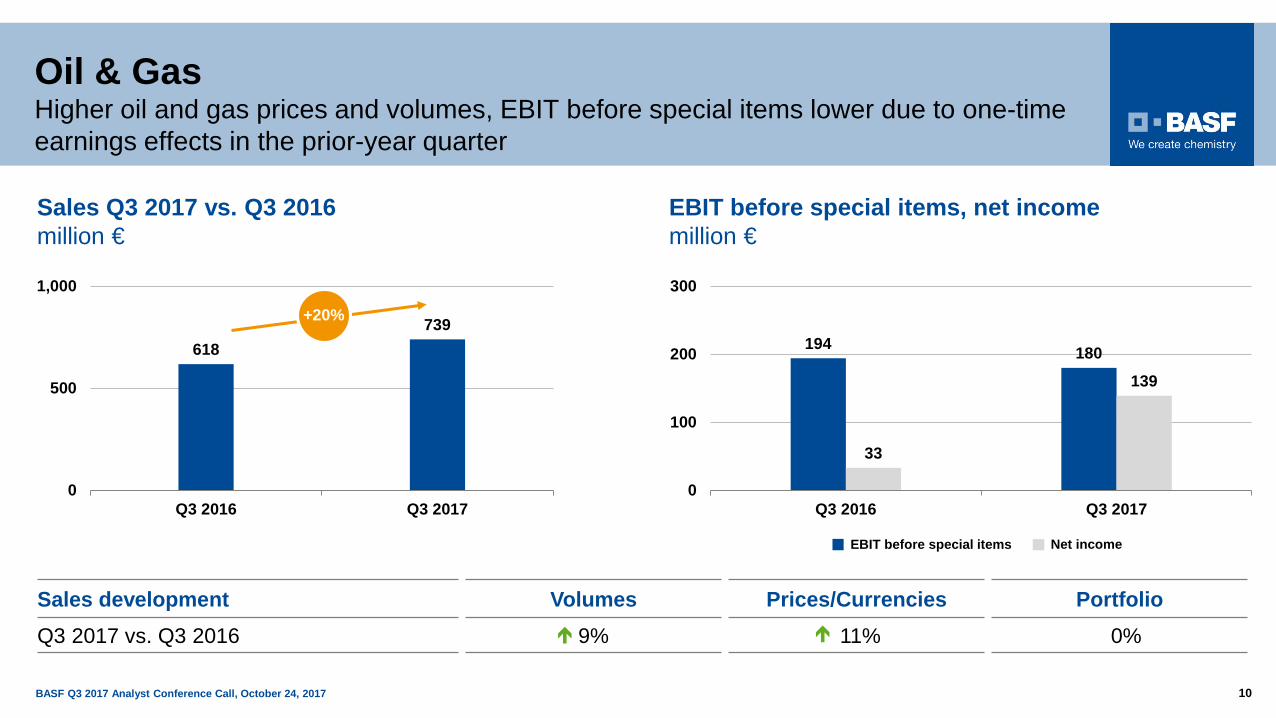
Oil & GasHigher oil and gas prices and volumes, EBIT before special items lower due to one-time earnings effects in the prior-year quarter
Sales Q3 2017 vs. Q3 2016million €
194 180
33
139
0
100
200
300
Q3 2016 Q3 2017
Sales development Volumes Prices/Currencies PortfolioQ3 2017 vs. Q3 2016 9% 11% 0%
EBIT before special items Net income
618739
0
500
1,000
Q3 2016 Q3 2017
EBIT before special items, net income million €
+20%
BASF Q3 2017 Analyst Conference Call, October 24, 2017 11
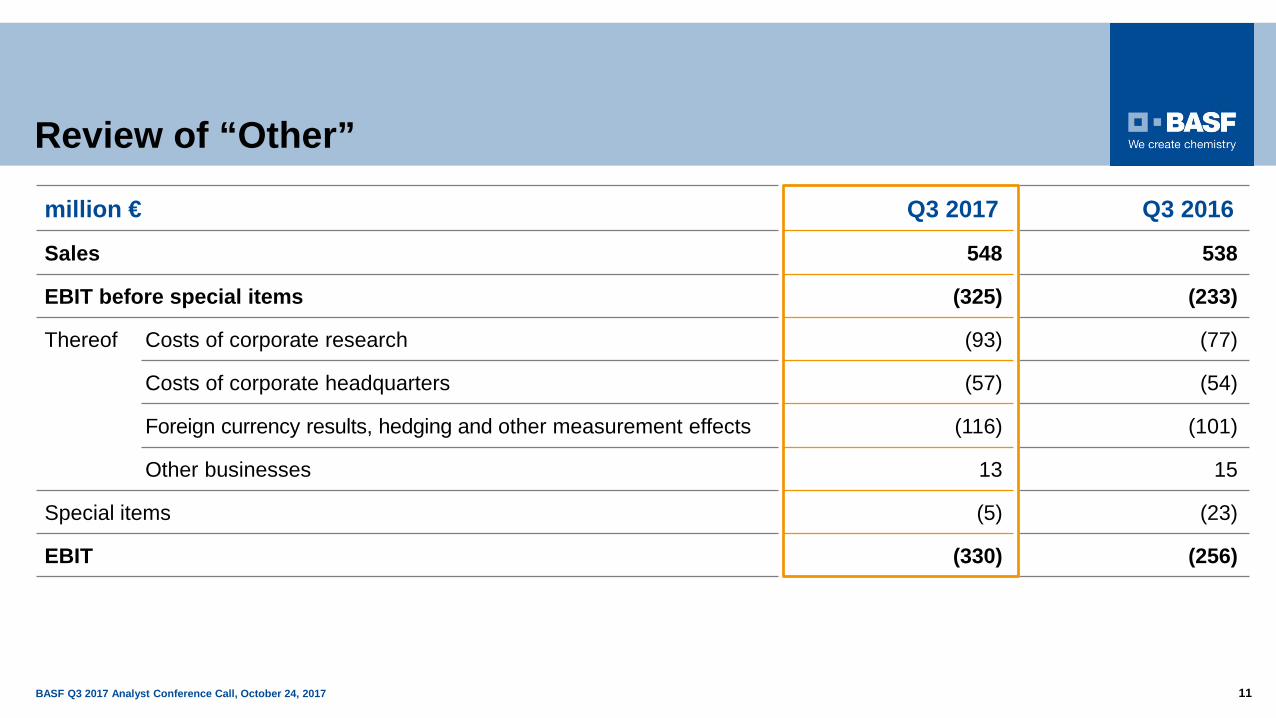
Review of “Other”
million € Q3 2017 Q3 2016
Sales 548 538
EBIT before special items (325) (233)
Thereof Costs of corporate research (93) (77)
Costs of corporate headquarters (57) (54)
Foreign currency results, hedging and other measurement effects (116) (101)
Other businesses 13 15
Special items (5) (23)
EBIT (330) (256)
BASF Q3 2017 Analyst Conference Call, October 24, 2017 12
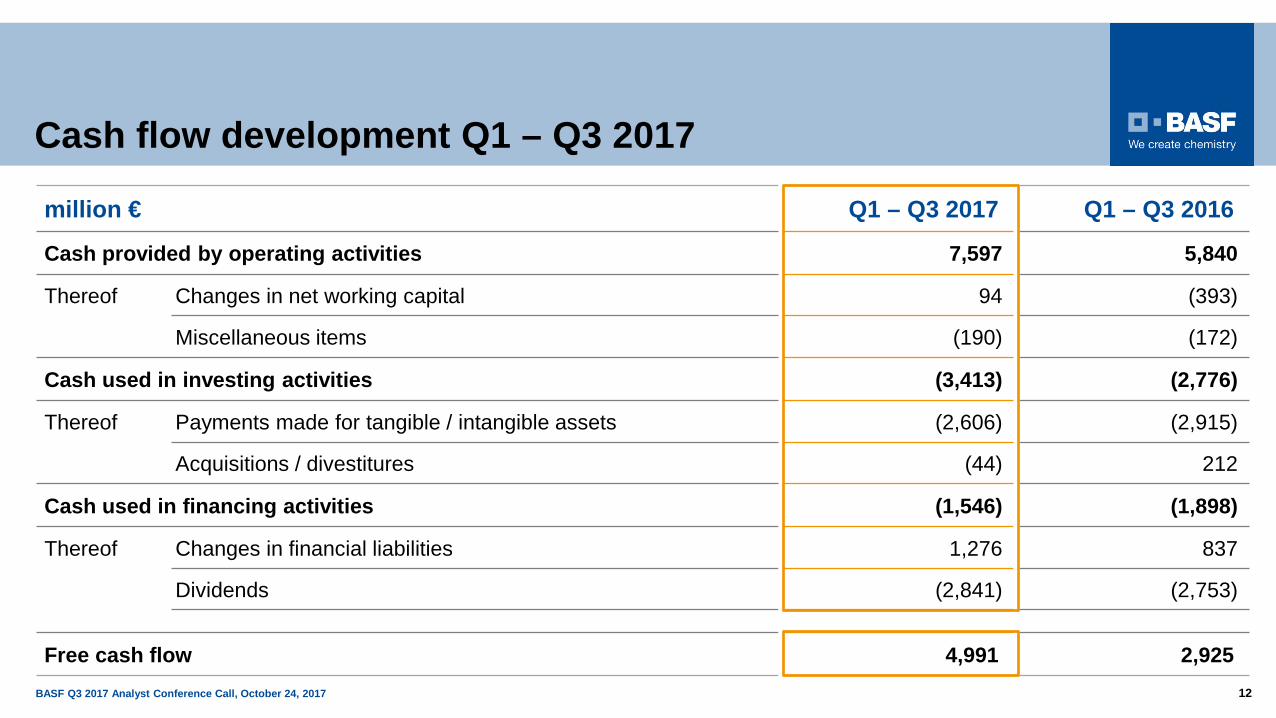
Cash flow development Q1 – Q3 2017
million € Q1 – Q3 2017 Q1 – Q3 2016
Cash provided by operating activities 7,597 5,840
Thereof Changes in net working capital 94 (393)
Miscellaneous items (190) (172)
Cash used in investing activities (3,413) (2,776)
Thereof Payments made for tangible / intangible assets (2,606) (2,915)
Acquisitions / divestitures (44) 212
Cash used in financing activities (1,546) (1,898)
Thereof Changes in financial liabilities 1,276 837
Dividends (2,841) (2,753)
Free cash flow 4,991 2,925
BASF Q3 2017 Analyst Conference Call, October 24, 2017 13
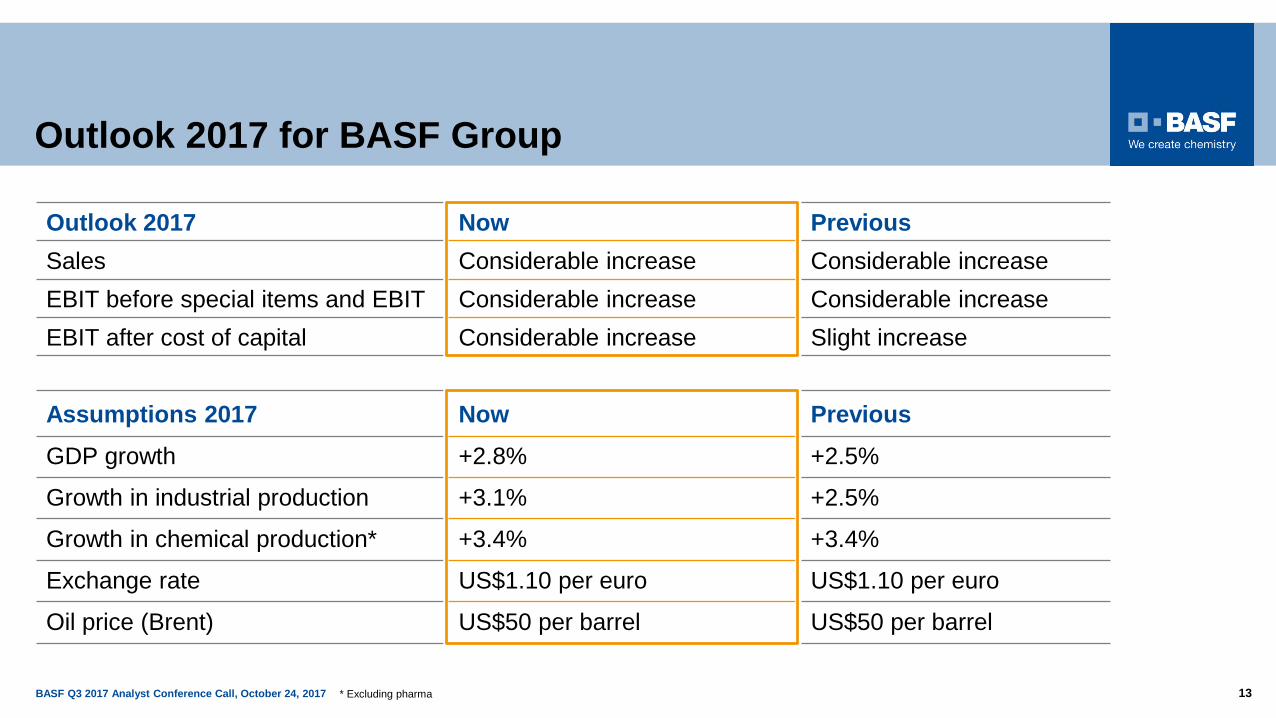
Outlook 2017 for BASF Group
Assumptions 2017 Now PreviousGDP growth +2.8% +2.5%
Growth in industrial production +3.1% +2.5%
Growth in chemical production* +3.4% +3.4%
Exchange rate US$1.10 per euro US$1.10 per euro
Oil price (Brent) US$50 per barrel US$50 per barrel
* Excluding pharma
Outlook 2017 Now PreviousSales Considerable increase Considerable increase EBIT before special items and EBIT Considerable increase Considerable increaseEBIT after cost of capital Considerable increase Slight increase
BASF Q3 2017 Analyst Conference Call, October 24, 2017 14BASF Investor Day 2015 – Keynote speech 14
BASF Q3 2017 Analyst Conference Call, October 24, 2017 15
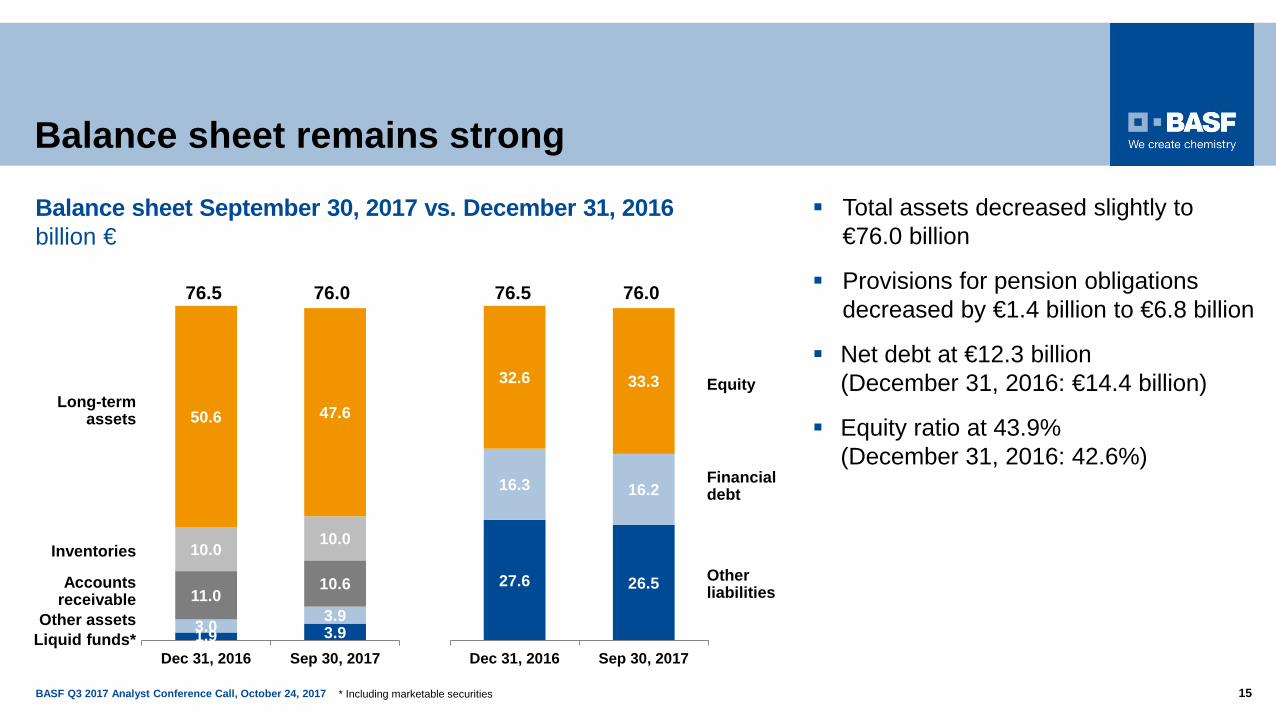
Balance sheet remains strong
Total assets decreased slightly to €76.0 billion
Provisions for pension obligations decreased by €1.4 billion to €6.8 billion
Net debt at €12.3 billion(December 31, 2016: €14.4 billion)
Equity ratio at 43.9% (December 31, 2016: 42.6%)
Balance sheet September 30, 2017 vs. December 31, 2016billion €
Liquid funds*
Accountsreceivable
Long-termassets
Inventories
Other assets
Otherliabilities
Financialdebt
Equity
27.6 26.5
16.3 16.2
32.6 33.3
Dec 31, 2016 Sep 30, 20171.9 3.93.0 3.911.0
10.6
10.0 10.0
50.6 47.6
Dec 31, 2016 Sep 30, 2017
76.5 76.0
* Including marketable securities
76.5 76.0