Spectrum Sharing and Potential Interference to Radars Sharing and Potential Interference to Radars...
23
Spectrum Sharing and Potential Spectrum Sharing and Potential Interference to Radars Interference to Radars International Symposium on Advanced Radio Technologies International Symposium on Advanced Radio Technologies Boulder, CO, 27 February 2007 Boulder, CO, 27 February 2007 Brent Bedford and Frank Sanders Brent Bedford and Frank Sanders Institute for Telecommunication Sciences Institute for Telecommunication Sciences NTIA, U.S. Department of Commerce, Boulder, CO NTIA, U.S. Department of Commerce, Boulder, CO [email protected] [email protected] and and [email protected] [email protected] 303.497.5288 and 303.497.7600 303.497.5288 and 303.497.7600 Robert Sole Robert Sole Office of Spectrum Management Office of Spectrum Management NTIA, U.S. Department of Commerce, Washington, DC NTIA, U.S. Department of Commerce, Washington, DC [email protected] [email protected] 202.482.1245 202.482.1245
Transcript of Spectrum Sharing and Potential Interference to Radars Sharing and Potential Interference to Radars...

Spectrum Sharing and Potential Spectrum Sharing and Potential Interference to RadarsInterference to Radars
International Symposium on Advanced Radio TechnologiesInternational Symposium on Advanced Radio TechnologiesBoulder, CO, 27 February 2007Boulder, CO, 27 February 2007
Brent Bedford and Frank SandersBrent Bedford and Frank SandersInstitute for Telecommunication SciencesInstitute for Telecommunication Sciences
NTIA, U.S. Department of Commerce, Boulder, CONTIA, U.S. Department of Commerce, Boulder, [email protected]@its.bldrdoc.gov and and [email protected]@its.bldrdoc.gov
303.497.5288 and 303.497.7600303.497.5288 and 303.497.7600
Robert Sole Robert Sole Office of Spectrum ManagementOffice of Spectrum Management
NTIA, U.S. Department of Commerce, Washington, DCNTIA, U.S. Department of Commerce, Washington, [email protected]@ntia.doc.gov
202.482.1245202.482.1245

Institute for Telecommunication Sciences – Boulder, Colorado
Proposals for Spectrum Sharing Proposals for Spectrum Sharing with Radarswith Radars
Radar systems have historically been allocated in bands Radar systems have historically been allocated in bands where they do not share spectrum with communication systems. where they do not share spectrum with communication systems. But in recent years proposals have been made for But in recent years proposals have been made for communication systems to operate in radar bands. These communication systems to operate in radar bands. These include:include:
Radio local area networks (RLANS);
Various proposed new mobile radio systems(e.g., IMT-2000/Advanced);
These proposals have raised the question:These proposals have raised the question:At what thresholds do various types of radioAt what thresholds do various types of radiointerference degrade the performance ofinterference degrade the performance ofradar receivers?radar receivers?
Institute for Telecommunication Sciences – Boulder, Colorado
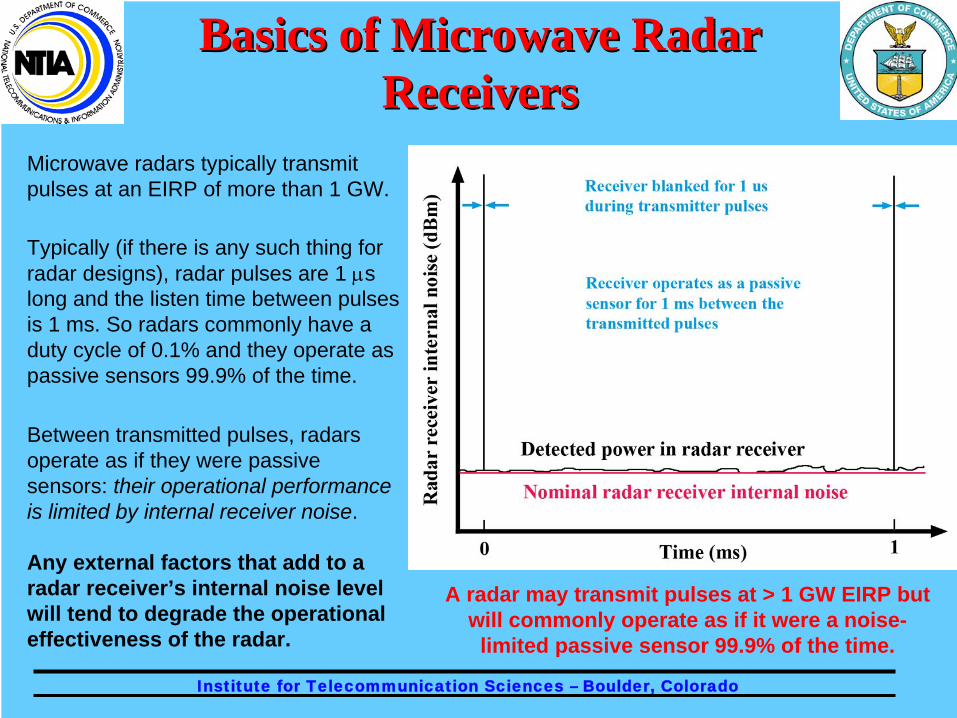
Microwave radars typically transmit pulses at an EIRP of more than 1 GW.
Basics of Microwave Radar Basics of Microwave Radar Receivers Receivers
Any external factors that add to a radar receiver’s internal noise level will tend to degrade the operational effectiveness of the radar.
Typically (if there is any such thing for radar designs), radar pulses are 1 μs long and the listen time between pulses is 1 ms. So radars commonly have a duty cycle of 0.1% and they operate as passive sensors 99.9% of the time.
A radar may transmit pulses at > 1 GW EIRP but will commonly operate as if it were a noise-
limited passive sensor 99.9% of the time.
Between transmitted pulses, radars operate as if they were passive sensors: their operational performance is limited by internal receiver noise.

Institute for Telecommunication Sciences – Boulder, Colorado
The low duty cycle of radar transmitters leads to a myth that they are “not using” most of their spectrum most of the time.
Do Radar Signals Really Fill Do Radar Signals Really Fill Their Spectrum Allocations?Their Spectrum Allocations?
Properly configured spectrum measurements do show allocations are filled by radar signals. But special stepped-frequency algorithms are needed to effectively reveal the signals.
The reality is that radar signals do occupy the majority of their allocated spectrum bands most of the time…albeit often (not always) at about 0.1% duty cycle. NTIA spectrum survey reports support this conclusion.
Snapshot of some radar spectrum occupancy at San Diego, measured with NTIA stepped-frequency
algorithm. See NTIA Report 97-334 for details.
This myth is partly rooted in typically unsuccessful attempts to observe radar signals with conventional (and naïve) swept-spectrum measurements.
Re c
eiv e
d si
gnal
leve
l (dB
m)
Frequency (MHz)

Institute for Telecommunication Sciences – Boulder, Colorado
Spectrum sharing proposals may directly affect US Government radar systems. Therefore it is critical that technical parameters for sharing between radar receivers and non- radar systems be accurately quantified.
NTIA Radar Interference NTIA Radar Interference Research ProgramResearch Program
Starting in 2001-2002, NTIA Office of Spectrum Management and NTIA Institute for Telecommunication Sciences undertook a joint effort to determine thresholds for interference to radar receivers.
PROBLEM: A lack of quantitativedata regarding thresholds at whichvarious types of interferencedegrade performance of radarreceiver systems.
An example of a fixed, ground-based 3-GHz airport surveillance radar antenna.
Institute for Telecommunication Sciences – Boulder, Colorado
Communication receivers typically experience interference effects as a function of the ratio of the interference level to the level of the desired signal (S/I or C/I).
Radar Interference Criterion: Radar Interference Criterion: I/NI/N
Fixed ground-based weather surveillance radar display in the presence of strong interference from a digital data signal (I/N = +3 dB).
Radar receivers, in contrast, normally operate against their internally generated noise. They are noise limited and thus the critical interference level parameter is the ratio I/N within the radar receiver IF stage.
But what criterion (or criteria) should be used to determine radar receiver performance at a given I/N level?

Institute for Telecommunication Sciences – Boulder, Colorado
OSM and ITS decided to assess radar performance on the basis of probability of detection (Pd ) of desired targets as a function of interference level (I/N) in the radar IF stage.
Radar Performance Criterion:Radar Performance Criterion: Probability of Detection of Probability of Detection of
Controlled TargetsControlled Targets
Air surveillance radar ppi display with internally generated targets
Target levels would have to be controlled during measurements. Therefore synthetic targets would be generated and injected into the radar receivers along with interference.
Baseline (non-interference) Pd required that the targets be strong enough to be easily observed a high percentage of the time.
Decision was made to set baseline Pd of desired targets at 90%. Then interference effects would be measured relative to that performance level.

Institute for Telecommunication Sciences – Boulder, Colorado
Although procedures varied slightly from radar to radar, the core procedure that NTIA (OSM and ITS) engineers used was:
Radar Interference Measurement Radar Interference Measurement ProcedureProcedure
OSM engineer preparing a maritime radar for signal injection at Curtis Bay Coast Guard Station near Baltimore.
1) Disconnect radar receiver and inject desired (controlled) targets at the RF stage so that they were handled the same way as regular returns.
2) Adjust synthetic target strength until Pd was as close as possible to 90%.
3) Inject interference signals at the radar RF stage. For each interference modulation, NTIA started atI/N = -12 dB, and successively raised the level to:-10 dB, -9 dB, -6 dB, -3 dB, 0 dB, +3 dB, +6 dB, Continuing to as much as +60 dB if necessary.
Interference types tested included: CW; CDMA; TDMA; BPSK; QPSK; OFDM; and UWB; and a variety of simulated radar pulses. Not all modulations were used on every radar.
4) NTIA counted 200 desired injected targets to obtain Pd for each level of interference.

Institute for Telecommunication Sciences – Boulder, Colorado
Typical Radar Interference Typical Radar Interference Testing Block DiagramTesting Block Diagram
Some live-target (aircraft) and radiated- interference tests were also performed.

Institute for Telecommunication Sciences – Boulder, Colorado
Typical Measurement SetupTypical Measurement Setup
Long-range air route surveillance radar station with NTIA measurement hardware

Institute for Telecommunication Sciences – Boulder, Colorado
Interference (Interference (I/NI/N) Calibration) Calibration

Institute for Telecommunication Sciences – Boulder, Colorado
Radars Measured in 2002Radars Measured in 2002--20062006
Several maritime radars at 3 GHz and 9 GHz (in both the US and the UK);
Airport surface detection (ASDE) radar at 9 GHz;
Two models of long range surveillance radar at 1.3 GHz;
Airport surveillance radar at 3 GHz;
Fixed ground-based weather surveillance radar at 3 GHz;
Airborne weather surveillance radar at 9 GHz;
Precision approach radar (PAR) at 9 GHz.

Institute for Telecommunication Sciences – Boulder, Colorado
Example of Example of PPdd Data CurvesData Curves

Institute for Telecommunication Sciences – Boulder, Colorado
Can Target Losses be Translated Can Target Losses be Translated into Range Reduction?into Range Reduction?
Target losses are a function of interference duty cycle and I/N level.
Target losses can occur at any time in the echo-listen period (and thus at any distance from a radar).
IF all target cross sections were equal, interference levels could be equated with a decrease in radar range.
But target cross sections vary enormously. So the concept of range loss is not very informative. Smaller targets may disappear closer-in while larger targets may be lost farther away.
Can anyone decide which targets various radars can afford to lose, at which ranges? Interference effect of 1% duty cycle pulses at high I/N.

Institute for Telecommunication Sciences – Boulder, Colorado
Example Target Loss at Low Example Target Loss at Low I/NI/N LevelsLevels----Communication SignalsCommunication Signals
Target losses at low I/N levels are insidious because there are no ancillary effects to indicate that interference is occurring or that targets are being lost.

Institute for Telecommunication Sciences – Boulder, Colorado
Example Target Loss at High Example Target Loss at High I/NI/N LevelsLevels----Communication SignalsCommunication Signals
Example of QPSK interference at I/N = +2 dB.

Institute for Telecommunication Sciences – Boulder, Colorado
Behavior at High Behavior at High I/NI/N Levels from Levels from Other Radar SignalsOther Radar Signals
Interference from other radars is effectively mitigated by interference rejection (IR) circuits at I/N levels as high as +30 dB to +60 dB. Next slide explains why…

Institute for Telecommunication Sciences – Boulder, Colorado
Radar Interference Rejection (IR) Radar Interference Rejection (IR) Circuitry Performance LimitsCircuitry Performance Limits
Interference rejection (IR) circuits accept echo pulses that are time-coherent with the radar’s own transmitted pulse repetition interval (PRI) and reject pulses that non-coherent with that PRI (or PRI’s).
Empirical NTIA test results indicate that IR circuits are only effective against interference that has less than a duty cycle of 1-3%.

Institute for Telecommunication Sciences – Boulder, Colorado
Summary of Results: Interference to RadarsSummary of Results: Interference to RadarsRadar Tested I/N Threshold
for Decreased Pd
Long Range Air Search Radiolocation Radar 1 (installation 1)
-9 dB
Long Range Air Search Radiolocation Radar 1 (installation 2)
-9 dB
Long Range Air Search Radiolocation Radar 2
-6 dB
Short Range Air Search Radionavigation Radar
-9 dB
Fixed Ground-Based Meteorological Radar
-9 dB*
Maritime Radionavigation Radar A -7 dB
Maritime Radionavigation Radar B -10 dB
Maritime Radionavigation Radar C -6 dB to -9 dB
Maritime Radionavigation Radar D -9 dB
Maritime Radionavigation Radar E -6 dB
Maritime Radionavigation Radar F -6 dB
Airborne Meteorological Radar -6 to -2 dB * -14 dB is the predicted threshold for an upgraded version of the fixed meteorological radar.
These results are applicable to interference signals having duty cycles of more than 1-3%.
Lower duty cycle signals, as are characteristic of emissions from radars, have been tolerated in NTIA tests at I/N levels of +30 dB to +60 dB.

Institute for Telecommunication Sciences – Boulder, Colorado
Summary of Results, continuedSummary of Results, continued
* Interference at high duty cycles (above 1-3%), such as from most communication signals, typically causes target losses to begin at I/N levels between -10 dB to -6 dB, depending upon radar type.
* Interference at low duty cycles (less than 1-3%), such as from other radars, can often be sustained at I/N levels as high as +30 dB to +60 dB without degrading receiver performance.
* Target losses due to low levels of interference are insidious because no visible effects are associated with the interference. The targets simply fade away.
* Target losses can occur at any range. Losses do not just occur at the edge of radar coverage, but rather anywhere that the targets are close to radar receiver noise.

Institute for Telecommunication Sciences – Boulder, Colorado
Implications for Spectrum Implications for Spectrum Sharing with RadarsSharing with Radars
* To the extent that communication-type signals have duty cycles above 1-3%, I/N levels in radar receivers must be kept below -10 dB to -6 dB in any proposed spectrum sharing schemes.
* Although workability of dynamic frequency sharing (DFS) has been demonstrated in NTIA testing, DFS is limited to the terms of ITU-R M.1652. It is limited to WLANs against 5 GHz radars. DFS is meant to limit interference to radars to I/N levels below -6 dB.
* Extension of some sort of DFS to other bands and other radio technologies (e.g., IMT-2000 at 3 GHz), if ever attempted, will require the development of new sharing protocols to accommodate the unique characteristics of new mobile radio systems, etc., for the limits NTIA has measured. Unique characteristics of radars in non-5 GHz bands would need to be understood and accommodated as well.

Institute for Telecommunication Sciences – Boulder, Colorado
Details may be found in NTIA Report TR-06-444, which fully describes this work:
“Effects of RF InterferenceEffects of RF Interference on Radar Receiverson Radar Receivers”
The report may be downloaded from: www.its.bldrdoc.gov/pub/ntia-rpt/06-444/index.php
Further ReadingFurther Reading

Institute for Telecommunication Sciences – Boulder, Colorado
The Administration of the United Kingdom, including critically important guidance and assistance from Mr. Peter Griffith; also Mr. Kim Fisher of the UK Maritime and Coast Guard Agency.
The staff of the UK Fraser Range facility at Portsmouth.
The Sperry Marine radar company.
The Kelvin Hughes radar company.
The Northrop Grumman Company, especially Mr. Rod Fremd, Linthicum, MD.
The Federal Aviation Administration (including critical assistance from Mr. Greg Barker and Mr. Mitch Hughes and the rest of the staff of the long range and ASDE radars of the FAA Technical Center in Oklahoma City. Also the staff of the airport surveillance radars at the FAA Oklahoma City Technical Center, Mr. Michael Biggs of the FAA in Washington, DC, and the FAA radar staff at Kirksville, MO;
The U.S. Coast Guard radar staff at Curtis Bay, MD, who assisted us well beyond convenience in their already-busy schedule.
The National Weather Service (including Mr. Dan Friedman and the NWS radar staff at Norman, OK).
The US Air Force, including especially Darrell McFarland and Ricardo Medilavilla of the 84th Radar Evaluation Squadron (RADES) from Hill AFB, UT and the USAF GPS Wing (formerly the GPS Joint Program Office) and the Aerospace Corporation.
Staff of the NTIA Office of Spectrum Management (OSM), including especially Mr. Robert Hinkle, Mr. Mike Doolan, Mr. Matt Barlow and Mr. Larry Brunson.
Ms. Kristen Davis of the NTIA/ITS laboratory, who drafted the technical drawings.
Photographic images in this presentation were taken by Frank Sanders.
AcknowledgementsAcknowledgements


![UWB Radars [EDocFind.com]](https://static.fdocuments.in/doc/165x107/577d2b9c1a28ab4e1eaae39f/uwb-radars-edocfindcom.jpg)