Spectrum Analyzer
26
Spectrum Analyzer
description
Spectrum Analyzer. Amplitude (power). frequency. time. Time domain Measurements. Frequency Domain Measurements. INTRODUCTION. A spectrum in the practical sense is a collection of sine waves , when combined properly produces the required time domain signal. - PowerPoint PPT Presentation
Transcript of Spectrum Analyzer

Spectrum Analyzer

INTRODUCTION
A spectrum in the practical sense is a collection of sine waves , when combined properly produces the required time domain signal.
The frequency domain also has its measurement strengths. The frequency domain is better for determining the harmonic content of a
signal.
time
Amplitude(power)
frequency
Time domainMeasurements Frequency Domain
Measurements
A spectrum analyzer is a device used to examine the spectral composition of some electrical, acoustic, or optical waveform.
Mostly it finds application in measurement of power spectrum .
Analog & Digital
An analog spectrum analyzer uses either a variable bandpass filter whose mid-frequency is automatically tuned (shifted, swept) through the range of frequencies of which the spectrum is to be measured or a superheterodyne receiver where the local oscillator is swept through a range of frequencies.
A digital spectrum analyzer computes the Fast Fourier transform (FFT), a mathematical process that transforms a waveform into the components of its frequency spectrum

Spectrum Analysis In various field operations involving signals there is need to ascertain the
nature of the signal at several points.
Signal characteristics affect the parameters of operation of a system.
Spectrum analysis mostly involves study of the signal entering a system or that produced by it .
Spectrum analyzers usually display raw, unprocessed signal information such as voltage, power, period, waveshape, sidebands, and frequency. They can provide you with a clear and precise window into the frequency spectrum.
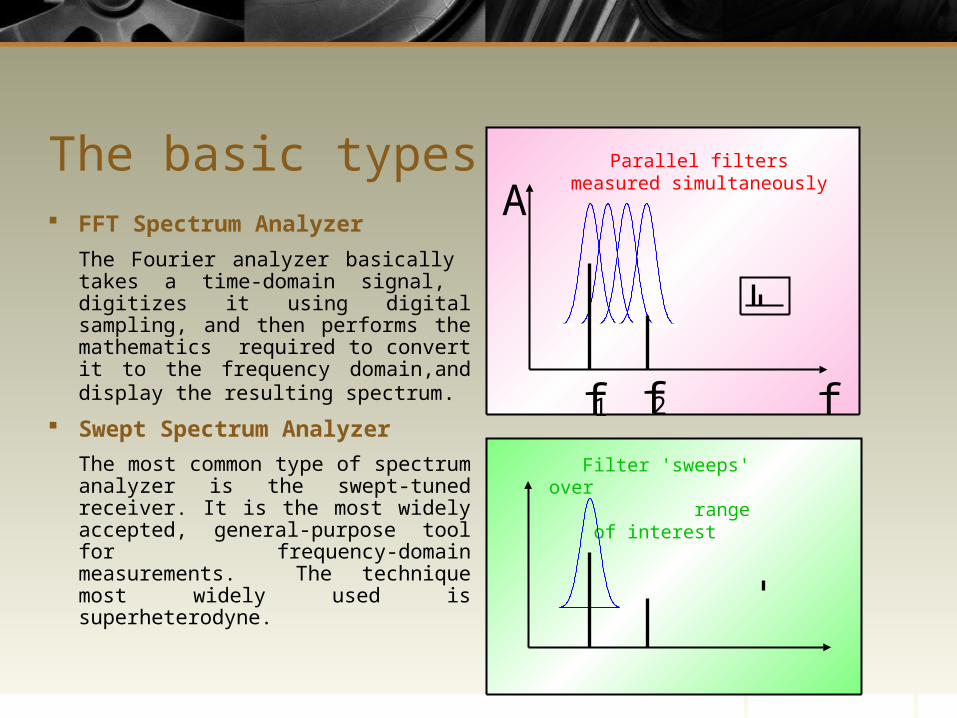
The basic types FFT Spectrum Analyzer
The Fourier analyzer basically takes a time-domain signal, digitizes it using digital sampling, and then performs the mathematics required to convert it to the frequency domain,and display the resulting spectrum.
Swept Spectrum Analyzer
The most common type of spectrum analyzer is the swept-tuned receiver. It is the most widely accepted, general-purpose tool for frequency-domain measurements. The technique most widely used is superheterodyne.
Parallel filters measured simultaneously
A
ff1 f2 Filter 'sweeps' over range of
interest

FFT Spectrum AnalyzerTHE MEASUREMENT SYSTEM
The analyzer is looking at the entire frequency range at the same time using parallel filters measuring simultaneously.
It is actually capturing the time domain information which contains all the frequency information in it.
With its real-time signal analysis capability, the Fourier analyzer is able to capture periodic as well as random and transient events.
It also can provide significant speed improvement over the more traditional swept analyzer and can measure phase as well as magnitude.
Swept Spectrum Analyzer Very basically, these analyzers "sweep" across the frequency range of
interest, displaying all the frequency components present.
The swept-tuned analyzer works just like the AM radio in your home except that on your radio, the dial controls the tuning and instead of a display, your radio has a speaker.
The swept receiver technique enables frequency domain measurements to be made over a large dynamic range and a wide frequency range.
It has significant contributions to frequency-domain signal analysis for numerous applications, including the manufacture and maintenance of microwave communications links, radar, telecommunications equipment, cable TV systems, and broadcast equipment; mobile communication systems; EMI diagnostic testing; component testing; and signal surveillance.

Theory of OperationSpectrum Analyzer Block Diagram
Pre-SelectorOr Low Pass
Filter
CrystalReference
LogAmp
RF inputattenuato
r mixerIF filter
detector
video
filterlocaloscillator
sweepgenerato
r
IF gain
Inputsignal
CRT display

The major components in a spectrum analyzer are the
RF input attenuator, mixer,
IF (Intermediate Frequency) gain,
IF filter, detector,
video filter,
local oscillator,
sweep generator
CRT display.

Theory of OperationMixer MIXER
fsig
LOf
fsig LOf
LOf fsig-LOf fsig+RF
LOIF
input

MIXER A mixer is a device that converts a signal from one frequency to another.
It is sometimes called a frequency-translation device.
A mixer is a non-linear device (frequencies are present at the output that were not present at the input).
The output of a mixer consists of the two original signals (fsig and fLO) as well as the sum (fLO+fsig) and difference (fLO-fsig) frequencies of these two signals.
In a spectrum analyzer, the difference frequency is actually the frequency of interest. The mixer has converted our RF input signal to an IF (Intermediate Frequency) signal that the analyzer can now filter, amplify and detect for the purpose of displaying the signal on the screen.
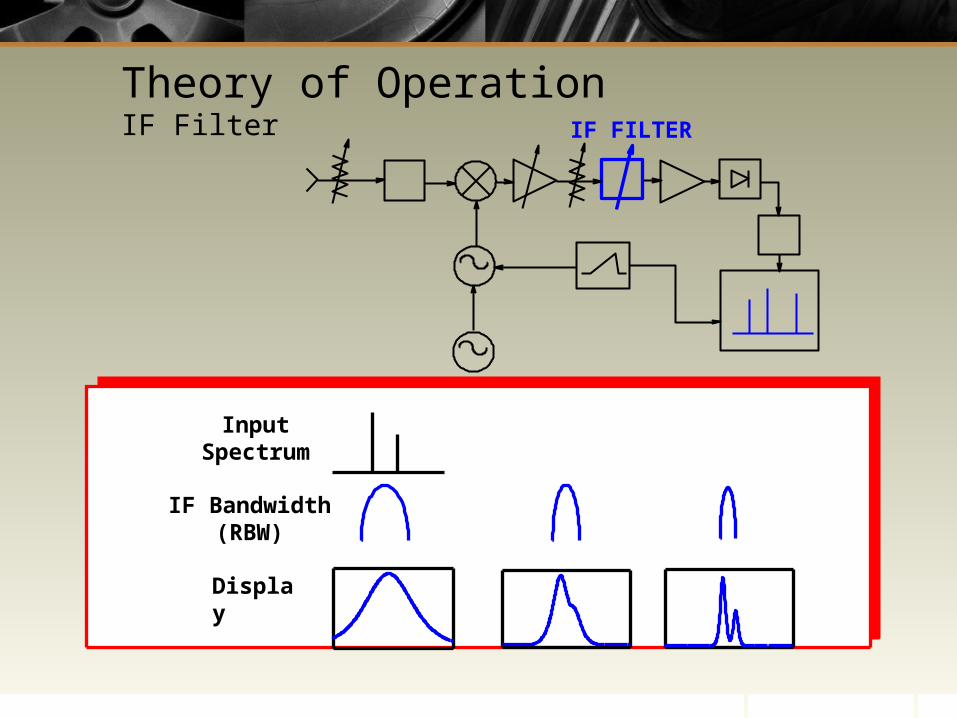
Theory of OperationIF Filter IF FILTER
Display
InputSpectru
mIF Bandwidth
(RBW)

IF FILTER The IF filter is a bandpass filter which is used as the "window" for detecting
signals. It's bandwidth is also called the resolution bandwidth (RBW) of the analyzer
and can be changed via the front panel of the analyzer.
By giving a broad range of variable resolution bandwidth settings , the instrument can be optimized for the sweep and signal conditions, letting trade-off frequency selectivity (the ability to resolve signals), signal-to-noise ratio (SNR), and measurement speed.
As RBW is narrowed, selectivity is improved (we are able to resolve the two input signals). This will also often improve SNR.

Theory of OperationDetector DETECTOR
Negative detection: smallest value in bin displayed
Positive detection: largest value in bin displayed
Sample detection: last value in bin displayed
"bins"
amplitude

Continued... In sample detection mode, a random value for each "bin" of data (also
called a trace element) is produced. This detector mode is best for computing the rms value of noise or noise-like signals, but it may miss the peaks of burst signals and narrowband signals when the RBW is narrower than the frequency spacing of the bins.
For displaying both signals and noise, a detector mode called the normal detector mode

DETECTOR The analyzer must convert the IF signal to a baseband or video signal so it
can be viewed on the instrument's display. This is accomplished with an envelope detector which then deflects the CRT beam on the y-axis, or amplitude axis.
Many modern spectrum analyzers have digital displays which first digitize the video signal with an analog-to-digital converter (ADC).
The positive-peak detector mode captures and displays the peak value of the signal over the duration of one trace element
The negative-peak detector mode captures the minimum value of the signal for each bin.

Theory of OperationVideo Filter
VIDEO FILTER

VIDEO FILTER The video filter is a low-pass filter that is located after the envelope
detector and before the ADC. This filter determines the bandwidth of the video amplifier, and is
used to average or smooth the trace seen on the screen. By changing the video bandwidth (VBW) setting, we can decrease the
peak-to-peak variations of noise.
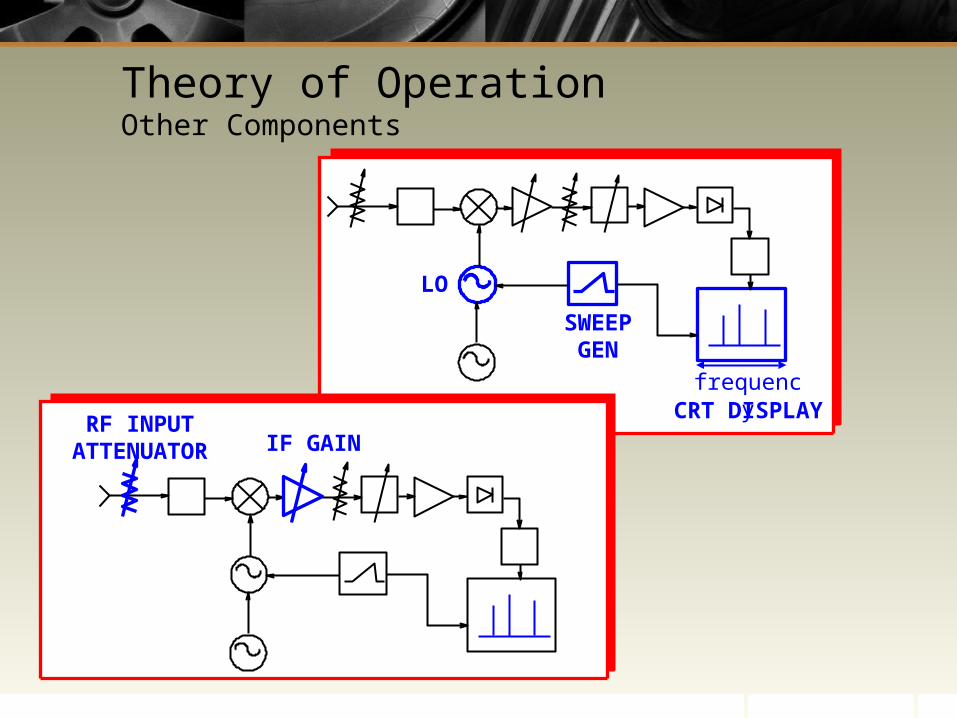
Theory of OperationOther Components
CRT DISPLAY
SWEEP GEN
LO
IF GAIN
frequency
RF INPUT ATTENUATOR
THE AUXILLARIES The local oscillator is a Voltage Controlled Oscillator (VCO) which in effect
tunes the analyzer.
The sweep generator actually tunes the LO so that its frequency changes in proportion to the ramp voltage.
This also deflects the CRT beam horizontally across the screen from left to right, creating the frequency domain in the x-axis.
The RF input attenuator is a step attenuator located between the input connector and the first mixer. It is also called the RF attenuator.
This is used to adjust the level of the signal incident upon the first mixer.
This is important in order to prevent mixer gain compression and distortion due to high-level and/or broadband signals.

Continued... The IF gain is located after the mixer but before the IF, or RBW, filter.
This is used to adjust the vertical position of signals on the display without affecting the signal level at the input mixer.
When it changed, the value of the reference level is changed accordingly.
The IF gain will automatically be changed to compensate for input attenuator changes, so signals remain stationary on the CRT display, and the reference level is not changed.

Theory of OperationHow it all works together
3.6
(GHz)
(GHz)
0 3 61 2 4 5
0 31 2
3 64 5
3.6
(GHz)0 31 2
f IF
Signal Range
LO Range
f s
sweep generator
LO
CRT display
input
mixer
IF filter
detector
A
f
f LO
f s
f s
f sf LO
-f s
f LO+
f LO
3.6
6.5
6.5

First of all, the signal to be analyzed is connected to the input of the spectrum analyzer. This input signal is then combined with the LO through the mixer, to convert (or translate) it to an intermediate frequency (IF).
These signals are then sent to the IF filter. The output of this filter is detected, indicating the presence of a signal
component at the analyzer's tuned frequency. The output voltage of the detector is used to drive the vertical axis (amplitude) of the analyzer display.
The sweep generator provides synchronization between the horizontal axis of the display (frequency) and tuning of the LO. The resulting display shows amplitude versus frequency of spectral components of each incoming signal.
The horizontal arrows are intended to illustrate the "sweeping" of the analyzer. Starting with LO at 3.6 GHz, the output of the mixer has four signals, one of which is at 3.6 GHz (fLO).

IF filter is also at 3.6 GHz (it's shape has been imposed onto the frequency graph for clarity). Therefore, we expect to see this signal on the display. At 0 Hz on the CRT, we do indeed see a signal - this is called "LO Feedthrough".
Sweep generator moving to the right, causes the LO to sweep upward in frequency. As the LO sweeps, so two will three of the mixer output signals (the input signal is stationary).
As the LO Feedthrough moves out of the IF filter bandwidth, we see it taper off on the display. As soon as the difference frequency (fLO-fs) comes into the envelop of the IF filter, we start to see it.
When it is at the center (e.g. 3.6 GHz) we see the full amplitude of this signal on the display.
And, as it moves further to the right, it leaves the filter envelop, and no signal is seen on the display.
The signal is being swept through the fixed IF filter, and properly displayed on the analyzer screen.

Theory of OperationFront Panel Operation
8563ASPECTRUM ANALYZER 9 kHz - 26.5 GHz
RF Input Numeric
keypad
Control functions
(RBW, sweep time, VBW)
Primary functions(Frequency,
Amplitude, Span)Softkey
s